development of a fluorescence-linked immunoassay based on quantum dots for fenvalerate
TRANSCRIPT
This article was downloaded by: [Laurentian University]On: 22 March 2013, At: 11:53Publisher: Taylor & FrancisInforma Ltd Registered in England and Wales Registered Number: 1072954 Registeredoffice: Mortimer House, 37-41 Mortimer Street, London W1T 3JH, UK
Food and Agricultural ImmunologyPublication details, including instructions for authors andsubscription information:http://www.tandfonline.com/loi/cfai20
Development of a fluorescence-linkedimmunoassay based on quantum dotsfor fenvalerateJingkun Liu a b , Qi Zhang a b , Wen Zhang a c , Xiaoxia Ding a d ,Xiaofeng Hu a b , Fangfang Zhao a b & Peiwu Li a c d ea Oil Crops Research Institute of the Chinese Acdemy ofAgricultural Sciences, Wuhan, 430062, P.R. Chinab Key Laboratory of Detection for Mycotoxins, Ministry ofAgriculture, Wuhan, 430062, P.R. Chinac Laboratory of Risk Assessment for Oilseeds Products (Wuhan),Ministry of Agriculture, Wuhan, 430062, P.R. Chinad Quality Inspection and Center for Oilseeds Productions, Ministryof Agriculture, Wuhan, 430062, P.R. Chinae Key Laboratory of Biology and Genetic Improvement of OilCrops, Ministry of Agriculture, Wuhan, 430062, P.R. ChinaVersion of record first published: 07 Jan 2013.
To cite this article: Jingkun Liu , Qi Zhang , Wen Zhang , Xiaoxia Ding , Xiaofeng Hu , FangfangZhao & Peiwu Li (2013): Development of a fluorescence-linked immunoassay based on quantum dotsfor fenvalerate, Food and Agricultural Immunology, DOI:10.1080/09540105.2012.749220
To link to this article: http://dx.doi.org/10.1080/09540105.2012.749220
PLEASE SCROLL DOWN FOR ARTICLE
Full terms and conditions of use: http://www.tandfonline.com/page/terms-and-conditions
This article may be used for research, teaching, and private study purposes. Anysubstantial or systematic reproduction, redistribution, reselling, loan, sub-licensing,systematic supply, or distribution in any form to anyone is expressly forbidden.
The publisher does not give any warranty express or implied or make any representationthat the contents will be complete or accurate or up to date. The accuracy of anyinstructions, formulae, and drug doses should be independently verified with primarysources. The publisher shall not be liable for any loss, actions, claims, proceedings,

demand, or costs or damages whatsoever or howsoever caused arising directly orindirectly in connection with or arising out of the use of this material.
Dow
nloa
ded
by [
Lau
rent
ian
Uni
vers
ity]
at 1
1:53
22
Mar
ch 2
013

Development of a fluorescence-linked immunoassay based on quantumdots for fenvalerate
Jingkun Liua,b, Qi Zhanga,b*, Wen Zhanga,c, Xiaoxia Dinga,d, Xiaofeng Hua,b,
Fangfang Zhaoa,b and Peiwu Lia,c,d,e*
aOil Crops Research Institute of the Chinese Acdemy of Agricultural Sciences, Wuhan 430062,P.R. China; bKey Laboratory of Detection for Mycotoxins, Ministry of Agriculture, Wuhan430062, P.R. China; cLaboratory of Risk Assessment for Oilseeds Products (Wuhan), Ministryof Agriculture, Wuhan 430062, P.R. China; dQuality Inspection and Center for OilseedsProductions, Ministry of Agriculture, Wuhan 430062, P.R. China; eKey Laboratory of Biologyand Genetic Improvement of Oil Crops, Ministry of Agriculture, Wuhan 430062, P.R. China
(Received 17 August 2012; final version received 9 November 2012)
The glutathione-coated CdTe quantum dots (QDs) were synthesized in a paper.After purification, the QDs were coupled with monoclonal antibody to fightagainst fenvalerate. The conjugates had the same emission wavelength as that ofQDs. The excitation wavelength and emission wavelength of the conjugates weredetermined to obtain the highest signal-to-noise ratio. After the antibodyconcentration optimization, the fluorescence-linked immunoassay method wasdeveloped. The method used the QDs as the signal to quantify the fenvalerate.Compared with the enzyme-linked immunosorbent assay (ELISA), it saved morethan 1 h and decreased the false-positive rate using the specified emissionwavelength of QDs. The 50% inhibitory concentration (IC50) of the method was0.28 mg mL�1. The detection limit was 25 ng mL�1 and the linear range was 60ng mL�1�3.83 mg mL�1. Via preliminary application, fenvalerate residues inspiked samples were determined. The recovery of fenvalerate in water samplesranged from 84.5% to 96.2% and that in vegetables ranged from 72.5% to 125.7%.It was a rapid detection of the fenvalerate residue in environment and vegetables.
Keywords: quantum dots; CdTe; fenvalerate; antibody; FLISA
Introduction
Due to their high bioefficiency, synthetic pyrethroids are widely used in agriculture
especially for growing vegetables and fruits. The fenvalerate, one of the most
commonly used synthetic pyrethoids, is classified as a type II pyrethroid (Arena et al.,
2008) because it contained an alpha-cyano group. It is a nonsystemic insecticide used
against a wide range of pests, especially those resistant to organochlorine, organopho-
sphorus, and carbamate insecticides (Sharma, Guptaa, & Shankera, 2008).Its extensive use, however, does harm human and livestock, though it is less toxic
to mammals. (Mak et al., 2005). The residues also cause great damage to the aquatic
environment and organisms (Pieters & Liess, 2006), and most pyrethoids are highly
toxic to aquatic organisms.
*Corresponding authors. Emails: [email protected]; [email protected]
Food and Agricultural Immunology, 2013
http://dx.doi.org/10.1080/09540105.2012.749220
# 2013 Taylor & Francis
Dow
nloa
ded
by [
Lau
rent
ian
Uni
vers
ity]
at 1
1:53
22
Mar
ch 2
013

Nowadays, governments and people pay increasing attention to food quality and
safety. Pesticide residues (Bouwman, Sereda, & Meinhardt, 2006; Jimenez, Bernal,
del Nozal, Bernal, & Toribio, 2007; Sharma, Satya, Kumar, & Tewary, 2005) are one
of the major factors which affect the health of humans and livestock. Fenvalerate is
one of the most commonly used pesticides in the cultivation of vegetables and fruits,
which are usually eaten raw by humans. Therefore, the detection and monitoring of
fenvalerate residues are extremely important for public health.
Many methods have been reported for the detection and monitoring of the
fenvalerate residues, including the gas chromatography (GC) (Pang et al., 2006),
high-performance liquid chromatography (HPLC) (Zhou, Zhang, & Xie, 2011), ion-
trap mass spectrometry and electron-capture GC (Pang et al., 2006), and solid-phase
extraction (SPE)-GC (Gong et al., 2004). Although these methods all have high
sensitivity and stability, they all require expensive equipments and skilled personnel,
and are time-consuming processes, which are not suitable for the detection of
fenvalerate residues in vegetables and fruits.
Immunoassay methods such as enzyme-linked immunosorbent assay (ELISA) and
fluorescence immune assay (FIA) have the advantages of sensitivity, speed, and
simplicity of operation, which are desirable for rapid detection and monitoring of the
pesticides residue. Several ELISA methods have been reported (Shi, Zhang, Ye, Zheng, &
Wang, 2011; Song, Lu, Liu, Xu, & Wang, 2011;) for permethrin, deltamethrin,
cypermethrin, and fenverlarate. Compared with polyclonal antibody, monoclonal
antibody is more specific and sensitive and is widely used in fenvalerate residue detection.
Unlike ELISA, fluorescence-linked immunosorbent assay (FLISA) is a kind of
immunoassay which uses fluorescence as a signal to quantify the residue. Besides
being simple and sensitive, FLISA is more rapid and gives less false positive than
ELISA.
Some researches have been reported for the fluorescence immunoassay based on
quantum dots (QDs) for the detection of pesticide residues (Vinayaka, Basheer, &
Thakur, 2009). But seldom has any research reported on the determination of the
fenvalerate. QDs are a kind of nanomaterial which produces fluorescence signals of a
specific wavelength. This material has advantages of continuous absorption spectrum
within a wide range, narrow and symmetric emission spectrum, and a large stokes
shift. QDs with fluorescence at different wavelengths can be obtained by adjusting
the sizes and components of the QDs (Hua et al., 2009). The peak wavelength of the
emission fluorescence for a type of QD is stable. Therefore, QDs are more stable than
the traditional fluorescein. As a result, the sensitivity of FLISA based on QDs is
about 100 times that based on the traditional fluorescein (Resch-Genger, Grabolle,
Cavaliere-Jaricot, Nitschke, & Nann, 2008; Wang, Li, & Slavik, 2007).
The objective of this paper is to explore the possible immunoassay based on QDs
for the fenvalerate residue detection in vegetables and other samples. The FLISA
method coupled with CdTe QDs as a fluorescent marker is described and applied to
practical samples.
Experimental
Reagent
CdCl2 �2.5H2O (99.0%), Na2TeO3, NaBH4 (96.0%), trisodium citrate (99.0%),
NaOH, CH3OH, C2H5OH,b-C2H5SH, MgSO4, acetone, acetonitrile, g-L�glutamyl-
2 J. Liu et al.
Dow
nloa
ded
by [
Lau
rent
ian
Uni
vers
ity]
at 1
1:53
22
Mar
ch 2
013

L�cysteinyl-glycine (GSH), and hexane are all purchased from Shanghai Guoyao
chemical reagents corporation; OVA (agarose gel electrophoresis grade) were all
purchased from Sigma corporation; white opaque plate with 96 wells was purchased
from Coastar corporation; the antibody was from the hybridoma made in ourexperiment (Jiang et al., 2010); water was obtained from a MilliQ purification system
(Millipore).
Instruments
UV spectrophotometer (500, Unicame corporation); fluorescence spectrophotometer(F-4500, Hitechi corporation); Votex device (tongzheng corporation); enzyme-
labeling instrument (spectramaxM2e, Molecular corporation); magnetic stirrer
(MR 3001, Heidolph corporation); plate washer (Els-50, Biotek corporation); rotary
evaporator (Laborota 4003 control, Heidolph corporation); gas chromatography
with ECD detection (Aglient 6890); and nitrogen blowing instrument (BF-2000,
Bafangshiji corporation).
Buffer and solution
The coating buffer was 0.025 M (pH 9.6) carbonate buffer. Washing buffer was
phosphate buffer solution with tween (PBST), which was phosphate buffer solution
(PBS) containing 0.05% (v/v) tween 20.
Synthesis of CdTe QDs
Colligating the reported methods (Sheng, Han, Hu, & Chen, 2010; Zhang et al., 2009),
the CdTe QDs were synthesized by a modified method. CdCl2 �2.5H2O (45.7 mg) was
dissolved in 20 mL of ultrapure water kept bubbling with highly pure N2 and the pH
value of the mixed solution was adjusted to 10.5. The following reagents were added in
sequence: GSH (73.8 mg), trisodium citrate (0.1 g), and Na2TeO3 (8 mg) at N2
atmosphere after all the chemical reagents were dissolved. The mixture was kept in a
microwave oven with a reflux device and the power of the oven was 600 W. The
solution started to reflux when it became yellow. QDs of different size would be
produced at different time intervals (Wang, Li, & Slavik, 2007). In this work, QDs with
560 nm fluorescence were accepted. About 30 min later, the reaction was finished.
Coupling of QDs with antibody (Dwarakanath, Bruno, & Shastry, 2004)
Ethanol was added dropwise into QDs solution under room temperature until the
turbidity appeared. The mixed solution was centrifuged at 4000 rpm for 5 min and
repeated again. The left Cd2�, TeO32 � was eliminated. And then the precipitation
was dissolved in PBS buffer. The fluorescence and ultraviolet absorption were
measured to obtain the spectrum and concentration of QDs.
Active ester method (1-Ethyl-3-(-3dimethyllaminopropyl) carbodiie hydrochlideand N-Hydroxysuccinimide) was used in the experiment because of GSH with the
carboxyl and amino groups surrounding the surface of QDs. Mercaptoethanol was
used as stabilizer in the method. Seventy-eight microliters of EDC solution (1 mg
mL�1) and 53 mL of NHS (1 mg mL�1) were added to 2 mL of the above QDs
Food and Agricultural Immunology 3
Dow
nloa
ded
by [
Lau
rent
ian
Uni
vers
ity]
at 1
1:53
22
Mar
ch 2
013

solution and the mixed solution was stirred for 1 h in dark. And then 10 mL b-
mercaptoethanol was added. After that, 5 mg of anti-fenvalerate antibody dissolved
in 500 mL PBS buffer was added, and the mixture was stirred for 3 h in dark. The
final solution was dialyzed in PBS solution for about 2 days after the reaction wascomplete. Conjugate was collected by centrifugation for 3 min at 10,000 rpm and
dissolved in PBST (3 mL) buffer.
Optimization of the concentration of antibody linked with QDs
The concentration of antibody was determined via checkerboard method. An
antigen at different concentrations (2 mg mL�1, 4 mg mL�1, and 8 mg mL�1) was
coated on the 96-well plate (100 mL per well) for 2 h at 37 8C. After a threefoldwashing, ovalbumin (OVA) solution (1%) was added to block the wells (200 mL per
well) for 1 h at 37 8C. And then an antibody at different concentrations (from 1:1 to
1:16) was added to the wells to react with antigen, after which the plates were washed
three times with PBST. The plates were incubated for 1 h at 37 8C. After the last
threefold washing, PBST (100 mL) was added to each well. The fluorescence intensity
of each well was measured.
Wavelengths of 400 nm and 564 nm were selected for excitation and emission,
respectively, to lower the excitation light effect of the emission light and keep theemission strength at a high level. For the purpose of getting a high signal-to-noise
ratio, proper concentration collocation of antigen and antibody should be
determined.
Fluorescence-linked immunosorbent assay (FLISA)
100 mL per well of antigen solution (2mg mL�1) was coated on the plates and
incubated for 2 h at 37 8C. The plates were washed and blocked as mentioned inabove section. After another threefold washing, fenvalerate standards of various
concentrations (from 5 ng mL�1 to 10.1 mg mL�1 in PBS with 10% methanol) were
added into the wells (50 mL per well) to compete with the antigen to react with the
antibody solution (50 mL per well), and then the antibody solution was added (50 mL
per well). The concentration of antibody solution was obtained in the above step.
The reaction lasted for 1 h at 37 8C. After the last threefold washing, 100 mL of PBS
was added into the wells to measure the fluorescence intensity.
In order to study the specificity of the method, three types of pyrethroidpesticides were used to measure the cross-reactivity (CR) between antibody and
other pyrethroids. In the work, deltamethrin, cypermethrin, and bifenthrin were
selected as related analytes. Deltamethrin and cypermethrin also had phenyl ether
and alpha-cyano, which is similar to fenvalerate. Compared with that, there were
more differences between bifenthrin and fenvalerate in respect of molecular
structure. The CR value was calculated as reported previously (Ahn, Watanabe,
Gee, & Hammock, 2004).
Sample test (FLISA and GC)
In order to study the recovery of the method, three types of samples were spiked and
detected using the method. One sample was Yangtze River water, which represented
4 J. Liu et al.
Dow
nloa
ded
by [
Lau
rent
ian
Uni
vers
ity]
at 1
1:53
22
Mar
ch 2
013
that the environment was polluted easily by the pesticide (Kong, Zhang, Zhang,
Shirley, & Li, 2010); the other two were cabbage and rape, which were often under
the protection of fenvalerate in agriculture. The samples were all free-fenvalerate.
The fenvalerate was dissolved in methanol and the water sample was mixed with10% methanol. The fenvalate standard solution was spiked in water sample, which
diluted the fenvalerate concentration to 0.08 mg mL�1, 0.24 mg mL�1, 0.72 mg mL�1,
and 2.16 mg mL�1, respectively. And then the water samples were filtered to be
detected because there were potential interferences in environmental water (Gui, Jin,
Chen, Cheng, & Zhu, 2006).
Cabbage and rape samples were spiked and homogenized. After filtering, the
samples’ matrix solution was cleared up via a solid-phase extraction column
(Florisil). The concentration of these spiked samples was the same as that in water.The samples were also determined by the GC method (Pang et al., 1999). For
extraction of high-moisture samples, the chopped and spiked sample (15 g) was
homogenized with 35 mL of acetone for 3 min at 18,000 rpm. After threefold
washing with acetone (5 mL), all the mixture was filtered. Hexane (30 mL) was
added and the mixture was shaken vigorously for 5 min. Sixty milliliters of 10%
aqueous NaCl (w/v) was added and the contents were mixed vigorously for 5 min.
The layers were separated and the aqueous one was discarded. MgSO4 (10 g) was
added to the hexane layer and mixed. After being washed and filtered, the hexanewas evaporated nearly to drynessusing rotary at 408C. The residue was redissolved in
hexane (10 mL), which was extracted by threefold extraction with 10 mL of
acetonitrile�saturated hexane. The acetonitrile layer was obtained and evaporated
nearly to dryness at 508C. The residue was redissolved in 5 mL of hexane.
And then the solution was cleaned up by the Florisil which was pretreated with 5
mL of hexane and acetonitrile (9�1). At last, the solution was blown nearly to
dryness with N2 and then hexane (5 mL) was added to dissolve the residue for GC
method.
Results and discussion
The appearance of the QDs
Figure 1 shows the appearance of QDs at different wavelengths (254 nm and 365 nm)
of ultraviolet light. They emitted the same wavelength but different intensity light at
different excited light. The QDs have a stable fluorescence characteristic (Kim, 2007;Kobayashi et al., 2007), which would be predicted in later measurement and
verification.
The absorption and emission spectrum of QDs
The QDs have a excitation spectrum within a wide range and a single emission peak.
UV absorption and emission spectra are shown in Figure 2. A wavelength of 564 nmwas selected as the emission wavelength, which could supply a high fluorescence
intensity value. It is known from the picture that the peak ranges from about 460 nm
to 660 nm. In order to avoid the effect of excitation wavelength, 400 nm was selected
as the wavelength to excite the QDs though the ultraviolet maximum absorption
wavelength was about 500 nm.
Food and Agricultural Immunology 5
Dow
nloa
ded
by [
Lau
rent
ian
Uni
vers
ity]
at 1
1:53
22
Mar
ch 2
013

Figure 2. The UV absorption spectrum and fluorescence spectrum of QDs.
Figure 1. The fluorescence of QDs in the light of ultraviolet of different wavelengths (A: 254
nm, B: 365 nm).
6 J. Liu et al.
Dow
nloa
ded
by [
Lau
rent
ian
Uni
vers
ity]
at 1
1:53
22
Mar
ch 2
013
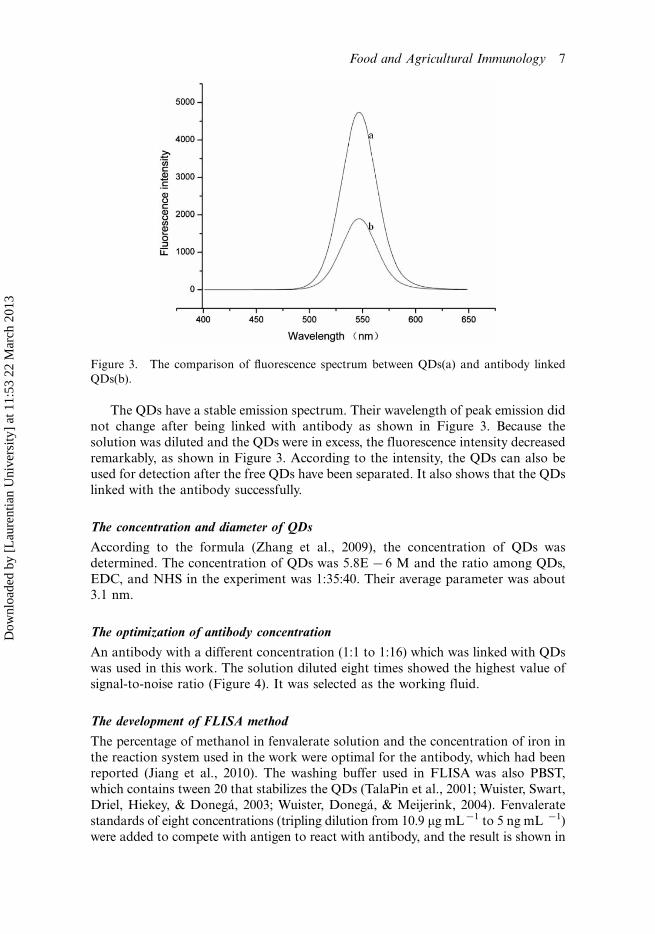
The QDs have a stable emission spectrum. Their wavelength of peak emission did
not change after being linked with antibody as shown in Figure 3. Because the
solution was diluted and the QDs were in excess, the fluorescence intensity decreased
remarkably, as shown in Figure 3. According to the intensity, the QDs can also be
used for detection after the free QDs have been separated. It also shows that the QDs
linked with the antibody successfully.
The concentration and diameter of QDs
According to the formula (Zhang et al., 2009), the concentration of QDs was
determined. The concentration of QDs was 5.8E �6 M and the ratio among QDs,
EDC, and NHS in the experiment was 1:35:40. Their average parameter was about3.1 nm.
The optimization of antibody concentration
An antibody with a different concentration (1:1 to 1:16) which was linked with QDs
was used in this work. The solution diluted eight times showed the highest value ofsignal-to-noise ratio (Figure 4). It was selected as the working fluid.
The development of FLISA method
The percentage of methanol in fenvalerate solution and the concentration of iron in
the reaction system used in the work were optimal for the antibody, which had beenreported (Jiang et al., 2010). The washing buffer used in FLISA was also PBST,
which contains tween 20 that stabilizes the QDs (TalaPin et al., 2001; Wuister, Swart,
Driel, Hiekey, & Donega, 2003; Wuister, Donega, & Meijerink, 2004). Fenvalerate
standards of eight concentrations (tripling dilution from 10.9 mg mL�1 to 5 ng mL �1)
were added to compete with antigen to react with antibody, and the result is shown in
Figure 3. The comparison of fluorescence spectrum between QDs(a) and antibody linked
QDs(b).
Food and Agricultural Immunology 7
Dow
nloa
ded
by [
Lau
rent
ian
Uni
vers
ity]
at 1
1:53
22
Mar
ch 2
013

Figure 5. The IC50 was 0.28 mg mL�1. The limit of detection (LOD) of the
immunoassay was 25 ng mL�1, and the linear range was from 60 ng mL�1 to 3.83 mg
mL�1. The method can be used in the rapid detection and screening for the fenvalerate
in samples like fruits and vegetables.
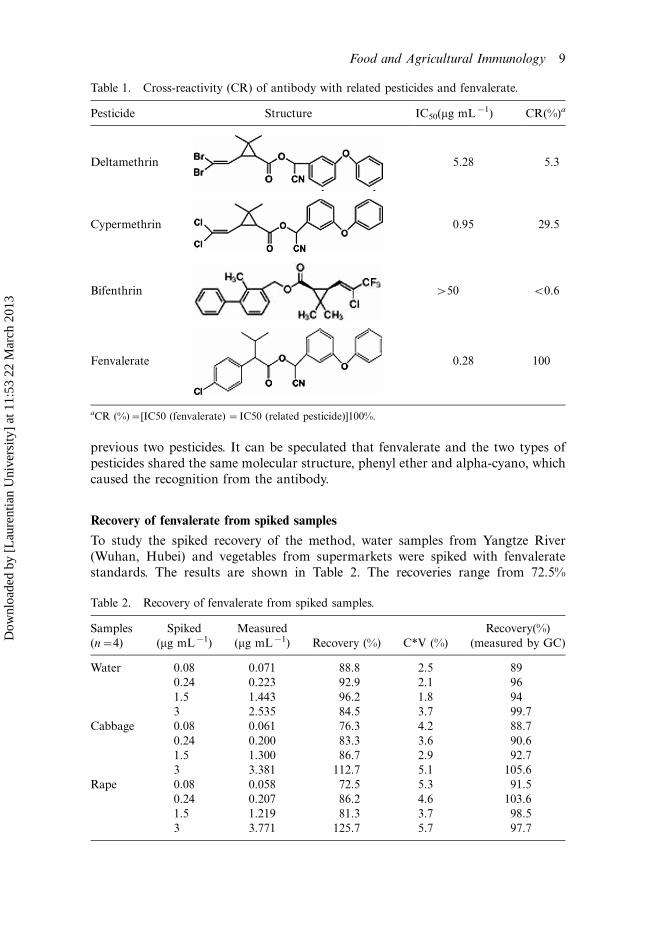
The CR from the reaction between antibody and other analytes represented the
specificity of the method. The results are shown in Table 1. The method had CRs of
29.5% and 5.3% with cypermethrin and deltamethrin, respectively, which was much
higher than that of bifenthrin (B0.6%). Obviously, the difference in structure
between fenvalerate and bifenthrin was much larger than that observed with the
Figure 4. Signal-to-noise ratio of different antibody concentration.
Figure 5. FLISA inhibitory curve for fenvalerate (B value was the fluorescence intensity of
the well with fenvalerate deducted the background and the B0 was the fluorescence intensity of
the well without fenvalerate deducted the background.)
8 J. Liu et al.
Dow
nloa
ded
by [
Lau
rent
ian
Uni
vers
ity]
at 1
1:53
22
Mar
ch 2
013
previous two pesticides. It can be speculated that fenvalerate and the two types of
pesticides shared the same molecular structure, phenyl ether and alpha-cyano, which
caused the recognition from the antibody.
Recovery of fenvalerate from spiked samples
To study the spiked recovery of the method, water samples from Yangtze River
(Wuhan, Hubei) and vegetables from supermarkets were spiked with fenvalerate
standards. The results are shown in Table 2. The recoveries range from 72.5%
Table 1. Cross-reactivity (CR) of antibody with related pesticides and fenvalerate.
Pesticide Structure IC50(mg mL�1) CR(%)a
Deltamethrin 5.28 5.3
Cypermethrin 0.95 29.5
Bifenthrin �50 B0.6
Fenvalerate 0.28 100
aCR (%)�[IC50 (fenvalerate) �IC50 (related pesticide)]100%.
Table 2. Recovery of fenvalerate from spiked samples.
Samples
(n�4)
Spiked
(mg mL�1)
Measured
(mg mL�1) Recovery (%) C*V (%)
Recovery(%)
(measured by GC)
Water 0.08 0.071 88.8 2.5 89
0.24 0.223 92.9 2.1 96
1.5 1.443 96.2 1.8 94
3 2.535 84.5 3.7 99.7
Cabbage 0.08 0.061 76.3 4.2 88.7
0.24 0.200 83.3 3.6 90.6
1.5 1.300 86.7 2.9 92.7
3 3.381 112.7 5.1 105.6
Rape 0.08 0.058 72.5 5.3 91.5
0.24 0.207 86.2 4.6 103.6
1.5 1.219 81.3 3.7 98.5
3 3.771 125.7 5.7 97.7
Food and Agricultural Immunology 9
Dow
nloa
ded
by [
Lau
rent
ian
Uni
vers
ity]
at 1
1:53
22
Mar
ch 2
013
to 125.7%. It was evident that the average recovery of water samples (84.5% to
96.2%) was higher than that in vegetables (72.5% to125.7%), which was caused by the
matrix efforts. It was speculated that the matrix in vegetable samples was much more
complex than that in the water sample. Compared with GC method, the recovery of
the FLISA method was not as well. The FLISA method was not only free of complex
pretreatment but also saved a lot of time and reagent, which might have polluted the
environment. Considering the acceptable recovery close to that obtained by the GC
method, FLISA was regarded as a rapid, accurate, and relatively sensitive method,
especially for the agro-food like vegetables and fruits.
Conclusion
In this work, a type of CdTe QDs was synthesized and coupled with monoclonal
antibody fight against fenvalerate made in lab. The absorption spectrum and
emission spectrum were obtained. Moreover, the emission wavelength of free QDs
was the same as that of the conjugate, which showed the stable fluorescence
characteristic. Proper excitation and emission wavelengths were selected and the
concentration of the antibody was optimized. After these optimizations, a FLISA
method was developed. The standard inhibitory curve was also developed. The
LOD was 25 ng mL�1 and the linear range was from 60 ng mL�1 to 3.83 mg mL�1.
In the method, the CRs of antibody with deltamethrin and cypermethrin were 29.5%
and 5.3%, respectively, which were much higher than the CR (B0.6%) between
antibody and bifenthrin. Fenvalerate shared the same molecular structure, phenyl
ether and a-cyano, which caused the recognition from the antibody. The result of the
spiked recovery work was also obtained, including those for water samples and
vegetables samples. The recoveries ranged from 72.5% to 125.7%, which was close to
those obtained by the GC method. The average recovery of water samples wasevidently higher than that of vegetables, which was caused by the complex matrix in
vegetables. On the basis of the specific emission wavelength of QDs, the FLISA
method reduced the false-positive ratio in the detection. The method also saved 1 h
compared to ELISA, which can be used in rapid detection of fenvalerate residue in
vegetables and other related samples.
Agro-food has a short shelf life. Vegetables and fruits are often eaten raw by
people, which makes the pestcide residue become one of the major factors which pose
threats to the health of human. Because of this, rapid detection of the residue of
fenvalerate, which is widely used as a useful pesticide in the producing these agro-
foods, is crucial. Rapid detection methods will play an increasingly important role in
environment protection and the food quality and safety.
Acknowledgments
The work was supported by the National Natural Science Fund (30800771), Key Project of theMinistry of Agriculture (2011-G5), Special Fund for Agro-scientific Research in the PublicInterest (201203094), Project of National Science & Technology Pillar Plan (2012BAB19B09),and Earmarked Fund for China Agriculture Research System (CARS-13).
References
Ahn, K. C., Watanabe, T., Gee, S. J., & Hammock, B. D. (2004). Hapten and antibodyproduction for a sensitive immunoassay determining a human urinary metabolite of the
10 J. Liu et al.
Dow
nloa
ded
by [
Lau
rent
ian
Uni
vers
ity]
at 1
1:53
22
Mar
ch 2
013
pyrethroid insecticide permethrin. Journal of Agricultural and Food Chemistry, 52(15), 4583�4594.
Arena, A. C., Fernandeza, C. D., Porto, E. M., Bissacot, D. Z., Pereira, O. C., & Kempinas, W.G. (2008). Fenvalerate, a Pyrethroid insecticide, adversely affects sperm production andstorage in male rats. Journal of Toxicology and Environmental Health, Part A, 71(23), 1550�1558.
Bouwman, H., Sereda, B., & Meinhardt, H.M. (2006). Simultaneous presence of DDT andpyrethroid residues in human breast milk from a malaria endemic area in South Africa.Journal of Environment and Pollution, 144(3), 902�917.
Dwarakanath, S., Bruno, J. G., & Shastry, A. (2004). Quantum dot-antibody and aptamerconjugates shift fluorescence upon binding bacteria. Biochemical and Biophysical ResearchCommunications, 11(3), 739�743.
Gong, J. L., Gong, F. C., Kuang, Y., Zeng, G. M., Shen, G. L., & Yu, R. Q. (2004). Capacitivechemical sensor for fenvalerate assay based on electropolymerized molecularly imprintedpolymer as the sensitive layer. Analytical and Bioanalytical Chemistry, 379(2), 302�307.
Gui, W. J., Jin, R. Y., Chen, Z. L., Cheng, J. L., & Zhu, G. N. (2006). Hapten synthsis forenzyme-linkde immunoassy of the insecticide triazophos. Analytical Biochemistry, 357(1), 9�14.
Hua, L. J., Han, H. Y., & Zhang, X. J. (2009). Size-dependent electrochemiluminescencebehavior of water-soluble CdTe quantum dots and selective sensing of l-cysteine. Talanta,77(5), 1654�1659.
Jiang, J., Zhang, D. H., Zhang, W, Wang, X. P., Kong, Y., Zhang, Q, & Li, P. W. (2010).Preparation, identification, and preliminary application of monoclonal antibody againstpyrethroid insecticide fenvalerate. Analytical Letters, 43(17), 2773�2789.
Jimenez, J. J., Bernal, J. L., del Nozal, M. J., Bernal, J., & Toribio, L. (2007). Persistence anddegradation of metalaxyl, lindane, fenvalerate and deltamethrin during the wine makingprocess. Food Chemistry, 104(1), 216�223.
Kim, K. Y. (2007). Nanotechnology platforms and physiological challenges for cancertherapeutics. Nanomedicine, 3(2), 103�110.
Kobayashi, H., Hama, Y., Koyama, Y., Barrett, T., Regino, C. A., Urano, Y., & Choyke, P. L.(2007). Simultaneous multicolor imaging of five different lymphatic basins using quantumdots. Nano Letters, 7(6), 1711�1716.
Kong, Y., Zhang, Q., Zhang, W., Shirley, J. G., & Li, P. W. (2010). Development of amonoclonal antibody-based enzyme immunoassay for the pyrethroid insecticide deltame-thrin. Journal of Agricultural and Food Chemistry, 58(14), 8189�8195.
Mak, S. K., Shan, G. M., Lee, H. J., Watanabe, T., Stoutamire, D. W., Gee, S. J., & Hammock,B. D. (2005). Development of a class selective immunoassay for The type II pyrethroidinsecticides. Analytica Chimica Acta, 534, 109�120.
Pang, G. F., Cao, Y. Z., Fan, C. L., Zhang, J. J., & Li, X. M. (1999). Multiresidue gaschromatographic method for determining synthetic pyrethroid pesticides in agriculturalproducts: Collaborative study. Journal of AOAC International, 82(1), 186�212.
Pang, G. F., Fan, C. L., Liu, Y. M., Cao, Y. Z., Zhang, J. J., Li, X. M., & . . . Guo, T. T. (2006).Determination of residues of 446 pesticides in fruits and vegetables by three-cartridge solid-phase extraction-gas chromatography-mass spectrometry and liquid chromatography-tandem mass spectrometry. Journal of AOAC International, 89, 740�771.
Pieters, B. J., & Liess, M. (2006). Population developmental stage determines the recover-ypotential of Daphnia magna populations after fenvalerate application. EnvironmentalScience & Technology, 40, 6157�6162.
Sharma, J., Satya, S., Kumar, V., & Tewary, D. K. (2005). Dissipation of pesticides duringbread-making. Journal of Chemical Health and Safety, 12(1), 17�22.
Sharma, A., Guptaa, M., & Shankera, A. (2008). Fenvalerate residue level and dissipation intea and in its infusion. Food Additives & Contaminants: Part A, 25(1), 97�104.
Sheng, Z. H., Han, H. Y., Hu, X. F., & Chen, C. (2010). One-step growth of high luminescenceCdTe quantum dots with low cytotoxicity in ambient atmospheric conditions. DaltonTransaction, 39(30), 7017�7020.
Food and Agricultural Immunology 11
Dow
nloa
ded
by [
Lau
rent
ian
Uni
vers
ity]
at 1
1:53
22
Mar
ch 2
013
Shi, H. Y., Zhang, B. H., Ye, Y. H., Zheng, Z. T., & Wang, M. H. (2011). Development of anenzyme-linked immunosorbent assay for the pyrethroid fenpropathrin. Food and Agricul-tural Immunology, 22(1), 69�76.
Song, Y., Lu, Y., Liu, B., Xu, N., & Wang, S. (2011). A sensitivity-improved enzyme-linkedimmunosorbent assay for fenvalerate: A new approach for hapten synthesis and applicationto tea samples. Journal of the Science of Food and Agriculture, 91(12), 2210�2216.
TalaPin, D. V., Haubold, S., Rogach, A. L., Kornowski, A., Haase, M., & Weller, H. (2001). Anovel organometallic synthesis of highly Luminescent CdTe Nanocrystals. Journal ofPhysical Chemistry B, 105(12), 2260�2263.
Resch-Genger, U., Grabolle, M., Cavaliere-Jaricot, S., Nitschke, R., & Nann, T. (2008).Quantum dots versus organic dyes as fluorescent labels. Nature Methods, 5, 763�775.
Vinayaka, A. C., Basheer, S., & Thakur, M. S. (2009). Bioconjugation of CdTe quantum dotfor the detection of 2,4-dichlorophenoxyacetic acid by competitive fluoroimmunoassaybased biosensor. Biosensors and Bioelectronics, 24(6), 1615�1620.
Wang, H., Li, Y. B., & Slavik, M. (2007). Rapid detection of listeria monocytogenes usingquantum dots and nanobeads-based optical biosensor. Journal of Rapid Methods andAutomation in Microbiology, 15(1), 67�76.
Wuister, S. F., Swart, I., Driel, F. V., Hiekey, S. G., & Donega, C. M. (2003). Highlyluminescent water-soluble CdTe quantum dots. Nano Letters, 3(4), 503�507.
Wuister, S. F., Donega, C. M., & Meijerink, A. (2004). Influence of thiol capping on theexciton luminescence and decay kinetics of CdTe and CdSe quantum dots. Journal ofPhysical Chemistry B, 108(45), 10393�10397.
Zhang, B. B., Liang, X. F., Hao, L. J., Cheng, J., Gong, X. Q., & Liu, X. H. (2009). Quantumdots/particle-based immunofluorescence assay: Synthesis, characterization and application.Journal of Photochemistry and Photobiology B, 94(1), 45�50.
Zhou, Q. X., Zhang, X. G., & Xie, G. H. (2011). Preconcentration and determination ofpyrethroid insecticides in water with ionic liquid dispersive liquid-phase microextraction incombination with high performance liquid chromatography. Analytical Methods, 3(2), 356�361.
12 J. Liu et al.
Dow
nloa
ded
by [
Lau
rent
ian
Uni
vers
ity]
at 1
1:53
22
Mar
ch 2
013