development of a fault detection approach based on svm
TRANSCRIPT

HAL Id: hal-01021232https://hal.inria.fr/hal-01021232
Submitted on 9 Jul 2014
HAL is a multi-disciplinary open accessarchive for the deposit and dissemination of sci-entific research documents, whether they are pub-lished or not. The documents may come fromteaching and research institutions in France orabroad, or from public or private research centers.
L’archive ouverte pluridisciplinaire HAL, estdestinée au dépôt et à la diffusion de documentsscientifiques de niveau recherche, publiés ou non,émanant des établissements d’enseignement et derecherche français ou étrangers, des laboratoirespublics ou privés.
Development of a Fault Detection Approach Based onSVM Apllied to Industrial Data
Astrid Rother, Mohieddine Jelali, Dirk Söffker
To cite this version:Astrid Rother, Mohieddine Jelali, Dirk Söffker. Development of a Fault Detection Approach Based onSVM Apllied to Industrial Data. EWSHM - 7th European Workshop on Structural Health Monitoring,IFFSTTAR, Inria, Université de Nantes, Jul 2014, Nantes, France. �hal-01021232�

Development of a Fault Detection Approach Based on SVM Applied to Industrial Data
Astrid Rother1,3, Mohieddine Jelali2, Dirk Söffker3 1 Rolling and Metallic Coating Bochum, ThyssenKrupp Steel Europe,
Essener Straße 244, 44793 Bochum 2 Laboratory of Control Engineering and Mechatronics,
Cologne University of Applied Sciences, Betzdorfer Straße, 50679 Cologne 3 Chair of Dynamics and Control, University of Duisburg-Essen,
Lotharstr. 1¬21, 47057 Duisburg [email protected]
ABSTRACT
In existing production plants, sensor systems and other sources provide information about the plant condition. This paper presents methods for how data can be conveniently summarized, treated, and evaluated to retain characteristic features and allocate them to certain faults respectively to use them for monitoring purposes. This work details the development of a method to be applied to selected data sets, and which then can be expanded for use in the real environment. This paper details a procedure developed for automated selection and processing to reduce the time exposure of qualified personnel. A number of possible methods of analysis were tested for their ability to point out conspicuous events, especially Wavelet Transformation for feature extraction and Support Vector Machines for classification. Data sets that are correlated to the different conditions of the system are used for training and testing. After training, the algorithm will be able to detect different faults in time. In today’s practice, faults are analyzed after they have occurred. Applying the method, a major failure can be prevented by detecting contingency faults. Using real industrial data from the hot strip mill of ThyssenKrupp Steel Europe (TKSE), the developed approach will be tested offline for practical relevance.
KEYWORDS : wavelet transform, support vector machine, fault detection, non-stationary signals, industrial data
INTRODUCTION
Due to increasing customer’s demands in product quality, the complexity of machinery increases steadily. As the complexity increases, the detection of faults becomes more difficult. The need to reduce downtimes caused by faulty machines and the need to extend the lifetime of machine parts is satisfied by condition-based maintenance (CBM) [1]. This is a cost effective and efficient technique to supervise the system’s condition. Assuming that knowledge about the system state and related wear effects is available, the prediction of wear-caused breakdowns and other faults becomes possible [2]. Depending on the fault to be considered, these can be detected by different monitoring systems with differing efficacies. Usually machines do not fail without warning. In many cases the initial symptoms can be used for early detection of faults.
A wide scientific contributions has been published on modeling these systems; a review is given by Venkatasubramanian [3]. Model design of a complex system for diagnostic purposes is expensive since it needs wide a priori knowledge and the model may not be suitable for the real application.
7th European Workshop on Structural Health MonitoringJuly 8-11, 2014. La Cité, Nantes, France
Copyright © Inria (2014) 1061

Data-driven approaches have proven to be applicable in many cases [4, 5] and are used in this contribution. Still, expert knowledge is needed for measurements and preselection of the appropriate key-features characterizing the machine state.
Serido et al. present a residual-based approach for fault detection in a cold strip mill [6]. They build an empirical model without a priori knowledge of fault patterns or models. Therefore authors needed to supervise all measured channels using linear models, Box-Cox models, and fuzzy models to examine the degree of non-linearity contained in a signal. This approach suffers from a dimensionality problem and increased computation time, especially in the case of non linear models.
Several investigations deal with fault detection in nearly periodic systems such as gearboxes. Sun et al. worked on rotating machinery [7]. They deployed a multi wavelet denoising method with a data-driven block threshold to spot weak features of incipient faults. The authors used expert knowledge to determine the signals to be analyzed and the properties of the chosen multiwavelets. Chen et al. worked as well on rotating machinery [8]. In their experimental study a laboratory experiment is used, a multi-kernel support vector machine with chaotic swarm optimization to set the parameters is applied. Empirical Mode Decomposition (EMD) for feature extraction and local tangent space alignments for feature reduction was used.
Yao et al. [9] developed a theoretical approach on fault detection based on wavelet transform and support vector machines. Discrete wavelet transform was used, one selected level containing the fault emerging frequency was selected to be reconstructed, and monitoring was realized with standard derivation. A Support Vector Machine (SVM) trained with those data form a laboratory experiment reached up to 95% classification. Cao et al. [10] used wavelet package transform for feature extraction. The packet containing rich information about the fault was reconstructed and transferred to a Hilbert-Huang transform. The mean and the standard value of Hilbert-Huang were taken into account to define significant indices for the fault. The authors state an improvement in detection rates but without giving concrete figures.
This contribution presents the results of a Wavelet Transform (WT), which is used to reveal machine state’s patterns. Trained with these patterns a SVM specifies the state of a system. The selected methods are applied to a hot strip mill’s problem. The used data originating from a seven-stand hot strip mill are highly non-stationary, since the special interest lies here on the strip pass. This is a non-repetitive process without significant periodic signals. Hence, solely time-based applications or solely frequency-based analyses are not suitable.
The following section of this contribution will give an overview on the considered methods. The subsequent section outlines the application to industrial data and summarizes the results. The last section discusses the results and future research.
1 SIGNAL PROCESSING TECHNIQUES
In the field of CBM a huge variety of analysis techniques have been applied. Feng et al. give a broad overview with several application examples [4]. The methods suited to solve this example of an industrial problem are introduced in this chapter.
1.1 Continuous Wavelet Transformation The wavelet transform (WT) solves the time-frequency resolution problem by sweeping the window size. This method is well known in topics concerning image analysis but also relevant for other tasks in the field of pattern analysis. For example, Al-Shrouf et al. applied CWT successfully as a prefilter for classification [11]. The continuous wavelet Transform (CWT) is given by
Ψ χψ (τ , s) = 1
sx(t)ψ∗(t −τ
s) dt
−∞
∞
∫ .
EWSHM 2014 - Nantes, France
1062

The transformed signal depends on the translation parameter τ and the scale parameter s. The function ψ is called the mother wavelet (MW). The mother wavelet is a basic window function applied to a signal. The parameter τ describes the position of the window (the translation), that is accountable for the time resolution. The parameter s is defined as the inverse of the frequency: s= 1/f. The higher the value of s, the wider the window. All windows are shrunk or widened versions of the MW. Different wavelets have different time-frequency structures and therefore different specific fault-feature extraction abilities. Common wavelets are Haar, Morlet or Daubechie. Smith et al. show the performance of these three wavelets on a specific fault [12].
1.2 Discrete Wavelet Transform The information allocated by CWT is redundant. The Discrete Wavelet Transform (DWT) uses only the required number of scale factors, reducing calculation time, and preserving recoverability. A good overview is given in Heil and Walnut [13]. Due to the constraints of the scaling factors a multi-scale analysis is possible. A filter belt (series of filters of different cutoff frequencies) splits the signal (x(n)) into its frequency components (see Figure 1). The signal is split in the middle by high-pass and low-pass filters repeatedly until the width of the window is reached. The impulse response functions of the high pass filters are h(n) and that of the low pass filter g(n). Without loss of information downsampling by a factor of 2 is allowed, thus computation time is considerably reduced.
Figure 1: Filter belt of discrete wavelet transform
1.3 Empirical Mode Decomposition The Empirical Mode Decomposition (EMD) decomposes any given data into Intrinsic Mode Functions (IMF). According to Hang [14], an IMF has to satisfy two conditions: “(1) in the whole data set, the number of extrema and the number of zero crossings must either equal or differ at most by one; and (2) at any point, the mean value of the envelope defined by the local maxima and the envelope defined by the local minima is zero”. The number of IMF needed to reconstruct the signal with an acceptable loss of information is finite and often small. Lei et al. [15] provide further information on the method and typical applications.
1.4 Support Vector Machines The Support Vector Machine (SVM) algorithm realizes classification of data. It is trained with prepared data sets (training data) of known classes to be able to distinguish between certain patterns. The trained model is used to classify unknown data (test data). Abe gives a comprehensive resume [16]. The linear SVM can be used on easily spreadable classes. In practice non-spreadable single data points will appear in the wrong class and may lead to malfunction of the algorithm. A certain number of wrongly classified data points is allowed with a soft margin. In this approach a non-linear SVM is used with a kernel function that may transform the data to a suited state space in which a separation of the classes is possible.
EWSHM 2014 - Nantes, France
1063

2 APPLICATION AREA
The industrial data used in this study originated from the ThyssenKrupp Steel Europe’s (TKSE) hot strip mill in Bochum. This mill is a semi-continuous mill, which consists of reheating furnaces, a roughing mill, coil box, finishing mill, and down coilers. Reheated slabs discharged from a furnace run first through the roughing mill, then through the finishing mill to be coiled down after cooling. For special quality groups it is necessary to coil the slap in the coil box before entering the finishing mill. The way strips pass through the continuous finishing mill is in some cases not optimal, and may lead to faults. Two of these faults were selected to be assessed by the previously described algorithms. Both faults can lead to machine damage and unwanted downtimes. For the sake of integrity two stable conditions were defined. In figure 2a an overview on a seven stand finishing mill is given.
Figure 2: a) Seven stand finishing mill, b) Single stand with pressure cell The data originating from the finishing mill sensors has been checked for suitability by state characterization. From the production experience the assumption results, that the faults to be detected may show characteristic features in the difference of rolling forces in each stand. The respective sensors (pressure cells) and the measurement direction are marked in red in figure 2b. The general approach on fault detection is shown on figure 3.
Figure 3: Detection procedure
EWSHM 2014 - Nantes, France
1064
3 EXPERIMENTAL RESULTS
To generate the training and test data for this approach, certain events in a rolling process were selected via event-based data. The considered events were classified as shown:
• Stable rolling with slab in stand (Pattern 1) • Stable rolling without slab in stand (Pattern 2) • Fault cobble (Pattern 3) • Fault shearing tale (Pattern 4)
For each of the two good and the two faulty classes related data samples of one second duration were selected. The training data set consisted of 15 and the test data of 5 samples for each of the four patterns.
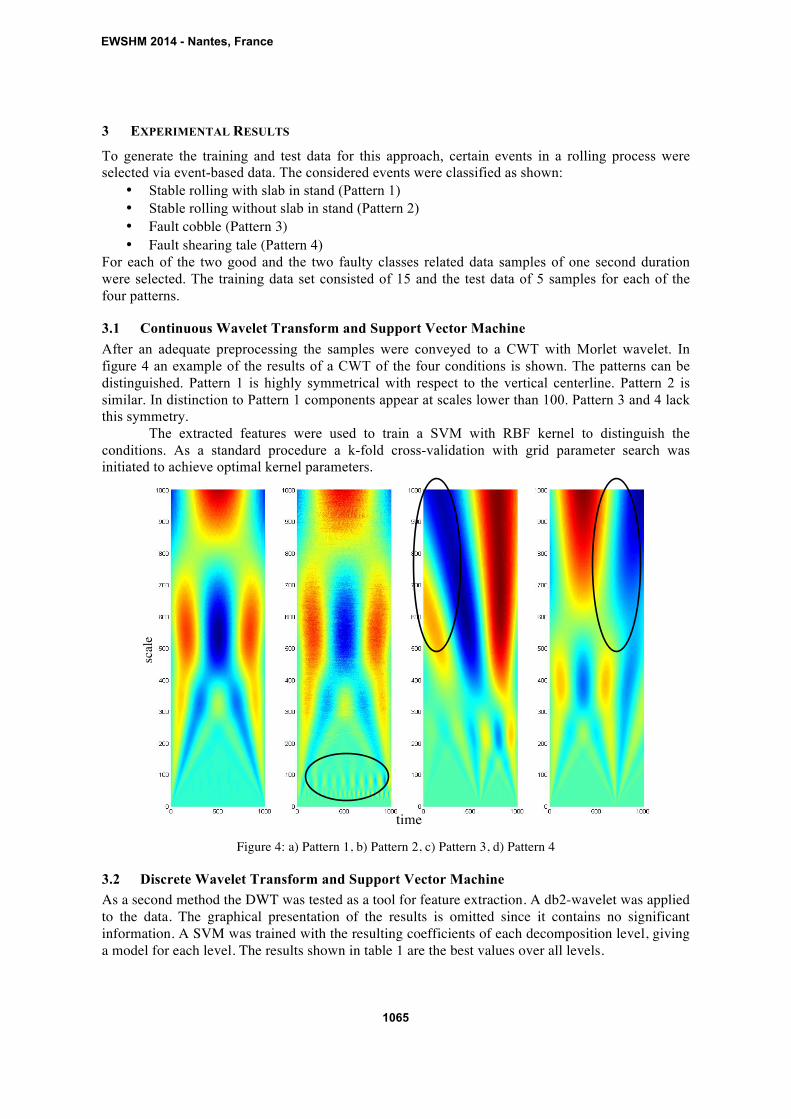
3.1 Continuous Wavelet Transform and Support Vector Machine After an adequate preprocessing the samples were conveyed to a CWT with Morlet wavelet. In figure 4 an example of the results of a CWT of the four conditions is shown. The patterns can be distinguished. Pattern 1 is highly symmetrical with respect to the vertical centerline. Pattern 2 is similar. In distinction to Pattern 1 components appear at scales lower than 100. Pattern 3 and 4 lack this symmetry.
The extracted features were used to train a SVM with RBF kernel to distinguish the conditions. As a standard procedure a k-fold cross-validation with grid parameter search was initiated to achieve optimal kernel parameters.
Figure 4: a) Pattern 1, b) Pattern 2, c) Pattern 3, d) Pattern 4
3.2 Discrete Wavelet Transform and Support Vector Machine As a second method the DWT was tested as a tool for feature extraction. A db2-wavelet was applied to the data. The graphical presentation of the results is omitted since it contains no significant information. A SVM was trained with the resulting coefficients of each decomposition level, giving a model for each level. The results shown in table 1 are the best values over all levels.
scal
e
time
EWSHM 2014 - Nantes, France
1065

3.3 Empirical Mode Decomposition and Cross-Correlation Due to the CWT’s symmetrical behavior of Pattern 1 and 2 an EMD was applied to extract this feature. In figure 5 some typical IMF of the data are given. The first, second and last modes were omitted, since they do not show characteristic behavior and were not analyzed. The upper left graph shows Pattern1, the upper right shows Pattern 2. The symmetrical behavior seen in the CWT result is mirrored in the IMF of the data. In contrast to this, the Patterns 3 and 4 show highly non-symmetrical behavior in their IMF, as shown in the lower left and lower right graph of figure 5.
Figure 5: Intrinsic Mode Functions a) Pattern 1 b) Pattern 2 c) Pattern 3 d) Pattern 4
The symmetry is measured by a cross-correlation analysis of the IMF. In figure 6 some typical results are shown. The cross-correlation’s amplitude at Pattern 1 is 0.8, and it is clearly distinguishable from the other three patterns. The IMF of Pattern 2 shows as well a symmetrical behavior, here denoted by a cross-correlation result of 0.2. The cross-correlation’s amplitude of the IMF of Pattern 3 is by a factor of 103 lower than that of the IMF of Pattern 1 and 2. The maximum is shifted from the middle position, which indicates the input signal was not axially symmetric. The IMF of Pattern 4 does not show symmetric behavior either. Also, the maximum amplitude of 0.05 is low and shifted.
EWSHM 2014 - Nantes, France
1066

Figure 6: Cross-correlation IMF a) Pattern 1 b) Pattern 2 c) Pattern 3 d) Pattern4
4 COMPARISON OF THE TWO METHODS INTRODUCED
Based on the examined 60 training data sets and the analysis of 20 test data sets, the detection rate (POD) and the analysis of fault alarms (PFA) are examined. The CWT-SVM approach lead to a POD of 100% with a PFA of 30%. It was not able to distinguish between Pattern 3 and 4. Pattern 3 has been falsely categorized as Pattern 4. The DWT-SVM scored 60% POD with 10% PFA. It was neither able to distinct between Pattern 3 and 4. Pattern 3 was categorized as Pattern 4 by this method. The EMD approach was applied to training and test data sets. The two first and the last mode were not suited to distinct the four patterns. For the remaining modes a threshold was defined to distinguish between Pattern 1 and 2. For the detection of Pattern 3 and 4 the position of the maximum correlation function was used. The preliminary results based on the first example data sets introduced before are shown in Table 1. The amount of data has to be increased to establish reliable and statistically significant statements.
Method Pattern1 Pattern 2 Pattern 3 Pattern4 POD PFA CWT 80% 60% 0% 100% 100% 30% DWT 80% 80% 0% 60% 60% 10% EMD 100% 80% 100% 100% 100% 1,2%
Table 1: Preliminary results of application
SUMMARY AND CONCLUSION
Three different approaches for feature-based fault detection were presented. The goal was to detect two different faults in production data with a low rate of false alarms. The three approaches were compared in terms of performance. The CWT-SVM approach uses CWT for feature extraction and a SVM for classification. Using the same classifier the DWT-SVM approach lead to a remarkable reduction in calculation time. Both methods introduced are able to identify faults, to distinguish some faulty states, but were not able do distinct between them, but rather classified Pattern 3 as Pattern 4. The CWT-SVM approach resulted in less false alarms. The second approach introduced first filters the input data using EMD and classifies them via cross-correlation. The hits for all patterns were good but the automatic identification still has to be improved. The results for all three approaches are able to clearly distinguish different faults as well as detect faults. Further investigations will be done to improve the results. A multi-stage approach on fault identification as shown in [11] will be taken into account.
ACKNOWLEDGEMENTS
The first author would like to thank ThyssenKrupp Steel Europe AG for the support of this research.
EWSHM 2014 - Nantes, France
1067

REFERENCES
[1] A.K.S. Jardine et al. A Review on machinery diagnostics and prognostics implementing condition-based maintenance. Mechanical Systems and Signal Processing 20, 1483-1510, 2006.
[2] T. Marwala. Condition Monitoring Using Computational Intelligence Methods. Springer London Dordrecht Heidelberg New York, 2012.
[3] V. Venkatasubramanian et al. A Review of process fault detection and diagnosis Part I: Quantitative model-based method. Computers and Chemical Engineering Vol. 27, 293-311, 2003.
[4] Z. Feng et al. Recent advances in time-frequency analysis methods for machinery fault diagnosis: A review with application examples. Mechanical Systems and Signal Processing 38, 165-205, 2013.
[5] J. McGregor, A. Cinar. Monitoring, fault diagnosis, fault-tolerant control and optimization: Data-driven methods. Computers and Chemical Engineering 47, 111-120, 2012.
[6] F. Serido et al. Residual-based fault detection using soft computing techniques for condition monitoring at rolling mills. Information Sciences 259, 304-320, 2014.
[7] H. Sun et al. Wind turbine fault detection using multiwavelet denoising with the data-driven block threshold. Applied Acoustics 77, 122-129, 2014.
[8] F. Chen et al. Multi-fault diagnosis study on roller bearing based on multi-kernel support vector machine with chaotic particle swarm optimization. Measurement 47, 576-590, 2014.
[9] Z. Yao et al. On-line chatter detection and identification based on wavelet and support vector machine. Journal of Materials Processing Technology Vol. 210 No. 5, 713-719, 2010.
[10] H. Cao et al. Chatter identification in end milling process using wavelet packets and Hilbert-Huang transform. International Journal of Machine Tools & Manufacture 69, 11-19, 2013.
[11] L. Al-Shrouf et al. Improved process monitoring and supervision based on a reliable multi-stage feature-based pattern recognition technique. Information Science 259, 282-294, 2014.
[12] C. Smith et al. An approach to vibration analysis using wavelets in an application of aircraft health monitoring. Mechanical Systems and Signal Processing 21, 1255-1320, 2007.
[13] C. E. Heil, D. F. Walnut. Continuous and Discrete Wavelet Transforms. SIAM Review Vol. 31 No. 4, 628-666, 1989.
[14] N. Huang et al. The empirical mode decomposition and the Hilbert spectrum for nonlinear and non-stationary time series analysis. Proceedings of the Royal Society A 454, 903-995, 1998.
[15] Y.Lei et al. A review on empirical mode decomposition in fault diagnosis of rotating machinery. Mechanical Systems and Signal Processing Vol. 35, 108-126, 2013.
[16] S. Abe. Support Vector Machines for Pattern Classification. Springer London Dordrecht Heidelberg New York, 2010.
EWSHM 2014 - Nantes, France
1068