development of a characterization instrument for
TRANSCRIPT
DEVELOPMENT OF A CHARACTERIZATION INSTRUMENT FOR
THERMOMECHANICAL TESTING OF SHAPE MEMORY ALLOY
TORQUE ACTUATORS
UNDERGRADUATE HONORS THESIS
By
Gordon Fox
The Ohio State University
Department of Mechanical Engineering
May 10, 2010
Approved By:
Dr. Marcelo Dapino, Advisor:

1
© Copyright Gordon Fox
2010
2
Table of Contents
List of Figures ................................................................................................................................................ 4
List of Tables ................................................................................................................................................. 4
Acknowledgements ....................................................................................................................................... 5
Abstract ......................................................................................................................................................... 6
1 Introduction ............................................................................................................................................... 7
1.1 Properties of Shape Memory Alloys ................................................................................................... 7
1.2 History of Shape Memory Alloys ......................................................................................................... 9
1.3 Applications of NiTi ............................................................................................................................. 9
1.3.1 Current Applications .................................................................................................................... 9
1.3.2 Potential Future Applications .................................................................................................... 10
1.4 Difficulties in Realizing Applications of NiTi ...................................................................................... 11
1.4.1 Machining NiTi ........................................................................................................................... 11
1.4.2 Adhesive Bonding....................................................................................................................... 11
1.4.3 Soldering .................................................................................................................................... 11
1.4.4 Brazing ........................................................................................................................................ 12
1.4.5 Welding ...................................................................................................................................... 12
1.5 Objectives of Research ...................................................................................................................... 14
2 Design and Construction of Torsion Testing Machine ............................................................................. 15
2.1 Specifications .................................................................................................................................... 15
2.2 Basic Design of Machine ................................................................................................................... 15
2.3 Torque Application ............................................................................................................................ 16
2.3.1 Motor ......................................................................................................................................... 16
2.3.2 Moment Arm .............................................................................................................................. 16
2.4 Torque Measurement ....................................................................................................................... 17
2.5 Torque Data Filter ............................................................................................................................. 17
2.6 Angle Measurement ......................................................................................................................... 19
2.7 Base and Frame ................................................................................................................................. 22
2.8 Specimen Grips ................................................................................................................................. 23
2.8.1 Single-Tightening-Screw Clamp ................................................................................................. 24
2.8.2 Force-Fit Clamp .......................................................................................................................... 24
3
2.8.3 Coefficient of Friction Test ......................................................................................................... 25
2.8.4 First Four-Tightening-Screw Clamp ............................................................................................ 27
2.8.5 Current Four-Tightening-Screw-Clamp ...................................................................................... 28
2.8.6 Future Design ............................................................................................................................. 29
3 Verification and Calibration of Torsion Testing Machine ........................................................................ 30
3.1 Calibration of Torque Cell ................................................................................................................. 30
3.2 Measuring the Machine’s Stiffness ................................................................................................... 31
3.3 Measuring the Failure Torque of an Aluminum Specimen ............................................................... 32
3.4 Failure Test of Ultra Sonic Soldered Specimens ............................................................................... 33
3.4.1 Design of the Specimens ............................................................................................................ 33
3.4.2 Soldering Holder ........................................................................................................................ 34
3.4.3 Torsion Test ................................................................................................................................ 35
3.4.4 Strength Calculations ................................................................................................................. 37
3.4.5 Conclusions for Torsion Machine ............................................................................................... 38
4 Ongoing Research .................................................................................................................................... 39
4.1 Laser Weld Trials of NiTi to Stainless Steel ....................................................................................... 39
4.1.1 Weld Penetration Tests .............................................................................................................. 39
4.1.2 Welded Joint Strength Tests ...................................................................................................... 39
4.2 Thermal Testing of NiTi ..................................................................................................................... 40
4.2.1 Thermal Chamber Specifications ............................................................................................... 40
4.2.2 First Attempt to Create a Thermal Chamber ............................................................................. 40
4.2.3 Current Thermal Chamber Design ............................................................................................. 43
4.2.4 Finite Element Simulations ........................................................................................................ 44
5 Future Research ....................................................................................................................................... 47
5.1 Improvements to Machine ............................................................................................................... 47
5.2 Investigate Joint Stiffnesses .............................................................................................................. 47
5.3 Find Bond Strength of Each NiTi Phase ............................................................................................. 47
5.4 Investigate Rate Dependence of Stress and Temperature ............................................................... 47
6 Conclusions .............................................................................................................................................. 49
7 Bibliography ............................................................................................................................................. 50
4
List of Figures
Figure 1.1. SMA phase transformation curve ............................................................................................... 7 Figure 1.2. Diagram of deformation and thermally-activated recovery cycle in a SMA ............................... 8 Figure 1.3. Noise-reducing chevrons on a jet engine ................................................................................. 10 Figure 1.4. Ultrasonic soldering tip ............................................................................................................. 12 Figure 2.1. Torsion testing machine ............................................................................................................ 15 Figure 2.2. Moment arm mounted to main shaft ....................................................................................... 16 Figure 2.3. Torque measuring cell ............................................................................................................... 17 Figure 2.4. Block diagram of data filter ....................................................................................................... 18 Figure 2.5. Simulation of filter response to ramp input ............................................................................. 18 Figure 2.6. Angle-measuring potentiometer .............................................................................................. 19 Figure 2.7. Angular encoder ........................................................................................................................ 20 Figure 2.8. Effect of smoothing script on angle data .................................................................................. 21 Figure 2.9. Potentiometer compared to encoder for angle measurement ................................................ 21 Figure 2.10. Base and main shaft anchor .................................................................................................... 22 Figure 2.11. Motor mounted on torsion machine ...................................................................................... 23 Figure 2.12. First iteration of specimen clamps .......................................................................................... 24 Figure 2.13. Friction test between steel collar and NiTi rod ....................................................................... 25 Figure 2.14. Detail of friction test ............................................................................................................... 26 Figure 2.15. First four-screw clamp ............................................................................................................ 27 Figure 2.16. First four-screw grip and current specimen grip .................................................................... 28 Figure 2.17. Future specimen clamp design ............................................................................................... 29 Figure 3.1. Static calibration data ............................................................................................................... 30 Figure 3.2. Aluminum failure specimen ...................................................................................................... 32 Figure 3.3. USS torsional specimen ............................................................................................................. 33 Figure 3.4. Soldering holder ........................................................................................................................ 34 Figure 3.5. USS torsion specimen ............................................................................................................... 35 Figure 3.6. Torque vs. angle for USS specimen #1 ...................................................................................... 36 Figure 3.7. Torque vs. angle data with angle of recovery ........................................................................... 37 Figure 4.1. Laser weld of 304 stainless steel to NiTi ................................................................................... 39 Figure 4.2. First proposed design for thermal chamber ............................................................................. 41 Figure 4.3. Diagram of heating coil test and steady-state temperature distribution ................................. 42 Figure 4.4. Current thermal chamber design .............................................................................................. 43 Figure 4.5. Finite element model and steady-state temperature distribution ........................................... 45 Figure 4.6. Temperature distribution in specimen over time ..................................................................... 46 List of Tables Table 1.1. Interlayers used to weld titanium to dissimilar metals .............................................................. 13 Table 2.1. Results of coefficient of friction test .......................................................................................... 26 Table 3.1. Results of USS torsion test ......................................................................................................... 36 Table 3.2. Strength results of USS torsion test ........................................................................................... 38

5
Acknowledgements
I would like to thank my advisor and mentor on this project Dr. Marcelo Dapino, and my project leader
Ryan Hahnlen. Their technical guidance and encouragement have been invaluable for my work. The
Ohio State College of Engineering and the Mechanical Engineering Department greatly contributed to
this project by providing facilities for this work, and by their generous scholarships for my education.
This research would also not be possible without the support of the Smart Vehicles Concept Center, and
in addition to their financial contributions, the Edison Welding Institute for allowing the use of their
welding and ultrasonic soldering machines, and Boeing for providing the NiTi material itself used in this
research. I would like to thank Dr. Dapino again and Dr. Gilat for serving on my defense committee and
reviewing this document.
6
Abstract
This thesis describes the design and ongoing construction of a torsional testing machine for shape
memory alloy tubes and joints between these tubes and common structural materials. This machine is
capable of finding the strength and stiffness of specimens, and in the future will be able to find how
their properties vary with temperature. Actuators using shape memory alloys have the potential to be
far smaller and lighter than actuators based on electric motors and hydraulic pumps. However, it is
currently very difficult to incorporate shape memory alloys into such mechanisms due to their poor
machinability. Hence, methods such as ultrasonic soldering and laser welding to join these to common
materials such as steel and aluminum are being investigated. Ultrasonic soldering between nickel-
titanium and aluminum was found to produce consistent joints with a shear strength of 5.3 ksi (37 MPa),
which is strong enough to begin detwinning the material.
7
1 Introduction
1.1 Properties of Shape Memory Alloys
Shape Memory Alloys (SMAs) have the property of being able to “remember” a past shape and return to
it upon heating. If an SMA is deformed at cool temperatures it will remain in that deformed state when
the deforming load is removed. Then, when it is heated above a certain temperature, which is
determined by the alloy, it will return to its original, “remembered” shape.
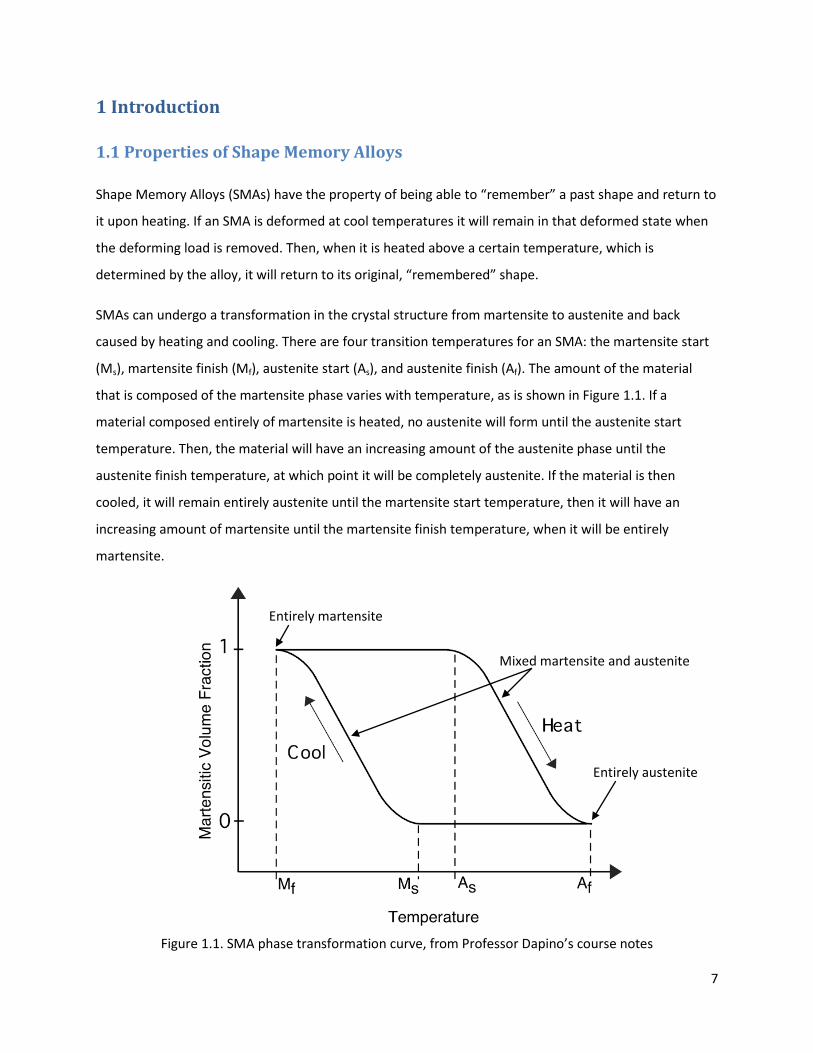
SMAs can undergo a transformation in the crystal structure from martensite to austenite and back
caused by heating and cooling. There are four transition temperatures for an SMA: the martensite start
(Ms), martensite finish (Mf), austenite start (As), and austenite finish (Af). The amount of the material
that is composed of the martensite phase varies with temperature, as is shown in Figure 1.1. If a
material composed entirely of martensite is heated, no austenite will form until the austenite start
temperature. Then, the material will have an increasing amount of the austenite phase until the
austenite finish temperature, at which point it will be completely austenite. If the material is then
cooled, it will remain entirely austenite until the martensite start temperature, then it will have an
increasing amount of martensite until the martensite finish temperature, when it will be entirely
martensite.
Figure 1.1. SMA phase transformation curve, from Professor Dapino’s course notes
Entirely martensite
Mixed martensite and austenite
Entirely austenite
8
An SMA is considered “superelastic” if its transition temperatures are below its normal operating
temperature. These alloys recover their deformation immediately. Such a material has an elastic
deformation region much larger than traditional materials, though it is highly non-linear. If the transition
temperatures are above the operating temperature, the material will remain in its deformed state until
heated. Recoverable strains of 8% are possible with nickel-titanium (NiTi), compared with a maximum
elastic strain of about 0.8% for aluminum and steel alloys. Because of this large recoverable strain, NiTi
has been the focus of this research.
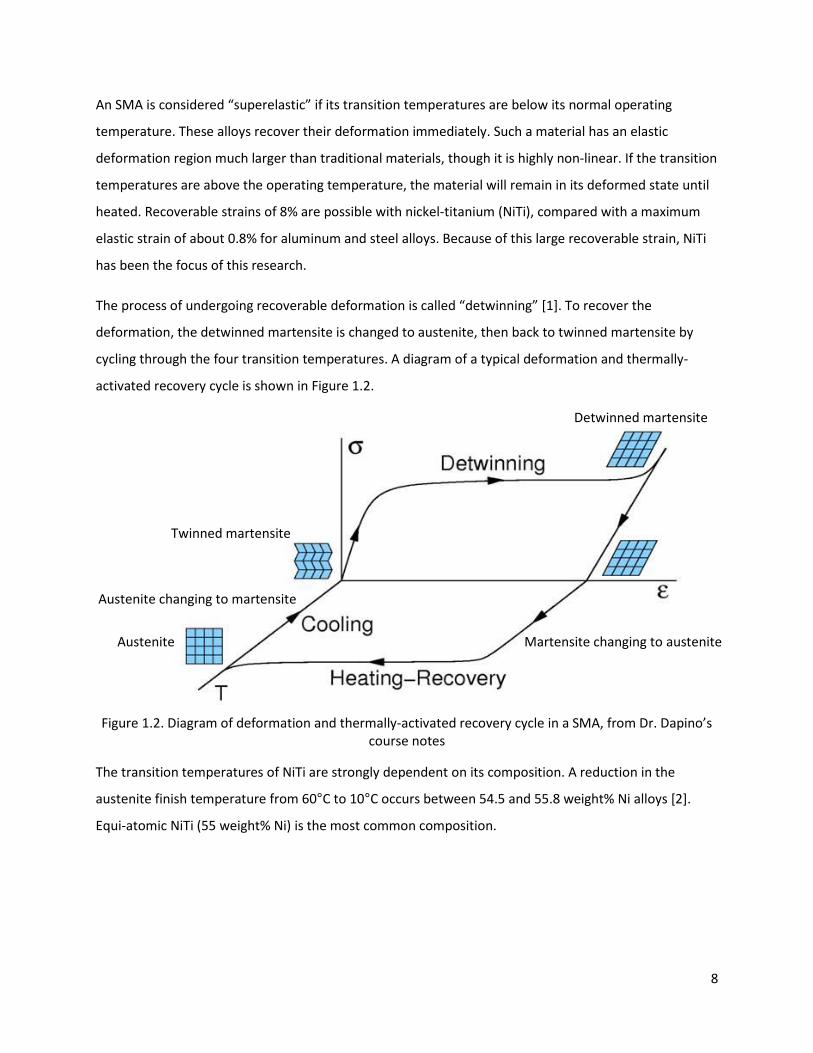
The process of undergoing recoverable deformation is called “detwinning” [1]. To recover the
deformation, the detwinned martensite is changed to austenite, then back to twinned martensite by
cycling through the four transition temperatures. A diagram of a typical deformation and thermally-
activated recovery cycle is shown in Figure 1.2.
Figure 1.2. Diagram of deformation and thermally-activated recovery cycle in a SMA, from Dr. Dapino’s course notes
The transition temperatures of NiTi are strongly dependent on its composition. A reduction in the
austenite finish temperature from 60°C to 10°C occurs between 54.5 and 55.8 weight% Ni alloys [2].
Equi-atomic NiTi (55 weight% Ni) is the most common composition.
Twinned martensite
Martensite changing to austenite
Detwinned martensite
Austenite
Austenite changing to martensite
9
1.2 History of Shape Memory Alloys
The first observed shape memory alloy was AuCd in 1932 [3]. In the 1960’s, more useful SMAs such as
NiTi, CuZnAl and CuAlNi were created. The usefulness of an SMA is due to its ability to either generate a
significant stress or strain upon recovery [1]. This stress and strain can be used to produce useful work.
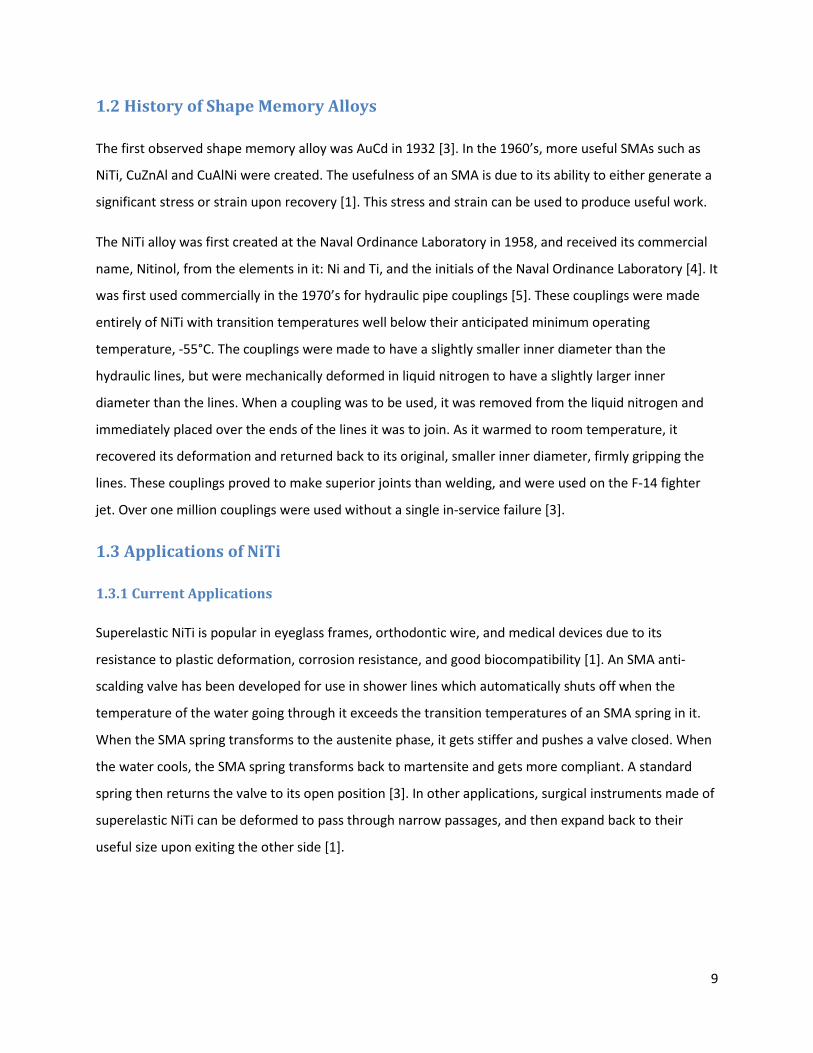
The NiTi alloy was first created at the Naval Ordinance Laboratory in 1958, and received its commercial
name, Nitinol, from the elements in it: Ni and Ti, and the initials of the Naval Ordinance Laboratory [4]. It
was first used commercially in the 1970’s for hydraulic pipe couplings [5]. These couplings were made
entirely of NiTi with transition temperatures well below their anticipated minimum operating
temperature, -55°C. The couplings were made to have a slightly smaller inner diameter than the
hydraulic lines, but were mechanically deformed in liquid nitrogen to have a slightly larger inner
diameter than the lines. When a coupling was to be used, it was removed from the liquid nitrogen and
immediately placed over the ends of the lines it was to join. As it warmed to room temperature, it
recovered its deformation and returned back to its original, smaller inner diameter, firmly gripping the
lines. These couplings proved to make superior joints than welding, and were used on the F-14 fighter
jet. Over one million couplings were used without a single in-service failure [3].
1.3 Applications of NiTi
1.3.1 Current Applications
Superelastic NiTi is popular in eyeglass frames, orthodontic wire, and medical devices due to its
resistance to plastic deformation, corrosion resistance, and good biocompatibility [1]. An SMA anti-
scalding valve has been developed for use in shower lines which automatically shuts off when the
temperature of the water going through it exceeds the transition temperatures of an SMA spring in it.
When the SMA spring transforms to the austenite phase, it gets stiffer and pushes a valve closed. When
the water cools, the SMA spring transforms back to martensite and gets more compliant. A standard
spring then returns the valve to its open position [3]. In other applications, surgical instruments made of
superelastic NiTi can be deformed to pass through narrow passages, and then expand back to their
useful size upon exiting the other side [1].
10
1.3.2 Potential Future Applications
An actuator powered by NiTi could have a much higher power-to-weight and power-to-size ratio than
one powered by an electric motor or hydraulic pump. Because of this, NiTi actuators have great promise
in aerospace and automotive applications. One proposed design is for NiTi tubes to be mounted inside
helicopter blades to deform them to different geometries depending on whether the helicopter is
hovering or cruising. This could increase their hovering payload and cruise range by 10-20% [6].
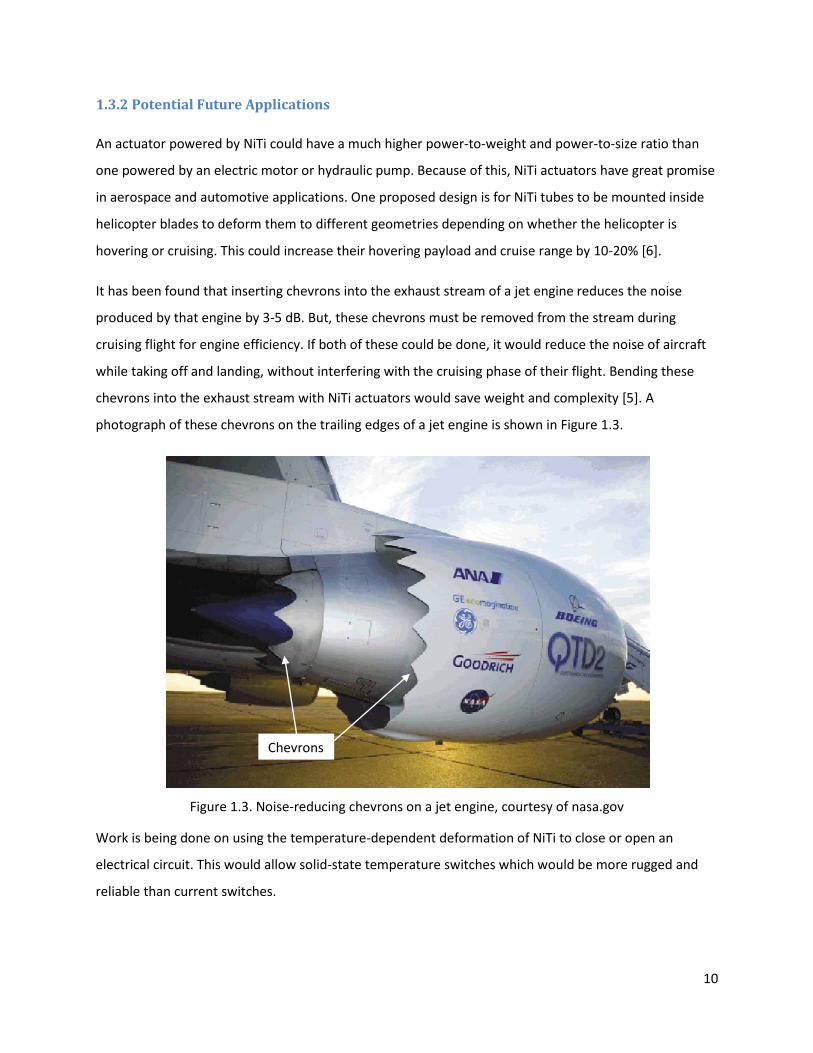
It has been found that inserting chevrons into the exhaust stream of a jet engine reduces the noise
produced by that engine by 3-5 dB. But, these chevrons must be removed from the stream during
cruising flight for engine efficiency. If both of these could be done, it would reduce the noise of aircraft
while taking off and landing, without interfering with the cruising phase of their flight. Bending these
chevrons into the exhaust stream with NiTi actuators would save weight and complexity [5]. A
photograph of these chevrons on the trailing edges of a jet engine is shown in Figure 1.3.
Figure 1.3. Noise-reducing chevrons on a jet engine, courtesy of nasa.gov
Work is being done on using the temperature-dependent deformation of NiTi to close or open an
electrical circuit. This would allow solid-state temperature switches which would be more rugged and
reliable than current switches.
Chevrons
11
1.4 Difficulties in Realizing Applications of NiTi
In order to be used in many applications, NiTi has to be incorporated into mechanisms made of common
engineering materials such as aluminum and ferrous alloys. There is currently no strong, inexpensive
and straightforward way to do this.
1.4.1 Machining NiTi
Machining NiTi is very difficult because the alloy rapidly work hardens. Grinding, drilling and turning can
be used to create parts with excellent tolerances and surface finishes if specific tooling and speeds are
used, but milling has been much more difficult [7]. Altering the geometry of the samples used in this
study was done by electro-discharge machining (EDM), which is time-consuming and expensive. It is
generally not practical to use mechanical joining methods with NiTi, thus joining processes which require
no geometric altering of the NiTi are being investigated.
1.4.2 Adhesive Bonding
Adhesive joints between NiTi and other materials have been successfully made. They are common in
medical, electronic, and disposable devices, but lack the strength or durability to be useful in actuators.
The strength of the joints is typically limited to a few thousand psi, and they degrade with time [8].
1.4.3 Soldering
Soldering NiTi has been successfully conducted using several different techniques. Any soldering
technique must deal with the surface oxides on NiTi which prevent the solder from wetting the surface.
An aggressive, halogenated flux may be used to break up the oxide coating, then conventional soldering
equipment and alloys used. Alternately, NiTi may be coated in a more readily solderable metal such as
Ni, Cu, or Au, and then soldered to another piece. The surface oxide layer may also be broken up using
an ultrasonically vibrating soldering tip [8]. This is the process that has been investigated in this
research.
The use of halogenated fluxes is restricted due to a patent, and has not been pursued further. Coating
NiTi in a solderable metal is itself difficult, so it does not reduce the difficulty of joining NiTi. Ultrasonic
soldering (USS) is promising because it requires no chemical flux, and is a very simple process [8].
Ultrasonic soldering works by heating the pieces to be soldered to a temperature just above the solder
melting temperature. Unlike brazing and welding, this is not hot enough to degrade the shape memory
12
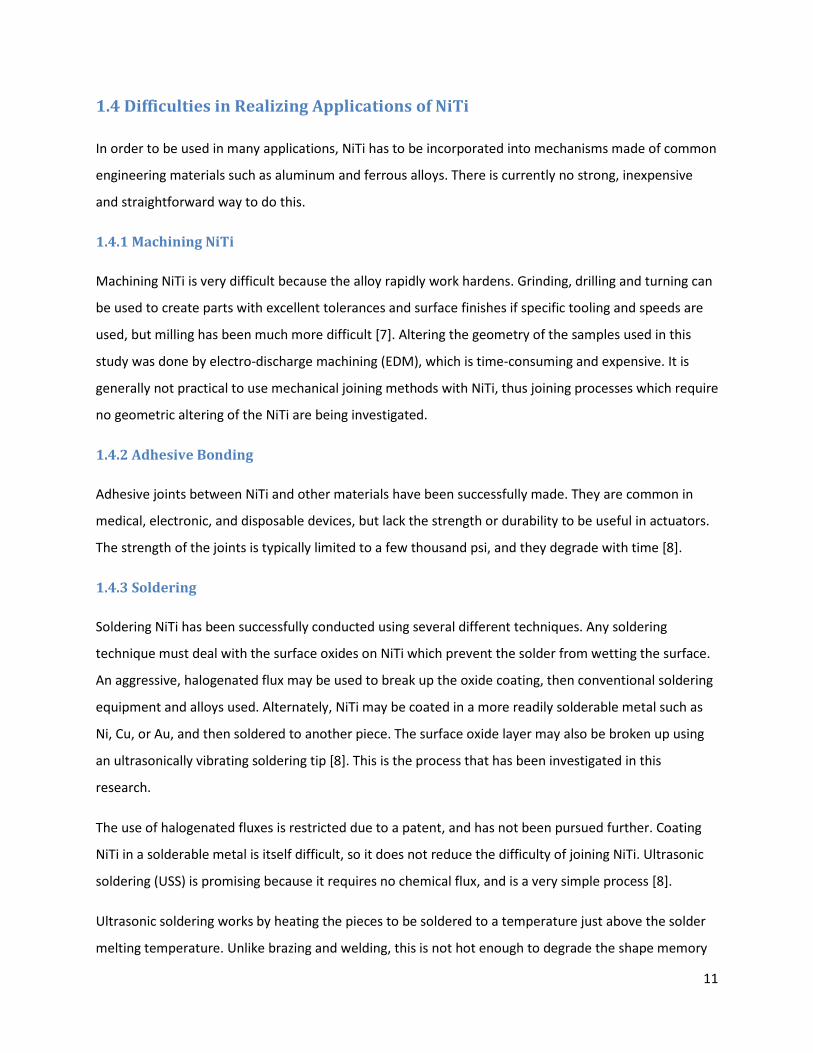
or superelastic properties of the NiTi. Solder is melted on the surfaces to be joined, but due to the oxide
layers, the solder balls up instead of wetting the surfaces. The soldering tip is then inserted into the
liquid solder and vibrated at ultrasonic frequencies. This causes cavitations in the solder which implode,
and the resulting pressure waves impinge on the oxide layer and break it up. This is illustrated in
Figure 1.4. When the oxide layer is broken up, the solder wets the surfaces beneath. The wetted
surfaces are then brought into contact in the final desired geometry and cooled.
Figure 1.4. Ultrasonic soldering tip, courtesy of Edison Welding Institute
1.4.4 Brazing
Brazing has been found to produce strong, reliable joints, but the heat involved degrades the usefulness
of the NiTi. Tenacious oxide coatings form on the surface of NiTi, so brazing must be conducted in a
vacuum or reducing gas furnace. This requires heating the entire piece being brazed, not just the joint
area, destroying the properties of the NiTi [8].
1.4.5 Welding
There has been much research in welding NiTi both to itself, and dissimilar metals such as aluminum and
ferrous alloys. Successful processes have been gas tungsten arc, electron beam, laser (particularly with
Nd:YAG lasers), electric resistance and friction welding [8].
Welding NiTi to itself can be accomplished fairly easily as long as a shielding gas is used to prevent
oxygen contamination of the weld pool, and the base metals are relatively pure [8]. There still may be
solidification cracking and degradation of the material caused by the heat, but that can be dealt with by
Work piece
Soldering tip Solder
Oxide layer
Cavitations
13
localizing the heated area and carefully cooling the weld [4]. Thus, processes which localize their heating
in a small area are preferable, such as laser welding.
Welding NiTi to ferrous alloys has proved much more difficult than to itself. If the titanium and iron are
permitted to mix in the weld pool, the brittle intermetallics TiFe and TiFe2 form, which cause cracking of
the weld during cooling. Welds are either very weak when cooled, or don’t survive the cooling process
at all. Separating the NiTi and ferrous alloy with a nickel filler has produced successful welds [1, 9]. Other
filler materials such as vanadium have been successful for welding titanium to ferrous alloys, and thus
are likely to work well for NiTi and ferrous alloys [10].
Welding NiTi to titanium alloys would be useful in many applications, particularly aerospace. Titanium
alloys have a higher strength-to-weight ratio and better fatigue characteristics than aluminum alloys,
and are widely used in modern aircraft. No written resources were found indicating that welding NiTi to
titanium alloys has been attempted, but information on good interlayers for welding each material was
found. It is unlikely that NiTi would weld well directly to Ti alloys because titanium rich NiTi does not
weld well to itself. The abundance of Ti in the weld pool causes solidification cracking and grain
boundary weakening [8]. The weld pool between NiTi and Ti would have such an abundance of Ti.
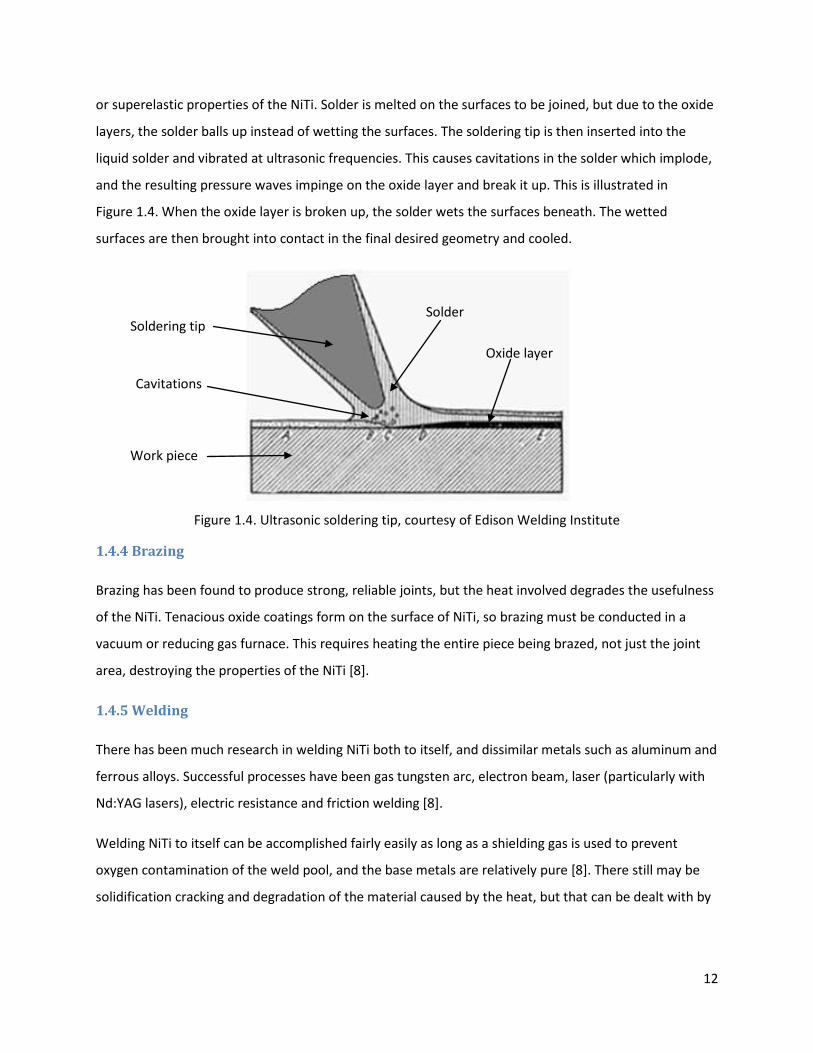
Welding pure titanium to dissimilar metals has been accomplished using several different interlayers.
The desirability of using these interlayers for welds, which is based on their physical, chemical and
mechanical properties, is tabulated in Table 1.1 [4]. This information is qualitatively confirmed in other
sources as well [11].
V Nb Ta Cr Mo
Normalized desirability for welding to titanium 0.147 0.300 0.278 0.137 0.228
Tensile Strength (psi) 116,000 87,000 131,000 59,900 47,000
Table 1.1. Interlayers used to weld titanium to dissimilar metals
Some of these materials such as V and Ta have proven to be good interlayers for welding NiTi [4], so
they are promising for welding NiTi to titanium alloys. Vanadium has the added advantage of already
being in the most common alloy of titanium. Grade 5, or “aircraft-grade” titanium contains 4%
vanadium.

14
It was decided to focus the current study on welding NiTi to stainless steel with a Ni interlayer, but this
preliminary literature review seems promising that it is possible to weld NiTi to titanium alloys. This may
merit further study in the future.
1.5 Objectives of Research
The goal of this research project is to build a torsional testing machine and use it to test joints between
nickel-titanium and structural materials. The material NiTi is also to be characterized at elevated
temperatures.
This research project spanned the past year, which is described in this document, but will also continue
through the author’s master’s program as well. Most of the capabilities needed from the torsional
testing machine are complete, but some, such as thermal testing, are not yet complete. More test on
laser welding of NiTi, and thermomechanical characterization of NiTi are forthcoming.
15
2 Design and Construction of Torsion Testing Machine
2.1 Specifications
In order to evaluate the strength of soldered and welded joints, a torsion testing machine was
constructed which can do the following things:
1. Apply up to 500 in-lb of torque to a specimen
2. Accurately measure the torque applied
3. Accurately measure the angular deflection of the specimen
2.2 Basic Design of Machine
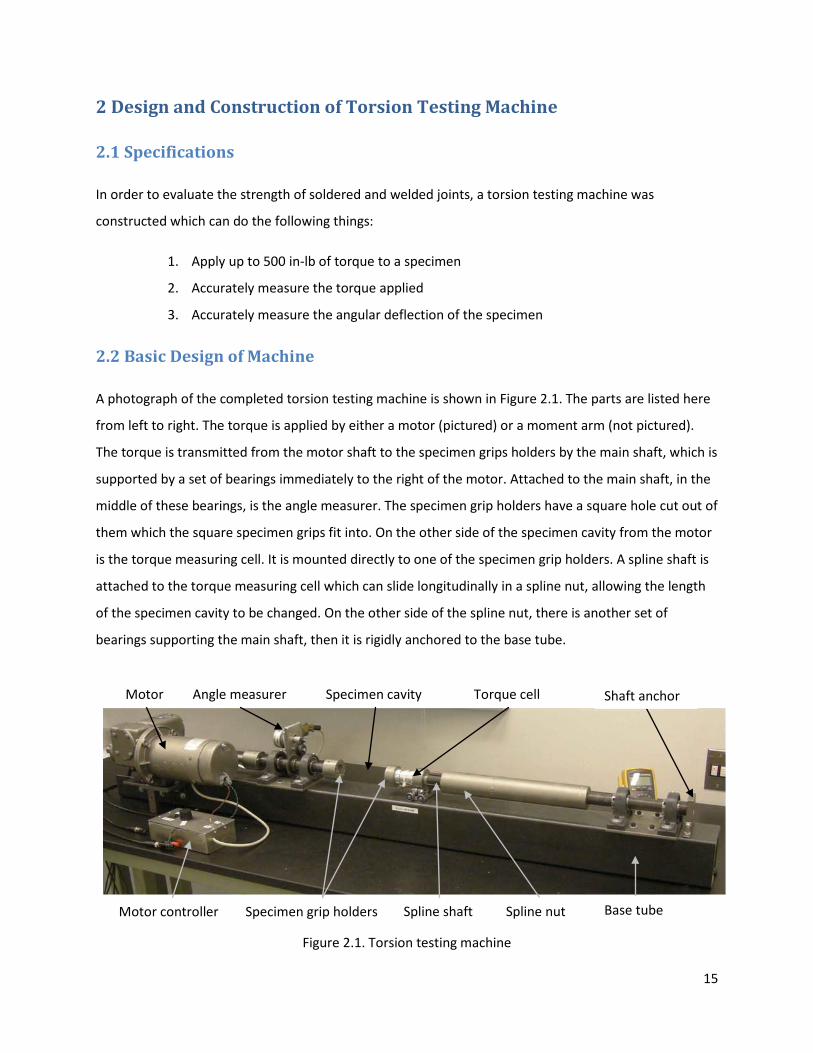
A photograph of the completed torsion testing machine is shown in Figure 2.1. The parts are listed here
from left to right. The torque is applied by either a motor (pictured) or a moment arm (not pictured).
The torque is transmitted from the motor shaft to the specimen grips holders by the main shaft, which is
supported by a set of bearings immediately to the right of the motor. Attached to the main shaft, in the
middle of these bearings, is the angle measurer. The specimen grip holders have a square hole cut out of
them which the square specimen grips fit into. On the other side of the specimen cavity from the motor
is the torque measuring cell. It is mounted directly to one of the specimen grip holders. A spline shaft is
attached to the torque measuring cell which can slide longitudinally in a spline nut, allowing the length
of the specimen cavity to be changed. On the other side of the spline nut, there is another set of
bearings supporting the main shaft, then it is rigidly anchored to the base tube.
Figure 2.1. Torsion testing machine
Angle measurer Specimen cavity Torque cell
Specimen grip holders Motor controller Spline shaft Main Shaft
Shaft anchor
Spline nut Base tube
Motor
16
2.3 Torque Application
2.3.1 Motor
To apply the torque to a specimen a pre-assembled motor and gearbox unit was purchased which is able
to apply up to 800 in-lb of torque on the shaft coming from the gear box, and runs on up to 90 V DC
power. A motor controller was also purchased, which takes in 120 V AC power and transforms it to DC
power of a voltage that is specified by the user. The speed of the motor is controlled by a potentiometer
on the motor controller. A relationship between motor speed and the potentiometer’s setting has been
determined from several tests, allowing open loop control of the motor speed by the potentiometer.
2.3.2 Moment Arm
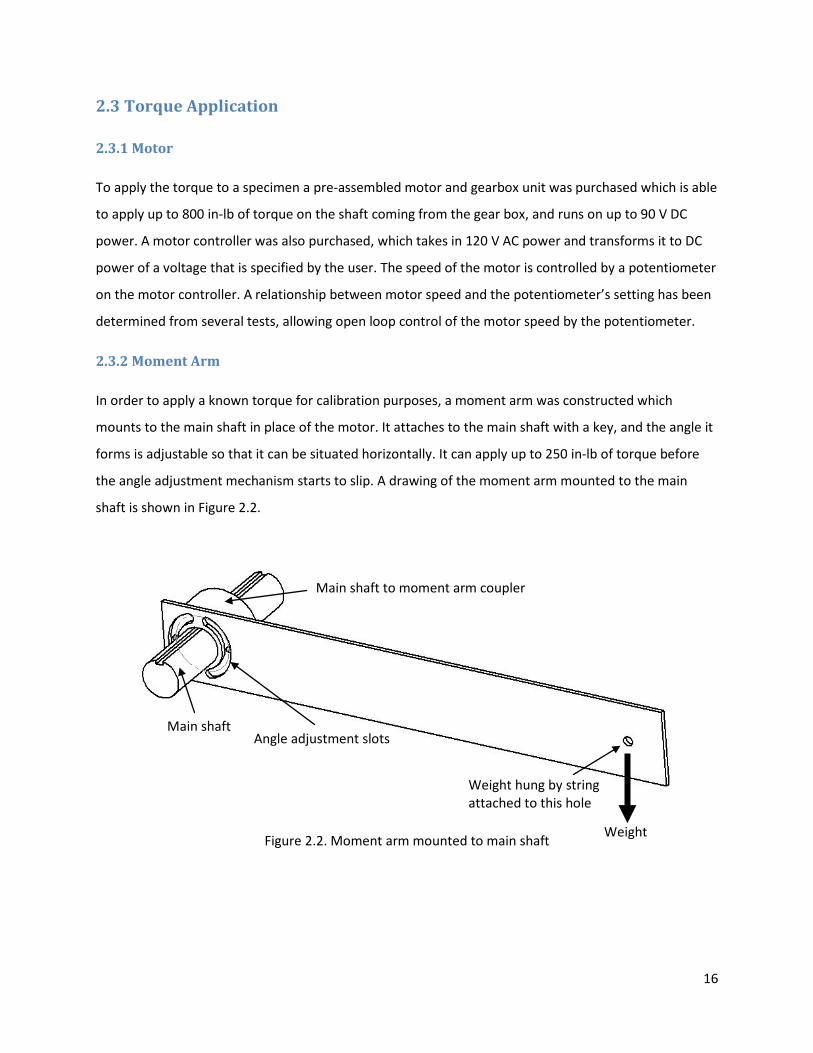
In order to apply a known torque for calibration purposes, a moment arm was constructed which
mounts to the main shaft in place of the motor. It attaches to the main shaft with a key, and the angle it
forms is adjustable so that it can be situated horizontally. It can apply up to 250 in-lb of torque before
the angle adjustment mechanism starts to slip. A drawing of the moment arm mounted to the main
shaft is shown in Figure 2.2.
Figure 2.2. Moment arm mounted to main shaft
Angle adjustment slots
Weight hung by string attached to this hole
Main shaft to moment arm coupler
Main shaft
Weight
17
2.4 Torque Measurement
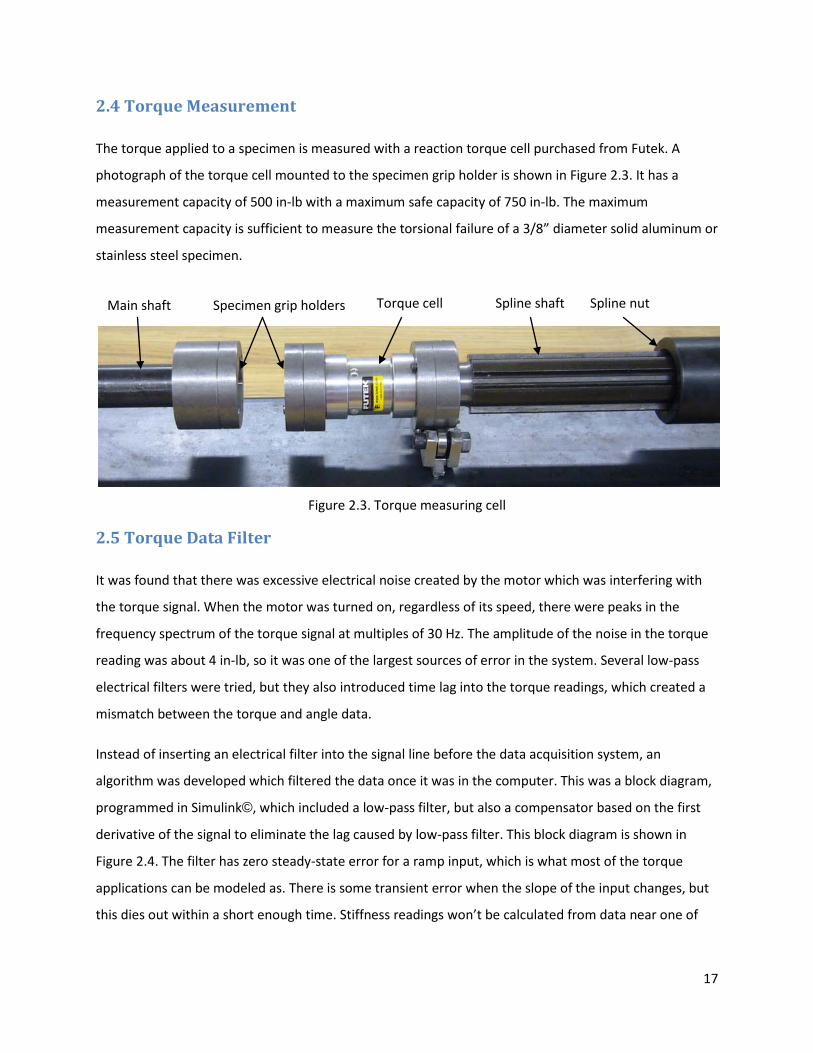
The torque applied to a specimen is measured with a reaction torque cell purchased from Futek. A
photograph of the torque cell mounted to the specimen grip holder is shown in Figure 2.3. It has a
measurement capacity of 500 in-lb with a maximum safe capacity of 750 in-lb. The maximum
measurement capacity is sufficient to measure the torsional failure of a 3/8” diameter solid aluminum or
stainless steel specimen.
Figure 2.3. Torque measuring cell
2.5 Torque Data Filter
It was found that there was excessive electrical noise created by the motor which was interfering with
the torque signal. When the motor was turned on, regardless of its speed, there were peaks in the
frequency spectrum of the torque signal at multiples of 30 Hz. The amplitude of the noise in the torque
reading was about 4 in-lb, so it was one of the largest sources of error in the system. Several low-pass
electrical filters were tried, but they also introduced time lag into the torque readings, which created a
mismatch between the torque and angle data.
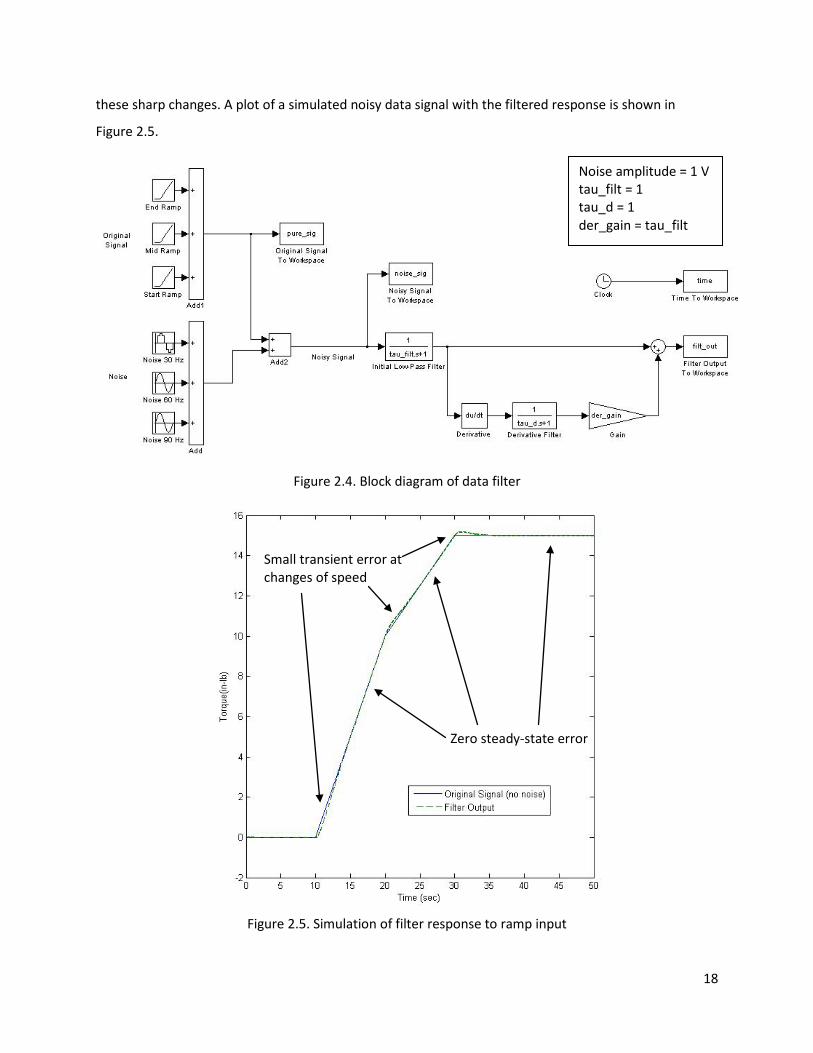
Instead of inserting an electrical filter into the signal line before the data acquisition system, an
algorithm was developed which filtered the data once it was in the computer. This was a block diagram,
programmed in Simulink©, which included a low-pass filter, but also a compensator based on the first
derivative of the signal to eliminate the lag caused by low-pass filter. This block diagram is shown in
Figure 2.4. The filter has zero steady-state error for a ramp input, which is what most of the torque
applications can be modeled as. There is some transient error when the slope of the input changes, but
this dies out within a short enough time. Stiffness readings won’t be calculated from data near one of
Main shaft Specimen grip holders Torque cell Spline shaft Spline nut
18
these sharp changes. A plot of a simulated noisy data signal with the filtered response is shown in
Figure 2.5.
Figure 2.4. Block diagram of data filter
Figure 2.5. Simulation of filter response to ramp input
Zero steady-state error
Small transient error at changes of speed
Noise amplitude = 1 V tau_filt = 1 tau_d = 1 der_gain = tau_filt
19
2.6 Angle Measurement
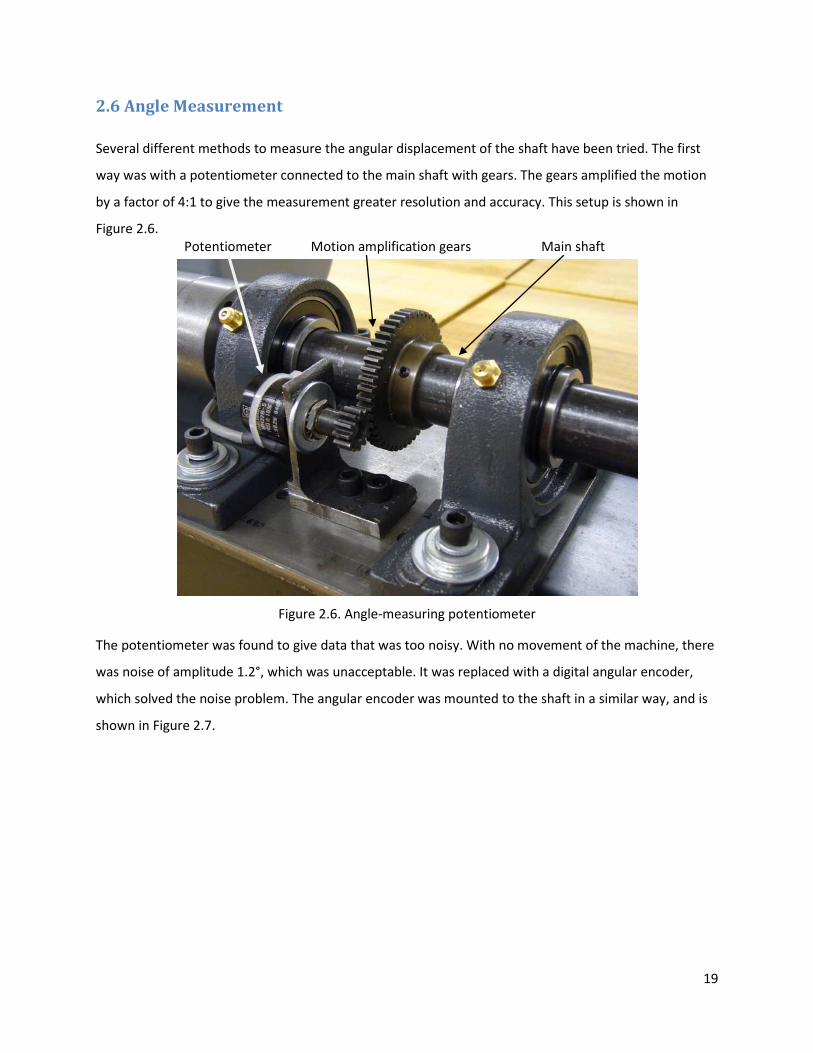
Several different methods to measure the angular displacement of the shaft have been tried. The first
way was with a potentiometer connected to the main shaft with gears. The gears amplified the motion
by a factor of 4:1 to give the measurement greater resolution and accuracy. This setup is shown in
Figure 2.6.
Figure 2.6. Angle-measuring potentiometer
The potentiometer was found to give data that was too noisy. With no movement of the machine, there
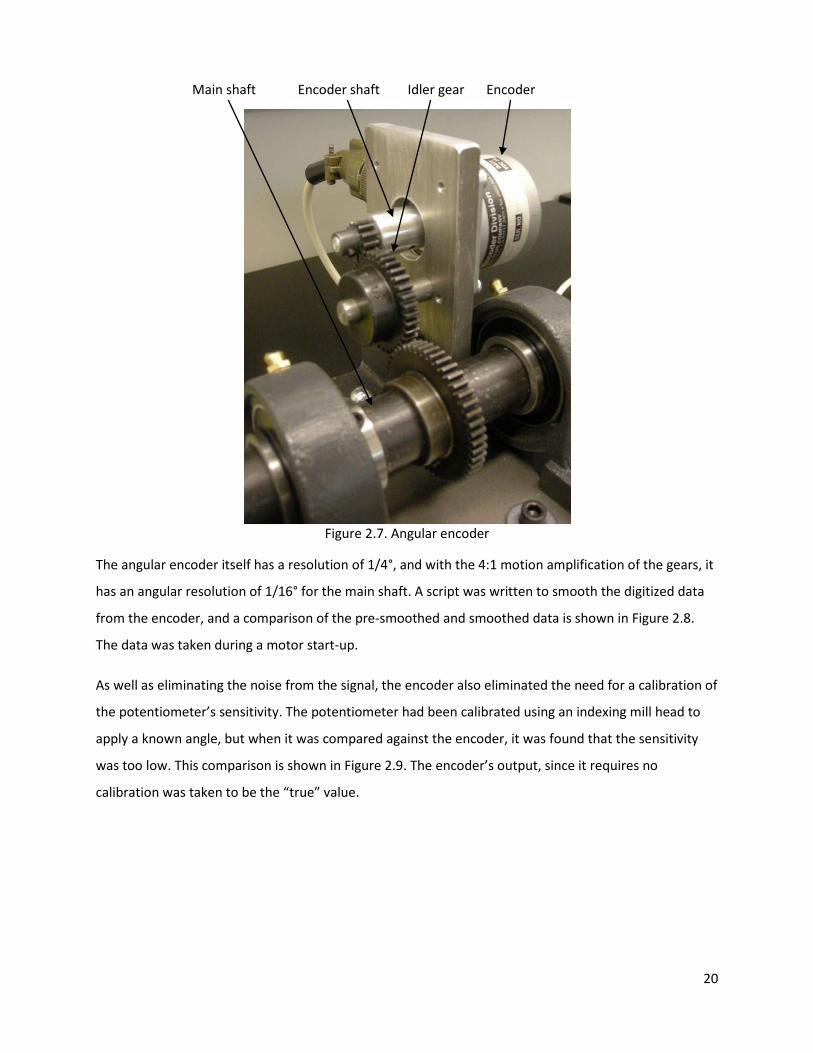
was noise of amplitude 1.2°, which was unacceptable. It was replaced with a digital angular encoder,
which solved the noise problem. The angular encoder was mounted to the shaft in a similar way, and is
shown in Figure 2.7.
Main shaft Potentiometer Motion amplification gears
20
Figure 2.7. Angular encoder
The angular encoder itself has a resolution of 1/4°, and with the 4:1 motion amplification of the gears, it
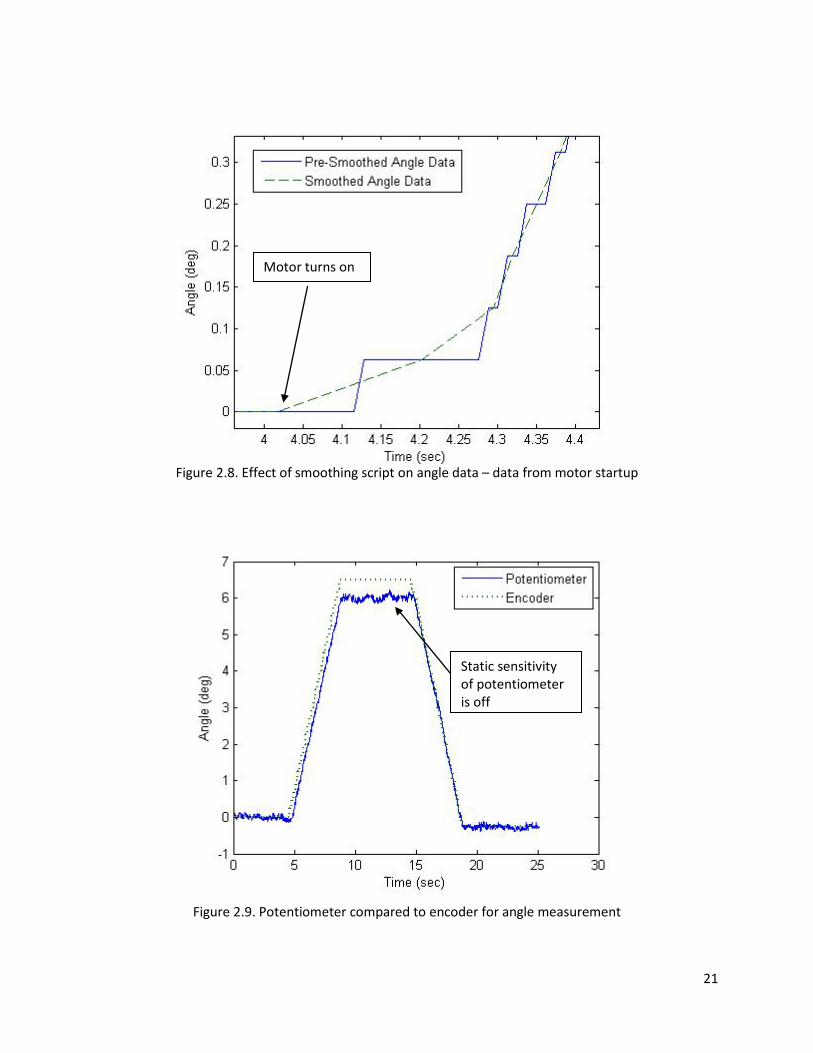
has an angular resolution of 1/16° for the main shaft. A script was written to smooth the digitized data
from the encoder, and a comparison of the pre-smoothed and smoothed data is shown in Figure 2.8.
The data was taken during a motor start-up.
As well as eliminating the noise from the signal, the encoder also eliminated the need for a calibration of
the potentiometer’s sensitivity. The potentiometer had been calibrated using an indexing mill head to
apply a known angle, but when it was compared against the encoder, it was found that the sensitivity
was too low. This comparison is shown in Figure 2.9. The encoder’s output, since it requires no
calibration was taken to be the “true” value.
Encoder Main shaft Idler gear Encoder shaft
21
Figure 2.8. Effect of smoothing script on angle data – data from motor startup
Figure 2.9. Potentiometer compared to encoder for angle measurement
Static sensitivity of potentiometer is off
Motor turns on
22
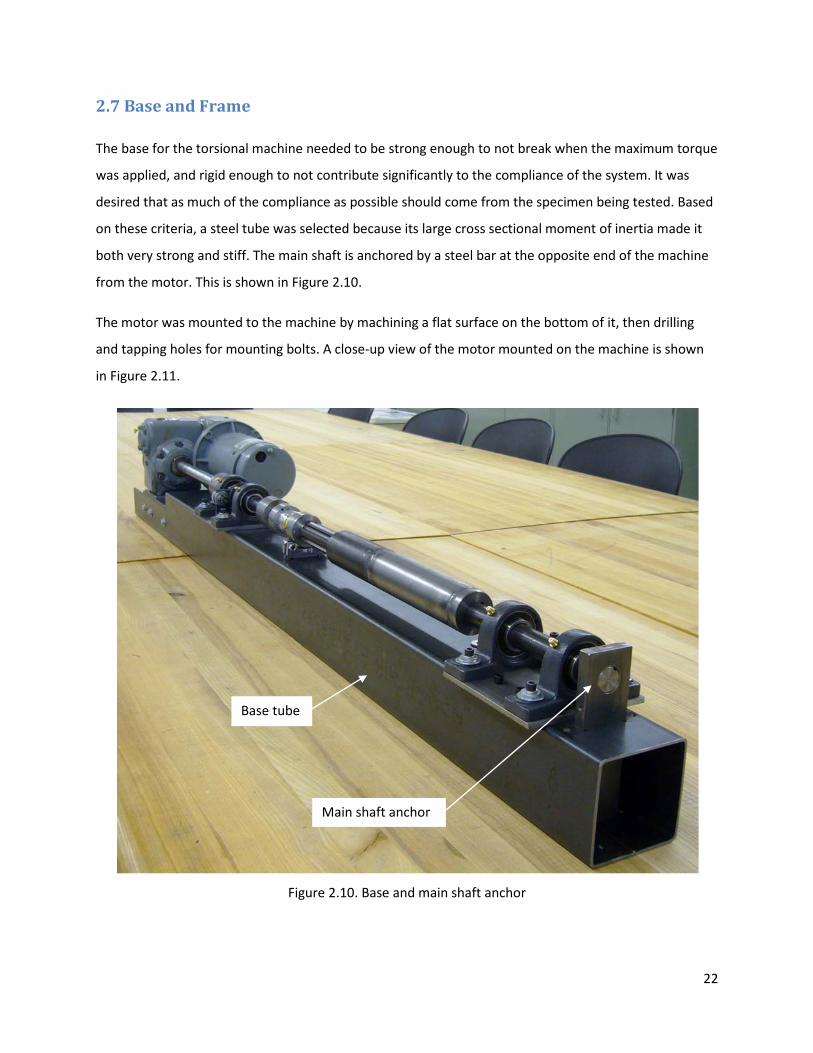
2.7 Base and Frame
The base for the torsional machine needed to be strong enough to not break when the maximum torque
was applied, and rigid enough to not contribute significantly to the compliance of the system. It was
desired that as much of the compliance as possible should come from the specimen being tested. Based
on these criteria, a steel tube was selected because its large cross sectional moment of inertia made it
both very strong and stiff. The main shaft is anchored by a steel bar at the opposite end of the machine
from the motor. This is shown in Figure 2.10.
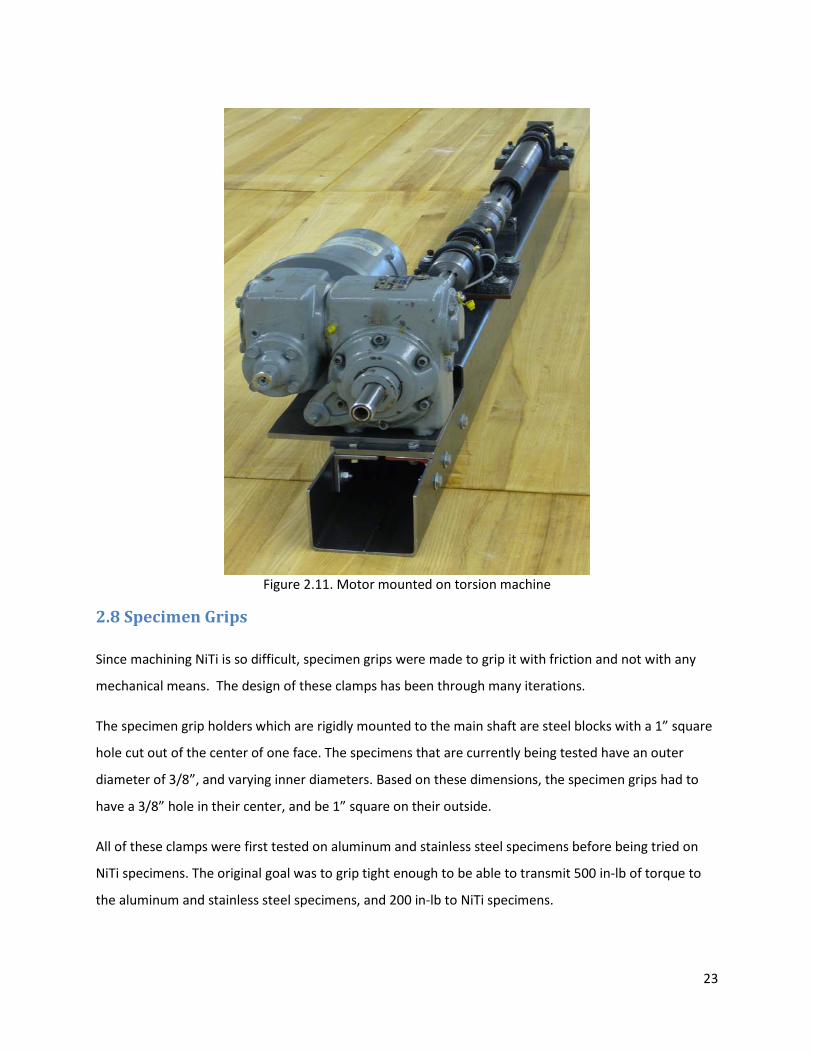
The motor was mounted to the machine by machining a flat surface on the bottom of it, then drilling
and tapping holes for mounting bolts. A close-up view of the motor mounted on the machine is shown
in Figure 2.11.
Figure 2.10. Base and main shaft anchor
Base tube
Main shaft anchor
23
Figure 2.11. Motor mounted on torsion machine
2.8 Specimen Grips
Since machining NiTi is so difficult, specimen grips were made to grip it with friction and not with any
mechanical means. The design of these clamps has been through many iterations.
The specimen grip holders which are rigidly mounted to the main shaft are steel blocks with a 1” square
hole cut out of the center of one face. The specimens that are currently being tested have an outer
diameter of 3/8”, and varying inner diameters. Based on these dimensions, the specimen grips had to
have a 3/8” hole in their center, and be 1” square on their outside.
All of these clamps were first tested on aluminum and stainless steel specimens before being tried on
NiTi specimens. The original goal was to grip tight enough to be able to transmit 500 in-lb of torque to
the aluminum and stainless steel specimens, and 200 in-lb to NiTi specimens.
24
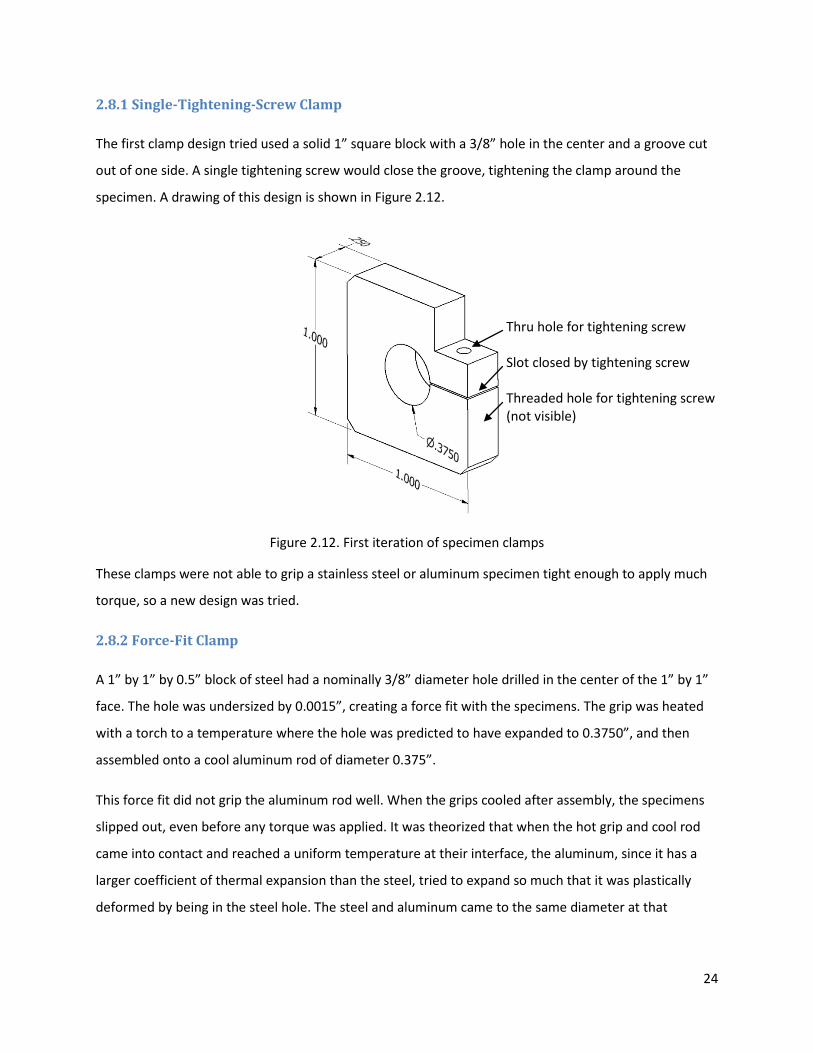
2.8.1 Single-Tightening-Screw Clamp
The first clamp design tried used a solid 1” square block with a 3/8” hole in the center and a groove cut
out of one side. A single tightening screw would close the groove, tightening the clamp around the
specimen. A drawing of this design is shown in Figure 2.12.
Figure 2.12. First iteration of specimen clamps
These clamps were not able to grip a stainless steel or aluminum specimen tight enough to apply much
torque, so a new design was tried.
2.8.2 Force-Fit Clamp
A 1” by 1” by 0.5” block of steel had a nominally 3/8” diameter hole drilled in the center of the 1” by 1”
face. The hole was undersized by 0.0015”, creating a force fit with the specimens. The grip was heated
with a torch to a temperature where the hole was predicted to have expanded to 0.3750”, and then
assembled onto a cool aluminum rod of diameter 0.375”.
This force fit did not grip the aluminum rod well. When the grips cooled after assembly, the specimens
slipped out, even before any torque was applied. It was theorized that when the hot grip and cool rod
came into contact and reached a uniform temperature at their interface, the aluminum, since it has a
larger coefficient of thermal expansion than the steel, tried to expand so much that it was plastically
deformed by being in the steel hole. The steel and aluminum came to the same diameter at that
Thru hole for tightening screw Slot closed by tightening screw Threaded hole for tightening screw (not visible)
25
elevated temperature, but the aluminum shrunk more when it cooled, leaving no diametral
interference.
A new set of grips would have been required for every specimen. Since one set took a while to make,
this would have greatly increased the time required for testing. It was decided to re-investigate reusable
clamp-on friction grips.
2.8.3 Coefficient of Friction Test
The first clamp designs did not work because they didn’t apply enough normal force to the specimen to
create enough friction. The basic design of the grip was changed to be two halves, each with a half-
cylindrical hole along one side, which would clamp together on a specimen. To calculate how much
clamping force would be required to transmit the desired torque without slipping, the coefficient of
friction between the clamp and the different specimen needed to be known.
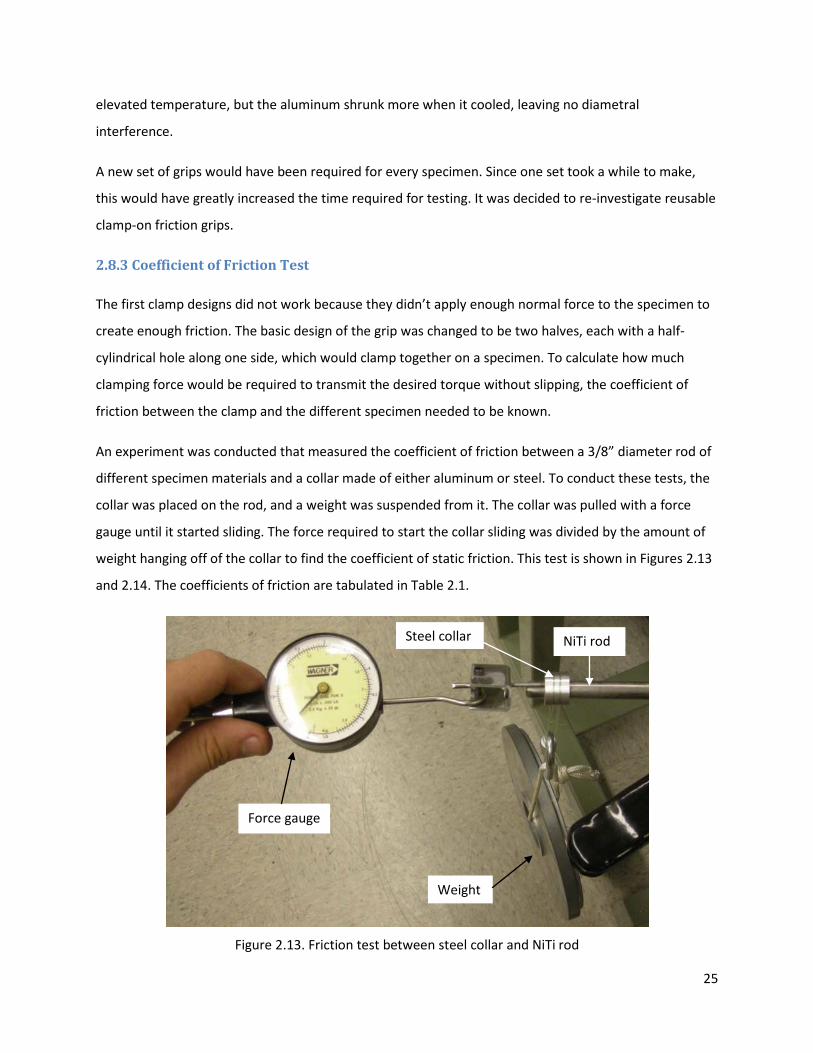
An experiment was conducted that measured the coefficient of friction between a 3/8” diameter rod of
different specimen materials and a collar made of either aluminum or steel. To conduct these tests, the
collar was placed on the rod, and a weight was suspended from it. The collar was pulled with a force
gauge until it started sliding. The force required to start the collar sliding was divided by the amount of
weight hanging off of the collar to find the coefficient of static friction. This test is shown in Figures 2.13
and 2.14. The coefficients of friction are tabulated in Table 2.1.
Figure 2.13. Friction test between steel collar and NiTi rod
Force gauge
NiTi rod Steel collar
Weight
26
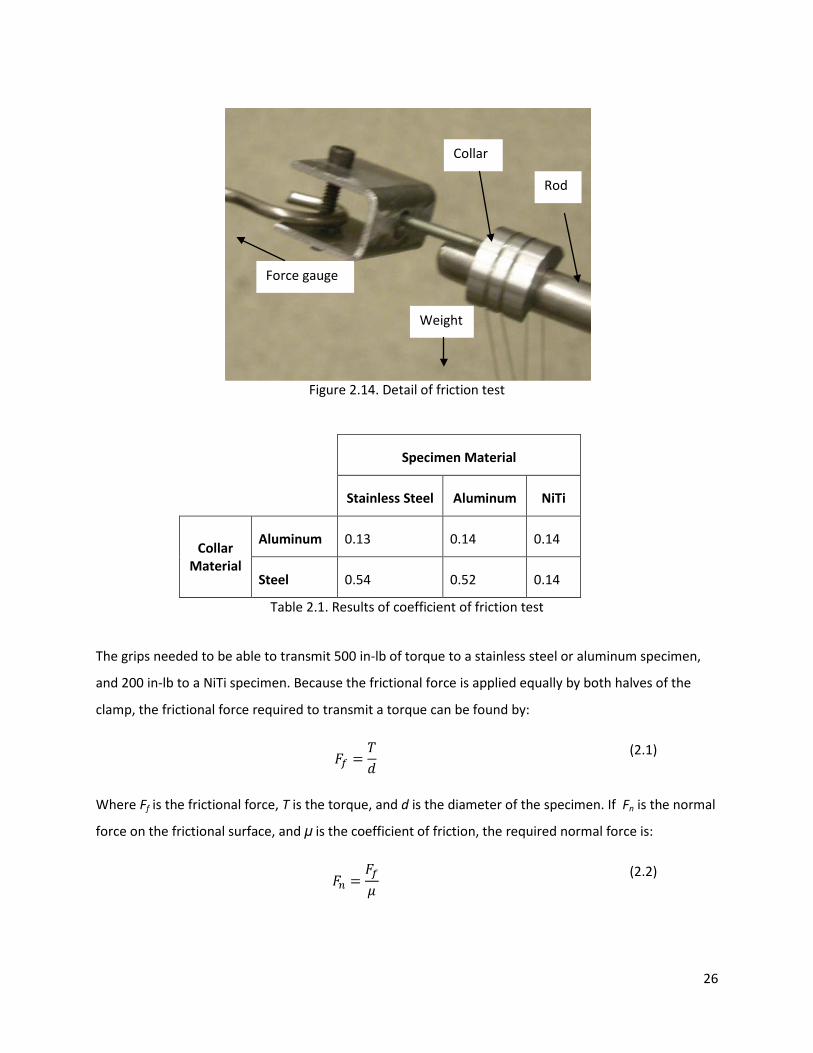
Figure 2.14. Detail of friction test
Specimen Material
Stainless Steel Aluminum NiTi
Collar Material
Aluminum 0.13 0.14 0.14
Steel 0.54 0.52 0.14
Table 2.1. Results of coefficient of friction test
The grips needed to be able to transmit 500 in-lb of torque to a stainless steel or aluminum specimen,
and 200 in-lb to a NiTi specimen. Because the frictional force is applied equally by both halves of the
clamp, the frictional force required to transmit a torque can be found by:
(2.1)
Where Ff is the frictional force, T is the torque, and d is the diameter of the specimen. If Fn is the normal
force on the frictional surface, and μ is the coefficient of friction, the required normal force is:
(2.2)
Force gauge
Collar
Weight
Rod
27
Combining equations (2.1) and (2.2):
(2.3)
With a steel collar on an aluminum specimen, the required T is 500 in-lb, μ is 0.52, d is 0.375 in. The
required Fn is then calculated to be 2,600 lb. With a steel collar on a NiTi specimen, T is 200 in-lb, μ is
0.14, and Fn is calculated to be 3,800 lb. Based on this, the clamp was designed to be able to apply 4,000
lb of normal force.
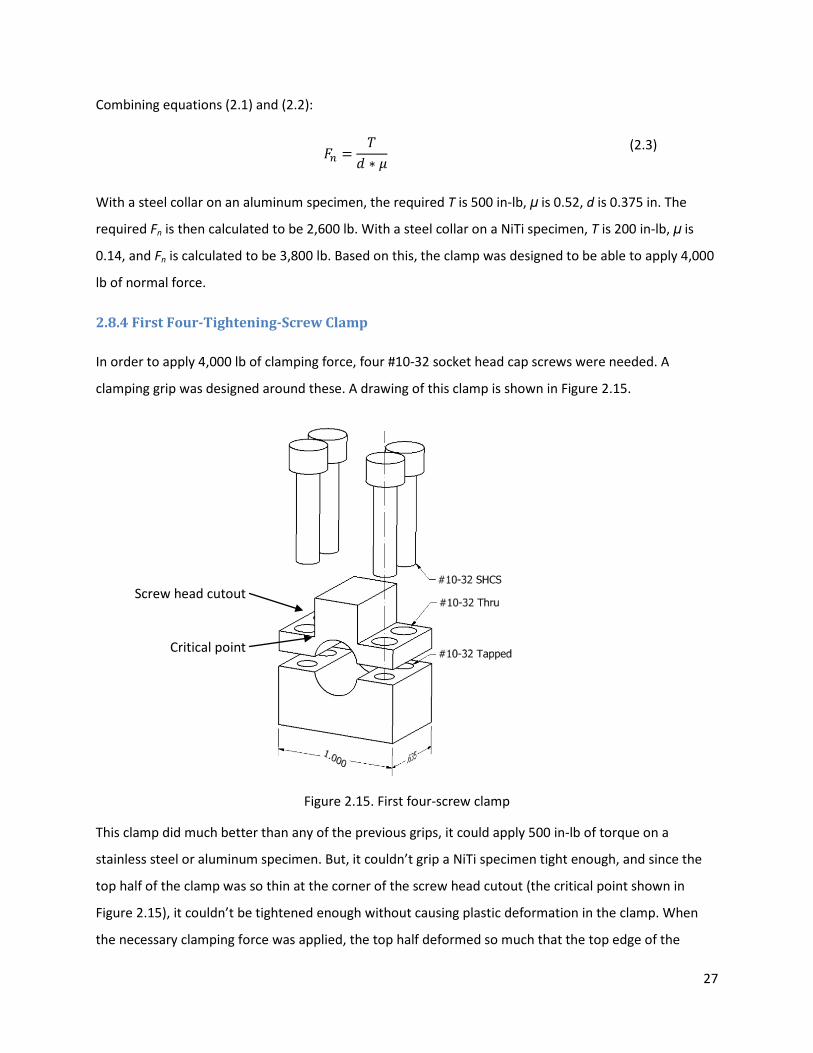
2.8.4 First Four-Tightening-Screw Clamp
In order to apply 4,000 lb of clamping force, four #10-32 socket head cap screws were needed. A
clamping grip was designed around these. A drawing of this clamp is shown in Figure 2.15.
Figure 2.15. First four-screw clamp
This clamp did much better than any of the previous grips, it could apply 500 in-lb of torque on a
stainless steel or aluminum specimen. But, it couldn’t grip a NiTi specimen tight enough, and since the
top half of the clamp was so thin at the corner of the screw head cutout (the critical point shown in
Figure 2.15), it couldn’t be tightened enough without causing plastic deformation in the clamp. When
the necessary clamping force was applied, the top half deformed so much that the top edge of the
Screw head cutout
Critical point
28
screws bowed out and did not fit in the square cutout in the grip holders. Thus, for every trial, once the
screw were tightened, the side of the heads had to be filed down so that they would fit in the specimen
grip holders. Some of the filing can be seen in Figure 2.16.
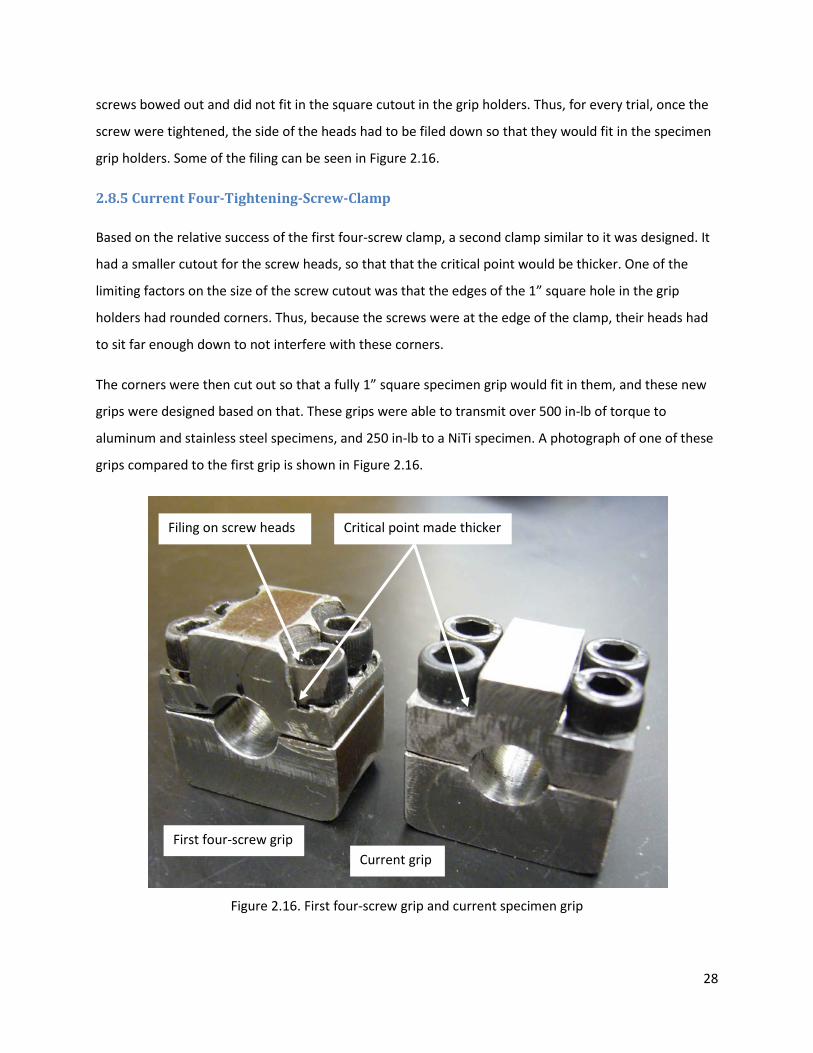
2.8.5 Current Four-Tightening-Screw-Clamp
Based on the relative success of the first four-screw clamp, a second clamp similar to it was designed. It
had a smaller cutout for the screw heads, so that that the critical point would be thicker. One of the
limiting factors on the size of the screw cutout was that the edges of the 1” square hole in the grip
holders had rounded corners. Thus, because the screws were at the edge of the clamp, their heads had
to sit far enough down to not interfere with these corners.
The corners were then cut out so that a fully 1” square specimen grip would fit in them, and these new
grips were designed based on that. These grips were able to transmit over 500 in-lb of torque to
aluminum and stainless steel specimens, and 250 in-lb to a NiTi specimen. A photograph of one of these
grips compared to the first grip is shown in Figure 2.16.
Figure 2.16. First four-screw grip and current specimen grip
First four-screw grip Current grip
Filing on screw heads Critical point made thicker
29
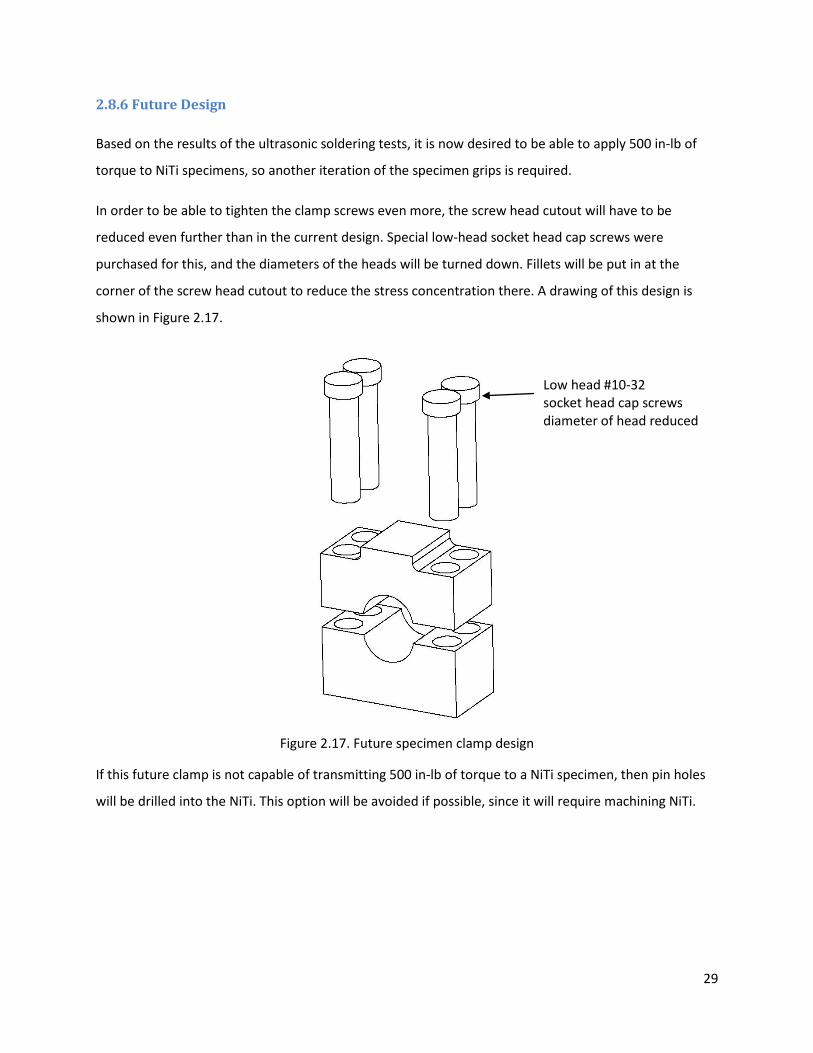
2.8.6 Future Design
Based on the results of the ultrasonic soldering tests, it is now desired to be able to apply 500 in-lb of
torque to NiTi specimens, so another iteration of the specimen grips is required.
In order to be able to tighten the clamp screws even more, the screw head cutout will have to be
reduced even further than in the current design. Special low-head socket head cap screws were
purchased for this, and the diameters of the heads will be turned down. Fillets will be put in at the
corner of the screw head cutout to reduce the stress concentration there. A drawing of this design is
shown in Figure 2.17.
Figure 2.17. Future specimen clamp design
If this future clamp is not capable of transmitting 500 in-lb of torque to a NiTi specimen, then pin holes
will be drilled into the NiTi. This option will be avoided if possible, since it will require machining NiTi.
Low head #10-32 socket head cap screws diameter of head reduced
30
3 Verification and Calibration of Torsion Testing Machine
As the torsional testing machine was being built, key components of it were calibrated and verified to
make sure that the final output of the machine would be accurate. The main calibrations were finding
the static sensitivity of the torque cell and finding the stiffness of the machine itself, which is currently
ongoing. Several trials with aluminum and stainless steel specimens were conducted to verify that the
measured strength of the specimens matched their known material properties. Most recently, failure
tests were run on five specimens of NiTi ultrasonically soldered to aluminum.
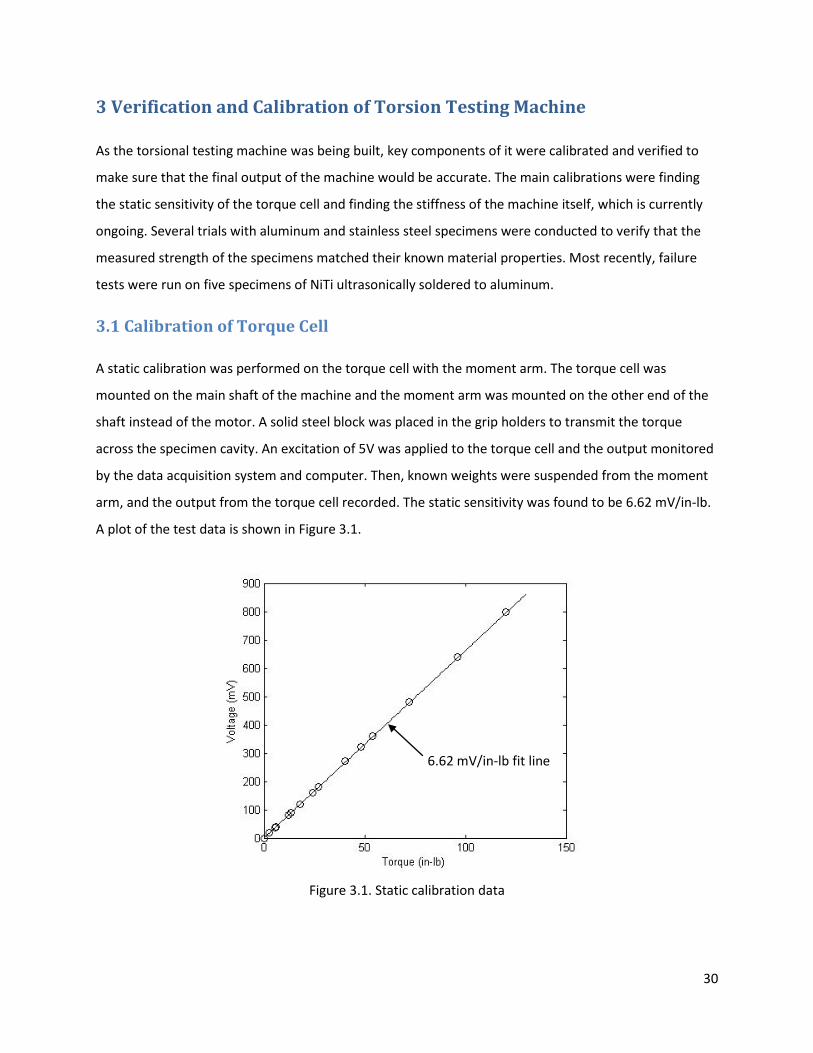
3.1 Calibration of Torque Cell
A static calibration was performed on the torque cell with the moment arm. The torque cell was
mounted on the main shaft of the machine and the moment arm was mounted on the other end of the
shaft instead of the motor. A solid steel block was placed in the grip holders to transmit the torque
across the specimen cavity. An excitation of 5V was applied to the torque cell and the output monitored
by the data acquisition system and computer. Then, known weights were suspended from the moment
arm, and the output from the torque cell recorded. The static sensitivity was found to be 6.62 mV/in-lb.
A plot of the test data is shown in Figure 3.1.
Figure 3.1. Static calibration data
6.62 mV/in-lb fit line
31
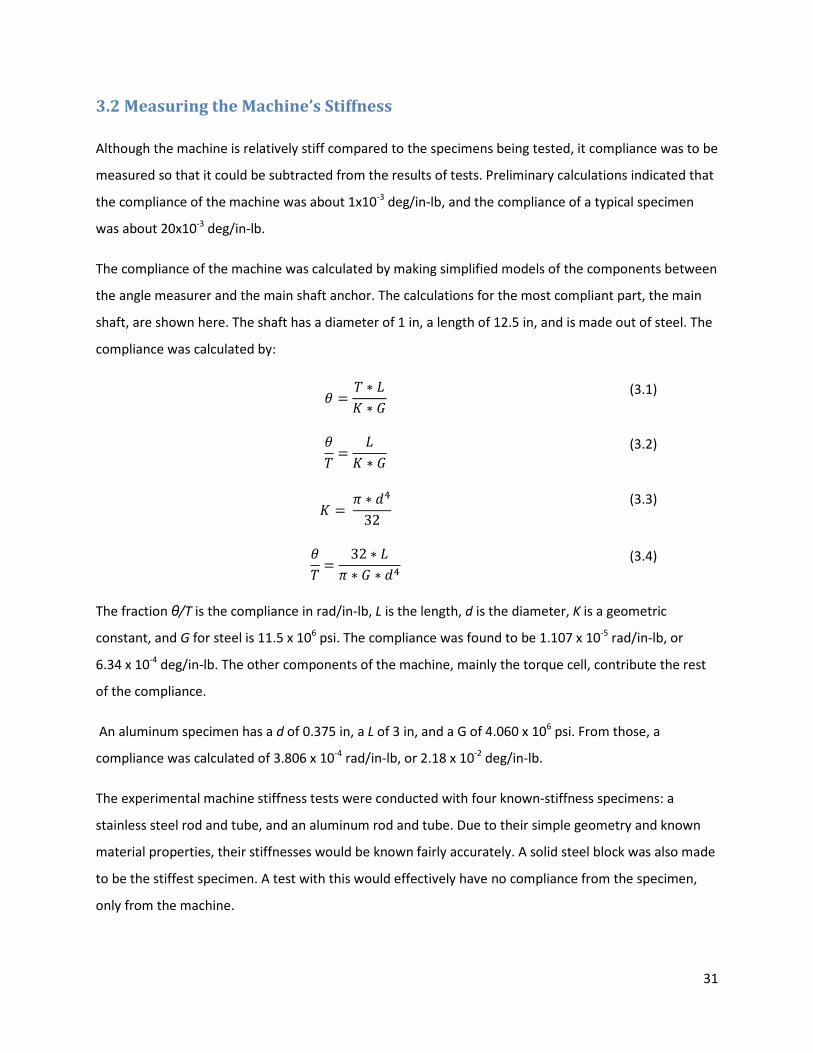
3.2 Measuring the Machine’s Stiffness
Although the machine is relatively stiff compared to the specimens being tested, it compliance was to be
measured so that it could be subtracted from the results of tests. Preliminary calculations indicated that
the compliance of the machine was about 1x10⁻³ deg/in-lb, and the compliance of a typical specimen
was about 20x10-3 deg/in-lb.
The compliance of the machine was calculated by making simplified models of the components between
the angle measurer and the main shaft anchor. The calculations for the most compliant part, the main
shaft, are shown here. The shaft has a diameter of 1 in, a length of 12.5 in, and is made out of steel. The
compliance was calculated by:
(3.1)
(3.2)
(3.3)
(3.4)
The fraction θ/T is the compliance in rad/in-lb, L is the length, d is the diameter, K is a geometric
constant, and G for steel is 11.5 x 10⁶ psi. The compliance was found to be 1.107 x 10⁻⁵ rad/in-lb, or
6.34 x 10⁻⁴ deg/in-lb. The other components of the machine, mainly the torque cell, contribute the rest
of the compliance.
An aluminum specimen has a d of 0.375 in, a L of 3 in, and a G of 4.060 x 10⁶ psi. From those, a
compliance was calculated of 3.806 x 10⁻⁴ rad/in-lb, or 2.18 x 10⁻² deg/in-lb.
The experimental machine stiffness tests were conducted with four known-stiffness specimens: a
stainless steel rod and tube, and an aluminum rod and tube. Due to their simple geometry and known
material properties, their stiffnesses would be known fairly accurately. A solid steel block was also made
to be the stiffest specimen. A test with this would effectively have no compliance from the specimen,
only from the machine.
32
During these stiffness trials, the angle measurer was changed from the potentiometer to the angular
encoder, so these tests will be re-conducted now that the angular data can be measured more
accurately.
3.3 Measuring the Failure Torque of an Aluminum Specimen
In order to verify that the torque cell was giving accurate readings, an aluminum specimen was tested to
failure, and the measured failure torque compared with a theoretical value based on the specimen’s
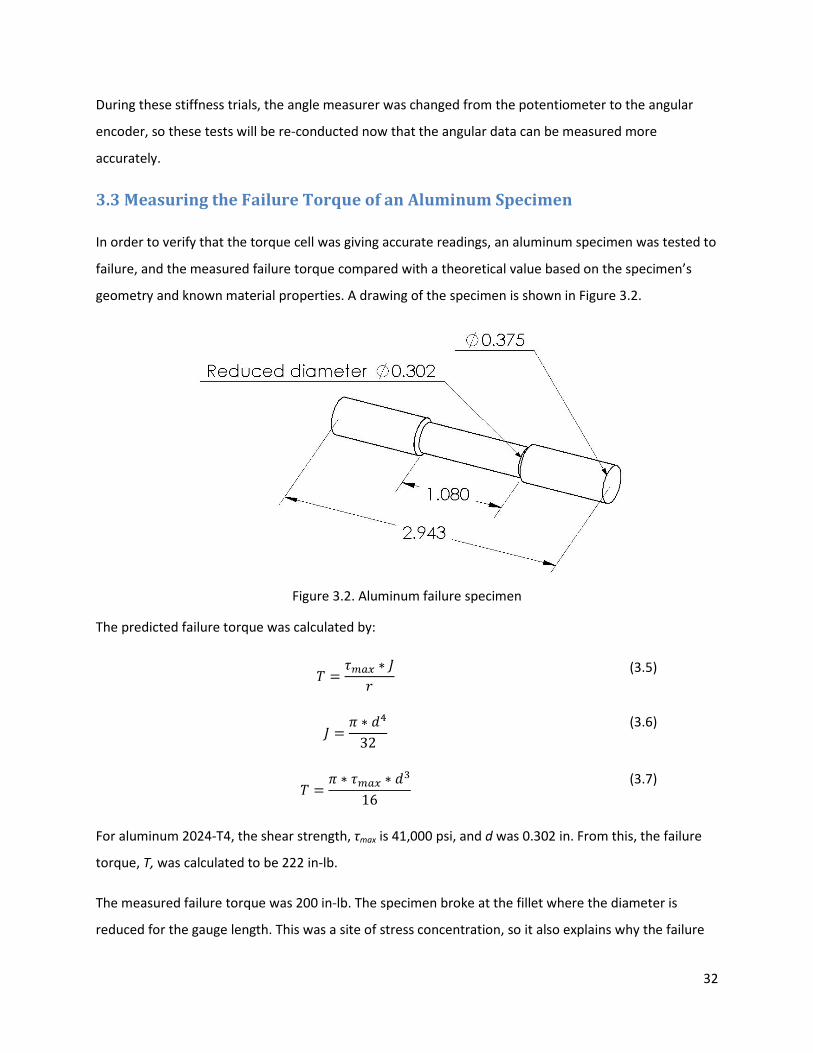
geometry and known material properties. A drawing of the specimen is shown in Figure 3.2.
Figure 3.2. Aluminum failure specimen
The predicted failure torque was calculated by:
(3.5)
(3.6)
(3.7)
For aluminum 2024-T4, the shear strength, τmax is 41,000 psi, and d was 0.302 in. From this, the failure
torque, T, was calculated to be 222 in-lb.
The measured failure torque was 200 in-lb. The specimen broke at the fillet where the diameter is
reduced for the gauge length. This was a site of stress concentration, so it also explains why the failure
33
torque was a little lower than expected. But, because of the close agreement between the predicted
and actual failure torque, the torque cell was judged to have worked accurately.
3.4 Failure Test of Ultra Sonic Soldered Specimens
Five samples of NiTi tubes ultrasonically soldered (USS) into aluminum grips were made and tested to
failure in torsion. Since failure occurred after the NiTi began to detwin, three of the five specimens were
heated and their free strain recovery observed. This was the first actual test conducted by the torsion
machine, and demonstrated its ability to conduct such tests well.
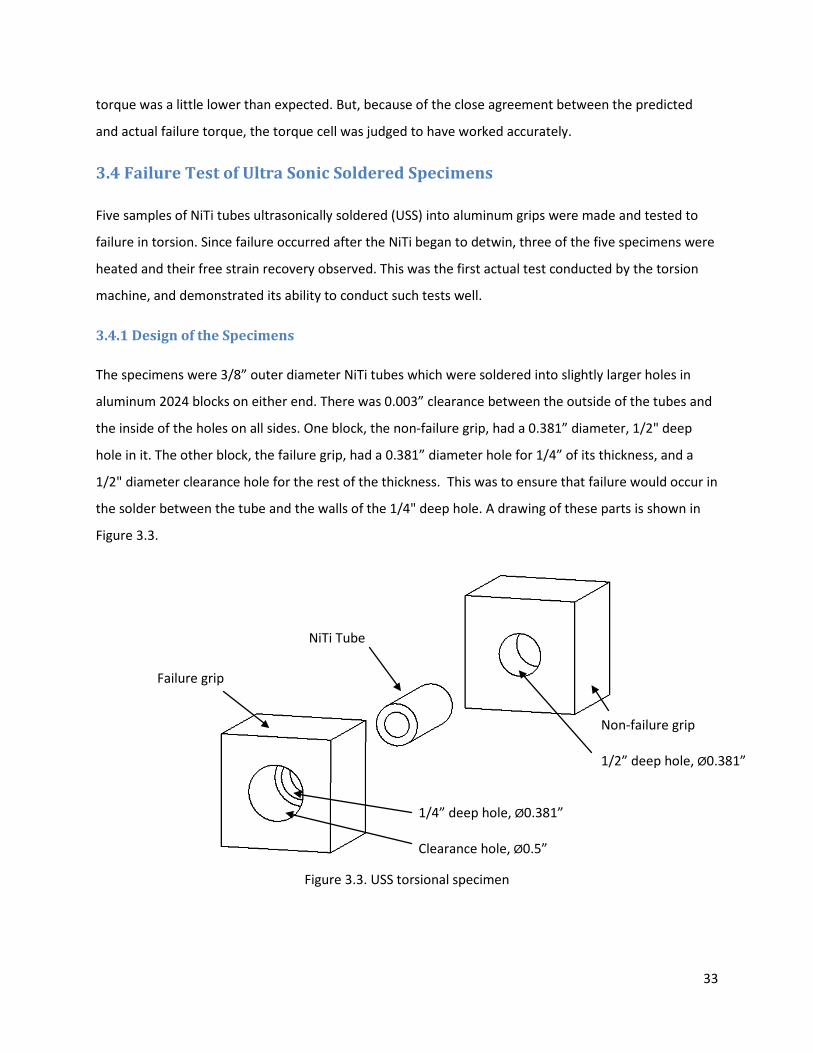
3.4.1 Design of the Specimens
The specimens were 3/8” outer diameter NiTi tubes which were soldered into slightly larger holes in
aluminum 2024 blocks on either end. There was 0.003” clearance between the outside of the tubes and
the inside of the holes on all sides. One block, the non-failure grip, had a 0.381” diameter, 1/2" deep
hole in it. The other block, the failure grip, had a 0.381” diameter hole for 1/4” of its thickness, and a
1/2" diameter clearance hole for the rest of the thickness. This was to ensure that failure would occur in
the solder between the tube and the walls of the 1/4" deep hole. A drawing of these parts is shown in
Figure 3.3.
Figure 3.3. USS torsional specimen
Non-failure grip 1/2” deep hole, Ø0.381”
1/4” deep hole, Ø0.381” Clearance hole, Ø0.5”
NiTi Tube
Failure grip
34
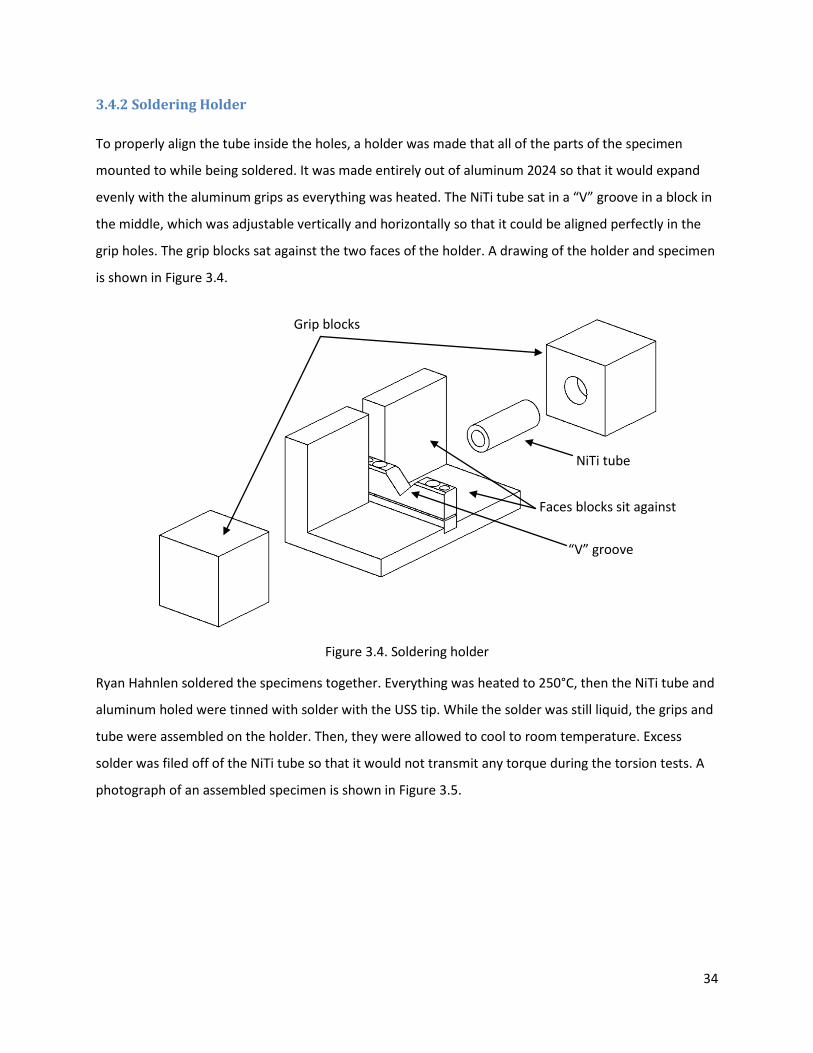
3.4.2 Soldering Holder
To properly align the tube inside the holes, a holder was made that all of the parts of the specimen
mounted to while being soldered. It was made entirely out of aluminum 2024 so that it would expand
evenly with the aluminum grips as everything was heated. The NiTi tube sat in a “V” groove in a block in
the middle, which was adjustable vertically and horizontally so that it could be aligned perfectly in the
grip holes. The grip blocks sat against the two faces of the holder. A drawing of the holder and specimen
is shown in Figure 3.4.
Figure 3.4. Soldering holder
Ryan Hahnlen soldered the specimens together. Everything was heated to 250°C, then the NiTi tube and
aluminum holed were tinned with solder with the USS tip. While the solder was still liquid, the grips and
tube were assembled on the holder. Then, they were allowed to cool to room temperature. Excess
solder was filed off of the NiTi tube so that it would not transmit any torque during the torsion tests. A
photograph of an assembled specimen is shown in Figure 3.5.
Grip blocks
“V” groove
Faces blocks sit against
NiTi tube
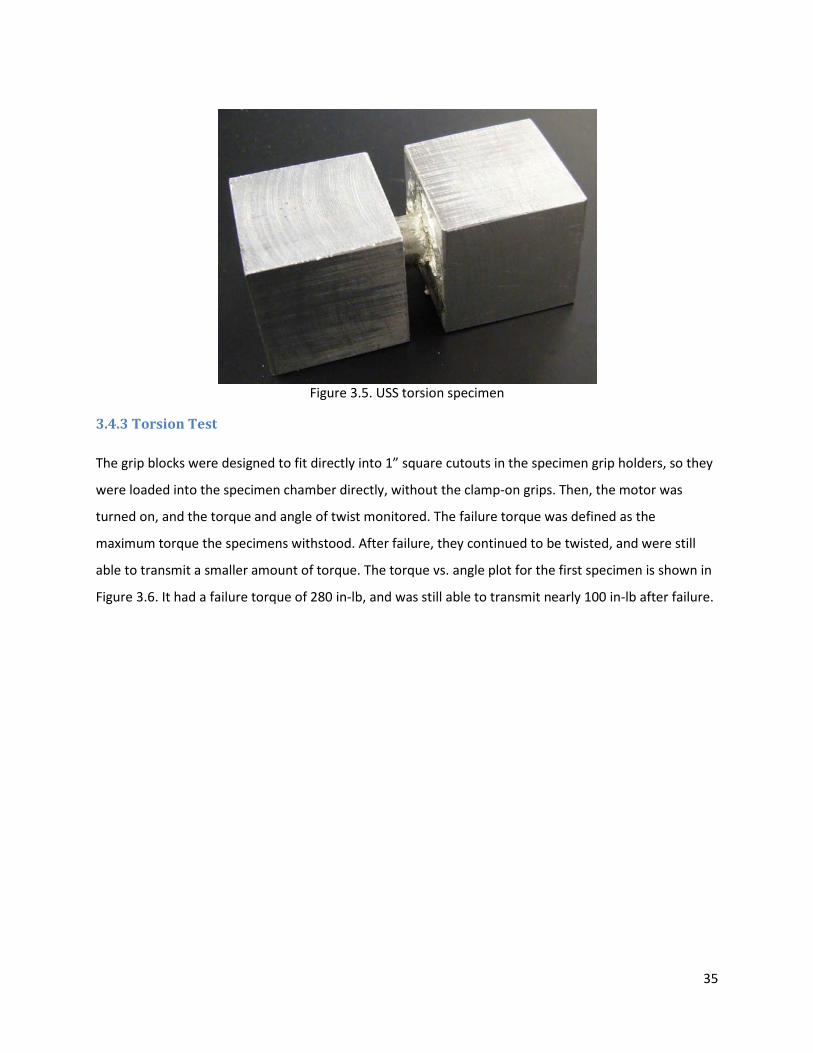
35
Figure 3.5. USS torsion specimen
3.4.3 Torsion Test
The grip blocks were designed to fit directly into 1” square cutouts in the specimen grip holders, so they
were loaded into the specimen chamber directly, without the clamp-on grips. Then, the motor was
turned on, and the torque and angle of twist monitored. The failure torque was defined as the
maximum torque the specimens withstood. After failure, they continued to be twisted, and were still
able to transmit a smaller amount of torque. The torque vs. angle plot for the first specimen is shown in
Figure 3.6. It had a failure torque of 280 in-lb, and was still able to transmit nearly 100 in-lb after failure.
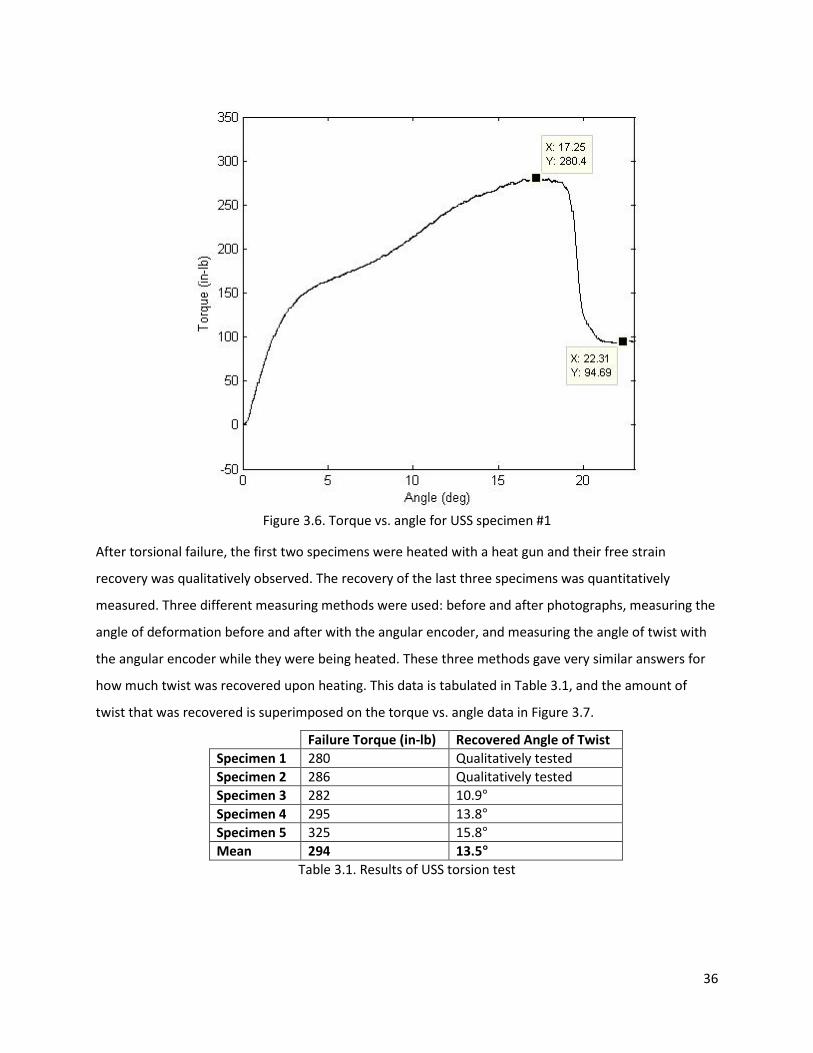
36
Figure 3.6. Torque vs. angle for USS specimen #1
After torsional failure, the first two specimens were heated with a heat gun and their free strain
recovery was qualitatively observed. The recovery of the last three specimens was quantitatively
measured. Three different measuring methods were used: before and after photographs, measuring the
angle of deformation before and after with the angular encoder, and measuring the angle of twist with
the angular encoder while they were being heated. These three methods gave very similar answers for
how much twist was recovered upon heating. This data is tabulated in Table 3.1, and the amount of
twist that was recovered is superimposed on the torque vs. angle data in Figure 3.7.
Failure Torque (in-lb) Recovered Angle of Twist Specimen 1 280 Qualitatively tested Specimen 2 286 Qualitatively tested Specimen 3 282 10.9° Specimen 4 295 13.8° Specimen 5 325 15.8° Mean 294 13.5°
Table 3.1. Results of USS torsion test
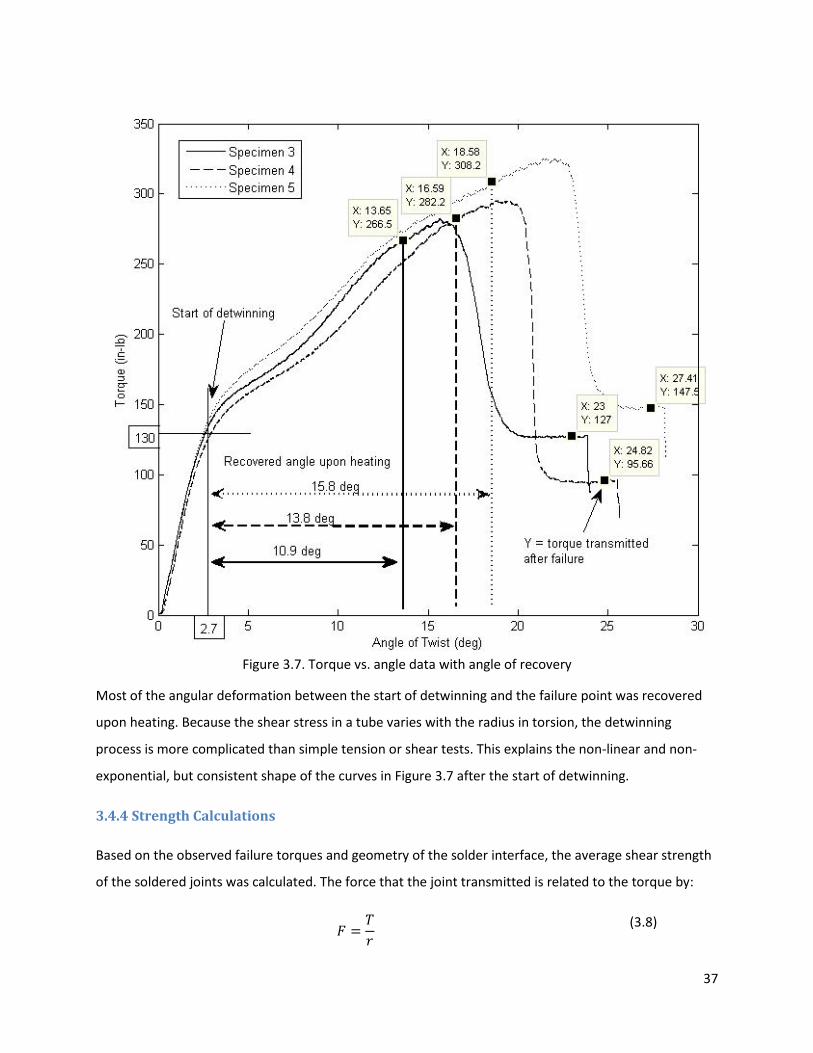
37
Figure 3.7. Torque vs. angle data with angle of recovery
Most of the angular deformation between the start of detwinning and the failure point was recovered
upon heating. Because the shear stress in a tube varies with the radius in torsion, the detwinning
process is more complicated than simple tension or shear tests. This explains the non-linear and non-
exponential, but consistent shape of the curves in Figure 3.7 after the start of detwinning.
3.4.4 Strength Calculations
Based on the observed failure torques and geometry of the solder interface, the average shear strength
of the soldered joints was calculated. The force that the joint transmitted is related to the torque by:
(3.8)
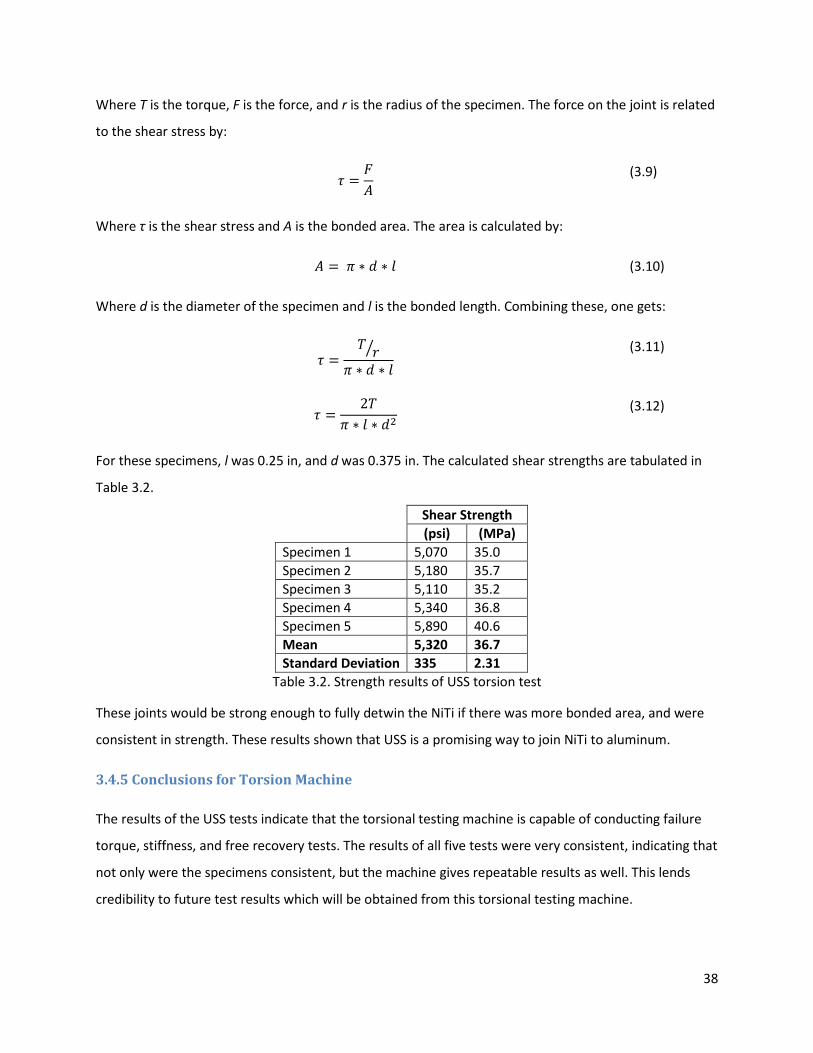
38
Where T is the torque, F is the force, and r is the radius of the specimen. The force on the joint is related
to the shear stress by:
(3.9)
Where τ is the shear stress and A is the bonded area. The area is calculated by:
(3.10)
Where d is the diameter of the specimen and l is the bonded length. Combining these, one gets:
(3.11)
(3.12)
For these specimens, l was 0.25 in, and d was 0.375 in. The calculated shear strengths are tabulated in
Table 3.2.
Shear Strength (psi) (MPa)
Specimen 1 5,070 35.0 Specimen 2 5,180 35.7 Specimen 3 5,110 35.2 Specimen 4 5,340 36.8 Specimen 5 5,890 40.6 Mean 5,320 36.7 Standard Deviation 335 2.31
Table 3.2. Strength results of USS torsion test
These joints would be strong enough to fully detwin the NiTi if there was more bonded area, and were
consistent in strength. These results shown that USS is a promising way to join NiTi to aluminum.
3.4.5 Conclusions for Torsion Machine
The results of the USS tests indicate that the torsional testing machine is capable of conducting failure
torque, stiffness, and free recovery tests. The results of all five tests were very consistent, indicating that
not only were the specimens consistent, but the machine gives repeatable results as well. This lends
credibility to future test results which will be obtained from this torsional testing machine.
39
4 Ongoing Research
As this research project is part of a combined B.S. and M.S. program, it is not complete yet. In the future,
more capabilities will be added to the torsion testing machine, and additional tests will be conducted
with it. The main areas of ongoing work are adding a thermal chamber to the torsion machine for
heating tests of NiTi, and using the machine to test specimens of NiTi laser welded to stainless steel.
4.1 Laser Weld Trials of NiTi to Stainless Steel
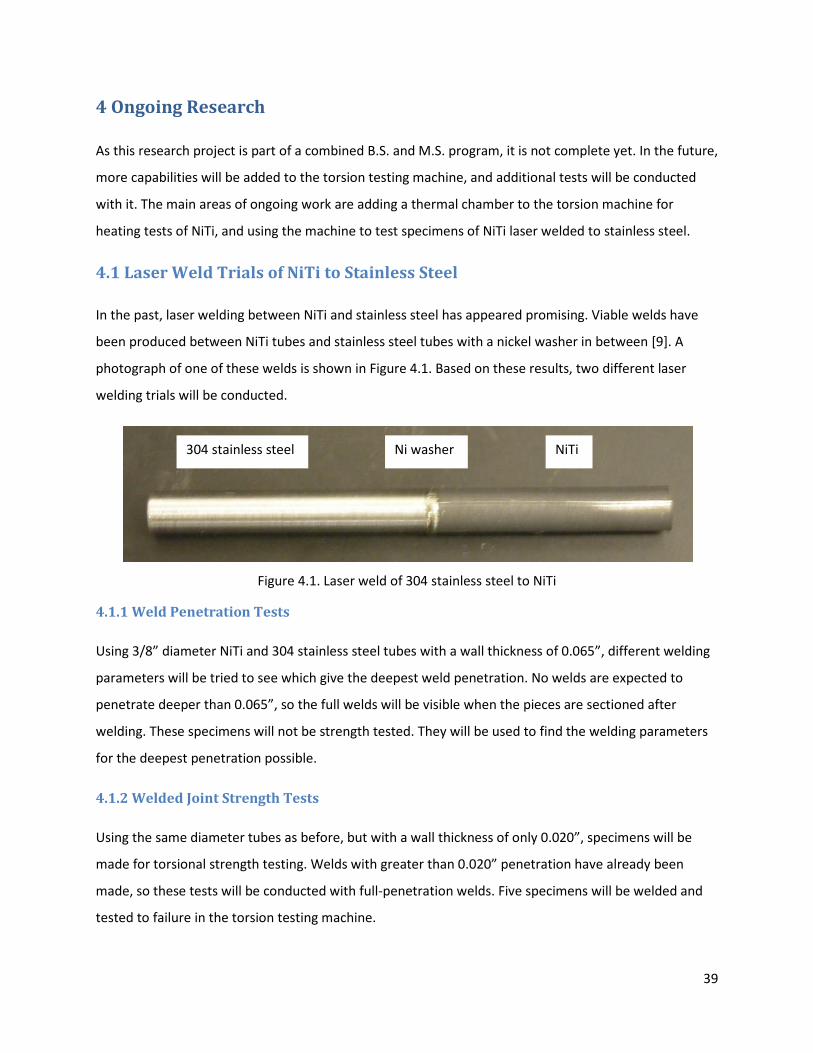
In the past, laser welding between NiTi and stainless steel has appeared promising. Viable welds have
been produced between NiTi tubes and stainless steel tubes with a nickel washer in between [9]. A
photograph of one of these welds is shown in Figure 4.1. Based on these results, two different laser
welding trials will be conducted.
Figure 4.1. Laser weld of 304 stainless steel to NiTi
4.1.1 Weld Penetration Tests
Using 3/8” diameter NiTi and 304 stainless steel tubes with a wall thickness of 0.065”, different welding
parameters will be tried to see which give the deepest weld penetration. No welds are expected to
penetrate deeper than 0.065”, so the full welds will be visible when the pieces are sectioned after
welding. These specimens will not be strength tested. They will be used to find the welding parameters
for the deepest penetration possible.
4.1.2 Welded Joint Strength Tests
Using the same diameter tubes as before, but with a wall thickness of only 0.020”, specimens will be
made for torsional strength testing. Welds with greater than 0.020” penetration have already been
made, so these tests will be conducted with full-penetration welds. Five specimens will be welded and
tested to failure in the torsion testing machine.
304 stainless steel Ni washer NiTi
40
4.2 Thermal Testing of NiTi
Since NiTi is a shape memory alloy, its thermal properties are very important. A chamber is being built
for the torsion testing machine which will be able to heat a specimen while apply torque and measuring
angular deflection. These tests will be used to observe the shape memory effect, and to characterize the
stiffness of NiTi at elevated temperatures. When activating the shape memory effect, trials will be run to
measure the blocked torque and the free deflection. This will give useful information for NiTi actuators.
Finding the stiffness of NiTi at elevated temperatures will be necessary to accurately model NiTi as it
goes through its phase transition.
The thermal chamber that will be used to perform these tests is currently being designed, and
prototypes of proposed components are being tested.
4.2.1 Thermal Chamber Specifications
In order to conduct accurate tests, the thermal chamber must be capable of doing the following things:
1. Maintain a steady temperature at an operator-set point between room temperature and 300°C
2. Not create a significant thermal gradient in the specimen being tested
3. Transmit up to 500 in-lb of torque into and out of the thermal chamber
4. Not lose significant amounts of heat through the walls, shafts, etc
The torque cell purchased has a maximum operating temperature of 200°C, so it will have to be
mounted outside of the thermal chamber.
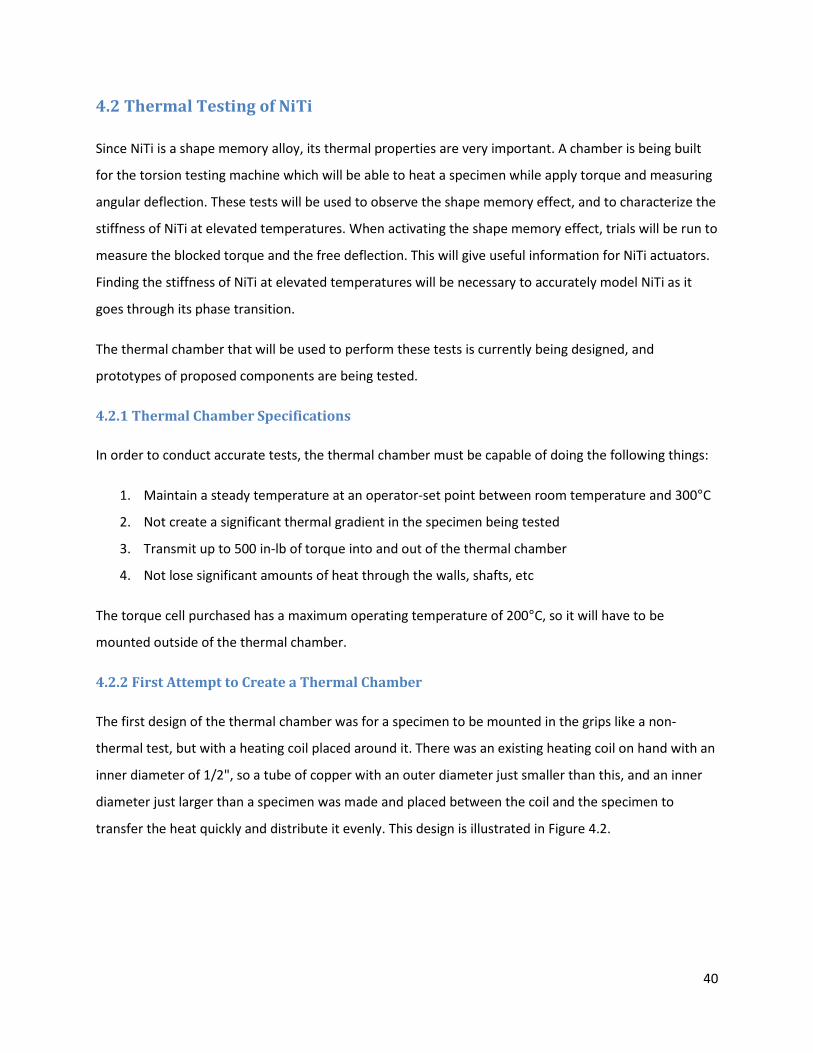
4.2.2 First Attempt to Create a Thermal Chamber
The first design of the thermal chamber was for a specimen to be mounted in the grips like a non-
thermal test, but with a heating coil placed around it. There was an existing heating coil on hand with an
inner diameter of 1/2", so a tube of copper with an outer diameter just smaller than this, and an inner
diameter just larger than a specimen was made and placed between the coil and the specimen to
transfer the heat quickly and distribute it evenly. This design is illustrated in Figure 4.2.
41
Figure 4.2. First proposed design for thermal chamber
This would be the simplest design and thus the quickest to implement, but there were some concerns
with it. The heater might heat the torque cell excessively, since the torque cell was mounted on the
main shaft very near the specimen. Also, the difference between the coil temperature and the grip
temperature might create too much of a thermal gradient in the specimen. This is why the ceramic
inserts were included, to insulate the specimen from the clamp-on holder. These concerns were
investigated experimentally.
To evaluate whether the torque cell would be heated too much, a rod of aluminum was mounted in the
specimen grip and the heating coil was placed around it. The coil was turned on, and the voltage to it
adjusted until a steady-state temperature in it of 200°C was maintained. The temperature of the torque
cell was found to only have increased about 5°C. This concern was found to not be a problem.
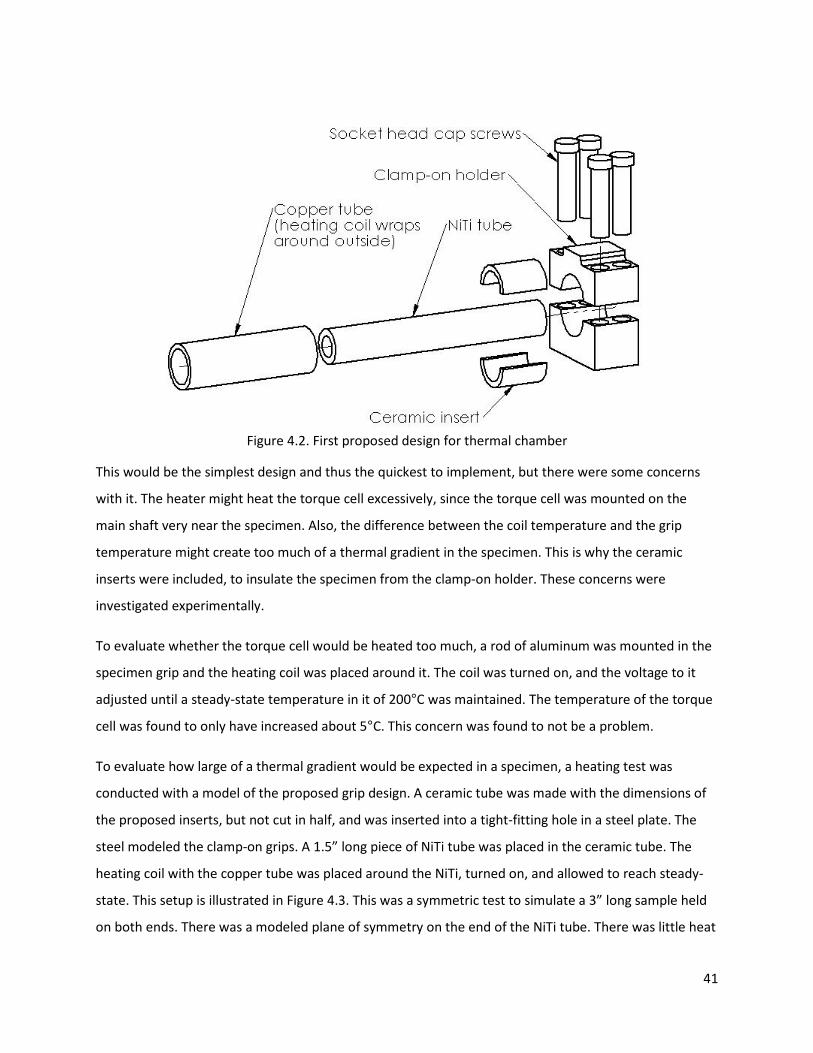
To evaluate how large of a thermal gradient would be expected in a specimen, a heating test was
conducted with a model of the proposed grip design. A ceramic tube was made with the dimensions of
the proposed inserts, but not cut in half, and was inserted into a tight-fitting hole in a steel plate. The
steel modeled the clamp-on grips. A 1.5” long piece of NiTi tube was placed in the ceramic tube. The
heating coil with the copper tube was placed around the NiTi, turned on, and allowed to reach steady-
state. This setup is illustrated in Figure 4.3. This was a symmetric test to simulate a 3” long sample held
on both ends. There was a modeled plane of symmetry on the end of the NiTi tube. There was little heat
42
flux through that end, and an ideal plane of symmetry has no heat flux through it. The temperature was
measured along the inside of the tube. It was found that from a temperature of 200°C at the end of the
tube, there was a 10°C drop in half of the distance between the edge and the grip, and a 100°C drop
between that point and the start of the grip. The temperature distribution is plotted in Figure 4.3. That
large of a thermal gradient is unacceptable, so that design will not be used.
Figure 4.3. Diagram of heating coil test and steady-state temperature distribution
Heating coil
Copper tube
NiTi tube
Ceramic tube
Steel base
Measurements taken along inside surface of NiTi
43
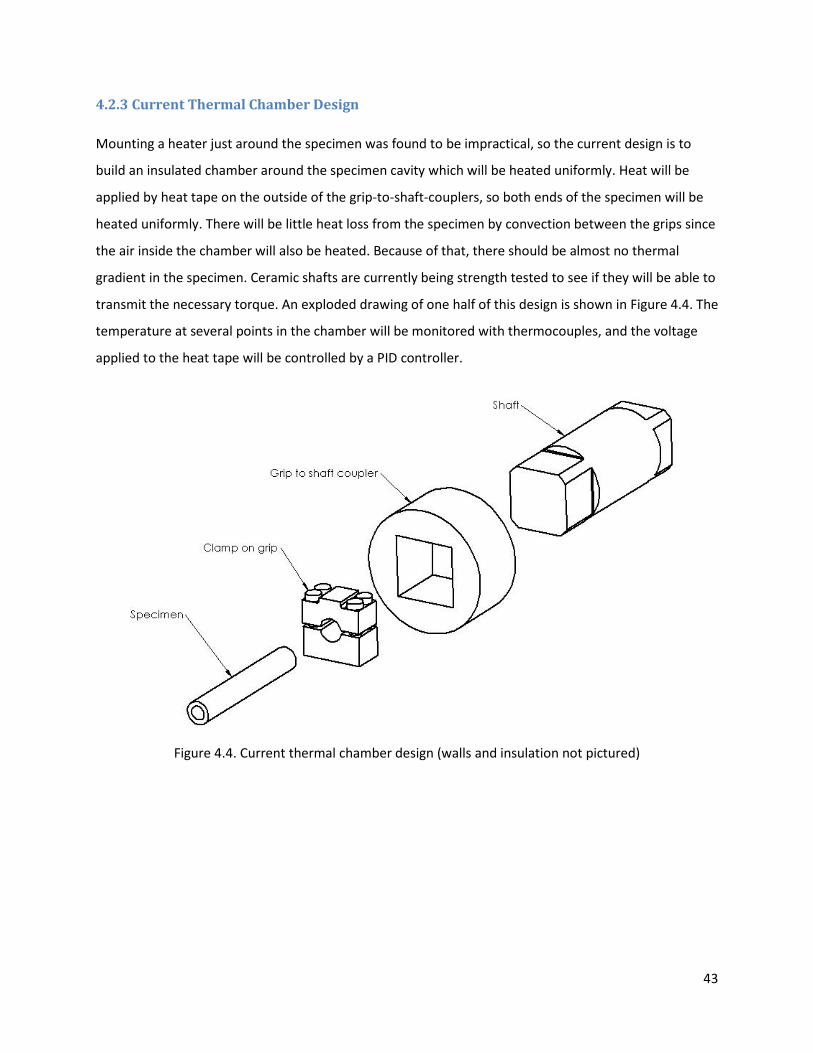
4.2.3 Current Thermal Chamber Design
Mounting a heater just around the specimen was found to be impractical, so the current design is to
build an insulated chamber around the specimen cavity which will be heated uniformly. Heat will be
applied by heat tape on the outside of the grip-to-shaft-couplers, so both ends of the specimen will be
heated uniformly. There will be little heat loss from the specimen by convection between the grips since
the air inside the chamber will also be heated. Because of that, there should be almost no thermal
gradient in the specimen. Ceramic shafts are currently being strength tested to see if they will be able to
transmit the necessary torque. An exploded drawing of one half of this design is shown in Figure 4.4. The
temperature at several points in the chamber will be monitored with thermocouples, and the voltage
applied to the heat tape will be controlled by a PID controller.
Figure 4.4. Current thermal chamber design (walls and insulation not pictured)
44
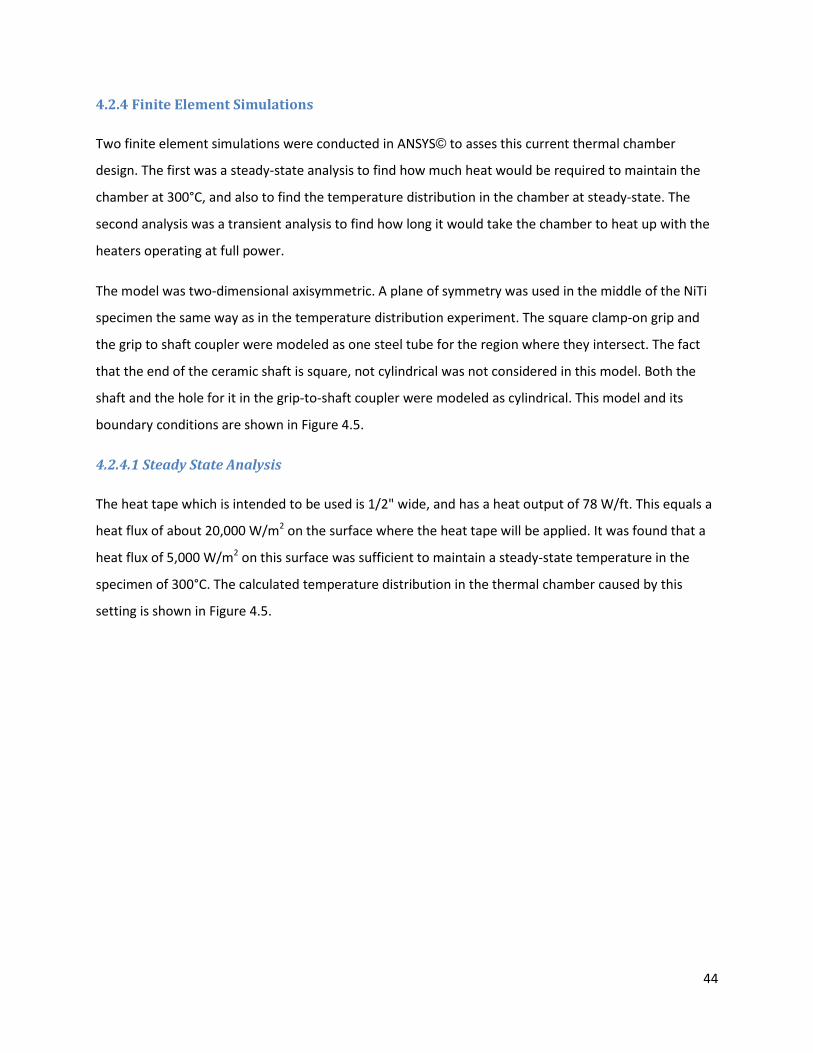
4.2.4 Finite Element Simulations
Two finite element simulations were conducted in ANSYS© to asses this current thermal chamber
design. The first was a steady-state analysis to find how much heat would be required to maintain the
chamber at 300°C, and also to find the temperature distribution in the chamber at steady-state. The
second analysis was a transient analysis to find how long it would take the chamber to heat up with the
heaters operating at full power.
The model was two-dimensional axisymmetric. A plane of symmetry was used in the middle of the NiTi
specimen the same way as in the temperature distribution experiment. The square clamp-on grip and
the grip to shaft coupler were modeled as one steel tube for the region where they intersect. The fact
that the end of the ceramic shaft is square, not cylindrical was not considered in this model. Both the
shaft and the hole for it in the grip-to-shaft coupler were modeled as cylindrical. This model and its
boundary conditions are shown in Figure 4.5.
4.2.4.1 Steady State Analysis
The heat tape which is intended to be used is 1/2" wide, and has a heat output of 78 W/ft. This equals a
heat flux of about 20,000 W/m2 on the surface where the heat tape will be applied. It was found that a
heat flux of 5,000 W/m2 on this surface was sufficient to maintain a steady-state temperature in the
specimen of 300°C. The calculated temperature distribution in the thermal chamber caused by this
setting is shown in Figure 4.5.
45
Figure 4.5. Finite element model and steady-state temperature distribution
46
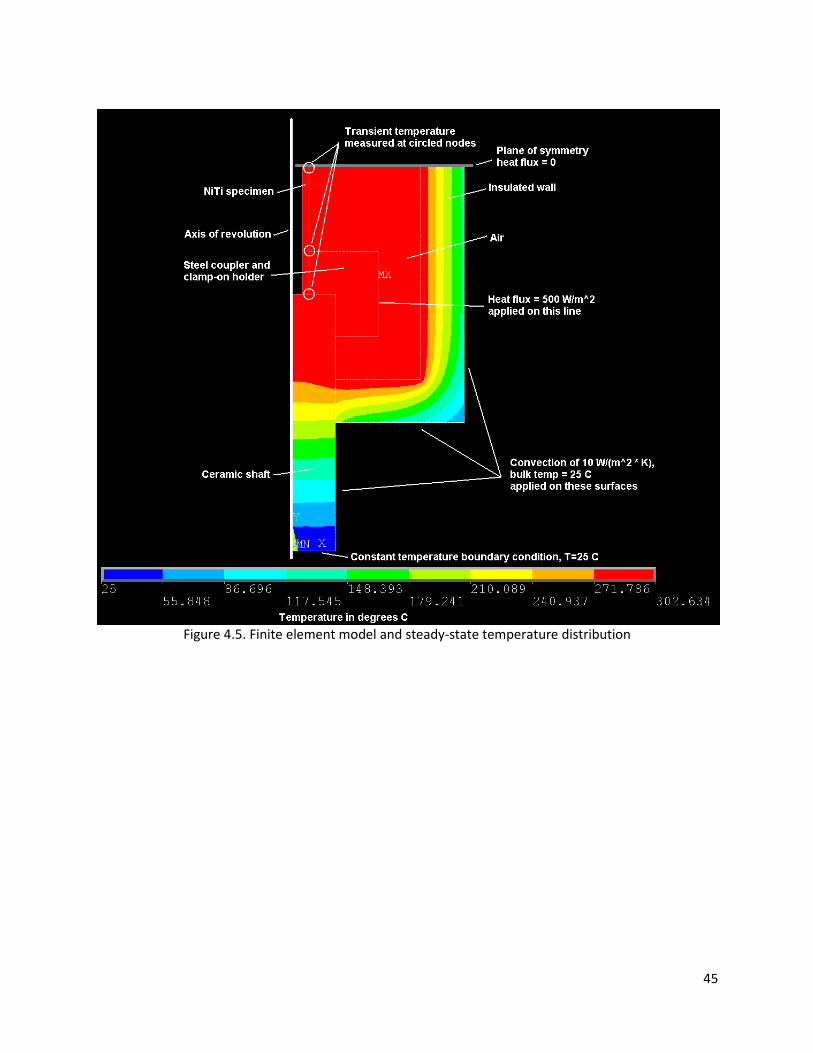
4.2.4.2 Transient Analysis
The heat flux applied on the edge of the coupler was increased from 5,000 W/m2 to the maximum value
of 20,000 W/m2, and the temperature of several nodes in the specimen was monitored over time. A plot
of these results is shown in Figure 4.6.
Figure 4.6. Temperature distribution in specimen over time
It can be seen that there is never any significant temperature gradient in the specimen, and that it takes
about 1,000 seconds (17 minutes) for the chamber to reach 300°C. This is a reasonable amount of time
since this chamber will not be conducting fatigue tests.
47
5 Future Research
5.1 Improvements to Machine
As a result of testing so far, several areas have been identified for improving the torsion testing
machine. First, the machine will be made stiffer. As described in section 3.2, the machine is about 20
times stiffer than the specimens it tests, but this ratio will be increased. The main shaft will be anchored
nearer to the specimen cavity to effectively shorten it, and thus make it less compliant.
The electrical noise produced by the motor will be reduced physically, not just with a digital filter on the
torque data after it is acquired. Different motors will be investigated, such as stepper and hydraulic
motors, but if one is not purchased, modification to the current motor will be made to reduce its
interference with the torque signal.
Currently, the torsion testing machine has open-loop control. A closed-loop control system will be
constructed for both the motor’s angular velocity and the temperature of the thermal chamber. This will
allow much more repeatable tests.
5.2 Investigate Joint Stiffnesses
In addition to finding the stiffness of NiTi itself, the stiffness of joints between it and other materials will
be decoupled from the stiffness of those materials. It is hoped that this will provide more information
about the joints, and allow more accurate modeling of mechanisms with NiTi joints in them.
5.3 Find Bond Strength of Each NiTi Phase
The bonding strength of both the martensite and austenite phases of NiTi will be investigated. This will
be more difficult than current tests because of the heat-induced phase transformation caused by the
joining processes being investigated, but post-joining heat treatments may be able to create the desired
phases in the NiTi.
5.4 Investigate Rate Dependence of Stress and Temperature
All of the tests so far have been semi-static, meaning that the rate at which stress and temperature has
been applied was so slow their dynamic effects have not been observed. In future work, the effect that
rapid applications of stress or changes in temperature have on phase transformation and detwinning

48
will be investigated. First, a literature search will be conducted to see if there has been any other
research on these questions, then, experiments will be conducted. The hypothesis is that as torque is
applied faster to a NiTi specimen, the detwinning process will begin at a higher stress. This is based on
the behavior of other materials where the yield stress increases with the strain rate.
49
6 Conclusions
Shape memory alloys have many potential applications as actuators, switches, and extremely flexible
structural components. Although they are being used to some extent now, more widespread use and
new applications are hindered by their difficulty being incorporated into mechanisms. One of the most
useful alloys, nickel-titanium is extremely expensive and difficult to machine, so mechanical joining
methods are impractical. However, laser welding to stainless steel, and ultrasonic soldering to aluminum
are promising joining methods.
A torsional testing machine was built to find the strength of such joints. The machine currently has the
capability to find the strength and stiffness of specimens and joints, and work is underway for it to be
able to be able to characterize the nickel-titanium material itself at elevated temperatures.
Ultrasonically soldered joints between nickel-titanium tubes and aluminum blocks have shown that
joints can be made strong enough to take advantage of the shape-memory properties. Their average
shear strength of these joints was 5.3 ksi (37 MPa), which was after the start of the detwinning process.
The strength of the joints were very consistent between different specimens.
Soon, specimens of nickel-titanium laser welded to stainless steel will be tested to find if that is another
effective way that nickel-titanium can be joined.
In the future, the stiffness of nickel-titanium joints themselves will be decoupled from the stiffness of
the base materials. Also, the effect of strain rate and temperature change rate on the detwinning
process and phase transformation will be investigated.
50
7 Bibliography
1. “Method of Welding Titanium and Titanium Based Alloys to Ferrous Metals”,
US Patent # 6,875,949, Peter Hall, Edison Welding Institute, 2005
2. Nitinol material specification sheets from http://www.nitinol.com/nitinol-university/material-
properties/
3. “Using Nitinol Alloys”, Johnson Matthey
4. “Welding of Nitinol to Stainless Steel”, Ge Wang, Edison Welding Institute
5. “Experimentally Validated Numerical Analysis of Aerostructures Incorporating Shape Memory
Alloys”, Darren J. Hartl, Jesse T. Mooney, Dimitris C. Lagoudas, Texas A&M University, College
Station, TX, U.S.A., James H. Mabe, Frederick T. Calkins, The Boeing Company, Seattle, WA,
U.S.A., 2008
6. “NiTinol Performance Characterization and Rotary Actuator Design”, James H. Mabe, Dr. Roger
T. Ruggeri, Ed Rosenzweig, Chin-Jye (Mike) Yu, Boeing Phantom Works, 2004
7. “Issues in the Further Development of Nitinol Properties and Processing for Medical Device
Applications”, L. McD. Schetck, M.H. Wu, Memry Corporation
8. “Joining and Welding Nitinol”, Peter Hall, Edison Welding Institute, 1999
9. “Development and Characterization of NiTi Joining Methods and Metal Matrix Composite
Tranducers with Embedded NiTi by Ultrasonic Consolidation”, Ryan Hahnlen, The Ohio State
University, 2009
10. “Welding of Chemical Equipment Made From Two-Layer Sheet with Titanium Protective Layer”,
N.T. Lositskii, A.A. Grigor’ev, G.V. Khitrova, 1966
11. “Laser Welding of Dissimilar Metal Combinations”, Z. Sun, J.C. Ion, Laser Processing Centre,
Lappeenranta University of Technology, Lappeenranta, Finland, 1995