development and pilot-scale demonstration...
TRANSCRIPT

Publication No. 02-162-229
DEVELOPMENT AND PILOT-SCALE DEMONSTRATION OF DEEP-CONE™ PASTE THICKENING PROCESS
FOR PHOSPHATIC CLAY DISPOSAL
FINAL REPORT
Prepared by
UNIVERSITY OF KENTUCKY
under a grant sponsored by
August 2008
The Florida Institute of Phosphate Research was created in 1978 by the Florida Legislature (Chapter 378.101, Florida Statutes) and empowered to conduct research supportive to the responsible development of the state’s phosphate resources. The Institute has targeted areas of research responsibility. These are: reclamation alternatives in mining and processing, including wetlands reclamation, phosphogypsum storage areas and phosphatic clay containment areas; methods for more efficient, economical and environmentally balanced phosphate recovery and processing; disposal and utilization of phosphatic clay; and environmental effects involving the health and welfare of the people, including those effects related to radiation and water consumption. FIPR is located in Polk County, in the heart of the Central Florida phosphate district. The Institute seeks to serve as an information center on phosphate-related topics and welcomes information requests made in person, or by mail, email, or telephone.
Executive Director Paul R. Clifford
G. Michael Lloyd, Jr.
Director of Research Programs
Research Directors
G. Michael Lloyd, Jr. -Chemical Processing J. Patrick Zhang -Mining & Beneficiation Steven G. Richardson -Reclamation Brian K. Birky -Public & Environmental Health
Publications Editor
Karen J. Stewart
Florida Institute of Phosphate Research 1855 West Main Street Bartow, Florida 33830
(863) 534-7160 Fax: (863) 534-7165
http://www.fipr.state.fl.us
DEVELOPMENT AND PILOT-SCALE DEMONSTRATION OF DEEP CONE PASTE THICKENING PROCESS FOR PHOSPHATIC CLAY DISPOSAL
FINAL REPORT
Daniel Tao1, B.K. Parekh2, and Rick Honaker1
1Department of Mining Engineering
2Center for Applied Energy Research University of Kentucky, Lexington, KY 40506-0107
in collaboration with
Dorr-Oliver Eimco Process Equipment Company The Mosaic Company
CF Industries Ciba Specialty Chemicals
Hengju Polymer Penn Pro, Inc.
Met-Pro Supply, Inc.
Prepared for
FLORIDA INSTITUTE OF PHOSPHATE RESEARCH 1855 West Main Street
Bartow, FL 33830
Contract Manager: Patrick Zhang FIPR Contract No.: 03-02-162
August 2008
DISCLAIMER The contents of this report are reproduced herein as received from the contractor. The report may have been edited as to format in conformance with the FIPR Style Manual. The opinions, findings and conclusions expressed herein are not necessarily those of the Florida Institute of Phosphate Research, nor does mention of company names or products constitute endorsement by the Florida Institute of Phosphate Research. © 2008, Florida Institute of Phosphate Research.

iii
PERSPECTIVE
Patrick Zhang, Research Director - Beneficiation & Mining
The Florida phosphate matrix (ore) is composed of roughly one third each of
phosphate, clay and sand. The clay must be removed before phosphate can be upgraded by flotation. Therefore, approximately one ton of clay waste (phosphatic clay) is generated for each ton of phosphate rock product. This translates to nearly 100,000 tons/day of waste clay in Florida. In current practice, phosphate clay slurry with an average solids content of about 3% is pumped through pipelines to clay storage ponds where the clay slowly settles. Clay settling ponds occupy up to 40% of mined lands and generally have limited use after reclamation, causing adverse economic impact. In the current FIPR Strategic Plan, the highest priority is given to developing technologies to reduce or eliminate clay settling ponds.
Mechanical thickeners are widely used for dewatering mining tailings as well as for clarifying water. A typical thickener is a large tank with a cone-shaped bottom section and a slow-moving rake. Before flocculants were introduced, thickeners were short and wide and occupied large areas, achieving slow settling. The addition of a flocculant in a traditional thickener can speed up settling and achieve higher solids, but it took the smaller-area, highly efficient E-Duc® flocculation thickener to realize high-rate thickening for ultra-fine particles.
The Deep Cone™ Thickener (DCT), evolved from the high-efficiency E-Duc® thickener, is a super-efficient thickening technology that produces a high-solids paste rather than a slurry. A slurry is a suspension of solids that settles under quiescent or mildly turbulent conditions, with the heaviest and largest particles settling first, resulting in segregation. Paste is defined as a non-settling, non-segregating, homogeneous suspension with minimal water release, and is therefore ideal for reclamation.
This project can be considered as Phase I of FIPR’s effort to develop a waste clay disposal system without impounding based on the deep cone paste technology. During this project a total of 25 polymers, including anionic, nonionic and cationic flocculants, were tested on lab scale to identify the most effective combination of flocculants for treating waste phosphatic clay and a sand/clay mix. Following the lab tests, an extensive pilot test was conducted using a 2 tph (1.5 m in diameter) DCT at Mosaic’s South Fort Meade mine. The pilot-scale field testing was successful in achieving a high-solids sand/clay mix that did not segregate and consolidated rapidly due to the novel use of dual polymers. The preliminary economic analysis also looks very encouraging.
A follow-on project is warranted to test waste clays of higher plasticity and to conduct a more vigorous economic analysis.

v
ABSTRACT
Phosphate mining and beneficiation produces huge amounts of phosphate clays in central Florida. There are more than 85,000 acres of phosphatic clay ponds and clay-filled mine cuts, with approximately 5,000 acres of additional ponds created each year by ongoing phosphate mining and beneficiation. Waste clay disposal represents one of the most challenging problems for the phosphate industry. Because of their colloidal nature and ultrafine size (91.5% by weight -325 mesh or 0.044 mm), the phosphatic clays are very stable in water suspensions and settle extremely slowly. It takes several years for waste clay slurry to thicken from about 3% to 20% solids by gravity settling. The most widely used method for disposing of phosphatic waste clays is to store them in clay ponds. This impounding approach is not preferred by the industry since a tremendous volume of water is tied up, large areas of land are occupied, potential dam failures may cause environmental disaster and public outrage, etc.
The purpose of this research project was to develop in the laboratory and demonstrate on pilot scale the feasibility of the Deep Cone Thickening (DCT) process to thicken phosphatic clay waste to a paste, without filtration, for mine backfilling or surface stacking. A 2 tph Deep Cone paste thickener from Dorr-Oliver Eimco was employed at the South Fort Meade mine of The Mosaic Company in central Florida for a pilot-scale study to investigate the effects of key operating parameters, including feed rate, sand addition rate, flocculant type and dosage, bed depth, etc. The pilot-scale field testing successfully demonstrated the simultaneous production of an underflow paste product and a clear overflow water stream. Typical overflow water recovery and underflow solids recovery were more than 88% and 98%, respectively, with a residence time of as low as 2 hours. The highest clay content and total solids content in the paste were more than 25% and 35%, respectively, with a clay/sand ratio of 2:1.

vi
ACKNOWLEDGMENTS
The authors would like to acknowledge the financial support of the Florida Institute of Phosphate Research (FIPR). Special thanks are given to Dorr-Oliver Eimco Process Equipment Company, The Mosaic Company, CF Industries, Ciba Specialty Chemicals and Beijing Hengju Oilfield Chemical Company for supplying the Deep Cone Paste Thickening System, phosphate clay slurry and chemicals.
vii
TABLE OF CONTENTS PERSPECTIVE ................................................................................................................. iii ABSTRACT ......................................................................................................................... v ACKNOWLEDGMENTS ................................................................................................. vi EXECUTIVE SUMMARY ................................................................................................. 1 Phosphatic Clay and Sand Acquisition and Characterization .................................. 1 Flocculant Acquisition and Preparation ................................................................... 1 Effect of Flocculants on Phosphatic Clay Flocculation ........................................... 2 Flocculation Testing with Addition of Sand ............................................................ 2 Effect of Slurry pH on Phosphatic Clay Flocculation ............................................. 2 Effect of Cations on Flocculation Characteristics ................................................... 3 Zeta Potential Measurement .................................................................................... 3 Rheologic Characterization ...................................................................................... 3 Slump Test ............................................................................................................... 4 Pilot-Scale DCT Demonstration .............................................................................. 4 INTRODUCTION ............................................................................................................... 5 TECHNICAL DISCUSSION .............................................................................................. 7 Paste Rheology ........................................................................................................ 8 Yield Stress .............................................................................................................. 9 Process Parameters ................................................................................................ 10 Flocculation ............................................................................................... 10 Yield Stress Curve ..................................................................................... 11 Bed Depth .................................................................................................. 11 Paste Discharge ...................................................................................................... 12 Tank Geometry .......................................................................................... 12 Rake Mechanism ........................................................................................ 14 PROPOSED APPROACH ................................................................................................. 15 PROCESS ADVANTAGES AND BENEFITS ................................................................ 17 OBJECTIVES .................................................................................................................... 19 RESULTS AND DISCUSSION ........................................................................................ 21 Phosphatic Clay and Sand Acquisition and Characterization ................................ 21 Flocculant Acquisition and Preparation ................................................................. 24
viii
TABLE OF CONTENTS (CONT.) Effects of Flocculants on Phosphatic Clay Flocculation ....................................... 24 Effects of Anionic Flocculants .................................................................. 24 Effects of DPW Flocculants .......................................................... 24 Effects of Magnafloc Flocculants .................................................. 30 Effects of Hengfloc Flocculants..................................................... 34 Effects of Cationic and Anionic Flocculants ............................................. 39 Effects of FLOPAM FO 4650 SH and Magnafloc 5250 ............... 39 Effects of FLCO CS 653 and Magnafloc 5250 .............................. 44 Effects of Nonionic Hengflocs................................................................... 49 Effect of Initial Polymer Concentration on Clay Flocculation .............................. 54 Flocculation Testing with Addition of Sand .......................................................... 56 Effect of Slurry pH on Flocculation Testing ......................................................... 65 Effect of Flocculant Addition Steps on Clay Flocculation .................................... 71 Zeta Potential Measurement .................................................................................. 79 Effect of Cations on Flocculation Characteristics ................................................. 81 Fundamental Paste Characterization ...................................................................... 89 Effect of Temperature on Yield Stress ...................................................... 94 Effect of pH on Yield Stress ...................................................................... 94 Rheologic Characterization .................................................................................... 96 Effect of Rotation Time on Viscosity ........................................................ 97 Effect of Spindle Rotation Speed on Viscosity ....................................... 102 Slump Test ........................................................................................................... 105 Modifier Screening Test ...................................................................................... 110 Pilot-Scale DCT System ...................................................................................... 112 Clay and Sand Samples ........................................................................................ 118 Initial Testing of the DCT .................................................................................... 120 Effects of Process Parameters .............................................................................. 126 Effect of Sand Addition Dosage .............................................................. 126 Effect of Solids Retention Time .............................................................. 127 Effect of Total Flocculant Dosage ........................................................... 128 Highest Paste Solids Content from the DCT ....................................................... 129

ix
TABLE OF CONTENTS (CONT.) Material Balance in the DCT Process .................................................................. 133 Preliminary Economic Analysis .......................................................................... 133 CONCLUSIONS ............................................................................................................. 135 REFERENCES ................................................................................................................ 139 FOR ADDITIONAL READING ..................................................................................... 143
xi
LIST OF FIGURES Figure Page 1. Typical Arrangement of the Eimco Deep Cone Thickener ............................. 7 2. Flowsheet for Surface Stacking of Tailings Using a Paste Thickener ................ 8 3. A Mineral Tailings Paste ..................................................................................... 9 4. Typical Yield Stress Curve ............................................................................... 10 5. E-DUC® Feedwell System ................................................................................ 11 6. Dependence of Thickener Unit Area for a Constant Underflow Solids % on Mud Bed Depth ............................................................................................ 12 7. 12 m Diameter Eimco Deep Cone Paste Thickeners ..................................... 14 8. CILAS 1064 Particle Size Analyzer ................................................................. 21 9. Data Collection System for the CILAS 1064 Particle Size Analyzer ............... 22 10. Cumulative Weight Percent vs. Particle Size for Phosphatic Clay Slurry ................................................................................................................. 22 11. Cumulative Weight Percent vs. Particle Size for Sand Sample ........................ 23 12. Schematic of the Settlement Cylinder ............................................................... 25 13. Effect of DPW Flocculant Dosage on Phosphatic Clay Settling Rate .............. 27 14. Effect of DPW Flocculant Dosage on Phosphatic Clay Underflow Compaction ....................................................................................................... 28 15. Micro 100 Turbidimeter .................................................................................... 29 16. Effects of DPW Flocculant Dosage on Phosphatic Clay Turbidity .................. 30 17. Effects of Magnafloc Dosage on Phosphatic Clay Settling Rate ...................... 32 18. Effects of Magnafloc Dosage on Phosphatic Clay Underflow Compaction ....................................................................................................... 33 19. Effects of Magnafloc Dosage on Phosphatic Clay Turbidity ........................... 34 20. Effects of Flocculant Dosage on Phosphatic Clay Settling Rate ...................... 36 21. Effects of Flocculant Dosage on Phosphatic Clay Underflow Compaction ....................................................................................................... 37 22. Effects of Hengfloc Dosage on Phosphatic Clay Turbidity .............................. 38 23. Effect of Flocculants on Phosphatic Clay Settling Rate ................................... 41 24. Effect of Flocculants on Phosphatic Clay Supernatant Turbidity ..................... 42 25. Effect of Flocculants on Underflow Solids Concentration ............................... 43 26. Effect of Flocculants on Water Content of Wet Clay Cake .............................. 44 27. Effect of Flocculants on Phosphatic Clay Settling Rate ................................... 46 28. Effect of Flocculants on Phosphatic Clay Supernatant Turbidity ..................... 47 29. Effect of Flocculants on Underflow Solids Concentration ............................... 48 30. Effect of Flocculants on Water Content of Wet Clay Cake .............................. 49 31. Effect of Flocculants on Phosphatic Clay Settling Rate ................................... 51 32. Effect of Flocculants on Phosphatic Clay Supernatant Turbidity ..................... 52 33. Effect of Flocculants on Underflow Solids Concentration ............................... 53 34. Effect of Flocculants on Water Content of Concentrated Clay ........................ 54 35. Flocculant Consumption for Flocculation of Phosphatic Clay as a Function of Initial Concentration of Flocculant ................................................ 56
xii
LIST OF FIGURES (CONT.) Figure Page 36. Settling Rate of Flocculated Phosphatic Clay as a Function of Sand Content .............................................................................................................. 58 37. Settling Flux of Flocculated Phosphatic Clay as a Function of Sand Content .............................................................................................................. 59 38. Clay Solids Content in Thickened Product as a Function of Sand Content .............................................................................................................. 61 39. Turbidity of Flocculated Phosphatic Clay Slime as a Function of Sand Content .............................................................................................................. 62 40. Filtration Time of Flocculated Phosphatic Clay Slime as a Function of Sand Content ..................................................................................................... 64 41. Water Content of Wet Clay Cake as a Function of Sand Content .................... 65 42. Settling Rate of Flocculated Phosphatic Clay as a Function of Slurry pH ....... 67 43. Clay Solids Content in Thickened Product as a Function of Slurry pH ........... 68 44. Turbidity of Phosphatic Clay Slime as a Function of Slurry pH ...................... 69 45. Filtration Time of Flocculated Phosphatic Clay Slime as a Function of Slurry pH ...................................................................................................... 70 46. Water Content of Wet Clay Cake as a Function of Slurry pH .......................... 71 47. Settling Rate of Flocculated Phosphatic Clay as a Function of Flocculant Addition Steps ................................................................................. 73 48. Clay Solids Content in Thickened Product as a Function of Flocculant Addition Steps ................................................................................................... 74 49. Turbidity of Flocculated Clay Slime as a Function of Flocculant Addition Steps ................................................................................................... 75 50. Settling Rate of Flocculated Phosphatic Clay as a Function of Flocculant Addition Steps with 5% Sand ......................................................... 77 51. Clay Solids Content in Thickened Product as a Function of Flocculant Addition Steps with 5% Sand ........................................................................... 78 52. Turbidity of Flocculated Phosphatic Clay Slime as a Function of Flocculant Addition Steps with 5% Sand ......................................................... 79 53. Zeta-Meter 3.0 ................................................................................................... 80 54. Zeta Potential of Phosphatic Clay Solids as a Function of pH with KCl, CaCl2, or AlCl3 ......................................................................................... 81 55. Effects of KCl, CaCl2, and AlCl3 Dosage on Flocculated Phosphatic Clay Settling Rate ............................................................................................. 84 56. Effects of KCl, CaCl2, and AlCl3 Dosage on Clay Solids Content in Thickened Product ............................................................................................ 86 57. Effects of KCl, CaCl2, and AlCl3 Dosage on Turbidity of Flocculated Phosphatic Clay Slime ...................................................................................... 87 58. Effects of KCl, CaCl2, and AlCl3 Dosage on Filtration Time of Thickened Phosphatic Clay Product ................................................................. 88

xiii
LIST OF FIGURES (CONT.) Figure Page 59. Effects of KCl, CaCl2, and AlCl3 Dosage on Water Content in Wet Clay Cake .......................................................................................................... 89 60. Effect of Solids Percentage on Yield Stress ...................................................... 92 61. Comparison of Clay Underflow Compaction at Different Solids Percentages: (a) 50% Solids, (b) 40% Solids, (c) 30% Solids, and (d) 20% Solids ................................................................................................... 93 62. Effect of Temperature on Yield Stress at 20% Solids Percentage .................... 95 63. Effect of pH on Yield Stress at 20% Solids Percentage ................................... 96 64. Effect of Rotation Time on Viscosity without Chemicals ................................ 98 65. Effect of Rotation Time on Viscosity with 15 ppm Magnafloc 5250 ............... 99 66. Effect of Rotation Time on Viscosity at 5% Sand Addition with 15 ppm Magnafloc 5250 and DP 203 ............................................................. 100 67. Comparison of the Effect of Rotation Time on Viscosity with and without Chemicals ........................................................................................... 101 68. Effect of Rotation Speed on Viscosity without Chemicals ............................. 103 69. Effect of Rotation Speed on Viscosity with 15 ppm Magnafloc 5250 ........... 104 70. Effect of Rotation Speed on Viscosity at 5% Sand Addition with 15 ppm Magnafloc 5250 and DP 203 ............................................................. 105 71. Schematic Diagram of the Slump Test ........................................................... 107 72. Effect of Solids Concentration on Clay Paste Slope Percentage .................... 108 73. Effect of Solids Concentration on Yield Stress .............................................. 110 74. Effect of Solids Concentration on Paste Yield Stress with Different Rheology Modifiers ........................................................................................ 112 75. Illustration of DCT Testing System Used at South Fort Meade Mine ............ 113 76. DCT System Control Scheme ......................................................................... 114 77. DCT Testing System (Part I) .......................................................................... 114 78. DCT Testing System (Part II) ......................................................................... 115 79. Illustration of Working Principle of DCT Apparatus ..................................... 116 80. DCT Installation (Part I) ................................................................................. 116 81. DCT Installation (Part II) ................................................................................ 117 82. Size Distribution of Three Clay Slurry Samples Used in DCT Testing ......... 119 83. Size Distribution of Sand Tailing Used in DCT Testing ................................ 120 84. Illustration of On-Site Flocculation Tests: (a) Stirring and Mixing Slurry; (b) Mixing Slurry with Flocculant; (c) Clay Settling; (d) After Settling for About Two Minutes ............................................................ 121 85. Clay Slurry Settling Rates as a Function of Flocculant Dosage ..................... 122 86. Flocculation Inside Conditioning Tank Beside DCT Where Hengfloc 80607 Was Added ........................................................................................... 122 87. DCT Overflow ................................................................................................ 123 88. Effects of Sand Addition on Clay Consolidation: No Sand (Left); Sand Added (Right) ........................................................................................ 123
xiv
LIST OF FIGURES (CONT.) Figure Page 89. Paste from Test 19 with 19.79% Total Solids and 15.87% Clay Solids ......... 126 90. Dependence of Total Solids % and Clay Solids % on Solids Retention Time (Anionic Floc: 0.32 kg/t; Cationic Floc 0.23 kg/t; Clay:Sand = 2.1; Bed Height: 2m; Feed Slurry: 30 gpm) .................................................... 127 91. Dependence of Total Solids % and Clay Solids % on Solids Retention Time (Anionic Floc 0.45 kg/t; Cationic Floc 0.45 kg/t; Clay:Sand = 2:1; Bed Height: 2m; Feed Slurry: 30 gpm) ................................................... 128 92. Effects of Flocculant Dosage on Paste Solids Content (Clay:Sand = 2:1; Bed Height: 2m; Feed Slurry 30 gpm; Residence Time: 2 h) ................. 129 93. Paste Products with 30.08% Solids (Top) and 35.44% Solids (Bottom) .......................................................................................................... 130 94. Paste Products with 27.28% Solids (Top) and 25.33% Solids (Bottom) .......................................................................................................... 131 95. Paste Slump Tests for Determining Yield Stress of Paste .............................. 132 96. Paste Storage Pond Near the End of Field Testing Period .............................. 132
1
EXECUTIVE SUMMARY
The Florida phosphate industry produces more than 80% of the United States phosphate output and generates revenue in billions of dollars. However, phosphate mining and beneficiation produces huge amounts of phosphate clays. About 100,000 tons of waste clays are currently produced each day by phosphate mines in Florida. There are more than 85,000 acres of phosphatic clay ponds and clay-filled mine cuts in central Florida, with approximately 5,000 acres of additional ponds created each year by ongoing phosphate mining and beneficiation.
Waste clay disposal represents one of the most challenging problems for the phosphate industry. Because of their colloidal nature and ultrafine size (91.5% by weight -325 mesh or 0.044 mm), the phosphatic clays are very stable in water suspensions and settle extremely slowly. It takes several years for waste clay slurry to thicken from about 3% to 20% solids by gravity settling. The most widely used method for disposing of phosphatic waste clays is to store them in the clay ponds. This impounding approach is not preferred by the industry since a tremendous volume of water is tied up, large areas of land are occupied, potential dam failures may cause environmental disaster and public outrage, etc. A more efficient and cost-effective dewatering/consolidation process for phosphatic clay is of great interest to the Florida phosphate industry.
This research project was aimed at developing an efficient, practical and cost-effective technique for disposal of Florida phosphate clay tailings. The process was designed specifically to thicken tailings to a paste, without filtration, for mine backfilling or surface stacking. The approach for producing paste from phosphate clay is to accomplish the concentration to the high densities and characteristics suitable for surface or mine disposal in the Eimco Deep Cone Paste Thickener, a uniquely designed paste thickener. The process was investigated in laboratory testing and demonstrated in Proof of Concept (POC) pilot-scale testing. A 2 tph Deep Cone thickener was employed for pilot-scale demonstration to quantify the effects of key design and operating parameters on the performance of the thickener for thickening Florida phosphate clay to a paste in a period of several hours. The research project involved the following major tasks: PHOSPHATIC CLAY AND SAND ACQUISITION AND CHARACTERIZATION
Phosphate clay slurry and sand sample were acquired from Mosaic. A representative sample was taken for solids percentage and size distribution analysis. Chemical composition analysis (P2O5, MgO, CaO, SiO2, etc.) was performed with each of the size fractions. FLOCCULANT ACQUISITION AND PREPARATION
Seven Ciba DP flocculants, coagulants and rheology modifiers and eight Ciba conventional Magnafloc flocculants were acquired from Ciba Specialty Chemicals.
2
Seven Hengfloc polymers, including anionic and nonionic flocculants, were acquired from Beijing Hengju Oilfield Chemical Company. Two cationic polymers were acquired from Zinkan Enterprises Inc. Aqueous solubility of the polymers was increased by incorporating with acetone. A concentrated polymer solution of 0.5% was prepared by dissolving 0.5 g of dry polymer in 5 ml acetone and 95 ml water and then stirring for one hour. The stock solution was used within ten days of preparation. A fresh working polymer solution of 0.05% was prepared every three days by dilution of concentrated stock solution. EFFECTS OF FLOCCULANTS ON PHOSPHATIC CLAY FLOCCULATION
Identification of a high-efficiency synthetic polymeric flocculant and optimum dosage is important for successful operation of Deep Cone Paste Thickeners. The effects of different flocculants including anionic, cationic, and nonionic polymers on phosphatic cay flocculation performance were evaluated. Flocculation testing was carried out by conducting bench-scale comparison tests in 500 ml cylinders. Flocculation effects were quantified by measuring clay settling rate, supernatant turbidity, clay solids content in the thickened product, and water content of wet clay cake. FLOCCULATION TESTING WITH ADDITION OF SAND
The disposal problem of phosphate slime is associated with the very large volume and the poor dewatering characteristics of the slimes. The slow dewatering behavior delays the reclamation of the affected land for many years. To eliminate the above problem, slimes must be concentrated to an average density of 30 weight percent solids. At present, average values of around 20 weight percent solids are achieved during the time it takes a disposal area to fill (2-3 years, typically). Among engineering studies, some approaches involve the modification of slimes. Several involve adding a polymeric flocculant; others involve intermixing sand with the slime, with or without flocculant present. These methods improved the early stage of dewatering, as well as improving the final effective slime volumes in some cases. Sand particles from phosphate flotation were added to promote flocculation and increase clay consolidation. Experimental results indicated that the addition of sand particles to the phosphatic clay slime promoted flocculation and created denser flocs that settled faster. Therefore, less water was trapped in the flocs and clay consolidation was increased. EFFECT OF SLURRY pH ON PHOSPHATIC CLAY FLOCCULATION
The effects of slurry pH on phosphatic clay flocculation performance were investigated. Changes in the pH of slurry can contribute to changes in solution chemistry of different inorganic and organic species including the polymer, and in surface properties of solid materials. Therefore, the flocculation settling rate and other dewatering characteristics were changed by changing the slime pH. Different pH values including acidic, neutral, and alkaline conditions were tested. Alkaline solution was

3
beneficial to increase the slurry settling rate and clay solids content in thickened product. This is because Mg2+ and Ca2+ easily form the precipitates of Mg(OH)2 and Ca(OH)2 in alkaline conditions. Such precipitates can act as coagulating agents. EFFECT OF CATIONS ON FLOCCULATION CHARACTERISTICS
It is well known that cations (e.g., K+, Ca2+ and Al3+) have significant effects on dewatering and consolidation efficiency of clay via neutralizing clay surface charge and promoting face-face aggregation of clay platelets. To investigate impacts of cations on paste characteristics, hydroxide salts were added to the slurry at dosages of 0, 0.25×10⁻³, 0.5×10⁻³, 10-3, 0.5×10⁻², and 10-2 M prior to flocculant addition. The effects of hydroxides on flocculation performance were studied using DPW-1-1355 as a flocculant. K+ showed good performance to improve the flocculation response. This may have occurred for two reasons. First, K+ neutralized clay surface charge and improved the flocculant adsorption on the phosphatic clay surface. Second, the addition of KOH increased slurry pH, which was beneficial to flocculation performance. At lower concentrations, Ca2+ and Al3+ improved the flocculation process by neutralizing clay surface charge, but they reduced the clay settling rate at higher dosages. This may be due to the fact that different forms of CaOH+, Al(OH)2+, and +
2)OH(Al adsorbed on the polymer functional group to form different species. ZETA POTENTIAL MEASUREMENT
The surface charge on the clay particles plays an important role in flocculation performance. For the measurements of the zeta potential of phosphatic clay particles, the suspension was prepared by mixing 1.0 g of the phosphatic clay in 1000 mL of deionized water and was shaken vigorously to obtain a uniformed suspension. The pH adjustment for the suspension was achieved by the addition of NaOH or HCl solution and stirring for 1 minute. To determine the zeta potential of phosphatic clay particles in the presence of K+, Ca2+, or Al3+ ions, the predetermined amount of KCl, CaCl2, or AlCl3 solution was added and stirred for another 1 minute. It is clear that the clay particles have negatively charged surfaces above pH 2. The zeta potential curve for phosphatic clay monotonically decreased from 0 to -40 mV from pH 2 to pH 10. This can be attributed to the predominant oxygenic surface of phosphatic clay in the aqueous solution. RHEOLOGIC CHARACTERIZATION
After tailing paste was made in the thickener, it was important to ensure that the paste could be removed by the centrifugal pump from the thickener as the underflow. This can be determined by measuring both dynamic and static rheologic characteristics and comparing them to the database of operating thickeners. Rheologic characterization was performed using Cannon V-2000 II rotary viscometers at different solids concentrations. The effects of solids percentage, temperature, pH on clay yield stress were investigated. Experimental results indicated that the yield stress was much higher
4
with addition of Magnafloc 5250 than without addition of flocculant. This was because flocs were easily formed after the addition of flocculant, which increased the yield stress significantly. The yield stress decreased as temperature increased. Experimental results also suggested that the yield stress increased with increasing slurry pH. This was mainly because flocs were more readily formed in alkaline solutions than in natural and acidic solutions, which increased yield stress. SLUMP TEST
The slump test is used extensively by engineers to estimate the yield stress and viscosity of paste. The slump height measured via the slump test is generally used as the control parameter. The effects of solids concentration on paste slope percentage and paste yield stress were investigated under different conditions. Experimental results indicated that the slope percentage increased significantly with increasing solids percentage. The clay yield curve has the characteristic of an extremely rapid increase in yield stress for increasing higher solids concentrations. As the solids concentration increases, the yield stress increases and eventually the paste becomes, in essence, a solid. The rheology modifier DP 203 significantly reduced the slope percentage, which is helpful for clay transportation by pumping. PILOT-SCALE DCT DEMONSTRATION
A 2 tph (1.5 m in diameter) Deep Cone thickener (DCT) from Dorr-Oliver Eimco was employed at the South Fort Meade mine of The Mosaic Company in central Florida for a pilot-scale study to investigate the effects of key operating parameters, including feed rate, sand addition rate, flocculant dosage, bed depth, etc. The pilot-scale field testing successfully demonstrated the simultaneous production of an underflow paste product and a clear overflow water stream. Typical overflow water recovery and underflow solids recovery were more than 88% and 98%, respectively, with a residence time of about 2 hours. The highest clay content and total solids content in the paste were more than 25% and 35%, respectively, with a clay/sand ratio of 2:1. To treat 1800 tph phosphatic clay slurry, two 40 m diameter DCTs or one 50 m diameter DCT will be needed at a cost of $8 million or $6 million, respectively.
5
INTRODUCTION
Up to 85% of the United States phosphate output or 30% of the world’s phosphate production is provided by the Florida phosphate industry. Phosphate mining and beneficiation produces huge amounts of phosphate clays. Approximately one ton of clay mixture is generated for each ton of phosphate product. About 100,000 tons of waste clays are currently produced each day by phosphate mines in Florida. The flow rate of phosphatic clay waste ranges between 20,000 and 60,000 gpm for each phosphate mine. To accommodate the waste, large impoundments covering 400 to 800 acres, with dam heights ranging from 20 to 60 ft, are required (Bromwell 1982; Scheiner and Stanley 1996). When existing impoundments become filled with phosphate waste, new ones are built to keep phosphate companies operating. There are more than 85,000 acres of phosphatic clay ponds and clay-filled mine cuts in central Florida, with approximately 5,000 acres of additional ponds created each year by ongoing phosphate mining and beneficiation operations (Hardianto and Ericson 1994).
Waste clay treatment represents one of the most difficult disposal problems facing the phosphate industry. Because of their colloidal nature and ultrafine size (91.5% by weight, -325 mesh or 0.044 mm), the phosphatic clays are very stable in water suspensions and settle extremely slowly. As a result, it takes several years for waste clay slurry to thicken from about 3% to 20% solids by gravity settling. The most widely used method for disposing of phosphatic waste clays is to store them in clay ponds. This impounding approach creates several major problems: (1) large amounts of phosphate are discarded; (2) a tremendous volume of water is tied up; (3) large areas of land are occupied; and (4) potential dam failures may cause environmental disaster and public outrage.
To overcome the problems associated with phosphatic clay impounding, many mechanical, electrical, biological, and chemical processes have been tested. They include the use of enzymes and bacteria (Anazia and Misra 1989; Smith and others 1992), the addition of chemicals (Nair and Somasundaran 1986, Pearse and others 2001); coagulation and flocculation (Packham 1965; Deason 1980; Onoda and others 1980; Chamberlain and Ellwanger 1981; Clark 1982; Scheiner and others 1982; Scheiner and Smelley 1985, 1993; Brooks and Scheiner 1986; Concha and Bustos 1986; Dixon and Golden 1987; El-Shall and others 1989; El-Shall and McFarlin 1992; Scheiner and Stanley 1995; El-Shall 1996; Nguyen and Boger 1998); freezing (Stanczyk and others 1971; NTP Corporation 1983); mechanical dewatering (Freeman 1982; Laros 1990; Agerbaek and Keiding 1993); and thickening (Raden 1982; Ghalambor and others 1990; Hoff and Bunnaul 1992), etc. However, these clay disposal methods are not cost-effective in consolidating phosphatic clay waste.
The proposed research program was aimed at developing a cost-effective dewatering/consolidation process that is able to thicken the Florida phosphatic clay to a paste. The thickened product was in the form of paste rather than slurry and could be disposed of by mine backfilling or surface stacking instead of impounding. Paste contains much less water than slurry and paste stacks are more environmentally friendly than slurry ponds.
7
TECHNICAL DISCUSSION
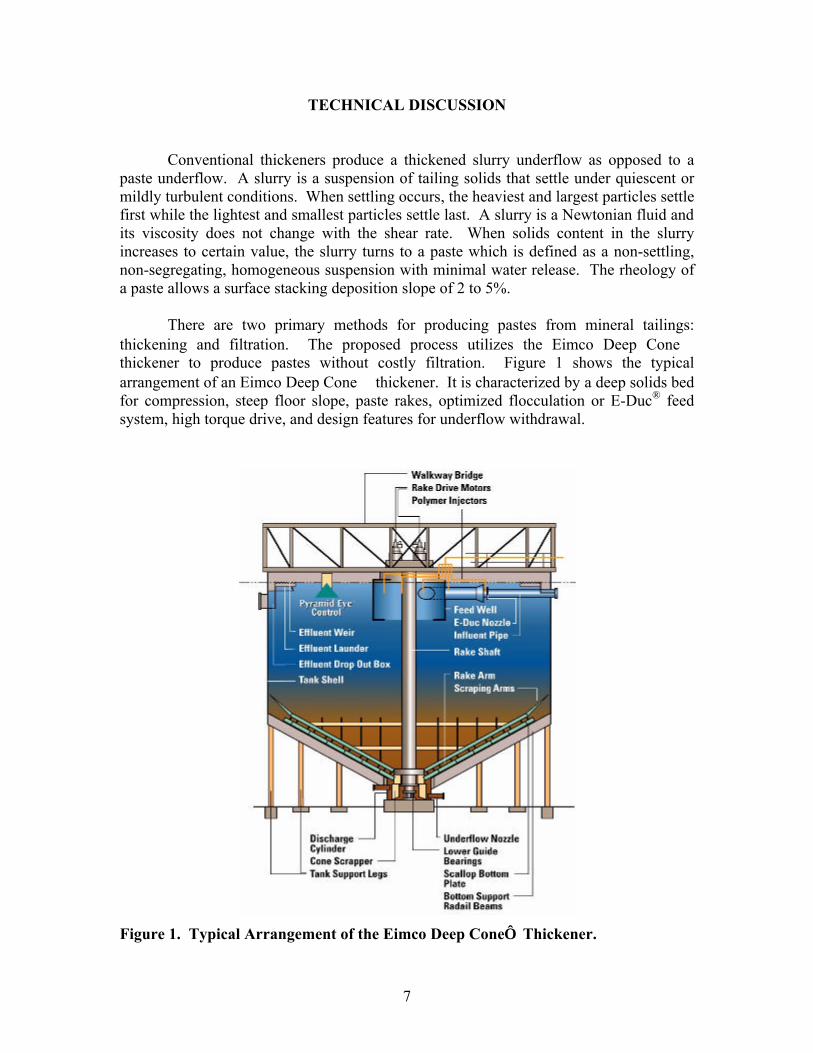
Conventional thickeners produce a thickened slurry underflow as opposed to a paste underflow. A slurry is a suspension of tailing solids that settle under quiescent or mildly turbulent conditions. When settling occurs, the heaviest and largest particles settle first while the lightest and smallest particles settle last. A slurry is a Newtonian fluid and its viscosity does not change with the shear rate. When solids content in the slurry increases to certain value, the slurry turns to a paste which is defined as a non-settling, non-segregating, homogeneous suspension with minimal water release. The rheology of a paste allows a surface stacking deposition slope of 2 to 5%.
There are two primary methods for producing pastes from mineral tailings: thickening and filtration. The proposed process utilizes the Eimco Deep Cone thickener to produce pastes without costly filtration. Figure 1 shows the typical arrangement of an Eimco Deep Cone thickener. It is characterized by a deep solids bed for compression, steep floor slope, paste rakes, optimized flocculation or E-Duc® feed system, high torque drive, and design features for underflow withdrawal. Figure 1. Typical Arrangement of the Eimco Deep Cone Thickener.

8
Figure 2 shows a typical flowsheet of a thickener producing paste for a surface stacking operation. The paste thickener receives a tailings feed and flocculants and settles the solids to a concentration that meets the requirements of the disposal site. Centrifugal pumps are used to remove the thickened solids from the thickener as underflow, while a positive displacement pump is used for transport of any distance beyond a few meters to the disposal site due to the high viscosity of the paste.
Figure 2. Flowsheet for Surface Stacking of Tailings Using a Paste Thickener.
The following technical discussion presents an overview of the most important design principles for a paste thickener. It is not intended to delve into the well known science of thickening which involves clarification, mass settling, and compression, but to provide some knowledge of unique geometry, characteristics, and operation performance of the paste thickener. PASTE RHEOLOGY
A paste does not obey the rules of flow for a Newtonian fluid and is therefore non-Newtonian. For many mineral beneficiation tailings pastes, viscosity changes with the shearing rate. These pastes are called shear thinning or shear thickening, depending on whether the viscosity decreases or increases with changing shear. Some pastes, referred to as thixotropic, exhibit the property of changing viscosity with time at a constant shear rate.
The non-Newtonian character creates a changing rheology since the pastes are exposed to different shearing rates and times during thickening, pumping, flowing in a pipeline, and deposition in the surface stack. As a result, the standard rules for fluid flow which engineers use to determine pipe diameters, pump sizes and slurry thickener sizes do not apply to pastes. The design and operation of a paste thickener requires new data

9
and experience not found in traditional references. The expertise is in the realm of the manufacturer, and much of this information is proprietary. YIELD STRESS
One of the defining characteristics of a paste is the increasingly solid-like behavior as the tailings become more concentrated. A typical mineral tailings paste is shown in Figure 3. Unlike a slurry, which is basically a liquid and will assume the shape of any container in which it is held, a paste will hold its shape to a degree determined primarily by the solids concentration. A pressure is required to make the paste flow. This pressure is a rheological term called yield stress which is a unique property of non-Newtonian fluids. It arises from the bond formation between fine particles through electrostatic and structural interactions. This bonding produces a continuous network that breaks only when a certain pressure is applied, which is the yield stress. The coarser particles are inhibited from settling by the fine particle network acting like a net to hold solids in suspension. This phenomenon is responsible for the non-settling and non-segregation behavior of pastes. Shearing introduces energy that disrupts the bonding between fine particles, causing a change in viscosity.
Figure 3. A Mineral Tailings Paste.
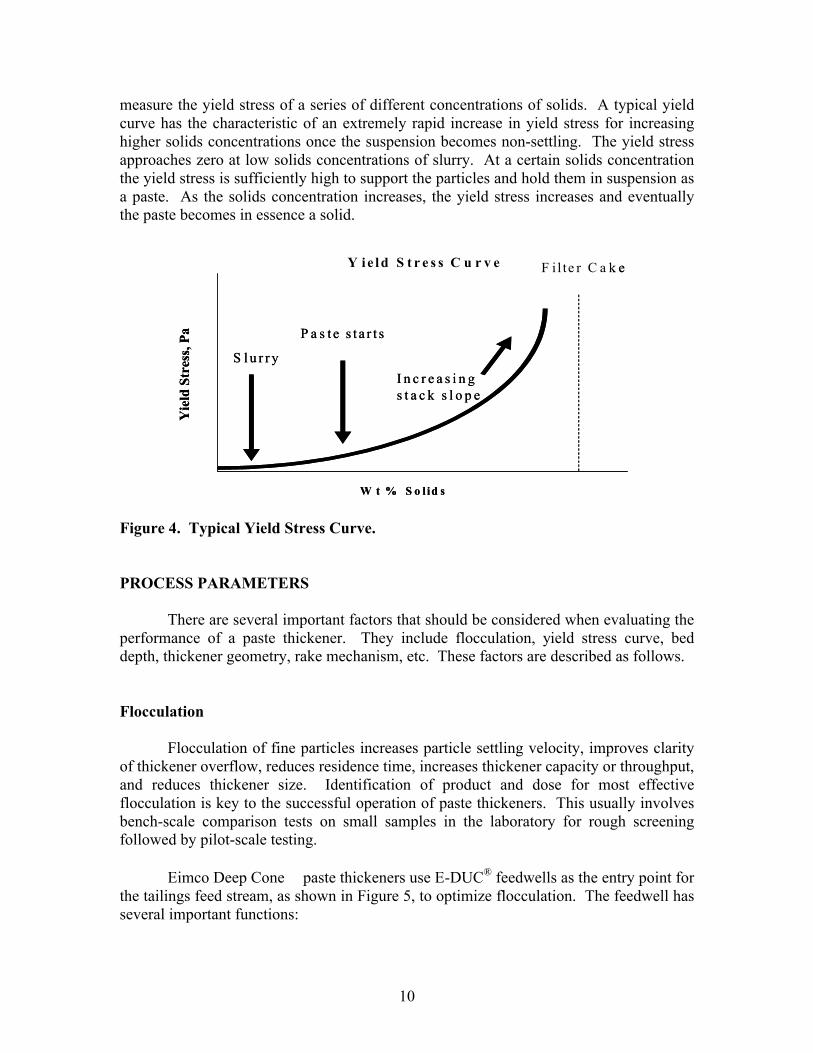
Yield stress is dependent on many parameters such as particle size, temperature, mineralogy, pH, and solids concentration. The most important data required for the paste thickener designer is the yield stress as a function of solids concentration, i.e., a yield stress curve as shown in Figure 4. The curve is obtained by using a viscometer to
10
measure the yield stress of a series of different concentrations of solids. A typical yield curve has the characteristic of an extremely rapid increase in yield stress for increasing higher solids concentrations once the suspension becomes non-settling. The yield stress approaches zero at low solids concentrations of slurry. At a certain solids concentration the yield stress is sufficiently high to support the particles and hold them in suspension as a paste. As the solids concentration increases, the yield stress increases and eventually the paste becomes in essence a solid.
Figure 4. Typical Yield Stress Curve. PROCESS PARAMETERS
There are several important factors that should be considered when evaluating the performance of a paste thickener. They include flocculation, yield stress curve, bed depth, thickener geometry, rake mechanism, etc. These factors are described as follows. Flocculation
Flocculation of fine particles increases particle settling velocity, improves clarity of thickener overflow, reduces residence time, increases thickener capacity or throughput, and reduces thickener size. Identification of product and dose for most effective flocculation is key to the successful operation of paste thickeners. This usually involves bench-scale comparison tests on small samples in the laboratory for rough screening followed by pilot-scale testing.
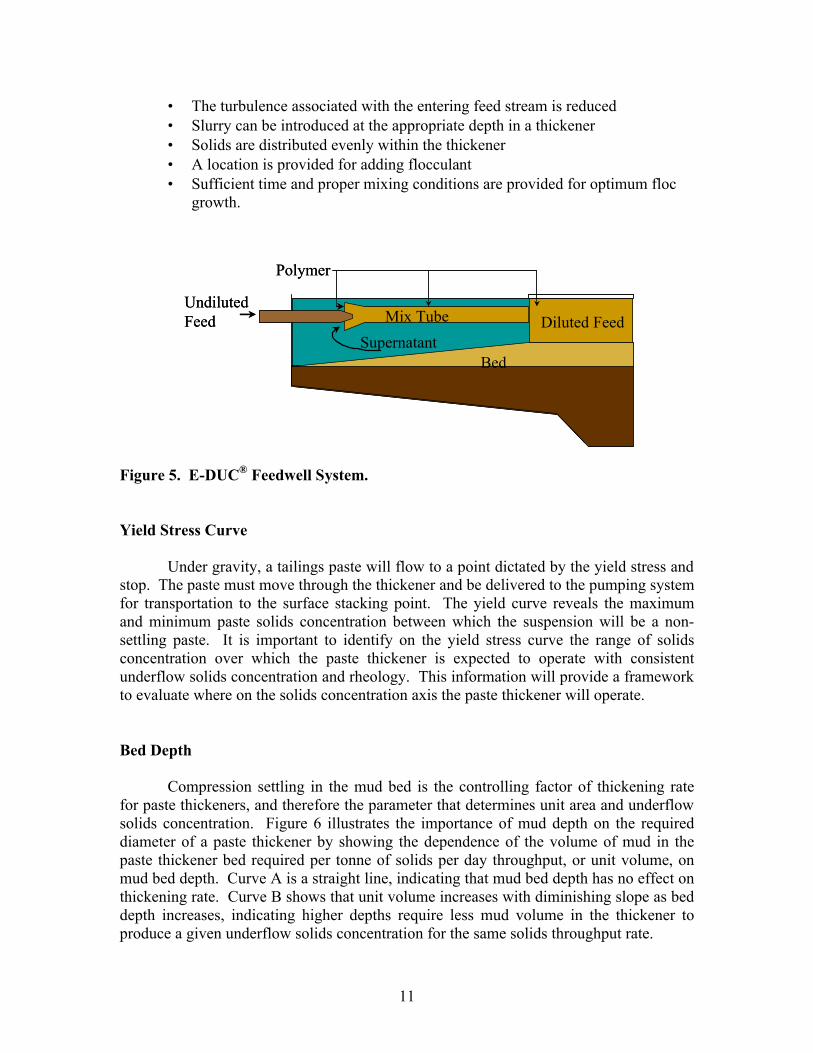
Eimco Deep Cone paste thickeners use E-DUC® feedwells as the entry point for the tailings feed stream, as shown in Figure 5, to optimize flocculation. The feedwell has several important functions:
Y i e l d S t r e s s C u r v e
W t % S o l id s
Yie
ld S
tres
s, P
a
F i l te r C a k e
S l u r r y
P a s t e s t a r t s
I n c r e a s i n g s t a c k s l o p e
Y i e l d S t r e s s C u r v e
W t % S o l id s
Yie
ld S
tres
s, P
a
F i l te r C a k e
S l u r r y
P a s t e s t a r t s
I n c r e a s i n g s t a c k s l o p e
11
• The turbulence associated with the entering feed stream is reduced • Slurry can be introduced at the appropriate depth in a thickener • Solids are distributed evenly within the thickener • A location is provided for adding flocculant • Sufficient time and proper mixing conditions are provided for optimum floc
growth.
Figure 5. E-DUC® Feedwell System. Yield Stress Curve
Under gravity, a tailings paste will flow to a point dictated by the yield stress and stop. The paste must move through the thickener and be delivered to the pumping system for transportation to the surface stacking point. The yield curve reveals the maximum and minimum paste solids concentration between which the suspension will be a non-settling paste. It is important to identify on the yield stress curve the range of solids concentration over which the paste thickener is expected to operate with consistent underflow solids concentration and rheology. This information will provide a framework to evaluate where on the solids concentration axis the paste thickener will operate. Bed Depth
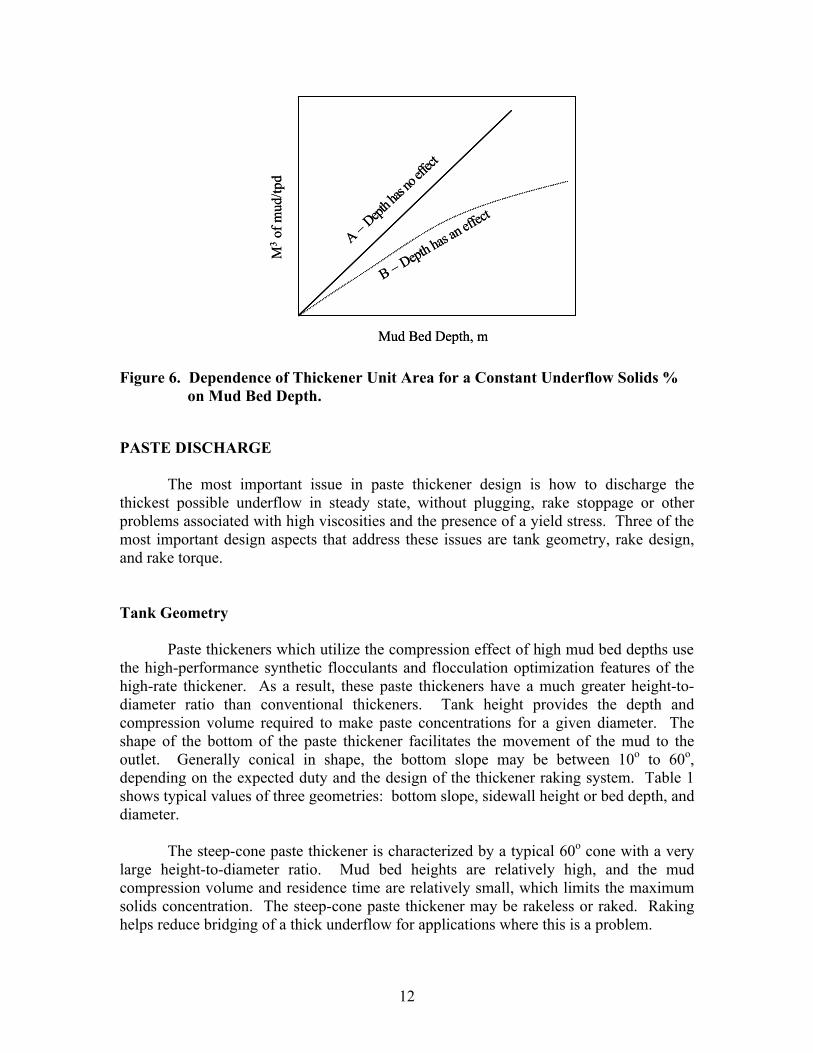
Compression settling in the mud bed is the controlling factor of thickening rate for paste thickeners, and therefore the parameter that determines unit area and underflow solids concentration. Figure 6 illustrates the importance of mud depth on the required diameter of a paste thickener by showing the dependence of the volume of mud in the paste thickener bed required per tonne of solids per day throughput, or unit volume, on mud bed depth. Curve A is a straight line, indicating that mud bed depth has no effect on thickening rate. Curve B shows that unit volume increases with diminishing slope as bed depth increases, indicating higher depths require less mud volume in the thickener to produce a given underflow solids concentration for the same solids throughput rate.
Undiluted Feed Diluted Feed
Polymer
Mix Tube
BedSupernatant
Undiluted Feed Diluted Feed
Polymer
Mix Tube
BedSupernatant
12
Figure 6. Dependence of Thickener Unit Area for a Constant Underflow Solids %
on Mud Bed Depth. PASTE DISCHARGE
The most important issue in paste thickener design is how to discharge the thickest possible underflow in steady state, without plugging, rake stoppage or other problems associated with high viscosities and the presence of a yield stress. Three of the most important design aspects that address these issues are tank geometry, rake design, and rake torque. Tank Geometry
Paste thickeners which utilize the compression effect of high mud bed depths use the high-performance synthetic flocculants and flocculation optimization features of the high-rate thickener. As a result, these paste thickeners have a much greater height-to-diameter ratio than conventional thickeners. Tank height provides the depth and compression volume required to make paste concentrations for a given diameter. The shape of the bottom of the paste thickener facilitates the movement of the mud to the outlet. Generally conical in shape, the bottom slope may be between 10o to 60o, depending on the expected duty and the design of the thickener raking system. Table 1 shows typical values of three geometries: bottom slope, sidewall height or bed depth, and diameter.
The steep-cone paste thickener is characterized by a typical 60o cone with a very large height-to-diameter ratio. Mud bed heights are relatively high, and the mud compression volume and residence time are relatively small, which limits the maximum solids concentration. The steep-cone paste thickener may be rakeless or raked. Raking helps reduce bridging of a thick underflow for applications where this is a problem.
B – Depth has an eff
ect
A –Dept
h has
no eff
ect
Mud Bed Depth, m
M3
of m
ud/tp
dB – Depth has a
n effect
A –Dept
h has
no eff
ect
Mud Bed Depth, m
M3
of m
ud/tp
d

13
Table 1. Typical Thickener Geometry.
Geometry
Typical Bed
Depth
Mud Bed Residence
Time
Approx Max
Diameter
K Factor
Discharge Paste
Relative Underflow % Solids
Conventional
or high rate slurry thickener
1 m Medium 120 m <25 No 1 = lowest
Unraked, steep
cone (60o) paste thickener
2-6 m Low 12 m - Yes 2
Raked, steep
cone (60o) paste thickener
2-6 m Low 12 m <25 Yes 3
Shallow cone
(~15o) paste thickener
3 m High 90 m >100 Yes 4
Eimco Deep Cone paste thickener (30-45o)
8 m High 30 m >150 Yes 5
The Eimco Deep Cone Paste Thickener to be employed in the proposed research was developed recently. It is raked and has a height-to-diameter ratio typically between one and two, with a 30-45o cone. The geometry provides a high mud compression volume and high depth and offers the potential of reaching maximum underflow solids concentrations well into the paste range. The combination of high mud-bed heights and long residence times allows the Eimco Deep Cone Paste Thickener to produce underflows in the paste range that approach the limit of flowability. Unit areas can be several times smaller than other thickeners. For example, tests on Chilean copper tails produced ranges of 60-65% solids at 25-35 t/d/m2 for the Eimco Deep Cone Paste Thickener as compared to 50-60% at 15-30 t/d/m2 for the shallow core paste thickener and 45-60% at 3-10 t/d/m2 for the high rate slurry thickener. The Eimco Deep Cone Paste Thickeners have been successfully applied to thickening bauxite (red mud), copper, iron, lead/zinc, platinum tailings, etc. to a paste for stacking disposal. These thickeners are typically elevated and diameters up to 20 m have been installed. Maximum diameter approaches 30 m. Figure 7 shows a group of 12 m diameter deep-cone paste thickeners.

14
Figure 7. 12 m Diameter Eimco Deep Cone Paste Thickeners. Rake Mechanism
The main purpose of the rake mechanism is to assist in moving the settled solids to the point of discharge. Rakes also aid in dewatering the mud by mechanisms not completely understood, but that involve compression and shearing of the mud. Rake design requires broad experience and proprietary technology. In paste thickeners, the rake design depends on the thickener geometry, the rheology of the paste, and the solids throughput rate. Sufficient torque must also be available in the rake drive of the thickener to push through the settling slurry and move settled solids to the outlet. Particle size distribution is particularly important in selecting torque. For slurry thickeners, coarse, granular particles settle rapidly and reach terminal solids concentrations, requiring relatively high torque in the rake; fine particles settle slowly and require less torque. Paste thickeners present a different environment to the raking system than the slurry thickener. Because of the non-settling nature of a paste thickener mud bed, coarse and fine particles tend to be non-segregating and the rules for slurry thickeners do not necessarily apply. For example, there is no limit on fines content. Because coarse particles are suspended to a significant degree by the fine particle bonding network, the coarse limitations may not apply. Other factors, such as geometry, yield stress, and the effects of shear thinning and/or thixotropy become more important. Much higher torques are needed because of the high solids concentrations and deep mud bed depths.
15
PROPOSED APPROACH
Impoundment is the current practice of phosphate clay disposal in Florida. The proposed project is aimed at developing a better alternative to traditional impoundment, which is to produce paste from clay tailings for mine backfill or surface stacking. Tailings pastes are commonly produced by concentrating the plant tails stream in a conventional thickener and filtering the underflow for final disposal on the surface or in the mine. The proposed approach for producing paste from phosphate clay is to accomplish the concentration to the high densities and characteristics suitable for surface or mine disposal in a uniquely designed thickener. The Eimco Deep Cone Paste Thickener will be investigated for producing paste for mine backfill or surface stacking, without a filter, using the phosphatic clay flow from the phosphate beneficiation plant. Clay paste can be used to reclaim thousands of acres of mined land as citrus groves, forested wetlands, sawgrass marshes, lakes, pasture, and crop land.

17
PROCESS ADVANTAGES AND BENEFITS
The proposed paste production process for the Florida phosphate clay tailings has many advantages and benefits over existing clay disposal processes:
• Tailings can be disposed of by surface stacking or mine backfilling rather than
impounding, which is not very reliable and may cause serious environmental problems if the dam collapses.
• The paste is low in water content and homogeneous in particle size distribution.
• Particle interaction of paste suspensions results in the release of a small quantity of free water.
• Much less land is needed for tailings disposal. • Water can be quickly recovered from tailings and recycled to the beneficiation
plant, reducing the need for fresh water. The residence or retention time of particles in the thickener is several hours rather than months or years in the clay pond.
• The paste thickener results in lower operating costs and higher-quality backfill.
19
OBJECTIVES
The overall objective of the proposed research program was to develop the Eimco Deep Cone Paste Thickening process for cost-effective disposal of Florida phosphatic clay. A 2 tph Deep Cone thickener was employed for pilot-scale testing to quantify the effects of key design and operating parameters on the performance of the thickener for thickening Florida phosphate clay to a paste. Specific objectives were:
• To investigate yield stress as a function of weight % solids to determine optimum paste thickener operating range.
• To performing slump tests to study effects of different flocculants on paste characteristics and optimize flocculant dosage.
• To investigate the effects of rheology modifiers on the pumpability of high-solids clay paste.
• Installation, testing, and evaluation of a pilot-scale Deep Cone thickener for making phosphate clay paste.

21
RESULTS AND DISCUSSION PHOSPHATIC CLAY AND SAND ACQUISITION AND CHARACTERIZATION
The objective of this task was to acquire and characterize phosphate clay and sand samples to be disposed of using the proposed process. The samples were used to perform laboratory testing to produce preliminary data that provided guidelines for the POC scale testing. Five 55-gallon drums of phosphatic clay sample and two buckets of sand tailings were acquired from The Mosaic Company. The slurry sample was shipped in the drum with a plastic liner to avoid contamination from rust. The phosphatic clay sample was thoroughly mixed and split into small lots for storage. A representative sample was taken for solids percentage and size distribution analysis.
A CILAS 1064 Particle Size Analyzer was used for phosphatic clay size analysis, as shown in Figure 8. Figure 9 illustrates the data collection system for this analyzer. Size analysis results are shown in Figure 10. It can be seen that the phosphatic clay diameter is 1.73 µm at 10% passing, 8.96 µm at 50%, and 19.95 µm at 90%.
The sand sample was wet-screened into ten different size fractions for size distribution analysis, and the results are shown in Table 2. The cumulative weight percent vs. particle size for the sand sample is shown in Figure 11. It is clear that the particles are quite evenly distributed in all size fractions except the +20 mesh and -200 mesh. Few particles are larger than 20 mesh or smaller than 200 mesh.
Figure 8. CILAS 1064 Particle Size Analyzer.

22
Figure 9. Data Collection System for the CILAS 1064 Particle Size Analyzer.
Figure 10. Cumulative Weight Percent vs. Particle Size for Phosphatic Clay Slurry.

23
Table 2. Mosaic Sand Size Analysis Results.
Sample Size Fraction (mm) Wt (%) ? Wt (%)
+20 0.85 0.32 0.32 -20+30 0.85-0.60 3.68 4.00 -30+40 0.60-0.425 14.78 18.78 -40+50 0.425-0.30 30.53 49.31 -50+60 0.30-0.25 20.45 69.76 -60+80 0.25-0.18 20.11 89.87 -80+100 0.18-0.15 2.23 92.10 -100+120 0.15-0.125 4.44 96.54 -120+200 0.125-0.075 3.30 99.84
-200 0.075 0.16 100.00
0.0 0.2 0.4 0.6 0.8 1.0 1.2
Particle Size (mm)
0
10
20
30
40
50
60
70
80
90
100
Cum
ulat
ive
Wei
ght (
%)
0.0 0.2 0.4 0.6 0.8 1.0 1.2
0
10
20
30
40
50
60
70
80
90
100
Figure 11. Cumulative Weight Percent vs. Particle Size for Sand Sample.

24
FLOCCULANT ACQUISITION AND PREPARATION
Seven Ciba DP flocculants and eight Ciba conventional Magnafloc flocculants were acquired from Ciba Specialty Chemicals. Seven Hengfloc polymers, including anionic and nonionic flocculants, were acquired from Beijing Hengju Oilfield Chemical Company. Two cationic polymers were acquired from Zinkan Enterprises Inc. A concentrated polymer solution of 0.5% was prepared by dissolving 0.5 g of dry polymer in 5 ml acetone and 95 ml water and was subsequently stirred for one hour. The purpose of acetone addition was to increase the dissolution of the polymers in water. The stock solution was used within ten days of preparation. A fresh working polymer solution of 0.05% was prepared every three days by dilution of concentrated stock solution. EFFECTS OF FLOCCULANTS ON PHOSPHATIC CLAY FLOCCULATION
The disposal problem of phosphatic clay is associated with its very large volume and the poor dewatering characteristics of the slimes. The slow dewatering behavior delays the reclamation of the affected land for many years. To eliminate this problem, slimes must be concentrated to an average density of 30 weight percent solids (Onoda and others 1980). At present, average values of around 20 weight percent solids are achieved during the time it takes for a disposal area to fill (2-3 years, typically). Effects of Anionic Flocculants Effects of DPW Flocculants
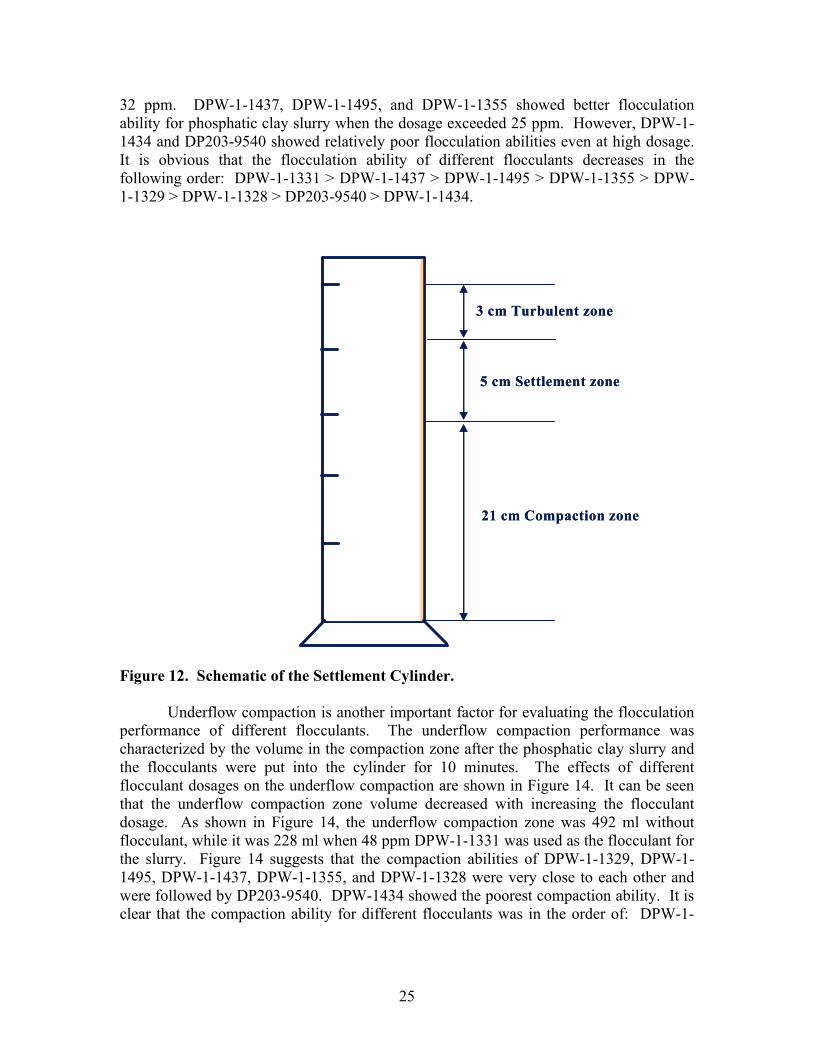
To identify the best flocculants that provide a high settling rate of the flocculated particles, tests were conducted using 500 ml clay slurry in a 500 ml graduated cylinder. A predetermined amount of flocculant solution was mixed with the clay slurry by turning the cylinder upside down five times. Figure 12 indicates that the phosphate clay slurry settlement in the cylinder was divided into three zones: a turbulent zone, settlement zone, and compaction zone. The settling rate was measured in the settlement zone, while the underflow solids concentration was determined in the compaction zone after the phosphate clay slurry and flocculants were put into the cylinder for 10 minutes. The flocculation efficiency and compaction ability of different flocculants have been compared under different conditions.
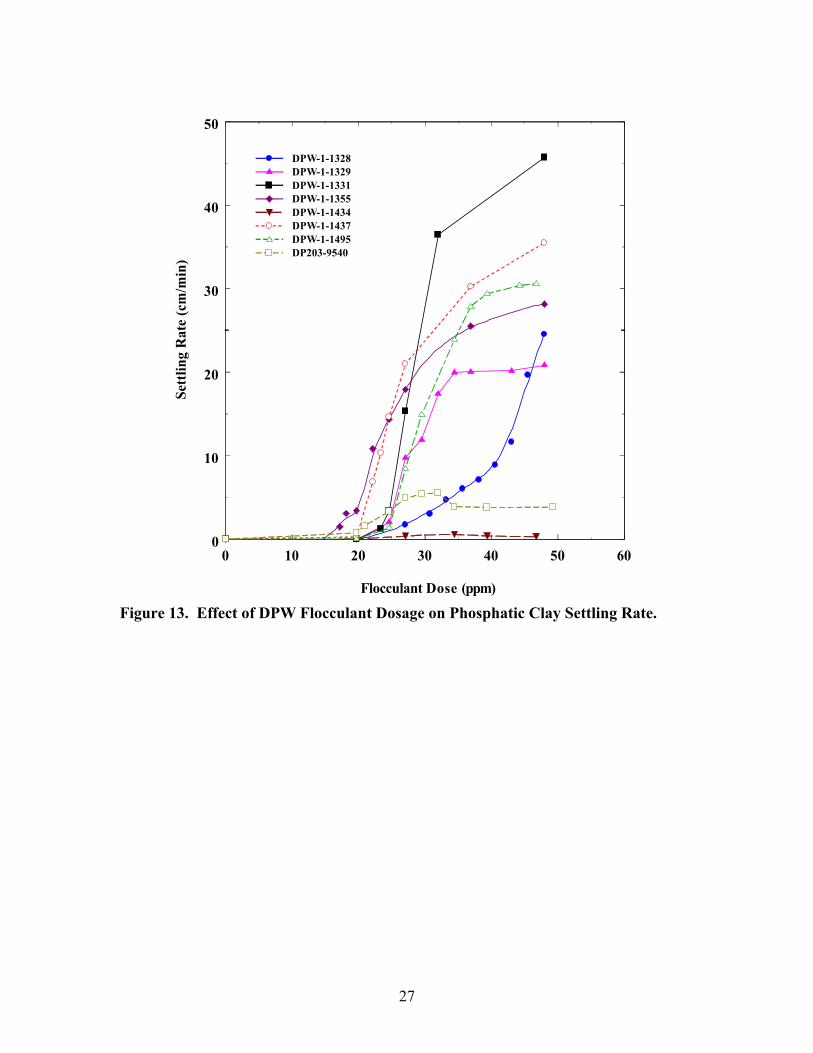
The effects of different DPW flocculants on phosphatic clay slurry settling rate were investigated, and the results are shown in Figure 13. Figure 13 indicates that the clay settling rate was 0.0122 cm/min without flocculants. Generally, the clay slurries thicken from a nominal 2 to 6% solids to 10% solids in a week and to 15% solids in about 3 months. Densification to about 18% solids requires about a year, and to reach solids content of 20% or higher requires several years. Figure 13 also shows that DPW-1-1331 exhibited strong flocculation ability for phosphatic clay slurry when the dosage exceeded
25
32 ppm. DPW-1-1437, DPW-1-1495, and DPW-1-1355 showed better flocculation ability for phosphatic clay slurry when the dosage exceeded 25 ppm. However, DPW-1-1434 and DP203-9540 showed relatively poor flocculation abilities even at high dosage. It is obvious that the flocculation ability of different flocculants decreases in the following order: DPW-1-1331 > DPW-1-1437 > DPW-1-1495 > DPW-1-1355 > DPW-1-1329 > DPW-1-1328 > DP203-9540 > DPW-1-1434.
Figure 12. Schematic of the Settlement Cylinder.
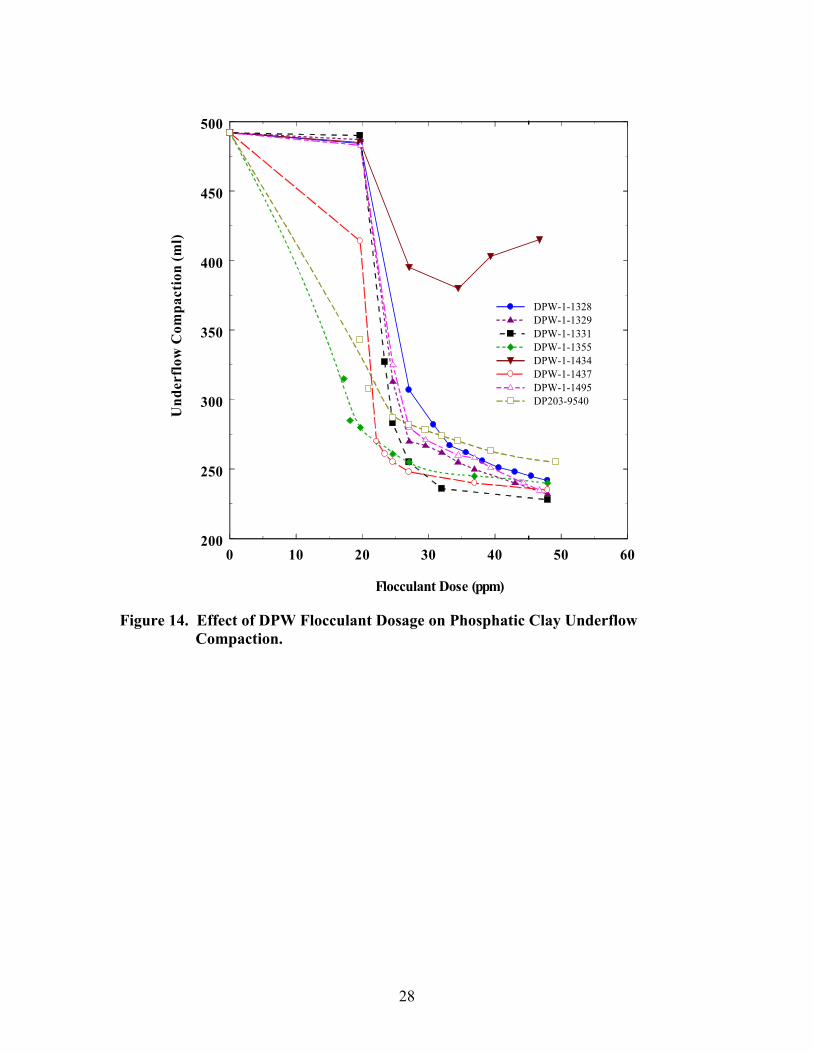
Underflow compaction is another important factor for evaluating the flocculation performance of different flocculants. The underflow compaction performance was characterized by the volume in the compaction zone after the phosphatic clay slurry and the flocculants were put into the cylinder for 10 minutes. The effects of different flocculant dosages on the underflow compaction are shown in Figure 14. It can be seen that the underflow compaction zone volume decreased with increasing the flocculant dosage. As shown in Figure 14, the underflow compaction zone was 492 ml without flocculant, while it was 228 ml when 48 ppm DPW-1-1331 was used as the flocculant for the slurry. Figure 14 suggests that the compaction abilities of DPW-1-1329, DPW-1-1495, DPW-1-1437, DPW-1-1355, and DPW-1-1328 were very close to each other and were followed by DP203-9540. DPW-1434 showed the poorest compaction ability. It is clear that the compaction ability for different flocculants was in the order of: DPW-1-
3 cm Turbulent zone
5 cm Settlement zone
21 cm Compaction zone
3 cm Turbulent zone
5 cm Settlement zone
21 cm Compaction zone
26
1331 > DPW-1-1329 > DPW-1-1495 > DPW-1-1437 > DPW-1-1355 > DPW-1-1328 > DP203-9540 > DPW-1-1434.
Turbidity reflects the cloudiness of water—the cloudier the water, the greater the turbidity. It is a measure of how much of the light traveling through water is scattered by suspended particles. The scattering of light increases with increasing suspended solids content. A turbidimeter measures the scattering of light, and provides a relative measure of turbidity in Nephelometric Turbidity Units (NTUs). The Micro 100 Turbidimeter shown in Figure 15 was used in the present study. Because one of the primary factors affecting turbidity is total suspended solids, the factors affecting total suspended solids will also affect turbidity. The data obtained from this task were used to determine the most effective synthetic polymeric flocculants and optimum dosage for successful operation of Deep Cone Paste Thickeners.
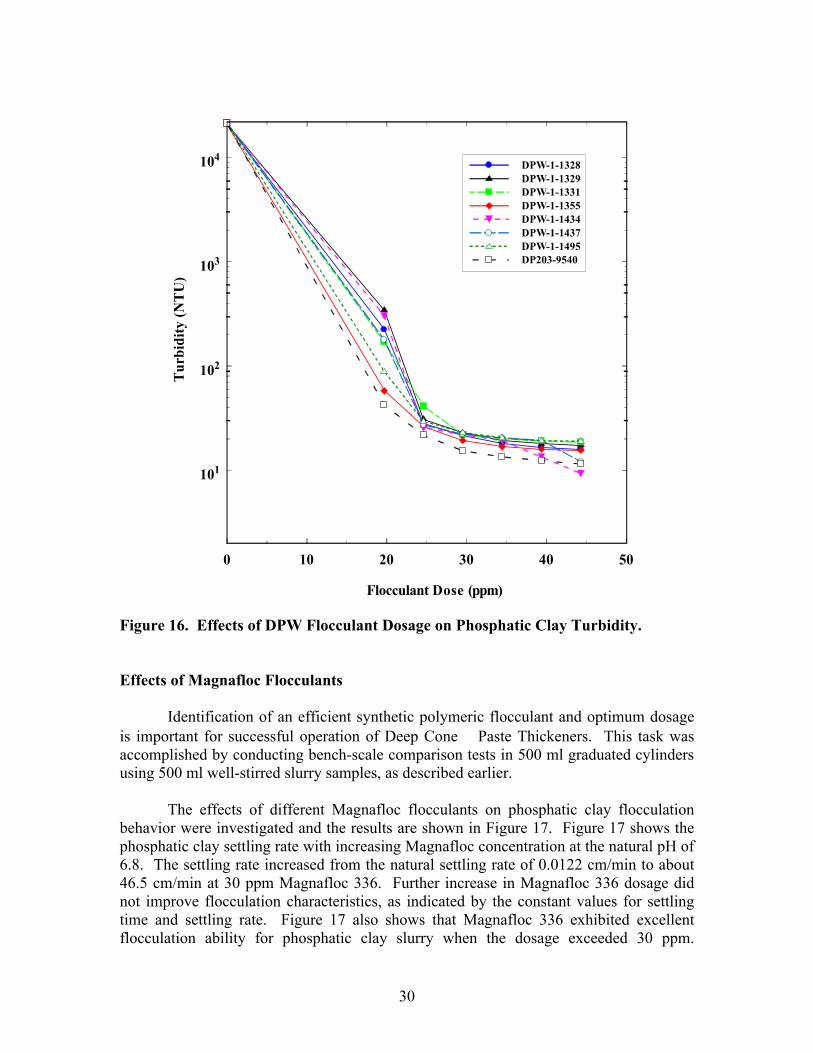
Figure 16 shows the effects of DPW flocculant dosage on phosphatic clay turbidity. The settling time was fixed at 5 minutes and a solution sample was drawn from the top of the solution. It is clear that the slime turbidity significantly decreased with increasing flocculant dosage. This is attributed to the fact that flocs were more easily formed with increasing flocculant content. The phosphatic clay slurry turbidity decreased from 2×10⁴ NTU without flocculant to 42.2 NTU with 20 ppm DP203-9540 and 15.4 NTU with 30 ppm DP203-9540. Further addition of DP203-9540 dosage did not reduce the slurry turbidity. A similar conclusion was also made for other DPW flocculants. Figure 17 also indicates that DP203-9540 exhibited excellent ability to reduce the slurry turbidity, followed by DPW-1-1355 and DPW-1-1328. However, DPW-1-1329 and DPW-1-1495 showed relatively poor ability.
27
0 10 20 30 40 50 60
Flocculant Dose (ppm)
0
10
20
30
40
50
Sett
ling
Rat
e (c
m/m
in)
DPW-1-1328DPW-1-1329DPW-1-1331DPW-1-1355DPW-1-1434DPW-1-1437DPW-1-1495DP203-9540
Figure 13. Effect of DPW Flocculant Dosage on Phosphatic Clay Settling Rate.
28
0 10 20 30 40 50 60
Flocculant Dose (ppm)
200
250
300
350
400
450
500
Und
erfl
ow C
ompa
ctio
n (m
l)
DPW-1-1328DPW-1-1329DPW-1-1331DPW-1-1355DPW-1-1434DPW-1-1437DPW-1-1495DP203-9540
Figure 14. Effect of DPW Flocculant Dosage on Phosphatic Clay Underflow
Compaction.
29
Figure 15. Micro 100 Turbidimeter.
30
0 10 20 30 40 50
Flocculant Dose (ppm)
101
102
103
104
Tur
bidi
ty (N
TU
)DPW-1-1328DPW-1-1329DPW-1-1331DPW-1-1355DPW-1-1434DPW-1-1437DPW-1-1495DP203-9540
Figure 16. Effects of DPW Flocculant Dosage on Phosphatic Clay Turbidity. Effects of Magnafloc Flocculants
Identification of an efficient synthetic polymeric flocculant and optimum dosage is important for successful operation of Deep Cone Paste Thickeners. This task was accomplished by conducting bench-scale comparison tests in 500 ml graduated cylinders using 500 ml well-stirred slurry samples, as described earlier.
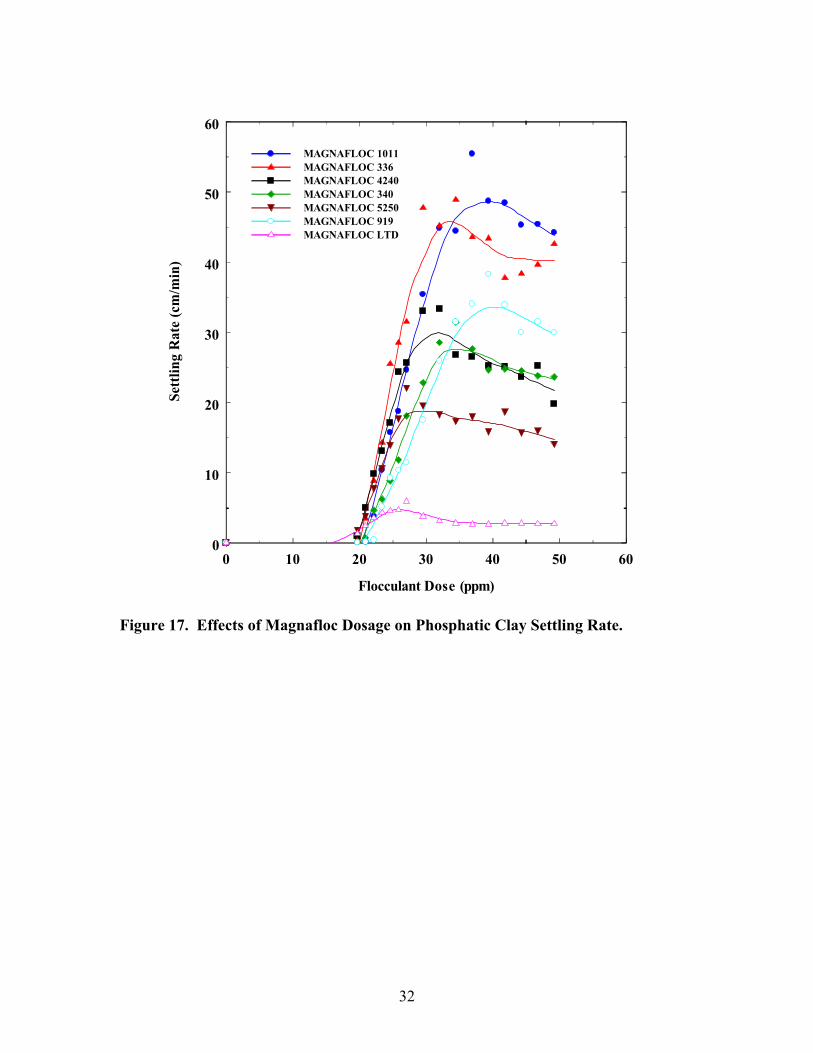
The effects of different Magnafloc flocculants on phosphatic clay flocculation behavior were investigated and the results are shown in Figure 17. Figure 17 shows the phosphatic clay settling rate with increasing Magnafloc concentration at the natural pH of 6.8. The settling rate increased from the natural settling rate of 0.0122 cm/min to about 46.5 cm/min at 30 ppm Magnafloc 336. Further increase in Magnafloc 336 dosage did not improve flocculation characteristics, as indicated by the constant values for settling time and settling rate. Figure 17 also shows that Magnafloc 336 exhibited excellent flocculation ability for phosphatic clay slurry when the dosage exceeded 30 ppm.

31
Magnafloc 1011 and Magnafloc 4240 showed slightly inferior flocculation ability to Magnafloc 336 for phosphatic clay slurry. Magnafloc LTD showed the worst flocculation response even at high dosages. It can thus be seen that the flocculation performance of different Magnafloc flocculants decreased in the following order: Magnafloc 336 > Magnafloc 1011 > Magnafloc 4240 > Magnafloc 340 > Magnafloc 919 > Magnafloc 5250 > Magnafloc LTD.
Underflow compaction is another important factor for evaluating the flocculation performance of different flocculants. The effects of different Magnafloc flocculant dosages on phosphatic clay underflow compaction are shown in Figure 18. Figure 18 indicates that the underflow compaction volume decreased significantly with increasing Magnafloc flocculant dosage. The underflow compaction volume was 492 ml without flocculant, which was twice as high as at 30 ppm Magnafloc 4240. The compaction behaviors of Magnafloc 336, Magnafloc 5250, and Magnafloc 1011 were very close to each other, which were followed by Magnafloc 340, then Magnafloc 919. Magnafloc LTD showed the poorest compaction ability for phosphatic clay slurry. This may be caused by different molecular structure, different molecular weight and different anionic charge. It can be seen that the compaction ability for different Magnafloc flocculants was in the order of: Magnafloc 4240 > Magnafloc 336 > Magnafloc 5250 > Magnafloc 1011 > Magnafloc 340 > Magnafloc 919 > Magnafloc LTD.
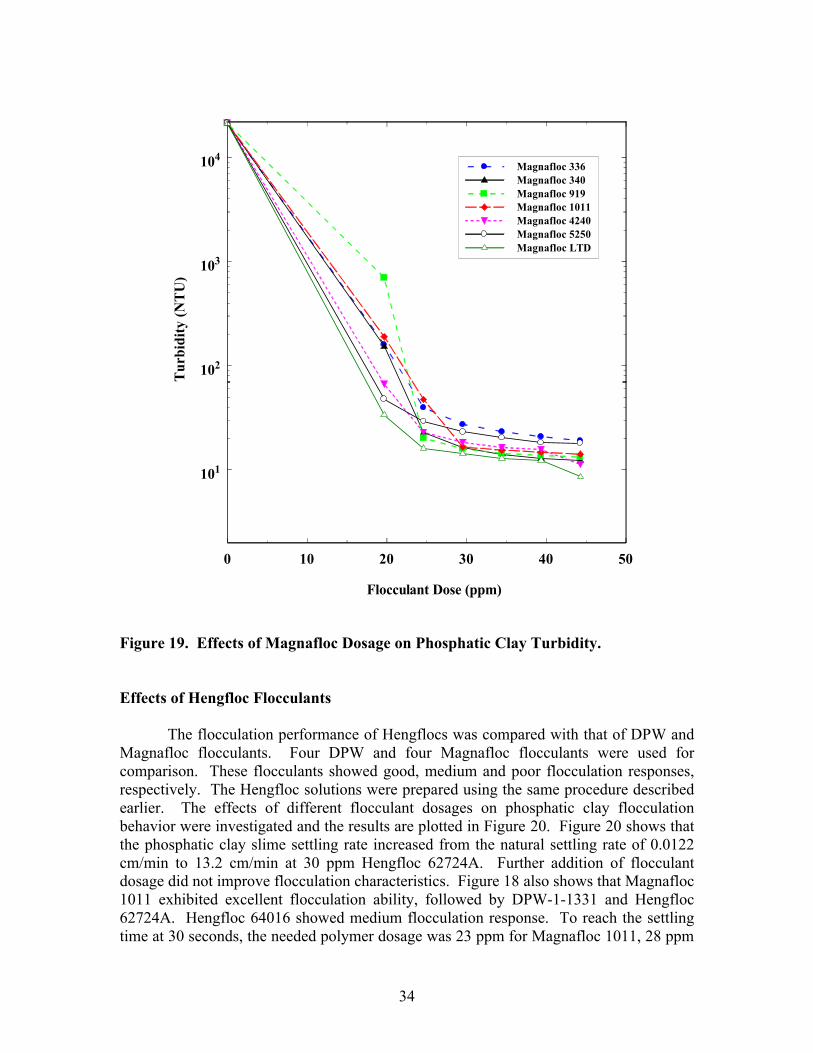
Figure 19 shows changes in phosphatic clay turbidity with increasing Magnafloc dosage. The turbidity decreased sharply with increasing flocculant dosage. For example, the slurry turbidity was reduced from 2×10⁴ NTU in the absence of flocculant to 33.6 NTU with 20 ppm Magnafloc LTD, and further reduced to 14.0 NTU with 30 ppm Magnafloc LTD. This figure also reveals that further increase in Magnafloc dosage did not reduce the slurry turbidity. This conclusion is similar to that obtained for DPW flocculants. The ability of different Magnafloc flocculants to reduce the slime turbidity was in the following order: Magnafloc LTD > Magnafloc 919 > Magnafloc 340 > Magnafloc 1011 > Magnafloc 4240 > Magnafloc 5250 > Magnafloc 336. It is very interesting to note that this is reverse to the order of Magnafloc flocculation performance.
32
0 10 20 30 40 50 60
Flocculant Dose (ppm)
0
10
20
30
40
50
60
Sett
ling
Rat
e (c
m/m
in)
MAGNAFLOC 1011MAGNAFLOC 336MAGNAFLOC 4240MAGNAFLOC 340MAGNAFLOC 5250MAGNAFLOC 919MAGNAFLOC LTD
Figure 17. Effects of Magnafloc Dosage on Phosphatic Clay Settling Rate.

33
0 10 20 30 40 50 60
Flocculant Dose (ppm)
150
200
250
300
350
400
450
500
Und
erflo
w C
ompa
ctio
n (m
l)MAGNAFLOC 1011MAGNAFLOC 336MAGNAFLOC 4240MAGNAFLOC 340MAGNAFLOC 5250MAGNAFLOC 919MAGNAFLOC LTD
Figure 18. Effects of Magnafloc Dosage on Phosphatic Clay Underflow Compaction.
34
0 10 20 30 40 50
Flocculant Dose (ppm)
101
102
103
104
Tur
bidi
ty (N
TU
)Magnafloc 336Magnafloc 340Magnafloc 919Magnafloc 1011Magnafloc 4240Magnafloc 5250Magnafloc LTD
Figure 19. Effects of Magnafloc Dosage on Phosphatic Clay Turbidity. Effects of Hengfloc Flocculants
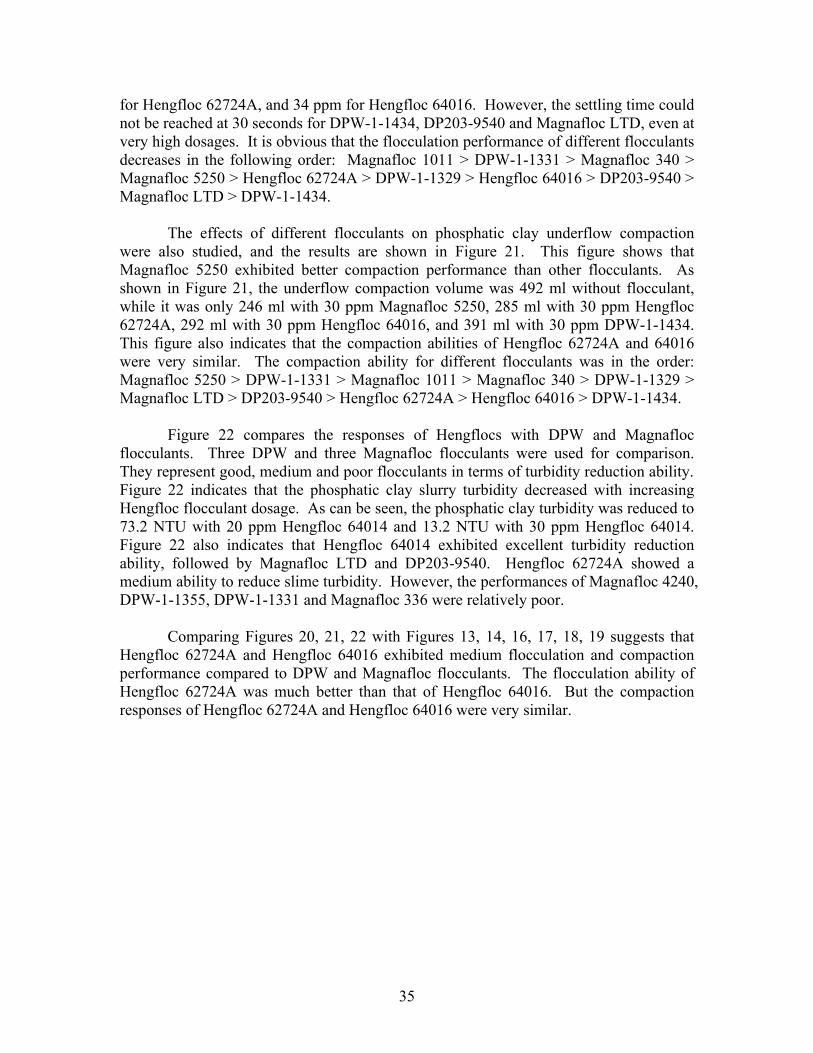
The flocculation performance of Hengflocs was compared with that of DPW and Magnafloc flocculants. Four DPW and four Magnafloc flocculants were used for comparison. These flocculants showed good, medium and poor flocculation responses, respectively. The Hengfloc solutions were prepared using the same procedure described earlier. The effects of different flocculant dosages on phosphatic clay flocculation behavior were investigated and the results are plotted in Figure 20. Figure 20 shows that the phosphatic clay slime settling rate increased from the natural settling rate of 0.0122 cm/min to 13.2 cm/min at 30 ppm Hengfloc 62724A. Further addition of flocculant dosage did not improve flocculation characteristics. Figure 18 also shows that Magnafloc 1011 exhibited excellent flocculation ability, followed by DPW-1-1331 and Hengfloc 62724A. Hengfloc 64016 showed medium flocculation response. To reach the settling time at 30 seconds, the needed polymer dosage was 23 ppm for Magnafloc 1011, 28 ppm
35
for Hengfloc 62724A, and 34 ppm for Hengfloc 64016. However, the settling time could not be reached at 30 seconds for DPW-1-1434, DP203-9540 and Magnafloc LTD, even at very high dosages. It is obvious that the flocculation performance of different flocculants decreases in the following order: Magnafloc 1011 > DPW-1-1331 > Magnafloc 340 > Magnafloc 5250 > Hengfloc 62724A > DPW-1-1329 > Hengfloc 64016 > DP203-9540 > Magnafloc LTD > DPW-1-1434.
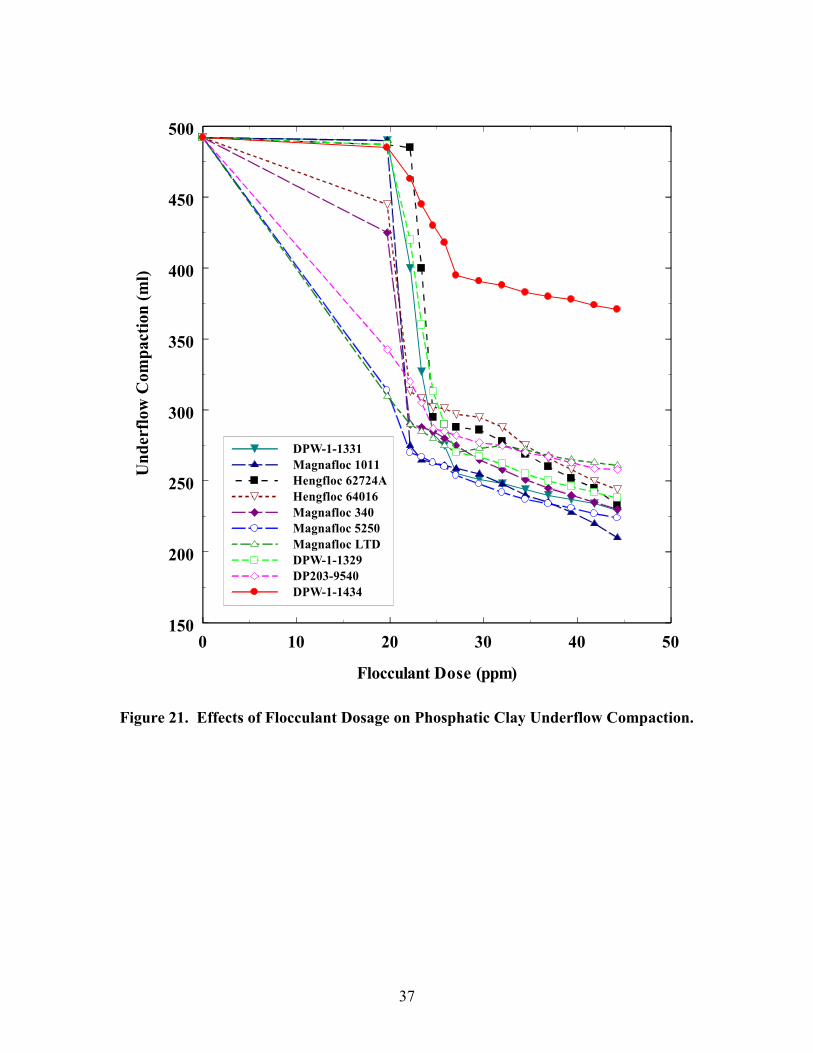
The effects of different flocculants on phosphatic clay underflow compaction were also studied, and the results are shown in Figure 21. This figure shows that Magnafloc 5250 exhibited better compaction performance than other flocculants. As shown in Figure 21, the underflow compaction volume was 492 ml without flocculant, while it was only 246 ml with 30 ppm Magnafloc 5250, 285 ml with 30 ppm Hengfloc 62724A, 292 ml with 30 ppm Hengfloc 64016, and 391 ml with 30 ppm DPW-1-1434. This figure also indicates that the compaction abilities of Hengfloc 62724A and 64016 were very similar. The compaction ability for different flocculants was in the order: Magnafloc 5250 > DPW-1-1331 > Magnafloc 1011 > Magnafloc 340 > DPW-1-1329 > Magnafloc LTD > DP203-9540 > Hengfloc 62724A > Hengfloc 64016 > DPW-1-1434.
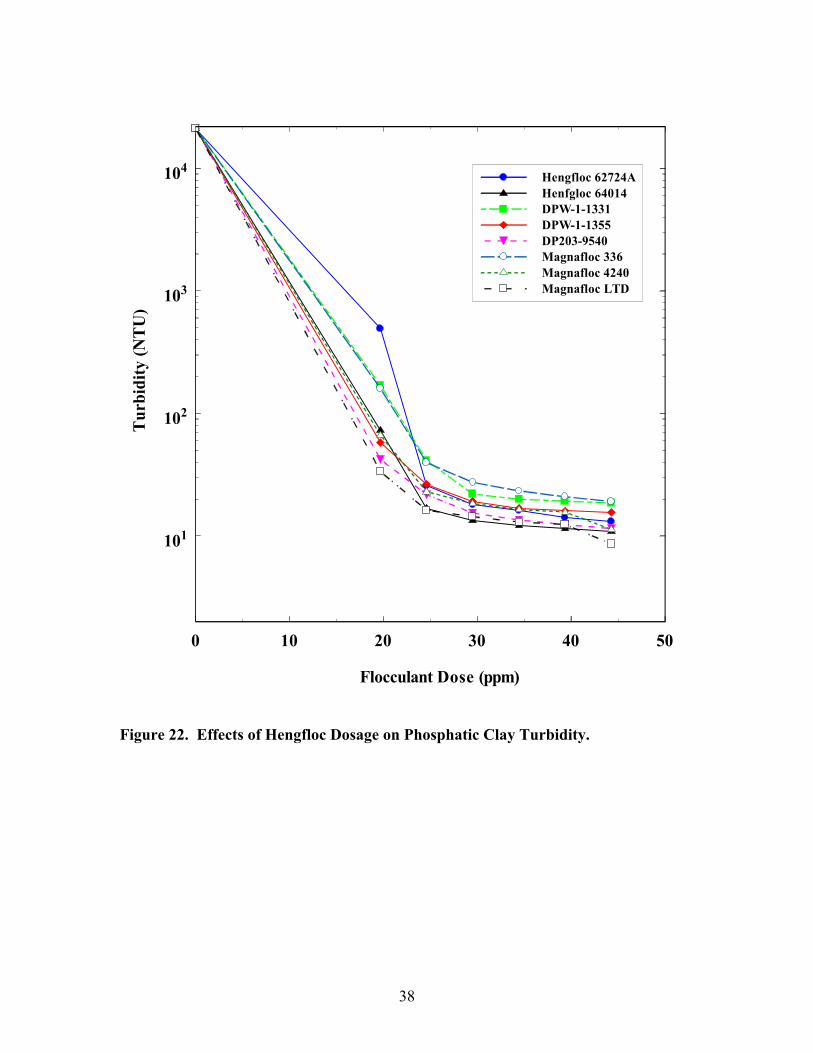
Figure 22 compares the responses of Hengflocs with DPW and Magnafloc flocculants. Three DPW and three Magnafloc flocculants were used for comparison. They represent good, medium and poor flocculants in terms of turbidity reduction ability. Figure 22 indicates that the phosphatic clay slurry turbidity decreased with increasing Hengfloc flocculant dosage. As can be seen, the phosphatic clay turbidity was reduced to 73.2 NTU with 20 ppm Hengfloc 64014 and 13.2 NTU with 30 ppm Hengfloc 64014. Figure 22 also indicates that Hengfloc 64014 exhibited excellent turbidity reduction ability, followed by Magnafloc LTD and DP203-9540. Hengfloc 62724A showed a medium ability to reduce slime turbidity. However, the performances of Magnafloc 4240, DPW-1-1355, DPW-1-1331 and Magnafloc 336 were relatively poor.
Comparing Figures 20, 21, 22 with Figures 13, 14, 16, 17, 18, 19 suggests that Hengfloc 62724A and Hengfloc 64016 exhibited medium flocculation and compaction performance compared to DPW and Magnafloc flocculants. The flocculation ability of Hengfloc 62724A was much better than that of Hengfloc 64016. But the compaction responses of Hengfloc 62724A and Hengfloc 64016 were very similar.
36
0 10 20 30 40 50 60Flocculant Dose (ppm)
0
10
20
30
40
50
60Se
ttlin
g R
ate
(cm
/min
)DPW-1-1331Magnafloc 1011Hengfloc 62724AHengfloc 64016Magnafloc 340Magnafloc 5250Magnafloc LTDDPW-1-1329DP203-9540DPW-1-1434
Figure 20. Effects of Flocculant Dosage on Phosphatic Clay Settling Rate.
37
0 10 20 30 40 50
Flocculant Dose (ppm)
150
200
250
300
350
400
450
500U
nder
flow
Com
pact
ion
(ml)
DPW-1-1331Magnafloc 1011Hengfloc 62724AHengfloc 64016Magnafloc 340Magnafloc 5250Magnafloc LTDDPW-1-1329DP203-9540DPW-1-1434
Figure 21. Effects of Flocculant Dosage on Phosphatic Clay Underflow Compaction.
38
0 10 20 30 40 50
Flocculant Dose (ppm)
101
102
103
104
Tur
bidi
ty (N
TU
)
Hengfloc 62724AHenfgloc 64014DPW-1-1331DPW-1-1355DP203-9540Magnafloc 336Magnafloc 4240Magnafloc LTD
Figure 22. Effects of Hengfloc Dosage on Phosphatic Clay Turbidity.
39
EFFECTS OF CATIONIC AND ANIONIC FLOCCULANTS
In order to investigate the effects of cationic polymers on phosphatic clay dewatering, FLOPAM FO 4650 SH and FLCO CS 653 were evaluated in the following tests. FLOPAM FO 4650 SH is a water-soluble polymer with medium ionic character. FLCO CS 653 is a high molecular weight viscous liquid. Both of them were supplied by Zinkan Enterprises Inc. Effects of FLOPAM FO 4650 SH and Magnafloc 5250
This task was accomplished by conducting bench-scale comparison tests in 500 ml graduated cylinders using 500 ml well stirred slurry samples, as described earlier. The cationic flocculant was first added into the slurry and mixed with phosphatic clay tailings, followed by the anionic polymer addition and shaking the cylinder up and down five times. Flocculation effect was quantified by measuring the settling time and settling rate over a fixed distance and underflow compaction of clay slurry at a given time. As described earlier, the phosphate clay slurry settlement in the cylinder was divided into three zones: turbulent, settlement, and compaction. The settling rate was measured in the settlement zone, while the underflow compaction was determined in the compaction zone after the phosphate clay slurry and flocculants were put into the cylinder for 10 minutes.
The effects of different cationic and anionic flocculant dosages on phosphatic clay slurry settling rate were investigated and the results are shown in Figure 23. Figure 23 indicates that the phosphatic clay reached the highest settling rate at 15 ppm Magnafloc 5250 without the addition of cationic polymer. For example, the clay slurry settling rate was 111.9 cm/min at 15 ppm Magnafloc 5250, while the clay settling rate decreased to 101.1 cm/min with further addition of 5 ppm FLOPAM FO 4650 SH. As shown in Figure 12, the settling rate was only 2.46 cm/min at 15 ppm FLOPAM FO 4650 SH. It is clear that the cationic flocculant FLOPAM FO 4650 SH did not increase the clay settling rate.
The effects of cationic and anionic flocculants on flocculation performance were also investigated by evaluating their effectiveness in providing a clear supernatant. The top 50 ml of supernatant was withdrawn using a syringe after 5 min of settling time. Figure 24 shows the effects of different flocculant dosages on supernatant quality. It is clear that the slime turbidity changed very little with different flocculant dosages. For example, the slime turbidity was 13.1 NTU with 15 ppm Magnafloc 5250, while it only increased to 14.7 NTU with 10 ppm Magnafloc 5250 and 5 ppm FO 4650 SH at the same solids concentration.
Another important criterion for the successful application of the deep cone thickener is the clay solids content in the thickened product. The percent solids in the thickened product was determined in the cylinder flocculation test by removing the supernatant and filtering the settled solids, which represents the highest solids content
40
possible by use of the deep cone thickener. The percent solids value was calculated using Equation (1):
100×=cakefilterwetofWeight
solidsdryofWeightSolidsPercent (1)
The effects of different flocculant dosages on phosphatic clay solids content in the filter cake are shown in Figure 25. It is obvious that the solids content reached the highest value of 8.21% with 15 ppm Magnafloc 5250, while it decreased to 4.67% with 15 ppm cationic FO 4650 SH addition. Figure 25 suggests that the addition of cationic flocculant reduced the clay solids content in the filter cake.
The water content of wet clay cake is another important factor to consider for the flocculation performance of different flocculants. The water content of wet clay cake was determined by removing the supernatant and filtering the settled solids, weighing the cake, drying it in an oven, and weighing it again. The water content of wet clay cake was calculated using Equation (2):
100×−
=cakewetofWeight
cakedryofWeightcakewetofWeightContentWater (2)
The effects of different cationic and anionic flocculant dosage on the water content of wet clay cake are shown in Figure 26. It can be seen that the water content of wet clay cake remained at a constant value with different flocculant dosage; thus, the effects of cationic polymer on the water content of wet clay cake were negligible.
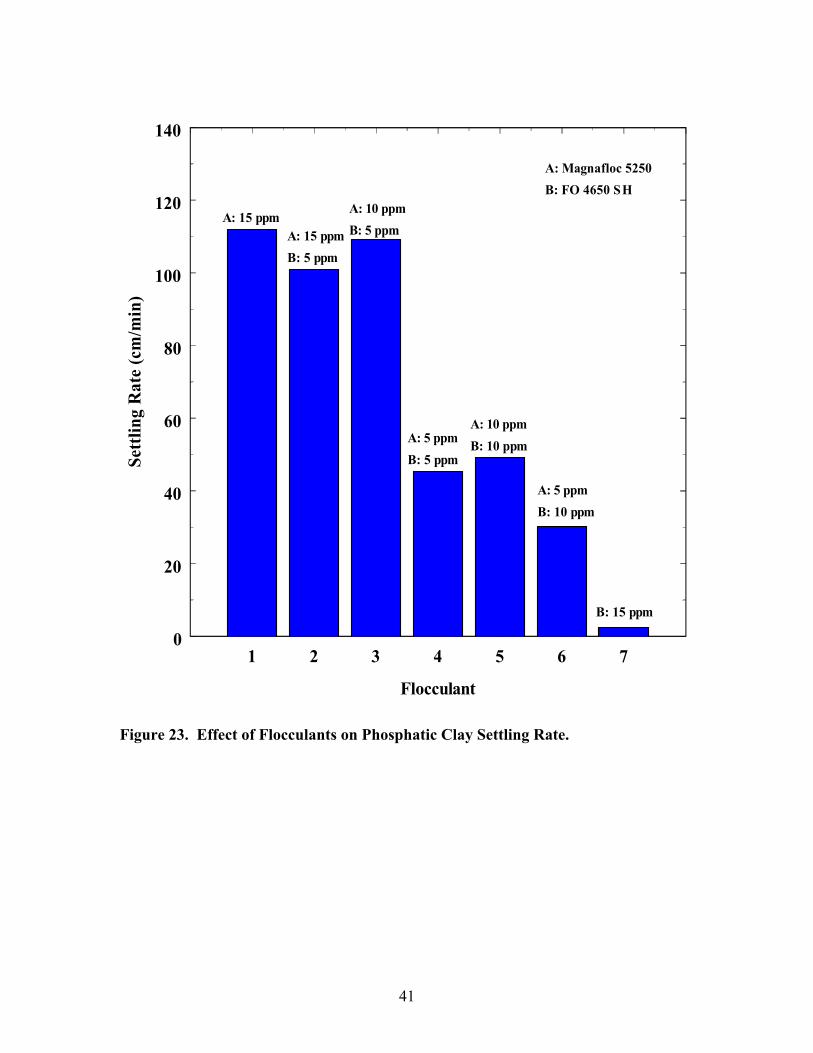
41
1 2 3 4 5 6 7
Flocculant
0
20
40
60
80
100
120
140Se
ttlin
g R
ate
(cm
/min
)
A: Magnafloc 5250
B: FO 4650 SH
A: 15 ppmA: 15 ppm
B: 5 ppm
A: 10 ppm
B: 5 ppm
A: 5 ppm
B: 5 ppm
A: 10 ppm
B: 10 ppm
A: 5 ppm
B: 10 ppm
B: 15 ppm
Figure 23. Effect of Flocculants on Phosphatic Clay Settling Rate.
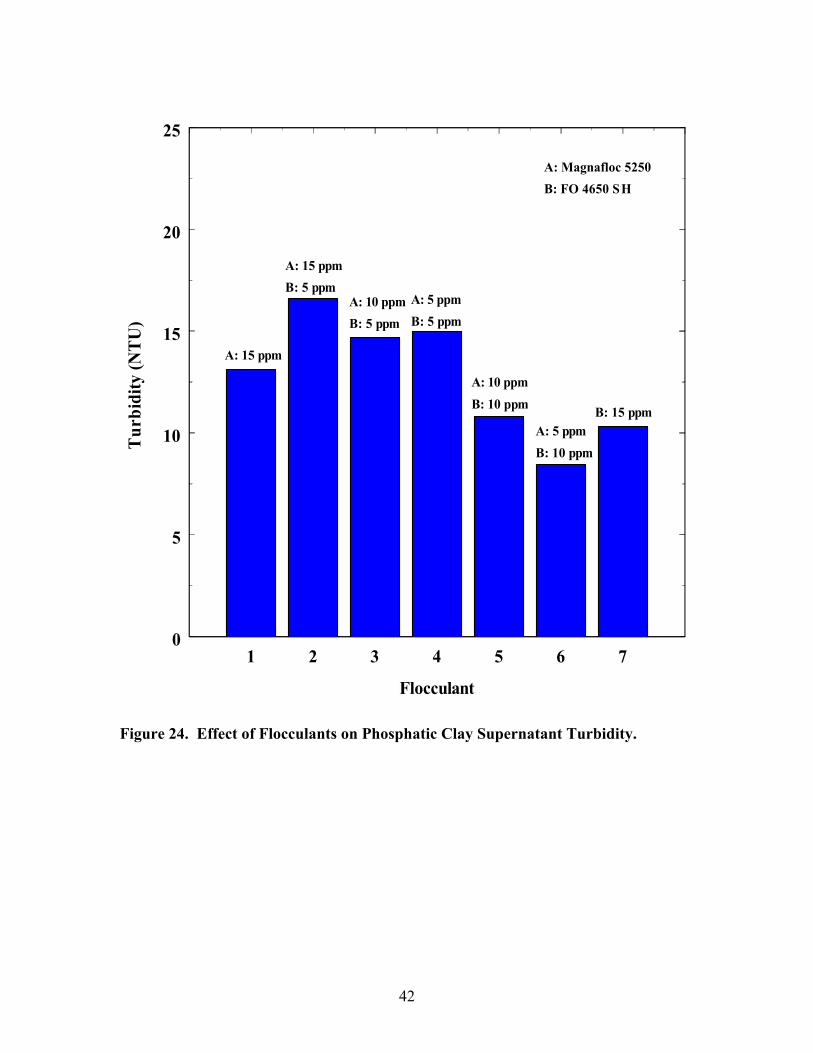
42
1 2 3 4 5 6 7
Flocculant
0
5
10
15
20
25T
urbi
dity
(NT
U)
A: Magnafloc 5250
B: FO 4650 SH
A: 15 ppm
A: 15 ppm
B: 5 ppmA: 10 ppm
B: 5 ppm
A: 5 ppm
B: 5 ppm
A: 10 ppm
B: 10 ppm
A: 5 ppm
B: 10 ppm
B: 15 ppm
Figure 24. Effect of Flocculants on Phosphatic Clay Supernatant Turbidity.

43
1 2 3 4 5 6 7
Flocculant
0
2
4
6
8
10So
lid C
onte
nt (%
)A: Magnafloc 5250
B: FO 4650 SHA: 15 ppm
A: 15 ppm
B: 5 ppm
A: 10 ppm
B: 5 ppm A: 5 ppm
B: 5 ppm A: 10 ppm
B: 10 ppm
A: 5 ppm
B: 10 ppm
B: 15 ppm
Figure 25. Effect of Flocculants on Underflow Solids Concentration.

44
1 2 3 4 5 6 7
Flocculant
0
20
40
60
80
100W
ater
Con
tent
(%)
A: Magnafloc 5250
B: FO 4650 SH
A: 15 ppm
A: 15 ppm
B: 5 ppmA: 10 ppm
B: 5 ppm
A: 5 ppm
B: 5 ppmA: 10 ppm
B: 10 ppm
A: 5 ppm
B: 10 ppm B: 15 ppm
Figure 26. Effect of Flocculants on Water Content of Wet Clay Cake. Effects of FLCO CS 653 and Magnafloc 5250
FLCO CS 653 was also used to investigate the effects of cationic polymer on clay flocculation performance. The effects of FLCO CS 653 and Magnafloc 5250 dosage on phosphate clay slurry settling rate are shown in Figure 27. It can be seen that the phosphate clay settling rate increased from 112 cm/min to 155 cm/min after 5 ppm FLCO CS 653 was added into the slurry. However, the clay settling rate was only 69.9 cm/min with 15 ppm FLCO CS 653 addition.
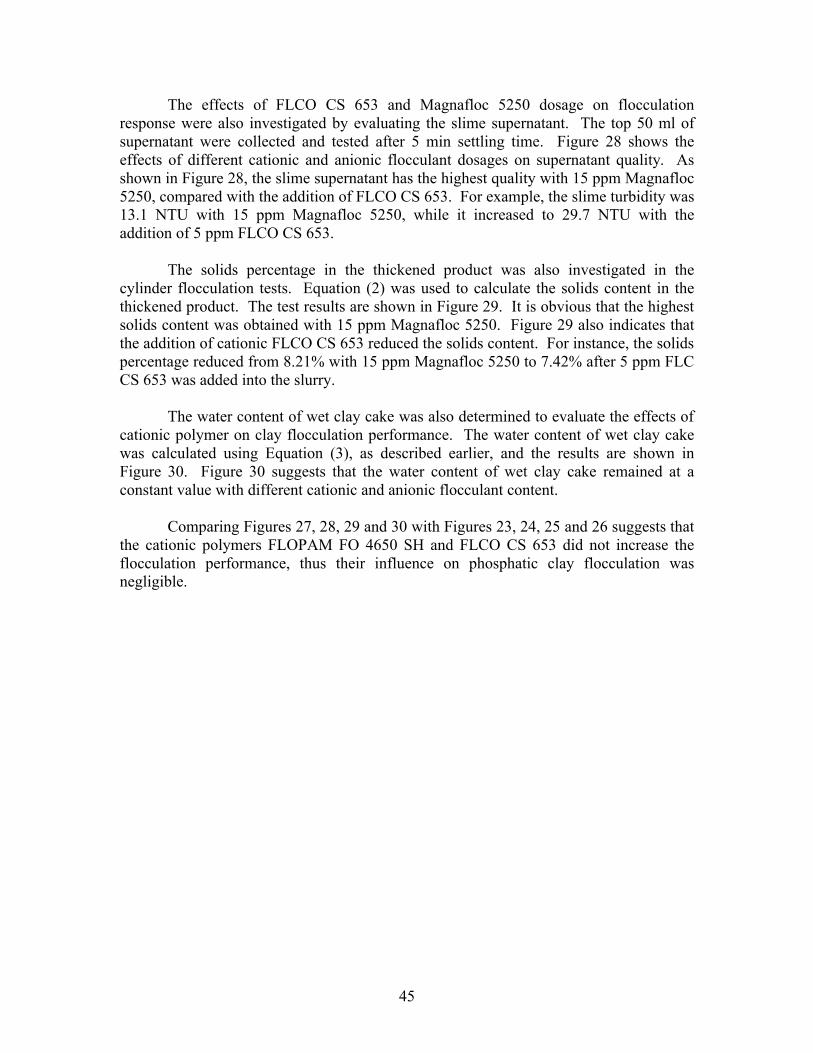
45
The effects of FLCO CS 653 and Magnafloc 5250 dosage on flocculation response were also investigated by evaluating the slime supernatant. The top 50 ml of supernatant were collected and tested after 5 min settling time. Figure 28 shows the effects of different cationic and anionic flocculant dosages on supernatant quality. As shown in Figure 28, the slime supernatant has the highest quality with 15 ppm Magnafloc 5250, compared with the addition of FLCO CS 653. For example, the slime turbidity was 13.1 NTU with 15 ppm Magnafloc 5250, while it increased to 29.7 NTU with the addition of 5 ppm FLCO CS 653.
The solids percentage in the thickened product was also investigated in the cylinder flocculation tests. Equation (2) was used to calculate the solids content in the thickened product. The test results are shown in Figure 29. It is obvious that the highest solids content was obtained with 15 ppm Magnafloc 5250. Figure 29 also indicates that the addition of cationic FLCO CS 653 reduced the solids content. For instance, the solids percentage reduced from 8.21% with 15 ppm Magnafloc 5250 to 7.42% after 5 ppm FLC CS 653 was added into the slurry.
The water content of wet clay cake was also determined to evaluate the effects of cationic polymer on clay flocculation performance. The water content of wet clay cake was calculated using Equation (3), as described earlier, and the results are shown in Figure 30. Figure 30 suggests that the water content of wet clay cake remained at a constant value with different cationic and anionic flocculant content.
Comparing Figures 27, 28, 29 and 30 with Figures 23, 24, 25 and 26 suggests that the cationic polymers FLOPAM FO 4650 SH and FLCO CS 653 did not increase the flocculation performance, thus their influence on phosphatic clay flocculation was negligible.

46
1 2 3 4 5 6 7
Flocculant
0
20
40
60
80
100
120
140
160Se
ttlin
g R
ate
(cm
/min
)
A: Magnafloc 5250
B: FLOC CS 653
A: 15 ppm
A: 15 ppm
B: 5 ppm
A: 10 ppm
B: 5 ppm
A: 5 ppm
B: 5 ppm
A: 10 ppm
B: 10 ppm
A: 5 ppm
B: 10 ppm
B: 15 ppm
Figure 27. Effect of Flocculants on Phosphatic Clay Settling Rate.

47
1 2 3 4 5 6 7
Flocculant
0
5
10
15
20
25
30
35T
urbi
dity
(NT
U)
A: Magnafloc 5250
B: FLCO CS 653
A: 15 ppm
A: 15 ppm
B: 5 ppm
A: 10 ppm
B: 5 ppm
A: 5 ppm
B: 5 ppm
A: 10 ppm
B: 10 ppmA: 5 ppm
B: 10 ppm
B: 15 ppm
Figure 28. Effect of Flocculants on Phosphatic Clay Supernatant Turbidity.

48
1 2 3 4 5 6 7
Flocculant
0
2
4
6
8
10So
lid C
onte
nt (%
)
A: Magnafloc 5250
B: FLCO CS 653A: 15 ppm
A: 15 ppm
B: 5 ppm A: 10 ppm
B: 5 ppm
A: 5 ppm
B: 5 ppm A: 10 ppm
B: 10 ppmA: 5 ppm
B: 10 ppm
B: 15 ppm
Figure 29. Effect of Flocculants on Underflow Solids Concentration.
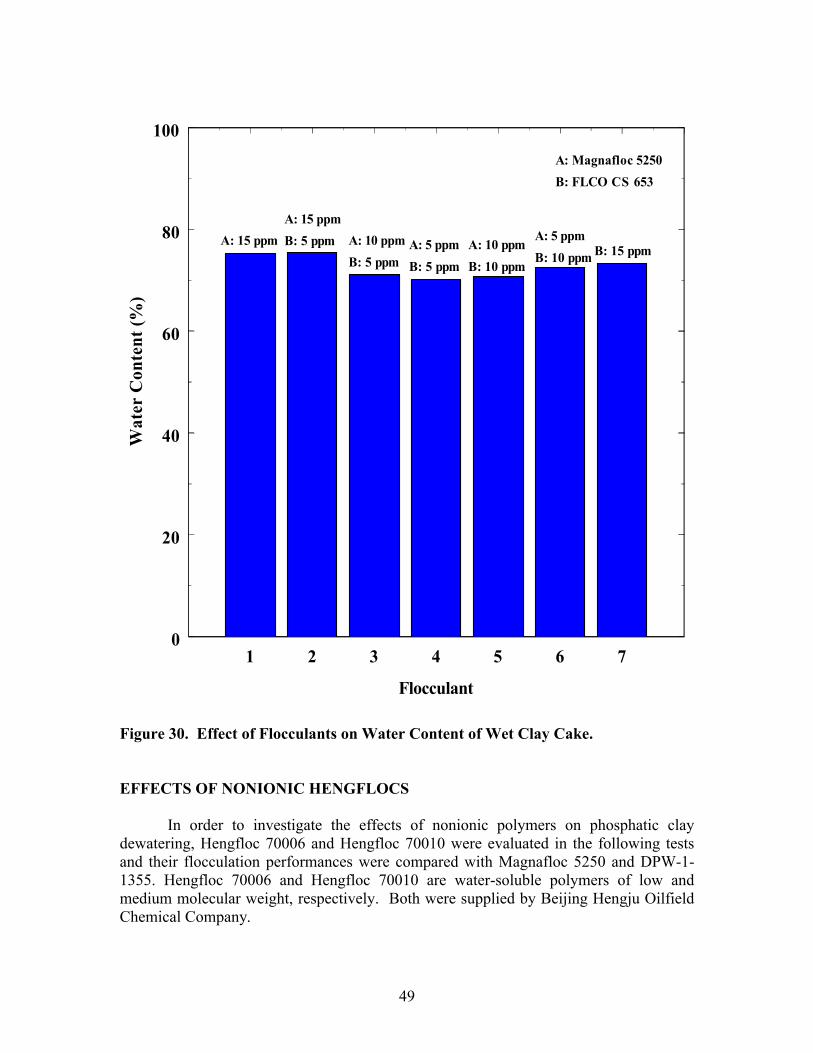
49
1 2 3 4 5 6 7
Flocculant
0
20
40
60
80
100W
ater
Con
tent
(%)
A: Magnafloc 5250
B: FLCO CS 653
A: 15 ppm
A: 15 ppm
B: 5 ppm A: 10 ppm
B: 5 ppmA: 5 ppm
B: 5 ppm
A: 10 ppm
B: 10 ppm
A: 5 ppm
B: 10 ppm B: 15 ppm
Figure 30. Effect of Flocculants on Water Content of Wet Clay Cake. EFFECTS OF NONIONIC HENGFLOCS
In order to investigate the effects of nonionic polymers on phosphatic clay dewatering, Hengfloc 70006 and Hengfloc 70010 were evaluated in the following tests and their flocculation performances were compared with Magnafloc 5250 and DPW-1-1355. Hengfloc 70006 and Hengfloc 70010 are water-soluble polymers of low and medium molecular weight, respectively. Both were supplied by Beijing Hengju Oilfield Chemical Company.
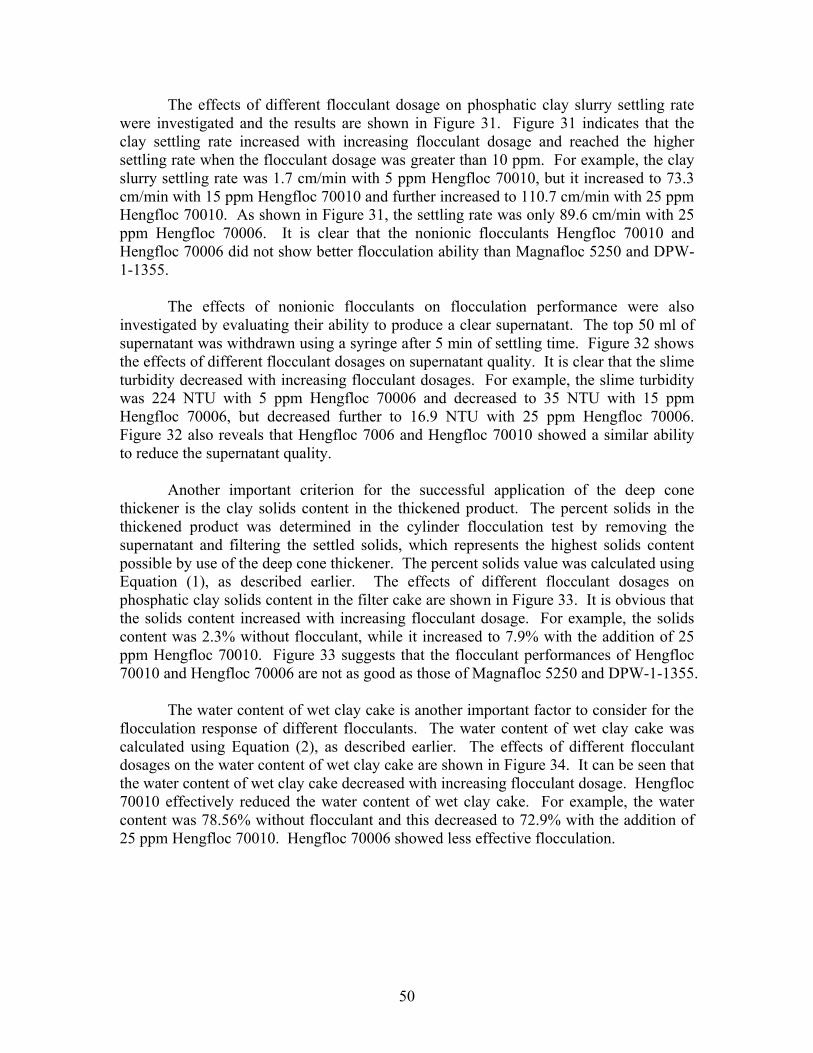
50
The effects of different flocculant dosage on phosphatic clay slurry settling rate were investigated and the results are shown in Figure 31. Figure 31 indicates that the clay settling rate increased with increasing flocculant dosage and reached the higher settling rate when the flocculant dosage was greater than 10 ppm. For example, the clay slurry settling rate was 1.7 cm/min with 5 ppm Hengfloc 70010, but it increased to 73.3 cm/min with 15 ppm Hengfloc 70010 and further increased to 110.7 cm/min with 25 ppm Hengfloc 70010. As shown in Figure 31, the settling rate was only 89.6 cm/min with 25 ppm Hengfloc 70006. It is clear that the nonionic flocculants Hengfloc 70010 and Hengfloc 70006 did not show better flocculation ability than Magnafloc 5250 and DPW-1-1355.
The effects of nonionic flocculants on flocculation performance were also investigated by evaluating their ability to produce a clear supernatant. The top 50 ml of supernatant was withdrawn using a syringe after 5 min of settling time. Figure 32 shows the effects of different flocculant dosages on supernatant quality. It is clear that the slime turbidity decreased with increasing flocculant dosages. For example, the slime turbidity was 224 NTU with 5 ppm Hengfloc 70006 and decreased to 35 NTU with 15 ppm Hengfloc 70006, but decreased further to 16.9 NTU with 25 ppm Hengfloc 70006. Figure 32 also reveals that Hengfloc 7006 and Hengfloc 70010 showed a similar ability to reduce the supernatant quality.
Another important criterion for the successful application of the deep cone thickener is the clay solids content in the thickened product. The percent solids in the thickened product was determined in the cylinder flocculation test by removing the supernatant and filtering the settled solids, which represents the highest solids content possible by use of the deep cone thickener. The percent solids value was calculated using Equation (1), as described earlier. The effects of different flocculant dosages on phosphatic clay solids content in the filter cake are shown in Figure 33. It is obvious that the solids content increased with increasing flocculant dosage. For example, the solids content was 2.3% without flocculant, while it increased to 7.9% with the addition of 25 ppm Hengfloc 70010. Figure 33 suggests that the flocculant performances of Hengfloc 70010 and Hengfloc 70006 are not as good as those of Magnafloc 5250 and DPW-1-1355.
The water content of wet clay cake is another important factor to consider for the flocculation response of different flocculants. The water content of wet clay cake was calculated using Equation (2), as described earlier. The effects of different flocculant dosages on the water content of wet clay cake are shown in Figure 34. It can be seen that the water content of wet clay cake decreased with increasing flocculant dosage. Hengfloc 70010 effectively reduced the water content of wet clay cake. For example, the water content was 78.56% without flocculant and this decreased to 72.9% with the addition of 25 ppm Hengfloc 70010. Hengfloc 70006 showed less effective flocculation.
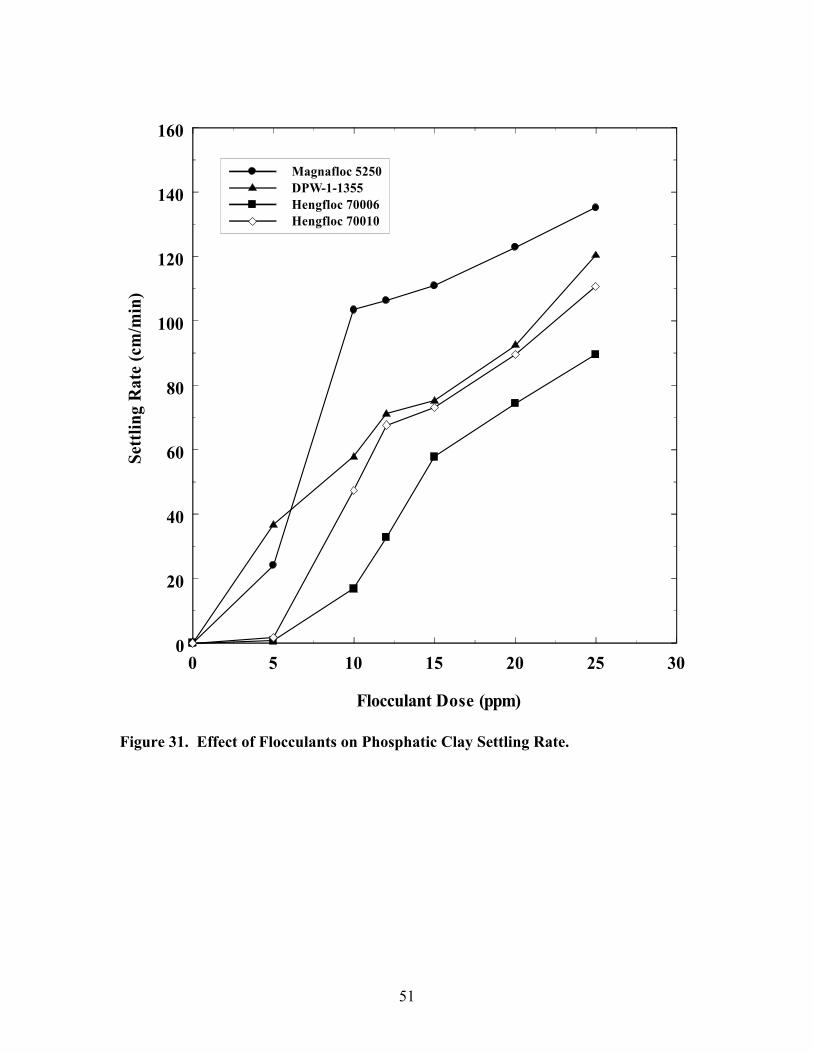
51
0 5 10 15 20 25 30
Flocculant Dose (ppm)
0
20
40
60
80
100
120
140
160Se
ttlin
g R
ate
(cm
/min
)
Magnafloc 5250DPW-1-1355Hengfloc 70006Hengfloc 70010
Figure 31. Effect of Flocculants on Phosphatic Clay Settling Rate.
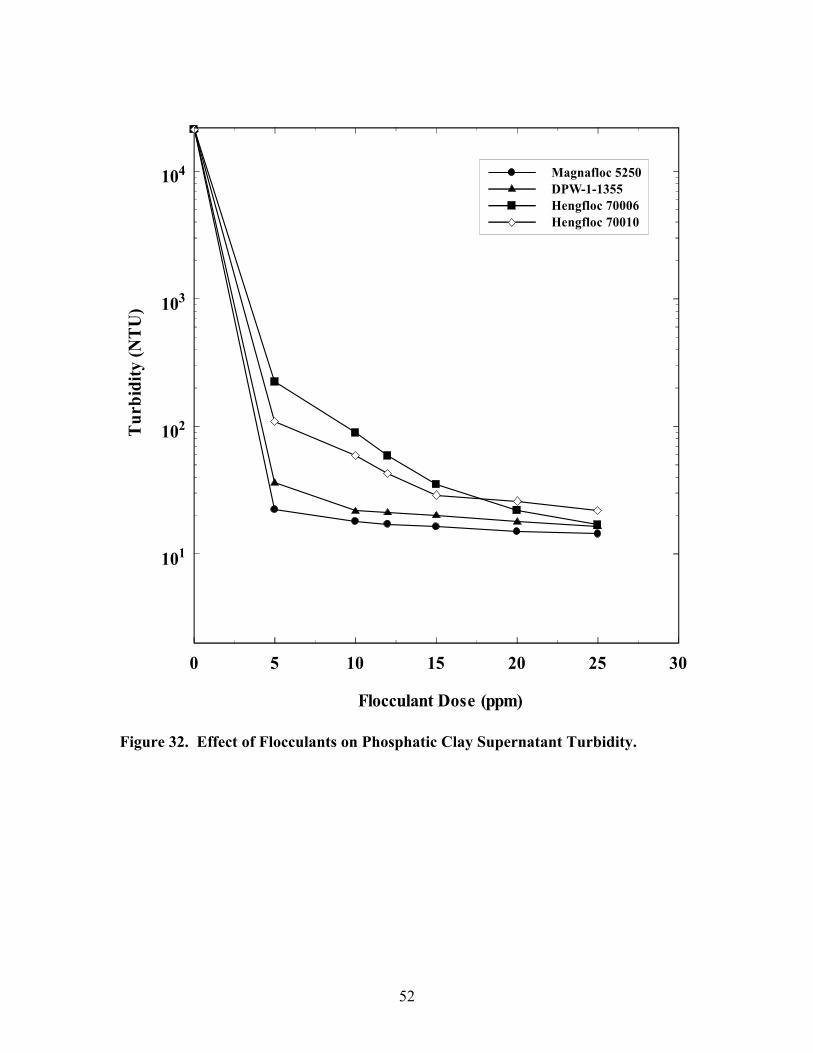
52
0 5 10 15 20 25 30
Flocculant Dose (ppm)
101
102
103
104
Tur
bidi
ty (N
TU
)
Magnafloc 5250DPW-1-1355Hengfloc 70006Hengfloc 70010
Figure 32. Effect of Flocculants on Phosphatic Clay Supernatant Turbidity.

53
0 5 10 15 20 25 30
Flocculant Dose (ppm)
0
2
4
6
8
10So
lids
Con
tent
(%)
Magnafloc 5250DPW-1-1355Hengfloc 70006Hengfloc 70010
Figure 33. Effect of Flocculants on Underflow Solids Concentration.
54
0 5 10 15 20 25 30
Flocculant Dose (ppm)
65
70
75
80
85
90So
lids
Con
tent
(%)
Magnafloc 5250DPW-1-1355Hengfloc 70006Hengfloc 70010
Figure 34. Effect of Flocculants on Water Content of Concentrated Clay. EFFECT OF INITIAL POLYMER CONCENTRATION ON CLAY FLOCCULATION
A review of the literature indicates that the initial polymer concentration, which is the polymer concentration in the solution before it was added to the phosphatic clay slurry, affects the performance of the flocculation process (El-Shall and others 1989). Therefore, it was decided to study its effect by varying the initial polymer concentration at 0.05%, 0.1%, 0.2%, 0.3%, 0.4% and 0.45%. Flocculant consumption was determined as the dosage which increased the settling rate to 12 cm/min in the settlement zone.
55
Results obtained from these tests are shown in Figure 35 for three polymers, including Magnafloc 5250, DPW-1-1355, and Hengfloc 62724A, which each exhibited excellent flocculation abilities in previous tests.
It is very interesting to note that polymer consumption increased with increasing initial polymer concentration. Since the polymer addition method and agitation intensity were kept the same in all tests, the observed differences in polymer requirement may be attributed to the kinetics of diffusion of the polymer molecules. The diffusion of polymer and its distribution throughout the suspension are expected to be faster in dilute solutions than in more concentrated solutions. Polymer molecules added in dilute solutions were adsorbed on a larger number of solid particles, while a large number of polymer molecules were adsorbed on a few particles in the more concentrated solutions. El-Shall and others (1989) reached a similar conclusion from the study of dewatering of phosphatic clays using polyacrylamide as the flocculant.
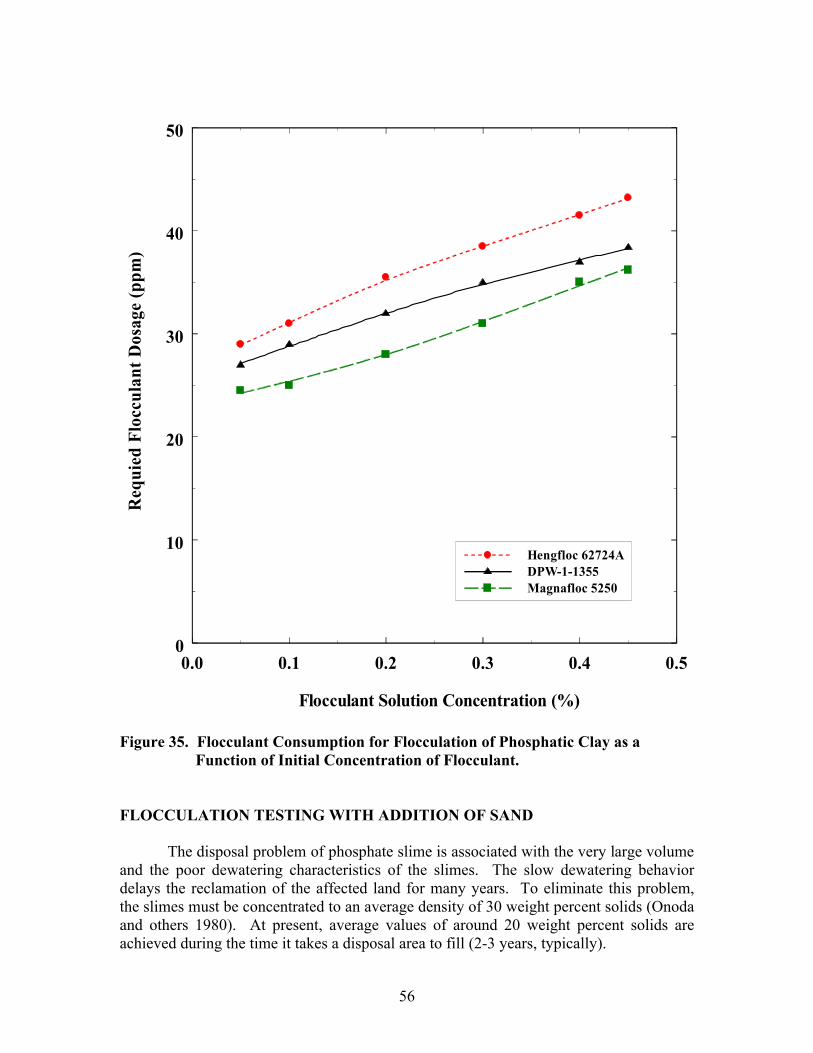
56
0.0 0.1 0.2 0.3 0.4 0.5
Flocculant Solution Concentration (%)
0
10
20
30
40
50R
equi
ed F
locc
ulan
t Dos
age
(ppm
)
Hengfloc 62724ADPW-1-1355Magnafloc 5250
Figure 35. Flocculant Consumption for Flocculation of Phosphatic Clay as a
Function of Initial Concentration of Flocculant. FLOCCULATION TESTING WITH ADDITION OF SAND
The disposal problem of phosphate slime is associated with the very large volume and the poor dewatering characteristics of the slimes. The slow dewatering behavior delays the reclamation of the affected land for many years. To eliminate this problem, the slimes must be concentrated to an average density of 30 weight percent solids (Onoda and others 1980). At present, average values of around 20 weight percent solids are achieved during the time it takes a disposal area to fill (2-3 years, typically).
57
Some engineering studies involve the modification of slimes. Several involve adding a polymeric flocculant, while others involve intermixing sand with the slime, with or without flocculant present (Barreiro and others 1977; Keshian and others 1977). These methods improved the early stage of dewatering, as well as improving the final effective slime volumes in some cases.
To identify the best performance of flocculants to provide a high settling rate of the flocculated particles, tests were conducted using 500 ml of the refuse slurry in a 500 ml graduated cylinder. A known amount of flocculant solution was added to the slurry in the cylinder and was mixed by turning the cylinder upside down five times. The settling rate (height of the sediment with respect to time in the settlement zone) of the flocculated solids was monitored using a stop watch. Figure 36 shows the settling rate of flocculated phosphatic clay as a function of sand additions using DPW, Magnafloc and Hengfloc as the flocculants. The dosage of all the flocculants was kept at 25 ppm. This figure clearly indicates that the settling rate increased with increasing sand particle content. For example, the phosphatic slime settling rate was 34.5 cm/min with 15% sand content and 25 ppm Magnafloc 5250, which is about seven times greater than the rate of 4.4 cm/min without sand content. Similar results were obtained for DPW and Hengfloc flocculants. This behavior might have been due to the fact that denser flocs were formed with the addition of sand particles, increasing the settling rate.
For the deep cone thickener the settling flux, which is an important parameter, was calculated for the underflow compaction using Equation (3):
( ) ( ) ( )( )
××=
sec3600/tan
// 2
TimeSettlinglKgionConcentratSlurrymetersceDisSettling
mhrtonnesFluxSettling (3)
Nine flocculants were selected from earlier tests for the present study. Figure 37 shows the effect of sand content on the settling flux of flocculated phosphatic clay. It is clear that the highest settling flux of 17.5 t/hr/m2 was obtained with 20% sand content and 25 ppm Magnafloc 336. The higher settling flux was also observed for Magnafloc 5250 and DPW-1-1355.
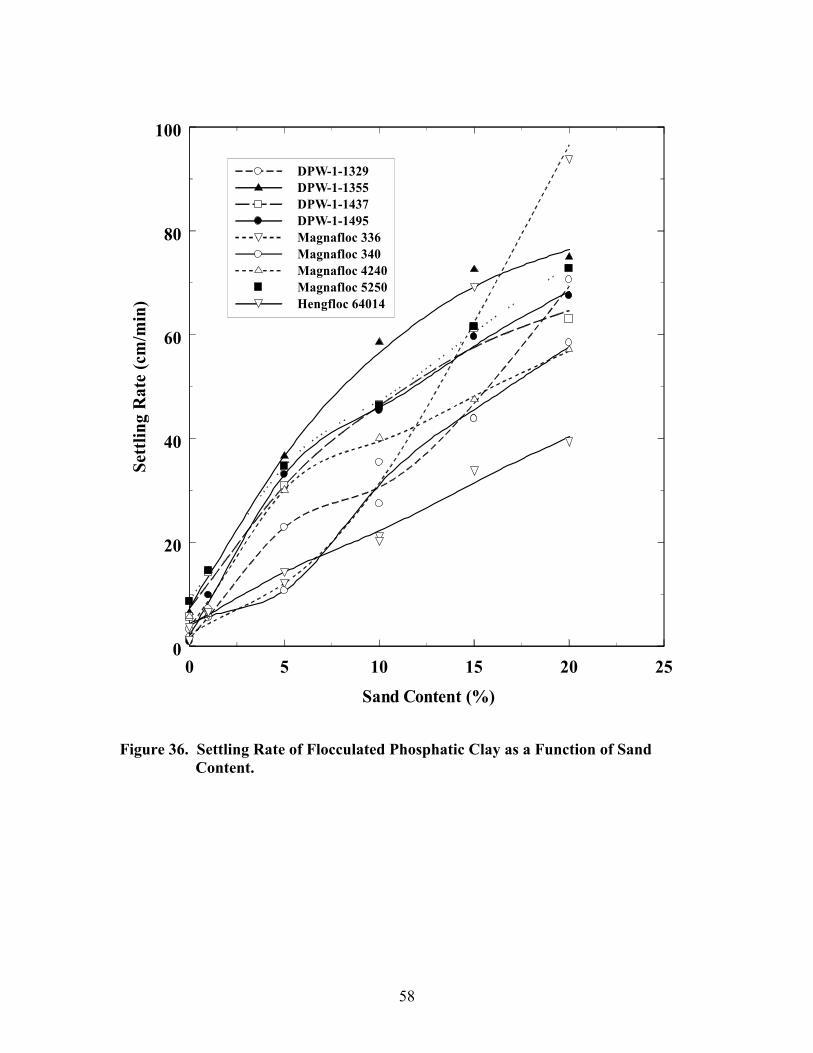
58
0 5 10 15 20 25
Sand Content (%)
0
20
40
60
80
100Se
ttlin
g R
ate
(cm
/min
)
DPW-1-1329DPW-1-1355DPW-1-1437DPW-1-1495Magnafloc 336Magnafloc 340Magnafloc 4240Magnafloc 5250Hengfloc 64014
Figure 36. Settling Rate of Flocculated Phosphatic Clay as a Function of Sand Content.
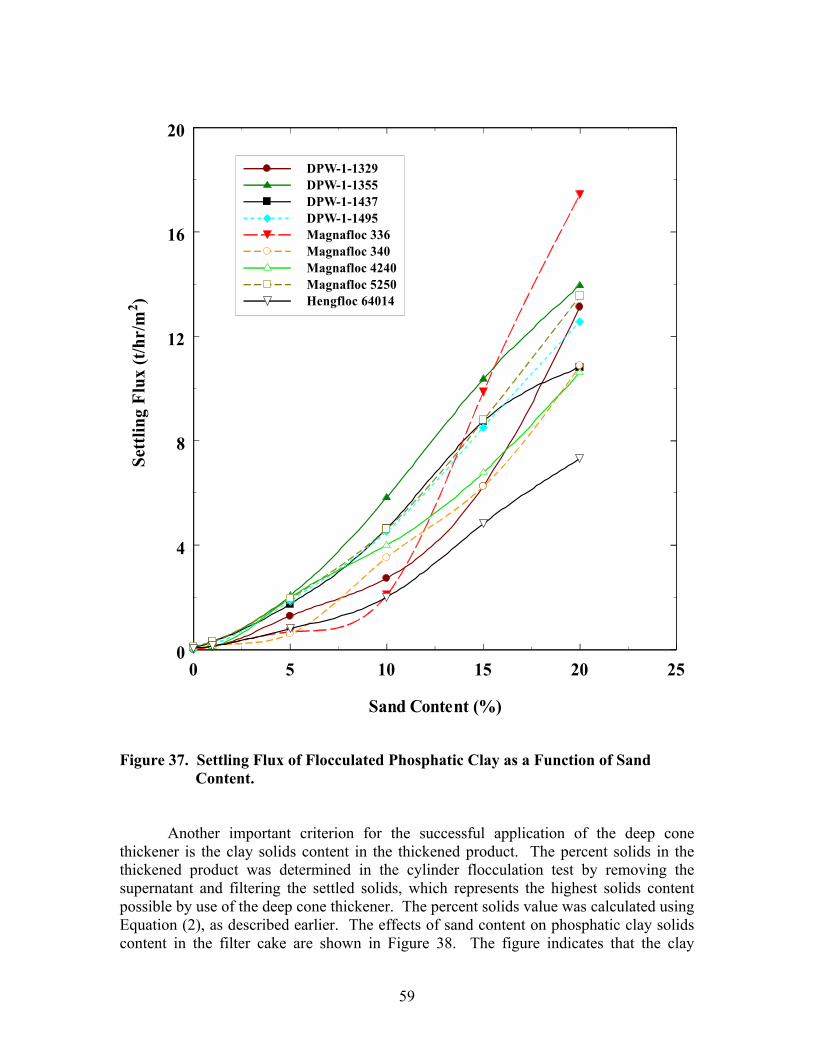
59
0 5 10 15 20 25
Sand Content (%)
0
4
8
12
16
20Se
ttlin
g F
lux
(t/h
r/m
2 )
DPW-1-1329DPW-1-1355DPW-1-1437DPW-1-1495Magnafloc 336Magnafloc 340Magnafloc 4240Magnafloc 5250Hengfloc 64014
Figure 37. Settling Flux of Flocculated Phosphatic Clay as a Function of Sand Content.
Another important criterion for the successful application of the deep cone thickener is the clay solids content in the thickened product. The percent solids in the thickened product was determined in the cylinder flocculation test by removing the supernatant and filtering the settled solids, which represents the highest solids content possible by use of the deep cone thickener. The percent solids value was calculated using Equation (2), as described earlier. The effects of sand content on phosphatic clay solids content in the filter cake are shown in Figure 38. The figure indicates that the clay
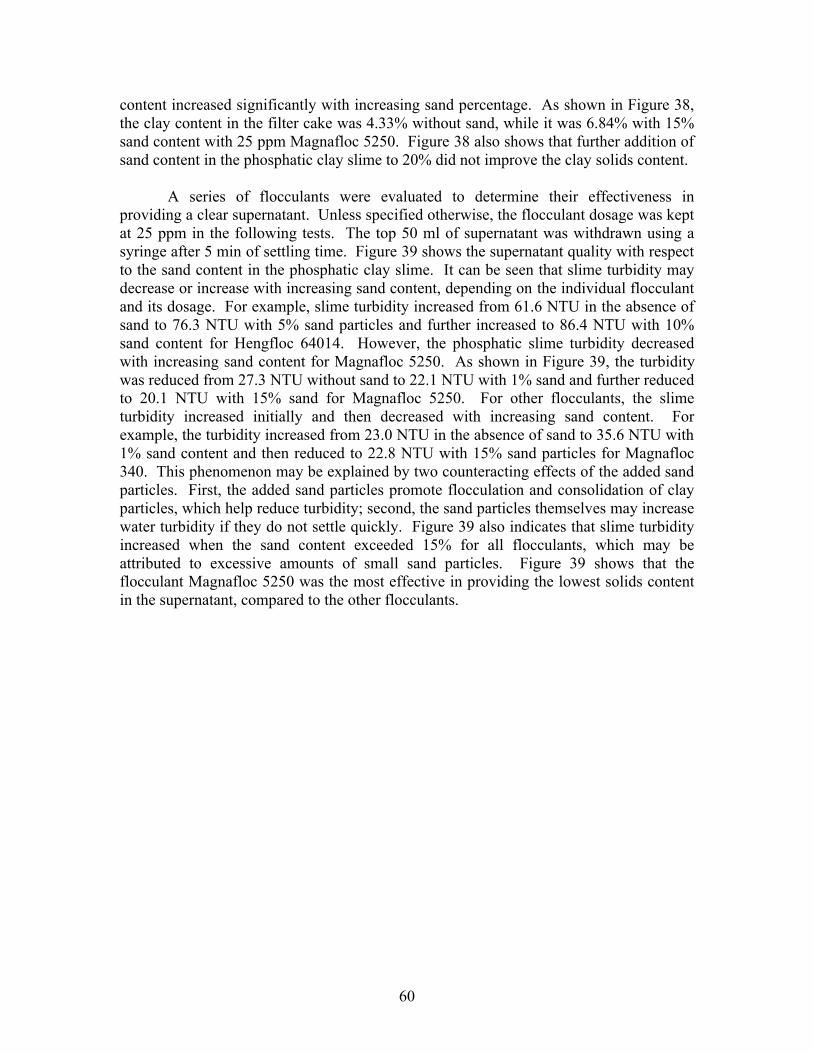
60
content increased significantly with increasing sand percentage. As shown in Figure 38, the clay content in the filter cake was 4.33% without sand, while it was 6.84% with 15% sand content with 25 ppm Magnafloc 5250. Figure 38 also shows that further addition of sand content in the phosphatic clay slime to 20% did not improve the clay solids content.
A series of flocculants were evaluated to determine their effectiveness in providing a clear supernatant. Unless specified otherwise, the flocculant dosage was kept at 25 ppm in the following tests. The top 50 ml of supernatant was withdrawn using a syringe after 5 min of settling time. Figure 39 shows the supernatant quality with respect to the sand content in the phosphatic clay slime. It can be seen that slime turbidity may decrease or increase with increasing sand content, depending on the individual flocculant and its dosage. For example, slime turbidity increased from 61.6 NTU in the absence of sand to 76.3 NTU with 5% sand particles and further increased to 86.4 NTU with 10% sand content for Hengfloc 64014. However, the phosphatic slime turbidity decreased with increasing sand content for Magnafloc 5250. As shown in Figure 39, the turbidity was reduced from 27.3 NTU without sand to 22.1 NTU with 1% sand and further reduced to 20.1 NTU with 15% sand for Magnafloc 5250. For other flocculants, the slime turbidity increased initially and then decreased with increasing sand content. For example, the turbidity increased from 23.0 NTU in the absence of sand to 35.6 NTU with 1% sand content and then reduced to 22.8 NTU with 15% sand particles for Magnafloc 340. This phenomenon may be explained by two counteracting effects of the added sand particles. First, the added sand particles promote flocculation and consolidation of clay particles, which help reduce turbidity; second, the sand particles themselves may increase water turbidity if they do not settle quickly. Figure 39 also indicates that slime turbidity increased when the sand content exceeded 15% for all flocculants, which may be attributed to excessive amounts of small sand particles. Figure 39 shows that the flocculant Magnafloc 5250 was the most effective in providing the lowest solids content in the supernatant, compared to the other flocculants.
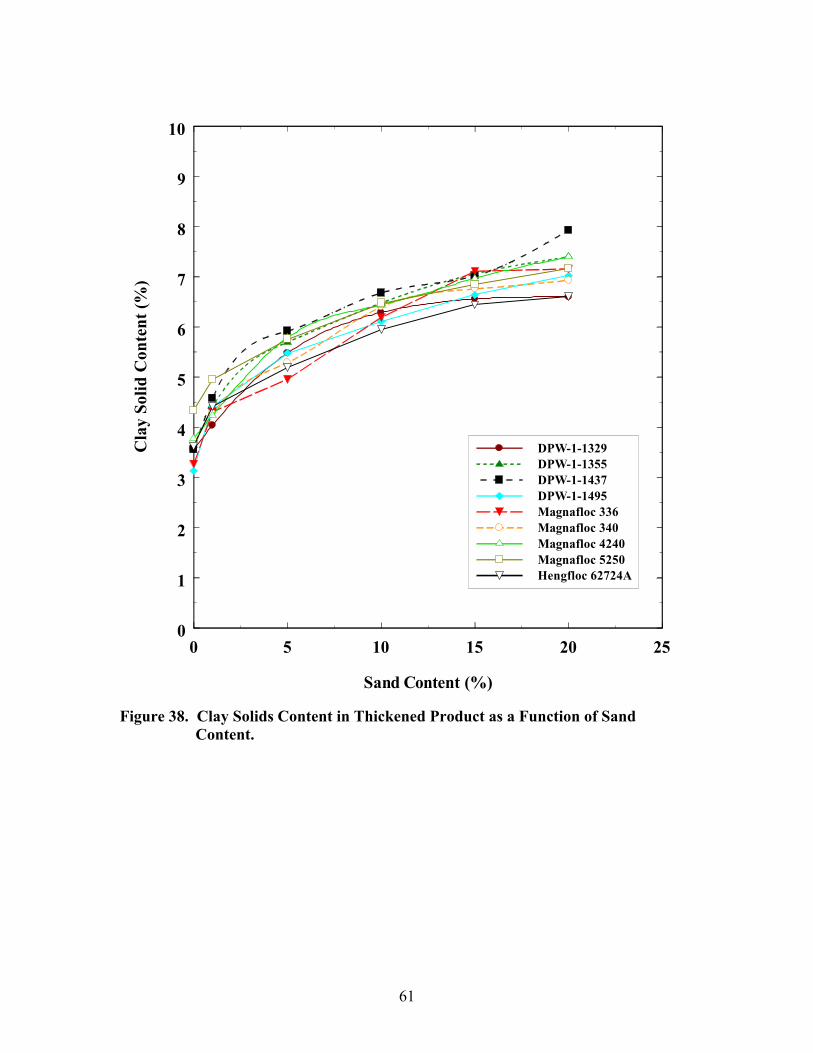
61
0 5 10 15 20 25
Sand Content (%)
0
1
2
3
4
5
6
7
8
9
10C
lay
Solid
Con
tent
(%)
DPW-1-1329DPW-1-1355DPW-1-1437DPW-1-1495Magnafloc 336Magnafloc 340Magnafloc 4240Magnafloc 5250Hengfloc 62724A
Figure 38. Clay Solids Content in Thickened Product as a Function of Sand
Content.
62
0 5 10 15 20 25
Sand Content (%)
0
10
20
30
40
50
60
70
80
90
100T
urbi
dity
(NT
U)
DPW-1-1329DPW-1-1355DPW-1-1437DPW-1-1495Magnafloc 336Magnafloc 340Magnafloc 4240Magnafloc 5250Hengfloc 64014
Figure 39. Turbidity of Flocculated Phosphatic Clay Slime as a Function of Sand Content.
Filtration time was also used as a criterion for evaluating flocculation
characteristics. The effects of different sand contents on flocculated clay filtration time were investigated and the results are shown in Figure 40. This figure shows that the filtration time of flocculated clay decreased with increasing sand percent in the phosphatic clay slime. For example, the filtration time was 82.2 seconds without sand for DPW-1-1437, while it was only 14.3 seconds with 15% sand content. Figure 40 also indicates that Magnafloc 340 and Magnafloc 5250 showed similar behavior.
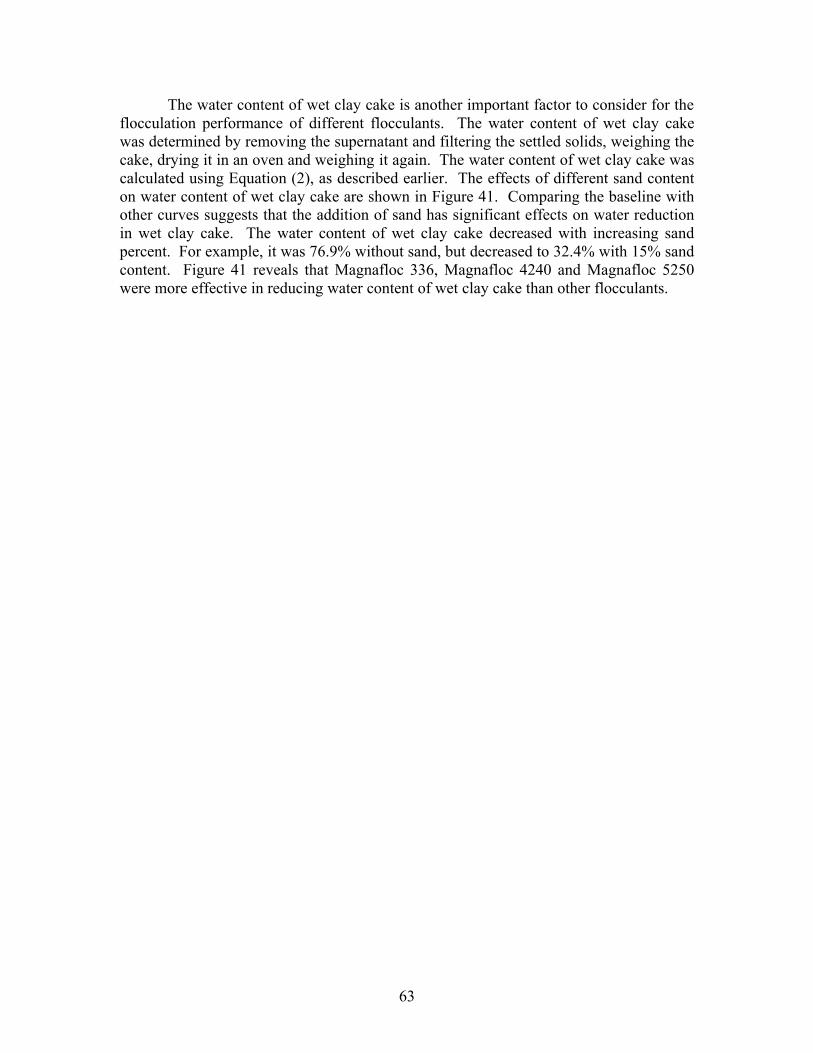
63
The water content of wet clay cake is another important factor to consider for the flocculation performance of different flocculants. The water content of wet clay cake was determined by removing the supernatant and filtering the settled solids, weighing the cake, drying it in an oven and weighing it again. The water content of wet clay cake was calculated using Equation (2), as described earlier. The effects of different sand content on water content of wet clay cake are shown in Figure 41. Comparing the baseline with other curves suggests that the addition of sand has significant effects on water reduction in wet clay cake. The water content of wet clay cake decreased with increasing sand percent. For example, it was 76.9% without sand, but decreased to 32.4% with 15% sand content. Figure 41 reveals that Magnafloc 336, Magnafloc 4240 and Magnafloc 5250 were more effective in reducing water content of wet clay cake than other flocculants.

64
0 5 10 15 20 25
Sand Content (%)
0
25
50
75
100
125
150F
iltra
tion
Tim
e (s
)DPW-1-1329DPW-1-1355DPW-1-1437DPW-1-1495Magnafloc 336Magnafloc 340Magnafloc 4240Magnafloc 5250Hengfloc 64014
Figure 40. Filtration Time of Flocculated Phosphatic Clay Slime as a Function of
Sand Content.
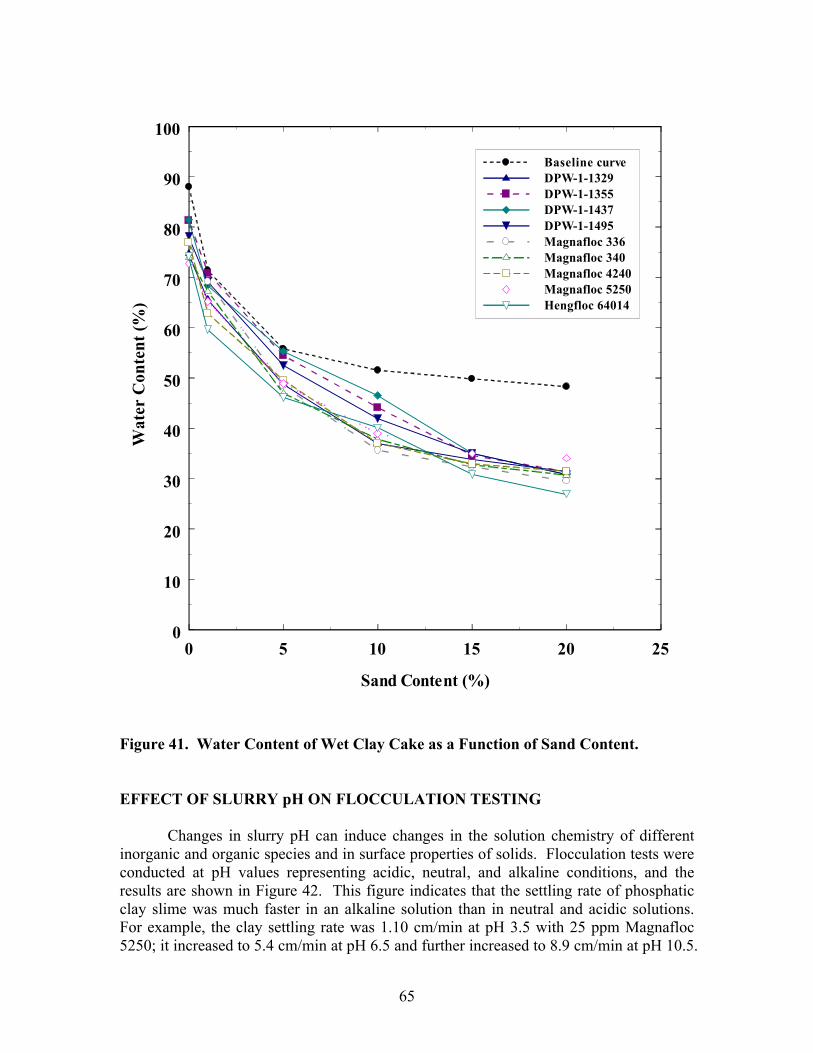
65
0 5 10 15 20 25
Sand Content (%)
0
10
20
30
40
50
60
70
80
90
100W
ater
Con
tent
(%)
Baseline curveDPW-1-1329DPW-1-1355DPW-1-1437DPW-1-1495Magnafloc 336Magnafloc 340Magnafloc 4240Magnafloc 5250Hengfloc 64014
Figure 41. Water Content of Wet Clay Cake as a Function of Sand Content. EFFECT OF SLURRY pH ON FLOCCULATION TESTING
Changes in slurry pH can induce changes in the solution chemistry of different inorganic and organic species and in surface properties of solids. Flocculation tests were conducted at pH values representing acidic, neutral, and alkaline conditions, and the results are shown in Figure 42. This figure indicates that the settling rate of phosphatic clay slime was much faster in an alkaline solution than in neutral and acidic solutions. For example, the clay settling rate was 1.10 cm/min at pH 3.5 with 25 ppm Magnafloc 5250; it increased to 5.4 cm/min at pH 6.5 and further increased to 8.9 cm/min at pH 10.5.

66
This is because Mg2+ and Ca2+ ions in the slurry easily form the precipitates of Mg(OH)2 and Ca(OH)2 under alkaline conditions. Such precipitates can act as coagulating agents, which gather particles into a cluster or clot, referred to as a coagulum. Coagula can be flocculated more readily than individual particles by polymers (El-Shall and others 1989; Sworska and others 2000).
Sometimes the clay particles are too small to settle out quickly enough using flocculation alone. Two processes, known as flocculation and coagulation, are used to create larger particles that will settle quickly to the bottom. In flocculation, small particles are made to agglomerate by mixing the slurry with a flocculant, thus bringing the particles into contact with one another. When the agglomeration of particles gets large enough, the aggregate can settle in slurry by sedimentation. Other suspended particles do not agglomerate well by flocculation. To remove these particles from the clay slurry, coagulation must be used. Coagulation is the process of gathering particles into a cluster or clot, often achieved by the addition of special chemicals known as coagulants. However, the polymer charge increased significantly with further increasing slurry pH, which led to an expansion of the polymer chain by mutual repulsion between negatively charged segments. El-Shall and others (1989) and Sworska and others (2000) reached similar conclusions from the study of phosphatic clay dewatering using polyacrylamide as flocculant. It was reported that the settling rate increased from 1.4 to 1.7 cm/min at 20 ppm polyacrylamide when slurry pH changed from 4.5 to 10.
The effects of slurry pH on clay solids content in the thickened slurry are shown in Figure 43. The figure shows that a lower solids content was obtained in pH 3.5 solution, and solids content remained essentially constant from pH 5.0 to pH 10.5. The effect of slurry pH on supernatant turbidity is shown in Figure 44. It is clear that the best supernatant quality was obtained at pH 5.0. Slime turbidity is much higher in alkaline solutions than in neutral and acidic solutions. For example, the slime turbidity was 16.0 NTU at pH 5.0; it increased to 94.2 NTU at pH 10.5. This may be related to the fact that phosphatic clay flocs settle faster in alkaline solutions than in acidic and neutral solutions. The unflocculated fine clay particles may increase water turbidity if they do not settle quickly.
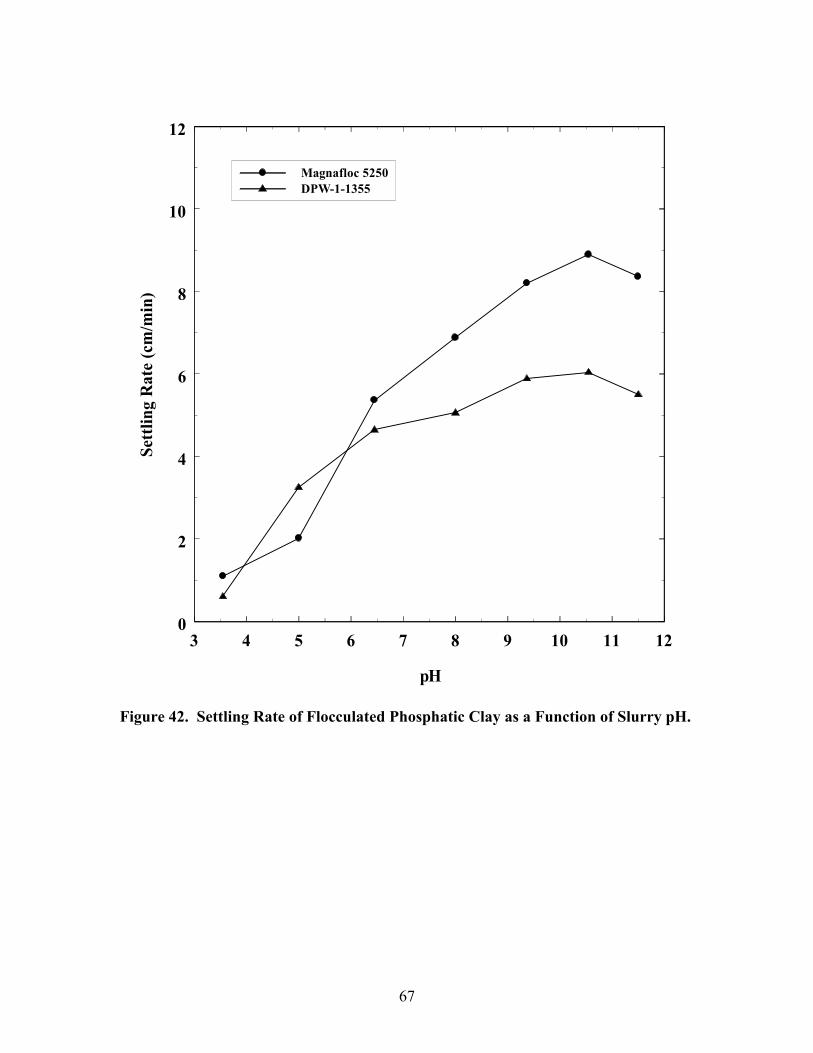
67
3 4 5 6 7 8 9 10 11 12
pH
0
2
4
6
8
10
12Se
ttlin
g R
ate
(cm
/min
)Magnafloc 5250DPW-1-1355
Figure 42. Settling Rate of Flocculated Phosphatic Clay as a Function of Slurry pH.
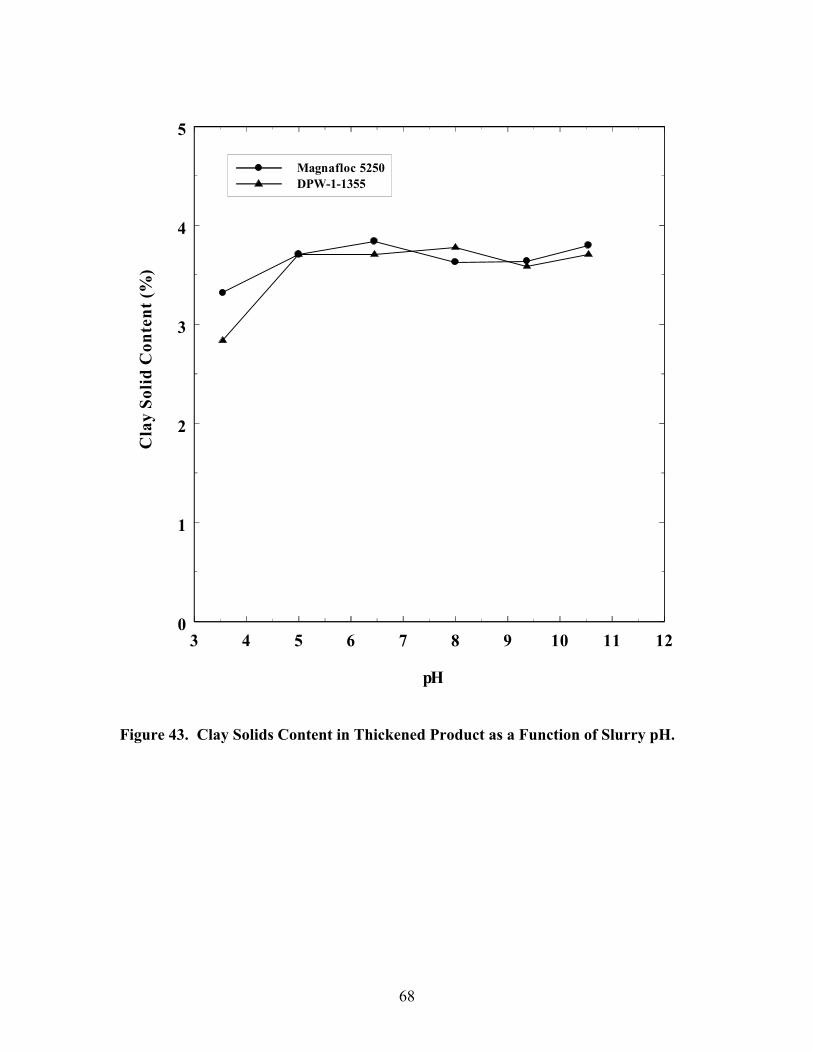
68
3 4 5 6 7 8 9 10 11 12
pH
0
1
2
3
4
5C
lay
Soli
d C
onte
nt (%
)Magnafloc 5250DPW-1-1355
Figure 43. Clay Solids Content in Thickened Product as a Function of Slurry pH.
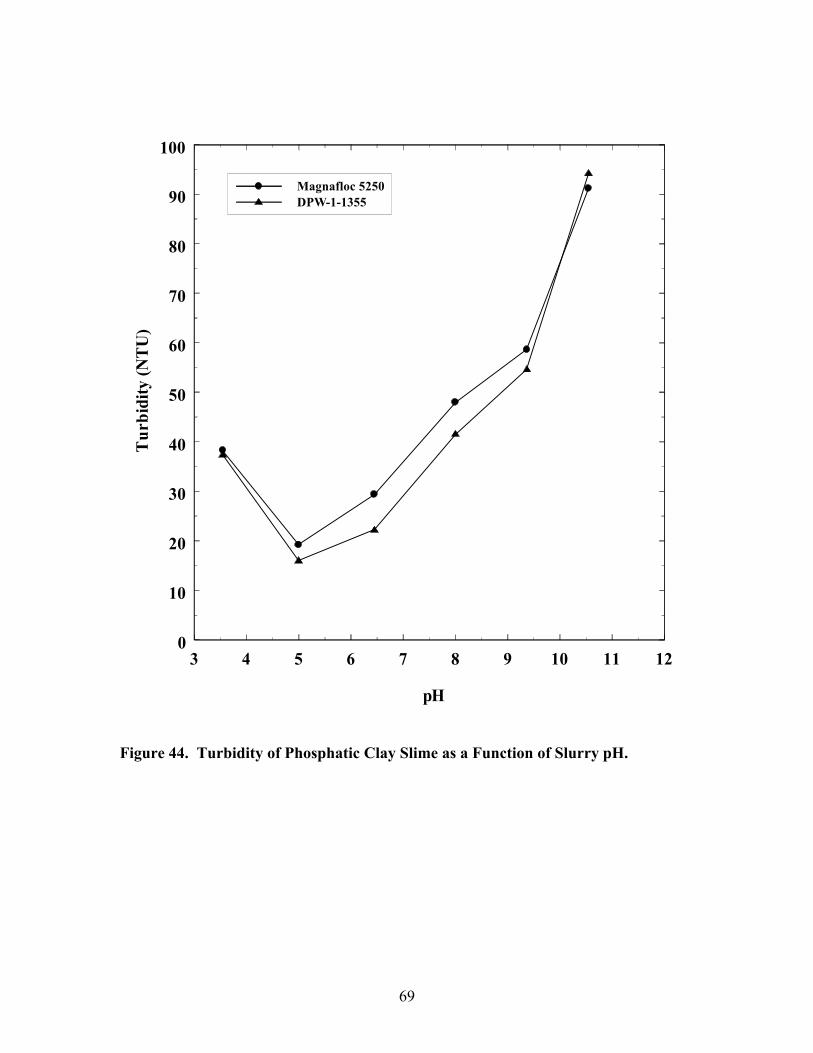
69
3 4 5 6 7 8 9 10 11 12
pH
0
10
20
30
40
50
60
70
80
90
100T
urbi
dity
(NT
U)
Magnafloc 5250DPW-1-1355
Figure 44. Turbidity of Phosphatic Clay Slime as a Function of Slurry pH.

70
The effects of different slurry pH on flocculated clay filtration time are shown in Figure 45. This figure clearly indicates that the flocculated clay filtration time decreased with increasing slurry pH. The flocculated clay filtration time was 120.4 seconds at pH 3.5 and 85 seconds at pH 10.5. This figure also reveals that the optimum filtration time was obtained in weak alkaline solutions. The water content of wet clay cake with respect to slurry pH is shown in Figure 46. As can be seen, the water content of wet clay cake increased with increasing slurry pH. For example, the water content of wet clay cake was 75.2% at pH 3.5, while it increased to 84.2% at pH 9.4.
Based on the above results, it can be concluded that a higher solution pH increased the slurry settling rate and clay solids content in the thickened slurry, but reduced the supernatant quality and solids content in the filter cake.
3 4 5 6 7 8 9 10 11 12
pH
0
20
40
60
80
100
120
140
160
Filt
rati
on T
ime
(s)
Magnafloc 5250DPW-1-1355
Figure 45. Filtration Time of Flocculated Phosphatic Clay Slime as a Function of
Slurry pH.

71
3 4 5 6 7 8 9 10 11 12
pH
40
50
60
70
80
90
100W
ater
Con
tent
(%)
Magnafloc 5250DPW-1-1355
Figure 46. Water Content of Wet Clay Cake as a Function of Slurry pH. EFFECT OF FLOCCULANT ADDITION STEPS ON CLAY FLOCCULATION
The disposal of phosphatic clays—a waste product of phosphate beneficiation—is a formidable task owing to their fine size and low self-weight consolidation of the clay particles. The effects of flocculant addition steps on flocculation performance were investigated by changing the addition step from 1, 2, 3, 4, 5, to 6 with and without sand addition. DPW-1-1355 was used as the flocculant since it showed good flocculation responses in the previous tests. The dosage varied from 12, 18, 25 to 40 ppm and the results are plotted in Figure 47. The phosphatic clay settling rate increased from 7.57
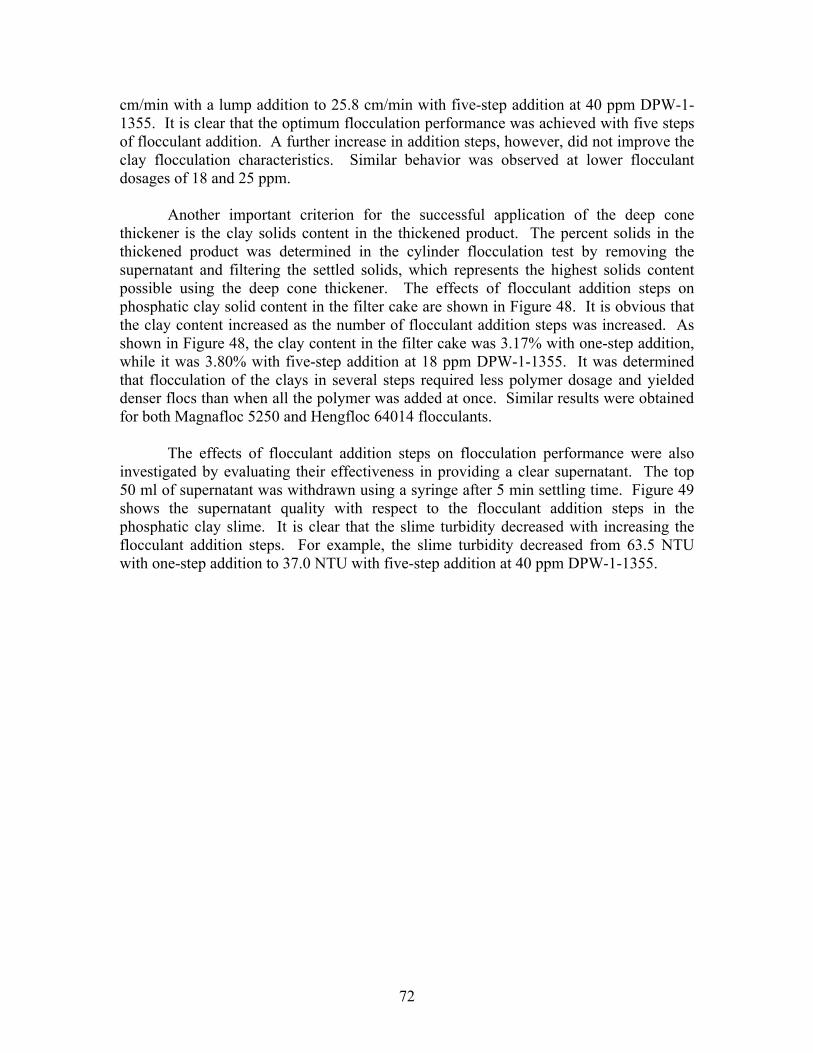
72
cm/min with a lump addition to 25.8 cm/min with five-step addition at 40 ppm DPW-1-1355. It is clear that the optimum flocculation performance was achieved with five steps of flocculant addition. A further increase in addition steps, however, did not improve the clay flocculation characteristics. Similar behavior was observed at lower flocculant dosages of 18 and 25 ppm.
Another important criterion for the successful application of the deep cone thickener is the clay solids content in the thickened product. The percent solids in the thickened product was determined in the cylinder flocculation test by removing the supernatant and filtering the settled solids, which represents the highest solids content possible using the deep cone thickener. The effects of flocculant addition steps on phosphatic clay solid content in the filter cake are shown in Figure 48. It is obvious that the clay content increased as the number of flocculant addition steps was increased. As shown in Figure 48, the clay content in the filter cake was 3.17% with one-step addition, while it was 3.80% with five-step addition at 18 ppm DPW-1-1355. It was determined that flocculation of the clays in several steps required less polymer dosage and yielded denser flocs than when all the polymer was added at once. Similar results were obtained for both Magnafloc 5250 and Hengfloc 64014 flocculants.
The effects of flocculant addition steps on flocculation performance were also investigated by evaluating their effectiveness in providing a clear supernatant. The top 50 ml of supernatant was withdrawn using a syringe after 5 min settling time. Figure 49 shows the supernatant quality with respect to the flocculant addition steps in the phosphatic clay slime. It is clear that the slime turbidity decreased with increasing the flocculant addition steps. For example, the slime turbidity decreased from 63.5 NTU with one-step addition to 37.0 NTU with five-step addition at 40 ppm DPW-1-1355.
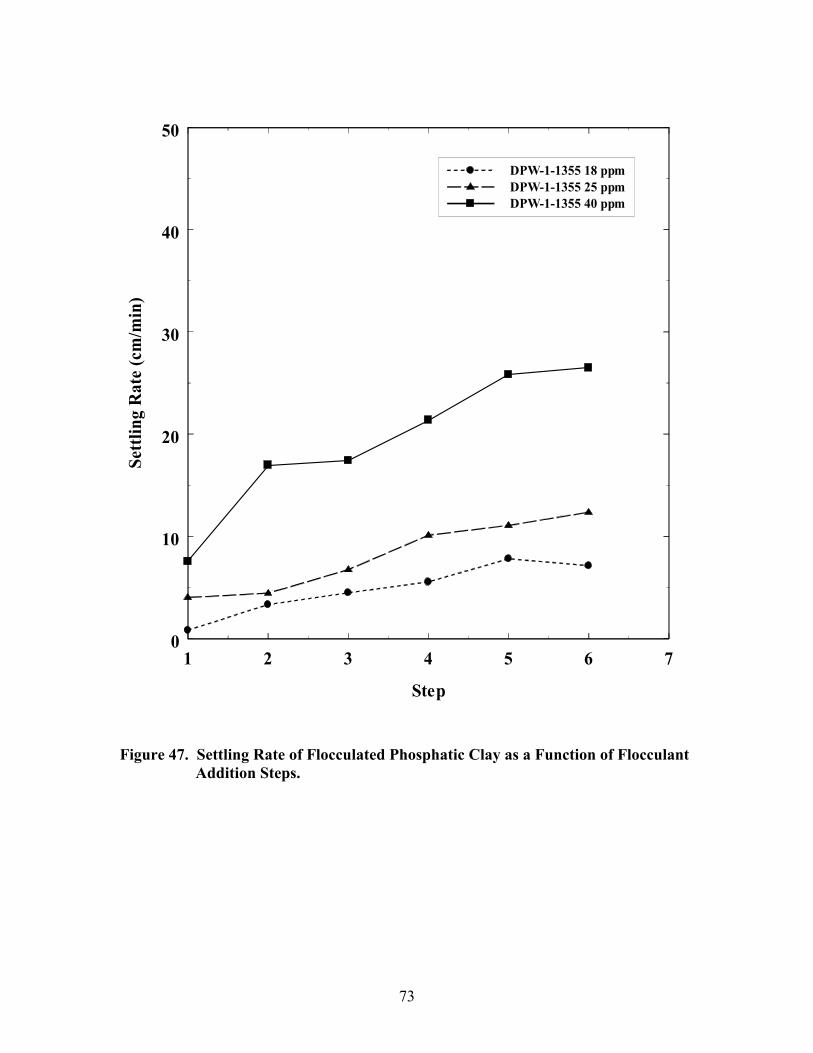
73
1 2 3 4 5 6 7
Step
0
10
20
30
40
50Se
ttlin
g R
ate
(cm
/min
)
DPW-1-1355 18 ppmDPW-1-1355 25 ppmDPW-1-1355 40 ppm
Figure 47. Settling Rate of Flocculated Phosphatic Clay as a Function of Flocculant
Addition Steps.

74
1 2 3 4 5 6 7
Step
0
1
2
3
4
5
6
7C
lay
Solid
Con
tent
(%)
DPW-1-1355 18 ppmDPW-1-1355 25 ppmDPW-1-1355 40 ppm
Figure 48. Clay Solids Content in Thickened Product as a Function of Flocculant
Addition Steps.

75
1 2 3 4 5 6 7
Step
0
10
20
30
40
50
60
70
80
90
100T
urbi
dity
(NT
U)
DPW-1-1355 18 ppmDPW-1-1355 25 ppmDPW-1-1355 40 ppm
Figure 49. Turbidity of Flocculated Clay Slime as a Function of Flocculant
Addition Steps.
To identify the best performance of different flocculant addition steps to provide a high settling rate of the flocculated particles, tests were conducted using 500 ml of the refuse slurry in a 500 ml graduated cylinder. The beneficiation waste sand was first added at a dosage of 5% to the slurry and then a known amount of flocculant solution was added to the slurry in the cylinder. The materials were mixed by inverting the cylinder five times. The settling rate of the flocculated solids was monitored using a stop watch. Figure 50 shows the settling rate of flocculated phosphatic clay as a function of flocculant addition steps using DPW-1-1355 as the flocculant. The dosage of the flocculant was changed from 12, 18, 25, to 40 ppm. Comparing Figure 50 with Figure 8 suggests that the settling rate increased substantially with 5% sand addition. For example,
76
the phosphatic slime settling rate was 126.58 cm/min with 5% sand content at 40 ppm DPW-1-1355, which is about five times greater than the rate of 25.52 cm/min without sand content. Similar results were obtained at other dosages. This behavior may be caused by the fact that denser flocs were formed with the addition of sand particles, increasing the settling rate.
The effects of different flocculant addition steps on phosphatic clay solids content in the filter cake with 5% sand content are shown in Figure 51. This figure indicates that the clay content increased significantly as the number of flocculant addition steps increased. As shown in Figure 51, the clay content in the filter cake was 2.55% with one-step flocculant addition, while it was 5.40% with five-step flocculant addition at 12 ppm DPW-1-1355. Figure 51 also shows that further increase in flocculant addition steps did not improve the clay solids content in the filter cake.
The effect of flocculant addition steps with 5% sand content on supernatant turbidity is shown in Figure 52. It is clear that the best supernatant quality was obtained with five addition steps. The slime turbidity decreased significantly with increasing the flocculant addition steps. For example, the slime turbidity was 98.0 NTU with one-step flocculant addition; it decreased to 36.4 NTU with five-step addition. This may be related to the fact that denser flocs were formed with the addition of sand particles, decreasing the slime turbidity.

77
1 2 3 4 5 6 7
Step
0
25
50
75
100
125
150Se
ttlin
g R
ate
(cm
/min
)DPW-1-1355 12 ppmDPW-1-1355 18 ppmDPW-1-1355 25 ppmDPW-1-1355 40 ppm
Figure 50. Settling Rate of Flocculated Phosphatic Clay as a Function of Flocculant
Addition Steps with 5% Sand.
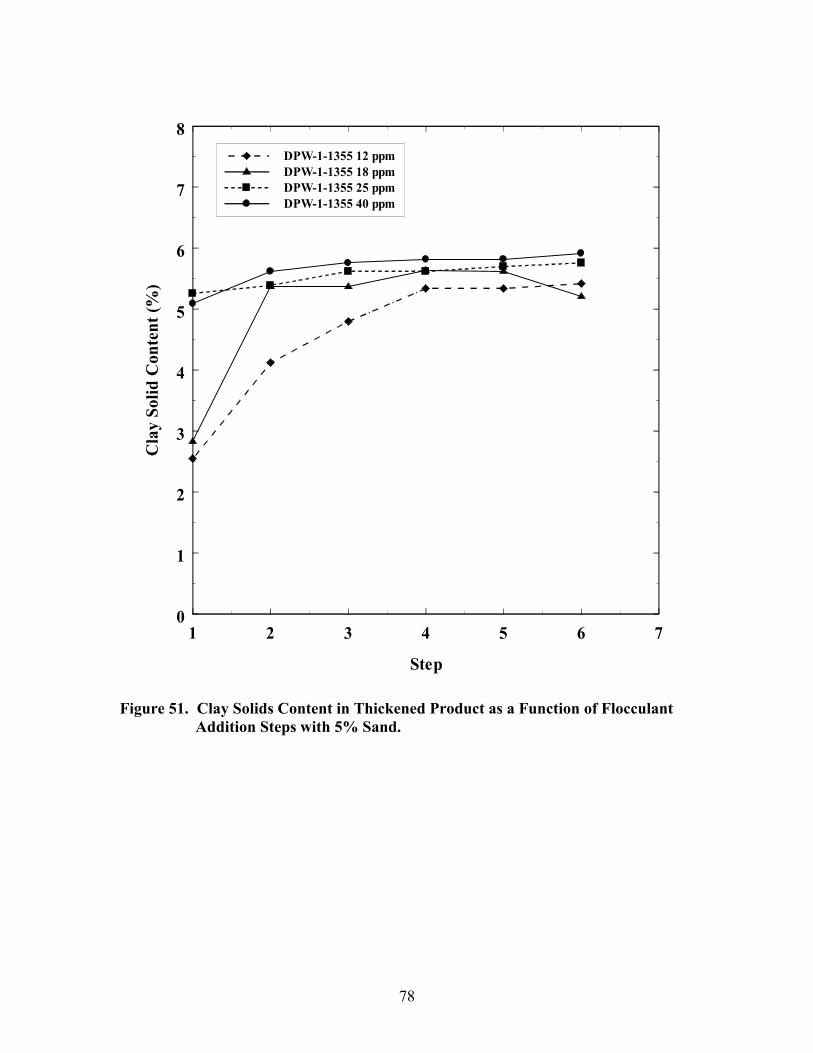
78
1 2 3 4 5 6 7
Step
0
1
2
3
4
5
6
7
8C
lay
Solid
Con
tent
(%)
DPW-1-1355 12 ppmDPW-1-1355 18 ppmDPW-1-1355 25 ppmDPW-1-1355 40 ppm
Figure 51. Clay Solids Content in Thickened Product as a Function of Flocculant
Addition Steps with 5% Sand.

79
1 2 3 4 5 6 7
Step
0
20
40
60
80
100
120T
urbi
dity
(NT
U)
DPW-1-1355 12 ppmDPW-1-1355 18 ppmDPW-1-1355 25 ppmDPW-1-1355 40 ppm
Figure 52. Turbidity of Flocculated Phosphatic Clay Slime as a Function of
Flocculant Addition Steps with 5% Sand. ZETA POTENTIAL MEASUREMENT
The surface charge on the clay particles plays an important role in flocculation performance. Zeta-Meter 3.0 was used for zeta potential measurements as shown in Figure 53. For the measurements of the zeta potential of phosphatic clay particles, the suspension was prepared by mixing 1.0 g phosphatic clay in 1000 ml deionized water and shaking vigorously to obtain a uniform suspension. The pH adjustment for the suspension was achieved by addition of NaOH or HCl solution. To determine the zeta potential of phosphatic clay particles in the presence of K+, Ca2+, or Al3+ ions, the predetermined amount of KCl, CaCl2, or AlCl3 solution was added and stirred for one

80
minute. Ten readings of the zeta potential were taken and averaged to obtain the reported value. Figure 54 shows the electrokinetic behavior of the phosphatic clay particles as a function of pH. It is clear that the clay particles have negatively charged surfaces above pH 2. The zeta potential curve for phosphatic clay monotonically decreased from 0 to -40 mV from pH 2 to pH 10. This can be attributed to the predominant oxygenic surface of phosphatic clay in the aqueous solution (Hall 1966; Ledoux and White 1966; Peng and Di 1994).
Figure 54 also shows the zeta potential curves of phosphatic clay particles as a function of pH in the presence of K+ ion, Ca2+ ion, and Al3+ ion. In the presence of 10-4 M AlCl3, a large positive value of the zeta potential was obtained. The zeta potential decreased from +30 mV to -7 mV as the pH value increased from 3 to 10 with a point-of-zero charge (PZC) at about pH 9.2. In the presence of 10-4 M CaCl2, the zeta potential of phosphatic clay remained nearly constant at -15 mV at pH 4 or higher. Nevertheless, as the pH value decreased to below 4, the zeta potential increased sharply from a negative value to a positive value, with the PZC at about pH 3.2. However, in the presence of 10-4 M KCl, the zeta potential of clay particles changed very little and the particles remained negatively charged at pH above 2.5 with a PZC at pH 2.0.
Figure 53. Zeta-Meter 3.0.
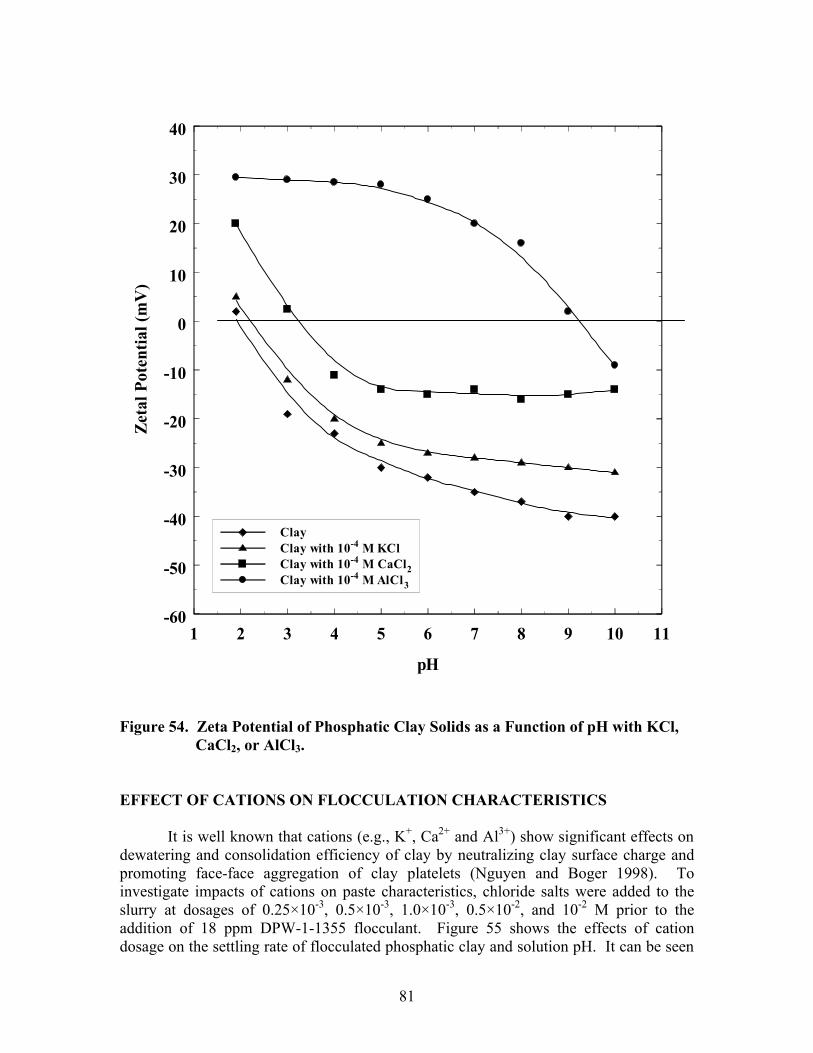
81
1 2 3 4 5 6 7 8 9 10 11
pH
-60
-50
-40
-30
-20
-10
0
10
20
30
40Z
etal
Pot
entia
l (m
V)
ClayClay with 10-4 M KClClay with 10-4 M CaCl2Clay with 10-4 M AlCl3
Figure 54. Zeta Potential of Phosphatic Clay Solids as a Function of pH with KCl,
CaCl2, or AlCl3. EFFECT OF CATIONS ON FLOCCULATION CHARACTERISTICS
It is well known that cations (e.g., K+, Ca2+ and Al3+) show significant effects on dewatering and consolidation efficiency of clay by neutralizing clay surface charge and promoting face-face aggregation of clay platelets (Nguyen and Boger 1998). To investigate impacts of cations on paste characteristics, chloride salts were added to the slurry at dosages of 0.25×10⁻³, 0.5×10⁻³, 1.0×10⁻³, 0.5×10⁻², and 10-2 M prior to the addition of 18 ppm DPW-1-1355 flocculant. Figure 55 shows the effects of cation dosage on the settling rate of flocculated phosphatic clay and solution pH. It can be seen
82
that K+ improved the flocculation characteristics, while Ca2+ and Al3+ showed adverse effects on flocculation performance.
Anionic polymer DPW-1-1355 has the long hydrocarbon chain –CH2–CH2–CH2– as the main structure with amide groups, –CONH2. Some amide groups along the chain are replaced by carboxylic groups (–COO-) in the aqueous solution. The repulsive force of the negatively charged functional groups on DPW-1-1355 induces the extendibility of the long hydrocarbon chain of the polymer, which is advantageous for the polymer to be an effective flocculant.
It is known that the fundamental structural and electrochemical properties are considerably different for the edge and basal surfaces (Pefferkorn and others 1985). The adsorption of flocculant on phosphatic clay is thus dependent on pH and is considered as a function of basal faces and edges of clay particles. The basal faces may act as non-adsorbing or weak-adsorbing surfaces, while the edge surfaces may act as adsorbing surfaces, as suggested by Pefferkorn, Lee, and their co-workers (Pefferkorn and others 1985; Lee and others 1992; Peng and Di 1994). The adsorption of polymer on the basal surfaces may be weak, which is mainly driven by the nonspecific van der Waals forces and/or by an entropic variation. However, the adsorption of anionic flocculant on the edge surfaces of clay has a much higher adsorption capacity than on the basal surfaces. The high-adsorptive capacity on the edge surfaces is likely due to specific interaction, i.e., hydrogen-bonding between amide groups of the DPW-1-1355 and the edge surfaces of clay particles (Lee and others 1992; Peng and Di 1994). Thus, the adsorption should parallel the variation of the adsorption capacity on the clay faces.
Figure 55 indicates that the addition of K+ species in the clay slurry increased the clay settling rate, possibly by neutralizing clay surface charge and promoting face-face aggregation of clay platelets. The phosphatic clay settling rate reached a maximum value of 9.10 cm/min at the 5 × 10⁻³ M K+ concentration, and remained constant with further increase in the K+ dosage. This can be explained by the influence of K+ concentration on the clay zeta potential, as shown in Figure 54. At lower concentration, K+ was used to neutralize the clay surface charge, which is beneficial to the polymer adsorption on the clay particles. However, when the K+ concentration is too high, the excessive K+ became adsorbed on the polymer’s functional group, which prevented the polymer adsorption on the clay particles and thus reduced the clay settling rate.
Figure 55 also shows that the Ca2+ ion increased the clay settling rate at 10-3 M and then decreased the settling rate as Ca2+ concentration increased further. The inhibiting effect on the flocculation may be explained by the cross-linking of the chains of the organic polymer by the multivalent inorganic ions (Roberts and others 1974), which leads to the loss of the anionic character and extendibility of DPW-1-1355 and the formation of curled flocculant. In addition to Ca2+ ions, a considerable number of CaOH+ may exist in the clay suspension. The increase in calcium species adsorbed on the anionic polymer may also be responsible for the inhibiting effect on the clay flocculation observed in Figure 55 (Li and Somasundaran 1992; Peng and Di 1994).
83
The precipitation of the hydroxyl complex of Ca2+ on the clay surface can also become an important factor in the clay flocculation process. The Ca2+ may be hydrolyzed to form a variety of the hydroxyl complex in the bulk solution and at the clay-water interface. Furthermore, the dielectric constant of the interface medium is significantly lower than that of the bulk solution (Peng and Di 1994). Therefore, the conditions for the formation of hydroxyl complex precipitates in the solution and in the interface may be expressed by the solubility products of the calcium hydroxyl complex in the bulk solution, Ksp and at the interface, Ksp
s. The difference between Ksp and Ksps can be calculated from
the relationship among the dissolution equilibrium for the calcium hydroxyl complex in the bulk solution and in the interface and the solubility products, as well as the free energies, +∆ 2CaG for Ca2+ and −∆ OHG for OH- in the media (James and Healy 1972; Dean 1999; Peng and Di 1994), respectively.
RTGGKK OHCasspsp 303.2/)()/log( 2 −+ ∆+∆=
)(2.6865 12
−•=∆ + molJGCa
)(5.1579 1−•=∆ − molJGOH
Thus, 50.1=SSP
SP
K
K
The solubility product of the calcium hydroxyls at the interface is one and one-
half orders of magnitude smaller than that of the bulk solution. In other words, Ca2+ ion can more easily produce hydroxide precipitates on the clay surface than in the bulk solution. The precipitation of calcium hydroxyl on the clay surface covers up the active functional groups, which prevents the formation of hydrogen bonding between clay and anionic DPW-1-1355. Consequently, this results in the reduction of adsorption on the clay surface and poor performance of the flocculation process.
Figure 55 also shows the effects of Al3+ ion on phosphatic clay settling rate. It is clear that at low dosage, Al3+ ion marginally increased the clay settling rate, possibly by neutralizing clay surface charge and promoting face-face aggregation of clay platelets. The flocculation deteriorated as the concentration of Al3+ ion increased. The suppression of flocculation by the presence of Al3+ ions is also pH-dependent. The results showed that the inhibiting effect of Al3+ ions on flocculation efficiency became more pronounced as the pH value decreased.
At pH 3.5 or lower, the majority of aluminum species in the solution are in the forms of Al3+, Al(OH)2+, and Al(OH)2
+. All of these positively charged ions have the tendency to adsorb on the carboxyl functional groups of anionic DPW-1-1355 by electrostatic force. Consequently, this reduces the extendibility of DPW-1-1355, leading to the poor performance of the flocculation process. At pH 6, aluminum hydroxyl compounds in the solution are Al(OH)3(s) (Ksp = 10-33.5), Al(OH)2+, Al(OH)2
+ and Al(OH)3(aq) (Dean 1999). In comparison with the acidic environment, the concentrations of the positively charged hydroxyl complexes are much lower and thus their effect on the flocculation is less significant, although some aluminum hydroxide precipitation on the

84
clay surface might also be expected. However, in solutions with a relatively high concentration of AlCl3, the aluminum hydroxides may precipitate on clay surfaces. This created an obstacle to the formation of hydrogen bonding between the polymer and clay, and thus reduced the flocculation efficiency. Figure 55. Effects of KCl, CaCl2, and AlCl3 Dosage on Flocculated Phosphatic Clay
Settling Rate. The effects of cation concentration on the clay solids content of thickened slurry were investigated, as shown in Figure 56. The flocculant dosage was kept at 18 ppm and the addition step was fixed at 5. It is obvious that the solids content remained constant
0.000 0.002 0.004 0.006 0.008 0.010 0.012
Dosage (M)
0
2
4
6
8
10
Sett
ling
Rat
e (c
m/m
in)
0
2
4
6
8
10
12
pH
KClCaCl2AlCl3
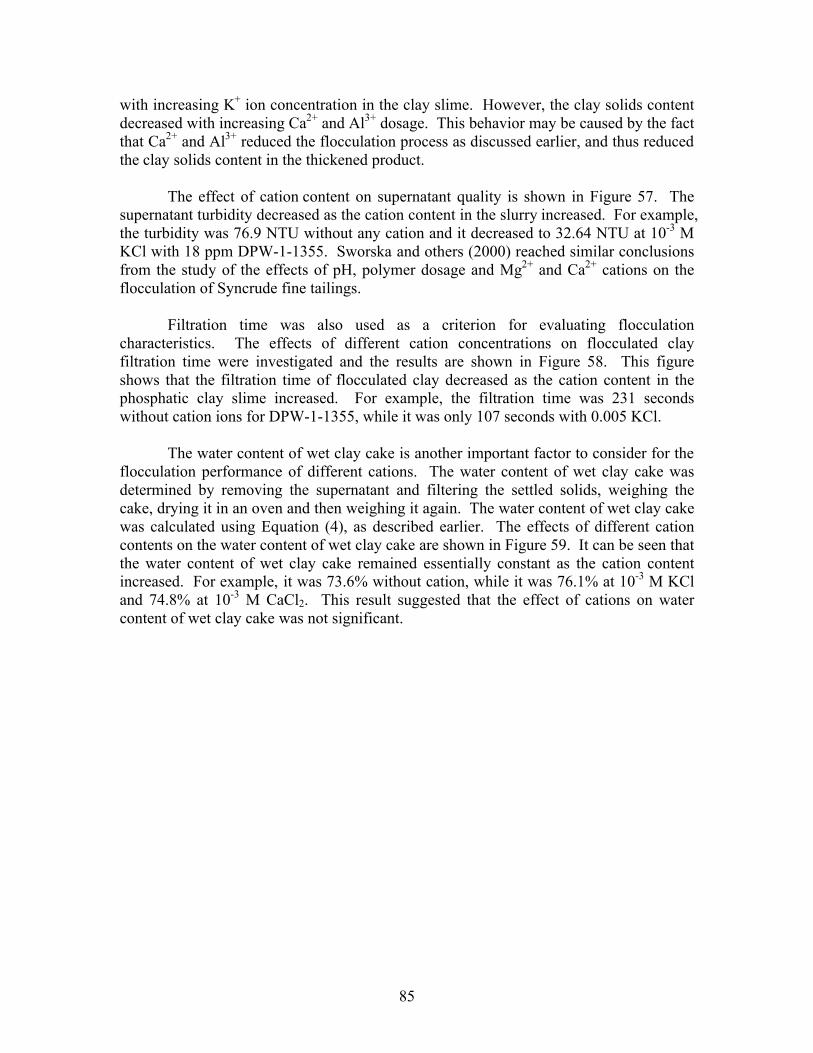
85
with increasing K+ ion concentration in the clay slime. However, the clay solids content decreased with increasing Ca2+ and Al3+ dosage. This behavior may be caused by the fact that Ca2+ and Al3+ reduced the flocculation process as discussed earlier, and thus reduced the clay solids content in the thickened product.
The effect of cation content on supernatant quality is shown in Figure 57. The supernatant turbidity decreased as the cation content in the slurry increased. For example, the turbidity was 76.9 NTU without any cation and it decreased to 32.64 NTU at 10-3 M KCl with 18 ppm DPW-1-1355. Sworska and others (2000) reached similar conclusions from the study of the effects of pH, polymer dosage and Mg2+ and Ca2+ cations on the flocculation of Syncrude fine tailings.
Filtration time was also used as a criterion for evaluating flocculation characteristics. The effects of different cation concentrations on flocculated clay filtration time were investigated and the results are shown in Figure 58. This figure shows that the filtration time of flocculated clay decreased as the cation content in the phosphatic clay slime increased. For example, the filtration time was 231 seconds without cation ions for DPW-1-1355, while it was only 107 seconds with 0.005 KCl.
The water content of wet clay cake is another important factor to consider for the flocculation performance of different cations. The water content of wet clay cake was determined by removing the supernatant and filtering the settled solids, weighing the cake, drying it in an oven and then weighing it again. The water content of wet clay cake was calculated using Equation (4), as described earlier. The effects of different cation contents on the water content of wet clay cake are shown in Figure 59. It can be seen that the water content of wet clay cake remained essentially constant as the cation content increased. For example, it was 73.6% without cation, while it was 76.1% at 10-3 M KCl and 74.8% at 10-3 M CaCl2. This result suggested that the effect of cations on water content of wet clay cake was not significant.

86
0.000 0.002 0.004 0.006 0.008 0.010 0.012
Dosage (M)
0
1
2
3
4
5
6
7C
lay
Solid
Con
tent
(%)
KClCaCl2AlCl3
Figure 56. Effects of KCl, CaCl2, and AlCl3 Dosage on Clay Solids Content in
Thickened Product.
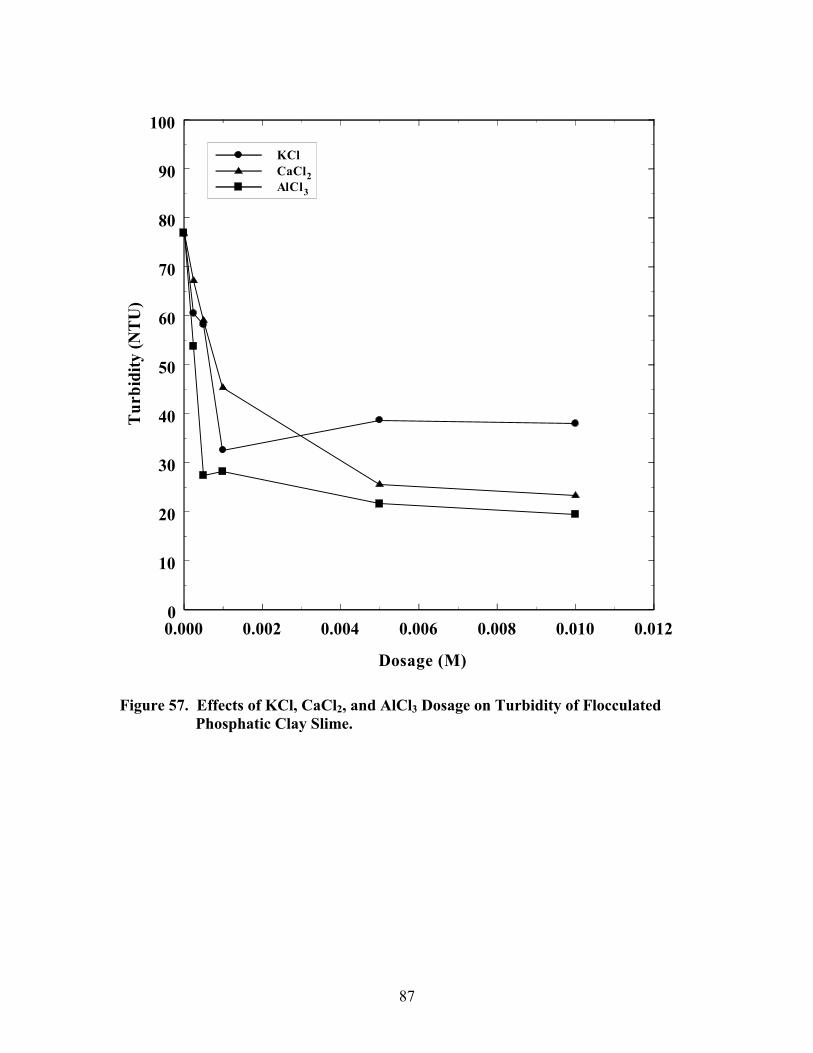
87
0.000 0.002 0.004 0.006 0.008 0.010 0.012
Dosage (M)
0
10
20
30
40
50
60
70
80
90
100T
urbi
dity
(NT
U)
KClCaCl2AlCl3
Figure 57. Effects of KCl, CaCl2, and AlCl3 Dosage on Turbidity of Flocculated
Phosphatic Clay Slime.

88
0.000 0.002 0.004 0.006 0.008 0.010 0.012
Dosage (M)
0
50
100
150
200
250
300Fi
ltrat
ion
Tim
e (s
ec)
KClCaCl2AlCl3
Figure 58. Effects of KCl, CaCl2, and AlCl3 Dosage on Filtration Time of Thickened
Phosphatic Clay Product.

89
0.000 0.002 0.004 0.006 0.008 0.010 0.012
Dosage (M)
0
10
20
30
40
50
60
70
80
90
100W
ater
Con
tent
(%)
KClCaCl2AlCl3
Figure 59. Effects of KCl, CaCl2, and AlCl3 Dosage on Water Content in Wet Clay
Cake. FUNDAMENTAL PASTE CHARACTERIZATION
Rheology is the most sensitive characterization for paste because flow behavior is responsive to properties such as solids concentration, shear rate, paste temperature, and pH. Rheology measurements are also useful in following the course of a chemical reaction. Such measurements can be employed as a quality check during production or to monitor and/or control a flocculation process. Rheological measurements allow the study of chemical, mechanical, and thermal treatments, or the effects of additives to the flocculation performance.
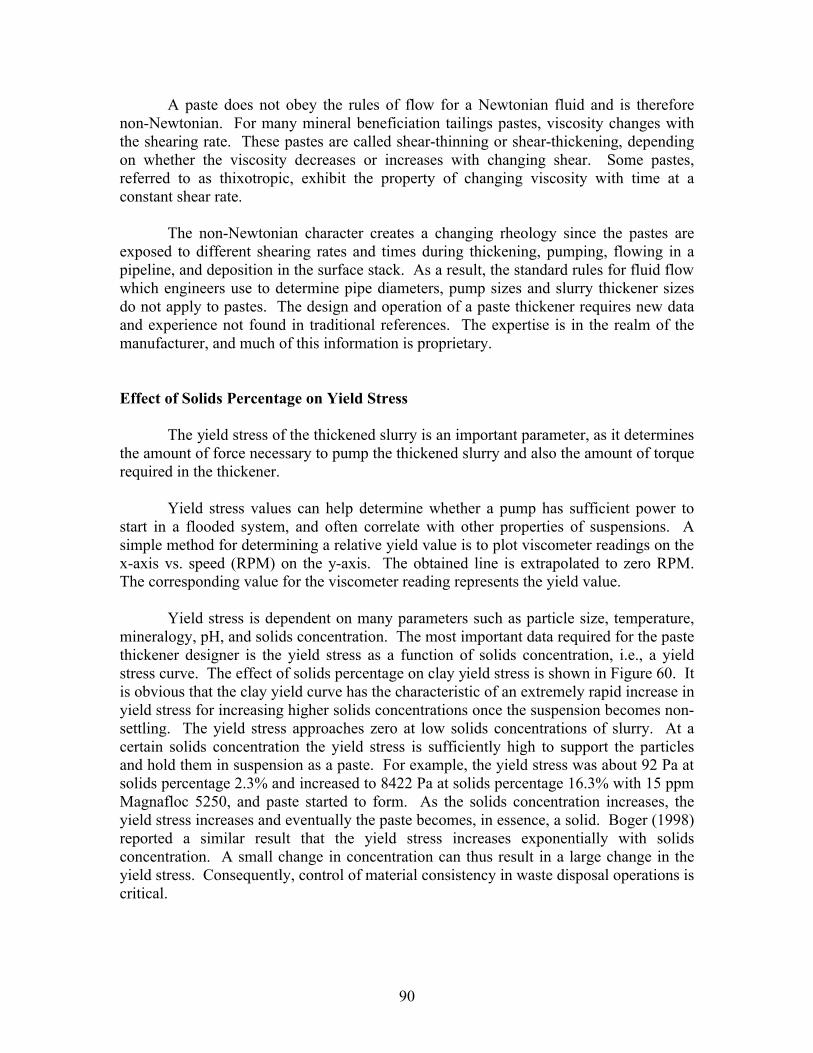
90
A paste does not obey the rules of flow for a Newtonian fluid and is therefore non-Newtonian. For many mineral beneficiation tailings pastes, viscosity changes with the shearing rate. These pastes are called shear-thinning or shear-thickening, depending on whether the viscosity decreases or increases with changing shear. Some pastes, referred to as thixotropic, exhibit the property of changing viscosity with time at a constant shear rate.
The non-Newtonian character creates a changing rheology since the pastes are exposed to different shearing rates and times during thickening, pumping, flowing in a pipeline, and deposition in the surface stack. As a result, the standard rules for fluid flow which engineers use to determine pipe diameters, pump sizes and slurry thickener sizes do not apply to pastes. The design and operation of a paste thickener requires new data and experience not found in traditional references. The expertise is in the realm of the manufacturer, and much of this information is proprietary. Effect of Solids Percentage on Yield Stress
The yield stress of the thickened slurry is an important parameter, as it determines the amount of force necessary to pump the thickened slurry and also the amount of torque required in the thickener.
Yield stress values can help determine whether a pump has sufficient power to start in a flooded system, and often correlate with other properties of suspensions. A simple method for determining a relative yield value is to plot viscometer readings on the x-axis vs. speed (RPM) on the y-axis. The obtained line is extrapolated to zero RPM. The corresponding value for the viscometer reading represents the yield value.
Yield stress is dependent on many parameters such as particle size, temperature, mineralogy, pH, and solids concentration. The most important data required for the paste thickener designer is the yield stress as a function of solids concentration, i.e., a yield stress curve. The effect of solids percentage on clay yield stress is shown in Figure 60. It is obvious that the clay yield curve has the characteristic of an extremely rapid increase in yield stress for increasing higher solids concentrations once the suspension becomes non-settling. The yield stress approaches zero at low solids concentrations of slurry. At a certain solids concentration the yield stress is sufficiently high to support the particles and hold them in suspension as a paste. For example, the yield stress was about 92 Pa at solids percentage 2.3% and increased to 8422 Pa at solids percentage 16.3% with 15 ppm Magnafloc 5250, and paste started to form. As the solids concentration increases, the yield stress increases and eventually the paste becomes, in essence, a solid. Boger (1998) reported a similar result that the yield stress increases exponentially with solids concentration. A small change in concentration can thus result in a large change in the yield stress. Consequently, control of material consistency in waste disposal operations is critical.

91
Figure 60 also shows that the yield stress was much higher with addition of Magnafloc 5250 than without addition of flocculant. For instance, the yield stress was only 546 Pa at 16.3% without flocculant, while it increased to 8422 Pa with 15 ppm Magnafloc 5250 at the same solids percentage. The bridging is believed to be the main adsorption mechanism of polymer flocculant on particles, and flocs were easily formed after the addition of flocculant, which increased the yield stress significantly.
The viscosity value was out of range for solids percentages between 25% and 30%. If the solids percentage was higher than 40%, there existed a space around the spindle when the viscosity meter was running. The comparison of clay underflow compaction at different solids percentages is shown in Figure 61. The solids percentage was therefore kept at less than 25% for the following tests.
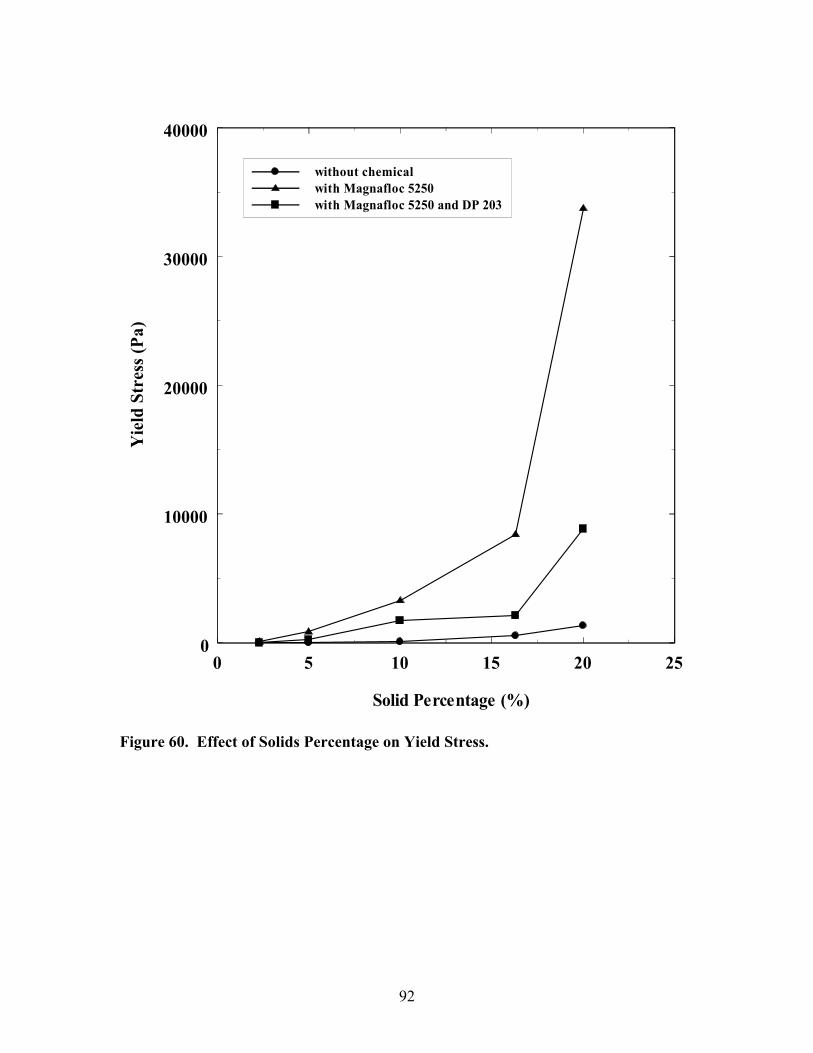
92
0 5 10 15 20 25
Solid Percentage (%)
0
10000
20000
30000
40000Y
ield
Str
ess
(Pa)
without chemicalwith Magnafloc 5250with Magnafloc 5250 and DP 203
Figure 60. Effect of Solids Percentage on Yield Stress.
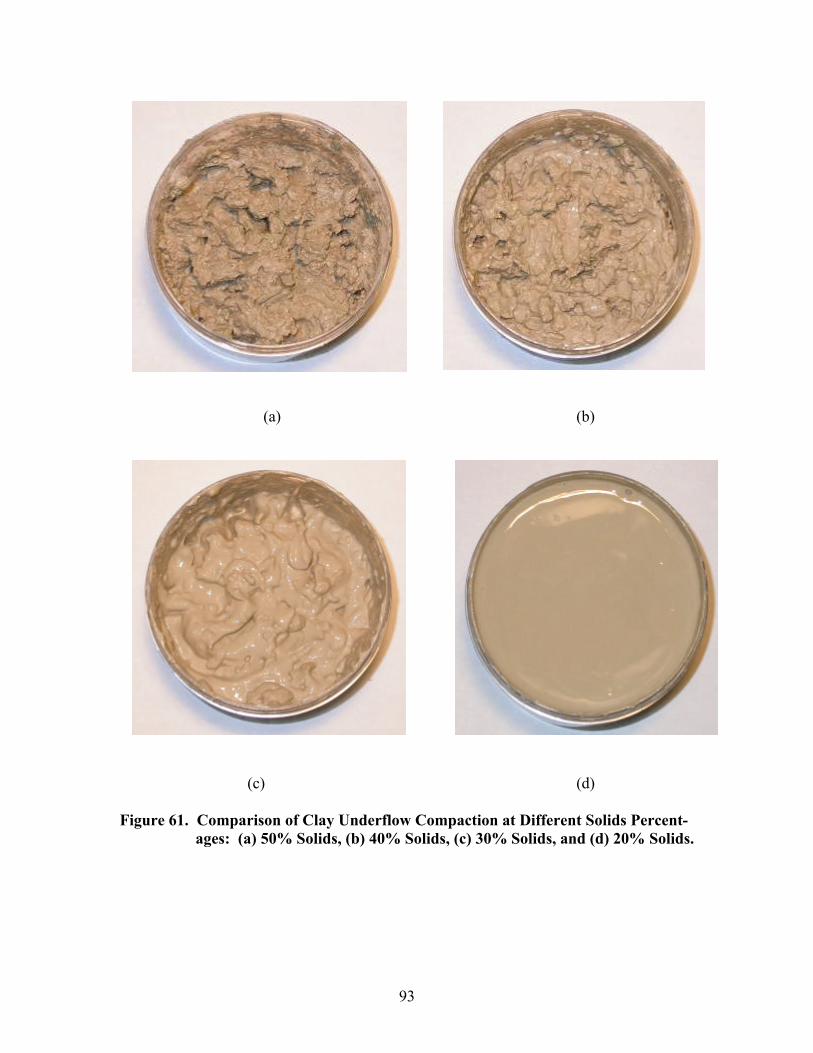
93
(a) (b) (c) (d) Figure 61. Comparison of Clay Underflow Compaction at Different Solids Percent-
ages: (a) 50% Solids, (b) 40% Solids, (c) 30% Solids, and (d) 20% Solids.
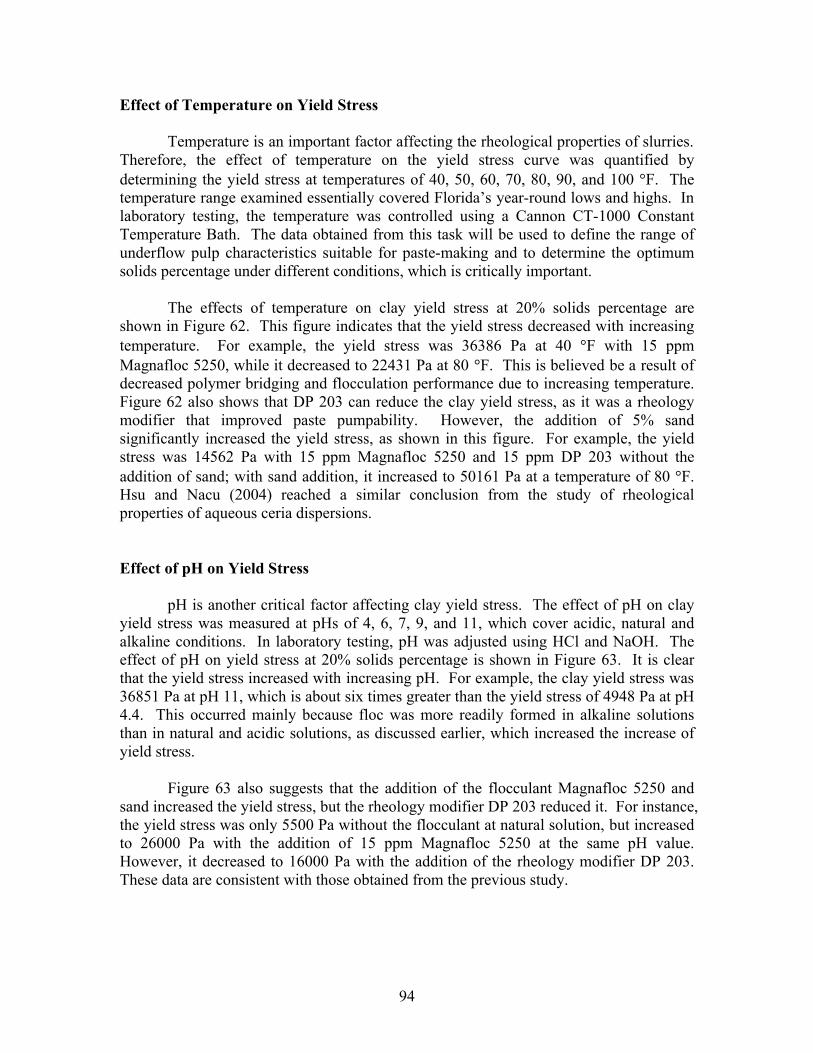
94
Effect of Temperature on Yield Stress
Temperature is an important factor affecting the rheological properties of slurries. Therefore, the effect of temperature on the yield stress curve was quantified by determining the yield stress at temperatures of 40, 50, 60, 70, 80, 90, and 100 °F. The temperature range examined essentially covered Florida’s year-round lows and highs. In laboratory testing, the temperature was controlled using a Cannon CT-1000 Constant Temperature Bath. The data obtained from this task will be used to define the range of underflow pulp characteristics suitable for paste-making and to determine the optimum solids percentage under different conditions, which is critically important.
The effects of temperature on clay yield stress at 20% solids percentage are shown in Figure 62. This figure indicates that the yield stress decreased with increasing temperature. For example, the yield stress was 36386 Pa at 40 °F with 15 ppm Magnafloc 5250, while it decreased to 22431 Pa at 80 °F. This is believed be a result of decreased polymer bridging and flocculation performance due to increasing temperature. Figure 62 also shows that DP 203 can reduce the clay yield stress, as it was a rheology modifier that improved paste pumpability. However, the addition of 5% sand significantly increased the yield stress, as shown in this figure. For example, the yield stress was 14562 Pa with 15 ppm Magnafloc 5250 and 15 ppm DP 203 without the addition of sand; with sand addition, it increased to 50161 Pa at a temperature of 80 °F. Hsu and Nacu (2004) reached a similar conclusion from the study of rheological properties of aqueous ceria dispersions. Effect of pH on Yield Stress
pH is another critical factor affecting clay yield stress. The effect of pH on clay yield stress was measured at pHs of 4, 6, 7, 9, and 11, which cover acidic, natural and alkaline conditions. In laboratory testing, pH was adjusted using HCl and NaOH. The effect of pH on yield stress at 20% solids percentage is shown in Figure 63. It is clear that the yield stress increased with increasing pH. For example, the clay yield stress was 36851 Pa at pH 11, which is about six times greater than the yield stress of 4948 Pa at pH 4.4. This occurred mainly because floc was more readily formed in alkaline solutions than in natural and acidic solutions, as discussed earlier, which increased the increase of yield stress.
Figure 63 also suggests that the addition of the flocculant Magnafloc 5250 and sand increased the yield stress, but the rheology modifier DP 203 reduced it. For instance, the yield stress was only 5500 Pa without the flocculant at natural solution, but increased to 26000 Pa with the addition of 15 ppm Magnafloc 5250 at the same pH value. However, it decreased to 16000 Pa with the addition of the rheology modifier DP 203. These data are consistent with those obtained from the previous study.
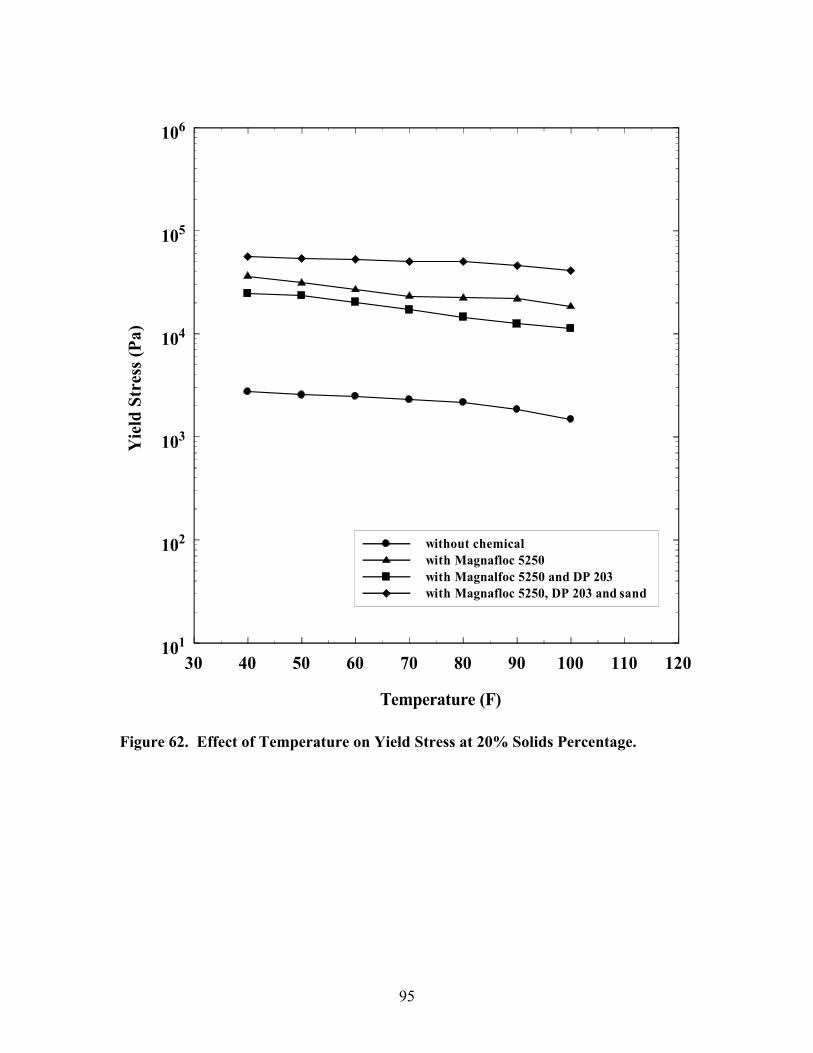
95
30 40 50 60 70 80 90 100 110 120
Temperature (F)
101
102
103
104
105
106Y
ield
Str
ess
(Pa)
without chemicalwith Magnafloc 5250with Magnalfoc 5250 and DP 203with Magnafloc 5250, DP 203 and sand
Figure 62. Effect of Temperature on Yield Stress at 20% Solids Percentage.
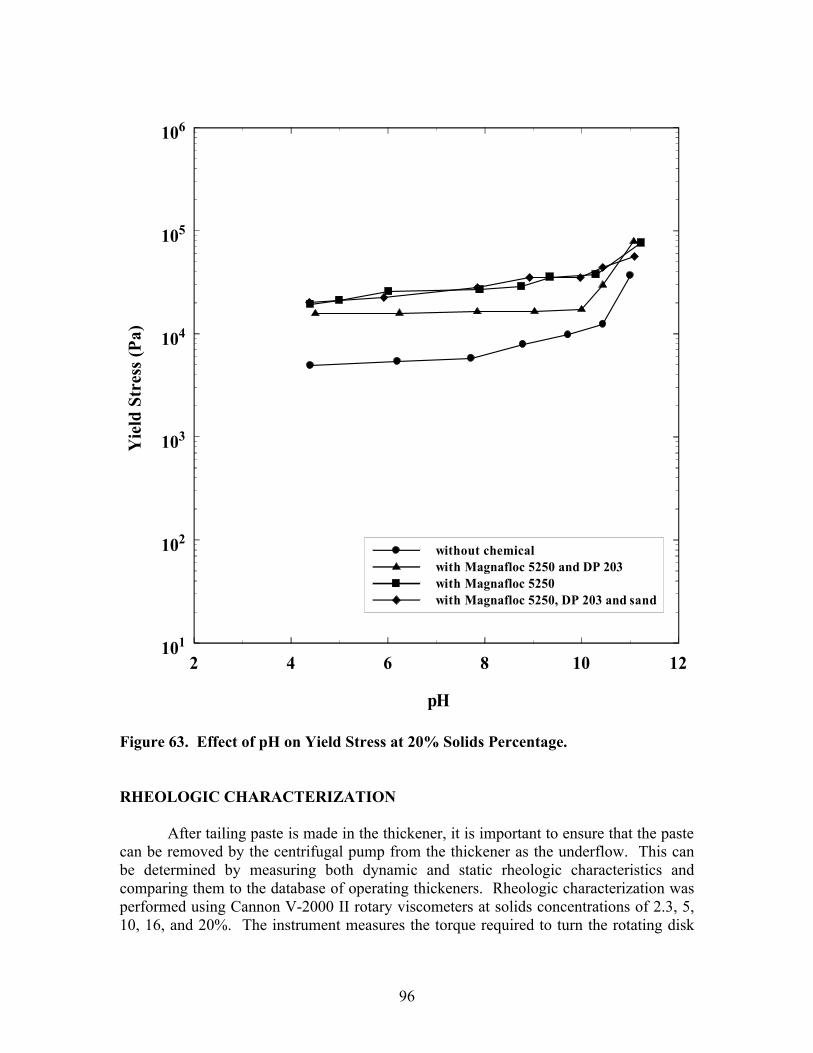
96
2 4 6 8 10 12
pH
101
102
103
104
105
106Y
ield
Str
ess
(Pa)
without chemicalwith Magnafloc 5250 and DP 203with Magnafloc 5250with Magnafloc 5250, DP 203 and sand
Figure 63. Effect of pH on Yield Stress at 20% Solids Percentage. RHEOLOGIC CHARACTERIZATION
After tailing paste is made in the thickener, it is important to ensure that the paste can be removed by the centrifugal pump from the thickener as the underflow. This can be determined by measuring both dynamic and static rheologic characteristics and comparing them to the database of operating thickeners. Rheologic characterization was performed using Cannon V-2000 II rotary viscometers at solids concentrations of 2.3, 5, 10, 16, and 20%. The instrument measures the torque required to turn the rotating disk
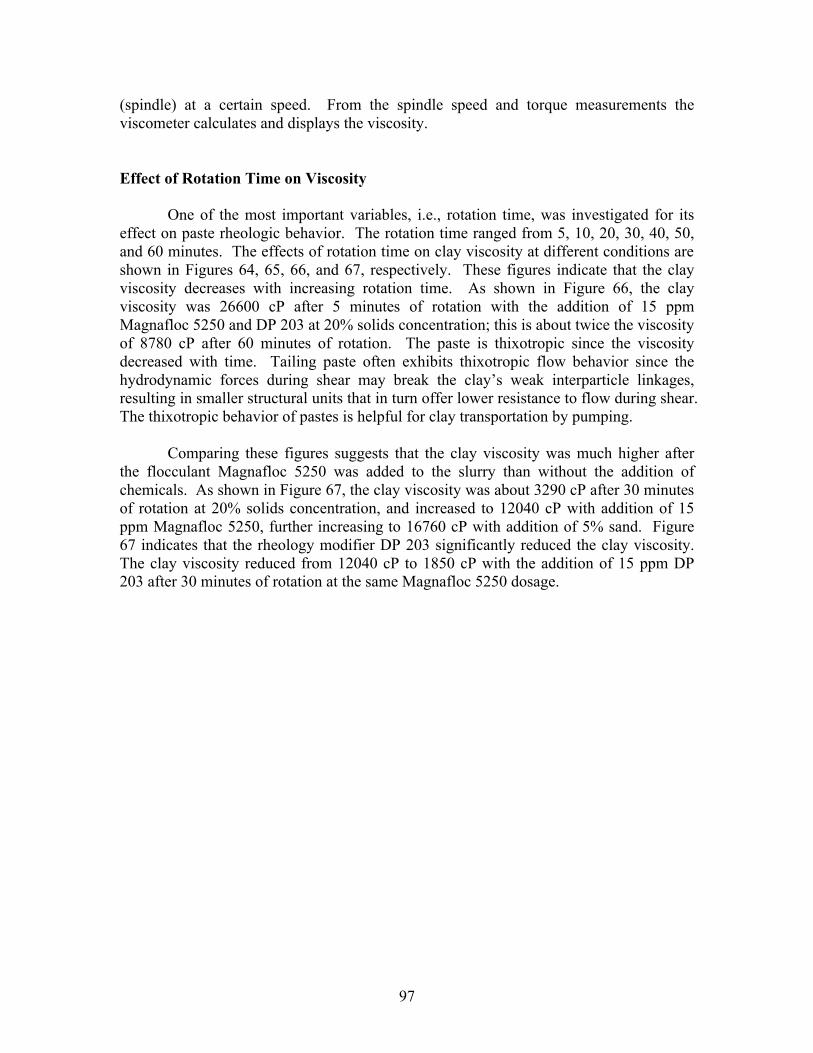
97
(spindle) at a certain speed. From the spindle speed and torque measurements the viscometer calculates and displays the viscosity. Effect of Rotation Time on Viscosity
One of the most important variables, i.e., rotation time, was investigated for its effect on paste rheologic behavior. The rotation time ranged from 5, 10, 20, 30, 40, 50, and 60 minutes. The effects of rotation time on clay viscosity at different conditions are shown in Figures 64, 65, 66, and 67, respectively. These figures indicate that the clay viscosity decreases with increasing rotation time. As shown in Figure 66, the clay viscosity was 26600 cP after 5 minutes of rotation with the addition of 15 ppm Magnafloc 5250 and DP 203 at 20% solids concentration; this is about twice the viscosity of 8780 cP after 60 minutes of rotation. The paste is thixotropic since the viscosity decreased with time. Tailing paste often exhibits thixotropic flow behavior since the hydrodynamic forces during shear may break the clay’s weak interparticle linkages, resulting in smaller structural units that in turn offer lower resistance to flow during shear. The thixotropic behavior of pastes is helpful for clay transportation by pumping.
Comparing these figures suggests that the clay viscosity was much higher after the flocculant Magnafloc 5250 was added to the slurry than without the addition of chemicals. As shown in Figure 67, the clay viscosity was about 3290 cP after 30 minutes of rotation at 20% solids concentration, and increased to 12040 cP with addition of 15 ppm Magnafloc 5250, further increasing to 16760 cP with addition of 5% sand. Figure 67 indicates that the rheology modifier DP 203 significantly reduced the clay viscosity. The clay viscosity reduced from 12040 cP to 1850 cP with the addition of 15 ppm DP 203 after 30 minutes of rotation at the same Magnafloc 5250 dosage.
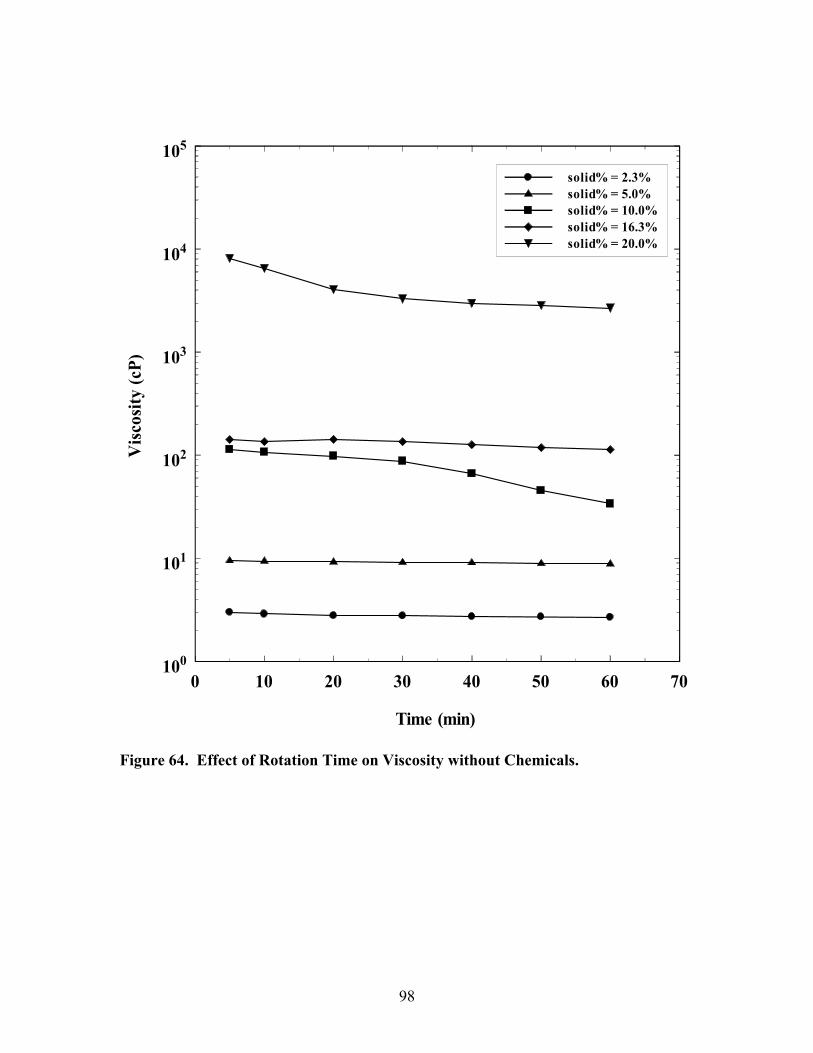
98
0 10 20 30 40 50 60 70
Time (min)
100
101
102
103
104
105V
isco
sity
(cP)
solid% = 2.3% solid% = 5.0%solid% = 10.0%solid% = 16.3%solid% = 20.0%
Figure 64. Effect of Rotation Time on Viscosity without Chemicals.
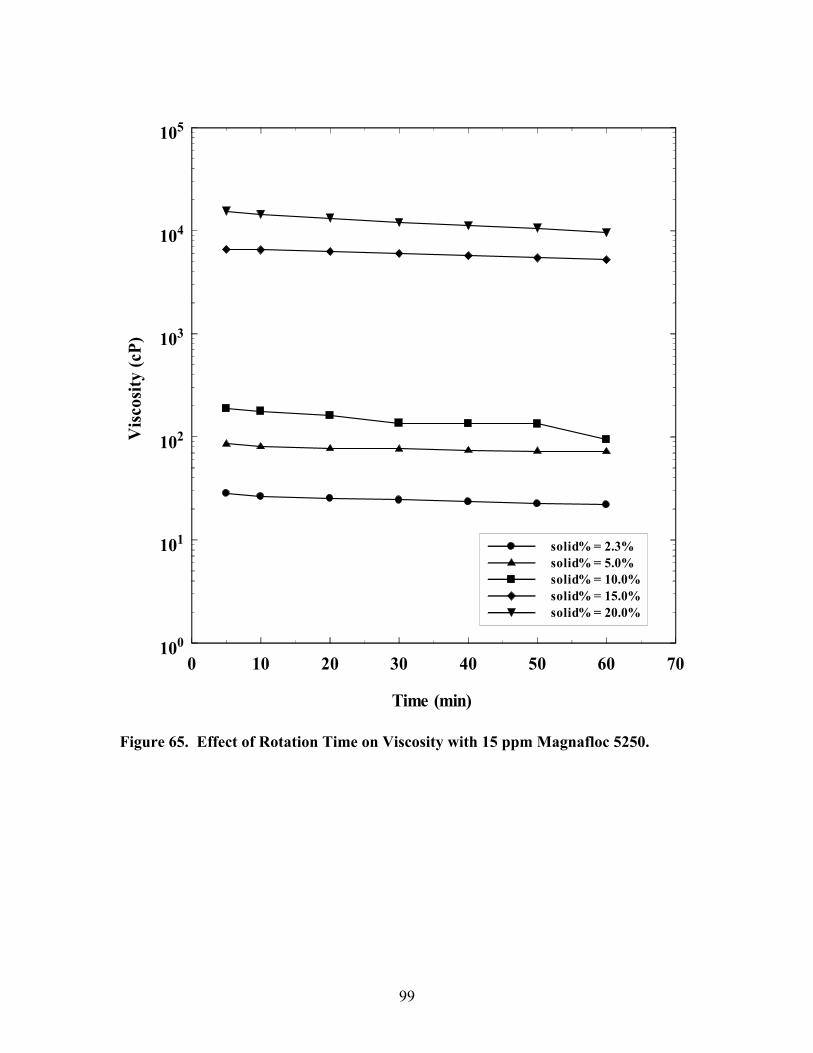
99
0 10 20 30 40 50 60 70
Time (min)
100
101
102
103
104
105V
isco
sity
(cP)
solid% = 2.3% solid% = 5.0%solid% = 10.0%solid% = 15.0%solid% = 20.0%
Figure 65. Effect of Rotation Time on Viscosity with 15 ppm Magnafloc 5250.

100
0 10 20 30 40 50 60 70
Time (min)
100
101
102
103
104
105
106V
isco
sity
(cP)
solid% = 2.3% solid% = 5.0%solid% = 10.0%solid% = 15.0%solid% = 20.0%
Figure 66. Effect of Rotation Time on Viscosity at 5% Sand Addition with 15 ppm
Magnafloc 5250 and DP 203.
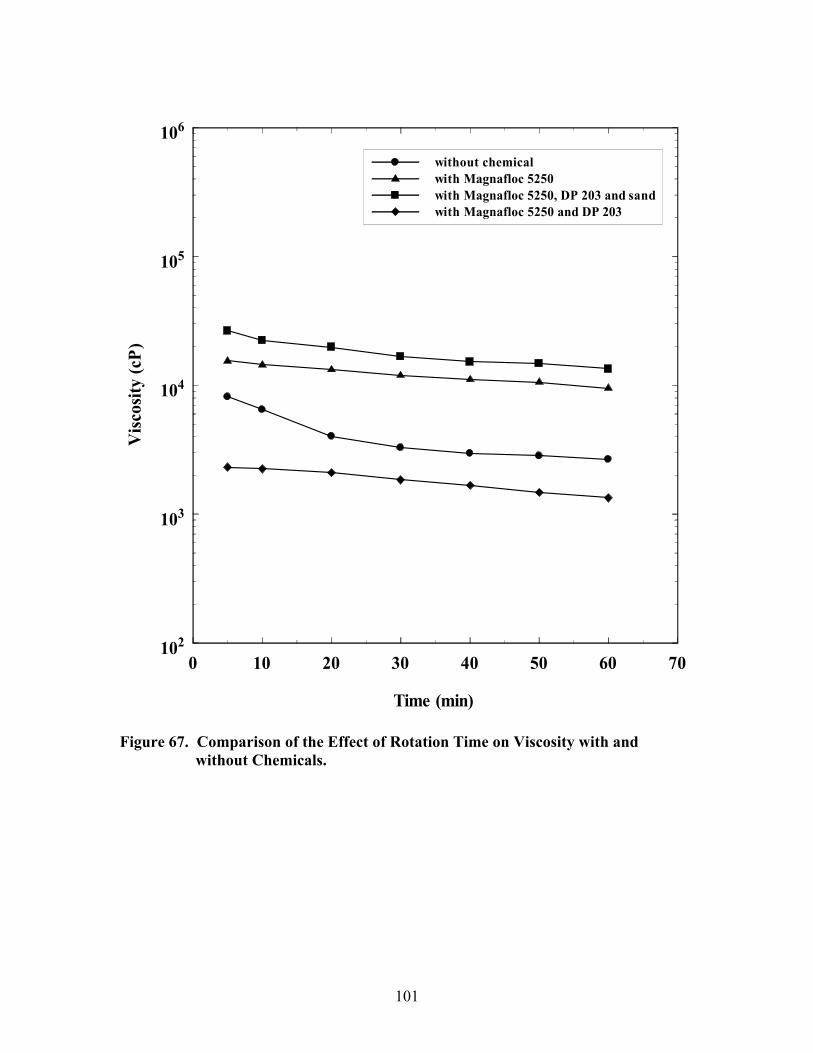
101
0 10 20 30 40 50 60 70
Time (min)
102
103
104
105
106V
isco
sity
(cP
)without chemicalwith Magnafloc 5250with Magnafloc 5250, DP 203 and sandwith Magnafloc 5250 and DP 203
Figure 67. Comparison of the Effect of Rotation Time on Viscosity with and
without Chemicals.
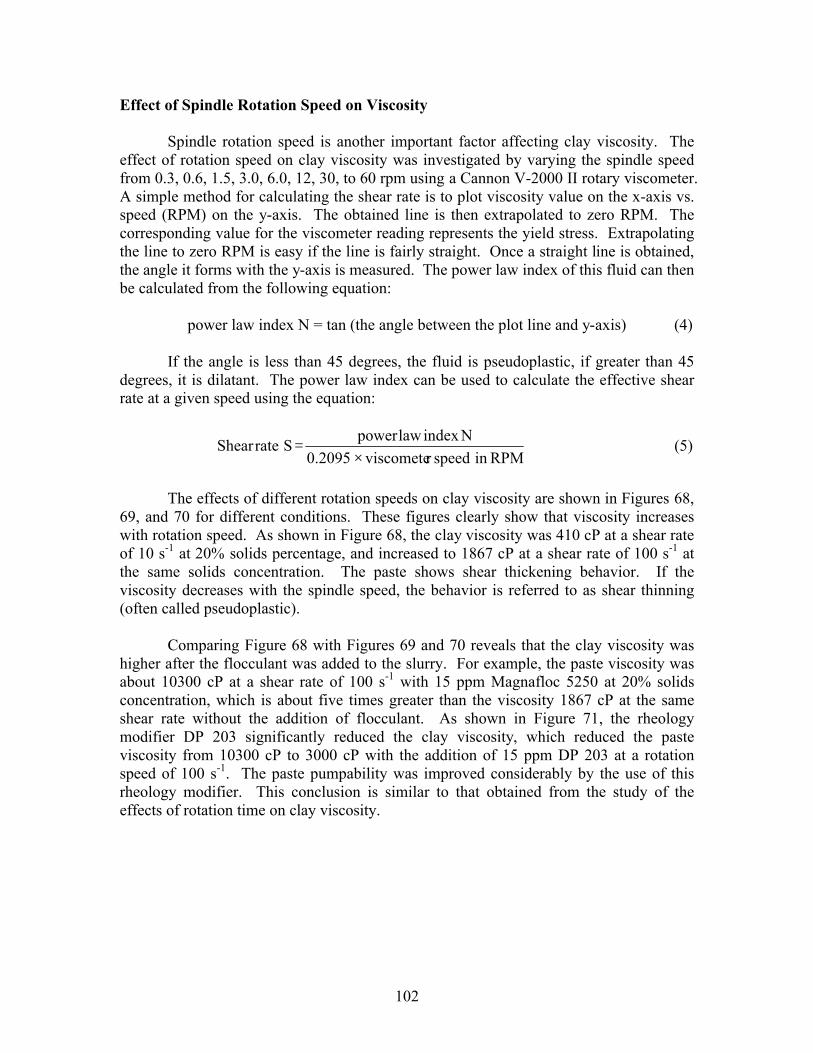
102
Effect of Spindle Rotation Speed on Viscosity
Spindle rotation speed is another important factor affecting clay viscosity. The effect of rotation speed on clay viscosity was investigated by varying the spindle speed from 0.3, 0.6, 1.5, 3.0, 6.0, 12, 30, to 60 rpm using a Cannon V-2000 II rotary viscometer. A simple method for calculating the shear rate is to plot viscosity value on the x-axis vs. speed (RPM) on the y-axis. The obtained line is then extrapolated to zero RPM. The corresponding value for the viscometer reading represents the yield stress. Extrapolating the line to zero RPM is easy if the line is fairly straight. Once a straight line is obtained, the angle it forms with the y-axis is measured. The power law index of this fluid can then be calculated from the following equation: power law index N = tan (the angle between the plot line and y-axis) (4)
If the angle is less than 45 degrees, the fluid is pseudoplastic, if greater than 45 degrees, it is dilatant. The power law index can be used to calculate the effective shear rate at a given speed using the equation:
RPMin speedr viscomete 0.2095
Nindex lawpower S rateShear
×= (5)
The effects of different rotation speeds on clay viscosity are shown in Figures 68,
69, and 70 for different conditions. These figures clearly show that viscosity increases with rotation speed. As shown in Figure 68, the clay viscosity was 410 cP at a shear rate of 10 s-1 at 20% solids percentage, and increased to 1867 cP at a shear rate of 100 s-1 at the same solids concentration. The paste shows shear thickening behavior. If the viscosity decreases with the spindle speed, the behavior is referred to as shear thinning (often called pseudoplastic).
Comparing Figure 68 with Figures 69 and 70 reveals that the clay viscosity was higher after the flocculant was added to the slurry. For example, the paste viscosity was about 10300 cP at a shear rate of 100 s-1 with 15 ppm Magnafloc 5250 at 20% solids concentration, which is about five times greater than the viscosity 1867 cP at the same shear rate without the addition of flocculant. As shown in Figure 71, the rheology modifier DP 203 significantly reduced the clay viscosity, which reduced the paste viscosity from 10300 cP to 3000 cP with the addition of 15 ppm DP 203 at a rotation speed of 100 s-1. The paste pumpability was improved considerably by the use of this rheology modifier. This conclusion is similar to that obtained from the study of the effects of rotation time on clay viscosity.

103
0 20 40 60 80 100 120
Shear Rate (s-1)
100
101
102
103
104V
isco
sity
(cP)
Solid% = 15.0%Solid% = 20.0%
Figure 68. Effect of Rotation Speed on Viscosity without Chemicals.

104
0 500 1000 1500 2000 2500
Shear Rate (s-1)
101
102
103
104
105
106V
isco
sity
(cP)
Solid% = 15.0%Solid% = 20.0%
Figure 69. Effect of Rotation Speed on Viscosity with 15 ppm Magnafloc 5250.
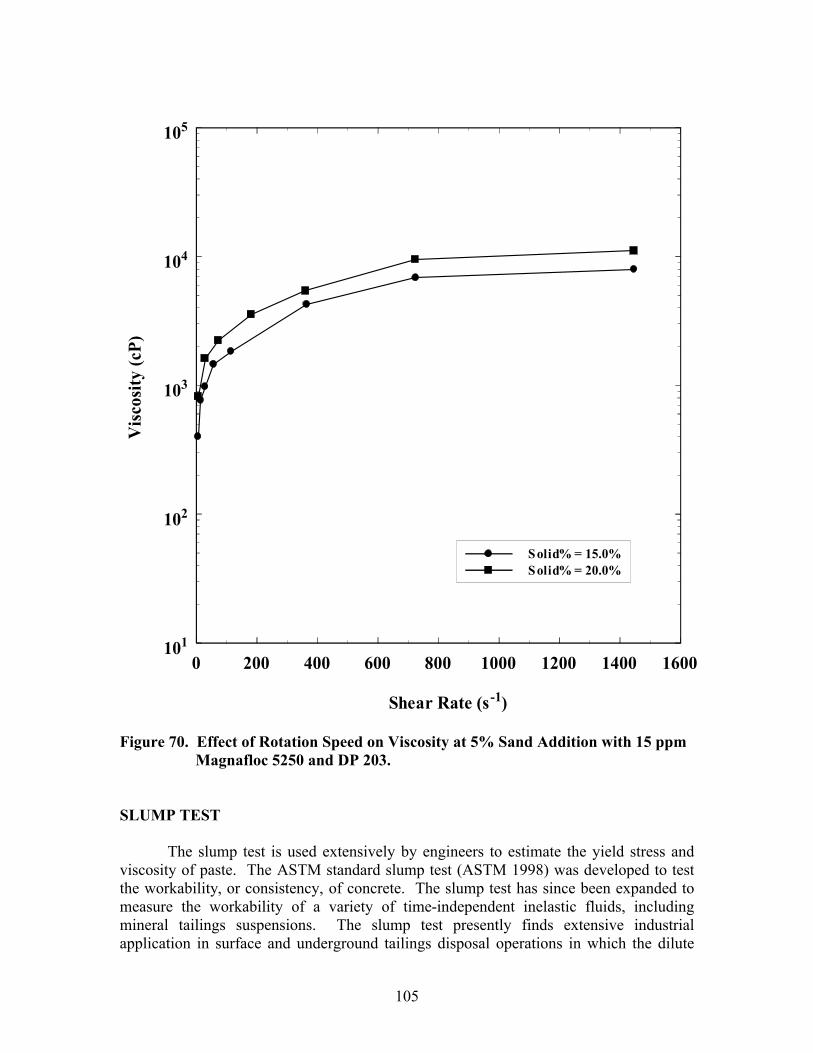
105
0 200 400 600 800 1000 1200 1400 1600
Shear Rate (s-1)
101
102
103
104
105V
isco
sity
(cP)
Solid% = 15.0%Solid% = 20.0%
Figure 70. Effect of Rotation Speed on Viscosity at 5% Sand Addition with 15 ppm
Magnafloc 5250 and DP 203. SLUMP TEST
The slump test is used extensively by engineers to estimate the yield stress and viscosity of paste. The ASTM standard slump test (ASTM 1998) was developed to test the workability, or consistency, of concrete. The slump test has since been expanded to measure the workability of a variety of time-independent inelastic fluids, including mineral tailings suspensions. The slump test presently finds extensive industrial application in surface and underground tailings disposal operations in which the dilute
106
tailings produced in processing are concentrated to a high solids concentration for disposal. A result of the highly concentrated nature of the tailings is the presence of an appreciable yield stress, which is the minimum shear stress for irreversible deformation and flow to occur.
Bench-scale slump tests were conducted on the phosphatic clay samples. A cylinder 5 cm in diameter and 10 cm in height was filled with a sample at a given solids concentration. The cylinder was lifted vertically and the sample was allowed to collapse under its weight. The height of the final deformed, or slumped, paste is measured. The difference between the initial and final heights is termed the slump height. Figure 71 illustrates schematically the experimental procedure.
The slump height measured via the slump test is generally used as the control parameter. The slump height, an empirical measure of consistency, is dependent on both the material yield stress and density, which in turn are dependent on chemical composition, particle specific gravity and particle size. The slump test would be a simple and ideal technique for on-site yield stress measurement.
The effect of solids concentration on clay slope percentage is shown in Figure 72. It is clear that the slope percentage increased significantly with increasing solids concentration. For example, the slope percentage is about 50 degrees at 25% solids concentration with 15 ppm Magnafloc 5250, increased to 85 degrees at 35% solids concentration, and further increased to 90 degrees at 40% solids concentration.
Figure 72 also indicates that the clay viscosity was much higher after the flocculant Magnafloc 5250 was added into the slurry than without the addition of polymers. As shown in this figure, the slope percentage was about 40 degrees at 25% solids concentration, while it increased to 50 degrees with the addition of 15 ppm Magnafloc 5250 at the same solids concentration. However, the rheology modifier DP 203 significantly reduced the slope percentage, as shown in this figure. This is helpful for clay transportation by pumping.
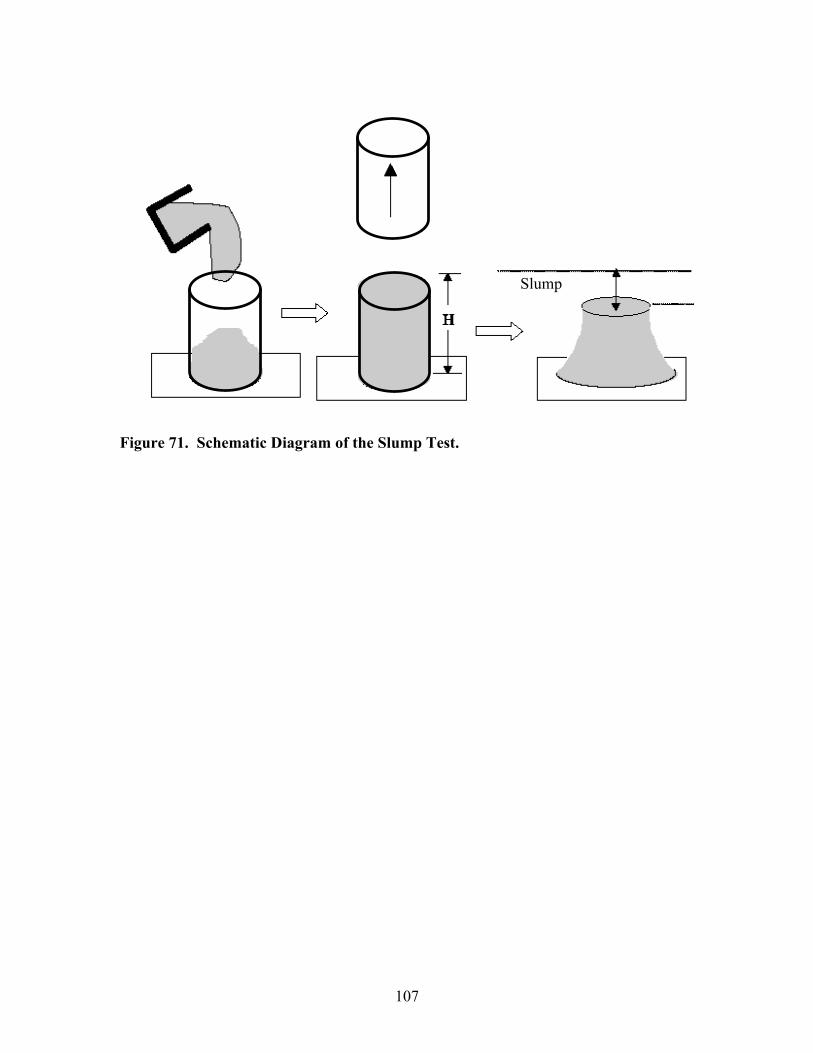
107
Figure 71. Schematic Diagram of the Slump Test.
Slump Height
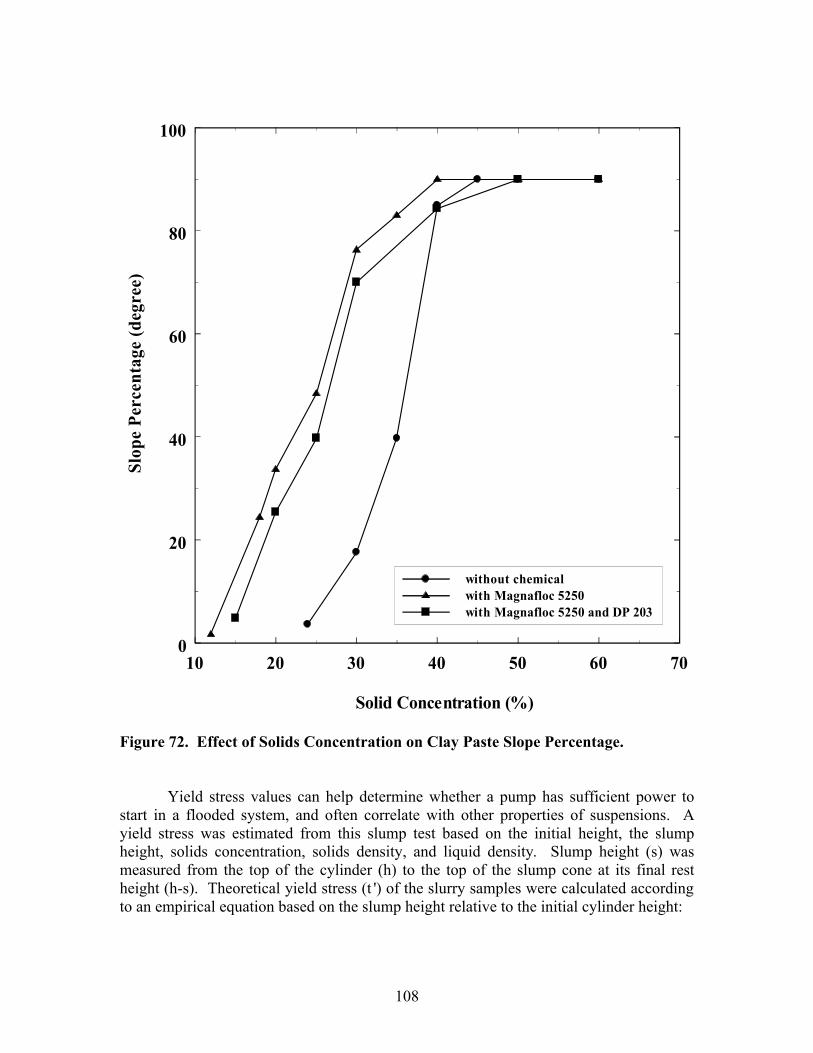
108
10 20 30 40 50 60 70
Solid Concentration (%)
0
20
40
60
80
100Sl
ope
Per
cent
age
(deg
ree)
without chemicalwith Magnafloc 5250with Magnafloc 5250 and DP 203
Figure 72. Effect of Solids Concentration on Clay Paste Slope Percentage.
Yield stress values can help determine whether a pump has sufficient power to start in a flooded system, and often correlate with other properties of suspensions. A yield stress was estimated from this slump test based on the initial height, the slump height, solids concentration, solids density, and liquid density. Slump height (s) was measured from the top of the cylinder (h) to the top of the slump cone at its final rest height (h-s). Theoretical yield stress (t ') of the slurry samples were calculated according to an empirical equation based on the slump height relative to the initial cylinder height:
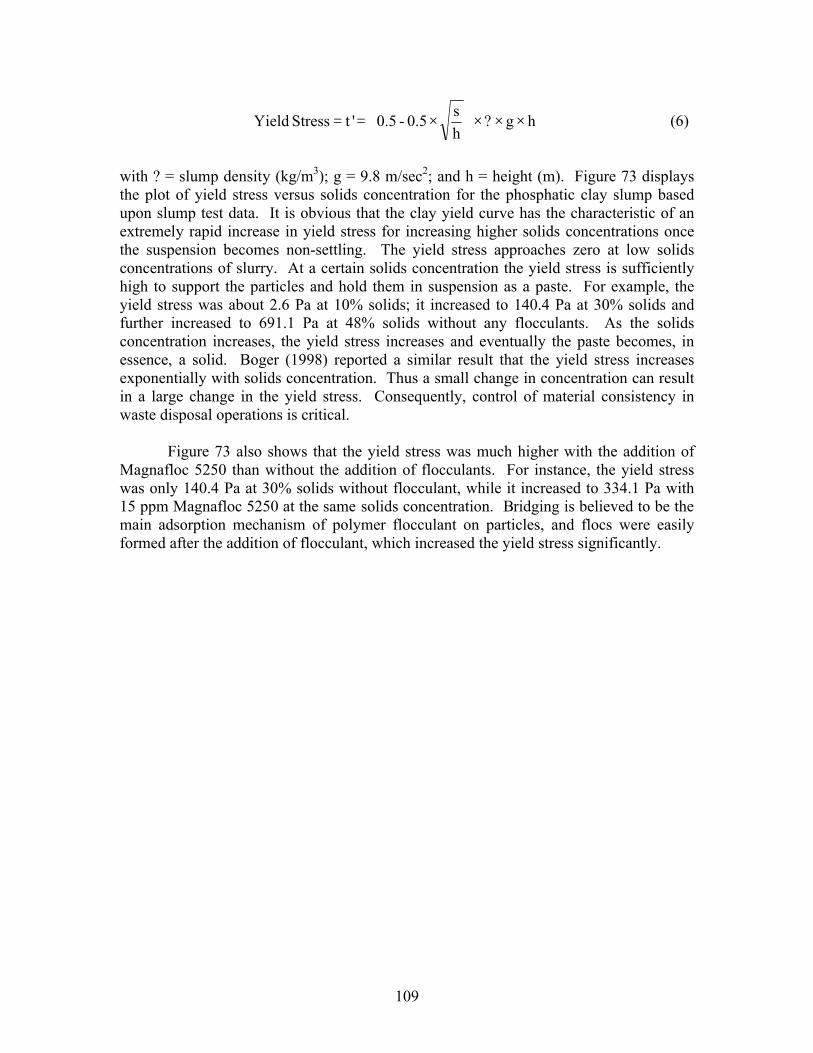
109
h g ? hs
0.5 - 0.5't Stress Yield ×××
×== (6)
with ? = slump density (kg/m3); g = 9.8 m/sec2; and h = height (m). Figure 73 displays the plot of yield stress versus solids concentration for the phosphatic clay slump based upon slump test data. It is obvious that the clay yield curve has the characteristic of an extremely rapid increase in yield stress for increasing higher solids concentrations once the suspension becomes non-settling. The yield stress approaches zero at low solids concentrations of slurry. At a certain solids concentration the yield stress is sufficiently high to support the particles and hold them in suspension as a paste. For example, the yield stress was about 2.6 Pa at 10% solids; it increased to 140.4 Pa at 30% solids and further increased to 691.1 Pa at 48% solids without any flocculants. As the solids concentration increases, the yield stress increases and eventually the paste becomes, in essence, a solid. Boger (1998) reported a similar result that the yield stress increases exponentially with solids concentration. Thus a small change in concentration can result in a large change in the yield stress. Consequently, control of material consistency in waste disposal operations is critical.
Figure 73 also shows that the yield stress was much higher with the addition of Magnafloc 5250 than without the addition of flocculants. For instance, the yield stress was only 140.4 Pa at 30% solids without flocculant, while it increased to 334.1 Pa with 15 ppm Magnafloc 5250 at the same solids concentration. Bridging is believed to be the main adsorption mechanism of polymer flocculant on particles, and flocs were easily formed after the addition of flocculant, which increased the yield stress significantly.
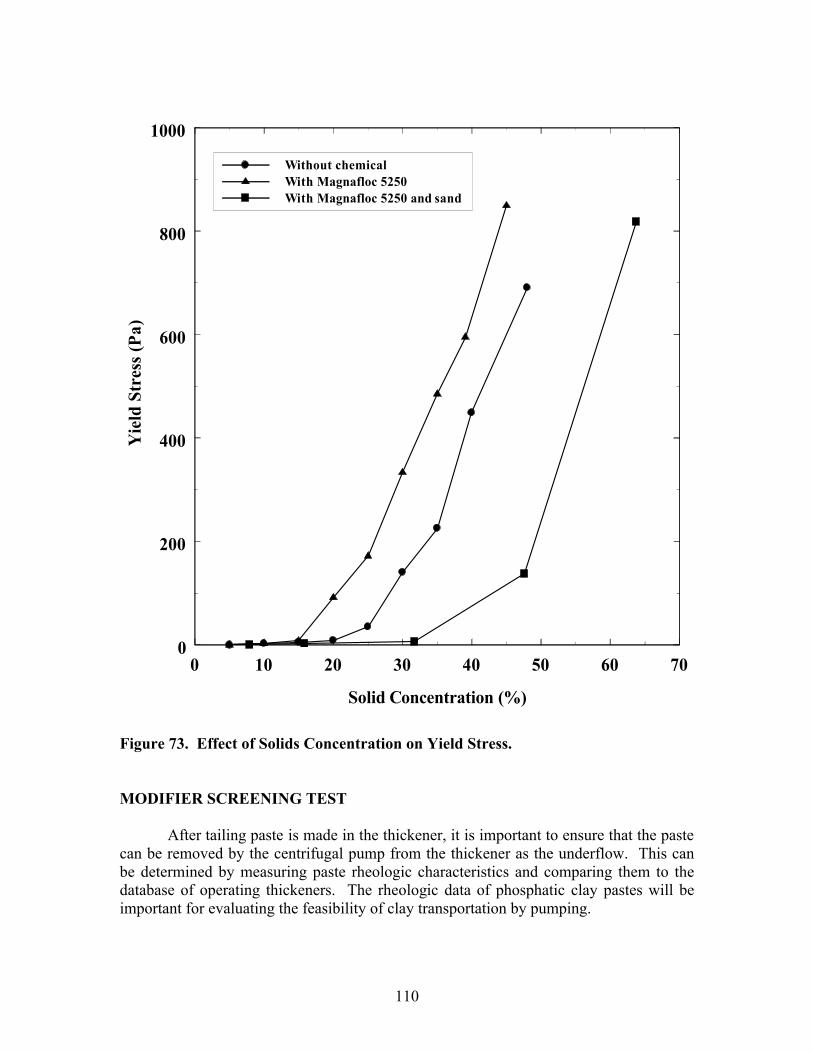
110
0 10 20 30 40 50 60 70
Solid Concentration (%)
0
200
400
600
800
1000Y
ield
Str
ess
(Pa)
Without chemicalWith Magnafloc 5250With Magnafloc 5250 and sand
Figure 73. Effect of Solids Concentration on Yield Stress. MODIFIER SCREENING TEST
After tailing paste is made in the thickener, it is important to ensure that the paste can be removed by the centrifugal pump from the thickener as the underflow. This can be determined by measuring paste rheologic characteristics and comparing them to the database of operating thickeners. The rheologic data of phosphatic clay pastes will be important for evaluating the feasibility of clay transportation by pumping.
111
Ten unique rheology modifiers, marketed under the trade name of Ciba Rheomax, were acquired from Ciba Specialty Chemicals. Their effects on clay paste rheologic characteristics were evaluated using the slump test setup described earlier. The effects of solids concentration on yield stress with different modifiers are shown in Figure 74. It is clear that Rheomax 1020, Rheomax 1030, and Rheomax 1040 did not reduce the paste yield stress. For example, the paste yield stress was about 334.1 Pa at 30% solids concentration with 15 ppm Magnafloc 5250, while it increased to 386.1 Pa after 15 ppm Rheomax 1020 was added into the paste. Figure 74 also indicates that Rheomax 9010, Rheomax 9040, and Rheomax 9060 decreased the clay paste yield stress. As shown in this figure, the paste yield stress decreased from 334.1 Pa at 30% solids to 244.6 Pa with 15 ppm Rheomax 9040 at the same solids concentration.
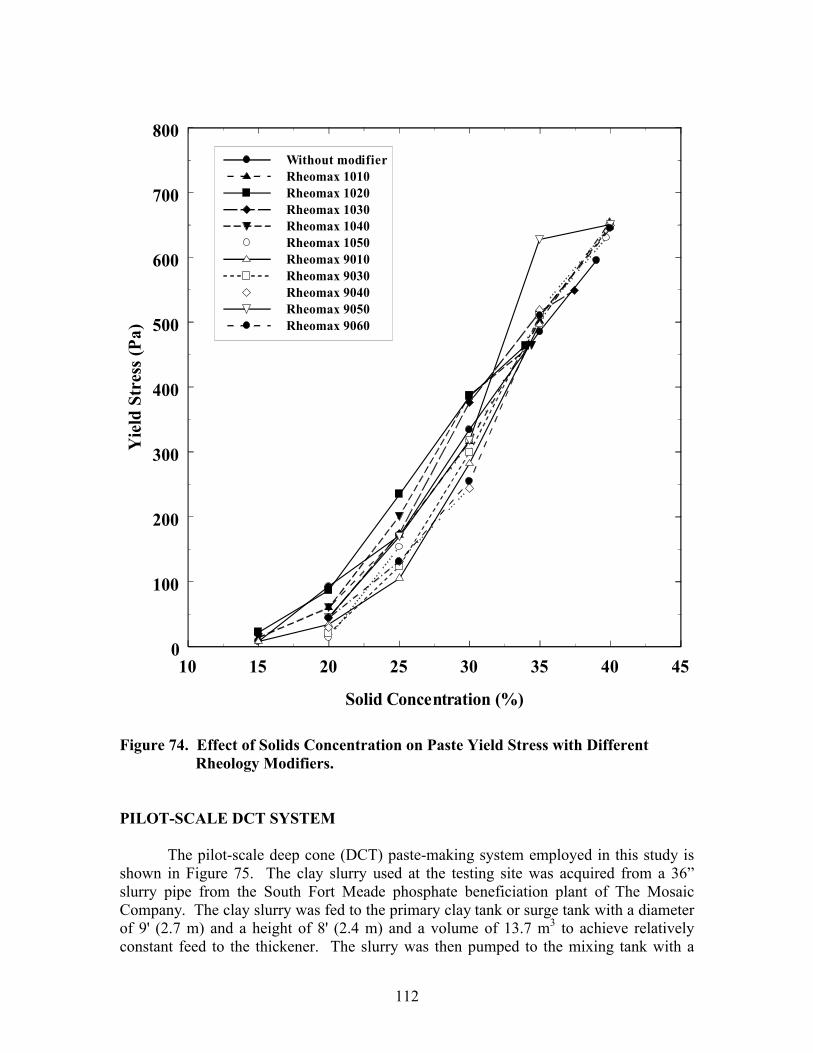
112
10 15 20 25 30 35 40 45
Solid Concentration (%)
0
100
200
300
400
500
600
700
800Y
ield
Str
ess
(Pa)
Without modifierRheomax 1010Rheomax 1020Rheomax 1030Rheomax 1040Rheomax 1050Rheomax 9010Rheomax 9030Rheomax 9040Rheomax 9050Rheomax 9060
Figure 74. Effect of Solids Concentration on Paste Yield Stress with Different
Rheology Modifiers. PILOT-SCALE DCT SYSTEM
The pilot-scale deep cone (DCT) paste-making system employed in this study is shown in Figure 75. The clay slurry used at the testing site was acquired from a 36” slurry pipe from the South Fort Meade phosphate beneficiation plant of The Mosaic Company. The clay slurry was fed to the primary clay tank or surge tank with a diameter of 9' (2.7 m) and a height of 8' (2.4 m) and a volume of 13.7 m3 to achieve relatively constant feed to the thickener. The slurry was then pumped to the mixing tank with a

113
dimension of 4' (1.2m) × 5' (1.5m) × 4' (1.2m) and a volume of 2 m3, where flocculant and sand were added to condition the slurry. The flocculated clay slurry in the mixing tank was pumped to a small conditioning tank (1' in diameter and 2' in height) mounted on top of the DCT thickener, where another type of flocculant was added to the slurry prior to entry to the feeding well inside the thickener. The DCT thickener from Dorr-Oliver Eimco was 1.5 m in diameter and 4.5 m in height with a volume of approximately 8 m3. The thickener rake rotated at a speed of 0.2 rpm during operation. The 0.2% by weight anionic and cationic flocculant solutions were prepared in two separate tanks by mixing the powder with water. The sand tailing added to the mixing tank was transported via a conveyor belt and its flow rate was controlled by a screw feeder. The dosage of flocculant was controlled by adjusting the flow rate to the tank by the peristaltic pump. The testing system was controlled by a computer system provided by Penn Pro, Inc. using a number of sensors, flow meters, and a pinch valve installed in the circuit. The control scheme for the system is shown in Figure 76. The DCT testing system operated under the following conditions, unless otherwise specified: Clay slurry rate: 30-75 gpm. Sand addition: 50-150% clay weight in the slurry Bed height inside the DCT: 1-2 m Anionic flocculant: Hengfloc 64014, 0.27-2.15 kg/t of clay solids Cationic flocculant: Hengfloc 80607, 0-0.45 kg/t of clay solids
Figure 75. Illustration of DCT Testing System Used at South Fort Meade Mine.
Primary clay tank
Primary clay tank
OverflowIncoming clay
8
Conveyor belt
Mixing tank
D C T
Anionic
Cationic
Sand pile
Underflow discharge
pond
Primary clay tank
Primary clay tank
OverflowIncoming clay
8
Conveyor belt
Mixing tank
D C T
Anionic
Cationic
Sand pile
Underflow discharge
pond
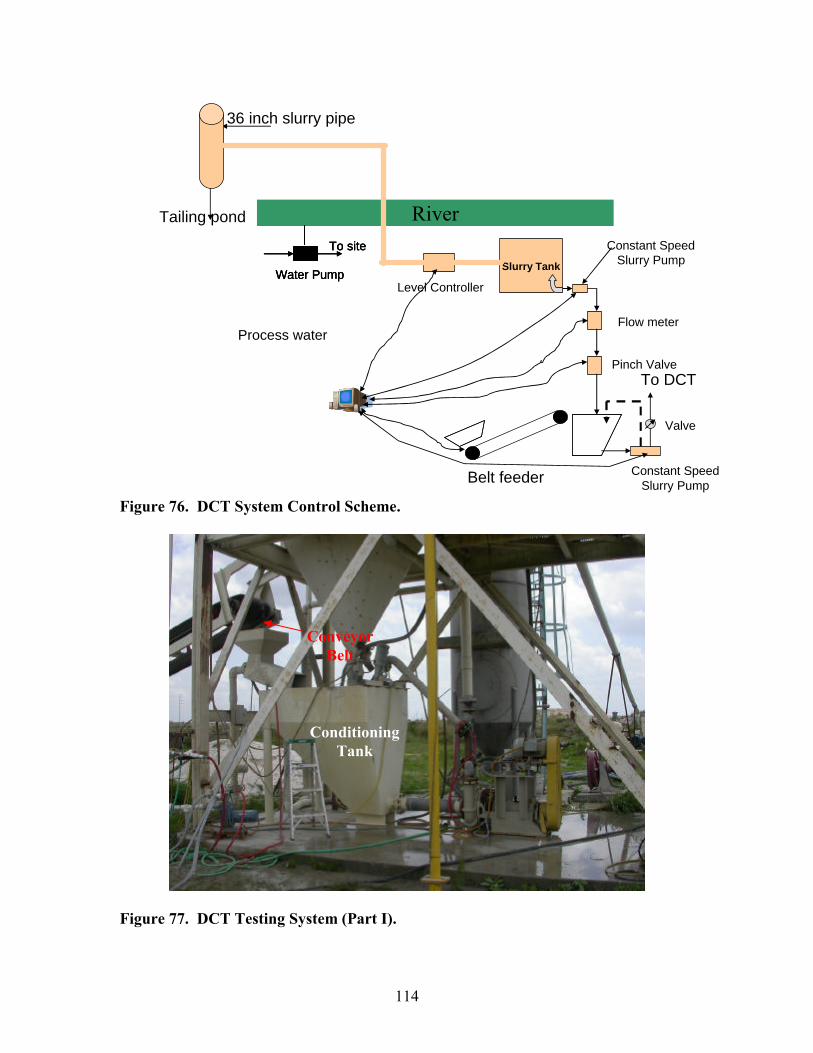
114
Figure 76. DCT System Control Scheme.
Figure 77. DCT Testing System (Part I).
Tailing pond River
Slurry Tank
To DCT
Constant SpeedSlurry Pump
Pinch Valve
Flow meter
Level Controller
Constant SpeedSlurry Pump
Valve
36 inch slurry pipe
Process water
Belt feeder
Water Pump
To site
Water Pump
To site
Water Pump
To site
DCT
Conveyor Belt
Conditioning Tank

115
Figure 78. DCT Testing System (Part II).
Figures 77 and 78 show pictures of the DCT testing system that was employed for the pilot-scale testing and evaluation study. Figure 79 illustrates more details of the DCT apparatus and the material flow. Clear water was discharged from the DCT as overflow and the solids were removed from the bottom as underflow that was pumped out using a Bredel peristaltic pump to a waste pond about thirty yards away.
The DCT apparatus was installed on a 10' (L) × 10' (W) × 1' (H) concrete pad with one bolt at each corner. The installation was made possible with support from The Mosaic Company, which provided a mobile crane to help unload the DCT from the truck and erect the thickener. Figures 80 and 81 show the DCT installation.
Flocculant tank
Paste Product
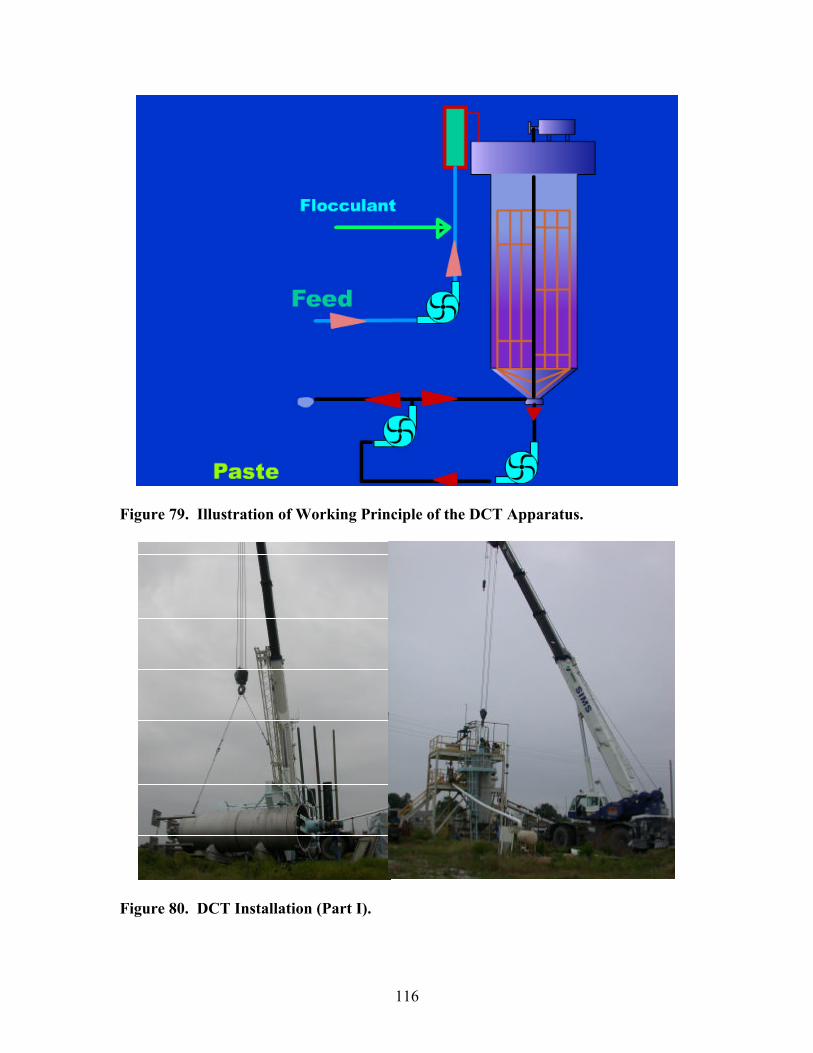
116
Figure 79. Illustration of Working Principle of the DCT Apparatus.
Figure 80. DCT Installation (Part I).

117
Figure 81. DCT Installation (Part II).

118
CLAY AND SAND SAMPLES
The clay slurry from the plant varied in solids percentage and particle size. Analysis of thirty-five samples collected during the testing program indicated that the solids percentage in twenty-nine of them varied from 1.88 to 3.04%, which was considered to be the normal range. However, three samples had solids significantly higher than 3.04% and three were significantly lower than 1.88%. Table 3 shows the individual solids percentage in different tests. Table 3. Clay Slurry Feed Solids Percentage in Different Tests. Test # Solids %
1 2.33
2 1.06
3 1.88
4 2.07
5 2.54
6 0.91
7 1.26
Test # Solids %
8 2.11
9 2.05
10 1.95
11 2.54
12 2.75
13 2.31
14 1.78
Test # Solids %
15 2.98
16 3.66
17 3.43
18 2.83
19 2.51
20 2.34
21 2.59
Test # Solids %
22 1.98
23 2.68
24 3.03
25 3.04
26 2.90
27 2.63
28 2.34
Test # Solids %
29 2.02
30 2.83
31 3.79
32 2.84
33 2.78
34 2.39
35 2.43
Figure 82 shows the size distribution of three clay slurry samples collected in
different tests. It appears that the size distribution showed a similar pattern and the D50 size was approximately 6 µm, which was finer than the clay slurry sample used in the lab testing shown in Figure 10. The sand tailing used in the pilot-scale DCT testing was also analyzed for size distribution and the data is shown in Figure 83. The D50 size was about 230 µm, which was also finer than the sand sample used in the lab testing shown in Figure 11, which showed a D50 size of about 300 µm.
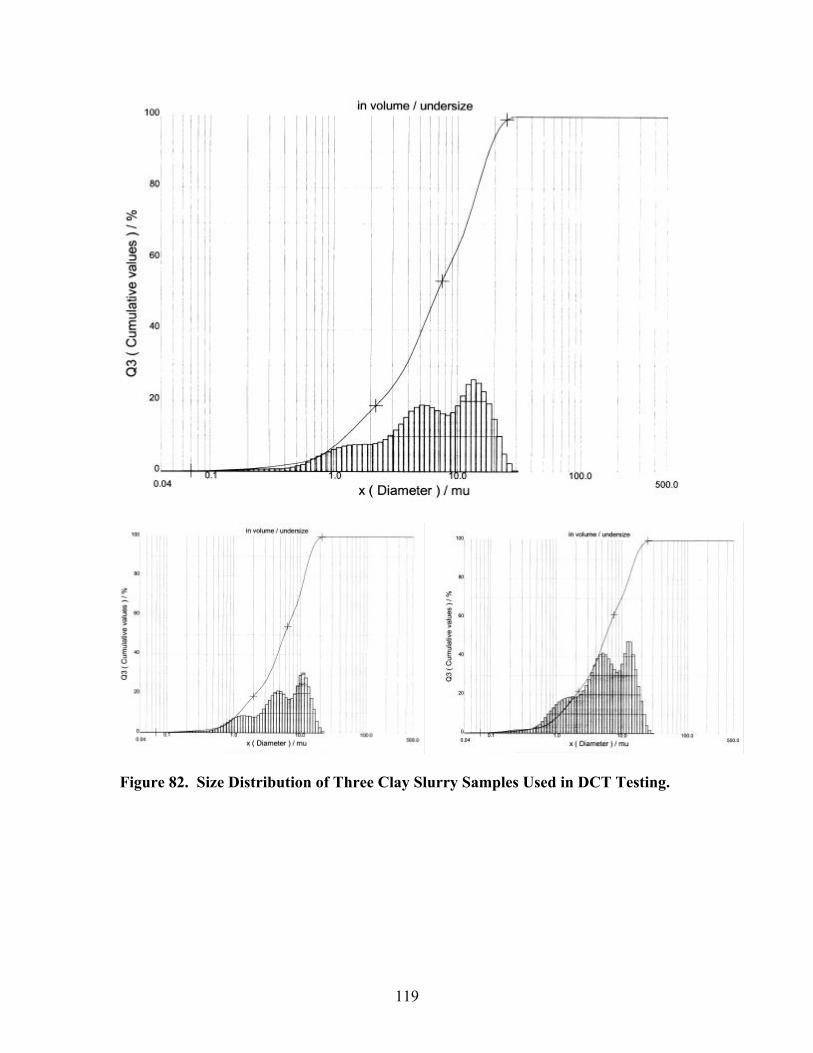
119
Figure 82. Size Distribution of Three Clay Slurry Samples Used in DCT Testing.

120
0
20
40
60
80
100
0.0 0.2 0.4 0.6 0.8 1.0
Particle size (mm)
Cum
ulat
ive
Und
ersc
reen
(%)
Cumulative weight
Figure 83. Size Distribution of Sand Tailing Used in DCT Testing. INITIAL TESTING OF THE DCT
On-site flocculation tests were performed with 1000 ml graduated glass cylinders by Dorr-Oliver Eimco process test engineer David Lee using five anionic flocculants he brought to the site and Hengfloc 64014 provided by Hengju Polymer. The flocculation procedure is shown in Figure 84 and the settling rate results are shown in Figure 85 as a function of flocculant dosage. The settling rate increased with increasing flocculant dosage initially and then leveled out. Hengfloc 64014 showed the highest settling rate of 1.5 m/min at a dosage of about 240 g/t. All other flocculants except MF1011 showed much lower settling rates, especially at lower dosages. The supernatant in the cylinder was clear and appeared to be free of solids.
Figure 86 shows an image of the flocculated clay slurry inside the conditioning tank just outside the DCT as cationic flocculant was being added into it. Clay particles were flocculated effectively and floc size was large. When flocculated clay particles entered the DCT, they settled quickly and the overflow of the thickener appeared very clear with no visible solids, as shown in Figure 87. When flocculation was not effective, the slurry in the conditioning tank was muddy and no large flocs could be seen.
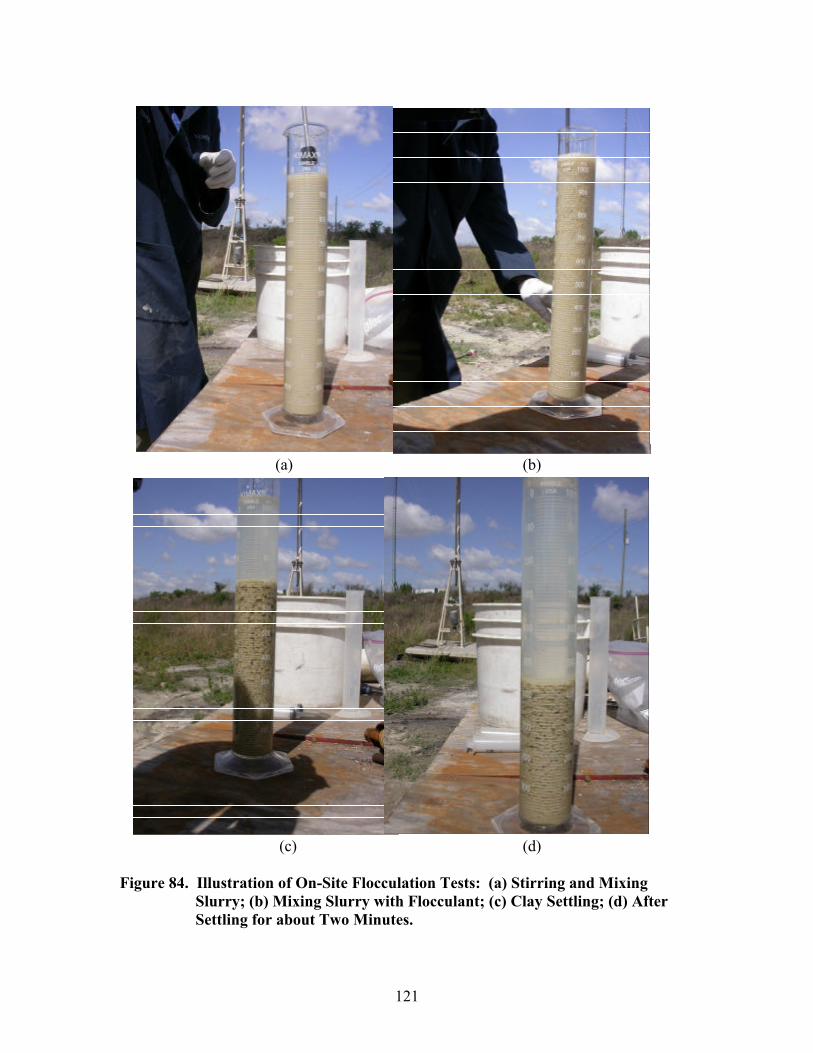
121
(a) (b)
(c) (d) Figure 84. Illustration of On-Site Flocculation Tests: (a) Stirring and Mixing
Slurry; (b) Mixing Slurry with Flocculant; (c) Clay Settling; (d) After Settling for about Two Minutes.

122
Flocculent Screening - Mosaic Phosphate Slimes
0.0
0.2
0.4
0.6
0.8
1.0
1.2
1.4
1.6
100 150 200 250 300
Floc Dose, g/t
Set
tling
Rat
e, m
/min
MF 727 MF 1011 Hengfloc 64014
AF 307 AF 310 MF 336
Figure 85. Clay Slurry Settling Rates as a Function of Flocculant Dosage. Figure 86. Flocculation Inside Conditioning Tank Beside DCT Where Hengfloc
80607 Was Added.
Flocculant Screening – Mosaic Phosphate Slimes

123
Figure 87. DCT Overflow.
Figure 88. Effects of Sand Addition on Clay Consolidation: No Sand (left); Sand
Added (right).

124
Figure 88 shows the on-site demonstration of the effect of sand addition on clay consolidation. With sand added at a sand/clay ratio of 1:1, the solids compacted much better, as evidenced by the shorter bed height. This is believed to be caused by the weight of sand particles that had a much greater density than clay flocs. This indicated that the underflow solids percentage could be increased by the addition of sand to the clay slurry, which was proved later in operations of the DCT. Table 4. Initial DCT Thickening Test Results Under Various Operating Conditions.
Test # Feed
Slurry (gpm)
Cat Floc (kg/ton)
Ani Floc
(kg/ton)
Bed Height
(m)
Residence Time (h)
Feed Solids (%)
OF Solids
(%)
UF Solids (%)
1 40 0.00 0.50 1 16 2.07 0.021 3.27 2 40 0.00 1.45 1 2 1.06 0.026 8.19 3 40 0.00 2.15 1 4 1.88 0.08 7.87 4 40 0.17 0.67 1 2 2.33 0.066 6.79 5 40 0.17 0.67 2 3 2.54 0.026 5.88 6 40 0.40 0.53 1.5 2 2.54 0.064 5.03 7 40 0.39 0.53 1.5 4 0.91 0.051 5.58 8 40 0.40 0.53 1.5 5 1.26 0.051 6.44 9 40 0.37 0.53 1.5 6 2.11 0.04 5.85
10 40 0.22 0.89 2 2 1.95 0.047 5.02 11 40 0.40 1.60 1.5 15 2.05 0.04 5.99 12 30 0.20 0.80 2 2 2.31 0.057 8.42 13 30 0.20 0.80 2 5 1.78 0.039 6.04 14 30 0.20 0.80 2 6 2.98 0.021 8.63
Table 4 shows thickening performance data in the early stage of DCT operation.
In these tests, the cationic flocculant was added to the mixing tank before the anionic flocculant was added to the smaller conditioning tank outside the DCT. Variables examined in the tests included feed slurry rate, dosages of cationic and anionic flocculant, bed height inside DCT, and residence time of solids. The solids percentage in feed, overflow (OF), and underflow (UF) were determined from samples collected. As can be seen from the table, the feed solids varied from 0.91% to 2.98%, but mostly in the range of 2-3%, which is considered normal. The solids percentage in the overflow was low, from 0.021% to 0.08%. However, the underflow solids percentage varied from 3.27% to 8.63%, and the underflow was still in the form of slurry rather than paste. The first test shown in the table had the solids in the thickener for 16 hours but the underflow solids were still only 3.27%, indicating the flocs did not consolidate at all. In the next two tests, the flocculant dosage increased from 1.45 kg/t to 2.15 kg/t and the underflow solids percentage increased to around 8%. This suggests that a higher flocculant dosage improved flocculation and consolidation.
Because anionic flocculant alone was unable to produce high solids underflow, cationic flocculant was added to the mixing tank in subsequent tests to enhance flocculation and consolidation while anionic was used in the conditioning tank on the DCT. When cationic and anionic flocculant were added at a dosage of 0.17 and 0.67 kg/t,
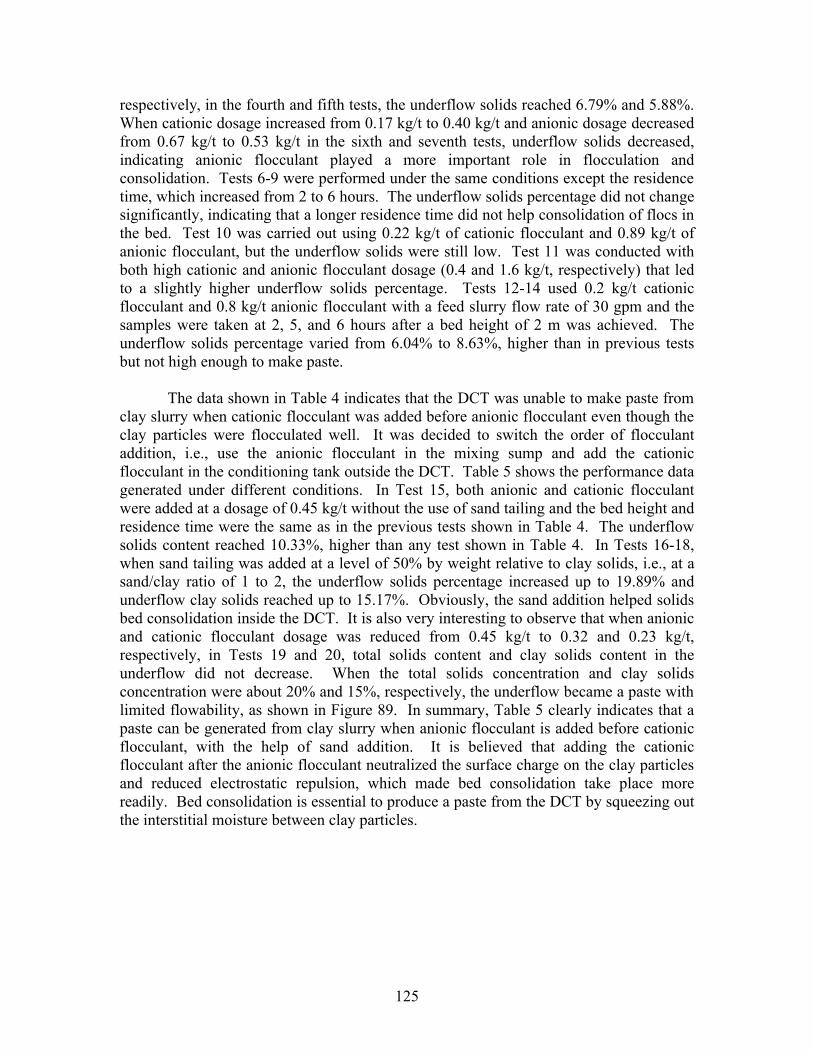
125
respectively, in the fourth and fifth tests, the underflow solids reached 6.79% and 5.88%. When cationic dosage increased from 0.17 kg/t to 0.40 kg/t and anionic dosage decreased from 0.67 kg/t to 0.53 kg/t in the sixth and seventh tests, underflow solids decreased, indicating anionic flocculant played a more important role in flocculation and consolidation. Tests 6-9 were performed under the same conditions except the residence time, which increased from 2 to 6 hours. The underflow solids percentage did not change significantly, indicating that a longer residence time did not help consolidation of flocs in the bed. Test 10 was carried out using 0.22 kg/t of cationic flocculant and 0.89 kg/t of anionic flocculant, but the underflow solids were still low. Test 11 was conducted with both high cationic and anionic flocculant dosage (0.4 and 1.6 kg/t, respectively) that led to a slightly higher underflow solids percentage. Tests 12-14 used 0.2 kg/t cationic flocculant and 0.8 kg/t anionic flocculant with a feed slurry flow rate of 30 gpm and the samples were taken at 2, 5, and 6 hours after a bed height of 2 m was achieved. The underflow solids percentage varied from 6.04% to 8.63%, higher than in previous tests but not high enough to make paste.
The data shown in Table 4 indicates that the DCT was unable to make paste from clay slurry when cationic flocculant was added before anionic flocculant even though the clay particles were flocculated well. It was decided to switch the order of flocculant addition, i.e., use the anionic flocculant in the mixing sump and add the cationic flocculant in the conditioning tank outside the DCT. Table 5 shows the performance data generated under different conditions. In Test 15, both anionic and cationic flocculant were added at a dosage of 0.45 kg/t without the use of sand tailing and the bed height and residence time were the same as in the previous tests shown in Table 4. The underflow solids content reached 10.33%, higher than any test shown in Table 4. In Tests 16-18, when sand tailing was added at a level of 50% by weight relative to clay solids, i.e., at a sand/clay ratio of 1 to 2, the underflow solids percentage increased up to 19.89% and underflow clay solids reached up to 15.17%. Obviously, the sand addition helped solids bed consolidation inside the DCT. It is also very interesting to observe that when anionic and cationic flocculant dosage was reduced from 0.45 kg/t to 0.32 and 0.23 kg/t, respectively, in Tests 19 and 20, total solids content and clay solids content in the underflow did not decrease. When the total solids concentration and clay solids concentration were about 20% and 15%, respectively, the underflow became a paste with limited flowability, as shown in Figure 89. In summary, Table 5 clearly indicates that a paste can be generated from clay slurry when anionic flocculant is added before cationic flocculant, with the help of sand addition. It is believed that adding the cationic flocculant after the anionic flocculant neutralized the surface charge on the clay particles and reduced electrostatic repulsion, which made bed consolidation take place more readily. Bed consolidation is essential to produce a paste from the DCT by squeezing out the interstitial moisture between clay particles.

126
Table 5. DCT Thickening Test Results Obtained When Anionic Floc Was Added Before Cationic Floc.
Test #
Feed Slurry (gpm)
Ani Floc
(kg/ton)
Cat Floc
(kg/ton)
Bed Height
(m)
Residence Time (h)
Sand Addition
(%)
Feed Solids (%)
OF Solids
(%)
UF Solids
(%)
UF Clay (%)
15 75 0.45 0.45 2 2 0 3.66 0.034 10.33 10.33 16 75 0.45 0.45 2 2 50 3.43 0.028 16.37 14.96 17 30 0.45 0.45 1.8 2 50 3.03 0.059 19.89 15.17 18 30 0.45 0.45 1.9 4 50 3.04 0.025 17.42 13.82 19 30 0.32 0.23 2 4 50 2.34 0.033 19.79 15.87 20 30 0.32 0.23 2 6 50 2.02 0.014 24.58 19.43
Figure 89. Paste from Test 19 with 19.79% Total Solids and 15.87% Clay Solids. EFFECTS OF PROCESS PARAMETERS Effect of Sand Addition Dosage
Table 6 shows the effect of sand addition dosage on thickening performance while the feed slurry rate was kept at 75 gpm, anionic and cationic flocculant dosage at 0.45 kg/t, bed height at 2m and residence time at 2 hours. Obviously, more sand added to the slurry helped bed consolidation, resulting in a higher total underflow solids percentage and clay solids percentage.

127
Table 6. DCT Thickening Test Results Obtained at Different Sand Addition Dosages. Sand Addition
(%) Feed Solids
(%) OF Solids
(%) UF Solids
(%) UF Clay
(%) 0 3.66 0.034 10.33 10.33 50 3.43 0.028 16.37 14.96 150 2.68 0.029 30.08 20.72
Effect of Solids Retention Time
Figure 90 shows the effect of solids retention time inside the DCT on total solids content and clay solids content in the underflow product. Both increased almost linearly with retention time in the range tested. Figure 91 shows similar data obtained at a higher flocculant dosage. At the higher flocculant dosage, underflow solids content became less dependent on retention time, as is evidenced by the smaller slope value. This was because the higher flocculant dosage produced larger and denser flocs that consolidated more quickly initially during the first two hours (as suggested by the higher solids content at 2 hours) and more slowly thereafter.
0
10
20
30
0 2 4 6 8Retention time (hour)
Solid
s (%
)
TotalClay
Figure 90. Dependence of Total Solids % and Clay Solids % on Solids Retention
Time (Anionic Floc: 0.32 kg/t; Cationic Floc: 0.23 kg/t; Clay:Sand=2:1; Bed Height: 2m; Feed Slurry: 30 gpm).
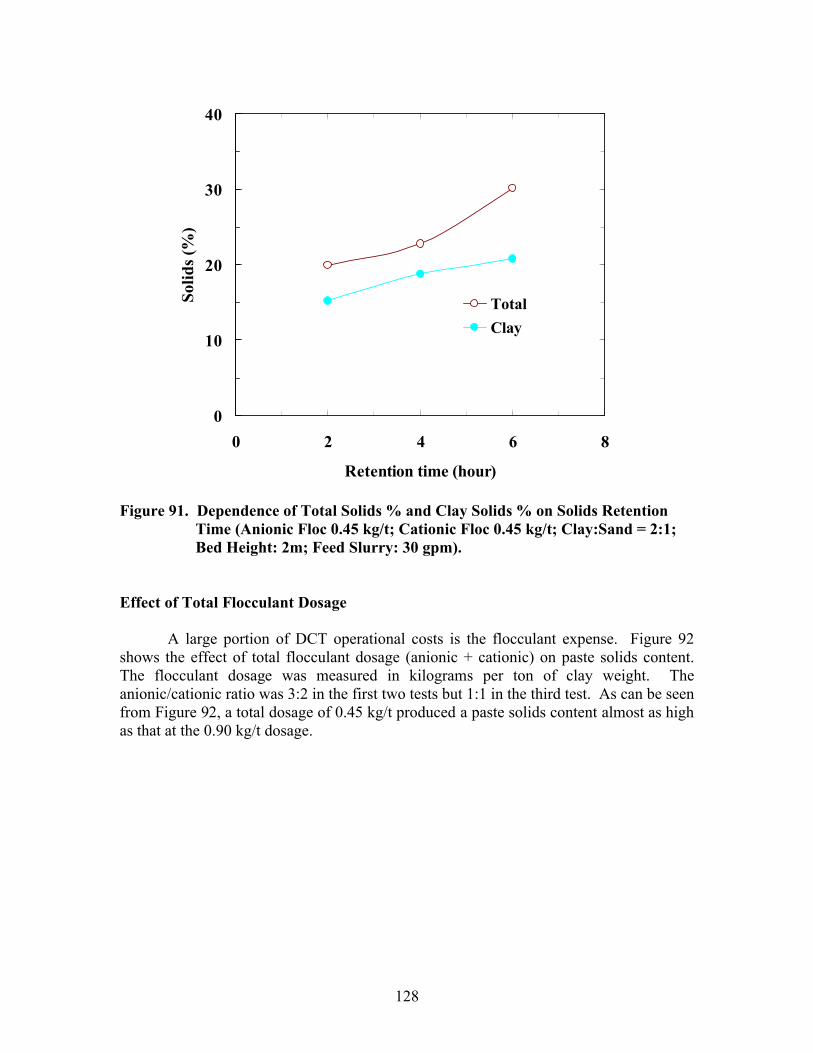
128
0
10
20
30
40
0 2 4 6 8
Retention time (hour)
Solid
s (%
)
TotalClay
Figure 91. Dependence of Total Solids % and Clay Solids % on Solids Retention
Time (Anionic Floc 0.45 kg/t; Cationic Floc 0.45 kg/t; Clay:Sand = 2:1; Bed Height: 2m; Feed Slurry: 30 gpm).
Effect of Total Flocculant Dosage
A large portion of DCT operational costs is the flocculant expense. Figure 92 shows the effect of total flocculant dosage (anionic + cationic) on paste solids content. The flocculant dosage was measured in kilograms per ton of clay weight. The anionic/cationic ratio was 3:2 in the first two tests but 1:1 in the third test. As can be seen from Figure 92, a total dosage of 0.45 kg/t produced a paste solids content almost as high as that at the 0.90 kg/t dosage.

129
0
10
20
30
40
0.4 0.6 0.8 1.0
Total floc dosage (kg/ton)
Solid
s (%
)
Total
Clay
Figure 92. Effects of Flocculant Dosage on Paste Solids Content (Clay:Sand=2:1;
Bed Height: 2m; Feed Slurry: 30 gpm; Residence Time: 2 h). Table 7. Highest Paste Solids Content.
Ani Floc (kg/ton)
Cat Floc (kg/ton)
Residence Time (h)
Sand Addition
(%)
Feed Solids
(%)
OF Solids
(%)
UF Solids
(%)
UF Clay (%)
0.32 0.32 3 50 2.68 0.029 30.08 20.72 0.45 0.45 6 50 2.90 0.122 22.71 18.70 0.32 0.23 6 50 2.02 0.014 24.58 19.43 0.32 0.23 6 50 2.83 0.036 27.28 20.21 0.27 0.14 6 50 2.84 0.038 35.44 25.81 0.27 0.18 4 50 2.39 0.045 25.33 20.56
HIGHEST PASTE SOLIDS CONTENT FROM THE DCT
Table 7 shows the highest paste solids contents obtained under various operating conditions. All tests generated a total solids content greater than 22.71% and clay solids content higher than 18.7%. It is interesting to note that the thickest paste, with 35.44% total solids content and 25.81% clay solids content, was obtained with a fairly low dosage of anionic flocculant of 0.27 kg/t and cationic flocculant dosage of 0.14 kg/t. Figures 93 and 94 show pictures of some paste samples being produced. The products appear to be
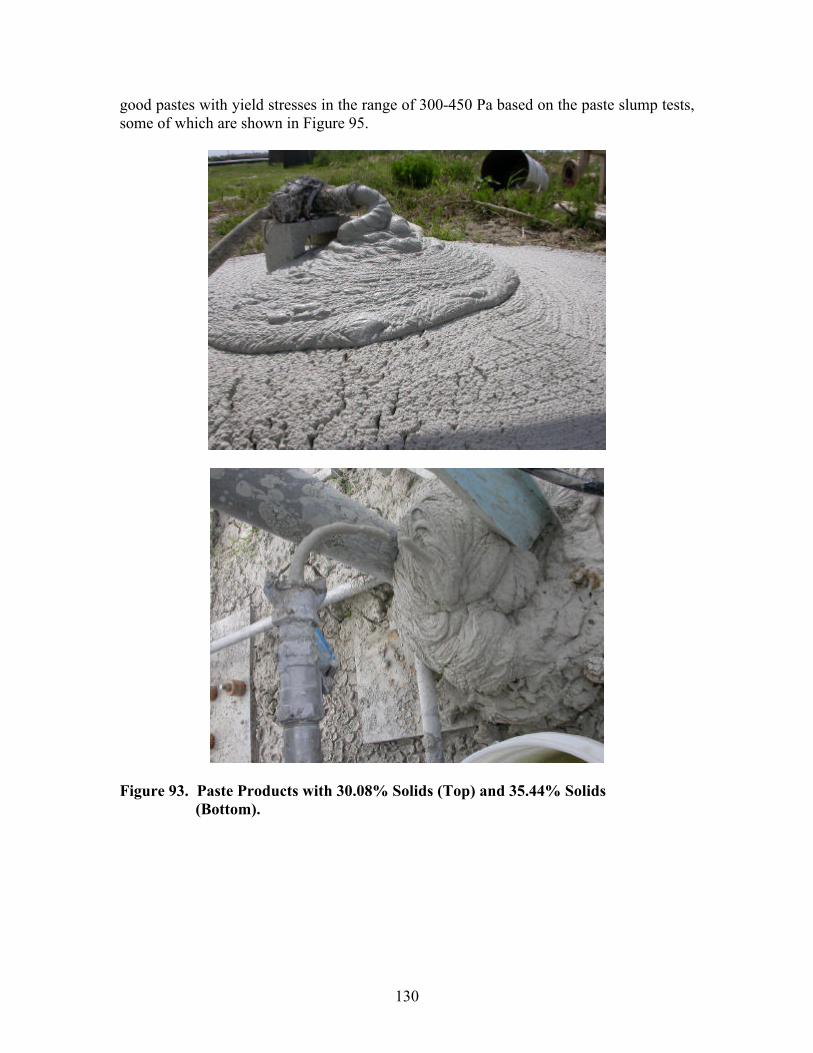
130
good pastes with yield stresses in the range of 300-450 Pa based on the paste slump tests, some of which are shown in Figure 95.
Figure 93. Paste Products with 30.08% Solids (Top) and 35.44% Solids
(Bottom).

131
Figure 94. Paste Products with 27.28% Solids (Top) and 25.33% Solids
(Bottom).
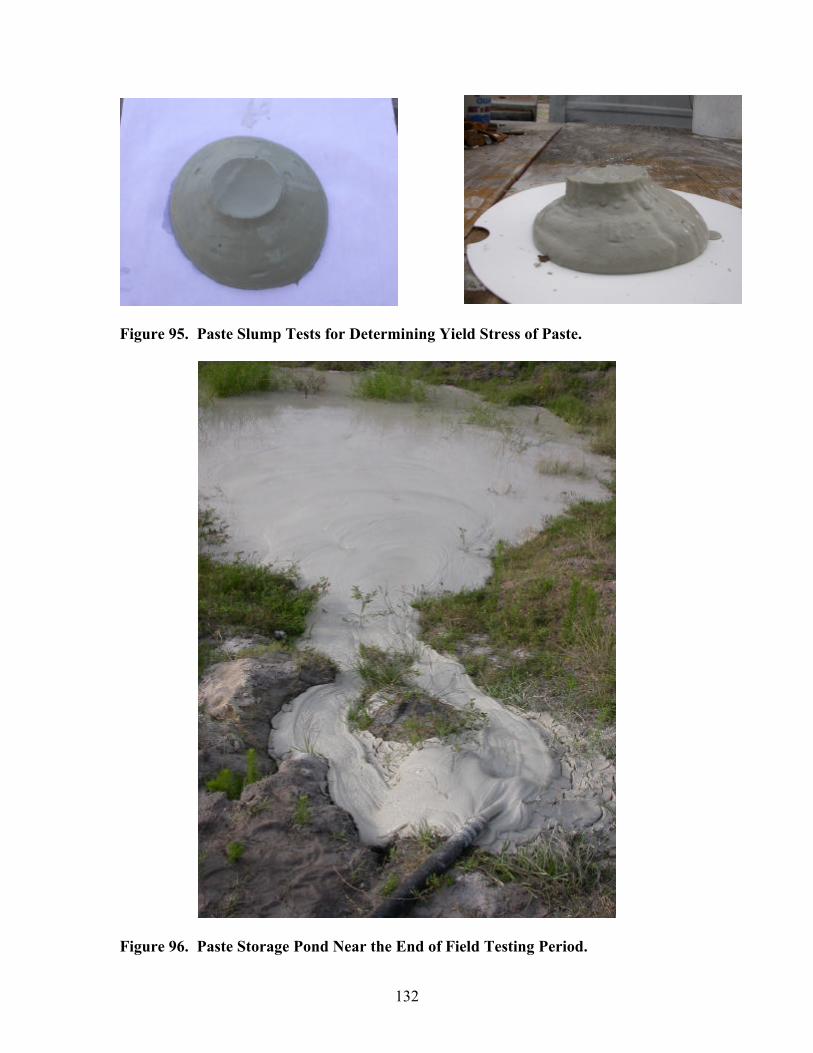
132
Figure 95. Paste Slump Tests for Determining Yield Stress of Paste.
Figure 96. Paste Storage Pond Near the End of Field Testing Period.
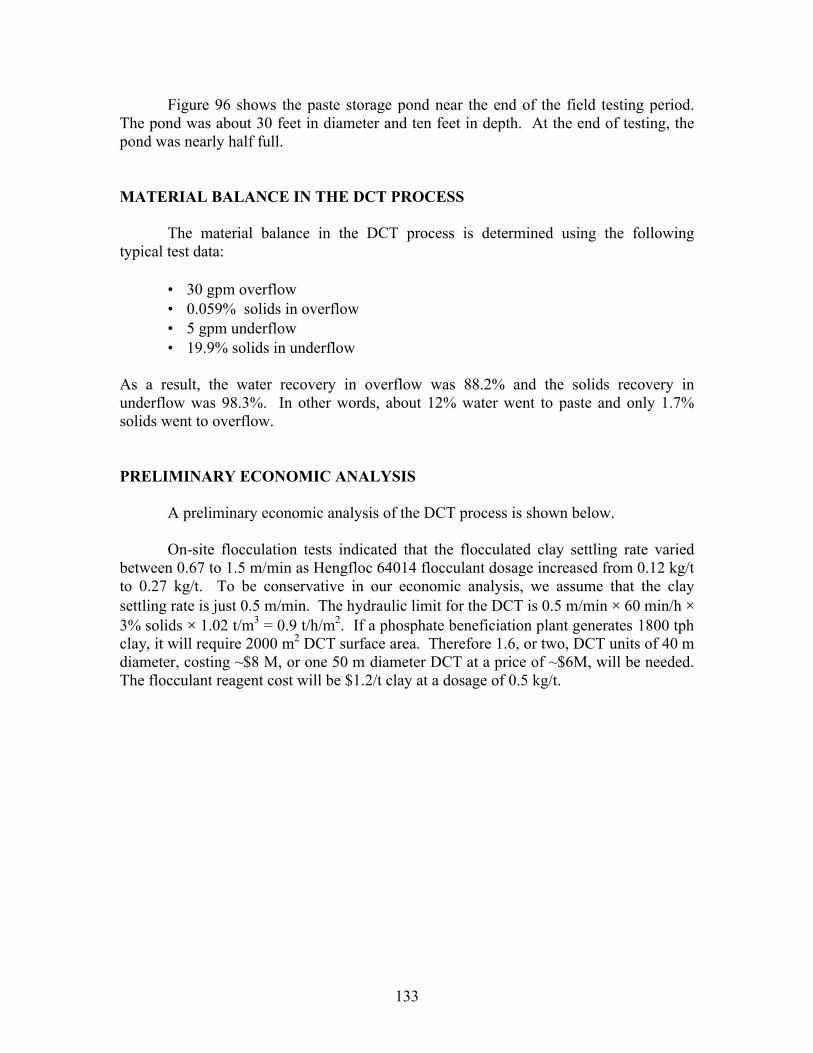
133
Figure 96 shows the paste storage pond near the end of the field testing period. The pond was about 30 feet in diameter and ten feet in depth. At the end of testing, the pond was nearly half full. MATERIAL BALANCE IN THE DCT PROCESS
The material balance in the DCT process is determined using the following typical test data:
• 30 gpm overflow • 0.059% solids in overflow • 5 gpm underflow • 19.9% solids in underflow
As a result, the water recovery in overflow was 88.2% and the solids recovery in underflow was 98.3%. In other words, about 12% water went to paste and only 1.7% solids went to overflow. PRELIMINARY ECONOMIC ANALYSIS
A preliminary economic analysis of the DCT process is shown below.
On-site flocculation tests indicated that the flocculated clay settling rate varied between 0.67 to 1.5 m/min as Hengfloc 64014 flocculant dosage increased from 0.12 kg/t to 0.27 kg/t. To be conservative in our economic analysis, we assume that the clay settling rate is just 0.5 m/min. The hydraulic limit for the DCT is 0.5 m/min × 60 min/h × 3% solids × 1.02 t/m3 = 0.9 t/h/m2. If a phosphate beneficiation plant generates 1800 tph clay, it will require 2000 m2 DCT surface area. Therefore 1.6, or two, DCT units of 40 m diameter, costing ~$8 M, or one 50 m diameter DCT at a price of ~$6M, will be needed. The flocculant reagent cost will be $1.2/t clay at a dosage of 0.5 kg/t.
135
CONCLUSIONS
Based on the above results and discussion, it is concluded that: 1. The DCT was capable of producing clay paste with sand added to the clay slurry at a clay:sand ratio of 2:1. The addition of more sand to the clay helped paste formation in terms of both rate and solids content. 2. To treat 1800 tph phosphatic clay slurry, two 40 m diameter DCTs, or one 50 m diameter DCT, will be needed at a cost of approximately $8 million or $6 million, respectively. 3. Approximately 90% of the water in the clay slurry was recovered as clear overflow from the DCT with a solids content between 0.02% to 0.05%, while more than 98% of the solids were in the paste or DCT underflow stream. 4. The highest clay solids and total solids content in the paste were more than 25% and 35%, respectively. A thicker paste was produced when more sand was added to the clay. 5. The flocculation scheme was critical for paste formation. Anionic flocculant Hengfloc 64014 must be added to the slurry before cationic flocculant Hengfloc 80607. 6. Flocculant dosage and sand addition were the most important parameters for the paste thickening process. 7. Magnafloc 5250 and DPW-1-1355 showed excellent flocculation ability, followed by DPW-1-1329 and DPW-1-1437. 8. Anionic flocculants Hengfloc 62724A and Hengfloc 64016 showed excellent performance at a single dosage of 25 ppm or one dosage of 20 ppm with three incremental additions. Hengfloc 62724A’s performance is better than that of Hengfloc 64016 without the addition of sand in the clay slurry. However, Hengfloc 64016 showed better flocculation ability than Hengfloc 62724A with the addition of sand. 9. Cationic Hengfloc 80607 and Hengfloc 80612 exhibited good flocculation ability compared with Magnaflocs and DPW flocs. Their flocculation abilities, however, were not as good as those of anionic Hengflocs. 10. The initial concentration of polymer affected flocculation performance. The required polymer dosage increased as the initial polymer concentration increased. 11. Slurry pH has significant effects on flocculation response. Alkaline solution increased the slurry settling rate and the optimum settling rate was obtained at pH 10.5.
136
12. Flocculation of the clays in several increments required a lower polymer dosage and yielded denser flocs than when all the polymer was added at once. Optimum flocculation performance was achieved with five incremental additions of flocculant. 13. The clay particles have negatively charged surfaces above pH 2. The effect of Al3+ on clay zeta potential was much more significant than those of Ca2+ and K+. 14. K+ improved flocculation characteristics by neutralizing the clay surface charge and promoting face-to-face clay flocculation. However, Ca2+ and Al3+ showed adverse effects on the flocculation process. A possible cause is that CaOH+, Al(OH)2+, and Al(OH)2
+ adsorbed on the polymer functional group and decreased functionality of the polymer. 15. Sand tailing particles from phosphate flotation promoted flocculation and increased clay consolidation. 16. Phosphatic clay turbidity significantly decreased with increasing flocculant dosage. This may be because flocs were more easily formed as the flocculant content increased. 17. The clay yield curve had the characteristic of an extremely rapid increase in yield stress with increasing solids concentrations. As the solids concentration increased, the yield stress increased and eventually the paste became, in essence, a solid. The yield stress was much higher with the addition of Magnafloc 5250 than without the addition of flocculant. This was because flocs were easily formed after the addition of flocculant, which increased the yield stress significantly. 18. The yield stress decreased as temperature increased. This is believed to be because increasing temperature resulted in decreased paste viscosity, polymer bridging, and flocculation performance. 19. The yield stress increased as slurry pH increased. This is mainly because floc is more readily formed in alkaline solutions than in natural and acidic solutions which increase yield stress. 20. The clay paste was thixotropic since its viscosity decreased with time. Tailing paste often exhibits thixotropic flow behavior since the hydrodynamic forces during shear may break the clay’s weak interparticle linkages, resulting in smaller structural units that in turn offer lower resistance to flow during shear. The thixotropic behavior of pastes is helpful for clay transportation by pumping. 21. The clay paste showed shear thickening behavior because the clay viscosity increased as rotation speed increased. 22. The slump height measured in the slump test is widely used as a paste control parameter. The slope percentage increased significantly with increasing solids

137
percentage. However, the rheology modifier DP 203 significantly reduced the slope percentage, a property that is helpful for clay transportation by pumping. 23. The unique rheology modifiers Rheomax 9010, Rheomax 9040, and Rheomax 9060 reduced the clay paste yield stress. The paste yield stress decreased from 334.1 Pa at 30% solids concentration to 244.6 Pa with 15 ppm Rheomax 9040 at the same solids concentration. The other Rheomax modifiers tested did not reduce the clay paste yield stress. 24. The cationic polymers FLOPAM FO 4650 SH and FLCO CS 653 had a negligible impact on phosphatic clay flocculation.
139
REFERENCES Agerbaek ML, Keiding K. 1993. On the origin of specific resistance to filtration. Water Sci. & Technol. 28(1): 159-68. Anazia I, Misra M. 1989. Enzymatic dewatering of Florida phosphate slimes. Minerals and Metallurgical Processing 6(2): 93-5. ASTM. 1998. Annual book of ASTM standards. 20th ed. Designation: C143/C143M-97 – Standard test method for slump of hydraulic-cement concrete. Vol.04.02, Concrete and aggregates. West Conshohocken (PA): ASTM International. p 89-91. Barreiro LJ, Austin RD, Kouloheris AP. 1977. Compaction of slimes and sand tailings by the Enviro-Clear thickener. Paper presented at the Seminar of the Phosphatic Clays Project; 1977 Jan 26; Lakeland, FL. Boger DV. 1998. Environmental rheology and the mining industry. In: Bloss M, editor. Minefill 98: Proceedings of the Sixth International Symposium on Mining with Backfill; 1998 Apr 14-16; Brisbane, Australia. Carlton (Victoria, Australia): The Australasian Institute of Mining and Metallurgy. Publication Series 98, 1. p 15-7. Bromwell LG. 1982. Physico-chemical properties of Florida phosphatic clays. Bartow (FL): Florida Institute of Phosphate Research. FIPR publication nr 02-003-020. Brooks DR, Scheiner BJ. 1986. Large-scale dewatering of phosphatic clay waste from Polk County, FL. Washington: US Bureau of Mines. Report of Investigations nr 9016. Chamberlain RJ, Ellwanger RE, inventors; American Cyanamid Co., assignee. Anionic polymeric flocculant combinations for settling phosphate slimes. 1981 Feb 17. US patent 4,251,363. Clark SW. 1982. Gardinier, Inc. superflocculation process for phosphatic clay disposal. In: Clark SW, editor. Phosphatic clay workshop. Bartow (FL): Florida Institute of Phosphate Research. FIPR publication nr 02-020-012. p 65-74. Concha F, Bustos MC. 1986. Theory of sedimentation of flocculated fine particles. In: Moudgil BM, Somasundaran P, editors. Flocculation, sedimentation and consolidation. New York: Engineering Foundation. p 275-84. Dean RW. 1999. Surface and ground water mixing in a karst aquifer: an example from the Floridan Aquifer [MS thesis]. Gainesville (FL): University of Florida. 74 p. Deason DM. 1980. Controlled dispersion and coagulation phenomena in phosphate slime dewatering [MS thesis]. Gainesville: University of Florida.
140
Dixon JB, Golden DC. 1987. Dewatering, flocculation, and strengthening of phosphatic clays. Bartow (FL): Florida Institute of Phosphate Research. Open File Report nr 84-02-049. El-Shall H, McFarlin R. 1992. Rapid dewatering of phosphatic clay slurries using fibers. Adv. Filtr. Sep. Technol. 5: 154-61. El-Shall H, Labban M, Scheiner B. 1989. Dewatering of phosphatic clays – role of polymer flocculation. In: Moudgil BM, Scheiner BJ, editor. Flocculation and dewatering, Proc. Eng. Found. Conf., 1988. New York: Engineering Foundation. p 263-78. El-Shall H. 1995. Development and evaluation of a rapid clay-dewatering (FIPR/DIPR) process as a reclamation technique. Bartow (FL): Florida Institute of Phosphate Research. FIPR publication nr 02-093-120. Ghalambor A, Foreman WE, Hayatdavoudi A. 1990. Optimization of thickener performance. Miner. Metall. Process. 7(4): 189-97. Hall ES. 1966. Electrokinetic study of dispersions of clay in hydrolyzed aluminium solutions. Discuss. Faraday Soc. 42: 197-203. Hardianto FS, Ericson WA. 1994. Stabilization of phosphatic clay using lime columns. Bartow (FL): Florida Institute of Phosphate Research. FIPR publication nr 02-088-102. Hoff R, Bunnaul P. 1992. Sediment compressibility in thickening of flocculated suspensions. Miner. Metall. Process. 9(4): 184-8. Hsu JP, Nacu A. 2004. An experimental study on the rheological properties of aqueous ceria dispersions. Journal of Colloid and Interface Science 274(1): 277-84. James RO, Healy TW. 1972. Adsorption of hydrolyzable metal ions at the oxide-water interface. II. Charge reversal of SiO2 and TiO2 colloids by adsorbed Co(II), La(III), and Th(IV) as model systems. J. Colloid Interface Sci. 40(1): 53-64. Keshian B Jr, Ladd CC, Olson RE. 1977. Sedimentation-consolidation behavior phosphatic clays. In: Proceedings of the Conference on Geotechnical Practice for Disposal of Solid Waste Materials; 1977 Jun 13-15; Ann Arbor, MI. New York: American Society of Civil Engineers. p 188-209. Laros TJ, inventor; Envirotech Corporation, assignee. 1990 Jun 5. Flocculating agent combinations for mineral slime filtration systems. US patent 4,931,190. Roberts K, Kowalewska J, Friberg S. 1974. Influence of interactions between hydrolyzed aluminum ions and polyacrylamides on the sedimentation of kaolin suspensions. J. Colloid and Interface Sci. 48(3): 361-7.

141
Scheiner BJ, Smelley AG, Brooks DR. 1982. Large-scale dewatering of phosphatic clay waste from central Florida. Washington: US Bureau of Mines. Report of Investigations nr 8611. Scheiner BJ, Smelley AG. 1985. The phosphatic clay waste problem–flocculation as a possible solution. Miner. Process. Technol. Rev. 1(3-4): 347-61. Scheiner BJ, Stanley DA. 1993. A historical view of dewatering of phosphatic clay waste using polyethylene oxide. In: El-Shall H, Moudgil BM, Wiegel R, editors. Beneficiation of phosphate: theory and practice. Littleton (CO): Society for Mining, Metallurgy, and Exploration. p 455-68. Scheiner BJ, Stanley DA. 1995. Dewatering of phosphatic clay waste using polyethylene oxide: theory and practice. Fluid/Particle Separation Journal 8(2): 96-105. Smith RW, Misra M, Dubel J. 1992. Bacterial flocculation of phosphate wastes using a hydrophobic bacterium. In: Reddy RG, Imrie WP, Queneau PB, editors. Residues and effluents: processing and environmental considerations : proceedings of an international symposium; 1992 Mar 1-5; San Diego, CA. Warrendale (PA): Minerals, Metals and Materials Society. p 747-56. Stanczyk MH, Feld IL, Collins EW. 1971. Dewatering of Florida phosphate pebble rock slime by freezing techniques. Washington: US Bureau of Mines. Report of Investigations nr 7520. Sworska A, Laskowski JS, Cymerman G. 2000. Flocculation of the syncrude fine tailings, Part I. Effect of pH, polymer dosage and Mg2+ and Ca2+ cations. International Journal of Mineral Processing 60(2): 143-52.

143
FOR ADDITIONAL READING Ledoux RL, White JL. 1966. Infrared studies of hydrogen-bonding interaction between kaolinite surfaces and intercalated potassium acetate, hydrazine, formamide and urea. J. Colloid Interface Sci. 21(2): 127-52. Lee LT, Rahbari R, Lecourtier J, Chauveteau G. 1992. Adsorption of polyacrylamides on the different faces of kaolinites. J. Colloid Interface Sci. 147(2): 351-7. Li C, Somasundaran P. 1992. Reversal of bubble charge in multivalent inorganic salt solutions—effect of aluminum. J. Colloid Interface Sci. 148(2): 587-91. Nair KV, Somasundaran P, inventors; Trustees of Columbia University in the City of New York, assignee. 1986 Jan 7. Method for dewatering phosphate slimes. US patent 4,563,285. Nguyen QD, Boger DV. 1998. Application of rheology to solving tailings disposal problems. International Journal of Mineral Processing 54(3-4): 217-33. NTP Corporation (Pittsburgh, PA). 1983. Thermal process for rapid dewatering and separation of phosphatic clay waste. Bartow (FL): Florida Institute of Phosphate Research. Open File Report nr 82-02-21. Onoda GY Jr, Deason DM, Chhatre RM. 1980. Flocculation and dispersion phenomena affecting phosphate slime dewatering. In: Somasundaran, P, editor. Fine Particles Processing: Proc. Int. Symp. on Fine Particles Processing; 1980 Feb. 24-28; Las Vegas, NV. New York: American Institute of Mining, Metallurgical and Petroleum Engineers. Vol. 2. p 1000-11. Packham RF. 1965. Some studies of the coagulation of dispersed clays with hydrolyzing salts. J. Colloid Sci. 20(1): 81-92. Pearse MJ, Weir S, Adkins SJ, Moody GM. 2001. Advances in mineral flocculation. Minerals Engineering 14(11): 1505-11. Pefferkorn E, Nabzar L, Carroy A. 1985. Adsorption of polyacrylamide to sodium kaolinite: correlation between clay structure and surface properties. J. Colloid and Interface Sci. 106(1): 94-103. Peng FF, Di PK. 1994. Effect of multivalent salts–calcium and aluminum on the flocculation of kaolin suspension with anionic polyacrylamide. J. Colloid and Interface Sci. 164(1): 229-37. Raden DJ. 1982. Dewatering phosphate clay waste using the Enviro-Clear thickener. In: Proceedings of the Consolidation and Dewatering of Fine Particles Conference; 1982 Aug 10-12; Tuscaloosa, AL. University (AL): US Bureau of Mines. p 205-24.
