developing and using indicators of ict use in education;...
TRANSCRIPT

Developingand Using Indicators ofICT Use in Education
Compiled by
UNESCO Asia and Pacific Regional Bureau for Education Bangkokand Southeast Asian Ministers of Education Organization Regional Centerfor Educational Innovation and Technology (SEAMEO INNOTECH)Metro Manila Philippines
Supported by Japanese Funds-in-Trust (JFIT)
United Nations Educational Scientific and Cultural OrganizationUNESCO Bangkok
Section One
Step Action
Developing and Using Indicators of ICT Use in Educationcompiled byUNESCO Asia and Pacific Regional Bureau for Education Bangkokand Southeast Asian Ministers of Education Organization Regional Centrefor Educational Innovation and Technology Metro Manila PhilippinesBangkok UNESCO Bangkok 2003
39 p
1 EDUCATIONAL TECHNOLOGY 2 INFORMATION TECHNOLOGY3 COMMUNICATION TECHNOLOGY 4 ICT 5 COMPUTER USES INEDUCATION 6 EDUCATIONAL INFORMATION SYSTEMS 7 EDUCATIONALINDICATORS I UNESCO Asia and Pacific Regional Bureau for EducationII SEAMEO Regional Centre for Educational Innovation and Technology
371334
copy UNESCO 2003
Published by theUNESCO Asia and Pacific Regional Bureau for EducationPO Box 967 Prakanong Post OfficeBangkok 10110 Thailand
Printed in Thailand
The designations employed and the presentation of material throughout the publicationdo not imply the expression of any opinion whatsoever on the part of UNESCOconcerning the legal status of any country territory city or area or of its authorities orconcerning its frontiers or boundaries
IPS03OS152-1500IPS03OS152-1500IPS03OS152-1500IPS03OS152-1500IPS03OS152-1500
Section 1 Introduction Indicators and Rationale of Use
C o n t e n t s
Basic approach to formulating indicators 1
Section 2 Using Indicators to Assess Impact of ICT inEducation
Synthesis of country experiences on ICT indicators and related issues 3
Kinds of indicators developed based on visions or goals and surveys 3
Standards for technology use 6
Levels of integration 6
ICT infrastructure hardware and connectivity 7
Teacherrsquos use of ICT 7
Targets of indicators surveys 7
Types of indicators 7
Assessment and evaluation methods 10
Section 3 Methods of Collecting Indicators
Survey questionnaire 11
Telephone interview 11
3-yearly sample assessment 11
Internet-based surveys 12
Web-based self-evaluation tool 12
Section 4 Various Software or Database Systems for 13Storing Indicators
C o n t e n t s (contrsquod)
Attachment I ICT Indicators Used in DifferentCountries 15
Attachment II Comparison of ICT Indicator Themesin Selected Countries 29
Attachment III Studies on the Use and Impact of ICT in Education 35
1
11Section
IntroductionIndicators and Rationale
of Use
In evaluation studies indicators are used as evidence or signs by which we canassess or evaluate materials methods an intervention a programme or a projectIndicators are measuring devices They define concepts in terms of themeasurements and data it is possible to collect and analyse They define whatdata to collect and at what time intervals
To develop good indicators we need first to have a clear view of what we are tryingto achieve and to measure The first requirement for a systematic development ofindicators for Information and Communication Technology (ICT) is to identify theresults objectives outputs and key concepts of the ICT project as part of theevaluation system plan
The basic approach involves four steps
Identify what is to be measured
Develop trial measures
Assess each trial indicator using agreed-on criteria
Select the best indicators for a specific project
Section One
Step Action
Step 1Step 1Step 1Step 1Step 1Identify allconcepts to bemeasuredespecially projectobjectives andoutputs
Review all concepts objectives results and output state-ments to clarify them and reach agreement
Be clear about what type of change is implied (a situationstate condition attitude behaviour)
Clarify whether the outcome sought is an absolute change arelative change or no change
Specify where and when the change is expected (what targetgroup what location and in what time frame) (this identifiesthe appropriate unit of analysis)
Determine the relationship between project activities and theiroutputs or objectives (are these outputs or objectives director indirect)
Step 2Step 2Step 2Step 2Step 2Develop a list ofpossible (trial)indicators
Think of possible alternative indicators for each conceptobjective and output without being too restrictive
Conduct internal brainstorming sessions
Consult stakeholders and other experts
Try to borrow from other projects and studies
Step 3Step 3Step 3Step 3Step 3Assess each trialindicator againstcriteria
Establish an agreed set of criteria for indicators (see Table 2)
Use a scoring scale (1-5) to determine the usefulness of eachtrial indicator (but be flexible and use your own judgment)
Table 1Describes the actionsrequired in each step
Step 4Step 4Step 4Step 4Step 4Select the bestindicators for thisproject
Consider each indicator on its merits against the criteria
Consider the mix of indicators to construct a robust set thatis consistent and complementary in terms of data-collectionmethods and time frames
Avoid having too many indicators (it may indicate that theobjectives and outputs are not clearly defined)
Be prepared to update your indicators - the best indicatorsmay change as projects develop (one common change occursafter using input indicators at first and then realizing that outputindicators were what was needed)
Basic approach to formulating indicators
2 Developing and Using Indicators of ICT Use in Education
Table 2 below summarises the criteria that can be applied in assessing potentialindicators based on the recommendations of the Centre for DevelopmentInformation Evaluation an institute of USAID These criteria are to be used flexiblyFor instance according to the Centre direct measures are not always better thanindirect measures while quantitative measures are not always better than qualitativemeasures
The process of developing indicators involves a combination of activities such asbrainstorming multi-stakeholder discussions and being clear about definitions criteriagoals and priorities More focused and cost-effective monitoring and evaluation ofICT use in education is expected Indicators are based on assumptions aboutwhat is relevant mdash they are expressions of value or of what is desirable Thus it isimportant that researchers and evaluators involve stakeholders in developing theindicators to ensure that the data collected will respond to their information needs
Criterion Description
Direct measure Indicator is intuitively understood (high face validity)
Indicator is a direct measurement rather than a proxy thatdepends on assumptions for its validity
Indicator is supported by a body of research
Objective Indicator is unambiguous about what is being measured
Different people will collect comparable data based on theindicator
Definition remains stable over time so change can be measured
Indicator is unidimensional (measures only one thing at a time)
Indicator can be quantitative or qualitative as long as it is clearlyand consistently defined and interpreted
Adequate Either by itself or with a minimal companion set of indicators theindicator provides reasonable confidence that it accuratelymeasures the attribute
Object is to have as few indicators as possible per attribute (shouldbe three or fewer) - more is not necessarily better
Number of indicators will depend on the complexity of the objector what is being measured
Quantitative Quantitative indicators are more objective than qualitative ones
Qualitative indicators should be adequately specified to be objectiveand consistent
Disaggregated The more disaggregated the indicator the more easily data can bemanipulated to answer questions not anticipated at the outset
Practical Data can be collected at reasonable cost given their utility
Data are available and can be collected at suitable time intervals
Data can be readily collected in various projects for comparison
Reliable Indicator is reliable within the context of the evaluation purposeand resources
Data-collection process is consistent across different time andspace scales using comparable methods and samplingprocedures Indicator is based on representative data
Table 2Criteria for
assessing indicators
1
12Section
Using Indicators toAssess Impact of ICT
in Education
3 3Final Report
Below is an attempt to synthesise several countriesrsquo efforts and initiatives inconducting research to evaluate the use of ICT in education and for some countriesthe development of ICT indicators Among these countries are
Australia Canada CIS and Balkan countriesIndia Indonesia JapanKorea Republic of Malaysia New ZealandPhilippines Singapore SloveniaSouth Africa Thailand United KingdomUnited States Uzbekistan Viet Nam
The development or potential development of indicators in the region follows threepaths
1 Ministries of Education or the Government set up Task Forces or committeesto take charge of developing indicators measuring the use and impact of ICTin education
2 The vision and goals of the ICT programme serve as basis for the formulationof ICT indicators
3 The impact of the use of ICT in education is determined through surveys andresearch and thus serves as basis for the formulation of national indicators
While the government of Korea has ldquoCyber Korea 21rdquo and the ldquoWhite Paperrdquo thegovernment of Japan has ldquoeJapan Priority Programmerdquo and Europe has theldquoeEuroperdquo initiative These programmes are all aimed at improving the ICT sectorand carry with them built-in indicators for measuring the achievement of thesegoals
Today most countries include ICT integration either in their national policies or inlaws pertaining to the education sector In Australia at the federal level theCommonwealth government has set goals for schools in relation to ICTdevelopment The government wants students to leave school as confident creativeand productive users of new technologies particularly ICTs as well as understandingthe impact of those technologies on society (httpwwwcurriculumeduaumceetyanationalgoalsnatgoalshtm) Schools are expected to integrate ICT into theiroperations
In Thailand the national Education Act of 1999 formed the core of educationreform towards ICT use in education as guided by three principal strategies value-added equity and quantum-jump (httpwwwunescoorgbangkokeducationictict_enablingap_policyLearntec-Tongyoopdf) Similarly the Law on Education inUzbekistan outlined the inclusion of ICT in the education sector Meanwhile thePhilippinesrsquo Department of Education has also formulated policies for the use ofICT The same trend is seen in Indonesia Malaysia Uzbekistan Viet Nam andothers where the national government sets goals for ICT integration in education
Within the region the Republic of Korea is the most advanced in terms of indicatordevelopment on the use of ICT in education The Ministry of Education and KoreanEducational Research and Information Service (KERIS mdash httpwwwkerisorkrenglish) have formulated and used a set of indicators categorised into supportinput utilisation or output The support indicators include training hours given toteachers and principals budget allocation the year plan and incentives for teachers
Section Two
Synthesis of country experiences on ICT indicatorsand related issues (Attachment II)
Kinds of indicators developed basedon visions or goals and surveys
4 Developing and Using Indicators of ICT Use in Education
The input indicators consist of the ratio between computers and students Internetconnectivity and speed educational software and the number of applications usedThe utilisation indicators include subjects using multimedia the percentage ofclasses using a Web board or computer labs the percentage of teachers joiningICT associations and discussion forums student usage of computers and usageof the internet Output indicators include teachers and students having an emailaddress a homepage and ICT certificates and students also having completed a32 hours ICT course
In Australia the Ministerial Council of Education Employment Training and YouthAffairs (MYCEETA) is currently looking into the use of performance measures forstudent achievement relating to new technologies Taking the National Goals forSchooling as the starting point the NEPMT commissioned a project in 2000 todevelop key performance measures for monitoring the ICT knowledge and skills ofAustralian school students The outcome of this process was the report MonitoringProgress towards the National Goals for Schooling Information and CommunicationTechnology (ICT) Skills and Knowledge Basically the report describes the contextof learning ICT skills and knowledge as an outcome of schooling identifies anddescribes performance measurement approaches definitions and sources of datacurrently used in relation to schooling research and national and internationalreporting on ICT skills and knowledge evaluates the ICT measures currently in usein the context of the National Goals for Schooling in the 21st Century proposes astrategy for monitoring the profile of ICT skills and the knowledge of school studentsand identifies further work required to establish an operational monitoring programme
There have also been several initiatives undertaken to measure the impact and useof ICT in education in different States of Australia The trends show that theseindicators are increasingly focusing on qualitative indicators measuring teacherand student outcomes For example the University of Sydney looked into whetherstudent-centred learning took place along with student improvement in high-orderthinking skills As far as the teachers are concerned the indicators assess changesin teaching practice and improvement in the ability to use emerging technologiesHowever connectivity remains a strong indicator in Australia focusing on the numberof teachers with a notebook the computer-student ratio bandwidth available inschools and the type of Internet connection
In Malaysia the creation of the Smart School System serves as benchmark for ICTintegration in schools (httpwwwmdccommymscflagshipsshtml) The MalaysianSmart School programme is aimed at reinventing learning institutions in terms ofteaching practices and school management preparing children for the InformationAge Some of the initial proposed indicators by the ICT project are both quantitativeand qualitative They focus on the use of ICT in curriculum in pedagogy inassessment and materials The quantitative indicators include decreased drop-outrates and recorded achievement gains each year among others while the qualitativeindicators include caring and competent teachers and a broad flexible curriculumthat caters to the differing needs and abilities of students
In the Philippines the Senate Committee on Education Arts and Culturecommissioned SEAMEO-INNOTECH to conduct the national survey to profile theICT capabilities of elementary and secondary schools in the Philippines SEAMEO-INNOTECH was responsible for formulating the indicatorsitems on the survey (httpwwwseameo-inotechorgframeshtml) These include the existence of an enablingenvironment the computer skills of school personnel the presence of computersin schools instructional or academic use of computers ICT infrastructure and Internetconnectivity The Department of Science and Technology in collaboration with theDepartment of Education has also conducted a survey not only looking at theinfrastructure and hardware support indicators but also with regard to howcomputers had been used and integrated into the curriculum as well as in teachingand learning
5 5Final Report
In Thailand initial use of indicators through a survey included Internet connectivityin schools the computer-student ratio and usage of ICT in schools and schooladministration and connection to SchoolNet as main issues The annex found atthe end of this document also shows a variety of potential indicators which fallunder their ICT projectrsquos three principlesstrategies namely value-added equityand quantum-jump strategies A committee was formed to concentrate onformulating indicators to measure the impact of ICT use in schools
Uzbekistan through its Ministry of Public Education has carried out monitoring andevaluation through the 14 Provincial Departments of Education and 15 In-serviceTraining Institutes Under these indicators have been examined such as theavailability of computers in schools the number of students using computers thenumber of computer classes integration of ICT in subjects and teacher training Itwas reported that the evaluation of student computer ability and performance isdifficult as different computers are being used throughout the country
In India the ICT programme statement of goals brought about potential indicatorsthat include the presence of MIS and software ICT in textbooks ICT in computersubjects and in-service and pre-service training of teachers
Though Indonesia has not developed its set of indicators its ICT in educationprogramme goals and objectives also imply that the following indicators can bepotentially useful studentrsquos understanding of the benefits of ICTs mdash disadvantagesas well as challenges studentrsquos use of ICT knowledge in acquiring processingarranging distributing and keeping information and studentrsquos application ofknowledge skills and attitudes in designing information technology systems andsolving problems relating to ICT
Similarly while Viet Nam has not developed its indicators its ICT goals imply indicatorsin the following areas ICT as a subject in general education number of trainedteachers and establishment of ICT departments in universities to train teachersprovision of computer labs in schools and the application of ICT in schoolmanagement
In Singapore as the process of IT integration in schools reaches a considerablelevel of maturity the question being asked is How do we integrate IT in schools solearning opportunities are optimised Research undertaken by the National Instituteof Education and Ministry of Education entitled ldquoEffective Integration of IT in SingaporeSchoolsrdquo (httpeduwebnieedusgprojectsITintegration) focused on the generalpedagogical practices and socio-cultural policies of IT integration in Singapore schoolsnot just the innovative and best practices The indicators used included infrastructureand resources school IT culture staff development teacher use and student useThe research sought answers to the following questions or indicators of a qualitativenature
What are the pedagogical practices of teachers and students that promote orhinder the integration of IT
What are the roles of the human participants activities and tools in such anenvironment
How does a change in the curriculum promote a culture that facilitates integrationof IT
How does a change in the mode of assessment affect integration of IT
The UNESCO Institute of Information Technology in Education (httpwwwiiteru)based in Moscow undertook a survey of the use of ICT in education in Baltic andCIS countries making use of the following indicators a) Official documents on ICTusage in education b) ICTs in curricula mdash as a separate subject or to support othersubjects c) Equipment (computer-student ratio computer availability in classroomsmultimedia system and LAN connection) d) Software (percentage of schools withDOS and Windows and using software for teaching subjects and software designed
6 Developing and Using Indicators of ICT Use in Education
by local and foreign experts) e) Global communication means (percentage withoutInternet access with limited Internet access ndash- only e-mail access via dial-up ordedicated line and those with web pages) and f) Personnel development mdashpercentage of elementary school teachers subject teachers and teachers ofInformatics and EI administration who have undertaken the computer literacy coursefor certain hours during a certain time frame and the computer skills of elementaryschool teachers subject teachers and teachers of Informatics and administration
What kinds of changes in knowledge skills and competencies are required fromteachers and students in the use if ICT In order to serve as a basis for developingknowledge skills and competencies in the use of ICT as well as in comparingoutcomes of ICT use against goals set few countries have standards for technologyuse
In Australia however the Victoria government has a curriculum standards framework(CSF) developed by the Victorian Curriculum and Assessment Authority whichidentifies what students should know and be able to do in eight key learning areasfrom preparatory year to year 10 In New South Wales the Government hasforeshadowed the introduction of an external Computer Skills Assessment for allyears 6 and 10 students to determine their knowledge skills and understanding inthe use of ICT Western Australia has a Competency Framework for Teachers andin Queensland these competencies are identified in Minimum Standards forTeachers-Learning Technology (httpeducationqldgovaucurriculumlearningtechnology mst_inthtmlintroduction) Queensland also produced a documentICTs for Learning School Information Kit 2002ndash2003 which details benchmarksestablished around teaching learning and the curriculum learning and developmentICT infrastructure connectivity ICT support and innovation Furthermore thedevelopment of indicators will be based on the following a) definition of contentdomain including functional skills in a cross curricular context manageability in itscomplexity delineates between Year 6 and Year 10 in terms of the curriculumcontext and the hierarchy of skills identified and b) the development of a scale ofcompetence including basic and functional skills as well as complex thinking andfacilitating the reporting of a range of achievement
The United States and Europe utilise a set of standards for the technology use ofstudents teachers and school administrators The International Society for Technologyin Education (ISTE) came up with the National Education Technology Standards(NETS) Project (httpcnetsisteorg) the primary goal of which is to enablestakeholders in PreK-12 education to develop national standards for the educationaluses of technology that will facilitate school learning (see attached for more detailson the ISTE NETS standards)
The fact that the other countries did not indicate any existing standards that canmonitor the use of technology reflects the lack of qualitative indicators Many countriesmerely focus on providing the technology that is making computers and Internetaccess available
In most of the countries researched on the studies have been limited to ICT indicatorsused in the primary and secondary level There are however instances whereother levels are included such as the case of Republic of Korea where universitylevel is included and in Slovenia pre-school In the United States those in physicaleducation and special education subjects in the primary and secondary levels wereexcluded Japan is noteworthy as its ICT policy includes even special schools forthe blind and the disabled Australia incorporates those in non-formal education intheir studies
Standards for technology use
Levels of integration
7 7Final Report
This situation tells us something about the issue of equity in the use of ICT in educationThere are times when the government policy itself can serve as either an aid or abarrier to equity in access
The number of computers or Internet connections in schools dominates statisticsIn fact only six countries specified indicators pertaining to other ICT technologiessuch as telephone lines fax machines LCD projectors and the like These countriesare Australia India New Zealand Republic of Korea Thailand and the Philippines
Perhaps future studies should also look into other types of ICTs in addition tocomputer-based and Internet In doing so there should be a clear definition of whatICT is The following definitions can serve as a guide
Information TInformation TInformation TInformation TInformation Technology (IT)echnology (IT)echnology (IT)echnology (IT)echnology (IT) is the term used to describe the items of equipment(hardware) and computer programmes (software) that allow us to access retrievestore organise manipulate and present information by electronic meansPersonal computers scanners and digital cameras fit into the hardware categoryDatabase storage programmes and multimedia programmes fit into the softwarecategory
Communicat ion technology (CT)Communicat ion technology (CT)Communicat ion technology (CT)Communicat ion technology (CT)Communicat ion technology (CT) is the term used to describetelecommunications equipment through which information can be sought andaccessed for example phones faxes modems and computers
Information literacyInformation literacyInformation literacyInformation literacyInformation literacy is the combination of knowledge understanding skills andattitudes that students need to fully contribute as members of society in theinformation age When students become information literate they develop anability to select interpret evaluate manipulate and present information
Studies on how teachers use ICT are also included in most ICT integrationprogrammes Many looked into how teachers have used ICT in teaching specificsubjects into how they have employed Internet resources in teaching how theyhave used email in communicating with students and other teachers and whetherthey have developed their own homepages In Australia for example teachersmake use of self-paced learning materials on ICT use in CD-format In other countriespreference is given to teacher applicants who are already computer literate suchas in the case of the Philippines In Korea and Australia teachers are provided withPCs These provides an overview of ICT indicators related to teacherrsquos use of ICT
Respondents for the different surveys in the US New Zealand the UK South Africaand Europe usually included teachers Students are included in surveys to determinetheir perceptions towards ICT such as in the UK and South Africa In other casesschool heads are taken as respondents such as in the Philippines and New ZealandIt was not clear from the results in other countries such as Canada Korea Japanand Slovenia who their respondents were
While some countries use qualitative in addition to quantitative indicators their useis obviously limited Quantitative data usually includes ICT infrastructure andconnectivity consisting of hardware and the physical networks that connect thecomputers locally and globally
Common indicators used for measuring or determining ICT infrastructure include
ICT infrastructure hardware and connectivity
Teacherrsquos use of ICT
Targets of indicators surveys
Types of indicators
8 Developing and Using Indicators of ICT Use in Education
Availability of computer hardware ratios of computerstudent computerclassroom computersteacher type of computers (stand alone multimedia innetwork)
Availability of connectivity and bandwidth of the computers Type of bandwidthfor connections includes high-speed broadband wireless
Quantitative data can be collected from indicators that will provide an overall view ofinfrastructure support and ICT presentation in schools However it is equally importantto examine indicators that will show how ICTs have been used not only as a basicoperational tool but also as a communications tool which promotes the developmentof creativity interactivity collaborative learning critical thinking and problem-solving
There are countries that are already attempting to include attainment and ICTimpact in indicators
Canada included ldquoobstacles to fuller use of information technologiesrdquo in its list ofindicators (httpwwwcmeccastatspceip1999Indicatorsiteenglishpagespage19ehtml) In Europe ldquoteacher confidence in the use of ICT change in teachingmethods and desirable ICT skillsrdquo is assessed (httpwwweurydiceorgDocumentsTicBIenFrameSethtm)
In New Zealand ldquoobstacles faced by teachers in using ICT factors that encourageuse of ICT studentrsquos positive views about technology activities in schoolrdquo are amongthe qualitative indicators
South Africa (httpeducationpwvgovzateli2researchICT20auditICTaduithtm)attempts to measure practical foundational and reflexive competencies of educatorsalong with how well students enjoy ICT-related activities and learnerrsquos perception ofhow the use of computers improves learning and attitudes
Meanwhile the UK (httpwwwdfesgovukstatisticsDBSBUb0296) looks atteacher confidence in ICT use and the benefits of ICT in subjects while in the USmost qualitative indicators pertain to the teacherrsquos perceived value of internet userelative to the teacherrsquos educational background school level taught location ofaccess etc
The Republic of Korea includes output indicators teachers and students now havingemail addresses and a homepage to deliver information and exchange school workand ideas as well as more participation in ICT extra curricular activities (httpwwwicce2001orgcdpdfp12 KR115pdf)
Research in Japan the Philippines Slovenia and other countries show that thesecountries are still concentrating on providing ICT infrastructure that is making thetechnology available in their respective countries rather than measuring impactand effectiveness
Qualitative indicators mentioned in the research include
How much students think they have improved Change in teaching methods Desirable ICT skills Factors that encourage telecommunications use Students who had positive views about technology activities in schools Teachers agreeing that telecommunications technologies can enhance learning
and teaching How much learners think they have improved in various activities Teacher confidence in the use of ICT Development of practical foundational and reflexive competencies Impact of computers on educators and learners Barriers to computer related activities
Some indicators appear to be unique or were only mentioned for some countries
In Europe for example ICT indicators include the ICT policy and strategy of eachcountry in the CIS and Balkan study looking at Denmark Sweden Finland Norwayand the UK These indicators measure objectives of each country in national ICTprojects along with the schedule of implementation
9 9Final Report
In the Republic of Korea the establishment of an education network (KoreaEducation Network) serves as one of the ICT indicators for higher education Koreaalso uses the establishment of a networked research system (Research InformationService System) for higher education as another indicator
The establishment of a network can be considered a quantitative indicator in thesense that it is a physical phenomenon where hardware or portalsplatforms areprovided for networking in a digital form to take place However networking canalso be a qualitative indicator if the focus is on developing competence indisseminating knowledge and information quickly and to large numbers of peopleThe level or quality of networking among organisations can also be used as aqualitative indicator
Furthermore most of the countries give themselves a deadline or a yearlyachievement target For example in the Republic of Korea the targets for theyear 2000 are to provide PCs and other infrastructure to schools for 2002 theestablishment of a Nationwide Education Administration Information System andfor 2005 the setting up of the Integrated Human Resources Information Network
The use of ICT in the school system in the Asia-Pacific Region as in the otherRegions of the world is widespread and continuously growing Many believe thatICT will empower teachers transforming teaching and learning processes frombeing highly teacher-dominated to student-centered Arguably the quality of studentlearning will improve tremendously as use of ICT will create opportunities for studentto develop their creativity problem-solving abilities and other higher-order thinkingskills
It appears though that while ICT has revolutionised business industry andentertainment indicators to prove that it has had the same effect on studentoutcomes are lacking as yet Moreover ICT has brought with it its own problemssuch as the oft-mentioned ldquodigital dividerdquo exacerbating the problem of access toICT between rich and poor male and female and between and among teachersand school administrators Moreover as countries continue to invest in ICT for usein education drawing financial resources from a variety of sources including theprivate sector and bilateral funding agencies there is even greater need forperformance indicators to monitor the use and effects of ICT demonstratingaccountability to these various funding sources and to the public
While these problems are known to our policy makers and educators informationon the extent of these problems remains scant due to lack or absence of monitoringand evaluation systems concerning the use of ICT in schools and its impact onteaching and learning There is an urgent need therefore for a monitoring andevaluation (M and E) system if current efforts to make ICT use an integral part ofthe education system are to succeed Such M and E systems should start withformulating a set of indicators of ICT use and impact in education
This effort is not new in other parts of the world such as in the USA Europe theUK Canada Australia New Zealand and the like (A listing of ICT indicatorsdeveloped in these countries is given as Appendix I to this paper) However in mostof the Asia-Pacific countries there has been little systematic work in the use of ICTindicators in the field of education except that of the Republic of Korea and soonAustralia
Given that Asia-Pacific countries differ widely in regard to the scope and variety ofuse of ICT in education it would be unrealistic and inappropriate to attempt toformulate a uniform set of indicators that can be used to frame data collection forICT in education projects Rather it is better to arrive at a consensus on commoncore indicators that can be used regardless of the ICT utilisation stage which acountry has reached Important criteria to be observed in formulating these coreindicators would include local relevance reliability and robustness when these areused for comparison of one ICT project or country with another
10 Developing and Using Indicators of ICT Use in Education
Assessment and evaluation methodsIn most of the studies reviewed traditional or standard assessment methods wereused Assessment rubrics were designed for specific projects lessons andorclassroom experiences in addition to standard assessment tools except in a primaryschool in Sunnyside Elementary School Putnam Washington In this study parentswere also involved in the assessment process preparing reports of their childrenrsquosprogress
The ways that technologies are being used in schools change the teacherrsquos rolefrom that of technology-as-teacher to technology-as-partner in the learning processAs students increasingly use technologies as learning tools they will producetechnology-based artifacts - student-constructed knowledge bases Theseknowledge bases are rich multi-modal indicators of what students have learnedMoreover as learning becomes more meaningful so it becomes more authenticand more complex Thus authentic assessment and other non-standard assessmentmethods such as rubrics need to be designed to capture meaningful learningexperiences of students brought about by these new technologies
Unfortunately not too many teachers have acquired the competencies to conductauthentic assessments for student learning using learning portfolios and rubrics forperformance evaluation The need for such learning assessment competencybecomes even more urgent as educators move away from the behaviourist andobjectivist perspective of learning to that of a more constructivist view
Using the type of indicators used by countries as basis for categorising them basedon the extent and impact of ICT and using the input-process-output model theresults would be
Level 1 - Includes input indicators only Level 2 - Includes input and process indicators
Level 3 - Includes input process and output indicators
x
x
x
x
x
x
x
x
x
x
x
x
x
x
x
x
x
x
Qualitative
Type of indicator
x
x
x
x
x
x
x
x
Australia
CIS and Balkan countries
Canada
Europe (Denmark SwedenFinland Norway UK)
India
Indonesia
Japan
Korea Republic of
Malaysia
New Zealand
Philippines
Slovenia
South Africa
Thailand
UK
USA
Uzbekistan
Viet Nam
Country LevelQuantitative
3
2
3
3
2
1
2
3
2
2
1
1
3
2
3
3
2
1
1
13Section
Methods ofCollecting Indicators
11 11Final Report
There are various ways of collecting data based on predetermined ICT indicatorsOf course the most popular one is the use of survey questionnaires farmed out toa representative sample of schools school heads and teachers either on a regularor one off basis Clearly those done more regularly can track the behaviour of theindicators over time Weaknesses in ICT implementation can be remedied in duecourse new strategies in ICT implementation can be worked out and carried outthus increasing the probability of success of ICT programmes and projects Theone-shot survey is more appropriate for a summative kind of assessment in whichwe are more interested in finding out for instance the longer-term impact of ICTuse
Where the telephone system in a particular country is well developed enough thatmost homes have access and long distance calls are cheap the telephone interviewis a more cost-efficient method of data collection For example EURYDICE BasicIndicators on the Incorporation of ICT into European Education Systems Project((httpwwweurydiceorgDocumentsTicBIenFrameSethtm) conductedEurobarometer surveys over the telephone in 2001 covering a representative sampleof school heads and teachers in each EU country The questions put to the schoolheads were mainly concerned with their school ICT equipment and facilities whilethose asked of the teachers included the use of computers and the Internet withtheir pupils (time spent using them frequency of their use reasons for not usingthem etc) and how ICT had changed the way they taught Slovenia also made useof telephone interviewing as a method of data collection augmented by publicopinion surveys in person on a one-to-one basis (httpwwwrisorg) Data oninformation-telecommunication infrastructure such as telephone cellular phoneand ISDN connections number of Internet providers backbone providers and thelike were gathered from the telecommunication companies themselves (Details ofindicators used in the above surveys are in Appendix I)
In Australia the national monitoring of ICT skills and knowledge of students in Year6 (aged 10-12 years) and Year 10 (aged 14-16 years) will be done by means ofthree-yearly sample assessments commencing in 2005 Student outcomeinformation is the focus of the reporting agenda Assessment techniques should beinnovative and model good assessment practice and wherever possible assessmentmaterials developed for national sample assessments should be available for use bysystems and schools Collection and use of data for national purposes will in allrespects conform to the guidelines provided in the report Data Principles and Protocolsagreed by the PMRT and where performance in different years in a particular domainis the focus of measurement a single domain scale should underpin measurementsof student achievement The assessment methods will include a mix of tests onpaper and on line and performance assessment tasks with teacher assessment
The study by Singapore to measure the effective integration of ICT in schoolsindicated that to gather accounts by various groups and individuals in the learningenvironment both qualitative and quantitative methods were drawn upon such asobservations of IT and non-IT based lessons face-to-face interviews with principalsand IT co-ordinators group interviews with students and teachers questionnairesfor teachers and students and samples of studentsrsquo work
Survey questionnaire
Telephone interview
3 -yearly sample assessment
12 Developing and Using Indicators of ICT Use in Education
Where there is a saturation of Internet connectivity in the country that is most ofthe homes schools and offices are connected use of questionnaires posted on thewebsite of the institutionagency conducting the surveys can be an efficient methodof collecting data on indicators Furthermore communication by emails betweenthe respondent schools school heads teachers and even students will facilitatedata gathering Data entered into the web-based questionnaire can be automaticallyuploaded to the institutionagencyrsquos computer server located thousands of milesaway
Notably the UNESCO IITE survey met with some difficulties because the collectionof data depended primarily on the efforts and contributions of heads of departmentssenior specialists and the staff of national Centres of Informational Technologies inEducation or Centres of Teacher Training Retraining and Educational Support whowere not given any financial support agreeing to work due to an official memorandumThus many of the results were generated from expertsrsquo estimates rather thandirect collection of data from teachers students and schools
EnGuage a new Web-based framework developed by NCREL in the USA (httpwwwncrelorgengauge) is a response concern regarding the ever-increasinginvestment in educational technology by providing answers to three significantquestions to wit What value does technology bring to the schools How can ourschools ensure a return on these investments And why does technology work insome schools and not in others EnGuage is a tool set designed to help schoolsand school districts use technology effectively for learning teaching and managing
The School Technology and Readiness (STAR) Chart (httpww2isteorgstarchart) provides another web-based self-evaluation tool providing schools withthe information they need to better integrate technology With STAR Chart onlinemultiple-choice questionnaire can be completed that will provide instant feedbackThe Chart identifies and defines four school profiles ranging from the ldquoEarly Techrdquoschool with little or no technology to the ldquoTarget Techrdquo school that provides a modelfor the integration and innovative use of educational technology It is not meant tobe a measure of any particular schoolrsquos technology and readiness but rather isintended to serve as a benchmark against which every school can assess andtrack its own progress
The STAR Chart can help any school or community answer three criticalquestions
Is your school using technology effectively to ensure the best possible teachingand learning
What is your schoolrsquos current education technology profile
What areas should your school focus on to improve its level of technologyintegration
The method of data collection for ICT indicators will then vary from country tocountry depending on the spread of telecommunication use such as the telephoneand the Internet It will also depend on whether the existing M and E systems canstill accommodate additional data collection tasks to monitor and evaluate ICTimpact in schools Additional variables based on ICT indicators can be integratedinto the existing database system
Internet-based surveys
Web-based self-evaluation tool
1
14Section
Various Software orDatabase Systems for
Storing Indicators
13 13Final Report
Below are a few of the software or database systems worth considering in developingthe databases for ICT indicators
Spreadsheet programmes such as IBM Lotus 123 and MS Excel
Statistical programmes such as Statistical Package for the Social Sciences(SPSS)
Customized database programmes using MS Access (for small databases)
SQL Server MAGIC (for big databases)
For data-based driven web applications (Visual Interdev Java Visual Basic) thereis anoother software available in the market which can be used to create the ICTdatabases Technical staff will be able to assist in determining the most feasible anduser-friendly software adequate to answer specific needs
1
1IAttachment
ICT IndicatorsUsed in
Different Countries
15 15Final Report
Government What students should know and be able to do at a certain level
Connectivity Number of teachers with notebook Computer student ratio Bandwidth available in schools Type of internet connection
Changes in studentperformances afterintegrating ICT intoeducation
Increase in student engagement enthusiasm and motivation If student-centred learning took place Improvement in studentsrsquo high-order thinking skills improved Occurrence of changes in teaching practices Improvement in the ability to use emerging technologies
University of Sydney
ICT Indicators in Baltic and CIS Countries
Hardware equipment Computer classroom availability in educational institutions (EI) The average number of students per one computer in EI equipped
with computer classrooms Percentage of IBM- and Apple-compatible computers in total
number of EI computers Percentage of EI equipped with one or more multimedia system in
total EI equipped with computer classroom number Percentage of EI equipped with local network to total EI equipped
with computer classrooms number
Software Percentage of computers with installed OS DOSTM to total numberof computers in computer classes
Percentage of computers with OS WindowsTM of Apple Macintoshto total computer number in computer classes
Per cent of computers with other OS to total computer number incomputer classes
Percentage of EI with any educational software for teaching thecorresponding subjects to total EI number with computer classes1 Elementary School subjects2 Science subjects3 Humanities4 Informatics or information technologies
Percentage of educational software designed by the specialistswithin the country to total number of educational software usedin EI for teaching of the corresponding subject curriculum(elementary school science subjects humanities informationsinformation technologies)
Percentage of educational software designed by foreign specialiststo total number of educational software used in EI for teaching ofthe corresponding curriculum (elementary school science subjectshumanities informaticsinformation technologies
Components of ICT Indicators
UNESCO Institute ofInformationTechnology inEducation
Official documents Official documents in ITICTs in secondary education Official documents in ITICTs in secondary education currently
in force
ICT in curricula Available state curriculum on informatics andor InformationTechnologies
Informatics andor Information Technologies as a separate subject ICT usage to support other subjects implied in curricula on these
subjects
Global communication Percentage of EI without internet access Percentage of EI with limited internet access - only e-mail Percentage of EI with access via dial-up channel Percentage of EI with access via dedicated line Percentage of EI with own web-pages
ICT Indicators in AustraliaAgency responsiblefor data gathering ICT indicators Components of ICT indicators
Agency responsiblefor data gathering ICT indicators Components of ICT indicators
16 Developing and Using Indicators of ICT Use in Education
Personnel development Percentage of elementary school teachers subject teachers(except teachers of Informatics andor Information Technologies)teachers of informatics and EI administration who haveundertaken the computer literacy course from 1 September 1999until present time1 Less than 50 hours (Index 1)2 50-100 hours (Index 2)3 Over 100 hours (Index 3)
Computer skills of elementary school teachers subject teachersand teachers of Informatics and administration1 Elementary computer literacy2 Proficiency in ICT field
ICT Indicators in Baltic and CIS Countries (contrsquod)Agency responsiblefor data gathering ICT indicators Components of ICT indicators
ICT Indicators in Canada
Pan-CanadianEducation IndicatorsProgramme (PCEIP)
The pupil-computer ratio is a proxy measure of the access of availabilityof computer to students in schools Only computers used for educationalpurposes are included in the ratio
Internet connectivity This is a measure of the percentage of students attending schools thatwere connected to the internet for educational purposes at the time ofthe survey Schools that were connected for administrative purposesonly were excluded
Internet activities ofstudents
School ICT co-ordinators were questioned about instructional activitiesinvolving the use of the internet They were asked to identify typicalactivities that students at certain grade levels would have engaged in bythe end of the school year
Obstacles to fulleruse of informationand communicationstechnologies
Principals were asked to identify the major barriers hindering theachievement of their schoolrsquos computer-related goals for students Inthis section items are presented that are identified as major obstaclesby principals of schools representing at least 50 per cent of enrolmentsat each of the three levels of schools The obstacles noted have beengrouped into three categories those relating to hardware and softwarethose relating to instruction and those relating to the training of teachers
Agency responsiblefor data gathering
ICT indicators Components of ICT indicators
ICT Indicators Used in Europe (Denmark Sweden Finland Norway and UK)
Information SocietyTechnologyProgramme fundedby the EuropeanCommunity
Policy and strategy Countries with an official policy on the use of ICT
Schedule for implementing national ICT education projects
Responsibility for the purchase and maintenance of hardware
Objectives in national ICT projects
Inclusion of ICT in the national curriculum
Schools with ICT implementation plan (simple)
Schools with ICT implementation plan (detailed)
Approaches of ICT defined in the curriculum
Objectives defined in the curriculum for the teaching or use of ICT
Schools with autonomous decision power
Agency responsiblefor data gathering ICT indicators Components of ICT indicators
Pupil-computerratio
17 17Final Report
Use and access Pupils and teachers with a personal e-mail address
Use of ICT in areas of the curriculum
Use of external electronic communication services
Teachers use the internet for non-computing teaching
Internet use in teaching
Teachers opinion about the internet as a tool
Pupils access to the internet
Teachers access to computer and internet at home
Who pays teachers home access
Teachers who connect with other schools via the internet
Competencies New ICT and media students in percentages of all students
New ICT and media students by level of education
Qualifications and degrees in information technology and mediastudies
Population with a degree of qualification in ICT and media studies byfield of study and level of education
Hoursyears spent to pedagogical IT guidance
Hoursyears spent to technical IT guidance
Teachers confidence in the use of ICT
Students and teachers knowledge regarding ICT
Specialist ICT teachers
ICT courses during initial training of general class teachers
ICT trained teachers
Change in teaching methods
Average expenditure on ICT in schools
Sources of funding for ICT in schools
Total expenditures on ICT in schools
Distribution of the specific budget between the purchase ofequipment and expenditure on human resources
Number of computers per 100 pupils
Number and quality of computers available for administration pupilsand teachers
Expected increase in the number of computers
Computers with access to school net andor internet
Quality of internet access in schools
Placement of the computers
Schools with own website
Schools with on-line services
Schools with intranet website e-mail
Economy andinfrastructure
ICT Indicators Used in Europe (Denmark Sweden Finland Norway and UK) (contrsquod)Agency responsiblefor data gathering ICT indicators Components of ICT indicators
18 Developing and Using Indicators of ICT Use in Education
Inclusion of ICT in the curriculum
Percentage of teachers who use computers andor internet in theclassroom
Approaches to ICT defined in the curriculum
Objectives defined in the curriculum for the teachingor the use of ICT
Inclusion of ICT in the initial training of all teachers (except specialistICT teachers)
Inclusion of ICT in the curriculum
Percentage of teachers who use computers andor internet in theclassroom
Reasons given for not using internet with pupils
Approaches to ICT defined in the curriculum
Annual number of hours recommended for teaching ICT as a subjectin its own right
Objectives defined in the curriculum for the teaching or the use ofICT
Inclusion of ICT in the initial training of all teachers (except specialistICT teachers)
Percentage share of compulsory teaching related to ICT and thenumber of hours devoted to such teaching in the initial training of allteachers (except specialist ICT teachers)
Desirable ICT skills according to official recommendations for theinitial training of all teachers (except specialist ICT teachers)
Secondary (lowerand uppersecondaryeducation)
Both Number of pupils per computer and number of pupils per computerwith an internet connection (primary and secondary education)
Responsibility for the purchase and maintenance of hardware(primary and secondary education)
Distribution of the special budget between the purchase ofequipment and expenditure on human resources (primary educationgeneral lower secondary education general upper secondaryeducation)
Average periods during which primary school teachers usecomputers (with or without internet connection) in the classroomhours per week
Specialist ICT teachers
Percentages of primary and secondary school teachers in Europewho have received official training in the use of computers andorinternet in their teaching
ICT Indicators Used in IndiaAgency responsiblefor data gathering
ICT indicators Components of ICT indicators
Ministry of HumanResourceDevelopment
Presence of MIS
Presence of software
ICT in textbooks
ICT in computer subjects
In-serv ice and pre-service training of teachers
Primary
ICT Indicators Used in EuropeAgency responsiblefor data gathering ICT indicators Components of ICT indicators
19 19Final Report
Student understanding of ICTrsquos benefits disadvantages as well aschallenges in information technology
Studentrsquos use of ICT knowledge in getting processing arrangingdistributing and keeping information
Governmentrsquos goalsand objectives
ICT Indicators Used in IndonesiaAgency responsiblefor data gathering ICT indicators Components of ICT indicators
Student application of knowledge skills and attitudes in designinginformation technology systems solving problems relating to ICT
Includes public halls libraries
Training hours of the principal Training hours of teachers implemented by the school itself Training hours on ICT use in education per teacher Percentage of operating budget vis-a-vis the total budget Percentage of teachers in the department of ICT Whether an ICT yearly plan exists or not Whether an incentive system for ICT personnel exists or not
ICT Indicators Used in Republic of Korea
Support
Agency responsiblefor data gathering ICT indicators Components of ICT indicators
bull Ministry ofEducation
bull KoreanEducationalResearch andInformationService (KERIS)
Inputs (infrastructurehardware software)
Number of students per computer Number of computers per teacher Percentage of computers less than 3 years old Percentage of computers connected to internet Speed of internet connection Number of educational software (CD-titles) Percentage of computers equipped with 5 basic applications
Number of students per PC
Internet access of students
Number of teachers inpublic schools who canoperate PCs
Number of teachers at elementary lower and uppersecondary schools and special education schools
Number of humanresources with IT-relatedmasterrsquos and doctoraldegrees
Number who graduated from masterrsquos course
Number who graduated from doctoral course
Number of foreign nationalswith the status of residenceldquoEngineerrdquo and number ofnationals entering Japanwith the status of residenceldquoEngineerrdquo
Number of registered foreign nationals
Number of foreign nationals entering Japan
Ensuring security andreliability
IT security measures (information security policies presenceof firewalls and back-up systems)
Number of public schoolswith internet access andcomputers
In households
In SMEs (companies with five employees or more)
In corporate (companies with 300 employees or more)
Number of internet users
ICT Indicators Used in JapanAgency responsiblefor data gathering ICT indicators Components of ICT indicators
e-Japan PriorityPolicy Programme
Public facilities withinternet access
20 Developing and Using Indicators of ICT Use in Education
Teachers
Percentage of subjects utilising multimedia materials for teachingand learning through WWW
Percentage of classes using web-board
Percentage of subjects using web-board
Percentage of teachers participating in an association regardingICT use
Percentage of subjects using computer lab
Percentage of functions of the Information System being used
Whether to use electronic decision system
Number of posting written for and by parents
Students
Hours of use of computer per student
Percentage of students participating in ICT special programmesafter school (Elementary)
Whether to teach on computer (Secondary)
Percentage of subjects collecting assignments through web board
Number of search library DB per students
Percentage of student-governing community utilising webenvironment
Whether a programme regarding internet ethics exists
Number of web communities per class
Internet
Usage of internet
Number of access to school website per week
How often school websites are revised
Output Teachers
Percentage of teachers having e-mail address
Percentage of teachers having homepage
Percentage of teachers having ICT certificates
Percentage of teachers participating in educational SW contests
Students
Percentage of students having e-mail address
Percentage of students having homepage
Percentage of students having ICT certificates
Percentage of students participating in educational SW contests
Percentage of students completing the ICT course (32 hours)
Utilization
Agency responsiblefor data gathering ICT indicators Components of ICT indicators
ICT Indicators Used in Republic of Korea (contrsquod)
21 21Final Report
Malaysian smart schoolsuse of technology forinformation processing andas a productivity tool toenhance professionaldevelopment and toautomate instruction
Malaysian government(Ministry of Education)
ICT in curriculum
ICT in pedagogy
ICT in assessment
ICT in materials
ICT Indicators Used in MalaysiaAgency responsiblefor data gathering ICT indicators Components of ICT indicators
How schools teachersand students usetelecommunicationstechnologies
Number of teachers taking in-service training using a tele-learningapproach
Obstacles faced by teachers in using telecommunicationstechnologies
Factors that encouraged telecommunications technology use
Percentage of teachers agreeing that telecommunicationstechnology can enhance learning and teaching
Percentage of students who had positive views about technologyactivities in school
Telecommunicationsequipment
Paper by David HarrisNZCER
Percentage of schools with telephone lines
Percentage of schools with classrooms that has telephone lines
Percentage of schools with fax machines
Percentage of schools with computers that has access to amodem
ICT Indicators Used in New ZealandAgency responsiblefor data gathering ICT indicators Components of ICT indicators
Availability of publiccommercial utilities andservices
Project TAO Cares(computer-assistedreforms for schools)senate committee oneducation arts andculture
Government throughthe Department ofEducation
Percentage of schools with electricity
Percentage of schools whose electricity is available for 24 hoursper day
Percentage of schools whose electricity is available year-round
Percentage of schools with ICT equipment
Percentage of schools where publiccommercial utilities andservices are available
Percentage of schools located in communities where publiccommercial utilities and services are available
ICT Indicators Used in The PhilippinesAgency responsiblefor data gathering ICT indicators Components of ICT indicators
Computer skills ofschool personnel
Percentage of schools staff who has computer skills
How school staff acquired computers skills
Percentage of school staff with expertise in using differentcomputer software
22 Developing and Using Indicators of ICT Use in Education
How were computers in the schools acquired
Location of computers in the school
Modes of set-up of the schools computers
Purposes for which computers are used
Operating system used
Software used for teaching and learning
How school acquired software programmes
Percentage of schools with internet access
Source of funds to pay for internet access
Internet connection arrangement (eg dial-up dedicated dial-upor leased line connection)
Who are given access to the internet (eg students principaladministrative staff etc)
Financial capacity to have internet access
How often computers are upgraded
Availability of funds for computer maintenance
Instructionalacademicuse of computers
Percentage of schools offering computer literacy subjects
How computer literacy subjects are offered (eg as part of regularcurriculum integrated with other subjects etc)
School personnel handling computer courses in the school
Purposes for which computers are used as part of instruction
Fees collected for computer use internet access
Computer use by non-formal education learners
Presence of computersin schools
ICT Indicators Used in The Philippines (contrsquod)Agency responsiblefor data gathering ICT indicators Components of ICT indicators
ICT Indicators Used in Slovenia
Information-telecommunicationsinfrastructure
Research on internetin Slovenia
Agency responsiblefor data gathering ICT indicators Components of ICT indicators
Telecommunication No of telephone connections No of telephone connections per 100 residents No of cellular phone connections NMT GSM No of cellular phone connections per 100 residents No of ISDN connections
Internet
No of internet providers No of backbone providers No of computers connected to the internet per 100000
residents No of wwwdomainsi web sites
Schools and relatedinstitutions
Internet
Schools with internet access (secondary schools primaryschools youth hostels kindergartens)
Pupils with internet access Schools with homepage
Computers networks and ISDN
Average number of computers per 100 employees Average number of computers per 100 pupils Share of schools with computers connected to network and
ISDN
23 23Final Report
ICT Indicators Used in Africa
Impact of ICT on qualityteaching and learning
School net educatordevelopmentprogramme
Agency responsiblefor data gathering ICT indicators Components of ICT indicators
1 ICT Skills Level of educator - includes assessment on skills suchas basic word processing e-mail and electronic informationaccessing skills
2 Integration Level - to be measured using the following guidelines
Educatorsrsquo Competence with ICT
Educators should be able to draw on generic ICT applications inorder to prepare for teaching
Educators should be generally competent in those ICTresources that could most benefit their teaching and the learnersrsquolearning
Educators should understand how to access and use electronicinformation and communications resources such as the internetfor the benefit of both the educator and the learner
Educators should know how to use ICT to improve theirprofessional and administrative efficiency
Educators should know how to encourage the development oflearnersrsquo ICT skills within the context of the lessons being taught
Integration of ICT with the curriculum
Educators should understand the key learning strategies thatinfluence the use of ICT to support teaching and learning
Educators should know how to organise their class andclassroom when making use of ICT to achieve lesson outcomes
Educators should understand the role of computer literacy withparticular reference to the educational use of computers as atool in a diverse and developing country like South Africa
Educators should know and understand the characteristics ofinformation particularly its role in learning and its ethical use andits credibility
Educators should be aware of current health legal and ethicalissues regarding the use of ICT in the classroom
Educators should understand how to assess the contributionof ICT to the process of learning
An evaluation instrument is created for assessments in this category
3 The Professional Growth of the educator - This is measuredinitially by conducting pre-course baseline studies in which theeducator reflects on existing practice and perceivedshortcomings This process begins with a workshop and isfurther pursued by the mentor in the follow-up period Progressevaluation of the impact of ICT and the development programmeon the educator as a professional is monitored by promptingfrom the mentor and the educator recording entries in anelectronic journal
4 Whole school levels - Whole school ICT use is measured in anumber of ways Staff ICT and integration-related proficienciesare measured individually or on a departmental or whole-staffbasis This is the choice of the school An instrument is used tomeasure the instructional use of technology in a school Thisinstrument categorises 6 levels of computer efficiency rangingfrom non-use to refinement The emphasis in this framework isgiven to the degree to which technology is used to support aconstructivist orientation to classroom pedagogy
24 Developing and Using Indicators of ICT Use in Education
Quantum jumpstrategy
All teachers and students to be IT and internet-literate by theyear 2002
Production of 250 titles of academic software and contentsannually and provision of funding worth 500 million Baht perannum to various communities for content development as wellas provide budget for localizing 2000 titles of useful foreigncontent
PC density target by the year 2006 as follows
1 20 for secondary school level
1 40 for primary school level
Investment in the production of IT and network equipment foruse in the education sector including software and multimedia
Provision of IT for education and professional development tothe under-privileged the disabled and common people seekinglifelong education
Provision of adequate radio frequencies for the education sector
Investment in research and development in IT for education atleast 400 million Baht per year
Establishment of monitoring and evaluating procedures andprotocols
Establishment of a National Institute of Technology for Education
ICT Indicators Used in Thailand
Value-added strategyGovernment ofThailand
Agency responsiblefor data gathering
ICT indicators Components of ICT indicators
Provision of software content and necessary supporting ITcurriculum via searching localizing producing to make betteruse of existing hardware in schools
Training of teachers to gain literacy in computer and internetuses
Establishment of maintenance programme for the existinghardware
Enhancement of the capabilities of organizations that can providesupport and services to schools by forming network of agenciesand individuals
Monitoring and evaluation of the use of technology for educationand collect data for planning purpose
Equity strategy Provision of a set of minimum requirement equipment andfacilities to needy schools including electricity 3 telephone lines5 computer sets 1 printer 3 sets of television 5 sets of radio 3internet accounts 100 hours per month via SchoolNetprogramme
Provision of a ldquoDigital Learning Centrerdquo (DLC) to the community
Training of teachers and trainers in IT and internet literacy
25 25Final Report
ICT Indicators Used in UK
Computers in schoolsNational Grid forLearning (NGFL)
Agency responsiblefor data gathering ICT indicators Components of ICT indicators
Computerpupil ratio
Average number of computers per school
Type age and multimedia capability of computers
Average number of computers used for management andadministrative purposes
Average number of computers linked to an international schoolnetwork
Different types of computer peripherals available
Internet and electronic Connectivity to the net
Number of schools connected to the internet at broadband level
Percentage and number of schools who have their own website
At least one networked computer with internet access in eachschooll for management and administration
E-mail access
Teacher confidence anduse of ICT in teaching
Teacher confidence
Use of ICT in subjects
Benefit of ICT in subject
Expenditure on ICT Estimated total
Average per school
Average per pupil
ICT Indicators Used in the United States of America
Internet use by teachers
Agency responsiblefor data gathering ICT indicators Components of ICT indicators
Teaching learning andcomputing A nationalsurvey of schools andteachers Centre forResearch onInformationTechnology andOrganizations
Public schools with internet access
Internet connections in classrooms of teachers
Teacherrsquos internet access at home and in their classroom
How often teachers use information from internet in lessons
Teacherrsquos use of electronic mail to communicate with teachers inother schools
Per cent of teachers having their students use different types ofsoftware
Student use of web browser software in lessons
Internet use for beyond classroom student projects andpublishing
Teacherrsquos perceived value of having a computer with electronicmail on their own desk
Teacherrsquos perceived value of classroom world wide web access
Internet use from various locations (home school etc)
Internet use by subject matter taught
Internet use by school level taught
Ability to use web search engine
26 Developing and Using Indicators of ICT Use in Education
Teacher and teacherdirected student useof computers andsoftware
Teacher directed student use of computers
1 Access to classroom computers
Computer-student ratios on classrooms
Number of classroom computers
Computer access in lab and media centres versus classrooms
2 Computer platforms used by student
Extent and variety of software used and teachers objectives for use
1 Type of software used
2 Software that teachers judge as most valuable for students
3 Objectives for computer use
4 Student computer use for school work on their own time
Teacher computer extertise and professional use
1 Use of software in profession
2 Expertise with computers
Technology support Average weekly hours spent by technology co-ordinator ondesignated job tasks
Average minutes spent per week by technology co-ordinatoron job tasks per teacher
Percentage of technology co-ordinators reporting additionalsupport from others (eg teachers district officers aidesadministrators etc)
Teacher rating of availability of technology support (per schoollevel and per type of school)
Total support hours per teacher (per school level and per typeof school)
Number of development occasions for teachers (per schoollevel and per type of school)
Technology support content used to deliver technologyservices to teachers [eg (1) facilities network and internetaccess hardware software (2) staff assistance and necessaryservices technical support help desk network services (3)one-on-one personal guidance computer experts for troubleshooting]
Percentage of teachers who have resource (ICT) available foruse
ICT Indicators Used in the United States of America (contrsquod)Agency responsiblefor data gathering ICT indicators Components of ICT indicators
Presence of computersin American schools
Total instructional computers
Students per computer
Type of computer in each school level
Per cent of computers with selected attached peripherals
Locations of instructional computers
Per cent technology-intensive by school level
Software saturation
Software diversity
Type of internet access
Public schools with internet access
27 27Final Report
Per student expenditure on hardware software and supportper school level
Instructional technology expenditure by US schools (hardwaresoftware and support
Per student expenditure on hardware software and supportfor one year vs five-year estimates
Five-year technology expenditures per student for schools withand without their own technology budgets
Five-year technology expenditures (per student) for public andnon-public schools
School technology expenditures (per student) by communityincome level
Five year school technology expenditures (per student) by levelof technology penetration
ICT Indicators Used in the United States of America (contrsquod)Agency responsiblefor data gathering ICT indicators Components of ICT indicators
School investments ininstructional technology
ICT Indicators in UzbekistanAgency responsiblefor data gathering ICT indicators Components of ICT indicators
Number of computer classes
ICT integration in subjects like physics chemistry and biology
Teacher training
Establishment of ICT departments in universities to train teachers for school
IT as a subject in general education
Number of trained teachers
Provision of computer labs in schools
Collaboration in international training about IT
Application of IT in school management
Government
ICT Indicators in Viet NamAgency responsiblefor data gathering ICT indicators Components of ICT indicators
Establishment of ICT departments in universities to train teachers for school
IT as a subject in general education
Number of trained teachers
Provision of computer labs in schools
Collaboration in international training about IT
Application of IT in school management
Government
1
1IIAttachment
Comparison ofICT Indicator Themesin Selected Countries
29
29
Final Rep
ort
Basis for ICTindicatorsagency
who formulatedICT indicators
Presence ofstandards for
technology use
Educationallevel covered
Respondents of studies
Technologiescovered
in studiesType of indicators
Presence ofindicators
addressing equityethics and
investment issues
Presence ofindicators on ICT
integration incurriculumimpact etc
Goals and objectivesof the governmentAll students will leaveschool as confidentcreative andproductive users ofnew technologiesparticularlyinformation andcommunicationstechnologies andunderstand theimpact of thosetechnologies insociety
Yes Curriculumand StandardsFramework (CSF)
Primary secondarynon-formal
Teachers students Computers internetuse of satellite TV
Quantitative andqualitative
Not specified Yes specificallythe studyconducted by theUniversity ofSydney Includestudies on studentengagemententhusiasm andmovitationimprovement ofhigher-orderthinking skills etc
Based on a meetingconvened in IITEMoscow in 2000 todevelop a set of ICTindicators
None Primarysecondary andtertiary levels
Heads ofdepartmentssenior specialistsstaff of nationalCentres ofInformationalTechnologies andEducation orCentres of TeacherTraining Retrainingand EducationalSupport
Computers andinternet
Quantitative -policy documentsICTs in curriculumhardware andequipmentsoftware Globalcommunicationmeans andpersonneldevelopment
None Partly
Australia
Baltic andCIScountries
30
Develop
ing and U
sing Indicators of IC
T Use in E
ducation
Basis for ICTindicatorsagency
who formulatedICT indicators
Presence ofstandards for
technology use
Educationallevel covered
Respondents of studies
Technologiescovered
in studiesType of indicators
Presence ofindicators
addressing equityethics and
investment issues
Presence ofindicators on ICT
integration incurriculum impact
etc
Canada Two criteria fordevelopment ofindicator set
Type of educationinformation neededfor policydevelopment
Practical availabilityof dataindicatorsdeveloped by Pan-CanadianEducationIndicatorsProgramme (PCEIP)
None Elementary andsecondary level
Not specified Computers andinternet
Quantitative andqualitative
Pupil-computerratio
Internetconnectivity
Internet activitiesof students
Obstacles to fulleruse of informationandcommunicationstechnologies
None Yes specificallyon whatencouragesteachers andstudents to usecomputers
Europe 1 Indicators based onthe eEurope initiativeof the EuropeanUnion Action lineldquoEuropean youth intothe digital agerdquo Thegoal for the saidobjective is to turndigital literacy to abasic competence forall young EuropeansSIBIS Study
Yes ISTE (NETS)standards
Various researcherscovered differentlevel public primaryand lowersecondary primarysecondary andspecial schoolshead teachers andteachers
School headsteachers
ICT in generalcomputers andinternet access
Quantitative andqualitative
Policy andstrategy
Economy andinfrastructure
Use and access
Competencies
Yes specifically onnational policiesand expenditure
Yes oncompetency ofICT instructors
Europe 2 Eurydice Yes ISTE(NETS)standards
Primary andsecondary level
Not specified Computers andinternet
Mostly quantitativevery little on qualita-tive indicatorsExamples
Number of pupilsper computer
Desirable ICTskills according toofficial recom-mendations forthe initial trainingof all teachers(except specialistICT teachers)
Mainly onexpendituredistribution ofbudget
Yes on integrationof ICT in subjects
31
31
Final Rep
ort
Basis for ICTindicatorsagency
who formulatedICT indicators
Presence ofstandards for
technology use
Educationallevel covered
Respondents of studies
Technologiescovered
in studiesType of indicators
Presence ofindicators
addressing equityethics and
investment issues
Presence ofindicators on ICT
integration incurriculumimpact etc
India Government None Elementary andsecondary schools
Not specified Computersinternet software
Quantitative None None
Indonesia Curriculum Centre
Governmentrsquos goalsand objectives
None Elementary andsecondary schools
Not specified Computers andthe internet
Quantitative Moreof internet andcomputer use andaccess
None None
Japan eJapan priority policyprogrammevarioussurveys conducted bygovernment agencieson ICT in general Likethose conducted bythe Ministry of PostsandTelecommunicationsSurvey on SocialEducation
None Elementary andsecondary in someindicators notspecified in otherindicators
Not specified Computers andinternet
Quantitative Moreof internet andcomputer use andaccess
Yes Governmentgeneral IT policy onelementary andsecondary schoolsthe same forschools for theblind and disabled
None
Republic ofKorea
Cyber Korea 21Vision To preparestudents forknowledge basedsociety by realizinglife-long learning viacyber-educationsystemrdquoKoreaNational StatisticsOffice
Yes - based onthe documententitled Adaptingeducation to theinformation ageA white paper
Elementarysecondary
Teachers andstudents andschoolheadmasters
Computersinternet andmultimedia
Quantitative Moreof internet andcomputer use andaccess throughinput utilizationand outputindicators
None None
Malaysia Government None Elementary andsecondary schools
Not specified Computers andthe internet
Quantitative None None
Quantitative andqualitative
Telecommunica-tions equipment
How schoolsteachers andstudents usetelecommuni-cationstechnologies
New Zealand Research conductedby the TelecomEducation Foundation
None Not specified Teachers andprincipals
Telephone linesfax machinescomputers andinternet
None Yes specificallyon whatencouragesteachers andstudents to usecomputers
32
Develop
ing and U
sing Indicators of IC
T Use in E
ducation
Philippines
Basis for ICTindicatorsagency
who formulatedICT indicators
Presence ofstandards for
technology use
Educationallevel covered
Respondents of studies
Technologiescovered
in studiesType of indicators
Presence ofindicators
addressing equityethics and
investment issues
Presence ofindicators on ICT
integration incurriculumimpact etc
Senate Committee onEducation Arts andCulture with SEAMEO-INNOTECH
Department ofEducation
None Public and privateelementary andsecondary schools
School heads All ICT relatedtechnologies suchas televisionprojectors radiocassette playerscomputersperipherals andinternet access
Quantitative Availability of
publiccommercialutilities andservices
Computer skillsof schoolpersonnel
Presence ofcomputers inschools
Instructionalacademic useof computers
Yes specificallythose pertaining touse of computers bynon-formaleducation students
None
Research on internetin Slovenia
None Primary secondaryyouth hostels andkindergartens
Not specified Computers andinternet access
Quantitative
Internet access
Computersnetworks
None None
School net None Not specified Students andteachers
Computers andinternet access
QualitativeexamplesIntegration of ICTwith curriculuminstructionalpractices barriersto computer use
None Yes oncompetency ofICT instructors
Government NationalEducation Act of1999
None Primary andsecondary schools
Not specified Computersinternettelephonescomputerperipherals ratio
Quantitative None None
Philippines
Slovenia
South Africa
Thailand
33
33
Final Rep
ort
Basis for ICTindicatorsagency
who formulatedICT indicators
Presence ofstandards for
technology use
Educationallevel covered
Respondents of studies
Technologiescovered
in studiesType of indicators
Presence ofindicators
addressing equityethics and
investment issues
Presence ofindicators on ICT
integrationin curriculumimpact etc
UK National grid forlearning
ISTE (NETS)standards
Primary andsecondary schools
Students andteachers
Computers and theinternet
Quantitative andqualitative
Computers inschools
Internet andelectroniccommunication
Teachercondidence anduse of ICT inteaching
Expenditure onICT
Yes mainly onexpenditure andbudget allocation
Yes includesteacherconfidence in theuse of ICT andbenefit of ICT
US Teaching learningand computing - astudy of teacherrsquosuse of computertechnology theirpedagogies andtheir school context
ISTE (NETS)standards
Public and privateschoolselementary middleschool and highschool all subjectsexcept physicaleducation andspecial education
Teachers Computers internetuse (includes use ofvarious softwareCDRom etc
Quantitative andqualitative School
technologyleadership andtechnologyoutcomes
Pedagogicalmotivations forstudent computeruse
Internet use byteachers
Presence ofcomputers inAmerican schools
Teacher andteacher directedstudent use ofcomputers andsoftware
Technologysupport
Schoolinvestments ininstructionaltechnology
Yes includesindicators thatdeterminestechnology intensiveareas softwaresaturation etc
Yes specificallypedagogicalmotivations forstudent computeruse
UK
US
34
Develop
ing and U
sing Indicators of IC
T Use in E
ducation
Basis for ICTindicatorsagency
who formulatedICT indicators
Presence ofstandards for
technology use
Educationallevel covered
Respondents of studies
Technologiescovered
in studiesType of indicators
Presence ofindicators
addressing equityethics and
investment issues
Presence ofindicators on ICT
integration incurriculumimpact etc
NoneUzbekistan Government Lawon Education
None Primary andsecondaryeducation
Not specified Computer andinternet
Quantitative None
Viet Nam Government
Governmentrsquos goalto ldquouniversalizerdquoeducation
None Primary andsecondary
Not specified Computer andinternet
Quantitative None None
1
1IIIAttachment
Studies on the Use andImpact of ICTin Education
35 35Final Report
Several studies have been conducted on ICT and its use and impact on educationsome of which are included below
This survey on the information and communications technology (ICT) provisions inschools in England was carried out in April 2001 the findings of which were comparedto similar surveys conducted in 1998 1999 and 2000 The surveys collectedinformation on the number and type of computers available in schools expenditurein schools the extent and benefit of the use of ICT across curriculum subjects theuse of internet and other electronic network communication links and teacherusage of computers and their confidence in the use of ICT in the curriculum It is asample survey and the sample is chosen to be representative of different types ofschools throughout the country Some of the findings as categorised are thefollowing
a Computers in schools
average number of computers per school increased steadily in all types ofschools between 1998 and 2001 the increase was noted to be greatbetween 2000 and 2001
b Internet usage and other external electronic communication services
between 1998 and 2001 there was a considerable increase in thepercentage of schools connected to the internet
c Use of ICT in teaching and teacher confidence
in each type of school there was an increase in the percentage of teachersreported to feel confident in the use of ICT in 2001
d Expenditure on ICT
the average expenditure on computers per school increased steadily in allschool types between 1998 and 2001
Source Statistics of EducationSurvey of Information and Communications Technology in Schools 2001National Statistics BulletinDepartment for Education and SkillsIssue No 0901October 2001
The Center for International Development (CID) at Harvard University conducted aresearch which came up with the Network Readiness Index (NRI) a majorinternational assessment of countriesrsquo capacity to exploit the opportunities offeredby ICTs In the development of the NRI data sources fall under two generalcategories First a variety of measures mainly ldquohardrdquo variables and also ldquosoftrdquoones from sources such as the World Bank the International TelecommunicationsUnion Freedom House and the Business Software Alliance were used Seconddata collected from the questionnaire responses of more than 4500 business andgovernment leaders surveyed in 75 countries by the Global Competitiveness Reportrsquos2001 Global Executive Opinion Survey conducted by Harvard University and theWorld Economic Forum were heavily relied upon
The Network Readiness Index is an assessment of a countryrsquos capacity to makeuse of ICT resources It shows how nations are performing with regards to theirparticipation in the Networked World Seventy-five countries were computed NRIs
B The Network Readiness Index Measuring thepreparedness of nations for the networked world
A Survey of information and communicationstechnology in schools 2001 in England
36 Developing and Using Indicators of ICT Use in Education
and the United States of America tops the NRI ranking making it the most highlydeveloped ICT network and it has the greatest potential to exploit networkrsquos capacityIceland Finland Sweden Norway and Netherlands follow USA Another NorthernEuropean country Denmark ranks 7th followed by Singapore in 8th Austria in 9th
and the United Kingdom in the 10th place Among the countries in the region whichwere included are Korea rank number 20 followed by Japan in the 21st placeMalaysia in number 26 Thailand number 43 India number 54 Philippines number58 followed by Indonesia in number 59 Sri Lanka in number 62 China in 64Bangladesh in 73 and Viet Nam in 74
Two components were taken into consideration in the computation of the NRIThese are network use and enabling factors Network use is defined as the measureof the extent of increase in the use of ICT in a specific country This is still narroweddown to five more catagories Internet users per hundred inhabitants cellularsubscribers per hundred inhabitants internet users per host percentage ofcomputers connected to the internet and availability of public access to the internet
Enabling factors is made up of four sub-indices network access network policynetworked society and networked economy Network access includes variablesrelated to the information infrastructure hardware software and support Itmeasures the extent and quality of the network infrastructure and the existence ofequipment programmes and support services that enable ICT use Network policyrefers to the information and communications policy environment and the businessand economic climate It also deals with the levels of competition in thetelecommnications and ICT sectors Networked society measures the quality andextent of use of ICT facilities in the learning process and networked economyassesses the extent of public and private sectors participation and e-governmentare considered in this sub-index
Source httpwwwcidharvardeducrpdfgitrr2002-cho02pdf
This is a national population survey of public and private elementary and secondaryschools conducted by SEAMEO INNOTECH in the Philippines under Project TAOCARES last March 2001 Its main objective was to determine the ICT capabilitiesof schools A total of 45811 schools were given questionnaires with the schoolheads as respondent of which 7937 per cent responded The survey questionnaireconsisted of 42 items mostly focused on the readiness of schools in terms ofinfrastructure hardware software and manpower capabilities on ICT Outputs ofthe survey were sixteen regional profiles on the ICT-preparedness of schools whichincluded data on the availability of electricity access of schools to communicationfacilities presence of computers computer peripherals and other multi-mediaequipment in schools sources of funds to maintain ICT-related operations proficiencyof school staff in the use of computers training received on ICT computer coursesbeing offered in schools and other ICT-related information
Some of the major findings of the survey at the national level are the following
Only 6607 per cent of schools have electrical connections
Only 1330 per cent have landline telephones 290 per cent have fax machinesand 200 per cent have internet connections
5217 schools only or 1428 per cent have computers with the National CapitalRegion having the highest percentage at 8730 per cent
Only 1824 per cent of schools have staff proficient in the use of computers
C Profile on the capabilities of elementary and secondary schools in the Philippines 2000-2001
37 37Final Report
7862 per cent of schools get funding to maintain ICT related operations fromthe PTCA
Only very few schools (1313 per cent) have school heads who have receivedICT training in the past five years
6436 per cent of school heads need training on basic computer literacy
This study was conducted by the New Educational Technologies Foundation Inc anon-profit organisation composed of schools that believe in the capacity of IT toimprove the quality of student learning and efficiency of teaching A total of 794schools participated in the survey with school heads in the public and private schoolsas respondents The questionnaire was divided into two parts the first part askedabout perceptions level of awareness and attitudes regarding the value of computereducation and was answered by users and non-users of computers The secondpart which dealt with the actual use of computers was answered by users onlyAmong the findings are the following
The number of computers owned by a private schools is twice as much aswhat a public school can afford
Computers available in schools are mostly the models AT486
Most computer units in the public elementary schools were acquired throughdonations in the secondary and tertiary schools most computers were acquiredthrough purchase
Computers are mostly used to teach different application programmes
Source The 1996 National Survey on Computer Education New Educational TechnologiesFoundation Inc
D The 1996 national survey on computereducation in the Philippines
In a primary school in Sunnyside Elementary School Pullman Washington studentsare using e-mails web sites videos and video conferencing technology tools todevelop their learning skills Through these mediums the students alongside theirglobal peers identify and share their cultures with one another in new waysTraditionally students learn about the world through books but new technologyallows the students to get in depth information about different cultures throughwriting reading and communicating with their global peers The following are theassessment tools used Assessment rublics designed for specific projects lessonandor classroom experiences standard assessment tools (ie DRA and WrightGroup Reading Assessments) teacher anecdotal notes childrenrsquos ownmetacognitive voices in the process of learning in conference with the teacherand in self-reflection of work and presentations parentsrsquo reports of student learningprogress
Teaching in non-traditional ways can sometimes be a risky business - with all eyesupon the class to see if learning is taking place It has been shown that studentsform teams to read write and communicate using technology at rates that meetand exceed standards for primary classes But along the way the added value oftechnology contributes in areas such as thinking skills social skills engagement inlearning motivation teaching and collaborating as the class sees what is essentialto learn in the context of the real world
Source httpwwwncrelorgengaugeframeworkefpalignefpalisuhtm
E Use of multiple assessment tools
38 Developing and Using Indicators of ICT Use in Education
F Technology A major catalyst for increasing learning by Jody C Isernhagen University of Nebraska-Lincoinby Jody C Isernhagen University of Nebraska-Lincoinby Jody C Isernhagen University of Nebraska-Lincoinby Jody C Isernhagen University of Nebraska-Lincoinby Jody C Isernhagen University of Nebraska-Lincoin TTTTTechnologechnologechnologechnologechnology Horizons in Educay Horizons in Educay Horizons in Educay Horizons in Educay Horizons in Educationtiontiontiontion Journal Online Journal Online Journal Online Journal Online Journal Online August 1999 - FeaAugust 1999 - FeaAugust 1999 - FeaAugust 1999 - FeaAugust 1999 - Featuretureturetureture
A rural public school in Nebraska composed of 1400 students applied for a three-year competitive Excellence in Education Grant in late 1995 Six schooladministrators and 18 staff members designed a plan to restructure their schooland classrooms The staff members defined that the major skills needed by studentsare comprehension reasoning composition and experimentation A computerwas placed in each classroom (80 classrooms) and 27 computers were located inthe elementary Integrated Learning Lab with Computer Curriculum CorporationSuccess Maker Software This software automatically diagnoses and placesstudents on the appropriate skill level while using the computer The computer labwas used by 314 students and 13 teachers in grades 1-3 from January 1996through May 1998 Teachers were trained on the use of ClarisWorks MicrosoftWord E-mail Internet Presentation Stations and the integration technology as atook in teaching and learning Activities of the students involved computer buildingdesigning of web pages to help maintain the schoolrsquos web pages digitizing video topresent to the community creating panoramic views and interactive virtual realityscenes preparing letters of application resumes and cover letters and to searchthe web for jobs With all the activities the teacher served as guides figuring outwith the students how to arrive at a productive presentation
The CAT scores in reading and math for students using an Integrated Learning Labfor 25 years showed a significant difference between the means The scores ofstudents testing below the 50th percentile at grades 1-3 in reading and math increasedsignificantly over time These findings suggest that using an Integrated LearningLab with rural primary age children daily over an extended period of time maypositively impact achievement for students particularly those students functioningbelow the 50th percentile
Source httpwwwthejournalcommagazinevaultarticleprintversioncfmaid=2126
G The impact of ICT on literacy learning in English
This report is the result of a literature review conducted first to identify a number ofstudies that might shed light on the major impact of ICT on literacy learning inEnglish for 5 to 16 year olds and the second to undertake an in-depth review ofthe papers that were identified as being on the impact of networked ICT on literacylearning in English for ages 5 to 16 There were 1871 studies screened following acriteria to identify relevant reports 188 studies were found that met the criteria inthe protocol These studies were then keyworded or indexed and the results filedon an electronic database
Of the 188 studies relevant to the mapping study 16 pertained to the topic of theimpact of networked ICT on literacy learning Data were extracted from these 16studies and were used as basis for an in-depth review Of these half were outcomeevaluations (evaluations of the results of an experiment or innovation) seven wereprocess evaluations (evaluations on how an intervention was delivered rather thanwhether it worked or not) and one was a needs assessment
Results show that as far as the in-depth study on networked ICT goes results areinconclusive Concerning policy and practice the recommendations of this revieware highly tentative and take the form of implications or pointers With regard topolicy they are to focus research funding for large-scale studies to give considerationto the balance of study type expertise in research teams and to give consideration
39 39Final Report
to the fact that the provision of computer hardware and software to schools andthe application of ICT in teaching and learning need to be informed by researchand evaluation
Source httpeppiioeacukEPPEWebhomeaspxpage=reelreview_groupreview_ one_abstractht
H Education Research Fund Effective Integrationof IT in Singapore Schools Pedagogical
and Policy ImplicationsThis is a report on the key findings of a questionnaire survey aimed at identifying thedegree of information technology (IT) integration among Singapore schools Thesurvey is the first part (Phase One) of a larger study funded by the Ministry ofEducation of Singapore aimed to examine and analyze where and how IT is integratedin Singapore schools to develop pupilsrsquo higher order thinking skills A total of 328schools responded to the survey of which 168 are primary schools 144 secondaryschools and 16 junior collegescentralized institutes (JCCs)
Major findings of the questionnaire survey include
Phase I schools in the IT Masterplan have significantly higher pupil and teacheruse of IT greater opportunities for staff development of teachers and moreconducive IT culture than Phase III schools
Independent-autonomous schools have significantly better management of ITresources higher teacher and pupils use of IT greater opportunities for staffdevelopment for teachers and more conducive IT culture than governmentschools
There are no significant differences among the primary schools secondaryschools and JCCs in terms of the management of IT resources pupil andteacher use of IT staff development and school IT culture
The correlations among management of IT resources pupil use of IT teacheruse of IT staff development and IT culture are significant and highly positive
- Contents
-

Section One
Step Action
Developing and Using Indicators of ICT Use in Educationcompiled byUNESCO Asia and Pacific Regional Bureau for Education Bangkokand Southeast Asian Ministers of Education Organization Regional Centrefor Educational Innovation and Technology Metro Manila PhilippinesBangkok UNESCO Bangkok 2003
39 p
1 EDUCATIONAL TECHNOLOGY 2 INFORMATION TECHNOLOGY3 COMMUNICATION TECHNOLOGY 4 ICT 5 COMPUTER USES INEDUCATION 6 EDUCATIONAL INFORMATION SYSTEMS 7 EDUCATIONALINDICATORS I UNESCO Asia and Pacific Regional Bureau for EducationII SEAMEO Regional Centre for Educational Innovation and Technology
371334
copy UNESCO 2003
Published by theUNESCO Asia and Pacific Regional Bureau for EducationPO Box 967 Prakanong Post OfficeBangkok 10110 Thailand
Printed in Thailand
The designations employed and the presentation of material throughout the publicationdo not imply the expression of any opinion whatsoever on the part of UNESCOconcerning the legal status of any country territory city or area or of its authorities orconcerning its frontiers or boundaries
IPS03OS152-1500IPS03OS152-1500IPS03OS152-1500IPS03OS152-1500IPS03OS152-1500
Section 1 Introduction Indicators and Rationale of Use
C o n t e n t s
Basic approach to formulating indicators 1
Section 2 Using Indicators to Assess Impact of ICT inEducation
Synthesis of country experiences on ICT indicators and related issues 3
Kinds of indicators developed based on visions or goals and surveys 3
Standards for technology use 6
Levels of integration 6
ICT infrastructure hardware and connectivity 7
Teacherrsquos use of ICT 7
Targets of indicators surveys 7
Types of indicators 7
Assessment and evaluation methods 10
Section 3 Methods of Collecting Indicators
Survey questionnaire 11
Telephone interview 11
3-yearly sample assessment 11
Internet-based surveys 12
Web-based self-evaluation tool 12
Section 4 Various Software or Database Systems for 13Storing Indicators
C o n t e n t s (contrsquod)
Attachment I ICT Indicators Used in DifferentCountries 15
Attachment II Comparison of ICT Indicator Themesin Selected Countries 29
Attachment III Studies on the Use and Impact of ICT in Education 35
1
11Section
IntroductionIndicators and Rationale
of Use
In evaluation studies indicators are used as evidence or signs by which we canassess or evaluate materials methods an intervention a programme or a projectIndicators are measuring devices They define concepts in terms of themeasurements and data it is possible to collect and analyse They define whatdata to collect and at what time intervals
To develop good indicators we need first to have a clear view of what we are tryingto achieve and to measure The first requirement for a systematic development ofindicators for Information and Communication Technology (ICT) is to identify theresults objectives outputs and key concepts of the ICT project as part of theevaluation system plan
The basic approach involves four steps
Identify what is to be measured
Develop trial measures
Assess each trial indicator using agreed-on criteria
Select the best indicators for a specific project
Section One
Step Action
Step 1Step 1Step 1Step 1Step 1Identify allconcepts to bemeasuredespecially projectobjectives andoutputs
Review all concepts objectives results and output state-ments to clarify them and reach agreement
Be clear about what type of change is implied (a situationstate condition attitude behaviour)
Clarify whether the outcome sought is an absolute change arelative change or no change
Specify where and when the change is expected (what targetgroup what location and in what time frame) (this identifiesthe appropriate unit of analysis)
Determine the relationship between project activities and theiroutputs or objectives (are these outputs or objectives director indirect)
Step 2Step 2Step 2Step 2Step 2Develop a list ofpossible (trial)indicators
Think of possible alternative indicators for each conceptobjective and output without being too restrictive
Conduct internal brainstorming sessions
Consult stakeholders and other experts
Try to borrow from other projects and studies
Step 3Step 3Step 3Step 3Step 3Assess each trialindicator againstcriteria
Establish an agreed set of criteria for indicators (see Table 2)
Use a scoring scale (1-5) to determine the usefulness of eachtrial indicator (but be flexible and use your own judgment)
Table 1Describes the actionsrequired in each step
Step 4Step 4Step 4Step 4Step 4Select the bestindicators for thisproject
Consider each indicator on its merits against the criteria
Consider the mix of indicators to construct a robust set thatis consistent and complementary in terms of data-collectionmethods and time frames
Avoid having too many indicators (it may indicate that theobjectives and outputs are not clearly defined)
Be prepared to update your indicators - the best indicatorsmay change as projects develop (one common change occursafter using input indicators at first and then realizing that outputindicators were what was needed)
Basic approach to formulating indicators
2 Developing and Using Indicators of ICT Use in Education
Table 2 below summarises the criteria that can be applied in assessing potentialindicators based on the recommendations of the Centre for DevelopmentInformation Evaluation an institute of USAID These criteria are to be used flexiblyFor instance according to the Centre direct measures are not always better thanindirect measures while quantitative measures are not always better than qualitativemeasures
The process of developing indicators involves a combination of activities such asbrainstorming multi-stakeholder discussions and being clear about definitions criteriagoals and priorities More focused and cost-effective monitoring and evaluation ofICT use in education is expected Indicators are based on assumptions aboutwhat is relevant mdash they are expressions of value or of what is desirable Thus it isimportant that researchers and evaluators involve stakeholders in developing theindicators to ensure that the data collected will respond to their information needs
Criterion Description
Direct measure Indicator is intuitively understood (high face validity)
Indicator is a direct measurement rather than a proxy thatdepends on assumptions for its validity
Indicator is supported by a body of research
Objective Indicator is unambiguous about what is being measured
Different people will collect comparable data based on theindicator
Definition remains stable over time so change can be measured
Indicator is unidimensional (measures only one thing at a time)
Indicator can be quantitative or qualitative as long as it is clearlyand consistently defined and interpreted
Adequate Either by itself or with a minimal companion set of indicators theindicator provides reasonable confidence that it accuratelymeasures the attribute
Object is to have as few indicators as possible per attribute (shouldbe three or fewer) - more is not necessarily better
Number of indicators will depend on the complexity of the objector what is being measured
Quantitative Quantitative indicators are more objective than qualitative ones
Qualitative indicators should be adequately specified to be objectiveand consistent
Disaggregated The more disaggregated the indicator the more easily data can bemanipulated to answer questions not anticipated at the outset
Practical Data can be collected at reasonable cost given their utility
Data are available and can be collected at suitable time intervals
Data can be readily collected in various projects for comparison
Reliable Indicator is reliable within the context of the evaluation purposeand resources
Data-collection process is consistent across different time andspace scales using comparable methods and samplingprocedures Indicator is based on representative data
Table 2Criteria for
assessing indicators
1
12Section
Using Indicators toAssess Impact of ICT
in Education
3 3Final Report
Below is an attempt to synthesise several countriesrsquo efforts and initiatives inconducting research to evaluate the use of ICT in education and for some countriesthe development of ICT indicators Among these countries are
Australia Canada CIS and Balkan countriesIndia Indonesia JapanKorea Republic of Malaysia New ZealandPhilippines Singapore SloveniaSouth Africa Thailand United KingdomUnited States Uzbekistan Viet Nam
The development or potential development of indicators in the region follows threepaths
1 Ministries of Education or the Government set up Task Forces or committeesto take charge of developing indicators measuring the use and impact of ICTin education
2 The vision and goals of the ICT programme serve as basis for the formulationof ICT indicators
3 The impact of the use of ICT in education is determined through surveys andresearch and thus serves as basis for the formulation of national indicators
While the government of Korea has ldquoCyber Korea 21rdquo and the ldquoWhite Paperrdquo thegovernment of Japan has ldquoeJapan Priority Programmerdquo and Europe has theldquoeEuroperdquo initiative These programmes are all aimed at improving the ICT sectorand carry with them built-in indicators for measuring the achievement of thesegoals
Today most countries include ICT integration either in their national policies or inlaws pertaining to the education sector In Australia at the federal level theCommonwealth government has set goals for schools in relation to ICTdevelopment The government wants students to leave school as confident creativeand productive users of new technologies particularly ICTs as well as understandingthe impact of those technologies on society (httpwwwcurriculumeduaumceetyanationalgoalsnatgoalshtm) Schools are expected to integrate ICT into theiroperations
In Thailand the national Education Act of 1999 formed the core of educationreform towards ICT use in education as guided by three principal strategies value-added equity and quantum-jump (httpwwwunescoorgbangkokeducationictict_enablingap_policyLearntec-Tongyoopdf) Similarly the Law on Education inUzbekistan outlined the inclusion of ICT in the education sector Meanwhile thePhilippinesrsquo Department of Education has also formulated policies for the use ofICT The same trend is seen in Indonesia Malaysia Uzbekistan Viet Nam andothers where the national government sets goals for ICT integration in education
Within the region the Republic of Korea is the most advanced in terms of indicatordevelopment on the use of ICT in education The Ministry of Education and KoreanEducational Research and Information Service (KERIS mdash httpwwwkerisorkrenglish) have formulated and used a set of indicators categorised into supportinput utilisation or output The support indicators include training hours given toteachers and principals budget allocation the year plan and incentives for teachers
Section Two
Synthesis of country experiences on ICT indicatorsand related issues (Attachment II)
Kinds of indicators developed basedon visions or goals and surveys
4 Developing and Using Indicators of ICT Use in Education
The input indicators consist of the ratio between computers and students Internetconnectivity and speed educational software and the number of applications usedThe utilisation indicators include subjects using multimedia the percentage ofclasses using a Web board or computer labs the percentage of teachers joiningICT associations and discussion forums student usage of computers and usageof the internet Output indicators include teachers and students having an emailaddress a homepage and ICT certificates and students also having completed a32 hours ICT course
In Australia the Ministerial Council of Education Employment Training and YouthAffairs (MYCEETA) is currently looking into the use of performance measures forstudent achievement relating to new technologies Taking the National Goals forSchooling as the starting point the NEPMT commissioned a project in 2000 todevelop key performance measures for monitoring the ICT knowledge and skills ofAustralian school students The outcome of this process was the report MonitoringProgress towards the National Goals for Schooling Information and CommunicationTechnology (ICT) Skills and Knowledge Basically the report describes the contextof learning ICT skills and knowledge as an outcome of schooling identifies anddescribes performance measurement approaches definitions and sources of datacurrently used in relation to schooling research and national and internationalreporting on ICT skills and knowledge evaluates the ICT measures currently in usein the context of the National Goals for Schooling in the 21st Century proposes astrategy for monitoring the profile of ICT skills and the knowledge of school studentsand identifies further work required to establish an operational monitoring programme
There have also been several initiatives undertaken to measure the impact and useof ICT in education in different States of Australia The trends show that theseindicators are increasingly focusing on qualitative indicators measuring teacherand student outcomes For example the University of Sydney looked into whetherstudent-centred learning took place along with student improvement in high-orderthinking skills As far as the teachers are concerned the indicators assess changesin teaching practice and improvement in the ability to use emerging technologiesHowever connectivity remains a strong indicator in Australia focusing on the numberof teachers with a notebook the computer-student ratio bandwidth available inschools and the type of Internet connection
In Malaysia the creation of the Smart School System serves as benchmark for ICTintegration in schools (httpwwwmdccommymscflagshipsshtml) The MalaysianSmart School programme is aimed at reinventing learning institutions in terms ofteaching practices and school management preparing children for the InformationAge Some of the initial proposed indicators by the ICT project are both quantitativeand qualitative They focus on the use of ICT in curriculum in pedagogy inassessment and materials The quantitative indicators include decreased drop-outrates and recorded achievement gains each year among others while the qualitativeindicators include caring and competent teachers and a broad flexible curriculumthat caters to the differing needs and abilities of students
In the Philippines the Senate Committee on Education Arts and Culturecommissioned SEAMEO-INNOTECH to conduct the national survey to profile theICT capabilities of elementary and secondary schools in the Philippines SEAMEO-INNOTECH was responsible for formulating the indicatorsitems on the survey (httpwwwseameo-inotechorgframeshtml) These include the existence of an enablingenvironment the computer skills of school personnel the presence of computersin schools instructional or academic use of computers ICT infrastructure and Internetconnectivity The Department of Science and Technology in collaboration with theDepartment of Education has also conducted a survey not only looking at theinfrastructure and hardware support indicators but also with regard to howcomputers had been used and integrated into the curriculum as well as in teachingand learning
5 5Final Report
In Thailand initial use of indicators through a survey included Internet connectivityin schools the computer-student ratio and usage of ICT in schools and schooladministration and connection to SchoolNet as main issues The annex found atthe end of this document also shows a variety of potential indicators which fallunder their ICT projectrsquos three principlesstrategies namely value-added equityand quantum-jump strategies A committee was formed to concentrate onformulating indicators to measure the impact of ICT use in schools
Uzbekistan through its Ministry of Public Education has carried out monitoring andevaluation through the 14 Provincial Departments of Education and 15 In-serviceTraining Institutes Under these indicators have been examined such as theavailability of computers in schools the number of students using computers thenumber of computer classes integration of ICT in subjects and teacher training Itwas reported that the evaluation of student computer ability and performance isdifficult as different computers are being used throughout the country
In India the ICT programme statement of goals brought about potential indicatorsthat include the presence of MIS and software ICT in textbooks ICT in computersubjects and in-service and pre-service training of teachers
Though Indonesia has not developed its set of indicators its ICT in educationprogramme goals and objectives also imply that the following indicators can bepotentially useful studentrsquos understanding of the benefits of ICTs mdash disadvantagesas well as challenges studentrsquos use of ICT knowledge in acquiring processingarranging distributing and keeping information and studentrsquos application ofknowledge skills and attitudes in designing information technology systems andsolving problems relating to ICT
Similarly while Viet Nam has not developed its indicators its ICT goals imply indicatorsin the following areas ICT as a subject in general education number of trainedteachers and establishment of ICT departments in universities to train teachersprovision of computer labs in schools and the application of ICT in schoolmanagement
In Singapore as the process of IT integration in schools reaches a considerablelevel of maturity the question being asked is How do we integrate IT in schools solearning opportunities are optimised Research undertaken by the National Instituteof Education and Ministry of Education entitled ldquoEffective Integration of IT in SingaporeSchoolsrdquo (httpeduwebnieedusgprojectsITintegration) focused on the generalpedagogical practices and socio-cultural policies of IT integration in Singapore schoolsnot just the innovative and best practices The indicators used included infrastructureand resources school IT culture staff development teacher use and student useThe research sought answers to the following questions or indicators of a qualitativenature
What are the pedagogical practices of teachers and students that promote orhinder the integration of IT
What are the roles of the human participants activities and tools in such anenvironment
How does a change in the curriculum promote a culture that facilitates integrationof IT
How does a change in the mode of assessment affect integration of IT
The UNESCO Institute of Information Technology in Education (httpwwwiiteru)based in Moscow undertook a survey of the use of ICT in education in Baltic andCIS countries making use of the following indicators a) Official documents on ICTusage in education b) ICTs in curricula mdash as a separate subject or to support othersubjects c) Equipment (computer-student ratio computer availability in classroomsmultimedia system and LAN connection) d) Software (percentage of schools withDOS and Windows and using software for teaching subjects and software designed
6 Developing and Using Indicators of ICT Use in Education
by local and foreign experts) e) Global communication means (percentage withoutInternet access with limited Internet access ndash- only e-mail access via dial-up ordedicated line and those with web pages) and f) Personnel development mdashpercentage of elementary school teachers subject teachers and teachers ofInformatics and EI administration who have undertaken the computer literacy coursefor certain hours during a certain time frame and the computer skills of elementaryschool teachers subject teachers and teachers of Informatics and administration
What kinds of changes in knowledge skills and competencies are required fromteachers and students in the use if ICT In order to serve as a basis for developingknowledge skills and competencies in the use of ICT as well as in comparingoutcomes of ICT use against goals set few countries have standards for technologyuse
In Australia however the Victoria government has a curriculum standards framework(CSF) developed by the Victorian Curriculum and Assessment Authority whichidentifies what students should know and be able to do in eight key learning areasfrom preparatory year to year 10 In New South Wales the Government hasforeshadowed the introduction of an external Computer Skills Assessment for allyears 6 and 10 students to determine their knowledge skills and understanding inthe use of ICT Western Australia has a Competency Framework for Teachers andin Queensland these competencies are identified in Minimum Standards forTeachers-Learning Technology (httpeducationqldgovaucurriculumlearningtechnology mst_inthtmlintroduction) Queensland also produced a documentICTs for Learning School Information Kit 2002ndash2003 which details benchmarksestablished around teaching learning and the curriculum learning and developmentICT infrastructure connectivity ICT support and innovation Furthermore thedevelopment of indicators will be based on the following a) definition of contentdomain including functional skills in a cross curricular context manageability in itscomplexity delineates between Year 6 and Year 10 in terms of the curriculumcontext and the hierarchy of skills identified and b) the development of a scale ofcompetence including basic and functional skills as well as complex thinking andfacilitating the reporting of a range of achievement
The United States and Europe utilise a set of standards for the technology use ofstudents teachers and school administrators The International Society for Technologyin Education (ISTE) came up with the National Education Technology Standards(NETS) Project (httpcnetsisteorg) the primary goal of which is to enablestakeholders in PreK-12 education to develop national standards for the educationaluses of technology that will facilitate school learning (see attached for more detailson the ISTE NETS standards)
The fact that the other countries did not indicate any existing standards that canmonitor the use of technology reflects the lack of qualitative indicators Many countriesmerely focus on providing the technology that is making computers and Internetaccess available
In most of the countries researched on the studies have been limited to ICT indicatorsused in the primary and secondary level There are however instances whereother levels are included such as the case of Republic of Korea where universitylevel is included and in Slovenia pre-school In the United States those in physicaleducation and special education subjects in the primary and secondary levels wereexcluded Japan is noteworthy as its ICT policy includes even special schools forthe blind and the disabled Australia incorporates those in non-formal education intheir studies
Standards for technology use
Levels of integration
7 7Final Report
This situation tells us something about the issue of equity in the use of ICT in educationThere are times when the government policy itself can serve as either an aid or abarrier to equity in access
The number of computers or Internet connections in schools dominates statisticsIn fact only six countries specified indicators pertaining to other ICT technologiessuch as telephone lines fax machines LCD projectors and the like These countriesare Australia India New Zealand Republic of Korea Thailand and the Philippines
Perhaps future studies should also look into other types of ICTs in addition tocomputer-based and Internet In doing so there should be a clear definition of whatICT is The following definitions can serve as a guide
Information TInformation TInformation TInformation TInformation Technology (IT)echnology (IT)echnology (IT)echnology (IT)echnology (IT) is the term used to describe the items of equipment(hardware) and computer programmes (software) that allow us to access retrievestore organise manipulate and present information by electronic meansPersonal computers scanners and digital cameras fit into the hardware categoryDatabase storage programmes and multimedia programmes fit into the softwarecategory
Communicat ion technology (CT)Communicat ion technology (CT)Communicat ion technology (CT)Communicat ion technology (CT)Communicat ion technology (CT) is the term used to describetelecommunications equipment through which information can be sought andaccessed for example phones faxes modems and computers
Information literacyInformation literacyInformation literacyInformation literacyInformation literacy is the combination of knowledge understanding skills andattitudes that students need to fully contribute as members of society in theinformation age When students become information literate they develop anability to select interpret evaluate manipulate and present information
Studies on how teachers use ICT are also included in most ICT integrationprogrammes Many looked into how teachers have used ICT in teaching specificsubjects into how they have employed Internet resources in teaching how theyhave used email in communicating with students and other teachers and whetherthey have developed their own homepages In Australia for example teachersmake use of self-paced learning materials on ICT use in CD-format In other countriespreference is given to teacher applicants who are already computer literate suchas in the case of the Philippines In Korea and Australia teachers are provided withPCs These provides an overview of ICT indicators related to teacherrsquos use of ICT
Respondents for the different surveys in the US New Zealand the UK South Africaand Europe usually included teachers Students are included in surveys to determinetheir perceptions towards ICT such as in the UK and South Africa In other casesschool heads are taken as respondents such as in the Philippines and New ZealandIt was not clear from the results in other countries such as Canada Korea Japanand Slovenia who their respondents were
While some countries use qualitative in addition to quantitative indicators their useis obviously limited Quantitative data usually includes ICT infrastructure andconnectivity consisting of hardware and the physical networks that connect thecomputers locally and globally
Common indicators used for measuring or determining ICT infrastructure include
ICT infrastructure hardware and connectivity
Teacherrsquos use of ICT
Targets of indicators surveys
Types of indicators
8 Developing and Using Indicators of ICT Use in Education
Availability of computer hardware ratios of computerstudent computerclassroom computersteacher type of computers (stand alone multimedia innetwork)
Availability of connectivity and bandwidth of the computers Type of bandwidthfor connections includes high-speed broadband wireless
Quantitative data can be collected from indicators that will provide an overall view ofinfrastructure support and ICT presentation in schools However it is equally importantto examine indicators that will show how ICTs have been used not only as a basicoperational tool but also as a communications tool which promotes the developmentof creativity interactivity collaborative learning critical thinking and problem-solving
There are countries that are already attempting to include attainment and ICTimpact in indicators
Canada included ldquoobstacles to fuller use of information technologiesrdquo in its list ofindicators (httpwwwcmeccastatspceip1999Indicatorsiteenglishpagespage19ehtml) In Europe ldquoteacher confidence in the use of ICT change in teachingmethods and desirable ICT skillsrdquo is assessed (httpwwweurydiceorgDocumentsTicBIenFrameSethtm)
In New Zealand ldquoobstacles faced by teachers in using ICT factors that encourageuse of ICT studentrsquos positive views about technology activities in schoolrdquo are amongthe qualitative indicators
South Africa (httpeducationpwvgovzateli2researchICT20auditICTaduithtm)attempts to measure practical foundational and reflexive competencies of educatorsalong with how well students enjoy ICT-related activities and learnerrsquos perception ofhow the use of computers improves learning and attitudes
Meanwhile the UK (httpwwwdfesgovukstatisticsDBSBUb0296) looks atteacher confidence in ICT use and the benefits of ICT in subjects while in the USmost qualitative indicators pertain to the teacherrsquos perceived value of internet userelative to the teacherrsquos educational background school level taught location ofaccess etc
The Republic of Korea includes output indicators teachers and students now havingemail addresses and a homepage to deliver information and exchange school workand ideas as well as more participation in ICT extra curricular activities (httpwwwicce2001orgcdpdfp12 KR115pdf)
Research in Japan the Philippines Slovenia and other countries show that thesecountries are still concentrating on providing ICT infrastructure that is making thetechnology available in their respective countries rather than measuring impactand effectiveness
Qualitative indicators mentioned in the research include
How much students think they have improved Change in teaching methods Desirable ICT skills Factors that encourage telecommunications use Students who had positive views about technology activities in schools Teachers agreeing that telecommunications technologies can enhance learning
and teaching How much learners think they have improved in various activities Teacher confidence in the use of ICT Development of practical foundational and reflexive competencies Impact of computers on educators and learners Barriers to computer related activities
Some indicators appear to be unique or were only mentioned for some countries
In Europe for example ICT indicators include the ICT policy and strategy of eachcountry in the CIS and Balkan study looking at Denmark Sweden Finland Norwayand the UK These indicators measure objectives of each country in national ICTprojects along with the schedule of implementation
9 9Final Report
In the Republic of Korea the establishment of an education network (KoreaEducation Network) serves as one of the ICT indicators for higher education Koreaalso uses the establishment of a networked research system (Research InformationService System) for higher education as another indicator
The establishment of a network can be considered a quantitative indicator in thesense that it is a physical phenomenon where hardware or portalsplatforms areprovided for networking in a digital form to take place However networking canalso be a qualitative indicator if the focus is on developing competence indisseminating knowledge and information quickly and to large numbers of peopleThe level or quality of networking among organisations can also be used as aqualitative indicator
Furthermore most of the countries give themselves a deadline or a yearlyachievement target For example in the Republic of Korea the targets for theyear 2000 are to provide PCs and other infrastructure to schools for 2002 theestablishment of a Nationwide Education Administration Information System andfor 2005 the setting up of the Integrated Human Resources Information Network
The use of ICT in the school system in the Asia-Pacific Region as in the otherRegions of the world is widespread and continuously growing Many believe thatICT will empower teachers transforming teaching and learning processes frombeing highly teacher-dominated to student-centered Arguably the quality of studentlearning will improve tremendously as use of ICT will create opportunities for studentto develop their creativity problem-solving abilities and other higher-order thinkingskills
It appears though that while ICT has revolutionised business industry andentertainment indicators to prove that it has had the same effect on studentoutcomes are lacking as yet Moreover ICT has brought with it its own problemssuch as the oft-mentioned ldquodigital dividerdquo exacerbating the problem of access toICT between rich and poor male and female and between and among teachersand school administrators Moreover as countries continue to invest in ICT for usein education drawing financial resources from a variety of sources including theprivate sector and bilateral funding agencies there is even greater need forperformance indicators to monitor the use and effects of ICT demonstratingaccountability to these various funding sources and to the public
While these problems are known to our policy makers and educators informationon the extent of these problems remains scant due to lack or absence of monitoringand evaluation systems concerning the use of ICT in schools and its impact onteaching and learning There is an urgent need therefore for a monitoring andevaluation (M and E) system if current efforts to make ICT use an integral part ofthe education system are to succeed Such M and E systems should start withformulating a set of indicators of ICT use and impact in education
This effort is not new in other parts of the world such as in the USA Europe theUK Canada Australia New Zealand and the like (A listing of ICT indicatorsdeveloped in these countries is given as Appendix I to this paper) However in mostof the Asia-Pacific countries there has been little systematic work in the use of ICTindicators in the field of education except that of the Republic of Korea and soonAustralia
Given that Asia-Pacific countries differ widely in regard to the scope and variety ofuse of ICT in education it would be unrealistic and inappropriate to attempt toformulate a uniform set of indicators that can be used to frame data collection forICT in education projects Rather it is better to arrive at a consensus on commoncore indicators that can be used regardless of the ICT utilisation stage which acountry has reached Important criteria to be observed in formulating these coreindicators would include local relevance reliability and robustness when these areused for comparison of one ICT project or country with another
10 Developing and Using Indicators of ICT Use in Education
Assessment and evaluation methodsIn most of the studies reviewed traditional or standard assessment methods wereused Assessment rubrics were designed for specific projects lessons andorclassroom experiences in addition to standard assessment tools except in a primaryschool in Sunnyside Elementary School Putnam Washington In this study parentswere also involved in the assessment process preparing reports of their childrenrsquosprogress
The ways that technologies are being used in schools change the teacherrsquos rolefrom that of technology-as-teacher to technology-as-partner in the learning processAs students increasingly use technologies as learning tools they will producetechnology-based artifacts - student-constructed knowledge bases Theseknowledge bases are rich multi-modal indicators of what students have learnedMoreover as learning becomes more meaningful so it becomes more authenticand more complex Thus authentic assessment and other non-standard assessmentmethods such as rubrics need to be designed to capture meaningful learningexperiences of students brought about by these new technologies
Unfortunately not too many teachers have acquired the competencies to conductauthentic assessments for student learning using learning portfolios and rubrics forperformance evaluation The need for such learning assessment competencybecomes even more urgent as educators move away from the behaviourist andobjectivist perspective of learning to that of a more constructivist view
Using the type of indicators used by countries as basis for categorising them basedon the extent and impact of ICT and using the input-process-output model theresults would be
Level 1 - Includes input indicators only Level 2 - Includes input and process indicators
Level 3 - Includes input process and output indicators
x
x
x
x
x
x
x
x
x
x
x
x
x
x
x
x
x
x
Qualitative
Type of indicator
x
x
x
x
x
x
x
x
Australia
CIS and Balkan countries
Canada
Europe (Denmark SwedenFinland Norway UK)
India
Indonesia
Japan
Korea Republic of
Malaysia
New Zealand
Philippines
Slovenia
South Africa
Thailand
UK
USA
Uzbekistan
Viet Nam
Country LevelQuantitative
3
2
3
3
2
1
2
3
2
2
1
1
3
2
3
3
2
1
1
13Section
Methods ofCollecting Indicators
11 11Final Report
There are various ways of collecting data based on predetermined ICT indicatorsOf course the most popular one is the use of survey questionnaires farmed out toa representative sample of schools school heads and teachers either on a regularor one off basis Clearly those done more regularly can track the behaviour of theindicators over time Weaknesses in ICT implementation can be remedied in duecourse new strategies in ICT implementation can be worked out and carried outthus increasing the probability of success of ICT programmes and projects Theone-shot survey is more appropriate for a summative kind of assessment in whichwe are more interested in finding out for instance the longer-term impact of ICTuse
Where the telephone system in a particular country is well developed enough thatmost homes have access and long distance calls are cheap the telephone interviewis a more cost-efficient method of data collection For example EURYDICE BasicIndicators on the Incorporation of ICT into European Education Systems Project((httpwwweurydiceorgDocumentsTicBIenFrameSethtm) conductedEurobarometer surveys over the telephone in 2001 covering a representative sampleof school heads and teachers in each EU country The questions put to the schoolheads were mainly concerned with their school ICT equipment and facilities whilethose asked of the teachers included the use of computers and the Internet withtheir pupils (time spent using them frequency of their use reasons for not usingthem etc) and how ICT had changed the way they taught Slovenia also made useof telephone interviewing as a method of data collection augmented by publicopinion surveys in person on a one-to-one basis (httpwwwrisorg) Data oninformation-telecommunication infrastructure such as telephone cellular phoneand ISDN connections number of Internet providers backbone providers and thelike were gathered from the telecommunication companies themselves (Details ofindicators used in the above surveys are in Appendix I)
In Australia the national monitoring of ICT skills and knowledge of students in Year6 (aged 10-12 years) and Year 10 (aged 14-16 years) will be done by means ofthree-yearly sample assessments commencing in 2005 Student outcomeinformation is the focus of the reporting agenda Assessment techniques should beinnovative and model good assessment practice and wherever possible assessmentmaterials developed for national sample assessments should be available for use bysystems and schools Collection and use of data for national purposes will in allrespects conform to the guidelines provided in the report Data Principles and Protocolsagreed by the PMRT and where performance in different years in a particular domainis the focus of measurement a single domain scale should underpin measurementsof student achievement The assessment methods will include a mix of tests onpaper and on line and performance assessment tasks with teacher assessment
The study by Singapore to measure the effective integration of ICT in schoolsindicated that to gather accounts by various groups and individuals in the learningenvironment both qualitative and quantitative methods were drawn upon such asobservations of IT and non-IT based lessons face-to-face interviews with principalsand IT co-ordinators group interviews with students and teachers questionnairesfor teachers and students and samples of studentsrsquo work
Survey questionnaire
Telephone interview
3 -yearly sample assessment
12 Developing and Using Indicators of ICT Use in Education
Where there is a saturation of Internet connectivity in the country that is most ofthe homes schools and offices are connected use of questionnaires posted on thewebsite of the institutionagency conducting the surveys can be an efficient methodof collecting data on indicators Furthermore communication by emails betweenthe respondent schools school heads teachers and even students will facilitatedata gathering Data entered into the web-based questionnaire can be automaticallyuploaded to the institutionagencyrsquos computer server located thousands of milesaway
Notably the UNESCO IITE survey met with some difficulties because the collectionof data depended primarily on the efforts and contributions of heads of departmentssenior specialists and the staff of national Centres of Informational Technologies inEducation or Centres of Teacher Training Retraining and Educational Support whowere not given any financial support agreeing to work due to an official memorandumThus many of the results were generated from expertsrsquo estimates rather thandirect collection of data from teachers students and schools
EnGuage a new Web-based framework developed by NCREL in the USA (httpwwwncrelorgengauge) is a response concern regarding the ever-increasinginvestment in educational technology by providing answers to three significantquestions to wit What value does technology bring to the schools How can ourschools ensure a return on these investments And why does technology work insome schools and not in others EnGuage is a tool set designed to help schoolsand school districts use technology effectively for learning teaching and managing
The School Technology and Readiness (STAR) Chart (httpww2isteorgstarchart) provides another web-based self-evaluation tool providing schools withthe information they need to better integrate technology With STAR Chart onlinemultiple-choice questionnaire can be completed that will provide instant feedbackThe Chart identifies and defines four school profiles ranging from the ldquoEarly Techrdquoschool with little or no technology to the ldquoTarget Techrdquo school that provides a modelfor the integration and innovative use of educational technology It is not meant tobe a measure of any particular schoolrsquos technology and readiness but rather isintended to serve as a benchmark against which every school can assess andtrack its own progress
The STAR Chart can help any school or community answer three criticalquestions
Is your school using technology effectively to ensure the best possible teachingand learning
What is your schoolrsquos current education technology profile
What areas should your school focus on to improve its level of technologyintegration
The method of data collection for ICT indicators will then vary from country tocountry depending on the spread of telecommunication use such as the telephoneand the Internet It will also depend on whether the existing M and E systems canstill accommodate additional data collection tasks to monitor and evaluate ICTimpact in schools Additional variables based on ICT indicators can be integratedinto the existing database system
Internet-based surveys
Web-based self-evaluation tool
1
14Section
Various Software orDatabase Systems for
Storing Indicators
13 13Final Report
Below are a few of the software or database systems worth considering in developingthe databases for ICT indicators
Spreadsheet programmes such as IBM Lotus 123 and MS Excel
Statistical programmes such as Statistical Package for the Social Sciences(SPSS)
Customized database programmes using MS Access (for small databases)
SQL Server MAGIC (for big databases)
For data-based driven web applications (Visual Interdev Java Visual Basic) thereis anoother software available in the market which can be used to create the ICTdatabases Technical staff will be able to assist in determining the most feasible anduser-friendly software adequate to answer specific needs
1
1IAttachment
ICT IndicatorsUsed in
Different Countries
15 15Final Report
Government What students should know and be able to do at a certain level
Connectivity Number of teachers with notebook Computer student ratio Bandwidth available in schools Type of internet connection
Changes in studentperformances afterintegrating ICT intoeducation
Increase in student engagement enthusiasm and motivation If student-centred learning took place Improvement in studentsrsquo high-order thinking skills improved Occurrence of changes in teaching practices Improvement in the ability to use emerging technologies
University of Sydney
ICT Indicators in Baltic and CIS Countries
Hardware equipment Computer classroom availability in educational institutions (EI) The average number of students per one computer in EI equipped
with computer classrooms Percentage of IBM- and Apple-compatible computers in total
number of EI computers Percentage of EI equipped with one or more multimedia system in
total EI equipped with computer classroom number Percentage of EI equipped with local network to total EI equipped
with computer classrooms number
Software Percentage of computers with installed OS DOSTM to total numberof computers in computer classes
Percentage of computers with OS WindowsTM of Apple Macintoshto total computer number in computer classes
Per cent of computers with other OS to total computer number incomputer classes
Percentage of EI with any educational software for teaching thecorresponding subjects to total EI number with computer classes1 Elementary School subjects2 Science subjects3 Humanities4 Informatics or information technologies
Percentage of educational software designed by the specialistswithin the country to total number of educational software usedin EI for teaching of the corresponding subject curriculum(elementary school science subjects humanities informationsinformation technologies)
Percentage of educational software designed by foreign specialiststo total number of educational software used in EI for teaching ofthe corresponding curriculum (elementary school science subjectshumanities informaticsinformation technologies
Components of ICT Indicators
UNESCO Institute ofInformationTechnology inEducation
Official documents Official documents in ITICTs in secondary education Official documents in ITICTs in secondary education currently
in force
ICT in curricula Available state curriculum on informatics andor InformationTechnologies
Informatics andor Information Technologies as a separate subject ICT usage to support other subjects implied in curricula on these
subjects
Global communication Percentage of EI without internet access Percentage of EI with limited internet access - only e-mail Percentage of EI with access via dial-up channel Percentage of EI with access via dedicated line Percentage of EI with own web-pages
ICT Indicators in AustraliaAgency responsiblefor data gathering ICT indicators Components of ICT indicators
Agency responsiblefor data gathering ICT indicators Components of ICT indicators
16 Developing and Using Indicators of ICT Use in Education
Personnel development Percentage of elementary school teachers subject teachers(except teachers of Informatics andor Information Technologies)teachers of informatics and EI administration who haveundertaken the computer literacy course from 1 September 1999until present time1 Less than 50 hours (Index 1)2 50-100 hours (Index 2)3 Over 100 hours (Index 3)
Computer skills of elementary school teachers subject teachersand teachers of Informatics and administration1 Elementary computer literacy2 Proficiency in ICT field
ICT Indicators in Baltic and CIS Countries (contrsquod)Agency responsiblefor data gathering ICT indicators Components of ICT indicators
ICT Indicators in Canada
Pan-CanadianEducation IndicatorsProgramme (PCEIP)
The pupil-computer ratio is a proxy measure of the access of availabilityof computer to students in schools Only computers used for educationalpurposes are included in the ratio
Internet connectivity This is a measure of the percentage of students attending schools thatwere connected to the internet for educational purposes at the time ofthe survey Schools that were connected for administrative purposesonly were excluded
Internet activities ofstudents
School ICT co-ordinators were questioned about instructional activitiesinvolving the use of the internet They were asked to identify typicalactivities that students at certain grade levels would have engaged in bythe end of the school year
Obstacles to fulleruse of informationand communicationstechnologies
Principals were asked to identify the major barriers hindering theachievement of their schoolrsquos computer-related goals for students Inthis section items are presented that are identified as major obstaclesby principals of schools representing at least 50 per cent of enrolmentsat each of the three levels of schools The obstacles noted have beengrouped into three categories those relating to hardware and softwarethose relating to instruction and those relating to the training of teachers
Agency responsiblefor data gathering
ICT indicators Components of ICT indicators
ICT Indicators Used in Europe (Denmark Sweden Finland Norway and UK)
Information SocietyTechnologyProgramme fundedby the EuropeanCommunity
Policy and strategy Countries with an official policy on the use of ICT
Schedule for implementing national ICT education projects
Responsibility for the purchase and maintenance of hardware
Objectives in national ICT projects
Inclusion of ICT in the national curriculum
Schools with ICT implementation plan (simple)
Schools with ICT implementation plan (detailed)
Approaches of ICT defined in the curriculum
Objectives defined in the curriculum for the teaching or use of ICT
Schools with autonomous decision power
Agency responsiblefor data gathering ICT indicators Components of ICT indicators
Pupil-computerratio
17 17Final Report
Use and access Pupils and teachers with a personal e-mail address
Use of ICT in areas of the curriculum
Use of external electronic communication services
Teachers use the internet for non-computing teaching
Internet use in teaching
Teachers opinion about the internet as a tool
Pupils access to the internet
Teachers access to computer and internet at home
Who pays teachers home access
Teachers who connect with other schools via the internet
Competencies New ICT and media students in percentages of all students
New ICT and media students by level of education
Qualifications and degrees in information technology and mediastudies
Population with a degree of qualification in ICT and media studies byfield of study and level of education
Hoursyears spent to pedagogical IT guidance
Hoursyears spent to technical IT guidance
Teachers confidence in the use of ICT
Students and teachers knowledge regarding ICT
Specialist ICT teachers
ICT courses during initial training of general class teachers
ICT trained teachers
Change in teaching methods
Average expenditure on ICT in schools
Sources of funding for ICT in schools
Total expenditures on ICT in schools
Distribution of the specific budget between the purchase ofequipment and expenditure on human resources
Number of computers per 100 pupils
Number and quality of computers available for administration pupilsand teachers
Expected increase in the number of computers
Computers with access to school net andor internet
Quality of internet access in schools
Placement of the computers
Schools with own website
Schools with on-line services
Schools with intranet website e-mail
Economy andinfrastructure
ICT Indicators Used in Europe (Denmark Sweden Finland Norway and UK) (contrsquod)Agency responsiblefor data gathering ICT indicators Components of ICT indicators
18 Developing and Using Indicators of ICT Use in Education
Inclusion of ICT in the curriculum
Percentage of teachers who use computers andor internet in theclassroom
Approaches to ICT defined in the curriculum
Objectives defined in the curriculum for the teachingor the use of ICT
Inclusion of ICT in the initial training of all teachers (except specialistICT teachers)
Inclusion of ICT in the curriculum
Percentage of teachers who use computers andor internet in theclassroom
Reasons given for not using internet with pupils
Approaches to ICT defined in the curriculum
Annual number of hours recommended for teaching ICT as a subjectin its own right
Objectives defined in the curriculum for the teaching or the use ofICT
Inclusion of ICT in the initial training of all teachers (except specialistICT teachers)
Percentage share of compulsory teaching related to ICT and thenumber of hours devoted to such teaching in the initial training of allteachers (except specialist ICT teachers)
Desirable ICT skills according to official recommendations for theinitial training of all teachers (except specialist ICT teachers)
Secondary (lowerand uppersecondaryeducation)
Both Number of pupils per computer and number of pupils per computerwith an internet connection (primary and secondary education)
Responsibility for the purchase and maintenance of hardware(primary and secondary education)
Distribution of the special budget between the purchase ofequipment and expenditure on human resources (primary educationgeneral lower secondary education general upper secondaryeducation)
Average periods during which primary school teachers usecomputers (with or without internet connection) in the classroomhours per week
Specialist ICT teachers
Percentages of primary and secondary school teachers in Europewho have received official training in the use of computers andorinternet in their teaching
ICT Indicators Used in IndiaAgency responsiblefor data gathering
ICT indicators Components of ICT indicators
Ministry of HumanResourceDevelopment
Presence of MIS
Presence of software
ICT in textbooks
ICT in computer subjects
In-serv ice and pre-service training of teachers
Primary
ICT Indicators Used in EuropeAgency responsiblefor data gathering ICT indicators Components of ICT indicators
19 19Final Report
Student understanding of ICTrsquos benefits disadvantages as well aschallenges in information technology
Studentrsquos use of ICT knowledge in getting processing arrangingdistributing and keeping information
Governmentrsquos goalsand objectives
ICT Indicators Used in IndonesiaAgency responsiblefor data gathering ICT indicators Components of ICT indicators
Student application of knowledge skills and attitudes in designinginformation technology systems solving problems relating to ICT
Includes public halls libraries
Training hours of the principal Training hours of teachers implemented by the school itself Training hours on ICT use in education per teacher Percentage of operating budget vis-a-vis the total budget Percentage of teachers in the department of ICT Whether an ICT yearly plan exists or not Whether an incentive system for ICT personnel exists or not
ICT Indicators Used in Republic of Korea
Support
Agency responsiblefor data gathering ICT indicators Components of ICT indicators
bull Ministry ofEducation
bull KoreanEducationalResearch andInformationService (KERIS)
Inputs (infrastructurehardware software)
Number of students per computer Number of computers per teacher Percentage of computers less than 3 years old Percentage of computers connected to internet Speed of internet connection Number of educational software (CD-titles) Percentage of computers equipped with 5 basic applications
Number of students per PC
Internet access of students
Number of teachers inpublic schools who canoperate PCs
Number of teachers at elementary lower and uppersecondary schools and special education schools
Number of humanresources with IT-relatedmasterrsquos and doctoraldegrees
Number who graduated from masterrsquos course
Number who graduated from doctoral course
Number of foreign nationalswith the status of residenceldquoEngineerrdquo and number ofnationals entering Japanwith the status of residenceldquoEngineerrdquo
Number of registered foreign nationals
Number of foreign nationals entering Japan
Ensuring security andreliability
IT security measures (information security policies presenceof firewalls and back-up systems)
Number of public schoolswith internet access andcomputers
In households
In SMEs (companies with five employees or more)
In corporate (companies with 300 employees or more)
Number of internet users
ICT Indicators Used in JapanAgency responsiblefor data gathering ICT indicators Components of ICT indicators
e-Japan PriorityPolicy Programme
Public facilities withinternet access
20 Developing and Using Indicators of ICT Use in Education
Teachers
Percentage of subjects utilising multimedia materials for teachingand learning through WWW
Percentage of classes using web-board
Percentage of subjects using web-board
Percentage of teachers participating in an association regardingICT use
Percentage of subjects using computer lab
Percentage of functions of the Information System being used
Whether to use electronic decision system
Number of posting written for and by parents
Students
Hours of use of computer per student
Percentage of students participating in ICT special programmesafter school (Elementary)
Whether to teach on computer (Secondary)
Percentage of subjects collecting assignments through web board
Number of search library DB per students
Percentage of student-governing community utilising webenvironment
Whether a programme regarding internet ethics exists
Number of web communities per class
Internet
Usage of internet
Number of access to school website per week
How often school websites are revised
Output Teachers
Percentage of teachers having e-mail address
Percentage of teachers having homepage
Percentage of teachers having ICT certificates
Percentage of teachers participating in educational SW contests
Students
Percentage of students having e-mail address
Percentage of students having homepage
Percentage of students having ICT certificates
Percentage of students participating in educational SW contests
Percentage of students completing the ICT course (32 hours)
Utilization
Agency responsiblefor data gathering ICT indicators Components of ICT indicators
ICT Indicators Used in Republic of Korea (contrsquod)
21 21Final Report
Malaysian smart schoolsuse of technology forinformation processing andas a productivity tool toenhance professionaldevelopment and toautomate instruction
Malaysian government(Ministry of Education)
ICT in curriculum
ICT in pedagogy
ICT in assessment
ICT in materials
ICT Indicators Used in MalaysiaAgency responsiblefor data gathering ICT indicators Components of ICT indicators
How schools teachersand students usetelecommunicationstechnologies
Number of teachers taking in-service training using a tele-learningapproach
Obstacles faced by teachers in using telecommunicationstechnologies
Factors that encouraged telecommunications technology use
Percentage of teachers agreeing that telecommunicationstechnology can enhance learning and teaching
Percentage of students who had positive views about technologyactivities in school
Telecommunicationsequipment
Paper by David HarrisNZCER
Percentage of schools with telephone lines
Percentage of schools with classrooms that has telephone lines
Percentage of schools with fax machines
Percentage of schools with computers that has access to amodem
ICT Indicators Used in New ZealandAgency responsiblefor data gathering ICT indicators Components of ICT indicators
Availability of publiccommercial utilities andservices
Project TAO Cares(computer-assistedreforms for schools)senate committee oneducation arts andculture
Government throughthe Department ofEducation
Percentage of schools with electricity
Percentage of schools whose electricity is available for 24 hoursper day
Percentage of schools whose electricity is available year-round
Percentage of schools with ICT equipment
Percentage of schools where publiccommercial utilities andservices are available
Percentage of schools located in communities where publiccommercial utilities and services are available
ICT Indicators Used in The PhilippinesAgency responsiblefor data gathering ICT indicators Components of ICT indicators
Computer skills ofschool personnel
Percentage of schools staff who has computer skills
How school staff acquired computers skills
Percentage of school staff with expertise in using differentcomputer software
22 Developing and Using Indicators of ICT Use in Education
How were computers in the schools acquired
Location of computers in the school
Modes of set-up of the schools computers
Purposes for which computers are used
Operating system used
Software used for teaching and learning
How school acquired software programmes
Percentage of schools with internet access
Source of funds to pay for internet access
Internet connection arrangement (eg dial-up dedicated dial-upor leased line connection)
Who are given access to the internet (eg students principaladministrative staff etc)
Financial capacity to have internet access
How often computers are upgraded
Availability of funds for computer maintenance
Instructionalacademicuse of computers
Percentage of schools offering computer literacy subjects
How computer literacy subjects are offered (eg as part of regularcurriculum integrated with other subjects etc)
School personnel handling computer courses in the school
Purposes for which computers are used as part of instruction
Fees collected for computer use internet access
Computer use by non-formal education learners
Presence of computersin schools
ICT Indicators Used in The Philippines (contrsquod)Agency responsiblefor data gathering ICT indicators Components of ICT indicators
ICT Indicators Used in Slovenia
Information-telecommunicationsinfrastructure
Research on internetin Slovenia
Agency responsiblefor data gathering ICT indicators Components of ICT indicators
Telecommunication No of telephone connections No of telephone connections per 100 residents No of cellular phone connections NMT GSM No of cellular phone connections per 100 residents No of ISDN connections
Internet
No of internet providers No of backbone providers No of computers connected to the internet per 100000
residents No of wwwdomainsi web sites
Schools and relatedinstitutions
Internet
Schools with internet access (secondary schools primaryschools youth hostels kindergartens)
Pupils with internet access Schools with homepage
Computers networks and ISDN
Average number of computers per 100 employees Average number of computers per 100 pupils Share of schools with computers connected to network and
ISDN
23 23Final Report
ICT Indicators Used in Africa
Impact of ICT on qualityteaching and learning
School net educatordevelopmentprogramme
Agency responsiblefor data gathering ICT indicators Components of ICT indicators
1 ICT Skills Level of educator - includes assessment on skills suchas basic word processing e-mail and electronic informationaccessing skills
2 Integration Level - to be measured using the following guidelines
Educatorsrsquo Competence with ICT
Educators should be able to draw on generic ICT applications inorder to prepare for teaching
Educators should be generally competent in those ICTresources that could most benefit their teaching and the learnersrsquolearning
Educators should understand how to access and use electronicinformation and communications resources such as the internetfor the benefit of both the educator and the learner
Educators should know how to use ICT to improve theirprofessional and administrative efficiency
Educators should know how to encourage the development oflearnersrsquo ICT skills within the context of the lessons being taught
Integration of ICT with the curriculum
Educators should understand the key learning strategies thatinfluence the use of ICT to support teaching and learning
Educators should know how to organise their class andclassroom when making use of ICT to achieve lesson outcomes
Educators should understand the role of computer literacy withparticular reference to the educational use of computers as atool in a diverse and developing country like South Africa
Educators should know and understand the characteristics ofinformation particularly its role in learning and its ethical use andits credibility
Educators should be aware of current health legal and ethicalissues regarding the use of ICT in the classroom
Educators should understand how to assess the contributionof ICT to the process of learning
An evaluation instrument is created for assessments in this category
3 The Professional Growth of the educator - This is measuredinitially by conducting pre-course baseline studies in which theeducator reflects on existing practice and perceivedshortcomings This process begins with a workshop and isfurther pursued by the mentor in the follow-up period Progressevaluation of the impact of ICT and the development programmeon the educator as a professional is monitored by promptingfrom the mentor and the educator recording entries in anelectronic journal
4 Whole school levels - Whole school ICT use is measured in anumber of ways Staff ICT and integration-related proficienciesare measured individually or on a departmental or whole-staffbasis This is the choice of the school An instrument is used tomeasure the instructional use of technology in a school Thisinstrument categorises 6 levels of computer efficiency rangingfrom non-use to refinement The emphasis in this framework isgiven to the degree to which technology is used to support aconstructivist orientation to classroom pedagogy
24 Developing and Using Indicators of ICT Use in Education
Quantum jumpstrategy
All teachers and students to be IT and internet-literate by theyear 2002
Production of 250 titles of academic software and contentsannually and provision of funding worth 500 million Baht perannum to various communities for content development as wellas provide budget for localizing 2000 titles of useful foreigncontent
PC density target by the year 2006 as follows
1 20 for secondary school level
1 40 for primary school level
Investment in the production of IT and network equipment foruse in the education sector including software and multimedia
Provision of IT for education and professional development tothe under-privileged the disabled and common people seekinglifelong education
Provision of adequate radio frequencies for the education sector
Investment in research and development in IT for education atleast 400 million Baht per year
Establishment of monitoring and evaluating procedures andprotocols
Establishment of a National Institute of Technology for Education
ICT Indicators Used in Thailand
Value-added strategyGovernment ofThailand
Agency responsiblefor data gathering
ICT indicators Components of ICT indicators
Provision of software content and necessary supporting ITcurriculum via searching localizing producing to make betteruse of existing hardware in schools
Training of teachers to gain literacy in computer and internetuses
Establishment of maintenance programme for the existinghardware
Enhancement of the capabilities of organizations that can providesupport and services to schools by forming network of agenciesand individuals
Monitoring and evaluation of the use of technology for educationand collect data for planning purpose
Equity strategy Provision of a set of minimum requirement equipment andfacilities to needy schools including electricity 3 telephone lines5 computer sets 1 printer 3 sets of television 5 sets of radio 3internet accounts 100 hours per month via SchoolNetprogramme
Provision of a ldquoDigital Learning Centrerdquo (DLC) to the community
Training of teachers and trainers in IT and internet literacy
25 25Final Report
ICT Indicators Used in UK
Computers in schoolsNational Grid forLearning (NGFL)
Agency responsiblefor data gathering ICT indicators Components of ICT indicators
Computerpupil ratio
Average number of computers per school
Type age and multimedia capability of computers
Average number of computers used for management andadministrative purposes
Average number of computers linked to an international schoolnetwork
Different types of computer peripherals available
Internet and electronic Connectivity to the net
Number of schools connected to the internet at broadband level
Percentage and number of schools who have their own website
At least one networked computer with internet access in eachschooll for management and administration
E-mail access
Teacher confidence anduse of ICT in teaching
Teacher confidence
Use of ICT in subjects
Benefit of ICT in subject
Expenditure on ICT Estimated total
Average per school
Average per pupil
ICT Indicators Used in the United States of America
Internet use by teachers
Agency responsiblefor data gathering ICT indicators Components of ICT indicators
Teaching learning andcomputing A nationalsurvey of schools andteachers Centre forResearch onInformationTechnology andOrganizations
Public schools with internet access
Internet connections in classrooms of teachers
Teacherrsquos internet access at home and in their classroom
How often teachers use information from internet in lessons
Teacherrsquos use of electronic mail to communicate with teachers inother schools
Per cent of teachers having their students use different types ofsoftware
Student use of web browser software in lessons
Internet use for beyond classroom student projects andpublishing
Teacherrsquos perceived value of having a computer with electronicmail on their own desk
Teacherrsquos perceived value of classroom world wide web access
Internet use from various locations (home school etc)
Internet use by subject matter taught
Internet use by school level taught
Ability to use web search engine
26 Developing and Using Indicators of ICT Use in Education
Teacher and teacherdirected student useof computers andsoftware
Teacher directed student use of computers
1 Access to classroom computers
Computer-student ratios on classrooms
Number of classroom computers
Computer access in lab and media centres versus classrooms
2 Computer platforms used by student
Extent and variety of software used and teachers objectives for use
1 Type of software used
2 Software that teachers judge as most valuable for students
3 Objectives for computer use
4 Student computer use for school work on their own time
Teacher computer extertise and professional use
1 Use of software in profession
2 Expertise with computers
Technology support Average weekly hours spent by technology co-ordinator ondesignated job tasks
Average minutes spent per week by technology co-ordinatoron job tasks per teacher
Percentage of technology co-ordinators reporting additionalsupport from others (eg teachers district officers aidesadministrators etc)
Teacher rating of availability of technology support (per schoollevel and per type of school)
Total support hours per teacher (per school level and per typeof school)
Number of development occasions for teachers (per schoollevel and per type of school)
Technology support content used to deliver technologyservices to teachers [eg (1) facilities network and internetaccess hardware software (2) staff assistance and necessaryservices technical support help desk network services (3)one-on-one personal guidance computer experts for troubleshooting]
Percentage of teachers who have resource (ICT) available foruse
ICT Indicators Used in the United States of America (contrsquod)Agency responsiblefor data gathering ICT indicators Components of ICT indicators
Presence of computersin American schools
Total instructional computers
Students per computer
Type of computer in each school level
Per cent of computers with selected attached peripherals
Locations of instructional computers
Per cent technology-intensive by school level
Software saturation
Software diversity
Type of internet access
Public schools with internet access
27 27Final Report
Per student expenditure on hardware software and supportper school level
Instructional technology expenditure by US schools (hardwaresoftware and support
Per student expenditure on hardware software and supportfor one year vs five-year estimates
Five-year technology expenditures per student for schools withand without their own technology budgets
Five-year technology expenditures (per student) for public andnon-public schools
School technology expenditures (per student) by communityincome level
Five year school technology expenditures (per student) by levelof technology penetration
ICT Indicators Used in the United States of America (contrsquod)Agency responsiblefor data gathering ICT indicators Components of ICT indicators
School investments ininstructional technology
ICT Indicators in UzbekistanAgency responsiblefor data gathering ICT indicators Components of ICT indicators
Number of computer classes
ICT integration in subjects like physics chemistry and biology
Teacher training
Establishment of ICT departments in universities to train teachers for school
IT as a subject in general education
Number of trained teachers
Provision of computer labs in schools
Collaboration in international training about IT
Application of IT in school management
Government
ICT Indicators in Viet NamAgency responsiblefor data gathering ICT indicators Components of ICT indicators
Establishment of ICT departments in universities to train teachers for school
IT as a subject in general education
Number of trained teachers
Provision of computer labs in schools
Collaboration in international training about IT
Application of IT in school management
Government
1
1IIAttachment
Comparison ofICT Indicator Themesin Selected Countries
29
29
Final Rep
ort
Basis for ICTindicatorsagency
who formulatedICT indicators
Presence ofstandards for
technology use
Educationallevel covered
Respondents of studies
Technologiescovered
in studiesType of indicators
Presence ofindicators
addressing equityethics and
investment issues
Presence ofindicators on ICT
integration incurriculumimpact etc
Goals and objectivesof the governmentAll students will leaveschool as confidentcreative andproductive users ofnew technologiesparticularlyinformation andcommunicationstechnologies andunderstand theimpact of thosetechnologies insociety
Yes Curriculumand StandardsFramework (CSF)
Primary secondarynon-formal
Teachers students Computers internetuse of satellite TV
Quantitative andqualitative
Not specified Yes specificallythe studyconducted by theUniversity ofSydney Includestudies on studentengagemententhusiasm andmovitationimprovement ofhigher-orderthinking skills etc
Based on a meetingconvened in IITEMoscow in 2000 todevelop a set of ICTindicators
None Primarysecondary andtertiary levels
Heads ofdepartmentssenior specialistsstaff of nationalCentres ofInformationalTechnologies andEducation orCentres of TeacherTraining Retrainingand EducationalSupport
Computers andinternet
Quantitative -policy documentsICTs in curriculumhardware andequipmentsoftware Globalcommunicationmeans andpersonneldevelopment
None Partly
Australia
Baltic andCIScountries
30
Develop
ing and U
sing Indicators of IC
T Use in E
ducation
Basis for ICTindicatorsagency
who formulatedICT indicators
Presence ofstandards for
technology use
Educationallevel covered
Respondents of studies
Technologiescovered
in studiesType of indicators
Presence ofindicators
addressing equityethics and
investment issues
Presence ofindicators on ICT
integration incurriculum impact
etc
Canada Two criteria fordevelopment ofindicator set
Type of educationinformation neededfor policydevelopment
Practical availabilityof dataindicatorsdeveloped by Pan-CanadianEducationIndicatorsProgramme (PCEIP)
None Elementary andsecondary level
Not specified Computers andinternet
Quantitative andqualitative
Pupil-computerratio
Internetconnectivity
Internet activitiesof students
Obstacles to fulleruse of informationandcommunicationstechnologies
None Yes specificallyon whatencouragesteachers andstudents to usecomputers
Europe 1 Indicators based onthe eEurope initiativeof the EuropeanUnion Action lineldquoEuropean youth intothe digital agerdquo Thegoal for the saidobjective is to turndigital literacy to abasic competence forall young EuropeansSIBIS Study
Yes ISTE (NETS)standards
Various researcherscovered differentlevel public primaryand lowersecondary primarysecondary andspecial schoolshead teachers andteachers
School headsteachers
ICT in generalcomputers andinternet access
Quantitative andqualitative
Policy andstrategy
Economy andinfrastructure
Use and access
Competencies
Yes specifically onnational policiesand expenditure
Yes oncompetency ofICT instructors
Europe 2 Eurydice Yes ISTE(NETS)standards
Primary andsecondary level
Not specified Computers andinternet
Mostly quantitativevery little on qualita-tive indicatorsExamples
Number of pupilsper computer
Desirable ICTskills according toofficial recom-mendations forthe initial trainingof all teachers(except specialistICT teachers)
Mainly onexpendituredistribution ofbudget
Yes on integrationof ICT in subjects
31
31
Final Rep
ort
Basis for ICTindicatorsagency
who formulatedICT indicators
Presence ofstandards for
technology use
Educationallevel covered
Respondents of studies
Technologiescovered
in studiesType of indicators
Presence ofindicators
addressing equityethics and
investment issues
Presence ofindicators on ICT
integration incurriculumimpact etc
India Government None Elementary andsecondary schools
Not specified Computersinternet software
Quantitative None None
Indonesia Curriculum Centre
Governmentrsquos goalsand objectives
None Elementary andsecondary schools
Not specified Computers andthe internet
Quantitative Moreof internet andcomputer use andaccess
None None
Japan eJapan priority policyprogrammevarioussurveys conducted bygovernment agencieson ICT in general Likethose conducted bythe Ministry of PostsandTelecommunicationsSurvey on SocialEducation
None Elementary andsecondary in someindicators notspecified in otherindicators
Not specified Computers andinternet
Quantitative Moreof internet andcomputer use andaccess
Yes Governmentgeneral IT policy onelementary andsecondary schoolsthe same forschools for theblind and disabled
None
Republic ofKorea
Cyber Korea 21Vision To preparestudents forknowledge basedsociety by realizinglife-long learning viacyber-educationsystemrdquoKoreaNational StatisticsOffice
Yes - based onthe documententitled Adaptingeducation to theinformation ageA white paper
Elementarysecondary
Teachers andstudents andschoolheadmasters
Computersinternet andmultimedia
Quantitative Moreof internet andcomputer use andaccess throughinput utilizationand outputindicators
None None
Malaysia Government None Elementary andsecondary schools
Not specified Computers andthe internet
Quantitative None None
Quantitative andqualitative
Telecommunica-tions equipment
How schoolsteachers andstudents usetelecommuni-cationstechnologies
New Zealand Research conductedby the TelecomEducation Foundation
None Not specified Teachers andprincipals
Telephone linesfax machinescomputers andinternet
None Yes specificallyon whatencouragesteachers andstudents to usecomputers
32
Develop
ing and U
sing Indicators of IC
T Use in E
ducation
Philippines
Basis for ICTindicatorsagency
who formulatedICT indicators
Presence ofstandards for
technology use
Educationallevel covered
Respondents of studies
Technologiescovered
in studiesType of indicators
Presence ofindicators
addressing equityethics and
investment issues
Presence ofindicators on ICT
integration incurriculumimpact etc
Senate Committee onEducation Arts andCulture with SEAMEO-INNOTECH
Department ofEducation
None Public and privateelementary andsecondary schools
School heads All ICT relatedtechnologies suchas televisionprojectors radiocassette playerscomputersperipherals andinternet access
Quantitative Availability of
publiccommercialutilities andservices
Computer skillsof schoolpersonnel
Presence ofcomputers inschools
Instructionalacademic useof computers
Yes specificallythose pertaining touse of computers bynon-formaleducation students
None
Research on internetin Slovenia
None Primary secondaryyouth hostels andkindergartens
Not specified Computers andinternet access
Quantitative
Internet access
Computersnetworks
None None
School net None Not specified Students andteachers
Computers andinternet access
QualitativeexamplesIntegration of ICTwith curriculuminstructionalpractices barriersto computer use
None Yes oncompetency ofICT instructors
Government NationalEducation Act of1999
None Primary andsecondary schools
Not specified Computersinternettelephonescomputerperipherals ratio
Quantitative None None
Philippines
Slovenia
South Africa
Thailand
33
33
Final Rep
ort
Basis for ICTindicatorsagency
who formulatedICT indicators
Presence ofstandards for
technology use
Educationallevel covered
Respondents of studies
Technologiescovered
in studiesType of indicators
Presence ofindicators
addressing equityethics and
investment issues
Presence ofindicators on ICT
integrationin curriculumimpact etc
UK National grid forlearning
ISTE (NETS)standards
Primary andsecondary schools
Students andteachers
Computers and theinternet
Quantitative andqualitative
Computers inschools
Internet andelectroniccommunication
Teachercondidence anduse of ICT inteaching
Expenditure onICT
Yes mainly onexpenditure andbudget allocation
Yes includesteacherconfidence in theuse of ICT andbenefit of ICT
US Teaching learningand computing - astudy of teacherrsquosuse of computertechnology theirpedagogies andtheir school context
ISTE (NETS)standards
Public and privateschoolselementary middleschool and highschool all subjectsexcept physicaleducation andspecial education
Teachers Computers internetuse (includes use ofvarious softwareCDRom etc
Quantitative andqualitative School
technologyleadership andtechnologyoutcomes
Pedagogicalmotivations forstudent computeruse
Internet use byteachers
Presence ofcomputers inAmerican schools
Teacher andteacher directedstudent use ofcomputers andsoftware
Technologysupport
Schoolinvestments ininstructionaltechnology
Yes includesindicators thatdeterminestechnology intensiveareas softwaresaturation etc
Yes specificallypedagogicalmotivations forstudent computeruse
UK
US
34
Develop
ing and U
sing Indicators of IC
T Use in E
ducation
Basis for ICTindicatorsagency
who formulatedICT indicators
Presence ofstandards for
technology use
Educationallevel covered
Respondents of studies
Technologiescovered
in studiesType of indicators
Presence ofindicators
addressing equityethics and
investment issues
Presence ofindicators on ICT
integration incurriculumimpact etc
NoneUzbekistan Government Lawon Education
None Primary andsecondaryeducation
Not specified Computer andinternet
Quantitative None
Viet Nam Government
Governmentrsquos goalto ldquouniversalizerdquoeducation
None Primary andsecondary
Not specified Computer andinternet
Quantitative None None
1
1IIIAttachment
Studies on the Use andImpact of ICTin Education
35 35Final Report
Several studies have been conducted on ICT and its use and impact on educationsome of which are included below
This survey on the information and communications technology (ICT) provisions inschools in England was carried out in April 2001 the findings of which were comparedto similar surveys conducted in 1998 1999 and 2000 The surveys collectedinformation on the number and type of computers available in schools expenditurein schools the extent and benefit of the use of ICT across curriculum subjects theuse of internet and other electronic network communication links and teacherusage of computers and their confidence in the use of ICT in the curriculum It is asample survey and the sample is chosen to be representative of different types ofschools throughout the country Some of the findings as categorised are thefollowing
a Computers in schools
average number of computers per school increased steadily in all types ofschools between 1998 and 2001 the increase was noted to be greatbetween 2000 and 2001
b Internet usage and other external electronic communication services
between 1998 and 2001 there was a considerable increase in thepercentage of schools connected to the internet
c Use of ICT in teaching and teacher confidence
in each type of school there was an increase in the percentage of teachersreported to feel confident in the use of ICT in 2001
d Expenditure on ICT
the average expenditure on computers per school increased steadily in allschool types between 1998 and 2001
Source Statistics of EducationSurvey of Information and Communications Technology in Schools 2001National Statistics BulletinDepartment for Education and SkillsIssue No 0901October 2001
The Center for International Development (CID) at Harvard University conducted aresearch which came up with the Network Readiness Index (NRI) a majorinternational assessment of countriesrsquo capacity to exploit the opportunities offeredby ICTs In the development of the NRI data sources fall under two generalcategories First a variety of measures mainly ldquohardrdquo variables and also ldquosoftrdquoones from sources such as the World Bank the International TelecommunicationsUnion Freedom House and the Business Software Alliance were used Seconddata collected from the questionnaire responses of more than 4500 business andgovernment leaders surveyed in 75 countries by the Global Competitiveness Reportrsquos2001 Global Executive Opinion Survey conducted by Harvard University and theWorld Economic Forum were heavily relied upon
The Network Readiness Index is an assessment of a countryrsquos capacity to makeuse of ICT resources It shows how nations are performing with regards to theirparticipation in the Networked World Seventy-five countries were computed NRIs
B The Network Readiness Index Measuring thepreparedness of nations for the networked world
A Survey of information and communicationstechnology in schools 2001 in England
36 Developing and Using Indicators of ICT Use in Education
and the United States of America tops the NRI ranking making it the most highlydeveloped ICT network and it has the greatest potential to exploit networkrsquos capacityIceland Finland Sweden Norway and Netherlands follow USA Another NorthernEuropean country Denmark ranks 7th followed by Singapore in 8th Austria in 9th
and the United Kingdom in the 10th place Among the countries in the region whichwere included are Korea rank number 20 followed by Japan in the 21st placeMalaysia in number 26 Thailand number 43 India number 54 Philippines number58 followed by Indonesia in number 59 Sri Lanka in number 62 China in 64Bangladesh in 73 and Viet Nam in 74
Two components were taken into consideration in the computation of the NRIThese are network use and enabling factors Network use is defined as the measureof the extent of increase in the use of ICT in a specific country This is still narroweddown to five more catagories Internet users per hundred inhabitants cellularsubscribers per hundred inhabitants internet users per host percentage ofcomputers connected to the internet and availability of public access to the internet
Enabling factors is made up of four sub-indices network access network policynetworked society and networked economy Network access includes variablesrelated to the information infrastructure hardware software and support Itmeasures the extent and quality of the network infrastructure and the existence ofequipment programmes and support services that enable ICT use Network policyrefers to the information and communications policy environment and the businessand economic climate It also deals with the levels of competition in thetelecommnications and ICT sectors Networked society measures the quality andextent of use of ICT facilities in the learning process and networked economyassesses the extent of public and private sectors participation and e-governmentare considered in this sub-index
Source httpwwwcidharvardeducrpdfgitrr2002-cho02pdf
This is a national population survey of public and private elementary and secondaryschools conducted by SEAMEO INNOTECH in the Philippines under Project TAOCARES last March 2001 Its main objective was to determine the ICT capabilitiesof schools A total of 45811 schools were given questionnaires with the schoolheads as respondent of which 7937 per cent responded The survey questionnaireconsisted of 42 items mostly focused on the readiness of schools in terms ofinfrastructure hardware software and manpower capabilities on ICT Outputs ofthe survey were sixteen regional profiles on the ICT-preparedness of schools whichincluded data on the availability of electricity access of schools to communicationfacilities presence of computers computer peripherals and other multi-mediaequipment in schools sources of funds to maintain ICT-related operations proficiencyof school staff in the use of computers training received on ICT computer coursesbeing offered in schools and other ICT-related information
Some of the major findings of the survey at the national level are the following
Only 6607 per cent of schools have electrical connections
Only 1330 per cent have landline telephones 290 per cent have fax machinesand 200 per cent have internet connections
5217 schools only or 1428 per cent have computers with the National CapitalRegion having the highest percentage at 8730 per cent
Only 1824 per cent of schools have staff proficient in the use of computers
C Profile on the capabilities of elementary and secondary schools in the Philippines 2000-2001
37 37Final Report
7862 per cent of schools get funding to maintain ICT related operations fromthe PTCA
Only very few schools (1313 per cent) have school heads who have receivedICT training in the past five years
6436 per cent of school heads need training on basic computer literacy
This study was conducted by the New Educational Technologies Foundation Inc anon-profit organisation composed of schools that believe in the capacity of IT toimprove the quality of student learning and efficiency of teaching A total of 794schools participated in the survey with school heads in the public and private schoolsas respondents The questionnaire was divided into two parts the first part askedabout perceptions level of awareness and attitudes regarding the value of computereducation and was answered by users and non-users of computers The secondpart which dealt with the actual use of computers was answered by users onlyAmong the findings are the following
The number of computers owned by a private schools is twice as much aswhat a public school can afford
Computers available in schools are mostly the models AT486
Most computer units in the public elementary schools were acquired throughdonations in the secondary and tertiary schools most computers were acquiredthrough purchase
Computers are mostly used to teach different application programmes
Source The 1996 National Survey on Computer Education New Educational TechnologiesFoundation Inc
D The 1996 national survey on computereducation in the Philippines
In a primary school in Sunnyside Elementary School Pullman Washington studentsare using e-mails web sites videos and video conferencing technology tools todevelop their learning skills Through these mediums the students alongside theirglobal peers identify and share their cultures with one another in new waysTraditionally students learn about the world through books but new technologyallows the students to get in depth information about different cultures throughwriting reading and communicating with their global peers The following are theassessment tools used Assessment rublics designed for specific projects lessonandor classroom experiences standard assessment tools (ie DRA and WrightGroup Reading Assessments) teacher anecdotal notes childrenrsquos ownmetacognitive voices in the process of learning in conference with the teacherand in self-reflection of work and presentations parentsrsquo reports of student learningprogress
Teaching in non-traditional ways can sometimes be a risky business - with all eyesupon the class to see if learning is taking place It has been shown that studentsform teams to read write and communicate using technology at rates that meetand exceed standards for primary classes But along the way the added value oftechnology contributes in areas such as thinking skills social skills engagement inlearning motivation teaching and collaborating as the class sees what is essentialto learn in the context of the real world
Source httpwwwncrelorgengaugeframeworkefpalignefpalisuhtm
E Use of multiple assessment tools
38 Developing and Using Indicators of ICT Use in Education
F Technology A major catalyst for increasing learning by Jody C Isernhagen University of Nebraska-Lincoinby Jody C Isernhagen University of Nebraska-Lincoinby Jody C Isernhagen University of Nebraska-Lincoinby Jody C Isernhagen University of Nebraska-Lincoinby Jody C Isernhagen University of Nebraska-Lincoin TTTTTechnologechnologechnologechnologechnology Horizons in Educay Horizons in Educay Horizons in Educay Horizons in Educay Horizons in Educationtiontiontiontion Journal Online Journal Online Journal Online Journal Online Journal Online August 1999 - FeaAugust 1999 - FeaAugust 1999 - FeaAugust 1999 - FeaAugust 1999 - Featuretureturetureture
A rural public school in Nebraska composed of 1400 students applied for a three-year competitive Excellence in Education Grant in late 1995 Six schooladministrators and 18 staff members designed a plan to restructure their schooland classrooms The staff members defined that the major skills needed by studentsare comprehension reasoning composition and experimentation A computerwas placed in each classroom (80 classrooms) and 27 computers were located inthe elementary Integrated Learning Lab with Computer Curriculum CorporationSuccess Maker Software This software automatically diagnoses and placesstudents on the appropriate skill level while using the computer The computer labwas used by 314 students and 13 teachers in grades 1-3 from January 1996through May 1998 Teachers were trained on the use of ClarisWorks MicrosoftWord E-mail Internet Presentation Stations and the integration technology as atook in teaching and learning Activities of the students involved computer buildingdesigning of web pages to help maintain the schoolrsquos web pages digitizing video topresent to the community creating panoramic views and interactive virtual realityscenes preparing letters of application resumes and cover letters and to searchthe web for jobs With all the activities the teacher served as guides figuring outwith the students how to arrive at a productive presentation
The CAT scores in reading and math for students using an Integrated Learning Labfor 25 years showed a significant difference between the means The scores ofstudents testing below the 50th percentile at grades 1-3 in reading and math increasedsignificantly over time These findings suggest that using an Integrated LearningLab with rural primary age children daily over an extended period of time maypositively impact achievement for students particularly those students functioningbelow the 50th percentile
Source httpwwwthejournalcommagazinevaultarticleprintversioncfmaid=2126
G The impact of ICT on literacy learning in English
This report is the result of a literature review conducted first to identify a number ofstudies that might shed light on the major impact of ICT on literacy learning inEnglish for 5 to 16 year olds and the second to undertake an in-depth review ofthe papers that were identified as being on the impact of networked ICT on literacylearning in English for ages 5 to 16 There were 1871 studies screened following acriteria to identify relevant reports 188 studies were found that met the criteria inthe protocol These studies were then keyworded or indexed and the results filedon an electronic database
Of the 188 studies relevant to the mapping study 16 pertained to the topic of theimpact of networked ICT on literacy learning Data were extracted from these 16studies and were used as basis for an in-depth review Of these half were outcomeevaluations (evaluations of the results of an experiment or innovation) seven wereprocess evaluations (evaluations on how an intervention was delivered rather thanwhether it worked or not) and one was a needs assessment
Results show that as far as the in-depth study on networked ICT goes results areinconclusive Concerning policy and practice the recommendations of this revieware highly tentative and take the form of implications or pointers With regard topolicy they are to focus research funding for large-scale studies to give considerationto the balance of study type expertise in research teams and to give consideration
39 39Final Report
to the fact that the provision of computer hardware and software to schools andthe application of ICT in teaching and learning need to be informed by researchand evaluation
Source httpeppiioeacukEPPEWebhomeaspxpage=reelreview_groupreview_ one_abstractht
H Education Research Fund Effective Integrationof IT in Singapore Schools Pedagogical
and Policy ImplicationsThis is a report on the key findings of a questionnaire survey aimed at identifying thedegree of information technology (IT) integration among Singapore schools Thesurvey is the first part (Phase One) of a larger study funded by the Ministry ofEducation of Singapore aimed to examine and analyze where and how IT is integratedin Singapore schools to develop pupilsrsquo higher order thinking skills A total of 328schools responded to the survey of which 168 are primary schools 144 secondaryschools and 16 junior collegescentralized institutes (JCCs)
Major findings of the questionnaire survey include
Phase I schools in the IT Masterplan have significantly higher pupil and teacheruse of IT greater opportunities for staff development of teachers and moreconducive IT culture than Phase III schools
Independent-autonomous schools have significantly better management of ITresources higher teacher and pupils use of IT greater opportunities for staffdevelopment for teachers and more conducive IT culture than governmentschools
There are no significant differences among the primary schools secondaryschools and JCCs in terms of the management of IT resources pupil andteacher use of IT staff development and school IT culture
The correlations among management of IT resources pupil use of IT teacheruse of IT staff development and IT culture are significant and highly positive
- Contents
-

1
11Section
IntroductionIndicators and Rationale
of Use
In evaluation studies indicators are used as evidence or signs by which we canassess or evaluate materials methods an intervention a programme or a projectIndicators are measuring devices They define concepts in terms of themeasurements and data it is possible to collect and analyse They define whatdata to collect and at what time intervals
To develop good indicators we need first to have a clear view of what we are tryingto achieve and to measure The first requirement for a systematic development ofindicators for Information and Communication Technology (ICT) is to identify theresults objectives outputs and key concepts of the ICT project as part of theevaluation system plan
The basic approach involves four steps
Identify what is to be measured
Develop trial measures
Assess each trial indicator using agreed-on criteria
Select the best indicators for a specific project
Section One
Step Action
Step 1Step 1Step 1Step 1Step 1Identify allconcepts to bemeasuredespecially projectobjectives andoutputs
Review all concepts objectives results and output state-ments to clarify them and reach agreement
Be clear about what type of change is implied (a situationstate condition attitude behaviour)
Clarify whether the outcome sought is an absolute change arelative change or no change
Specify where and when the change is expected (what targetgroup what location and in what time frame) (this identifiesthe appropriate unit of analysis)
Determine the relationship between project activities and theiroutputs or objectives (are these outputs or objectives director indirect)
Step 2Step 2Step 2Step 2Step 2Develop a list ofpossible (trial)indicators
Think of possible alternative indicators for each conceptobjective and output without being too restrictive
Conduct internal brainstorming sessions
Consult stakeholders and other experts
Try to borrow from other projects and studies
Step 3Step 3Step 3Step 3Step 3Assess each trialindicator againstcriteria
Establish an agreed set of criteria for indicators (see Table 2)
Use a scoring scale (1-5) to determine the usefulness of eachtrial indicator (but be flexible and use your own judgment)
Table 1Describes the actionsrequired in each step
Step 4Step 4Step 4Step 4Step 4Select the bestindicators for thisproject
Consider each indicator on its merits against the criteria
Consider the mix of indicators to construct a robust set thatis consistent and complementary in terms of data-collectionmethods and time frames
Avoid having too many indicators (it may indicate that theobjectives and outputs are not clearly defined)
Be prepared to update your indicators - the best indicatorsmay change as projects develop (one common change occursafter using input indicators at first and then realizing that outputindicators were what was needed)
Basic approach to formulating indicators
2 Developing and Using Indicators of ICT Use in Education
Table 2 below summarises the criteria that can be applied in assessing potentialindicators based on the recommendations of the Centre for DevelopmentInformation Evaluation an institute of USAID These criteria are to be used flexiblyFor instance according to the Centre direct measures are not always better thanindirect measures while quantitative measures are not always better than qualitativemeasures
The process of developing indicators involves a combination of activities such asbrainstorming multi-stakeholder discussions and being clear about definitions criteriagoals and priorities More focused and cost-effective monitoring and evaluation ofICT use in education is expected Indicators are based on assumptions aboutwhat is relevant mdash they are expressions of value or of what is desirable Thus it isimportant that researchers and evaluators involve stakeholders in developing theindicators to ensure that the data collected will respond to their information needs
Criterion Description
Direct measure Indicator is intuitively understood (high face validity)
Indicator is a direct measurement rather than a proxy thatdepends on assumptions for its validity
Indicator is supported by a body of research
Objective Indicator is unambiguous about what is being measured
Different people will collect comparable data based on theindicator
Definition remains stable over time so change can be measured
Indicator is unidimensional (measures only one thing at a time)
Indicator can be quantitative or qualitative as long as it is clearlyand consistently defined and interpreted
Adequate Either by itself or with a minimal companion set of indicators theindicator provides reasonable confidence that it accuratelymeasures the attribute
Object is to have as few indicators as possible per attribute (shouldbe three or fewer) - more is not necessarily better
Number of indicators will depend on the complexity of the objector what is being measured
Quantitative Quantitative indicators are more objective than qualitative ones
Qualitative indicators should be adequately specified to be objectiveand consistent
Disaggregated The more disaggregated the indicator the more easily data can bemanipulated to answer questions not anticipated at the outset
Practical Data can be collected at reasonable cost given their utility
Data are available and can be collected at suitable time intervals
Data can be readily collected in various projects for comparison
Reliable Indicator is reliable within the context of the evaluation purposeand resources
Data-collection process is consistent across different time andspace scales using comparable methods and samplingprocedures Indicator is based on representative data
Table 2Criteria for
assessing indicators
1
12Section
Using Indicators toAssess Impact of ICT
in Education
3 3Final Report
Below is an attempt to synthesise several countriesrsquo efforts and initiatives inconducting research to evaluate the use of ICT in education and for some countriesthe development of ICT indicators Among these countries are
Australia Canada CIS and Balkan countriesIndia Indonesia JapanKorea Republic of Malaysia New ZealandPhilippines Singapore SloveniaSouth Africa Thailand United KingdomUnited States Uzbekistan Viet Nam
The development or potential development of indicators in the region follows threepaths
1 Ministries of Education or the Government set up Task Forces or committeesto take charge of developing indicators measuring the use and impact of ICTin education
2 The vision and goals of the ICT programme serve as basis for the formulationof ICT indicators
3 The impact of the use of ICT in education is determined through surveys andresearch and thus serves as basis for the formulation of national indicators
While the government of Korea has ldquoCyber Korea 21rdquo and the ldquoWhite Paperrdquo thegovernment of Japan has ldquoeJapan Priority Programmerdquo and Europe has theldquoeEuroperdquo initiative These programmes are all aimed at improving the ICT sectorand carry with them built-in indicators for measuring the achievement of thesegoals
Today most countries include ICT integration either in their national policies or inlaws pertaining to the education sector In Australia at the federal level theCommonwealth government has set goals for schools in relation to ICTdevelopment The government wants students to leave school as confident creativeand productive users of new technologies particularly ICTs as well as understandingthe impact of those technologies on society (httpwwwcurriculumeduaumceetyanationalgoalsnatgoalshtm) Schools are expected to integrate ICT into theiroperations
In Thailand the national Education Act of 1999 formed the core of educationreform towards ICT use in education as guided by three principal strategies value-added equity and quantum-jump (httpwwwunescoorgbangkokeducationictict_enablingap_policyLearntec-Tongyoopdf) Similarly the Law on Education inUzbekistan outlined the inclusion of ICT in the education sector Meanwhile thePhilippinesrsquo Department of Education has also formulated policies for the use ofICT The same trend is seen in Indonesia Malaysia Uzbekistan Viet Nam andothers where the national government sets goals for ICT integration in education
Within the region the Republic of Korea is the most advanced in terms of indicatordevelopment on the use of ICT in education The Ministry of Education and KoreanEducational Research and Information Service (KERIS mdash httpwwwkerisorkrenglish) have formulated and used a set of indicators categorised into supportinput utilisation or output The support indicators include training hours given toteachers and principals budget allocation the year plan and incentives for teachers
Section Two
Synthesis of country experiences on ICT indicatorsand related issues (Attachment II)
Kinds of indicators developed basedon visions or goals and surveys
4 Developing and Using Indicators of ICT Use in Education
The input indicators consist of the ratio between computers and students Internetconnectivity and speed educational software and the number of applications usedThe utilisation indicators include subjects using multimedia the percentage ofclasses using a Web board or computer labs the percentage of teachers joiningICT associations and discussion forums student usage of computers and usageof the internet Output indicators include teachers and students having an emailaddress a homepage and ICT certificates and students also having completed a32 hours ICT course
In Australia the Ministerial Council of Education Employment Training and YouthAffairs (MYCEETA) is currently looking into the use of performance measures forstudent achievement relating to new technologies Taking the National Goals forSchooling as the starting point the NEPMT commissioned a project in 2000 todevelop key performance measures for monitoring the ICT knowledge and skills ofAustralian school students The outcome of this process was the report MonitoringProgress towards the National Goals for Schooling Information and CommunicationTechnology (ICT) Skills and Knowledge Basically the report describes the contextof learning ICT skills and knowledge as an outcome of schooling identifies anddescribes performance measurement approaches definitions and sources of datacurrently used in relation to schooling research and national and internationalreporting on ICT skills and knowledge evaluates the ICT measures currently in usein the context of the National Goals for Schooling in the 21st Century proposes astrategy for monitoring the profile of ICT skills and the knowledge of school studentsand identifies further work required to establish an operational monitoring programme
There have also been several initiatives undertaken to measure the impact and useof ICT in education in different States of Australia The trends show that theseindicators are increasingly focusing on qualitative indicators measuring teacherand student outcomes For example the University of Sydney looked into whetherstudent-centred learning took place along with student improvement in high-orderthinking skills As far as the teachers are concerned the indicators assess changesin teaching practice and improvement in the ability to use emerging technologiesHowever connectivity remains a strong indicator in Australia focusing on the numberof teachers with a notebook the computer-student ratio bandwidth available inschools and the type of Internet connection
In Malaysia the creation of the Smart School System serves as benchmark for ICTintegration in schools (httpwwwmdccommymscflagshipsshtml) The MalaysianSmart School programme is aimed at reinventing learning institutions in terms ofteaching practices and school management preparing children for the InformationAge Some of the initial proposed indicators by the ICT project are both quantitativeand qualitative They focus on the use of ICT in curriculum in pedagogy inassessment and materials The quantitative indicators include decreased drop-outrates and recorded achievement gains each year among others while the qualitativeindicators include caring and competent teachers and a broad flexible curriculumthat caters to the differing needs and abilities of students
In the Philippines the Senate Committee on Education Arts and Culturecommissioned SEAMEO-INNOTECH to conduct the national survey to profile theICT capabilities of elementary and secondary schools in the Philippines SEAMEO-INNOTECH was responsible for formulating the indicatorsitems on the survey (httpwwwseameo-inotechorgframeshtml) These include the existence of an enablingenvironment the computer skills of school personnel the presence of computersin schools instructional or academic use of computers ICT infrastructure and Internetconnectivity The Department of Science and Technology in collaboration with theDepartment of Education has also conducted a survey not only looking at theinfrastructure and hardware support indicators but also with regard to howcomputers had been used and integrated into the curriculum as well as in teachingand learning
5 5Final Report
In Thailand initial use of indicators through a survey included Internet connectivityin schools the computer-student ratio and usage of ICT in schools and schooladministration and connection to SchoolNet as main issues The annex found atthe end of this document also shows a variety of potential indicators which fallunder their ICT projectrsquos three principlesstrategies namely value-added equityand quantum-jump strategies A committee was formed to concentrate onformulating indicators to measure the impact of ICT use in schools
Uzbekistan through its Ministry of Public Education has carried out monitoring andevaluation through the 14 Provincial Departments of Education and 15 In-serviceTraining Institutes Under these indicators have been examined such as theavailability of computers in schools the number of students using computers thenumber of computer classes integration of ICT in subjects and teacher training Itwas reported that the evaluation of student computer ability and performance isdifficult as different computers are being used throughout the country
In India the ICT programme statement of goals brought about potential indicatorsthat include the presence of MIS and software ICT in textbooks ICT in computersubjects and in-service and pre-service training of teachers
Though Indonesia has not developed its set of indicators its ICT in educationprogramme goals and objectives also imply that the following indicators can bepotentially useful studentrsquos understanding of the benefits of ICTs mdash disadvantagesas well as challenges studentrsquos use of ICT knowledge in acquiring processingarranging distributing and keeping information and studentrsquos application ofknowledge skills and attitudes in designing information technology systems andsolving problems relating to ICT
Similarly while Viet Nam has not developed its indicators its ICT goals imply indicatorsin the following areas ICT as a subject in general education number of trainedteachers and establishment of ICT departments in universities to train teachersprovision of computer labs in schools and the application of ICT in schoolmanagement
In Singapore as the process of IT integration in schools reaches a considerablelevel of maturity the question being asked is How do we integrate IT in schools solearning opportunities are optimised Research undertaken by the National Instituteof Education and Ministry of Education entitled ldquoEffective Integration of IT in SingaporeSchoolsrdquo (httpeduwebnieedusgprojectsITintegration) focused on the generalpedagogical practices and socio-cultural policies of IT integration in Singapore schoolsnot just the innovative and best practices The indicators used included infrastructureand resources school IT culture staff development teacher use and student useThe research sought answers to the following questions or indicators of a qualitativenature
What are the pedagogical practices of teachers and students that promote orhinder the integration of IT
What are the roles of the human participants activities and tools in such anenvironment
How does a change in the curriculum promote a culture that facilitates integrationof IT
How does a change in the mode of assessment affect integration of IT
The UNESCO Institute of Information Technology in Education (httpwwwiiteru)based in Moscow undertook a survey of the use of ICT in education in Baltic andCIS countries making use of the following indicators a) Official documents on ICTusage in education b) ICTs in curricula mdash as a separate subject or to support othersubjects c) Equipment (computer-student ratio computer availability in classroomsmultimedia system and LAN connection) d) Software (percentage of schools withDOS and Windows and using software for teaching subjects and software designed
6 Developing and Using Indicators of ICT Use in Education
by local and foreign experts) e) Global communication means (percentage withoutInternet access with limited Internet access ndash- only e-mail access via dial-up ordedicated line and those with web pages) and f) Personnel development mdashpercentage of elementary school teachers subject teachers and teachers ofInformatics and EI administration who have undertaken the computer literacy coursefor certain hours during a certain time frame and the computer skills of elementaryschool teachers subject teachers and teachers of Informatics and administration
What kinds of changes in knowledge skills and competencies are required fromteachers and students in the use if ICT In order to serve as a basis for developingknowledge skills and competencies in the use of ICT as well as in comparingoutcomes of ICT use against goals set few countries have standards for technologyuse
In Australia however the Victoria government has a curriculum standards framework(CSF) developed by the Victorian Curriculum and Assessment Authority whichidentifies what students should know and be able to do in eight key learning areasfrom preparatory year to year 10 In New South Wales the Government hasforeshadowed the introduction of an external Computer Skills Assessment for allyears 6 and 10 students to determine their knowledge skills and understanding inthe use of ICT Western Australia has a Competency Framework for Teachers andin Queensland these competencies are identified in Minimum Standards forTeachers-Learning Technology (httpeducationqldgovaucurriculumlearningtechnology mst_inthtmlintroduction) Queensland also produced a documentICTs for Learning School Information Kit 2002ndash2003 which details benchmarksestablished around teaching learning and the curriculum learning and developmentICT infrastructure connectivity ICT support and innovation Furthermore thedevelopment of indicators will be based on the following a) definition of contentdomain including functional skills in a cross curricular context manageability in itscomplexity delineates between Year 6 and Year 10 in terms of the curriculumcontext and the hierarchy of skills identified and b) the development of a scale ofcompetence including basic and functional skills as well as complex thinking andfacilitating the reporting of a range of achievement
The United States and Europe utilise a set of standards for the technology use ofstudents teachers and school administrators The International Society for Technologyin Education (ISTE) came up with the National Education Technology Standards(NETS) Project (httpcnetsisteorg) the primary goal of which is to enablestakeholders in PreK-12 education to develop national standards for the educationaluses of technology that will facilitate school learning (see attached for more detailson the ISTE NETS standards)
The fact that the other countries did not indicate any existing standards that canmonitor the use of technology reflects the lack of qualitative indicators Many countriesmerely focus on providing the technology that is making computers and Internetaccess available
In most of the countries researched on the studies have been limited to ICT indicatorsused in the primary and secondary level There are however instances whereother levels are included such as the case of Republic of Korea where universitylevel is included and in Slovenia pre-school In the United States those in physicaleducation and special education subjects in the primary and secondary levels wereexcluded Japan is noteworthy as its ICT policy includes even special schools forthe blind and the disabled Australia incorporates those in non-formal education intheir studies
Standards for technology use
Levels of integration
7 7Final Report
This situation tells us something about the issue of equity in the use of ICT in educationThere are times when the government policy itself can serve as either an aid or abarrier to equity in access
The number of computers or Internet connections in schools dominates statisticsIn fact only six countries specified indicators pertaining to other ICT technologiessuch as telephone lines fax machines LCD projectors and the like These countriesare Australia India New Zealand Republic of Korea Thailand and the Philippines
Perhaps future studies should also look into other types of ICTs in addition tocomputer-based and Internet In doing so there should be a clear definition of whatICT is The following definitions can serve as a guide
Information TInformation TInformation TInformation TInformation Technology (IT)echnology (IT)echnology (IT)echnology (IT)echnology (IT) is the term used to describe the items of equipment(hardware) and computer programmes (software) that allow us to access retrievestore organise manipulate and present information by electronic meansPersonal computers scanners and digital cameras fit into the hardware categoryDatabase storage programmes and multimedia programmes fit into the softwarecategory
Communicat ion technology (CT)Communicat ion technology (CT)Communicat ion technology (CT)Communicat ion technology (CT)Communicat ion technology (CT) is the term used to describetelecommunications equipment through which information can be sought andaccessed for example phones faxes modems and computers
Information literacyInformation literacyInformation literacyInformation literacyInformation literacy is the combination of knowledge understanding skills andattitudes that students need to fully contribute as members of society in theinformation age When students become information literate they develop anability to select interpret evaluate manipulate and present information
Studies on how teachers use ICT are also included in most ICT integrationprogrammes Many looked into how teachers have used ICT in teaching specificsubjects into how they have employed Internet resources in teaching how theyhave used email in communicating with students and other teachers and whetherthey have developed their own homepages In Australia for example teachersmake use of self-paced learning materials on ICT use in CD-format In other countriespreference is given to teacher applicants who are already computer literate suchas in the case of the Philippines In Korea and Australia teachers are provided withPCs These provides an overview of ICT indicators related to teacherrsquos use of ICT
Respondents for the different surveys in the US New Zealand the UK South Africaand Europe usually included teachers Students are included in surveys to determinetheir perceptions towards ICT such as in the UK and South Africa In other casesschool heads are taken as respondents such as in the Philippines and New ZealandIt was not clear from the results in other countries such as Canada Korea Japanand Slovenia who their respondents were
While some countries use qualitative in addition to quantitative indicators their useis obviously limited Quantitative data usually includes ICT infrastructure andconnectivity consisting of hardware and the physical networks that connect thecomputers locally and globally
Common indicators used for measuring or determining ICT infrastructure include
ICT infrastructure hardware and connectivity
Teacherrsquos use of ICT
Targets of indicators surveys
Types of indicators
8 Developing and Using Indicators of ICT Use in Education
Availability of computer hardware ratios of computerstudent computerclassroom computersteacher type of computers (stand alone multimedia innetwork)
Availability of connectivity and bandwidth of the computers Type of bandwidthfor connections includes high-speed broadband wireless
Quantitative data can be collected from indicators that will provide an overall view ofinfrastructure support and ICT presentation in schools However it is equally importantto examine indicators that will show how ICTs have been used not only as a basicoperational tool but also as a communications tool which promotes the developmentof creativity interactivity collaborative learning critical thinking and problem-solving
There are countries that are already attempting to include attainment and ICTimpact in indicators
Canada included ldquoobstacles to fuller use of information technologiesrdquo in its list ofindicators (httpwwwcmeccastatspceip1999Indicatorsiteenglishpagespage19ehtml) In Europe ldquoteacher confidence in the use of ICT change in teachingmethods and desirable ICT skillsrdquo is assessed (httpwwweurydiceorgDocumentsTicBIenFrameSethtm)
In New Zealand ldquoobstacles faced by teachers in using ICT factors that encourageuse of ICT studentrsquos positive views about technology activities in schoolrdquo are amongthe qualitative indicators
South Africa (httpeducationpwvgovzateli2researchICT20auditICTaduithtm)attempts to measure practical foundational and reflexive competencies of educatorsalong with how well students enjoy ICT-related activities and learnerrsquos perception ofhow the use of computers improves learning and attitudes
Meanwhile the UK (httpwwwdfesgovukstatisticsDBSBUb0296) looks atteacher confidence in ICT use and the benefits of ICT in subjects while in the USmost qualitative indicators pertain to the teacherrsquos perceived value of internet userelative to the teacherrsquos educational background school level taught location ofaccess etc
The Republic of Korea includes output indicators teachers and students now havingemail addresses and a homepage to deliver information and exchange school workand ideas as well as more participation in ICT extra curricular activities (httpwwwicce2001orgcdpdfp12 KR115pdf)
Research in Japan the Philippines Slovenia and other countries show that thesecountries are still concentrating on providing ICT infrastructure that is making thetechnology available in their respective countries rather than measuring impactand effectiveness
Qualitative indicators mentioned in the research include
How much students think they have improved Change in teaching methods Desirable ICT skills Factors that encourage telecommunications use Students who had positive views about technology activities in schools Teachers agreeing that telecommunications technologies can enhance learning
and teaching How much learners think they have improved in various activities Teacher confidence in the use of ICT Development of practical foundational and reflexive competencies Impact of computers on educators and learners Barriers to computer related activities
Some indicators appear to be unique or were only mentioned for some countries
In Europe for example ICT indicators include the ICT policy and strategy of eachcountry in the CIS and Balkan study looking at Denmark Sweden Finland Norwayand the UK These indicators measure objectives of each country in national ICTprojects along with the schedule of implementation
9 9Final Report
In the Republic of Korea the establishment of an education network (KoreaEducation Network) serves as one of the ICT indicators for higher education Koreaalso uses the establishment of a networked research system (Research InformationService System) for higher education as another indicator
The establishment of a network can be considered a quantitative indicator in thesense that it is a physical phenomenon where hardware or portalsplatforms areprovided for networking in a digital form to take place However networking canalso be a qualitative indicator if the focus is on developing competence indisseminating knowledge and information quickly and to large numbers of peopleThe level or quality of networking among organisations can also be used as aqualitative indicator
Furthermore most of the countries give themselves a deadline or a yearlyachievement target For example in the Republic of Korea the targets for theyear 2000 are to provide PCs and other infrastructure to schools for 2002 theestablishment of a Nationwide Education Administration Information System andfor 2005 the setting up of the Integrated Human Resources Information Network
The use of ICT in the school system in the Asia-Pacific Region as in the otherRegions of the world is widespread and continuously growing Many believe thatICT will empower teachers transforming teaching and learning processes frombeing highly teacher-dominated to student-centered Arguably the quality of studentlearning will improve tremendously as use of ICT will create opportunities for studentto develop their creativity problem-solving abilities and other higher-order thinkingskills
It appears though that while ICT has revolutionised business industry andentertainment indicators to prove that it has had the same effect on studentoutcomes are lacking as yet Moreover ICT has brought with it its own problemssuch as the oft-mentioned ldquodigital dividerdquo exacerbating the problem of access toICT between rich and poor male and female and between and among teachersand school administrators Moreover as countries continue to invest in ICT for usein education drawing financial resources from a variety of sources including theprivate sector and bilateral funding agencies there is even greater need forperformance indicators to monitor the use and effects of ICT demonstratingaccountability to these various funding sources and to the public
While these problems are known to our policy makers and educators informationon the extent of these problems remains scant due to lack or absence of monitoringand evaluation systems concerning the use of ICT in schools and its impact onteaching and learning There is an urgent need therefore for a monitoring andevaluation (M and E) system if current efforts to make ICT use an integral part ofthe education system are to succeed Such M and E systems should start withformulating a set of indicators of ICT use and impact in education
This effort is not new in other parts of the world such as in the USA Europe theUK Canada Australia New Zealand and the like (A listing of ICT indicatorsdeveloped in these countries is given as Appendix I to this paper) However in mostof the Asia-Pacific countries there has been little systematic work in the use of ICTindicators in the field of education except that of the Republic of Korea and soonAustralia
Given that Asia-Pacific countries differ widely in regard to the scope and variety ofuse of ICT in education it would be unrealistic and inappropriate to attempt toformulate a uniform set of indicators that can be used to frame data collection forICT in education projects Rather it is better to arrive at a consensus on commoncore indicators that can be used regardless of the ICT utilisation stage which acountry has reached Important criteria to be observed in formulating these coreindicators would include local relevance reliability and robustness when these areused for comparison of one ICT project or country with another
10 Developing and Using Indicators of ICT Use in Education
Assessment and evaluation methodsIn most of the studies reviewed traditional or standard assessment methods wereused Assessment rubrics were designed for specific projects lessons andorclassroom experiences in addition to standard assessment tools except in a primaryschool in Sunnyside Elementary School Putnam Washington In this study parentswere also involved in the assessment process preparing reports of their childrenrsquosprogress
The ways that technologies are being used in schools change the teacherrsquos rolefrom that of technology-as-teacher to technology-as-partner in the learning processAs students increasingly use technologies as learning tools they will producetechnology-based artifacts - student-constructed knowledge bases Theseknowledge bases are rich multi-modal indicators of what students have learnedMoreover as learning becomes more meaningful so it becomes more authenticand more complex Thus authentic assessment and other non-standard assessmentmethods such as rubrics need to be designed to capture meaningful learningexperiences of students brought about by these new technologies
Unfortunately not too many teachers have acquired the competencies to conductauthentic assessments for student learning using learning portfolios and rubrics forperformance evaluation The need for such learning assessment competencybecomes even more urgent as educators move away from the behaviourist andobjectivist perspective of learning to that of a more constructivist view
Using the type of indicators used by countries as basis for categorising them basedon the extent and impact of ICT and using the input-process-output model theresults would be
Level 1 - Includes input indicators only Level 2 - Includes input and process indicators
Level 3 - Includes input process and output indicators
x
x
x
x
x
x
x
x
x
x
x
x
x
x
x
x
x
x
Qualitative
Type of indicator
x
x
x
x
x
x
x
x
Australia
CIS and Balkan countries
Canada
Europe (Denmark SwedenFinland Norway UK)
India
Indonesia
Japan
Korea Republic of
Malaysia
New Zealand
Philippines
Slovenia
South Africa
Thailand
UK
USA
Uzbekistan
Viet Nam
Country LevelQuantitative
3
2
3
3
2
1
2
3
2
2
1
1
3
2
3
3
2
1
1
13Section
Methods ofCollecting Indicators
11 11Final Report
There are various ways of collecting data based on predetermined ICT indicatorsOf course the most popular one is the use of survey questionnaires farmed out toa representative sample of schools school heads and teachers either on a regularor one off basis Clearly those done more regularly can track the behaviour of theindicators over time Weaknesses in ICT implementation can be remedied in duecourse new strategies in ICT implementation can be worked out and carried outthus increasing the probability of success of ICT programmes and projects Theone-shot survey is more appropriate for a summative kind of assessment in whichwe are more interested in finding out for instance the longer-term impact of ICTuse
Where the telephone system in a particular country is well developed enough thatmost homes have access and long distance calls are cheap the telephone interviewis a more cost-efficient method of data collection For example EURYDICE BasicIndicators on the Incorporation of ICT into European Education Systems Project((httpwwweurydiceorgDocumentsTicBIenFrameSethtm) conductedEurobarometer surveys over the telephone in 2001 covering a representative sampleof school heads and teachers in each EU country The questions put to the schoolheads were mainly concerned with their school ICT equipment and facilities whilethose asked of the teachers included the use of computers and the Internet withtheir pupils (time spent using them frequency of their use reasons for not usingthem etc) and how ICT had changed the way they taught Slovenia also made useof telephone interviewing as a method of data collection augmented by publicopinion surveys in person on a one-to-one basis (httpwwwrisorg) Data oninformation-telecommunication infrastructure such as telephone cellular phoneand ISDN connections number of Internet providers backbone providers and thelike were gathered from the telecommunication companies themselves (Details ofindicators used in the above surveys are in Appendix I)
In Australia the national monitoring of ICT skills and knowledge of students in Year6 (aged 10-12 years) and Year 10 (aged 14-16 years) will be done by means ofthree-yearly sample assessments commencing in 2005 Student outcomeinformation is the focus of the reporting agenda Assessment techniques should beinnovative and model good assessment practice and wherever possible assessmentmaterials developed for national sample assessments should be available for use bysystems and schools Collection and use of data for national purposes will in allrespects conform to the guidelines provided in the report Data Principles and Protocolsagreed by the PMRT and where performance in different years in a particular domainis the focus of measurement a single domain scale should underpin measurementsof student achievement The assessment methods will include a mix of tests onpaper and on line and performance assessment tasks with teacher assessment
The study by Singapore to measure the effective integration of ICT in schoolsindicated that to gather accounts by various groups and individuals in the learningenvironment both qualitative and quantitative methods were drawn upon such asobservations of IT and non-IT based lessons face-to-face interviews with principalsand IT co-ordinators group interviews with students and teachers questionnairesfor teachers and students and samples of studentsrsquo work
Survey questionnaire
Telephone interview
3 -yearly sample assessment
12 Developing and Using Indicators of ICT Use in Education
Where there is a saturation of Internet connectivity in the country that is most ofthe homes schools and offices are connected use of questionnaires posted on thewebsite of the institutionagency conducting the surveys can be an efficient methodof collecting data on indicators Furthermore communication by emails betweenthe respondent schools school heads teachers and even students will facilitatedata gathering Data entered into the web-based questionnaire can be automaticallyuploaded to the institutionagencyrsquos computer server located thousands of milesaway
Notably the UNESCO IITE survey met with some difficulties because the collectionof data depended primarily on the efforts and contributions of heads of departmentssenior specialists and the staff of national Centres of Informational Technologies inEducation or Centres of Teacher Training Retraining and Educational Support whowere not given any financial support agreeing to work due to an official memorandumThus many of the results were generated from expertsrsquo estimates rather thandirect collection of data from teachers students and schools
EnGuage a new Web-based framework developed by NCREL in the USA (httpwwwncrelorgengauge) is a response concern regarding the ever-increasinginvestment in educational technology by providing answers to three significantquestions to wit What value does technology bring to the schools How can ourschools ensure a return on these investments And why does technology work insome schools and not in others EnGuage is a tool set designed to help schoolsand school districts use technology effectively for learning teaching and managing
The School Technology and Readiness (STAR) Chart (httpww2isteorgstarchart) provides another web-based self-evaluation tool providing schools withthe information they need to better integrate technology With STAR Chart onlinemultiple-choice questionnaire can be completed that will provide instant feedbackThe Chart identifies and defines four school profiles ranging from the ldquoEarly Techrdquoschool with little or no technology to the ldquoTarget Techrdquo school that provides a modelfor the integration and innovative use of educational technology It is not meant tobe a measure of any particular schoolrsquos technology and readiness but rather isintended to serve as a benchmark against which every school can assess andtrack its own progress
The STAR Chart can help any school or community answer three criticalquestions
Is your school using technology effectively to ensure the best possible teachingand learning
What is your schoolrsquos current education technology profile
What areas should your school focus on to improve its level of technologyintegration
The method of data collection for ICT indicators will then vary from country tocountry depending on the spread of telecommunication use such as the telephoneand the Internet It will also depend on whether the existing M and E systems canstill accommodate additional data collection tasks to monitor and evaluate ICTimpact in schools Additional variables based on ICT indicators can be integratedinto the existing database system
Internet-based surveys
Web-based self-evaluation tool
1
14Section
Various Software orDatabase Systems for
Storing Indicators
13 13Final Report
Below are a few of the software or database systems worth considering in developingthe databases for ICT indicators
Spreadsheet programmes such as IBM Lotus 123 and MS Excel
Statistical programmes such as Statistical Package for the Social Sciences(SPSS)
Customized database programmes using MS Access (for small databases)
SQL Server MAGIC (for big databases)
For data-based driven web applications (Visual Interdev Java Visual Basic) thereis anoother software available in the market which can be used to create the ICTdatabases Technical staff will be able to assist in determining the most feasible anduser-friendly software adequate to answer specific needs
1
1IAttachment
ICT IndicatorsUsed in
Different Countries
15 15Final Report
Government What students should know and be able to do at a certain level
Connectivity Number of teachers with notebook Computer student ratio Bandwidth available in schools Type of internet connection
Changes in studentperformances afterintegrating ICT intoeducation
Increase in student engagement enthusiasm and motivation If student-centred learning took place Improvement in studentsrsquo high-order thinking skills improved Occurrence of changes in teaching practices Improvement in the ability to use emerging technologies
University of Sydney
ICT Indicators in Baltic and CIS Countries
Hardware equipment Computer classroom availability in educational institutions (EI) The average number of students per one computer in EI equipped
with computer classrooms Percentage of IBM- and Apple-compatible computers in total
number of EI computers Percentage of EI equipped with one or more multimedia system in
total EI equipped with computer classroom number Percentage of EI equipped with local network to total EI equipped
with computer classrooms number
Software Percentage of computers with installed OS DOSTM to total numberof computers in computer classes
Percentage of computers with OS WindowsTM of Apple Macintoshto total computer number in computer classes
Per cent of computers with other OS to total computer number incomputer classes
Percentage of EI with any educational software for teaching thecorresponding subjects to total EI number with computer classes1 Elementary School subjects2 Science subjects3 Humanities4 Informatics or information technologies
Percentage of educational software designed by the specialistswithin the country to total number of educational software usedin EI for teaching of the corresponding subject curriculum(elementary school science subjects humanities informationsinformation technologies)
Percentage of educational software designed by foreign specialiststo total number of educational software used in EI for teaching ofthe corresponding curriculum (elementary school science subjectshumanities informaticsinformation technologies
Components of ICT Indicators
UNESCO Institute ofInformationTechnology inEducation
Official documents Official documents in ITICTs in secondary education Official documents in ITICTs in secondary education currently
in force
ICT in curricula Available state curriculum on informatics andor InformationTechnologies
Informatics andor Information Technologies as a separate subject ICT usage to support other subjects implied in curricula on these
subjects
Global communication Percentage of EI without internet access Percentage of EI with limited internet access - only e-mail Percentage of EI with access via dial-up channel Percentage of EI with access via dedicated line Percentage of EI with own web-pages
ICT Indicators in AustraliaAgency responsiblefor data gathering ICT indicators Components of ICT indicators
Agency responsiblefor data gathering ICT indicators Components of ICT indicators
16 Developing and Using Indicators of ICT Use in Education
Personnel development Percentage of elementary school teachers subject teachers(except teachers of Informatics andor Information Technologies)teachers of informatics and EI administration who haveundertaken the computer literacy course from 1 September 1999until present time1 Less than 50 hours (Index 1)2 50-100 hours (Index 2)3 Over 100 hours (Index 3)
Computer skills of elementary school teachers subject teachersand teachers of Informatics and administration1 Elementary computer literacy2 Proficiency in ICT field
ICT Indicators in Baltic and CIS Countries (contrsquod)Agency responsiblefor data gathering ICT indicators Components of ICT indicators
ICT Indicators in Canada
Pan-CanadianEducation IndicatorsProgramme (PCEIP)
The pupil-computer ratio is a proxy measure of the access of availabilityof computer to students in schools Only computers used for educationalpurposes are included in the ratio
Internet connectivity This is a measure of the percentage of students attending schools thatwere connected to the internet for educational purposes at the time ofthe survey Schools that were connected for administrative purposesonly were excluded
Internet activities ofstudents
School ICT co-ordinators were questioned about instructional activitiesinvolving the use of the internet They were asked to identify typicalactivities that students at certain grade levels would have engaged in bythe end of the school year
Obstacles to fulleruse of informationand communicationstechnologies
Principals were asked to identify the major barriers hindering theachievement of their schoolrsquos computer-related goals for students Inthis section items are presented that are identified as major obstaclesby principals of schools representing at least 50 per cent of enrolmentsat each of the three levels of schools The obstacles noted have beengrouped into three categories those relating to hardware and softwarethose relating to instruction and those relating to the training of teachers
Agency responsiblefor data gathering
ICT indicators Components of ICT indicators
ICT Indicators Used in Europe (Denmark Sweden Finland Norway and UK)
Information SocietyTechnologyProgramme fundedby the EuropeanCommunity
Policy and strategy Countries with an official policy on the use of ICT
Schedule for implementing national ICT education projects
Responsibility for the purchase and maintenance of hardware
Objectives in national ICT projects
Inclusion of ICT in the national curriculum
Schools with ICT implementation plan (simple)
Schools with ICT implementation plan (detailed)
Approaches of ICT defined in the curriculum
Objectives defined in the curriculum for the teaching or use of ICT
Schools with autonomous decision power
Agency responsiblefor data gathering ICT indicators Components of ICT indicators
Pupil-computerratio
17 17Final Report
Use and access Pupils and teachers with a personal e-mail address
Use of ICT in areas of the curriculum
Use of external electronic communication services
Teachers use the internet for non-computing teaching
Internet use in teaching
Teachers opinion about the internet as a tool
Pupils access to the internet
Teachers access to computer and internet at home
Who pays teachers home access
Teachers who connect with other schools via the internet
Competencies New ICT and media students in percentages of all students
New ICT and media students by level of education
Qualifications and degrees in information technology and mediastudies
Population with a degree of qualification in ICT and media studies byfield of study and level of education
Hoursyears spent to pedagogical IT guidance
Hoursyears spent to technical IT guidance
Teachers confidence in the use of ICT
Students and teachers knowledge regarding ICT
Specialist ICT teachers
ICT courses during initial training of general class teachers
ICT trained teachers
Change in teaching methods
Average expenditure on ICT in schools
Sources of funding for ICT in schools
Total expenditures on ICT in schools
Distribution of the specific budget between the purchase ofequipment and expenditure on human resources
Number of computers per 100 pupils
Number and quality of computers available for administration pupilsand teachers
Expected increase in the number of computers
Computers with access to school net andor internet
Quality of internet access in schools
Placement of the computers
Schools with own website
Schools with on-line services
Schools with intranet website e-mail
Economy andinfrastructure
ICT Indicators Used in Europe (Denmark Sweden Finland Norway and UK) (contrsquod)Agency responsiblefor data gathering ICT indicators Components of ICT indicators
18 Developing and Using Indicators of ICT Use in Education
Inclusion of ICT in the curriculum
Percentage of teachers who use computers andor internet in theclassroom
Approaches to ICT defined in the curriculum
Objectives defined in the curriculum for the teachingor the use of ICT
Inclusion of ICT in the initial training of all teachers (except specialistICT teachers)
Inclusion of ICT in the curriculum
Percentage of teachers who use computers andor internet in theclassroom
Reasons given for not using internet with pupils
Approaches to ICT defined in the curriculum
Annual number of hours recommended for teaching ICT as a subjectin its own right
Objectives defined in the curriculum for the teaching or the use ofICT
Inclusion of ICT in the initial training of all teachers (except specialistICT teachers)
Percentage share of compulsory teaching related to ICT and thenumber of hours devoted to such teaching in the initial training of allteachers (except specialist ICT teachers)
Desirable ICT skills according to official recommendations for theinitial training of all teachers (except specialist ICT teachers)
Secondary (lowerand uppersecondaryeducation)
Both Number of pupils per computer and number of pupils per computerwith an internet connection (primary and secondary education)
Responsibility for the purchase and maintenance of hardware(primary and secondary education)
Distribution of the special budget between the purchase ofequipment and expenditure on human resources (primary educationgeneral lower secondary education general upper secondaryeducation)
Average periods during which primary school teachers usecomputers (with or without internet connection) in the classroomhours per week
Specialist ICT teachers
Percentages of primary and secondary school teachers in Europewho have received official training in the use of computers andorinternet in their teaching
ICT Indicators Used in IndiaAgency responsiblefor data gathering
ICT indicators Components of ICT indicators
Ministry of HumanResourceDevelopment
Presence of MIS
Presence of software
ICT in textbooks
ICT in computer subjects
In-serv ice and pre-service training of teachers
Primary
ICT Indicators Used in EuropeAgency responsiblefor data gathering ICT indicators Components of ICT indicators
19 19Final Report
Student understanding of ICTrsquos benefits disadvantages as well aschallenges in information technology
Studentrsquos use of ICT knowledge in getting processing arrangingdistributing and keeping information
Governmentrsquos goalsand objectives
ICT Indicators Used in IndonesiaAgency responsiblefor data gathering ICT indicators Components of ICT indicators
Student application of knowledge skills and attitudes in designinginformation technology systems solving problems relating to ICT
Includes public halls libraries
Training hours of the principal Training hours of teachers implemented by the school itself Training hours on ICT use in education per teacher Percentage of operating budget vis-a-vis the total budget Percentage of teachers in the department of ICT Whether an ICT yearly plan exists or not Whether an incentive system for ICT personnel exists or not
ICT Indicators Used in Republic of Korea
Support
Agency responsiblefor data gathering ICT indicators Components of ICT indicators
bull Ministry ofEducation
bull KoreanEducationalResearch andInformationService (KERIS)
Inputs (infrastructurehardware software)
Number of students per computer Number of computers per teacher Percentage of computers less than 3 years old Percentage of computers connected to internet Speed of internet connection Number of educational software (CD-titles) Percentage of computers equipped with 5 basic applications
Number of students per PC
Internet access of students
Number of teachers inpublic schools who canoperate PCs
Number of teachers at elementary lower and uppersecondary schools and special education schools
Number of humanresources with IT-relatedmasterrsquos and doctoraldegrees
Number who graduated from masterrsquos course
Number who graduated from doctoral course
Number of foreign nationalswith the status of residenceldquoEngineerrdquo and number ofnationals entering Japanwith the status of residenceldquoEngineerrdquo
Number of registered foreign nationals
Number of foreign nationals entering Japan
Ensuring security andreliability
IT security measures (information security policies presenceof firewalls and back-up systems)
Number of public schoolswith internet access andcomputers
In households
In SMEs (companies with five employees or more)
In corporate (companies with 300 employees or more)
Number of internet users
ICT Indicators Used in JapanAgency responsiblefor data gathering ICT indicators Components of ICT indicators
e-Japan PriorityPolicy Programme
Public facilities withinternet access
20 Developing and Using Indicators of ICT Use in Education
Teachers
Percentage of subjects utilising multimedia materials for teachingand learning through WWW
Percentage of classes using web-board
Percentage of subjects using web-board
Percentage of teachers participating in an association regardingICT use
Percentage of subjects using computer lab
Percentage of functions of the Information System being used
Whether to use electronic decision system
Number of posting written for and by parents
Students
Hours of use of computer per student
Percentage of students participating in ICT special programmesafter school (Elementary)
Whether to teach on computer (Secondary)
Percentage of subjects collecting assignments through web board
Number of search library DB per students
Percentage of student-governing community utilising webenvironment
Whether a programme regarding internet ethics exists
Number of web communities per class
Internet
Usage of internet
Number of access to school website per week
How often school websites are revised
Output Teachers
Percentage of teachers having e-mail address
Percentage of teachers having homepage
Percentage of teachers having ICT certificates
Percentage of teachers participating in educational SW contests
Students
Percentage of students having e-mail address
Percentage of students having homepage
Percentage of students having ICT certificates
Percentage of students participating in educational SW contests
Percentage of students completing the ICT course (32 hours)
Utilization
Agency responsiblefor data gathering ICT indicators Components of ICT indicators
ICT Indicators Used in Republic of Korea (contrsquod)
21 21Final Report
Malaysian smart schoolsuse of technology forinformation processing andas a productivity tool toenhance professionaldevelopment and toautomate instruction
Malaysian government(Ministry of Education)
ICT in curriculum
ICT in pedagogy
ICT in assessment
ICT in materials
ICT Indicators Used in MalaysiaAgency responsiblefor data gathering ICT indicators Components of ICT indicators
How schools teachersand students usetelecommunicationstechnologies
Number of teachers taking in-service training using a tele-learningapproach
Obstacles faced by teachers in using telecommunicationstechnologies
Factors that encouraged telecommunications technology use
Percentage of teachers agreeing that telecommunicationstechnology can enhance learning and teaching
Percentage of students who had positive views about technologyactivities in school
Telecommunicationsequipment
Paper by David HarrisNZCER
Percentage of schools with telephone lines
Percentage of schools with classrooms that has telephone lines
Percentage of schools with fax machines
Percentage of schools with computers that has access to amodem
ICT Indicators Used in New ZealandAgency responsiblefor data gathering ICT indicators Components of ICT indicators
Availability of publiccommercial utilities andservices
Project TAO Cares(computer-assistedreforms for schools)senate committee oneducation arts andculture
Government throughthe Department ofEducation
Percentage of schools with electricity
Percentage of schools whose electricity is available for 24 hoursper day
Percentage of schools whose electricity is available year-round
Percentage of schools with ICT equipment
Percentage of schools where publiccommercial utilities andservices are available
Percentage of schools located in communities where publiccommercial utilities and services are available
ICT Indicators Used in The PhilippinesAgency responsiblefor data gathering ICT indicators Components of ICT indicators
Computer skills ofschool personnel
Percentage of schools staff who has computer skills
How school staff acquired computers skills
Percentage of school staff with expertise in using differentcomputer software
22 Developing and Using Indicators of ICT Use in Education
How were computers in the schools acquired
Location of computers in the school
Modes of set-up of the schools computers
Purposes for which computers are used
Operating system used
Software used for teaching and learning
How school acquired software programmes
Percentage of schools with internet access
Source of funds to pay for internet access
Internet connection arrangement (eg dial-up dedicated dial-upor leased line connection)
Who are given access to the internet (eg students principaladministrative staff etc)
Financial capacity to have internet access
How often computers are upgraded
Availability of funds for computer maintenance
Instructionalacademicuse of computers
Percentage of schools offering computer literacy subjects
How computer literacy subjects are offered (eg as part of regularcurriculum integrated with other subjects etc)
School personnel handling computer courses in the school
Purposes for which computers are used as part of instruction
Fees collected for computer use internet access
Computer use by non-formal education learners
Presence of computersin schools
ICT Indicators Used in The Philippines (contrsquod)Agency responsiblefor data gathering ICT indicators Components of ICT indicators
ICT Indicators Used in Slovenia
Information-telecommunicationsinfrastructure
Research on internetin Slovenia
Agency responsiblefor data gathering ICT indicators Components of ICT indicators
Telecommunication No of telephone connections No of telephone connections per 100 residents No of cellular phone connections NMT GSM No of cellular phone connections per 100 residents No of ISDN connections
Internet
No of internet providers No of backbone providers No of computers connected to the internet per 100000
residents No of wwwdomainsi web sites
Schools and relatedinstitutions
Internet
Schools with internet access (secondary schools primaryschools youth hostels kindergartens)
Pupils with internet access Schools with homepage
Computers networks and ISDN
Average number of computers per 100 employees Average number of computers per 100 pupils Share of schools with computers connected to network and
ISDN
23 23Final Report
ICT Indicators Used in Africa
Impact of ICT on qualityteaching and learning
School net educatordevelopmentprogramme
Agency responsiblefor data gathering ICT indicators Components of ICT indicators
1 ICT Skills Level of educator - includes assessment on skills suchas basic word processing e-mail and electronic informationaccessing skills
2 Integration Level - to be measured using the following guidelines
Educatorsrsquo Competence with ICT
Educators should be able to draw on generic ICT applications inorder to prepare for teaching
Educators should be generally competent in those ICTresources that could most benefit their teaching and the learnersrsquolearning
Educators should understand how to access and use electronicinformation and communications resources such as the internetfor the benefit of both the educator and the learner
Educators should know how to use ICT to improve theirprofessional and administrative efficiency
Educators should know how to encourage the development oflearnersrsquo ICT skills within the context of the lessons being taught
Integration of ICT with the curriculum
Educators should understand the key learning strategies thatinfluence the use of ICT to support teaching and learning
Educators should know how to organise their class andclassroom when making use of ICT to achieve lesson outcomes
Educators should understand the role of computer literacy withparticular reference to the educational use of computers as atool in a diverse and developing country like South Africa
Educators should know and understand the characteristics ofinformation particularly its role in learning and its ethical use andits credibility
Educators should be aware of current health legal and ethicalissues regarding the use of ICT in the classroom
Educators should understand how to assess the contributionof ICT to the process of learning
An evaluation instrument is created for assessments in this category
3 The Professional Growth of the educator - This is measuredinitially by conducting pre-course baseline studies in which theeducator reflects on existing practice and perceivedshortcomings This process begins with a workshop and isfurther pursued by the mentor in the follow-up period Progressevaluation of the impact of ICT and the development programmeon the educator as a professional is monitored by promptingfrom the mentor and the educator recording entries in anelectronic journal
4 Whole school levels - Whole school ICT use is measured in anumber of ways Staff ICT and integration-related proficienciesare measured individually or on a departmental or whole-staffbasis This is the choice of the school An instrument is used tomeasure the instructional use of technology in a school Thisinstrument categorises 6 levels of computer efficiency rangingfrom non-use to refinement The emphasis in this framework isgiven to the degree to which technology is used to support aconstructivist orientation to classroom pedagogy
24 Developing and Using Indicators of ICT Use in Education
Quantum jumpstrategy
All teachers and students to be IT and internet-literate by theyear 2002
Production of 250 titles of academic software and contentsannually and provision of funding worth 500 million Baht perannum to various communities for content development as wellas provide budget for localizing 2000 titles of useful foreigncontent
PC density target by the year 2006 as follows
1 20 for secondary school level
1 40 for primary school level
Investment in the production of IT and network equipment foruse in the education sector including software and multimedia
Provision of IT for education and professional development tothe under-privileged the disabled and common people seekinglifelong education
Provision of adequate radio frequencies for the education sector
Investment in research and development in IT for education atleast 400 million Baht per year
Establishment of monitoring and evaluating procedures andprotocols
Establishment of a National Institute of Technology for Education
ICT Indicators Used in Thailand
Value-added strategyGovernment ofThailand
Agency responsiblefor data gathering
ICT indicators Components of ICT indicators
Provision of software content and necessary supporting ITcurriculum via searching localizing producing to make betteruse of existing hardware in schools
Training of teachers to gain literacy in computer and internetuses
Establishment of maintenance programme for the existinghardware
Enhancement of the capabilities of organizations that can providesupport and services to schools by forming network of agenciesand individuals
Monitoring and evaluation of the use of technology for educationand collect data for planning purpose
Equity strategy Provision of a set of minimum requirement equipment andfacilities to needy schools including electricity 3 telephone lines5 computer sets 1 printer 3 sets of television 5 sets of radio 3internet accounts 100 hours per month via SchoolNetprogramme
Provision of a ldquoDigital Learning Centrerdquo (DLC) to the community
Training of teachers and trainers in IT and internet literacy
25 25Final Report
ICT Indicators Used in UK
Computers in schoolsNational Grid forLearning (NGFL)
Agency responsiblefor data gathering ICT indicators Components of ICT indicators
Computerpupil ratio
Average number of computers per school
Type age and multimedia capability of computers
Average number of computers used for management andadministrative purposes
Average number of computers linked to an international schoolnetwork
Different types of computer peripherals available
Internet and electronic Connectivity to the net
Number of schools connected to the internet at broadband level
Percentage and number of schools who have their own website
At least one networked computer with internet access in eachschooll for management and administration
E-mail access
Teacher confidence anduse of ICT in teaching
Teacher confidence
Use of ICT in subjects
Benefit of ICT in subject
Expenditure on ICT Estimated total
Average per school
Average per pupil
ICT Indicators Used in the United States of America
Internet use by teachers
Agency responsiblefor data gathering ICT indicators Components of ICT indicators
Teaching learning andcomputing A nationalsurvey of schools andteachers Centre forResearch onInformationTechnology andOrganizations
Public schools with internet access
Internet connections in classrooms of teachers
Teacherrsquos internet access at home and in their classroom
How often teachers use information from internet in lessons
Teacherrsquos use of electronic mail to communicate with teachers inother schools
Per cent of teachers having their students use different types ofsoftware
Student use of web browser software in lessons
Internet use for beyond classroom student projects andpublishing
Teacherrsquos perceived value of having a computer with electronicmail on their own desk
Teacherrsquos perceived value of classroom world wide web access
Internet use from various locations (home school etc)
Internet use by subject matter taught
Internet use by school level taught
Ability to use web search engine
26 Developing and Using Indicators of ICT Use in Education
Teacher and teacherdirected student useof computers andsoftware
Teacher directed student use of computers
1 Access to classroom computers
Computer-student ratios on classrooms
Number of classroom computers
Computer access in lab and media centres versus classrooms
2 Computer platforms used by student
Extent and variety of software used and teachers objectives for use
1 Type of software used
2 Software that teachers judge as most valuable for students
3 Objectives for computer use
4 Student computer use for school work on their own time
Teacher computer extertise and professional use
1 Use of software in profession
2 Expertise with computers
Technology support Average weekly hours spent by technology co-ordinator ondesignated job tasks
Average minutes spent per week by technology co-ordinatoron job tasks per teacher
Percentage of technology co-ordinators reporting additionalsupport from others (eg teachers district officers aidesadministrators etc)
Teacher rating of availability of technology support (per schoollevel and per type of school)
Total support hours per teacher (per school level and per typeof school)
Number of development occasions for teachers (per schoollevel and per type of school)
Technology support content used to deliver technologyservices to teachers [eg (1) facilities network and internetaccess hardware software (2) staff assistance and necessaryservices technical support help desk network services (3)one-on-one personal guidance computer experts for troubleshooting]
Percentage of teachers who have resource (ICT) available foruse
ICT Indicators Used in the United States of America (contrsquod)Agency responsiblefor data gathering ICT indicators Components of ICT indicators
Presence of computersin American schools
Total instructional computers
Students per computer
Type of computer in each school level
Per cent of computers with selected attached peripherals
Locations of instructional computers
Per cent technology-intensive by school level
Software saturation
Software diversity
Type of internet access
Public schools with internet access
27 27Final Report
Per student expenditure on hardware software and supportper school level
Instructional technology expenditure by US schools (hardwaresoftware and support
Per student expenditure on hardware software and supportfor one year vs five-year estimates
Five-year technology expenditures per student for schools withand without their own technology budgets
Five-year technology expenditures (per student) for public andnon-public schools
School technology expenditures (per student) by communityincome level
Five year school technology expenditures (per student) by levelof technology penetration
ICT Indicators Used in the United States of America (contrsquod)Agency responsiblefor data gathering ICT indicators Components of ICT indicators
School investments ininstructional technology
ICT Indicators in UzbekistanAgency responsiblefor data gathering ICT indicators Components of ICT indicators
Number of computer classes
ICT integration in subjects like physics chemistry and biology
Teacher training
Establishment of ICT departments in universities to train teachers for school
IT as a subject in general education
Number of trained teachers
Provision of computer labs in schools
Collaboration in international training about IT
Application of IT in school management
Government
ICT Indicators in Viet NamAgency responsiblefor data gathering ICT indicators Components of ICT indicators
Establishment of ICT departments in universities to train teachers for school
IT as a subject in general education
Number of trained teachers
Provision of computer labs in schools
Collaboration in international training about IT
Application of IT in school management
Government
1
1IIAttachment
Comparison ofICT Indicator Themesin Selected Countries
29
29
Final Rep
ort
Basis for ICTindicatorsagency
who formulatedICT indicators
Presence ofstandards for
technology use
Educationallevel covered
Respondents of studies
Technologiescovered
in studiesType of indicators
Presence ofindicators
addressing equityethics and
investment issues
Presence ofindicators on ICT
integration incurriculumimpact etc
Goals and objectivesof the governmentAll students will leaveschool as confidentcreative andproductive users ofnew technologiesparticularlyinformation andcommunicationstechnologies andunderstand theimpact of thosetechnologies insociety
Yes Curriculumand StandardsFramework (CSF)
Primary secondarynon-formal
Teachers students Computers internetuse of satellite TV
Quantitative andqualitative
Not specified Yes specificallythe studyconducted by theUniversity ofSydney Includestudies on studentengagemententhusiasm andmovitationimprovement ofhigher-orderthinking skills etc
Based on a meetingconvened in IITEMoscow in 2000 todevelop a set of ICTindicators
None Primarysecondary andtertiary levels
Heads ofdepartmentssenior specialistsstaff of nationalCentres ofInformationalTechnologies andEducation orCentres of TeacherTraining Retrainingand EducationalSupport
Computers andinternet
Quantitative -policy documentsICTs in curriculumhardware andequipmentsoftware Globalcommunicationmeans andpersonneldevelopment
None Partly
Australia
Baltic andCIScountries
30
Develop
ing and U
sing Indicators of IC
T Use in E
ducation
Basis for ICTindicatorsagency
who formulatedICT indicators
Presence ofstandards for
technology use
Educationallevel covered
Respondents of studies
Technologiescovered
in studiesType of indicators
Presence ofindicators
addressing equityethics and
investment issues
Presence ofindicators on ICT
integration incurriculum impact
etc
Canada Two criteria fordevelopment ofindicator set
Type of educationinformation neededfor policydevelopment
Practical availabilityof dataindicatorsdeveloped by Pan-CanadianEducationIndicatorsProgramme (PCEIP)
None Elementary andsecondary level
Not specified Computers andinternet
Quantitative andqualitative
Pupil-computerratio
Internetconnectivity
Internet activitiesof students
Obstacles to fulleruse of informationandcommunicationstechnologies
None Yes specificallyon whatencouragesteachers andstudents to usecomputers
Europe 1 Indicators based onthe eEurope initiativeof the EuropeanUnion Action lineldquoEuropean youth intothe digital agerdquo Thegoal for the saidobjective is to turndigital literacy to abasic competence forall young EuropeansSIBIS Study
Yes ISTE (NETS)standards
Various researcherscovered differentlevel public primaryand lowersecondary primarysecondary andspecial schoolshead teachers andteachers
School headsteachers
ICT in generalcomputers andinternet access
Quantitative andqualitative
Policy andstrategy
Economy andinfrastructure
Use and access
Competencies
Yes specifically onnational policiesand expenditure
Yes oncompetency ofICT instructors
Europe 2 Eurydice Yes ISTE(NETS)standards
Primary andsecondary level
Not specified Computers andinternet
Mostly quantitativevery little on qualita-tive indicatorsExamples
Number of pupilsper computer
Desirable ICTskills according toofficial recom-mendations forthe initial trainingof all teachers(except specialistICT teachers)
Mainly onexpendituredistribution ofbudget
Yes on integrationof ICT in subjects
31
31
Final Rep
ort
Basis for ICTindicatorsagency
who formulatedICT indicators
Presence ofstandards for
technology use
Educationallevel covered
Respondents of studies
Technologiescovered
in studiesType of indicators
Presence ofindicators
addressing equityethics and
investment issues
Presence ofindicators on ICT
integration incurriculumimpact etc
India Government None Elementary andsecondary schools
Not specified Computersinternet software
Quantitative None None
Indonesia Curriculum Centre
Governmentrsquos goalsand objectives
None Elementary andsecondary schools
Not specified Computers andthe internet
Quantitative Moreof internet andcomputer use andaccess
None None
Japan eJapan priority policyprogrammevarioussurveys conducted bygovernment agencieson ICT in general Likethose conducted bythe Ministry of PostsandTelecommunicationsSurvey on SocialEducation
None Elementary andsecondary in someindicators notspecified in otherindicators
Not specified Computers andinternet
Quantitative Moreof internet andcomputer use andaccess
Yes Governmentgeneral IT policy onelementary andsecondary schoolsthe same forschools for theblind and disabled
None
Republic ofKorea
Cyber Korea 21Vision To preparestudents forknowledge basedsociety by realizinglife-long learning viacyber-educationsystemrdquoKoreaNational StatisticsOffice
Yes - based onthe documententitled Adaptingeducation to theinformation ageA white paper
Elementarysecondary
Teachers andstudents andschoolheadmasters
Computersinternet andmultimedia
Quantitative Moreof internet andcomputer use andaccess throughinput utilizationand outputindicators
None None
Malaysia Government None Elementary andsecondary schools
Not specified Computers andthe internet
Quantitative None None
Quantitative andqualitative
Telecommunica-tions equipment
How schoolsteachers andstudents usetelecommuni-cationstechnologies
New Zealand Research conductedby the TelecomEducation Foundation
None Not specified Teachers andprincipals
Telephone linesfax machinescomputers andinternet
None Yes specificallyon whatencouragesteachers andstudents to usecomputers
32
Develop
ing and U
sing Indicators of IC
T Use in E
ducation
Philippines
Basis for ICTindicatorsagency
who formulatedICT indicators
Presence ofstandards for
technology use
Educationallevel covered
Respondents of studies
Technologiescovered
in studiesType of indicators
Presence ofindicators
addressing equityethics and
investment issues
Presence ofindicators on ICT
integration incurriculumimpact etc
Senate Committee onEducation Arts andCulture with SEAMEO-INNOTECH
Department ofEducation
None Public and privateelementary andsecondary schools
School heads All ICT relatedtechnologies suchas televisionprojectors radiocassette playerscomputersperipherals andinternet access
Quantitative Availability of
publiccommercialutilities andservices
Computer skillsof schoolpersonnel
Presence ofcomputers inschools
Instructionalacademic useof computers
Yes specificallythose pertaining touse of computers bynon-formaleducation students
None
Research on internetin Slovenia
None Primary secondaryyouth hostels andkindergartens
Not specified Computers andinternet access
Quantitative
Internet access
Computersnetworks
None None
School net None Not specified Students andteachers
Computers andinternet access
QualitativeexamplesIntegration of ICTwith curriculuminstructionalpractices barriersto computer use
None Yes oncompetency ofICT instructors
Government NationalEducation Act of1999
None Primary andsecondary schools
Not specified Computersinternettelephonescomputerperipherals ratio
Quantitative None None
Philippines
Slovenia
South Africa
Thailand
33
33
Final Rep
ort
Basis for ICTindicatorsagency
who formulatedICT indicators
Presence ofstandards for
technology use
Educationallevel covered
Respondents of studies
Technologiescovered
in studiesType of indicators
Presence ofindicators
addressing equityethics and
investment issues
Presence ofindicators on ICT
integrationin curriculumimpact etc
UK National grid forlearning
ISTE (NETS)standards
Primary andsecondary schools
Students andteachers
Computers and theinternet
Quantitative andqualitative
Computers inschools
Internet andelectroniccommunication
Teachercondidence anduse of ICT inteaching
Expenditure onICT
Yes mainly onexpenditure andbudget allocation
Yes includesteacherconfidence in theuse of ICT andbenefit of ICT
US Teaching learningand computing - astudy of teacherrsquosuse of computertechnology theirpedagogies andtheir school context
ISTE (NETS)standards
Public and privateschoolselementary middleschool and highschool all subjectsexcept physicaleducation andspecial education
Teachers Computers internetuse (includes use ofvarious softwareCDRom etc
Quantitative andqualitative School
technologyleadership andtechnologyoutcomes
Pedagogicalmotivations forstudent computeruse
Internet use byteachers
Presence ofcomputers inAmerican schools
Teacher andteacher directedstudent use ofcomputers andsoftware
Technologysupport
Schoolinvestments ininstructionaltechnology
Yes includesindicators thatdeterminestechnology intensiveareas softwaresaturation etc
Yes specificallypedagogicalmotivations forstudent computeruse
UK
US
34
Develop
ing and U
sing Indicators of IC
T Use in E
ducation
Basis for ICTindicatorsagency
who formulatedICT indicators
Presence ofstandards for
technology use
Educationallevel covered
Respondents of studies
Technologiescovered
in studiesType of indicators
Presence ofindicators
addressing equityethics and
investment issues
Presence ofindicators on ICT
integration incurriculumimpact etc
NoneUzbekistan Government Lawon Education
None Primary andsecondaryeducation
Not specified Computer andinternet
Quantitative None
Viet Nam Government
Governmentrsquos goalto ldquouniversalizerdquoeducation
None Primary andsecondary
Not specified Computer andinternet
Quantitative None None
1
1IIIAttachment
Studies on the Use andImpact of ICTin Education
35 35Final Report
Several studies have been conducted on ICT and its use and impact on educationsome of which are included below
This survey on the information and communications technology (ICT) provisions inschools in England was carried out in April 2001 the findings of which were comparedto similar surveys conducted in 1998 1999 and 2000 The surveys collectedinformation on the number and type of computers available in schools expenditurein schools the extent and benefit of the use of ICT across curriculum subjects theuse of internet and other electronic network communication links and teacherusage of computers and their confidence in the use of ICT in the curriculum It is asample survey and the sample is chosen to be representative of different types ofschools throughout the country Some of the findings as categorised are thefollowing
a Computers in schools
average number of computers per school increased steadily in all types ofschools between 1998 and 2001 the increase was noted to be greatbetween 2000 and 2001
b Internet usage and other external electronic communication services
between 1998 and 2001 there was a considerable increase in thepercentage of schools connected to the internet
c Use of ICT in teaching and teacher confidence
in each type of school there was an increase in the percentage of teachersreported to feel confident in the use of ICT in 2001
d Expenditure on ICT
the average expenditure on computers per school increased steadily in allschool types between 1998 and 2001
Source Statistics of EducationSurvey of Information and Communications Technology in Schools 2001National Statistics BulletinDepartment for Education and SkillsIssue No 0901October 2001
The Center for International Development (CID) at Harvard University conducted aresearch which came up with the Network Readiness Index (NRI) a majorinternational assessment of countriesrsquo capacity to exploit the opportunities offeredby ICTs In the development of the NRI data sources fall under two generalcategories First a variety of measures mainly ldquohardrdquo variables and also ldquosoftrdquoones from sources such as the World Bank the International TelecommunicationsUnion Freedom House and the Business Software Alliance were used Seconddata collected from the questionnaire responses of more than 4500 business andgovernment leaders surveyed in 75 countries by the Global Competitiveness Reportrsquos2001 Global Executive Opinion Survey conducted by Harvard University and theWorld Economic Forum were heavily relied upon
The Network Readiness Index is an assessment of a countryrsquos capacity to makeuse of ICT resources It shows how nations are performing with regards to theirparticipation in the Networked World Seventy-five countries were computed NRIs
B The Network Readiness Index Measuring thepreparedness of nations for the networked world
A Survey of information and communicationstechnology in schools 2001 in England
36 Developing and Using Indicators of ICT Use in Education
and the United States of America tops the NRI ranking making it the most highlydeveloped ICT network and it has the greatest potential to exploit networkrsquos capacityIceland Finland Sweden Norway and Netherlands follow USA Another NorthernEuropean country Denmark ranks 7th followed by Singapore in 8th Austria in 9th
and the United Kingdom in the 10th place Among the countries in the region whichwere included are Korea rank number 20 followed by Japan in the 21st placeMalaysia in number 26 Thailand number 43 India number 54 Philippines number58 followed by Indonesia in number 59 Sri Lanka in number 62 China in 64Bangladesh in 73 and Viet Nam in 74
Two components were taken into consideration in the computation of the NRIThese are network use and enabling factors Network use is defined as the measureof the extent of increase in the use of ICT in a specific country This is still narroweddown to five more catagories Internet users per hundred inhabitants cellularsubscribers per hundred inhabitants internet users per host percentage ofcomputers connected to the internet and availability of public access to the internet
Enabling factors is made up of four sub-indices network access network policynetworked society and networked economy Network access includes variablesrelated to the information infrastructure hardware software and support Itmeasures the extent and quality of the network infrastructure and the existence ofequipment programmes and support services that enable ICT use Network policyrefers to the information and communications policy environment and the businessand economic climate It also deals with the levels of competition in thetelecommnications and ICT sectors Networked society measures the quality andextent of use of ICT facilities in the learning process and networked economyassesses the extent of public and private sectors participation and e-governmentare considered in this sub-index
Source httpwwwcidharvardeducrpdfgitrr2002-cho02pdf
This is a national population survey of public and private elementary and secondaryschools conducted by SEAMEO INNOTECH in the Philippines under Project TAOCARES last March 2001 Its main objective was to determine the ICT capabilitiesof schools A total of 45811 schools were given questionnaires with the schoolheads as respondent of which 7937 per cent responded The survey questionnaireconsisted of 42 items mostly focused on the readiness of schools in terms ofinfrastructure hardware software and manpower capabilities on ICT Outputs ofthe survey were sixteen regional profiles on the ICT-preparedness of schools whichincluded data on the availability of electricity access of schools to communicationfacilities presence of computers computer peripherals and other multi-mediaequipment in schools sources of funds to maintain ICT-related operations proficiencyof school staff in the use of computers training received on ICT computer coursesbeing offered in schools and other ICT-related information
Some of the major findings of the survey at the national level are the following
Only 6607 per cent of schools have electrical connections
Only 1330 per cent have landline telephones 290 per cent have fax machinesand 200 per cent have internet connections
5217 schools only or 1428 per cent have computers with the National CapitalRegion having the highest percentage at 8730 per cent
Only 1824 per cent of schools have staff proficient in the use of computers
C Profile on the capabilities of elementary and secondary schools in the Philippines 2000-2001
37 37Final Report
7862 per cent of schools get funding to maintain ICT related operations fromthe PTCA
Only very few schools (1313 per cent) have school heads who have receivedICT training in the past five years
6436 per cent of school heads need training on basic computer literacy
This study was conducted by the New Educational Technologies Foundation Inc anon-profit organisation composed of schools that believe in the capacity of IT toimprove the quality of student learning and efficiency of teaching A total of 794schools participated in the survey with school heads in the public and private schoolsas respondents The questionnaire was divided into two parts the first part askedabout perceptions level of awareness and attitudes regarding the value of computereducation and was answered by users and non-users of computers The secondpart which dealt with the actual use of computers was answered by users onlyAmong the findings are the following
The number of computers owned by a private schools is twice as much aswhat a public school can afford
Computers available in schools are mostly the models AT486
Most computer units in the public elementary schools were acquired throughdonations in the secondary and tertiary schools most computers were acquiredthrough purchase
Computers are mostly used to teach different application programmes
Source The 1996 National Survey on Computer Education New Educational TechnologiesFoundation Inc
D The 1996 national survey on computereducation in the Philippines
In a primary school in Sunnyside Elementary School Pullman Washington studentsare using e-mails web sites videos and video conferencing technology tools todevelop their learning skills Through these mediums the students alongside theirglobal peers identify and share their cultures with one another in new waysTraditionally students learn about the world through books but new technologyallows the students to get in depth information about different cultures throughwriting reading and communicating with their global peers The following are theassessment tools used Assessment rublics designed for specific projects lessonandor classroom experiences standard assessment tools (ie DRA and WrightGroup Reading Assessments) teacher anecdotal notes childrenrsquos ownmetacognitive voices in the process of learning in conference with the teacherand in self-reflection of work and presentations parentsrsquo reports of student learningprogress
Teaching in non-traditional ways can sometimes be a risky business - with all eyesupon the class to see if learning is taking place It has been shown that studentsform teams to read write and communicate using technology at rates that meetand exceed standards for primary classes But along the way the added value oftechnology contributes in areas such as thinking skills social skills engagement inlearning motivation teaching and collaborating as the class sees what is essentialto learn in the context of the real world
Source httpwwwncrelorgengaugeframeworkefpalignefpalisuhtm
E Use of multiple assessment tools
38 Developing and Using Indicators of ICT Use in Education
F Technology A major catalyst for increasing learning by Jody C Isernhagen University of Nebraska-Lincoinby Jody C Isernhagen University of Nebraska-Lincoinby Jody C Isernhagen University of Nebraska-Lincoinby Jody C Isernhagen University of Nebraska-Lincoinby Jody C Isernhagen University of Nebraska-Lincoin TTTTTechnologechnologechnologechnologechnology Horizons in Educay Horizons in Educay Horizons in Educay Horizons in Educay Horizons in Educationtiontiontiontion Journal Online Journal Online Journal Online Journal Online Journal Online August 1999 - FeaAugust 1999 - FeaAugust 1999 - FeaAugust 1999 - FeaAugust 1999 - Featuretureturetureture
A rural public school in Nebraska composed of 1400 students applied for a three-year competitive Excellence in Education Grant in late 1995 Six schooladministrators and 18 staff members designed a plan to restructure their schooland classrooms The staff members defined that the major skills needed by studentsare comprehension reasoning composition and experimentation A computerwas placed in each classroom (80 classrooms) and 27 computers were located inthe elementary Integrated Learning Lab with Computer Curriculum CorporationSuccess Maker Software This software automatically diagnoses and placesstudents on the appropriate skill level while using the computer The computer labwas used by 314 students and 13 teachers in grades 1-3 from January 1996through May 1998 Teachers were trained on the use of ClarisWorks MicrosoftWord E-mail Internet Presentation Stations and the integration technology as atook in teaching and learning Activities of the students involved computer buildingdesigning of web pages to help maintain the schoolrsquos web pages digitizing video topresent to the community creating panoramic views and interactive virtual realityscenes preparing letters of application resumes and cover letters and to searchthe web for jobs With all the activities the teacher served as guides figuring outwith the students how to arrive at a productive presentation
The CAT scores in reading and math for students using an Integrated Learning Labfor 25 years showed a significant difference between the means The scores ofstudents testing below the 50th percentile at grades 1-3 in reading and math increasedsignificantly over time These findings suggest that using an Integrated LearningLab with rural primary age children daily over an extended period of time maypositively impact achievement for students particularly those students functioningbelow the 50th percentile
Source httpwwwthejournalcommagazinevaultarticleprintversioncfmaid=2126
G The impact of ICT on literacy learning in English
This report is the result of a literature review conducted first to identify a number ofstudies that might shed light on the major impact of ICT on literacy learning inEnglish for 5 to 16 year olds and the second to undertake an in-depth review ofthe papers that were identified as being on the impact of networked ICT on literacylearning in English for ages 5 to 16 There were 1871 studies screened following acriteria to identify relevant reports 188 studies were found that met the criteria inthe protocol These studies were then keyworded or indexed and the results filedon an electronic database
Of the 188 studies relevant to the mapping study 16 pertained to the topic of theimpact of networked ICT on literacy learning Data were extracted from these 16studies and were used as basis for an in-depth review Of these half were outcomeevaluations (evaluations of the results of an experiment or innovation) seven wereprocess evaluations (evaluations on how an intervention was delivered rather thanwhether it worked or not) and one was a needs assessment
Results show that as far as the in-depth study on networked ICT goes results areinconclusive Concerning policy and practice the recommendations of this revieware highly tentative and take the form of implications or pointers With regard topolicy they are to focus research funding for large-scale studies to give considerationto the balance of study type expertise in research teams and to give consideration
39 39Final Report
to the fact that the provision of computer hardware and software to schools andthe application of ICT in teaching and learning need to be informed by researchand evaluation
Source httpeppiioeacukEPPEWebhomeaspxpage=reelreview_groupreview_ one_abstractht
H Education Research Fund Effective Integrationof IT in Singapore Schools Pedagogical
and Policy ImplicationsThis is a report on the key findings of a questionnaire survey aimed at identifying thedegree of information technology (IT) integration among Singapore schools Thesurvey is the first part (Phase One) of a larger study funded by the Ministry ofEducation of Singapore aimed to examine and analyze where and how IT is integratedin Singapore schools to develop pupilsrsquo higher order thinking skills A total of 328schools responded to the survey of which 168 are primary schools 144 secondaryschools and 16 junior collegescentralized institutes (JCCs)
Major findings of the questionnaire survey include
Phase I schools in the IT Masterplan have significantly higher pupil and teacheruse of IT greater opportunities for staff development of teachers and moreconducive IT culture than Phase III schools
Independent-autonomous schools have significantly better management of ITresources higher teacher and pupils use of IT greater opportunities for staffdevelopment for teachers and more conducive IT culture than governmentschools
There are no significant differences among the primary schools secondaryschools and JCCs in terms of the management of IT resources pupil andteacher use of IT staff development and school IT culture
The correlations among management of IT resources pupil use of IT teacheruse of IT staff development and IT culture are significant and highly positive
- Contents
-

1
12Section
Using Indicators toAssess Impact of ICT
in Education
3 3Final Report
Below is an attempt to synthesise several countriesrsquo efforts and initiatives inconducting research to evaluate the use of ICT in education and for some countriesthe development of ICT indicators Among these countries are
Australia Canada CIS and Balkan countriesIndia Indonesia JapanKorea Republic of Malaysia New ZealandPhilippines Singapore SloveniaSouth Africa Thailand United KingdomUnited States Uzbekistan Viet Nam
The development or potential development of indicators in the region follows threepaths
1 Ministries of Education or the Government set up Task Forces or committeesto take charge of developing indicators measuring the use and impact of ICTin education
2 The vision and goals of the ICT programme serve as basis for the formulationof ICT indicators
3 The impact of the use of ICT in education is determined through surveys andresearch and thus serves as basis for the formulation of national indicators
While the government of Korea has ldquoCyber Korea 21rdquo and the ldquoWhite Paperrdquo thegovernment of Japan has ldquoeJapan Priority Programmerdquo and Europe has theldquoeEuroperdquo initiative These programmes are all aimed at improving the ICT sectorand carry with them built-in indicators for measuring the achievement of thesegoals
Today most countries include ICT integration either in their national policies or inlaws pertaining to the education sector In Australia at the federal level theCommonwealth government has set goals for schools in relation to ICTdevelopment The government wants students to leave school as confident creativeand productive users of new technologies particularly ICTs as well as understandingthe impact of those technologies on society (httpwwwcurriculumeduaumceetyanationalgoalsnatgoalshtm) Schools are expected to integrate ICT into theiroperations
In Thailand the national Education Act of 1999 formed the core of educationreform towards ICT use in education as guided by three principal strategies value-added equity and quantum-jump (httpwwwunescoorgbangkokeducationictict_enablingap_policyLearntec-Tongyoopdf) Similarly the Law on Education inUzbekistan outlined the inclusion of ICT in the education sector Meanwhile thePhilippinesrsquo Department of Education has also formulated policies for the use ofICT The same trend is seen in Indonesia Malaysia Uzbekistan Viet Nam andothers where the national government sets goals for ICT integration in education
Within the region the Republic of Korea is the most advanced in terms of indicatordevelopment on the use of ICT in education The Ministry of Education and KoreanEducational Research and Information Service (KERIS mdash httpwwwkerisorkrenglish) have formulated and used a set of indicators categorised into supportinput utilisation or output The support indicators include training hours given toteachers and principals budget allocation the year plan and incentives for teachers
Section Two
Synthesis of country experiences on ICT indicatorsand related issues (Attachment II)
Kinds of indicators developed basedon visions or goals and surveys
4 Developing and Using Indicators of ICT Use in Education
The input indicators consist of the ratio between computers and students Internetconnectivity and speed educational software and the number of applications usedThe utilisation indicators include subjects using multimedia the percentage ofclasses using a Web board or computer labs the percentage of teachers joiningICT associations and discussion forums student usage of computers and usageof the internet Output indicators include teachers and students having an emailaddress a homepage and ICT certificates and students also having completed a32 hours ICT course
In Australia the Ministerial Council of Education Employment Training and YouthAffairs (MYCEETA) is currently looking into the use of performance measures forstudent achievement relating to new technologies Taking the National Goals forSchooling as the starting point the NEPMT commissioned a project in 2000 todevelop key performance measures for monitoring the ICT knowledge and skills ofAustralian school students The outcome of this process was the report MonitoringProgress towards the National Goals for Schooling Information and CommunicationTechnology (ICT) Skills and Knowledge Basically the report describes the contextof learning ICT skills and knowledge as an outcome of schooling identifies anddescribes performance measurement approaches definitions and sources of datacurrently used in relation to schooling research and national and internationalreporting on ICT skills and knowledge evaluates the ICT measures currently in usein the context of the National Goals for Schooling in the 21st Century proposes astrategy for monitoring the profile of ICT skills and the knowledge of school studentsand identifies further work required to establish an operational monitoring programme
There have also been several initiatives undertaken to measure the impact and useof ICT in education in different States of Australia The trends show that theseindicators are increasingly focusing on qualitative indicators measuring teacherand student outcomes For example the University of Sydney looked into whetherstudent-centred learning took place along with student improvement in high-orderthinking skills As far as the teachers are concerned the indicators assess changesin teaching practice and improvement in the ability to use emerging technologiesHowever connectivity remains a strong indicator in Australia focusing on the numberof teachers with a notebook the computer-student ratio bandwidth available inschools and the type of Internet connection
In Malaysia the creation of the Smart School System serves as benchmark for ICTintegration in schools (httpwwwmdccommymscflagshipsshtml) The MalaysianSmart School programme is aimed at reinventing learning institutions in terms ofteaching practices and school management preparing children for the InformationAge Some of the initial proposed indicators by the ICT project are both quantitativeand qualitative They focus on the use of ICT in curriculum in pedagogy inassessment and materials The quantitative indicators include decreased drop-outrates and recorded achievement gains each year among others while the qualitativeindicators include caring and competent teachers and a broad flexible curriculumthat caters to the differing needs and abilities of students
In the Philippines the Senate Committee on Education Arts and Culturecommissioned SEAMEO-INNOTECH to conduct the national survey to profile theICT capabilities of elementary and secondary schools in the Philippines SEAMEO-INNOTECH was responsible for formulating the indicatorsitems on the survey (httpwwwseameo-inotechorgframeshtml) These include the existence of an enablingenvironment the computer skills of school personnel the presence of computersin schools instructional or academic use of computers ICT infrastructure and Internetconnectivity The Department of Science and Technology in collaboration with theDepartment of Education has also conducted a survey not only looking at theinfrastructure and hardware support indicators but also with regard to howcomputers had been used and integrated into the curriculum as well as in teachingand learning
5 5Final Report
In Thailand initial use of indicators through a survey included Internet connectivityin schools the computer-student ratio and usage of ICT in schools and schooladministration and connection to SchoolNet as main issues The annex found atthe end of this document also shows a variety of potential indicators which fallunder their ICT projectrsquos three principlesstrategies namely value-added equityand quantum-jump strategies A committee was formed to concentrate onformulating indicators to measure the impact of ICT use in schools
Uzbekistan through its Ministry of Public Education has carried out monitoring andevaluation through the 14 Provincial Departments of Education and 15 In-serviceTraining Institutes Under these indicators have been examined such as theavailability of computers in schools the number of students using computers thenumber of computer classes integration of ICT in subjects and teacher training Itwas reported that the evaluation of student computer ability and performance isdifficult as different computers are being used throughout the country
In India the ICT programme statement of goals brought about potential indicatorsthat include the presence of MIS and software ICT in textbooks ICT in computersubjects and in-service and pre-service training of teachers
Though Indonesia has not developed its set of indicators its ICT in educationprogramme goals and objectives also imply that the following indicators can bepotentially useful studentrsquos understanding of the benefits of ICTs mdash disadvantagesas well as challenges studentrsquos use of ICT knowledge in acquiring processingarranging distributing and keeping information and studentrsquos application ofknowledge skills and attitudes in designing information technology systems andsolving problems relating to ICT
Similarly while Viet Nam has not developed its indicators its ICT goals imply indicatorsin the following areas ICT as a subject in general education number of trainedteachers and establishment of ICT departments in universities to train teachersprovision of computer labs in schools and the application of ICT in schoolmanagement
In Singapore as the process of IT integration in schools reaches a considerablelevel of maturity the question being asked is How do we integrate IT in schools solearning opportunities are optimised Research undertaken by the National Instituteof Education and Ministry of Education entitled ldquoEffective Integration of IT in SingaporeSchoolsrdquo (httpeduwebnieedusgprojectsITintegration) focused on the generalpedagogical practices and socio-cultural policies of IT integration in Singapore schoolsnot just the innovative and best practices The indicators used included infrastructureand resources school IT culture staff development teacher use and student useThe research sought answers to the following questions or indicators of a qualitativenature
What are the pedagogical practices of teachers and students that promote orhinder the integration of IT
What are the roles of the human participants activities and tools in such anenvironment
How does a change in the curriculum promote a culture that facilitates integrationof IT
How does a change in the mode of assessment affect integration of IT
The UNESCO Institute of Information Technology in Education (httpwwwiiteru)based in Moscow undertook a survey of the use of ICT in education in Baltic andCIS countries making use of the following indicators a) Official documents on ICTusage in education b) ICTs in curricula mdash as a separate subject or to support othersubjects c) Equipment (computer-student ratio computer availability in classroomsmultimedia system and LAN connection) d) Software (percentage of schools withDOS and Windows and using software for teaching subjects and software designed
6 Developing and Using Indicators of ICT Use in Education
by local and foreign experts) e) Global communication means (percentage withoutInternet access with limited Internet access ndash- only e-mail access via dial-up ordedicated line and those with web pages) and f) Personnel development mdashpercentage of elementary school teachers subject teachers and teachers ofInformatics and EI administration who have undertaken the computer literacy coursefor certain hours during a certain time frame and the computer skills of elementaryschool teachers subject teachers and teachers of Informatics and administration
What kinds of changes in knowledge skills and competencies are required fromteachers and students in the use if ICT In order to serve as a basis for developingknowledge skills and competencies in the use of ICT as well as in comparingoutcomes of ICT use against goals set few countries have standards for technologyuse
In Australia however the Victoria government has a curriculum standards framework(CSF) developed by the Victorian Curriculum and Assessment Authority whichidentifies what students should know and be able to do in eight key learning areasfrom preparatory year to year 10 In New South Wales the Government hasforeshadowed the introduction of an external Computer Skills Assessment for allyears 6 and 10 students to determine their knowledge skills and understanding inthe use of ICT Western Australia has a Competency Framework for Teachers andin Queensland these competencies are identified in Minimum Standards forTeachers-Learning Technology (httpeducationqldgovaucurriculumlearningtechnology mst_inthtmlintroduction) Queensland also produced a documentICTs for Learning School Information Kit 2002ndash2003 which details benchmarksestablished around teaching learning and the curriculum learning and developmentICT infrastructure connectivity ICT support and innovation Furthermore thedevelopment of indicators will be based on the following a) definition of contentdomain including functional skills in a cross curricular context manageability in itscomplexity delineates between Year 6 and Year 10 in terms of the curriculumcontext and the hierarchy of skills identified and b) the development of a scale ofcompetence including basic and functional skills as well as complex thinking andfacilitating the reporting of a range of achievement
The United States and Europe utilise a set of standards for the technology use ofstudents teachers and school administrators The International Society for Technologyin Education (ISTE) came up with the National Education Technology Standards(NETS) Project (httpcnetsisteorg) the primary goal of which is to enablestakeholders in PreK-12 education to develop national standards for the educationaluses of technology that will facilitate school learning (see attached for more detailson the ISTE NETS standards)
The fact that the other countries did not indicate any existing standards that canmonitor the use of technology reflects the lack of qualitative indicators Many countriesmerely focus on providing the technology that is making computers and Internetaccess available
In most of the countries researched on the studies have been limited to ICT indicatorsused in the primary and secondary level There are however instances whereother levels are included such as the case of Republic of Korea where universitylevel is included and in Slovenia pre-school In the United States those in physicaleducation and special education subjects in the primary and secondary levels wereexcluded Japan is noteworthy as its ICT policy includes even special schools forthe blind and the disabled Australia incorporates those in non-formal education intheir studies
Standards for technology use
Levels of integration
7 7Final Report
This situation tells us something about the issue of equity in the use of ICT in educationThere are times when the government policy itself can serve as either an aid or abarrier to equity in access
The number of computers or Internet connections in schools dominates statisticsIn fact only six countries specified indicators pertaining to other ICT technologiessuch as telephone lines fax machines LCD projectors and the like These countriesare Australia India New Zealand Republic of Korea Thailand and the Philippines
Perhaps future studies should also look into other types of ICTs in addition tocomputer-based and Internet In doing so there should be a clear definition of whatICT is The following definitions can serve as a guide
Information TInformation TInformation TInformation TInformation Technology (IT)echnology (IT)echnology (IT)echnology (IT)echnology (IT) is the term used to describe the items of equipment(hardware) and computer programmes (software) that allow us to access retrievestore organise manipulate and present information by electronic meansPersonal computers scanners and digital cameras fit into the hardware categoryDatabase storage programmes and multimedia programmes fit into the softwarecategory
Communicat ion technology (CT)Communicat ion technology (CT)Communicat ion technology (CT)Communicat ion technology (CT)Communicat ion technology (CT) is the term used to describetelecommunications equipment through which information can be sought andaccessed for example phones faxes modems and computers
Information literacyInformation literacyInformation literacyInformation literacyInformation literacy is the combination of knowledge understanding skills andattitudes that students need to fully contribute as members of society in theinformation age When students become information literate they develop anability to select interpret evaluate manipulate and present information
Studies on how teachers use ICT are also included in most ICT integrationprogrammes Many looked into how teachers have used ICT in teaching specificsubjects into how they have employed Internet resources in teaching how theyhave used email in communicating with students and other teachers and whetherthey have developed their own homepages In Australia for example teachersmake use of self-paced learning materials on ICT use in CD-format In other countriespreference is given to teacher applicants who are already computer literate suchas in the case of the Philippines In Korea and Australia teachers are provided withPCs These provides an overview of ICT indicators related to teacherrsquos use of ICT
Respondents for the different surveys in the US New Zealand the UK South Africaand Europe usually included teachers Students are included in surveys to determinetheir perceptions towards ICT such as in the UK and South Africa In other casesschool heads are taken as respondents such as in the Philippines and New ZealandIt was not clear from the results in other countries such as Canada Korea Japanand Slovenia who their respondents were
While some countries use qualitative in addition to quantitative indicators their useis obviously limited Quantitative data usually includes ICT infrastructure andconnectivity consisting of hardware and the physical networks that connect thecomputers locally and globally
Common indicators used for measuring or determining ICT infrastructure include
ICT infrastructure hardware and connectivity
Teacherrsquos use of ICT
Targets of indicators surveys
Types of indicators
8 Developing and Using Indicators of ICT Use in Education
Availability of computer hardware ratios of computerstudent computerclassroom computersteacher type of computers (stand alone multimedia innetwork)
Availability of connectivity and bandwidth of the computers Type of bandwidthfor connections includes high-speed broadband wireless
Quantitative data can be collected from indicators that will provide an overall view ofinfrastructure support and ICT presentation in schools However it is equally importantto examine indicators that will show how ICTs have been used not only as a basicoperational tool but also as a communications tool which promotes the developmentof creativity interactivity collaborative learning critical thinking and problem-solving
There are countries that are already attempting to include attainment and ICTimpact in indicators
Canada included ldquoobstacles to fuller use of information technologiesrdquo in its list ofindicators (httpwwwcmeccastatspceip1999Indicatorsiteenglishpagespage19ehtml) In Europe ldquoteacher confidence in the use of ICT change in teachingmethods and desirable ICT skillsrdquo is assessed (httpwwweurydiceorgDocumentsTicBIenFrameSethtm)
In New Zealand ldquoobstacles faced by teachers in using ICT factors that encourageuse of ICT studentrsquos positive views about technology activities in schoolrdquo are amongthe qualitative indicators
South Africa (httpeducationpwvgovzateli2researchICT20auditICTaduithtm)attempts to measure practical foundational and reflexive competencies of educatorsalong with how well students enjoy ICT-related activities and learnerrsquos perception ofhow the use of computers improves learning and attitudes
Meanwhile the UK (httpwwwdfesgovukstatisticsDBSBUb0296) looks atteacher confidence in ICT use and the benefits of ICT in subjects while in the USmost qualitative indicators pertain to the teacherrsquos perceived value of internet userelative to the teacherrsquos educational background school level taught location ofaccess etc
The Republic of Korea includes output indicators teachers and students now havingemail addresses and a homepage to deliver information and exchange school workand ideas as well as more participation in ICT extra curricular activities (httpwwwicce2001orgcdpdfp12 KR115pdf)
Research in Japan the Philippines Slovenia and other countries show that thesecountries are still concentrating on providing ICT infrastructure that is making thetechnology available in their respective countries rather than measuring impactand effectiveness
Qualitative indicators mentioned in the research include
How much students think they have improved Change in teaching methods Desirable ICT skills Factors that encourage telecommunications use Students who had positive views about technology activities in schools Teachers agreeing that telecommunications technologies can enhance learning
and teaching How much learners think they have improved in various activities Teacher confidence in the use of ICT Development of practical foundational and reflexive competencies Impact of computers on educators and learners Barriers to computer related activities
Some indicators appear to be unique or were only mentioned for some countries
In Europe for example ICT indicators include the ICT policy and strategy of eachcountry in the CIS and Balkan study looking at Denmark Sweden Finland Norwayand the UK These indicators measure objectives of each country in national ICTprojects along with the schedule of implementation
9 9Final Report
In the Republic of Korea the establishment of an education network (KoreaEducation Network) serves as one of the ICT indicators for higher education Koreaalso uses the establishment of a networked research system (Research InformationService System) for higher education as another indicator
The establishment of a network can be considered a quantitative indicator in thesense that it is a physical phenomenon where hardware or portalsplatforms areprovided for networking in a digital form to take place However networking canalso be a qualitative indicator if the focus is on developing competence indisseminating knowledge and information quickly and to large numbers of peopleThe level or quality of networking among organisations can also be used as aqualitative indicator
Furthermore most of the countries give themselves a deadline or a yearlyachievement target For example in the Republic of Korea the targets for theyear 2000 are to provide PCs and other infrastructure to schools for 2002 theestablishment of a Nationwide Education Administration Information System andfor 2005 the setting up of the Integrated Human Resources Information Network
The use of ICT in the school system in the Asia-Pacific Region as in the otherRegions of the world is widespread and continuously growing Many believe thatICT will empower teachers transforming teaching and learning processes frombeing highly teacher-dominated to student-centered Arguably the quality of studentlearning will improve tremendously as use of ICT will create opportunities for studentto develop their creativity problem-solving abilities and other higher-order thinkingskills
It appears though that while ICT has revolutionised business industry andentertainment indicators to prove that it has had the same effect on studentoutcomes are lacking as yet Moreover ICT has brought with it its own problemssuch as the oft-mentioned ldquodigital dividerdquo exacerbating the problem of access toICT between rich and poor male and female and between and among teachersand school administrators Moreover as countries continue to invest in ICT for usein education drawing financial resources from a variety of sources including theprivate sector and bilateral funding agencies there is even greater need forperformance indicators to monitor the use and effects of ICT demonstratingaccountability to these various funding sources and to the public
While these problems are known to our policy makers and educators informationon the extent of these problems remains scant due to lack or absence of monitoringand evaluation systems concerning the use of ICT in schools and its impact onteaching and learning There is an urgent need therefore for a monitoring andevaluation (M and E) system if current efforts to make ICT use an integral part ofthe education system are to succeed Such M and E systems should start withformulating a set of indicators of ICT use and impact in education
This effort is not new in other parts of the world such as in the USA Europe theUK Canada Australia New Zealand and the like (A listing of ICT indicatorsdeveloped in these countries is given as Appendix I to this paper) However in mostof the Asia-Pacific countries there has been little systematic work in the use of ICTindicators in the field of education except that of the Republic of Korea and soonAustralia
Given that Asia-Pacific countries differ widely in regard to the scope and variety ofuse of ICT in education it would be unrealistic and inappropriate to attempt toformulate a uniform set of indicators that can be used to frame data collection forICT in education projects Rather it is better to arrive at a consensus on commoncore indicators that can be used regardless of the ICT utilisation stage which acountry has reached Important criteria to be observed in formulating these coreindicators would include local relevance reliability and robustness when these areused for comparison of one ICT project or country with another
10 Developing and Using Indicators of ICT Use in Education
Assessment and evaluation methodsIn most of the studies reviewed traditional or standard assessment methods wereused Assessment rubrics were designed for specific projects lessons andorclassroom experiences in addition to standard assessment tools except in a primaryschool in Sunnyside Elementary School Putnam Washington In this study parentswere also involved in the assessment process preparing reports of their childrenrsquosprogress
The ways that technologies are being used in schools change the teacherrsquos rolefrom that of technology-as-teacher to technology-as-partner in the learning processAs students increasingly use technologies as learning tools they will producetechnology-based artifacts - student-constructed knowledge bases Theseknowledge bases are rich multi-modal indicators of what students have learnedMoreover as learning becomes more meaningful so it becomes more authenticand more complex Thus authentic assessment and other non-standard assessmentmethods such as rubrics need to be designed to capture meaningful learningexperiences of students brought about by these new technologies
Unfortunately not too many teachers have acquired the competencies to conductauthentic assessments for student learning using learning portfolios and rubrics forperformance evaluation The need for such learning assessment competencybecomes even more urgent as educators move away from the behaviourist andobjectivist perspective of learning to that of a more constructivist view
Using the type of indicators used by countries as basis for categorising them basedon the extent and impact of ICT and using the input-process-output model theresults would be
Level 1 - Includes input indicators only Level 2 - Includes input and process indicators
Level 3 - Includes input process and output indicators
x
x
x
x
x
x
x
x
x
x
x
x
x
x
x
x
x
x
Qualitative
Type of indicator
x
x
x
x
x
x
x
x
Australia
CIS and Balkan countries
Canada
Europe (Denmark SwedenFinland Norway UK)
India
Indonesia
Japan
Korea Republic of
Malaysia
New Zealand
Philippines
Slovenia
South Africa
Thailand
UK
USA
Uzbekistan
Viet Nam
Country LevelQuantitative
3
2
3
3
2
1
2
3
2
2
1
1
3
2
3
3
2
1
1
13Section
Methods ofCollecting Indicators
11 11Final Report
There are various ways of collecting data based on predetermined ICT indicatorsOf course the most popular one is the use of survey questionnaires farmed out toa representative sample of schools school heads and teachers either on a regularor one off basis Clearly those done more regularly can track the behaviour of theindicators over time Weaknesses in ICT implementation can be remedied in duecourse new strategies in ICT implementation can be worked out and carried outthus increasing the probability of success of ICT programmes and projects Theone-shot survey is more appropriate for a summative kind of assessment in whichwe are more interested in finding out for instance the longer-term impact of ICTuse
Where the telephone system in a particular country is well developed enough thatmost homes have access and long distance calls are cheap the telephone interviewis a more cost-efficient method of data collection For example EURYDICE BasicIndicators on the Incorporation of ICT into European Education Systems Project((httpwwweurydiceorgDocumentsTicBIenFrameSethtm) conductedEurobarometer surveys over the telephone in 2001 covering a representative sampleof school heads and teachers in each EU country The questions put to the schoolheads were mainly concerned with their school ICT equipment and facilities whilethose asked of the teachers included the use of computers and the Internet withtheir pupils (time spent using them frequency of their use reasons for not usingthem etc) and how ICT had changed the way they taught Slovenia also made useof telephone interviewing as a method of data collection augmented by publicopinion surveys in person on a one-to-one basis (httpwwwrisorg) Data oninformation-telecommunication infrastructure such as telephone cellular phoneand ISDN connections number of Internet providers backbone providers and thelike were gathered from the telecommunication companies themselves (Details ofindicators used in the above surveys are in Appendix I)
In Australia the national monitoring of ICT skills and knowledge of students in Year6 (aged 10-12 years) and Year 10 (aged 14-16 years) will be done by means ofthree-yearly sample assessments commencing in 2005 Student outcomeinformation is the focus of the reporting agenda Assessment techniques should beinnovative and model good assessment practice and wherever possible assessmentmaterials developed for national sample assessments should be available for use bysystems and schools Collection and use of data for national purposes will in allrespects conform to the guidelines provided in the report Data Principles and Protocolsagreed by the PMRT and where performance in different years in a particular domainis the focus of measurement a single domain scale should underpin measurementsof student achievement The assessment methods will include a mix of tests onpaper and on line and performance assessment tasks with teacher assessment
The study by Singapore to measure the effective integration of ICT in schoolsindicated that to gather accounts by various groups and individuals in the learningenvironment both qualitative and quantitative methods were drawn upon such asobservations of IT and non-IT based lessons face-to-face interviews with principalsand IT co-ordinators group interviews with students and teachers questionnairesfor teachers and students and samples of studentsrsquo work
Survey questionnaire
Telephone interview
3 -yearly sample assessment
12 Developing and Using Indicators of ICT Use in Education
Where there is a saturation of Internet connectivity in the country that is most ofthe homes schools and offices are connected use of questionnaires posted on thewebsite of the institutionagency conducting the surveys can be an efficient methodof collecting data on indicators Furthermore communication by emails betweenthe respondent schools school heads teachers and even students will facilitatedata gathering Data entered into the web-based questionnaire can be automaticallyuploaded to the institutionagencyrsquos computer server located thousands of milesaway
Notably the UNESCO IITE survey met with some difficulties because the collectionof data depended primarily on the efforts and contributions of heads of departmentssenior specialists and the staff of national Centres of Informational Technologies inEducation or Centres of Teacher Training Retraining and Educational Support whowere not given any financial support agreeing to work due to an official memorandumThus many of the results were generated from expertsrsquo estimates rather thandirect collection of data from teachers students and schools
EnGuage a new Web-based framework developed by NCREL in the USA (httpwwwncrelorgengauge) is a response concern regarding the ever-increasinginvestment in educational technology by providing answers to three significantquestions to wit What value does technology bring to the schools How can ourschools ensure a return on these investments And why does technology work insome schools and not in others EnGuage is a tool set designed to help schoolsand school districts use technology effectively for learning teaching and managing
The School Technology and Readiness (STAR) Chart (httpww2isteorgstarchart) provides another web-based self-evaluation tool providing schools withthe information they need to better integrate technology With STAR Chart onlinemultiple-choice questionnaire can be completed that will provide instant feedbackThe Chart identifies and defines four school profiles ranging from the ldquoEarly Techrdquoschool with little or no technology to the ldquoTarget Techrdquo school that provides a modelfor the integration and innovative use of educational technology It is not meant tobe a measure of any particular schoolrsquos technology and readiness but rather isintended to serve as a benchmark against which every school can assess andtrack its own progress
The STAR Chart can help any school or community answer three criticalquestions
Is your school using technology effectively to ensure the best possible teachingand learning
What is your schoolrsquos current education technology profile
What areas should your school focus on to improve its level of technologyintegration
The method of data collection for ICT indicators will then vary from country tocountry depending on the spread of telecommunication use such as the telephoneand the Internet It will also depend on whether the existing M and E systems canstill accommodate additional data collection tasks to monitor and evaluate ICTimpact in schools Additional variables based on ICT indicators can be integratedinto the existing database system
Internet-based surveys
Web-based self-evaluation tool
1
14Section
Various Software orDatabase Systems for
Storing Indicators
13 13Final Report
Below are a few of the software or database systems worth considering in developingthe databases for ICT indicators
Spreadsheet programmes such as IBM Lotus 123 and MS Excel
Statistical programmes such as Statistical Package for the Social Sciences(SPSS)
Customized database programmes using MS Access (for small databases)
SQL Server MAGIC (for big databases)
For data-based driven web applications (Visual Interdev Java Visual Basic) thereis anoother software available in the market which can be used to create the ICTdatabases Technical staff will be able to assist in determining the most feasible anduser-friendly software adequate to answer specific needs
1
1IAttachment
ICT IndicatorsUsed in
Different Countries
15 15Final Report
Government What students should know and be able to do at a certain level
Connectivity Number of teachers with notebook Computer student ratio Bandwidth available in schools Type of internet connection
Changes in studentperformances afterintegrating ICT intoeducation
Increase in student engagement enthusiasm and motivation If student-centred learning took place Improvement in studentsrsquo high-order thinking skills improved Occurrence of changes in teaching practices Improvement in the ability to use emerging technologies
University of Sydney
ICT Indicators in Baltic and CIS Countries
Hardware equipment Computer classroom availability in educational institutions (EI) The average number of students per one computer in EI equipped
with computer classrooms Percentage of IBM- and Apple-compatible computers in total
number of EI computers Percentage of EI equipped with one or more multimedia system in
total EI equipped with computer classroom number Percentage of EI equipped with local network to total EI equipped
with computer classrooms number
Software Percentage of computers with installed OS DOSTM to total numberof computers in computer classes
Percentage of computers with OS WindowsTM of Apple Macintoshto total computer number in computer classes
Per cent of computers with other OS to total computer number incomputer classes
Percentage of EI with any educational software for teaching thecorresponding subjects to total EI number with computer classes1 Elementary School subjects2 Science subjects3 Humanities4 Informatics or information technologies
Percentage of educational software designed by the specialistswithin the country to total number of educational software usedin EI for teaching of the corresponding subject curriculum(elementary school science subjects humanities informationsinformation technologies)
Percentage of educational software designed by foreign specialiststo total number of educational software used in EI for teaching ofthe corresponding curriculum (elementary school science subjectshumanities informaticsinformation technologies
Components of ICT Indicators
UNESCO Institute ofInformationTechnology inEducation
Official documents Official documents in ITICTs in secondary education Official documents in ITICTs in secondary education currently
in force
ICT in curricula Available state curriculum on informatics andor InformationTechnologies
Informatics andor Information Technologies as a separate subject ICT usage to support other subjects implied in curricula on these
subjects
Global communication Percentage of EI without internet access Percentage of EI with limited internet access - only e-mail Percentage of EI with access via dial-up channel Percentage of EI with access via dedicated line Percentage of EI with own web-pages
ICT Indicators in AustraliaAgency responsiblefor data gathering ICT indicators Components of ICT indicators
Agency responsiblefor data gathering ICT indicators Components of ICT indicators
16 Developing and Using Indicators of ICT Use in Education
Personnel development Percentage of elementary school teachers subject teachers(except teachers of Informatics andor Information Technologies)teachers of informatics and EI administration who haveundertaken the computer literacy course from 1 September 1999until present time1 Less than 50 hours (Index 1)2 50-100 hours (Index 2)3 Over 100 hours (Index 3)
Computer skills of elementary school teachers subject teachersand teachers of Informatics and administration1 Elementary computer literacy2 Proficiency in ICT field
ICT Indicators in Baltic and CIS Countries (contrsquod)Agency responsiblefor data gathering ICT indicators Components of ICT indicators
ICT Indicators in Canada
Pan-CanadianEducation IndicatorsProgramme (PCEIP)
The pupil-computer ratio is a proxy measure of the access of availabilityof computer to students in schools Only computers used for educationalpurposes are included in the ratio
Internet connectivity This is a measure of the percentage of students attending schools thatwere connected to the internet for educational purposes at the time ofthe survey Schools that were connected for administrative purposesonly were excluded
Internet activities ofstudents
School ICT co-ordinators were questioned about instructional activitiesinvolving the use of the internet They were asked to identify typicalactivities that students at certain grade levels would have engaged in bythe end of the school year
Obstacles to fulleruse of informationand communicationstechnologies
Principals were asked to identify the major barriers hindering theachievement of their schoolrsquos computer-related goals for students Inthis section items are presented that are identified as major obstaclesby principals of schools representing at least 50 per cent of enrolmentsat each of the three levels of schools The obstacles noted have beengrouped into three categories those relating to hardware and softwarethose relating to instruction and those relating to the training of teachers
Agency responsiblefor data gathering
ICT indicators Components of ICT indicators
ICT Indicators Used in Europe (Denmark Sweden Finland Norway and UK)
Information SocietyTechnologyProgramme fundedby the EuropeanCommunity
Policy and strategy Countries with an official policy on the use of ICT
Schedule for implementing national ICT education projects
Responsibility for the purchase and maintenance of hardware
Objectives in national ICT projects
Inclusion of ICT in the national curriculum
Schools with ICT implementation plan (simple)
Schools with ICT implementation plan (detailed)
Approaches of ICT defined in the curriculum
Objectives defined in the curriculum for the teaching or use of ICT
Schools with autonomous decision power
Agency responsiblefor data gathering ICT indicators Components of ICT indicators
Pupil-computerratio
17 17Final Report
Use and access Pupils and teachers with a personal e-mail address
Use of ICT in areas of the curriculum
Use of external electronic communication services
Teachers use the internet for non-computing teaching
Internet use in teaching
Teachers opinion about the internet as a tool
Pupils access to the internet
Teachers access to computer and internet at home
Who pays teachers home access
Teachers who connect with other schools via the internet
Competencies New ICT and media students in percentages of all students
New ICT and media students by level of education
Qualifications and degrees in information technology and mediastudies
Population with a degree of qualification in ICT and media studies byfield of study and level of education
Hoursyears spent to pedagogical IT guidance
Hoursyears spent to technical IT guidance
Teachers confidence in the use of ICT
Students and teachers knowledge regarding ICT
Specialist ICT teachers
ICT courses during initial training of general class teachers
ICT trained teachers
Change in teaching methods
Average expenditure on ICT in schools
Sources of funding for ICT in schools
Total expenditures on ICT in schools
Distribution of the specific budget between the purchase ofequipment and expenditure on human resources
Number of computers per 100 pupils
Number and quality of computers available for administration pupilsand teachers
Expected increase in the number of computers
Computers with access to school net andor internet
Quality of internet access in schools
Placement of the computers
Schools with own website
Schools with on-line services
Schools with intranet website e-mail
Economy andinfrastructure
ICT Indicators Used in Europe (Denmark Sweden Finland Norway and UK) (contrsquod)Agency responsiblefor data gathering ICT indicators Components of ICT indicators
18 Developing and Using Indicators of ICT Use in Education
Inclusion of ICT in the curriculum
Percentage of teachers who use computers andor internet in theclassroom
Approaches to ICT defined in the curriculum
Objectives defined in the curriculum for the teachingor the use of ICT
Inclusion of ICT in the initial training of all teachers (except specialistICT teachers)
Inclusion of ICT in the curriculum
Percentage of teachers who use computers andor internet in theclassroom
Reasons given for not using internet with pupils
Approaches to ICT defined in the curriculum
Annual number of hours recommended for teaching ICT as a subjectin its own right
Objectives defined in the curriculum for the teaching or the use ofICT
Inclusion of ICT in the initial training of all teachers (except specialistICT teachers)
Percentage share of compulsory teaching related to ICT and thenumber of hours devoted to such teaching in the initial training of allteachers (except specialist ICT teachers)
Desirable ICT skills according to official recommendations for theinitial training of all teachers (except specialist ICT teachers)
Secondary (lowerand uppersecondaryeducation)
Both Number of pupils per computer and number of pupils per computerwith an internet connection (primary and secondary education)
Responsibility for the purchase and maintenance of hardware(primary and secondary education)
Distribution of the special budget between the purchase ofequipment and expenditure on human resources (primary educationgeneral lower secondary education general upper secondaryeducation)
Average periods during which primary school teachers usecomputers (with or without internet connection) in the classroomhours per week
Specialist ICT teachers
Percentages of primary and secondary school teachers in Europewho have received official training in the use of computers andorinternet in their teaching
ICT Indicators Used in IndiaAgency responsiblefor data gathering
ICT indicators Components of ICT indicators
Ministry of HumanResourceDevelopment
Presence of MIS
Presence of software
ICT in textbooks
ICT in computer subjects
In-serv ice and pre-service training of teachers
Primary
ICT Indicators Used in EuropeAgency responsiblefor data gathering ICT indicators Components of ICT indicators
19 19Final Report
Student understanding of ICTrsquos benefits disadvantages as well aschallenges in information technology
Studentrsquos use of ICT knowledge in getting processing arrangingdistributing and keeping information
Governmentrsquos goalsand objectives
ICT Indicators Used in IndonesiaAgency responsiblefor data gathering ICT indicators Components of ICT indicators
Student application of knowledge skills and attitudes in designinginformation technology systems solving problems relating to ICT
Includes public halls libraries
Training hours of the principal Training hours of teachers implemented by the school itself Training hours on ICT use in education per teacher Percentage of operating budget vis-a-vis the total budget Percentage of teachers in the department of ICT Whether an ICT yearly plan exists or not Whether an incentive system for ICT personnel exists or not
ICT Indicators Used in Republic of Korea
Support
Agency responsiblefor data gathering ICT indicators Components of ICT indicators
bull Ministry ofEducation
bull KoreanEducationalResearch andInformationService (KERIS)
Inputs (infrastructurehardware software)
Number of students per computer Number of computers per teacher Percentage of computers less than 3 years old Percentage of computers connected to internet Speed of internet connection Number of educational software (CD-titles) Percentage of computers equipped with 5 basic applications
Number of students per PC
Internet access of students
Number of teachers inpublic schools who canoperate PCs
Number of teachers at elementary lower and uppersecondary schools and special education schools
Number of humanresources with IT-relatedmasterrsquos and doctoraldegrees
Number who graduated from masterrsquos course
Number who graduated from doctoral course
Number of foreign nationalswith the status of residenceldquoEngineerrdquo and number ofnationals entering Japanwith the status of residenceldquoEngineerrdquo
Number of registered foreign nationals
Number of foreign nationals entering Japan
Ensuring security andreliability
IT security measures (information security policies presenceof firewalls and back-up systems)
Number of public schoolswith internet access andcomputers
In households
In SMEs (companies with five employees or more)
In corporate (companies with 300 employees or more)
Number of internet users
ICT Indicators Used in JapanAgency responsiblefor data gathering ICT indicators Components of ICT indicators
e-Japan PriorityPolicy Programme
Public facilities withinternet access
20 Developing and Using Indicators of ICT Use in Education
Teachers
Percentage of subjects utilising multimedia materials for teachingand learning through WWW
Percentage of classes using web-board
Percentage of subjects using web-board
Percentage of teachers participating in an association regardingICT use
Percentage of subjects using computer lab
Percentage of functions of the Information System being used
Whether to use electronic decision system
Number of posting written for and by parents
Students
Hours of use of computer per student
Percentage of students participating in ICT special programmesafter school (Elementary)
Whether to teach on computer (Secondary)
Percentage of subjects collecting assignments through web board
Number of search library DB per students
Percentage of student-governing community utilising webenvironment
Whether a programme regarding internet ethics exists
Number of web communities per class
Internet
Usage of internet
Number of access to school website per week
How often school websites are revised
Output Teachers
Percentage of teachers having e-mail address
Percentage of teachers having homepage
Percentage of teachers having ICT certificates
Percentage of teachers participating in educational SW contests
Students
Percentage of students having e-mail address
Percentage of students having homepage
Percentage of students having ICT certificates
Percentage of students participating in educational SW contests
Percentage of students completing the ICT course (32 hours)
Utilization
Agency responsiblefor data gathering ICT indicators Components of ICT indicators
ICT Indicators Used in Republic of Korea (contrsquod)
21 21Final Report
Malaysian smart schoolsuse of technology forinformation processing andas a productivity tool toenhance professionaldevelopment and toautomate instruction
Malaysian government(Ministry of Education)
ICT in curriculum
ICT in pedagogy
ICT in assessment
ICT in materials
ICT Indicators Used in MalaysiaAgency responsiblefor data gathering ICT indicators Components of ICT indicators
How schools teachersand students usetelecommunicationstechnologies
Number of teachers taking in-service training using a tele-learningapproach
Obstacles faced by teachers in using telecommunicationstechnologies
Factors that encouraged telecommunications technology use
Percentage of teachers agreeing that telecommunicationstechnology can enhance learning and teaching
Percentage of students who had positive views about technologyactivities in school
Telecommunicationsequipment
Paper by David HarrisNZCER
Percentage of schools with telephone lines
Percentage of schools with classrooms that has telephone lines
Percentage of schools with fax machines
Percentage of schools with computers that has access to amodem
ICT Indicators Used in New ZealandAgency responsiblefor data gathering ICT indicators Components of ICT indicators
Availability of publiccommercial utilities andservices
Project TAO Cares(computer-assistedreforms for schools)senate committee oneducation arts andculture
Government throughthe Department ofEducation
Percentage of schools with electricity
Percentage of schools whose electricity is available for 24 hoursper day
Percentage of schools whose electricity is available year-round
Percentage of schools with ICT equipment
Percentage of schools where publiccommercial utilities andservices are available
Percentage of schools located in communities where publiccommercial utilities and services are available
ICT Indicators Used in The PhilippinesAgency responsiblefor data gathering ICT indicators Components of ICT indicators
Computer skills ofschool personnel
Percentage of schools staff who has computer skills
How school staff acquired computers skills
Percentage of school staff with expertise in using differentcomputer software
22 Developing and Using Indicators of ICT Use in Education
How were computers in the schools acquired
Location of computers in the school
Modes of set-up of the schools computers
Purposes for which computers are used
Operating system used
Software used for teaching and learning
How school acquired software programmes
Percentage of schools with internet access
Source of funds to pay for internet access
Internet connection arrangement (eg dial-up dedicated dial-upor leased line connection)
Who are given access to the internet (eg students principaladministrative staff etc)
Financial capacity to have internet access
How often computers are upgraded
Availability of funds for computer maintenance
Instructionalacademicuse of computers
Percentage of schools offering computer literacy subjects
How computer literacy subjects are offered (eg as part of regularcurriculum integrated with other subjects etc)
School personnel handling computer courses in the school
Purposes for which computers are used as part of instruction
Fees collected for computer use internet access
Computer use by non-formal education learners
Presence of computersin schools
ICT Indicators Used in The Philippines (contrsquod)Agency responsiblefor data gathering ICT indicators Components of ICT indicators
ICT Indicators Used in Slovenia
Information-telecommunicationsinfrastructure
Research on internetin Slovenia
Agency responsiblefor data gathering ICT indicators Components of ICT indicators
Telecommunication No of telephone connections No of telephone connections per 100 residents No of cellular phone connections NMT GSM No of cellular phone connections per 100 residents No of ISDN connections
Internet
No of internet providers No of backbone providers No of computers connected to the internet per 100000
residents No of wwwdomainsi web sites
Schools and relatedinstitutions
Internet
Schools with internet access (secondary schools primaryschools youth hostels kindergartens)
Pupils with internet access Schools with homepage
Computers networks and ISDN
Average number of computers per 100 employees Average number of computers per 100 pupils Share of schools with computers connected to network and
ISDN
23 23Final Report
ICT Indicators Used in Africa
Impact of ICT on qualityteaching and learning
School net educatordevelopmentprogramme
Agency responsiblefor data gathering ICT indicators Components of ICT indicators
1 ICT Skills Level of educator - includes assessment on skills suchas basic word processing e-mail and electronic informationaccessing skills
2 Integration Level - to be measured using the following guidelines
Educatorsrsquo Competence with ICT
Educators should be able to draw on generic ICT applications inorder to prepare for teaching
Educators should be generally competent in those ICTresources that could most benefit their teaching and the learnersrsquolearning
Educators should understand how to access and use electronicinformation and communications resources such as the internetfor the benefit of both the educator and the learner
Educators should know how to use ICT to improve theirprofessional and administrative efficiency
Educators should know how to encourage the development oflearnersrsquo ICT skills within the context of the lessons being taught
Integration of ICT with the curriculum
Educators should understand the key learning strategies thatinfluence the use of ICT to support teaching and learning
Educators should know how to organise their class andclassroom when making use of ICT to achieve lesson outcomes
Educators should understand the role of computer literacy withparticular reference to the educational use of computers as atool in a diverse and developing country like South Africa
Educators should know and understand the characteristics ofinformation particularly its role in learning and its ethical use andits credibility
Educators should be aware of current health legal and ethicalissues regarding the use of ICT in the classroom
Educators should understand how to assess the contributionof ICT to the process of learning
An evaluation instrument is created for assessments in this category
3 The Professional Growth of the educator - This is measuredinitially by conducting pre-course baseline studies in which theeducator reflects on existing practice and perceivedshortcomings This process begins with a workshop and isfurther pursued by the mentor in the follow-up period Progressevaluation of the impact of ICT and the development programmeon the educator as a professional is monitored by promptingfrom the mentor and the educator recording entries in anelectronic journal
4 Whole school levels - Whole school ICT use is measured in anumber of ways Staff ICT and integration-related proficienciesare measured individually or on a departmental or whole-staffbasis This is the choice of the school An instrument is used tomeasure the instructional use of technology in a school Thisinstrument categorises 6 levels of computer efficiency rangingfrom non-use to refinement The emphasis in this framework isgiven to the degree to which technology is used to support aconstructivist orientation to classroom pedagogy
24 Developing and Using Indicators of ICT Use in Education
Quantum jumpstrategy
All teachers and students to be IT and internet-literate by theyear 2002
Production of 250 titles of academic software and contentsannually and provision of funding worth 500 million Baht perannum to various communities for content development as wellas provide budget for localizing 2000 titles of useful foreigncontent
PC density target by the year 2006 as follows
1 20 for secondary school level
1 40 for primary school level
Investment in the production of IT and network equipment foruse in the education sector including software and multimedia
Provision of IT for education and professional development tothe under-privileged the disabled and common people seekinglifelong education
Provision of adequate radio frequencies for the education sector
Investment in research and development in IT for education atleast 400 million Baht per year
Establishment of monitoring and evaluating procedures andprotocols
Establishment of a National Institute of Technology for Education
ICT Indicators Used in Thailand
Value-added strategyGovernment ofThailand
Agency responsiblefor data gathering
ICT indicators Components of ICT indicators
Provision of software content and necessary supporting ITcurriculum via searching localizing producing to make betteruse of existing hardware in schools
Training of teachers to gain literacy in computer and internetuses
Establishment of maintenance programme for the existinghardware
Enhancement of the capabilities of organizations that can providesupport and services to schools by forming network of agenciesand individuals
Monitoring and evaluation of the use of technology for educationand collect data for planning purpose
Equity strategy Provision of a set of minimum requirement equipment andfacilities to needy schools including electricity 3 telephone lines5 computer sets 1 printer 3 sets of television 5 sets of radio 3internet accounts 100 hours per month via SchoolNetprogramme
Provision of a ldquoDigital Learning Centrerdquo (DLC) to the community
Training of teachers and trainers in IT and internet literacy
25 25Final Report
ICT Indicators Used in UK
Computers in schoolsNational Grid forLearning (NGFL)
Agency responsiblefor data gathering ICT indicators Components of ICT indicators
Computerpupil ratio
Average number of computers per school
Type age and multimedia capability of computers
Average number of computers used for management andadministrative purposes
Average number of computers linked to an international schoolnetwork
Different types of computer peripherals available
Internet and electronic Connectivity to the net
Number of schools connected to the internet at broadband level
Percentage and number of schools who have their own website
At least one networked computer with internet access in eachschooll for management and administration
E-mail access
Teacher confidence anduse of ICT in teaching
Teacher confidence
Use of ICT in subjects
Benefit of ICT in subject
Expenditure on ICT Estimated total
Average per school
Average per pupil
ICT Indicators Used in the United States of America
Internet use by teachers
Agency responsiblefor data gathering ICT indicators Components of ICT indicators
Teaching learning andcomputing A nationalsurvey of schools andteachers Centre forResearch onInformationTechnology andOrganizations
Public schools with internet access
Internet connections in classrooms of teachers
Teacherrsquos internet access at home and in their classroom
How often teachers use information from internet in lessons
Teacherrsquos use of electronic mail to communicate with teachers inother schools
Per cent of teachers having their students use different types ofsoftware
Student use of web browser software in lessons
Internet use for beyond classroom student projects andpublishing
Teacherrsquos perceived value of having a computer with electronicmail on their own desk
Teacherrsquos perceived value of classroom world wide web access
Internet use from various locations (home school etc)
Internet use by subject matter taught
Internet use by school level taught
Ability to use web search engine
26 Developing and Using Indicators of ICT Use in Education
Teacher and teacherdirected student useof computers andsoftware
Teacher directed student use of computers
1 Access to classroom computers
Computer-student ratios on classrooms
Number of classroom computers
Computer access in lab and media centres versus classrooms
2 Computer platforms used by student
Extent and variety of software used and teachers objectives for use
1 Type of software used
2 Software that teachers judge as most valuable for students
3 Objectives for computer use
4 Student computer use for school work on their own time
Teacher computer extertise and professional use
1 Use of software in profession
2 Expertise with computers
Technology support Average weekly hours spent by technology co-ordinator ondesignated job tasks
Average minutes spent per week by technology co-ordinatoron job tasks per teacher
Percentage of technology co-ordinators reporting additionalsupport from others (eg teachers district officers aidesadministrators etc)
Teacher rating of availability of technology support (per schoollevel and per type of school)
Total support hours per teacher (per school level and per typeof school)
Number of development occasions for teachers (per schoollevel and per type of school)
Technology support content used to deliver technologyservices to teachers [eg (1) facilities network and internetaccess hardware software (2) staff assistance and necessaryservices technical support help desk network services (3)one-on-one personal guidance computer experts for troubleshooting]
Percentage of teachers who have resource (ICT) available foruse
ICT Indicators Used in the United States of America (contrsquod)Agency responsiblefor data gathering ICT indicators Components of ICT indicators
Presence of computersin American schools
Total instructional computers
Students per computer
Type of computer in each school level
Per cent of computers with selected attached peripherals
Locations of instructional computers
Per cent technology-intensive by school level
Software saturation
Software diversity
Type of internet access
Public schools with internet access
27 27Final Report
Per student expenditure on hardware software and supportper school level
Instructional technology expenditure by US schools (hardwaresoftware and support
Per student expenditure on hardware software and supportfor one year vs five-year estimates
Five-year technology expenditures per student for schools withand without their own technology budgets
Five-year technology expenditures (per student) for public andnon-public schools
School technology expenditures (per student) by communityincome level
Five year school technology expenditures (per student) by levelof technology penetration
ICT Indicators Used in the United States of America (contrsquod)Agency responsiblefor data gathering ICT indicators Components of ICT indicators
School investments ininstructional technology
ICT Indicators in UzbekistanAgency responsiblefor data gathering ICT indicators Components of ICT indicators
Number of computer classes
ICT integration in subjects like physics chemistry and biology
Teacher training
Establishment of ICT departments in universities to train teachers for school
IT as a subject in general education
Number of trained teachers
Provision of computer labs in schools
Collaboration in international training about IT
Application of IT in school management
Government
ICT Indicators in Viet NamAgency responsiblefor data gathering ICT indicators Components of ICT indicators
Establishment of ICT departments in universities to train teachers for school
IT as a subject in general education
Number of trained teachers
Provision of computer labs in schools
Collaboration in international training about IT
Application of IT in school management
Government
1
1IIAttachment
Comparison ofICT Indicator Themesin Selected Countries
29
29
Final Rep
ort
Basis for ICTindicatorsagency
who formulatedICT indicators
Presence ofstandards for
technology use
Educationallevel covered
Respondents of studies
Technologiescovered
in studiesType of indicators
Presence ofindicators
addressing equityethics and
investment issues
Presence ofindicators on ICT
integration incurriculumimpact etc
Goals and objectivesof the governmentAll students will leaveschool as confidentcreative andproductive users ofnew technologiesparticularlyinformation andcommunicationstechnologies andunderstand theimpact of thosetechnologies insociety
Yes Curriculumand StandardsFramework (CSF)
Primary secondarynon-formal
Teachers students Computers internetuse of satellite TV
Quantitative andqualitative
Not specified Yes specificallythe studyconducted by theUniversity ofSydney Includestudies on studentengagemententhusiasm andmovitationimprovement ofhigher-orderthinking skills etc
Based on a meetingconvened in IITEMoscow in 2000 todevelop a set of ICTindicators
None Primarysecondary andtertiary levels
Heads ofdepartmentssenior specialistsstaff of nationalCentres ofInformationalTechnologies andEducation orCentres of TeacherTraining Retrainingand EducationalSupport
Computers andinternet
Quantitative -policy documentsICTs in curriculumhardware andequipmentsoftware Globalcommunicationmeans andpersonneldevelopment
None Partly
Australia
Baltic andCIScountries
30
Develop
ing and U
sing Indicators of IC
T Use in E
ducation
Basis for ICTindicatorsagency
who formulatedICT indicators
Presence ofstandards for
technology use
Educationallevel covered
Respondents of studies
Technologiescovered
in studiesType of indicators
Presence ofindicators
addressing equityethics and
investment issues
Presence ofindicators on ICT
integration incurriculum impact
etc
Canada Two criteria fordevelopment ofindicator set
Type of educationinformation neededfor policydevelopment
Practical availabilityof dataindicatorsdeveloped by Pan-CanadianEducationIndicatorsProgramme (PCEIP)
None Elementary andsecondary level
Not specified Computers andinternet
Quantitative andqualitative
Pupil-computerratio
Internetconnectivity
Internet activitiesof students
Obstacles to fulleruse of informationandcommunicationstechnologies
None Yes specificallyon whatencouragesteachers andstudents to usecomputers
Europe 1 Indicators based onthe eEurope initiativeof the EuropeanUnion Action lineldquoEuropean youth intothe digital agerdquo Thegoal for the saidobjective is to turndigital literacy to abasic competence forall young EuropeansSIBIS Study
Yes ISTE (NETS)standards
Various researcherscovered differentlevel public primaryand lowersecondary primarysecondary andspecial schoolshead teachers andteachers
School headsteachers
ICT in generalcomputers andinternet access
Quantitative andqualitative
Policy andstrategy
Economy andinfrastructure
Use and access
Competencies
Yes specifically onnational policiesand expenditure
Yes oncompetency ofICT instructors
Europe 2 Eurydice Yes ISTE(NETS)standards
Primary andsecondary level
Not specified Computers andinternet
Mostly quantitativevery little on qualita-tive indicatorsExamples
Number of pupilsper computer
Desirable ICTskills according toofficial recom-mendations forthe initial trainingof all teachers(except specialistICT teachers)
Mainly onexpendituredistribution ofbudget
Yes on integrationof ICT in subjects
31
31
Final Rep
ort
Basis for ICTindicatorsagency
who formulatedICT indicators
Presence ofstandards for
technology use
Educationallevel covered
Respondents of studies
Technologiescovered
in studiesType of indicators
Presence ofindicators
addressing equityethics and
investment issues
Presence ofindicators on ICT
integration incurriculumimpact etc
India Government None Elementary andsecondary schools
Not specified Computersinternet software
Quantitative None None
Indonesia Curriculum Centre
Governmentrsquos goalsand objectives
None Elementary andsecondary schools
Not specified Computers andthe internet
Quantitative Moreof internet andcomputer use andaccess
None None
Japan eJapan priority policyprogrammevarioussurveys conducted bygovernment agencieson ICT in general Likethose conducted bythe Ministry of PostsandTelecommunicationsSurvey on SocialEducation
None Elementary andsecondary in someindicators notspecified in otherindicators
Not specified Computers andinternet
Quantitative Moreof internet andcomputer use andaccess
Yes Governmentgeneral IT policy onelementary andsecondary schoolsthe same forschools for theblind and disabled
None
Republic ofKorea
Cyber Korea 21Vision To preparestudents forknowledge basedsociety by realizinglife-long learning viacyber-educationsystemrdquoKoreaNational StatisticsOffice
Yes - based onthe documententitled Adaptingeducation to theinformation ageA white paper
Elementarysecondary
Teachers andstudents andschoolheadmasters
Computersinternet andmultimedia
Quantitative Moreof internet andcomputer use andaccess throughinput utilizationand outputindicators
None None
Malaysia Government None Elementary andsecondary schools
Not specified Computers andthe internet
Quantitative None None
Quantitative andqualitative
Telecommunica-tions equipment
How schoolsteachers andstudents usetelecommuni-cationstechnologies
New Zealand Research conductedby the TelecomEducation Foundation
None Not specified Teachers andprincipals
Telephone linesfax machinescomputers andinternet
None Yes specificallyon whatencouragesteachers andstudents to usecomputers
32
Develop
ing and U
sing Indicators of IC
T Use in E
ducation
Philippines
Basis for ICTindicatorsagency
who formulatedICT indicators
Presence ofstandards for
technology use
Educationallevel covered
Respondents of studies
Technologiescovered
in studiesType of indicators
Presence ofindicators
addressing equityethics and
investment issues
Presence ofindicators on ICT
integration incurriculumimpact etc
Senate Committee onEducation Arts andCulture with SEAMEO-INNOTECH
Department ofEducation
None Public and privateelementary andsecondary schools
School heads All ICT relatedtechnologies suchas televisionprojectors radiocassette playerscomputersperipherals andinternet access
Quantitative Availability of
publiccommercialutilities andservices
Computer skillsof schoolpersonnel
Presence ofcomputers inschools
Instructionalacademic useof computers
Yes specificallythose pertaining touse of computers bynon-formaleducation students
None
Research on internetin Slovenia
None Primary secondaryyouth hostels andkindergartens
Not specified Computers andinternet access
Quantitative
Internet access
Computersnetworks
None None
School net None Not specified Students andteachers
Computers andinternet access
QualitativeexamplesIntegration of ICTwith curriculuminstructionalpractices barriersto computer use
None Yes oncompetency ofICT instructors
Government NationalEducation Act of1999
None Primary andsecondary schools
Not specified Computersinternettelephonescomputerperipherals ratio
Quantitative None None
Philippines
Slovenia
South Africa
Thailand
33
33
Final Rep
ort
Basis for ICTindicatorsagency
who formulatedICT indicators
Presence ofstandards for
technology use
Educationallevel covered
Respondents of studies
Technologiescovered
in studiesType of indicators
Presence ofindicators
addressing equityethics and
investment issues
Presence ofindicators on ICT
integrationin curriculumimpact etc
UK National grid forlearning
ISTE (NETS)standards
Primary andsecondary schools
Students andteachers
Computers and theinternet
Quantitative andqualitative
Computers inschools
Internet andelectroniccommunication
Teachercondidence anduse of ICT inteaching
Expenditure onICT
Yes mainly onexpenditure andbudget allocation
Yes includesteacherconfidence in theuse of ICT andbenefit of ICT
US Teaching learningand computing - astudy of teacherrsquosuse of computertechnology theirpedagogies andtheir school context
ISTE (NETS)standards
Public and privateschoolselementary middleschool and highschool all subjectsexcept physicaleducation andspecial education
Teachers Computers internetuse (includes use ofvarious softwareCDRom etc
Quantitative andqualitative School
technologyleadership andtechnologyoutcomes
Pedagogicalmotivations forstudent computeruse
Internet use byteachers
Presence ofcomputers inAmerican schools
Teacher andteacher directedstudent use ofcomputers andsoftware
Technologysupport
Schoolinvestments ininstructionaltechnology
Yes includesindicators thatdeterminestechnology intensiveareas softwaresaturation etc
Yes specificallypedagogicalmotivations forstudent computeruse
UK
US
34
Develop
ing and U
sing Indicators of IC
T Use in E
ducation
Basis for ICTindicatorsagency
who formulatedICT indicators
Presence ofstandards for
technology use
Educationallevel covered
Respondents of studies
Technologiescovered
in studiesType of indicators
Presence ofindicators
addressing equityethics and
investment issues
Presence ofindicators on ICT
integration incurriculumimpact etc
NoneUzbekistan Government Lawon Education
None Primary andsecondaryeducation
Not specified Computer andinternet
Quantitative None
Viet Nam Government
Governmentrsquos goalto ldquouniversalizerdquoeducation
None Primary andsecondary
Not specified Computer andinternet
Quantitative None None
1
1IIIAttachment
Studies on the Use andImpact of ICTin Education
35 35Final Report
Several studies have been conducted on ICT and its use and impact on educationsome of which are included below
This survey on the information and communications technology (ICT) provisions inschools in England was carried out in April 2001 the findings of which were comparedto similar surveys conducted in 1998 1999 and 2000 The surveys collectedinformation on the number and type of computers available in schools expenditurein schools the extent and benefit of the use of ICT across curriculum subjects theuse of internet and other electronic network communication links and teacherusage of computers and their confidence in the use of ICT in the curriculum It is asample survey and the sample is chosen to be representative of different types ofschools throughout the country Some of the findings as categorised are thefollowing
a Computers in schools
average number of computers per school increased steadily in all types ofschools between 1998 and 2001 the increase was noted to be greatbetween 2000 and 2001
b Internet usage and other external electronic communication services
between 1998 and 2001 there was a considerable increase in thepercentage of schools connected to the internet
c Use of ICT in teaching and teacher confidence
in each type of school there was an increase in the percentage of teachersreported to feel confident in the use of ICT in 2001
d Expenditure on ICT
the average expenditure on computers per school increased steadily in allschool types between 1998 and 2001
Source Statistics of EducationSurvey of Information and Communications Technology in Schools 2001National Statistics BulletinDepartment for Education and SkillsIssue No 0901October 2001
The Center for International Development (CID) at Harvard University conducted aresearch which came up with the Network Readiness Index (NRI) a majorinternational assessment of countriesrsquo capacity to exploit the opportunities offeredby ICTs In the development of the NRI data sources fall under two generalcategories First a variety of measures mainly ldquohardrdquo variables and also ldquosoftrdquoones from sources such as the World Bank the International TelecommunicationsUnion Freedom House and the Business Software Alliance were used Seconddata collected from the questionnaire responses of more than 4500 business andgovernment leaders surveyed in 75 countries by the Global Competitiveness Reportrsquos2001 Global Executive Opinion Survey conducted by Harvard University and theWorld Economic Forum were heavily relied upon
The Network Readiness Index is an assessment of a countryrsquos capacity to makeuse of ICT resources It shows how nations are performing with regards to theirparticipation in the Networked World Seventy-five countries were computed NRIs
B The Network Readiness Index Measuring thepreparedness of nations for the networked world
A Survey of information and communicationstechnology in schools 2001 in England
36 Developing and Using Indicators of ICT Use in Education
and the United States of America tops the NRI ranking making it the most highlydeveloped ICT network and it has the greatest potential to exploit networkrsquos capacityIceland Finland Sweden Norway and Netherlands follow USA Another NorthernEuropean country Denmark ranks 7th followed by Singapore in 8th Austria in 9th
and the United Kingdom in the 10th place Among the countries in the region whichwere included are Korea rank number 20 followed by Japan in the 21st placeMalaysia in number 26 Thailand number 43 India number 54 Philippines number58 followed by Indonesia in number 59 Sri Lanka in number 62 China in 64Bangladesh in 73 and Viet Nam in 74
Two components were taken into consideration in the computation of the NRIThese are network use and enabling factors Network use is defined as the measureof the extent of increase in the use of ICT in a specific country This is still narroweddown to five more catagories Internet users per hundred inhabitants cellularsubscribers per hundred inhabitants internet users per host percentage ofcomputers connected to the internet and availability of public access to the internet
Enabling factors is made up of four sub-indices network access network policynetworked society and networked economy Network access includes variablesrelated to the information infrastructure hardware software and support Itmeasures the extent and quality of the network infrastructure and the existence ofequipment programmes and support services that enable ICT use Network policyrefers to the information and communications policy environment and the businessand economic climate It also deals with the levels of competition in thetelecommnications and ICT sectors Networked society measures the quality andextent of use of ICT facilities in the learning process and networked economyassesses the extent of public and private sectors participation and e-governmentare considered in this sub-index
Source httpwwwcidharvardeducrpdfgitrr2002-cho02pdf
This is a national population survey of public and private elementary and secondaryschools conducted by SEAMEO INNOTECH in the Philippines under Project TAOCARES last March 2001 Its main objective was to determine the ICT capabilitiesof schools A total of 45811 schools were given questionnaires with the schoolheads as respondent of which 7937 per cent responded The survey questionnaireconsisted of 42 items mostly focused on the readiness of schools in terms ofinfrastructure hardware software and manpower capabilities on ICT Outputs ofthe survey were sixteen regional profiles on the ICT-preparedness of schools whichincluded data on the availability of electricity access of schools to communicationfacilities presence of computers computer peripherals and other multi-mediaequipment in schools sources of funds to maintain ICT-related operations proficiencyof school staff in the use of computers training received on ICT computer coursesbeing offered in schools and other ICT-related information
Some of the major findings of the survey at the national level are the following
Only 6607 per cent of schools have electrical connections
Only 1330 per cent have landline telephones 290 per cent have fax machinesand 200 per cent have internet connections
5217 schools only or 1428 per cent have computers with the National CapitalRegion having the highest percentage at 8730 per cent
Only 1824 per cent of schools have staff proficient in the use of computers
C Profile on the capabilities of elementary and secondary schools in the Philippines 2000-2001
37 37Final Report
7862 per cent of schools get funding to maintain ICT related operations fromthe PTCA
Only very few schools (1313 per cent) have school heads who have receivedICT training in the past five years
6436 per cent of school heads need training on basic computer literacy
This study was conducted by the New Educational Technologies Foundation Inc anon-profit organisation composed of schools that believe in the capacity of IT toimprove the quality of student learning and efficiency of teaching A total of 794schools participated in the survey with school heads in the public and private schoolsas respondents The questionnaire was divided into two parts the first part askedabout perceptions level of awareness and attitudes regarding the value of computereducation and was answered by users and non-users of computers The secondpart which dealt with the actual use of computers was answered by users onlyAmong the findings are the following
The number of computers owned by a private schools is twice as much aswhat a public school can afford
Computers available in schools are mostly the models AT486
Most computer units in the public elementary schools were acquired throughdonations in the secondary and tertiary schools most computers were acquiredthrough purchase
Computers are mostly used to teach different application programmes
Source The 1996 National Survey on Computer Education New Educational TechnologiesFoundation Inc
D The 1996 national survey on computereducation in the Philippines
In a primary school in Sunnyside Elementary School Pullman Washington studentsare using e-mails web sites videos and video conferencing technology tools todevelop their learning skills Through these mediums the students alongside theirglobal peers identify and share their cultures with one another in new waysTraditionally students learn about the world through books but new technologyallows the students to get in depth information about different cultures throughwriting reading and communicating with their global peers The following are theassessment tools used Assessment rublics designed for specific projects lessonandor classroom experiences standard assessment tools (ie DRA and WrightGroup Reading Assessments) teacher anecdotal notes childrenrsquos ownmetacognitive voices in the process of learning in conference with the teacherand in self-reflection of work and presentations parentsrsquo reports of student learningprogress
Teaching in non-traditional ways can sometimes be a risky business - with all eyesupon the class to see if learning is taking place It has been shown that studentsform teams to read write and communicate using technology at rates that meetand exceed standards for primary classes But along the way the added value oftechnology contributes in areas such as thinking skills social skills engagement inlearning motivation teaching and collaborating as the class sees what is essentialto learn in the context of the real world
Source httpwwwncrelorgengaugeframeworkefpalignefpalisuhtm
E Use of multiple assessment tools
38 Developing and Using Indicators of ICT Use in Education
F Technology A major catalyst for increasing learning by Jody C Isernhagen University of Nebraska-Lincoinby Jody C Isernhagen University of Nebraska-Lincoinby Jody C Isernhagen University of Nebraska-Lincoinby Jody C Isernhagen University of Nebraska-Lincoinby Jody C Isernhagen University of Nebraska-Lincoin TTTTTechnologechnologechnologechnologechnology Horizons in Educay Horizons in Educay Horizons in Educay Horizons in Educay Horizons in Educationtiontiontiontion Journal Online Journal Online Journal Online Journal Online Journal Online August 1999 - FeaAugust 1999 - FeaAugust 1999 - FeaAugust 1999 - FeaAugust 1999 - Featuretureturetureture
A rural public school in Nebraska composed of 1400 students applied for a three-year competitive Excellence in Education Grant in late 1995 Six schooladministrators and 18 staff members designed a plan to restructure their schooland classrooms The staff members defined that the major skills needed by studentsare comprehension reasoning composition and experimentation A computerwas placed in each classroom (80 classrooms) and 27 computers were located inthe elementary Integrated Learning Lab with Computer Curriculum CorporationSuccess Maker Software This software automatically diagnoses and placesstudents on the appropriate skill level while using the computer The computer labwas used by 314 students and 13 teachers in grades 1-3 from January 1996through May 1998 Teachers were trained on the use of ClarisWorks MicrosoftWord E-mail Internet Presentation Stations and the integration technology as atook in teaching and learning Activities of the students involved computer buildingdesigning of web pages to help maintain the schoolrsquos web pages digitizing video topresent to the community creating panoramic views and interactive virtual realityscenes preparing letters of application resumes and cover letters and to searchthe web for jobs With all the activities the teacher served as guides figuring outwith the students how to arrive at a productive presentation
The CAT scores in reading and math for students using an Integrated Learning Labfor 25 years showed a significant difference between the means The scores ofstudents testing below the 50th percentile at grades 1-3 in reading and math increasedsignificantly over time These findings suggest that using an Integrated LearningLab with rural primary age children daily over an extended period of time maypositively impact achievement for students particularly those students functioningbelow the 50th percentile
Source httpwwwthejournalcommagazinevaultarticleprintversioncfmaid=2126
G The impact of ICT on literacy learning in English
This report is the result of a literature review conducted first to identify a number ofstudies that might shed light on the major impact of ICT on literacy learning inEnglish for 5 to 16 year olds and the second to undertake an in-depth review ofthe papers that were identified as being on the impact of networked ICT on literacylearning in English for ages 5 to 16 There were 1871 studies screened following acriteria to identify relevant reports 188 studies were found that met the criteria inthe protocol These studies were then keyworded or indexed and the results filedon an electronic database
Of the 188 studies relevant to the mapping study 16 pertained to the topic of theimpact of networked ICT on literacy learning Data were extracted from these 16studies and were used as basis for an in-depth review Of these half were outcomeevaluations (evaluations of the results of an experiment or innovation) seven wereprocess evaluations (evaluations on how an intervention was delivered rather thanwhether it worked or not) and one was a needs assessment
Results show that as far as the in-depth study on networked ICT goes results areinconclusive Concerning policy and practice the recommendations of this revieware highly tentative and take the form of implications or pointers With regard topolicy they are to focus research funding for large-scale studies to give considerationto the balance of study type expertise in research teams and to give consideration
39 39Final Report
to the fact that the provision of computer hardware and software to schools andthe application of ICT in teaching and learning need to be informed by researchand evaluation
Source httpeppiioeacukEPPEWebhomeaspxpage=reelreview_groupreview_ one_abstractht
H Education Research Fund Effective Integrationof IT in Singapore Schools Pedagogical
and Policy ImplicationsThis is a report on the key findings of a questionnaire survey aimed at identifying thedegree of information technology (IT) integration among Singapore schools Thesurvey is the first part (Phase One) of a larger study funded by the Ministry ofEducation of Singapore aimed to examine and analyze where and how IT is integratedin Singapore schools to develop pupilsrsquo higher order thinking skills A total of 328schools responded to the survey of which 168 are primary schools 144 secondaryschools and 16 junior collegescentralized institutes (JCCs)
Major findings of the questionnaire survey include
Phase I schools in the IT Masterplan have significantly higher pupil and teacheruse of IT greater opportunities for staff development of teachers and moreconducive IT culture than Phase III schools
Independent-autonomous schools have significantly better management of ITresources higher teacher and pupils use of IT greater opportunities for staffdevelopment for teachers and more conducive IT culture than governmentschools
There are no significant differences among the primary schools secondaryschools and JCCs in terms of the management of IT resources pupil andteacher use of IT staff development and school IT culture
The correlations among management of IT resources pupil use of IT teacheruse of IT staff development and IT culture are significant and highly positive
- Contents
-

1
13Section
Methods ofCollecting Indicators
11 11Final Report
There are various ways of collecting data based on predetermined ICT indicatorsOf course the most popular one is the use of survey questionnaires farmed out toa representative sample of schools school heads and teachers either on a regularor one off basis Clearly those done more regularly can track the behaviour of theindicators over time Weaknesses in ICT implementation can be remedied in duecourse new strategies in ICT implementation can be worked out and carried outthus increasing the probability of success of ICT programmes and projects Theone-shot survey is more appropriate for a summative kind of assessment in whichwe are more interested in finding out for instance the longer-term impact of ICTuse
Where the telephone system in a particular country is well developed enough thatmost homes have access and long distance calls are cheap the telephone interviewis a more cost-efficient method of data collection For example EURYDICE BasicIndicators on the Incorporation of ICT into European Education Systems Project((httpwwweurydiceorgDocumentsTicBIenFrameSethtm) conductedEurobarometer surveys over the telephone in 2001 covering a representative sampleof school heads and teachers in each EU country The questions put to the schoolheads were mainly concerned with their school ICT equipment and facilities whilethose asked of the teachers included the use of computers and the Internet withtheir pupils (time spent using them frequency of their use reasons for not usingthem etc) and how ICT had changed the way they taught Slovenia also made useof telephone interviewing as a method of data collection augmented by publicopinion surveys in person on a one-to-one basis (httpwwwrisorg) Data oninformation-telecommunication infrastructure such as telephone cellular phoneand ISDN connections number of Internet providers backbone providers and thelike were gathered from the telecommunication companies themselves (Details ofindicators used in the above surveys are in Appendix I)
In Australia the national monitoring of ICT skills and knowledge of students in Year6 (aged 10-12 years) and Year 10 (aged 14-16 years) will be done by means ofthree-yearly sample assessments commencing in 2005 Student outcomeinformation is the focus of the reporting agenda Assessment techniques should beinnovative and model good assessment practice and wherever possible assessmentmaterials developed for national sample assessments should be available for use bysystems and schools Collection and use of data for national purposes will in allrespects conform to the guidelines provided in the report Data Principles and Protocolsagreed by the PMRT and where performance in different years in a particular domainis the focus of measurement a single domain scale should underpin measurementsof student achievement The assessment methods will include a mix of tests onpaper and on line and performance assessment tasks with teacher assessment
The study by Singapore to measure the effective integration of ICT in schoolsindicated that to gather accounts by various groups and individuals in the learningenvironment both qualitative and quantitative methods were drawn upon such asobservations of IT and non-IT based lessons face-to-face interviews with principalsand IT co-ordinators group interviews with students and teachers questionnairesfor teachers and students and samples of studentsrsquo work
Survey questionnaire
Telephone interview
3 -yearly sample assessment
12 Developing and Using Indicators of ICT Use in Education
Where there is a saturation of Internet connectivity in the country that is most ofthe homes schools and offices are connected use of questionnaires posted on thewebsite of the institutionagency conducting the surveys can be an efficient methodof collecting data on indicators Furthermore communication by emails betweenthe respondent schools school heads teachers and even students will facilitatedata gathering Data entered into the web-based questionnaire can be automaticallyuploaded to the institutionagencyrsquos computer server located thousands of milesaway
Notably the UNESCO IITE survey met with some difficulties because the collectionof data depended primarily on the efforts and contributions of heads of departmentssenior specialists and the staff of national Centres of Informational Technologies inEducation or Centres of Teacher Training Retraining and Educational Support whowere not given any financial support agreeing to work due to an official memorandumThus many of the results were generated from expertsrsquo estimates rather thandirect collection of data from teachers students and schools
EnGuage a new Web-based framework developed by NCREL in the USA (httpwwwncrelorgengauge) is a response concern regarding the ever-increasinginvestment in educational technology by providing answers to three significantquestions to wit What value does technology bring to the schools How can ourschools ensure a return on these investments And why does technology work insome schools and not in others EnGuage is a tool set designed to help schoolsand school districts use technology effectively for learning teaching and managing
The School Technology and Readiness (STAR) Chart (httpww2isteorgstarchart) provides another web-based self-evaluation tool providing schools withthe information they need to better integrate technology With STAR Chart onlinemultiple-choice questionnaire can be completed that will provide instant feedbackThe Chart identifies and defines four school profiles ranging from the ldquoEarly Techrdquoschool with little or no technology to the ldquoTarget Techrdquo school that provides a modelfor the integration and innovative use of educational technology It is not meant tobe a measure of any particular schoolrsquos technology and readiness but rather isintended to serve as a benchmark against which every school can assess andtrack its own progress
The STAR Chart can help any school or community answer three criticalquestions
Is your school using technology effectively to ensure the best possible teachingand learning
What is your schoolrsquos current education technology profile
What areas should your school focus on to improve its level of technologyintegration
The method of data collection for ICT indicators will then vary from country tocountry depending on the spread of telecommunication use such as the telephoneand the Internet It will also depend on whether the existing M and E systems canstill accommodate additional data collection tasks to monitor and evaluate ICTimpact in schools Additional variables based on ICT indicators can be integratedinto the existing database system
Internet-based surveys
Web-based self-evaluation tool
1
14Section
Various Software orDatabase Systems for
Storing Indicators
13 13Final Report
Below are a few of the software or database systems worth considering in developingthe databases for ICT indicators
Spreadsheet programmes such as IBM Lotus 123 and MS Excel
Statistical programmes such as Statistical Package for the Social Sciences(SPSS)
Customized database programmes using MS Access (for small databases)
SQL Server MAGIC (for big databases)
For data-based driven web applications (Visual Interdev Java Visual Basic) thereis anoother software available in the market which can be used to create the ICTdatabases Technical staff will be able to assist in determining the most feasible anduser-friendly software adequate to answer specific needs
1
1IAttachment
ICT IndicatorsUsed in
Different Countries
15 15Final Report
Government What students should know and be able to do at a certain level
Connectivity Number of teachers with notebook Computer student ratio Bandwidth available in schools Type of internet connection
Changes in studentperformances afterintegrating ICT intoeducation
Increase in student engagement enthusiasm and motivation If student-centred learning took place Improvement in studentsrsquo high-order thinking skills improved Occurrence of changes in teaching practices Improvement in the ability to use emerging technologies
University of Sydney
ICT Indicators in Baltic and CIS Countries
Hardware equipment Computer classroom availability in educational institutions (EI) The average number of students per one computer in EI equipped
with computer classrooms Percentage of IBM- and Apple-compatible computers in total
number of EI computers Percentage of EI equipped with one or more multimedia system in
total EI equipped with computer classroom number Percentage of EI equipped with local network to total EI equipped
with computer classrooms number
Software Percentage of computers with installed OS DOSTM to total numberof computers in computer classes
Percentage of computers with OS WindowsTM of Apple Macintoshto total computer number in computer classes
Per cent of computers with other OS to total computer number incomputer classes
Percentage of EI with any educational software for teaching thecorresponding subjects to total EI number with computer classes1 Elementary School subjects2 Science subjects3 Humanities4 Informatics or information technologies
Percentage of educational software designed by the specialistswithin the country to total number of educational software usedin EI for teaching of the corresponding subject curriculum(elementary school science subjects humanities informationsinformation technologies)
Percentage of educational software designed by foreign specialiststo total number of educational software used in EI for teaching ofthe corresponding curriculum (elementary school science subjectshumanities informaticsinformation technologies
Components of ICT Indicators
UNESCO Institute ofInformationTechnology inEducation
Official documents Official documents in ITICTs in secondary education Official documents in ITICTs in secondary education currently
in force
ICT in curricula Available state curriculum on informatics andor InformationTechnologies
Informatics andor Information Technologies as a separate subject ICT usage to support other subjects implied in curricula on these
subjects
Global communication Percentage of EI without internet access Percentage of EI with limited internet access - only e-mail Percentage of EI with access via dial-up channel Percentage of EI with access via dedicated line Percentage of EI with own web-pages
ICT Indicators in AustraliaAgency responsiblefor data gathering ICT indicators Components of ICT indicators
Agency responsiblefor data gathering ICT indicators Components of ICT indicators
16 Developing and Using Indicators of ICT Use in Education
Personnel development Percentage of elementary school teachers subject teachers(except teachers of Informatics andor Information Technologies)teachers of informatics and EI administration who haveundertaken the computer literacy course from 1 September 1999until present time1 Less than 50 hours (Index 1)2 50-100 hours (Index 2)3 Over 100 hours (Index 3)
Computer skills of elementary school teachers subject teachersand teachers of Informatics and administration1 Elementary computer literacy2 Proficiency in ICT field
ICT Indicators in Baltic and CIS Countries (contrsquod)Agency responsiblefor data gathering ICT indicators Components of ICT indicators
ICT Indicators in Canada
Pan-CanadianEducation IndicatorsProgramme (PCEIP)
The pupil-computer ratio is a proxy measure of the access of availabilityof computer to students in schools Only computers used for educationalpurposes are included in the ratio
Internet connectivity This is a measure of the percentage of students attending schools thatwere connected to the internet for educational purposes at the time ofthe survey Schools that were connected for administrative purposesonly were excluded
Internet activities ofstudents
School ICT co-ordinators were questioned about instructional activitiesinvolving the use of the internet They were asked to identify typicalactivities that students at certain grade levels would have engaged in bythe end of the school year
Obstacles to fulleruse of informationand communicationstechnologies
Principals were asked to identify the major barriers hindering theachievement of their schoolrsquos computer-related goals for students Inthis section items are presented that are identified as major obstaclesby principals of schools representing at least 50 per cent of enrolmentsat each of the three levels of schools The obstacles noted have beengrouped into three categories those relating to hardware and softwarethose relating to instruction and those relating to the training of teachers
Agency responsiblefor data gathering
ICT indicators Components of ICT indicators
ICT Indicators Used in Europe (Denmark Sweden Finland Norway and UK)
Information SocietyTechnologyProgramme fundedby the EuropeanCommunity
Policy and strategy Countries with an official policy on the use of ICT
Schedule for implementing national ICT education projects
Responsibility for the purchase and maintenance of hardware
Objectives in national ICT projects
Inclusion of ICT in the national curriculum
Schools with ICT implementation plan (simple)
Schools with ICT implementation plan (detailed)
Approaches of ICT defined in the curriculum
Objectives defined in the curriculum for the teaching or use of ICT
Schools with autonomous decision power
Agency responsiblefor data gathering ICT indicators Components of ICT indicators
Pupil-computerratio
17 17Final Report
Use and access Pupils and teachers with a personal e-mail address
Use of ICT in areas of the curriculum
Use of external electronic communication services
Teachers use the internet for non-computing teaching
Internet use in teaching
Teachers opinion about the internet as a tool
Pupils access to the internet
Teachers access to computer and internet at home
Who pays teachers home access
Teachers who connect with other schools via the internet
Competencies New ICT and media students in percentages of all students
New ICT and media students by level of education
Qualifications and degrees in information technology and mediastudies
Population with a degree of qualification in ICT and media studies byfield of study and level of education
Hoursyears spent to pedagogical IT guidance
Hoursyears spent to technical IT guidance
Teachers confidence in the use of ICT
Students and teachers knowledge regarding ICT
Specialist ICT teachers
ICT courses during initial training of general class teachers
ICT trained teachers
Change in teaching methods
Average expenditure on ICT in schools
Sources of funding for ICT in schools
Total expenditures on ICT in schools
Distribution of the specific budget between the purchase ofequipment and expenditure on human resources
Number of computers per 100 pupils
Number and quality of computers available for administration pupilsand teachers
Expected increase in the number of computers
Computers with access to school net andor internet
Quality of internet access in schools
Placement of the computers
Schools with own website
Schools with on-line services
Schools with intranet website e-mail
Economy andinfrastructure
ICT Indicators Used in Europe (Denmark Sweden Finland Norway and UK) (contrsquod)Agency responsiblefor data gathering ICT indicators Components of ICT indicators
18 Developing and Using Indicators of ICT Use in Education
Inclusion of ICT in the curriculum
Percentage of teachers who use computers andor internet in theclassroom
Approaches to ICT defined in the curriculum
Objectives defined in the curriculum for the teachingor the use of ICT
Inclusion of ICT in the initial training of all teachers (except specialistICT teachers)
Inclusion of ICT in the curriculum
Percentage of teachers who use computers andor internet in theclassroom
Reasons given for not using internet with pupils
Approaches to ICT defined in the curriculum
Annual number of hours recommended for teaching ICT as a subjectin its own right
Objectives defined in the curriculum for the teaching or the use ofICT
Inclusion of ICT in the initial training of all teachers (except specialistICT teachers)
Percentage share of compulsory teaching related to ICT and thenumber of hours devoted to such teaching in the initial training of allteachers (except specialist ICT teachers)
Desirable ICT skills according to official recommendations for theinitial training of all teachers (except specialist ICT teachers)
Secondary (lowerand uppersecondaryeducation)
Both Number of pupils per computer and number of pupils per computerwith an internet connection (primary and secondary education)
Responsibility for the purchase and maintenance of hardware(primary and secondary education)
Distribution of the special budget between the purchase ofequipment and expenditure on human resources (primary educationgeneral lower secondary education general upper secondaryeducation)
Average periods during which primary school teachers usecomputers (with or without internet connection) in the classroomhours per week
Specialist ICT teachers
Percentages of primary and secondary school teachers in Europewho have received official training in the use of computers andorinternet in their teaching
ICT Indicators Used in IndiaAgency responsiblefor data gathering
ICT indicators Components of ICT indicators
Ministry of HumanResourceDevelopment
Presence of MIS
Presence of software
ICT in textbooks
ICT in computer subjects
In-serv ice and pre-service training of teachers
Primary
ICT Indicators Used in EuropeAgency responsiblefor data gathering ICT indicators Components of ICT indicators
19 19Final Report
Student understanding of ICTrsquos benefits disadvantages as well aschallenges in information technology
Studentrsquos use of ICT knowledge in getting processing arrangingdistributing and keeping information
Governmentrsquos goalsand objectives
ICT Indicators Used in IndonesiaAgency responsiblefor data gathering ICT indicators Components of ICT indicators
Student application of knowledge skills and attitudes in designinginformation technology systems solving problems relating to ICT
Includes public halls libraries
Training hours of the principal Training hours of teachers implemented by the school itself Training hours on ICT use in education per teacher Percentage of operating budget vis-a-vis the total budget Percentage of teachers in the department of ICT Whether an ICT yearly plan exists or not Whether an incentive system for ICT personnel exists or not
ICT Indicators Used in Republic of Korea
Support
Agency responsiblefor data gathering ICT indicators Components of ICT indicators
bull Ministry ofEducation
bull KoreanEducationalResearch andInformationService (KERIS)
Inputs (infrastructurehardware software)
Number of students per computer Number of computers per teacher Percentage of computers less than 3 years old Percentage of computers connected to internet Speed of internet connection Number of educational software (CD-titles) Percentage of computers equipped with 5 basic applications
Number of students per PC
Internet access of students
Number of teachers inpublic schools who canoperate PCs
Number of teachers at elementary lower and uppersecondary schools and special education schools
Number of humanresources with IT-relatedmasterrsquos and doctoraldegrees
Number who graduated from masterrsquos course
Number who graduated from doctoral course
Number of foreign nationalswith the status of residenceldquoEngineerrdquo and number ofnationals entering Japanwith the status of residenceldquoEngineerrdquo
Number of registered foreign nationals
Number of foreign nationals entering Japan
Ensuring security andreliability
IT security measures (information security policies presenceof firewalls and back-up systems)
Number of public schoolswith internet access andcomputers
In households
In SMEs (companies with five employees or more)
In corporate (companies with 300 employees or more)
Number of internet users
ICT Indicators Used in JapanAgency responsiblefor data gathering ICT indicators Components of ICT indicators
e-Japan PriorityPolicy Programme
Public facilities withinternet access
20 Developing and Using Indicators of ICT Use in Education
Teachers
Percentage of subjects utilising multimedia materials for teachingand learning through WWW
Percentage of classes using web-board
Percentage of subjects using web-board
Percentage of teachers participating in an association regardingICT use
Percentage of subjects using computer lab
Percentage of functions of the Information System being used
Whether to use electronic decision system
Number of posting written for and by parents
Students
Hours of use of computer per student
Percentage of students participating in ICT special programmesafter school (Elementary)
Whether to teach on computer (Secondary)
Percentage of subjects collecting assignments through web board
Number of search library DB per students
Percentage of student-governing community utilising webenvironment
Whether a programme regarding internet ethics exists
Number of web communities per class
Internet
Usage of internet
Number of access to school website per week
How often school websites are revised
Output Teachers
Percentage of teachers having e-mail address
Percentage of teachers having homepage
Percentage of teachers having ICT certificates
Percentage of teachers participating in educational SW contests
Students
Percentage of students having e-mail address
Percentage of students having homepage
Percentage of students having ICT certificates
Percentage of students participating in educational SW contests
Percentage of students completing the ICT course (32 hours)
Utilization
Agency responsiblefor data gathering ICT indicators Components of ICT indicators
ICT Indicators Used in Republic of Korea (contrsquod)
21 21Final Report
Malaysian smart schoolsuse of technology forinformation processing andas a productivity tool toenhance professionaldevelopment and toautomate instruction
Malaysian government(Ministry of Education)
ICT in curriculum
ICT in pedagogy
ICT in assessment
ICT in materials
ICT Indicators Used in MalaysiaAgency responsiblefor data gathering ICT indicators Components of ICT indicators
How schools teachersand students usetelecommunicationstechnologies
Number of teachers taking in-service training using a tele-learningapproach
Obstacles faced by teachers in using telecommunicationstechnologies
Factors that encouraged telecommunications technology use
Percentage of teachers agreeing that telecommunicationstechnology can enhance learning and teaching
Percentage of students who had positive views about technologyactivities in school
Telecommunicationsequipment
Paper by David HarrisNZCER
Percentage of schools with telephone lines
Percentage of schools with classrooms that has telephone lines
Percentage of schools with fax machines
Percentage of schools with computers that has access to amodem
ICT Indicators Used in New ZealandAgency responsiblefor data gathering ICT indicators Components of ICT indicators
Availability of publiccommercial utilities andservices
Project TAO Cares(computer-assistedreforms for schools)senate committee oneducation arts andculture
Government throughthe Department ofEducation
Percentage of schools with electricity
Percentage of schools whose electricity is available for 24 hoursper day
Percentage of schools whose electricity is available year-round
Percentage of schools with ICT equipment
Percentage of schools where publiccommercial utilities andservices are available
Percentage of schools located in communities where publiccommercial utilities and services are available
ICT Indicators Used in The PhilippinesAgency responsiblefor data gathering ICT indicators Components of ICT indicators
Computer skills ofschool personnel
Percentage of schools staff who has computer skills
How school staff acquired computers skills
Percentage of school staff with expertise in using differentcomputer software
22 Developing and Using Indicators of ICT Use in Education
How were computers in the schools acquired
Location of computers in the school
Modes of set-up of the schools computers
Purposes for which computers are used
Operating system used
Software used for teaching and learning
How school acquired software programmes
Percentage of schools with internet access
Source of funds to pay for internet access
Internet connection arrangement (eg dial-up dedicated dial-upor leased line connection)
Who are given access to the internet (eg students principaladministrative staff etc)
Financial capacity to have internet access
How often computers are upgraded
Availability of funds for computer maintenance
Instructionalacademicuse of computers
Percentage of schools offering computer literacy subjects
How computer literacy subjects are offered (eg as part of regularcurriculum integrated with other subjects etc)
School personnel handling computer courses in the school
Purposes for which computers are used as part of instruction
Fees collected for computer use internet access
Computer use by non-formal education learners
Presence of computersin schools
ICT Indicators Used in The Philippines (contrsquod)Agency responsiblefor data gathering ICT indicators Components of ICT indicators
ICT Indicators Used in Slovenia
Information-telecommunicationsinfrastructure
Research on internetin Slovenia
Agency responsiblefor data gathering ICT indicators Components of ICT indicators
Telecommunication No of telephone connections No of telephone connections per 100 residents No of cellular phone connections NMT GSM No of cellular phone connections per 100 residents No of ISDN connections
Internet
No of internet providers No of backbone providers No of computers connected to the internet per 100000
residents No of wwwdomainsi web sites
Schools and relatedinstitutions
Internet
Schools with internet access (secondary schools primaryschools youth hostels kindergartens)
Pupils with internet access Schools with homepage
Computers networks and ISDN
Average number of computers per 100 employees Average number of computers per 100 pupils Share of schools with computers connected to network and
ISDN
23 23Final Report
ICT Indicators Used in Africa
Impact of ICT on qualityteaching and learning
School net educatordevelopmentprogramme
Agency responsiblefor data gathering ICT indicators Components of ICT indicators
1 ICT Skills Level of educator - includes assessment on skills suchas basic word processing e-mail and electronic informationaccessing skills
2 Integration Level - to be measured using the following guidelines
Educatorsrsquo Competence with ICT
Educators should be able to draw on generic ICT applications inorder to prepare for teaching
Educators should be generally competent in those ICTresources that could most benefit their teaching and the learnersrsquolearning
Educators should understand how to access and use electronicinformation and communications resources such as the internetfor the benefit of both the educator and the learner
Educators should know how to use ICT to improve theirprofessional and administrative efficiency
Educators should know how to encourage the development oflearnersrsquo ICT skills within the context of the lessons being taught
Integration of ICT with the curriculum
Educators should understand the key learning strategies thatinfluence the use of ICT to support teaching and learning
Educators should know how to organise their class andclassroom when making use of ICT to achieve lesson outcomes
Educators should understand the role of computer literacy withparticular reference to the educational use of computers as atool in a diverse and developing country like South Africa
Educators should know and understand the characteristics ofinformation particularly its role in learning and its ethical use andits credibility
Educators should be aware of current health legal and ethicalissues regarding the use of ICT in the classroom
Educators should understand how to assess the contributionof ICT to the process of learning
An evaluation instrument is created for assessments in this category
3 The Professional Growth of the educator - This is measuredinitially by conducting pre-course baseline studies in which theeducator reflects on existing practice and perceivedshortcomings This process begins with a workshop and isfurther pursued by the mentor in the follow-up period Progressevaluation of the impact of ICT and the development programmeon the educator as a professional is monitored by promptingfrom the mentor and the educator recording entries in anelectronic journal
4 Whole school levels - Whole school ICT use is measured in anumber of ways Staff ICT and integration-related proficienciesare measured individually or on a departmental or whole-staffbasis This is the choice of the school An instrument is used tomeasure the instructional use of technology in a school Thisinstrument categorises 6 levels of computer efficiency rangingfrom non-use to refinement The emphasis in this framework isgiven to the degree to which technology is used to support aconstructivist orientation to classroom pedagogy
24 Developing and Using Indicators of ICT Use in Education
Quantum jumpstrategy
All teachers and students to be IT and internet-literate by theyear 2002
Production of 250 titles of academic software and contentsannually and provision of funding worth 500 million Baht perannum to various communities for content development as wellas provide budget for localizing 2000 titles of useful foreigncontent
PC density target by the year 2006 as follows
1 20 for secondary school level
1 40 for primary school level
Investment in the production of IT and network equipment foruse in the education sector including software and multimedia
Provision of IT for education and professional development tothe under-privileged the disabled and common people seekinglifelong education
Provision of adequate radio frequencies for the education sector
Investment in research and development in IT for education atleast 400 million Baht per year
Establishment of monitoring and evaluating procedures andprotocols
Establishment of a National Institute of Technology for Education
ICT Indicators Used in Thailand
Value-added strategyGovernment ofThailand
Agency responsiblefor data gathering
ICT indicators Components of ICT indicators
Provision of software content and necessary supporting ITcurriculum via searching localizing producing to make betteruse of existing hardware in schools
Training of teachers to gain literacy in computer and internetuses
Establishment of maintenance programme for the existinghardware
Enhancement of the capabilities of organizations that can providesupport and services to schools by forming network of agenciesand individuals
Monitoring and evaluation of the use of technology for educationand collect data for planning purpose
Equity strategy Provision of a set of minimum requirement equipment andfacilities to needy schools including electricity 3 telephone lines5 computer sets 1 printer 3 sets of television 5 sets of radio 3internet accounts 100 hours per month via SchoolNetprogramme
Provision of a ldquoDigital Learning Centrerdquo (DLC) to the community
Training of teachers and trainers in IT and internet literacy
25 25Final Report
ICT Indicators Used in UK
Computers in schoolsNational Grid forLearning (NGFL)
Agency responsiblefor data gathering ICT indicators Components of ICT indicators
Computerpupil ratio
Average number of computers per school
Type age and multimedia capability of computers
Average number of computers used for management andadministrative purposes
Average number of computers linked to an international schoolnetwork
Different types of computer peripherals available
Internet and electronic Connectivity to the net
Number of schools connected to the internet at broadband level
Percentage and number of schools who have their own website
At least one networked computer with internet access in eachschooll for management and administration
E-mail access
Teacher confidence anduse of ICT in teaching
Teacher confidence
Use of ICT in subjects
Benefit of ICT in subject
Expenditure on ICT Estimated total
Average per school
Average per pupil
ICT Indicators Used in the United States of America
Internet use by teachers
Agency responsiblefor data gathering ICT indicators Components of ICT indicators
Teaching learning andcomputing A nationalsurvey of schools andteachers Centre forResearch onInformationTechnology andOrganizations
Public schools with internet access
Internet connections in classrooms of teachers
Teacherrsquos internet access at home and in their classroom
How often teachers use information from internet in lessons
Teacherrsquos use of electronic mail to communicate with teachers inother schools
Per cent of teachers having their students use different types ofsoftware
Student use of web browser software in lessons
Internet use for beyond classroom student projects andpublishing
Teacherrsquos perceived value of having a computer with electronicmail on their own desk
Teacherrsquos perceived value of classroom world wide web access
Internet use from various locations (home school etc)
Internet use by subject matter taught
Internet use by school level taught
Ability to use web search engine
26 Developing and Using Indicators of ICT Use in Education
Teacher and teacherdirected student useof computers andsoftware
Teacher directed student use of computers
1 Access to classroom computers
Computer-student ratios on classrooms
Number of classroom computers
Computer access in lab and media centres versus classrooms
2 Computer platforms used by student
Extent and variety of software used and teachers objectives for use
1 Type of software used
2 Software that teachers judge as most valuable for students
3 Objectives for computer use
4 Student computer use for school work on their own time
Teacher computer extertise and professional use
1 Use of software in profession
2 Expertise with computers
Technology support Average weekly hours spent by technology co-ordinator ondesignated job tasks
Average minutes spent per week by technology co-ordinatoron job tasks per teacher
Percentage of technology co-ordinators reporting additionalsupport from others (eg teachers district officers aidesadministrators etc)
Teacher rating of availability of technology support (per schoollevel and per type of school)
Total support hours per teacher (per school level and per typeof school)
Number of development occasions for teachers (per schoollevel and per type of school)
Technology support content used to deliver technologyservices to teachers [eg (1) facilities network and internetaccess hardware software (2) staff assistance and necessaryservices technical support help desk network services (3)one-on-one personal guidance computer experts for troubleshooting]
Percentage of teachers who have resource (ICT) available foruse
ICT Indicators Used in the United States of America (contrsquod)Agency responsiblefor data gathering ICT indicators Components of ICT indicators
Presence of computersin American schools
Total instructional computers
Students per computer
Type of computer in each school level
Per cent of computers with selected attached peripherals
Locations of instructional computers
Per cent technology-intensive by school level
Software saturation
Software diversity
Type of internet access
Public schools with internet access
27 27Final Report
Per student expenditure on hardware software and supportper school level
Instructional technology expenditure by US schools (hardwaresoftware and support
Per student expenditure on hardware software and supportfor one year vs five-year estimates
Five-year technology expenditures per student for schools withand without their own technology budgets
Five-year technology expenditures (per student) for public andnon-public schools
School technology expenditures (per student) by communityincome level
Five year school technology expenditures (per student) by levelof technology penetration
ICT Indicators Used in the United States of America (contrsquod)Agency responsiblefor data gathering ICT indicators Components of ICT indicators
School investments ininstructional technology
ICT Indicators in UzbekistanAgency responsiblefor data gathering ICT indicators Components of ICT indicators
Number of computer classes
ICT integration in subjects like physics chemistry and biology
Teacher training
Establishment of ICT departments in universities to train teachers for school
IT as a subject in general education
Number of trained teachers
Provision of computer labs in schools
Collaboration in international training about IT
Application of IT in school management
Government
ICT Indicators in Viet NamAgency responsiblefor data gathering ICT indicators Components of ICT indicators
Establishment of ICT departments in universities to train teachers for school
IT as a subject in general education
Number of trained teachers
Provision of computer labs in schools
Collaboration in international training about IT
Application of IT in school management
Government
1
1IIAttachment
Comparison ofICT Indicator Themesin Selected Countries
29
29
Final Rep
ort
Basis for ICTindicatorsagency
who formulatedICT indicators
Presence ofstandards for
technology use
Educationallevel covered
Respondents of studies
Technologiescovered
in studiesType of indicators
Presence ofindicators
addressing equityethics and
investment issues
Presence ofindicators on ICT
integration incurriculumimpact etc
Goals and objectivesof the governmentAll students will leaveschool as confidentcreative andproductive users ofnew technologiesparticularlyinformation andcommunicationstechnologies andunderstand theimpact of thosetechnologies insociety
Yes Curriculumand StandardsFramework (CSF)
Primary secondarynon-formal
Teachers students Computers internetuse of satellite TV
Quantitative andqualitative
Not specified Yes specificallythe studyconducted by theUniversity ofSydney Includestudies on studentengagemententhusiasm andmovitationimprovement ofhigher-orderthinking skills etc
Based on a meetingconvened in IITEMoscow in 2000 todevelop a set of ICTindicators
None Primarysecondary andtertiary levels
Heads ofdepartmentssenior specialistsstaff of nationalCentres ofInformationalTechnologies andEducation orCentres of TeacherTraining Retrainingand EducationalSupport
Computers andinternet
Quantitative -policy documentsICTs in curriculumhardware andequipmentsoftware Globalcommunicationmeans andpersonneldevelopment
None Partly
Australia
Baltic andCIScountries
30
Develop
ing and U
sing Indicators of IC
T Use in E
ducation
Basis for ICTindicatorsagency
who formulatedICT indicators
Presence ofstandards for
technology use
Educationallevel covered
Respondents of studies
Technologiescovered
in studiesType of indicators
Presence ofindicators
addressing equityethics and
investment issues
Presence ofindicators on ICT
integration incurriculum impact
etc
Canada Two criteria fordevelopment ofindicator set
Type of educationinformation neededfor policydevelopment
Practical availabilityof dataindicatorsdeveloped by Pan-CanadianEducationIndicatorsProgramme (PCEIP)
None Elementary andsecondary level
Not specified Computers andinternet
Quantitative andqualitative
Pupil-computerratio
Internetconnectivity
Internet activitiesof students
Obstacles to fulleruse of informationandcommunicationstechnologies
None Yes specificallyon whatencouragesteachers andstudents to usecomputers
Europe 1 Indicators based onthe eEurope initiativeof the EuropeanUnion Action lineldquoEuropean youth intothe digital agerdquo Thegoal for the saidobjective is to turndigital literacy to abasic competence forall young EuropeansSIBIS Study
Yes ISTE (NETS)standards
Various researcherscovered differentlevel public primaryand lowersecondary primarysecondary andspecial schoolshead teachers andteachers
School headsteachers
ICT in generalcomputers andinternet access
Quantitative andqualitative
Policy andstrategy
Economy andinfrastructure
Use and access
Competencies
Yes specifically onnational policiesand expenditure
Yes oncompetency ofICT instructors
Europe 2 Eurydice Yes ISTE(NETS)standards
Primary andsecondary level
Not specified Computers andinternet
Mostly quantitativevery little on qualita-tive indicatorsExamples
Number of pupilsper computer
Desirable ICTskills according toofficial recom-mendations forthe initial trainingof all teachers(except specialistICT teachers)
Mainly onexpendituredistribution ofbudget
Yes on integrationof ICT in subjects
31
31
Final Rep
ort
Basis for ICTindicatorsagency
who formulatedICT indicators
Presence ofstandards for
technology use
Educationallevel covered
Respondents of studies
Technologiescovered
in studiesType of indicators
Presence ofindicators
addressing equityethics and
investment issues
Presence ofindicators on ICT
integration incurriculumimpact etc
India Government None Elementary andsecondary schools
Not specified Computersinternet software
Quantitative None None
Indonesia Curriculum Centre
Governmentrsquos goalsand objectives
None Elementary andsecondary schools
Not specified Computers andthe internet
Quantitative Moreof internet andcomputer use andaccess
None None
Japan eJapan priority policyprogrammevarioussurveys conducted bygovernment agencieson ICT in general Likethose conducted bythe Ministry of PostsandTelecommunicationsSurvey on SocialEducation
None Elementary andsecondary in someindicators notspecified in otherindicators
Not specified Computers andinternet
Quantitative Moreof internet andcomputer use andaccess
Yes Governmentgeneral IT policy onelementary andsecondary schoolsthe same forschools for theblind and disabled
None
Republic ofKorea
Cyber Korea 21Vision To preparestudents forknowledge basedsociety by realizinglife-long learning viacyber-educationsystemrdquoKoreaNational StatisticsOffice
Yes - based onthe documententitled Adaptingeducation to theinformation ageA white paper
Elementarysecondary
Teachers andstudents andschoolheadmasters
Computersinternet andmultimedia
Quantitative Moreof internet andcomputer use andaccess throughinput utilizationand outputindicators
None None
Malaysia Government None Elementary andsecondary schools
Not specified Computers andthe internet
Quantitative None None
Quantitative andqualitative
Telecommunica-tions equipment
How schoolsteachers andstudents usetelecommuni-cationstechnologies
New Zealand Research conductedby the TelecomEducation Foundation
None Not specified Teachers andprincipals
Telephone linesfax machinescomputers andinternet
None Yes specificallyon whatencouragesteachers andstudents to usecomputers
32
Develop
ing and U
sing Indicators of IC
T Use in E
ducation
Philippines
Basis for ICTindicatorsagency
who formulatedICT indicators
Presence ofstandards for
technology use
Educationallevel covered
Respondents of studies
Technologiescovered
in studiesType of indicators
Presence ofindicators
addressing equityethics and
investment issues
Presence ofindicators on ICT
integration incurriculumimpact etc
Senate Committee onEducation Arts andCulture with SEAMEO-INNOTECH
Department ofEducation
None Public and privateelementary andsecondary schools
School heads All ICT relatedtechnologies suchas televisionprojectors radiocassette playerscomputersperipherals andinternet access
Quantitative Availability of
publiccommercialutilities andservices
Computer skillsof schoolpersonnel
Presence ofcomputers inschools
Instructionalacademic useof computers
Yes specificallythose pertaining touse of computers bynon-formaleducation students
None
Research on internetin Slovenia
None Primary secondaryyouth hostels andkindergartens
Not specified Computers andinternet access
Quantitative
Internet access
Computersnetworks
None None
School net None Not specified Students andteachers
Computers andinternet access
QualitativeexamplesIntegration of ICTwith curriculuminstructionalpractices barriersto computer use
None Yes oncompetency ofICT instructors
Government NationalEducation Act of1999
None Primary andsecondary schools
Not specified Computersinternettelephonescomputerperipherals ratio
Quantitative None None
Philippines
Slovenia
South Africa
Thailand
33
33
Final Rep
ort
Basis for ICTindicatorsagency
who formulatedICT indicators
Presence ofstandards for
technology use
Educationallevel covered
Respondents of studies
Technologiescovered
in studiesType of indicators
Presence ofindicators
addressing equityethics and
investment issues
Presence ofindicators on ICT
integrationin curriculumimpact etc
UK National grid forlearning
ISTE (NETS)standards
Primary andsecondary schools
Students andteachers
Computers and theinternet
Quantitative andqualitative
Computers inschools
Internet andelectroniccommunication
Teachercondidence anduse of ICT inteaching
Expenditure onICT
Yes mainly onexpenditure andbudget allocation
Yes includesteacherconfidence in theuse of ICT andbenefit of ICT
US Teaching learningand computing - astudy of teacherrsquosuse of computertechnology theirpedagogies andtheir school context
ISTE (NETS)standards
Public and privateschoolselementary middleschool and highschool all subjectsexcept physicaleducation andspecial education
Teachers Computers internetuse (includes use ofvarious softwareCDRom etc
Quantitative andqualitative School
technologyleadership andtechnologyoutcomes
Pedagogicalmotivations forstudent computeruse
Internet use byteachers
Presence ofcomputers inAmerican schools
Teacher andteacher directedstudent use ofcomputers andsoftware
Technologysupport
Schoolinvestments ininstructionaltechnology
Yes includesindicators thatdeterminestechnology intensiveareas softwaresaturation etc
Yes specificallypedagogicalmotivations forstudent computeruse
UK
US
34
Develop
ing and U
sing Indicators of IC
T Use in E
ducation
Basis for ICTindicatorsagency
who formulatedICT indicators
Presence ofstandards for
technology use
Educationallevel covered
Respondents of studies
Technologiescovered
in studiesType of indicators
Presence ofindicators
addressing equityethics and
investment issues
Presence ofindicators on ICT
integration incurriculumimpact etc
NoneUzbekistan Government Lawon Education
None Primary andsecondaryeducation
Not specified Computer andinternet
Quantitative None
Viet Nam Government
Governmentrsquos goalto ldquouniversalizerdquoeducation
None Primary andsecondary
Not specified Computer andinternet
Quantitative None None
1
1IIIAttachment
Studies on the Use andImpact of ICTin Education
35 35Final Report
Several studies have been conducted on ICT and its use and impact on educationsome of which are included below
This survey on the information and communications technology (ICT) provisions inschools in England was carried out in April 2001 the findings of which were comparedto similar surveys conducted in 1998 1999 and 2000 The surveys collectedinformation on the number and type of computers available in schools expenditurein schools the extent and benefit of the use of ICT across curriculum subjects theuse of internet and other electronic network communication links and teacherusage of computers and their confidence in the use of ICT in the curriculum It is asample survey and the sample is chosen to be representative of different types ofschools throughout the country Some of the findings as categorised are thefollowing
a Computers in schools
average number of computers per school increased steadily in all types ofschools between 1998 and 2001 the increase was noted to be greatbetween 2000 and 2001
b Internet usage and other external electronic communication services
between 1998 and 2001 there was a considerable increase in thepercentage of schools connected to the internet
c Use of ICT in teaching and teacher confidence
in each type of school there was an increase in the percentage of teachersreported to feel confident in the use of ICT in 2001
d Expenditure on ICT
the average expenditure on computers per school increased steadily in allschool types between 1998 and 2001
Source Statistics of EducationSurvey of Information and Communications Technology in Schools 2001National Statistics BulletinDepartment for Education and SkillsIssue No 0901October 2001
The Center for International Development (CID) at Harvard University conducted aresearch which came up with the Network Readiness Index (NRI) a majorinternational assessment of countriesrsquo capacity to exploit the opportunities offeredby ICTs In the development of the NRI data sources fall under two generalcategories First a variety of measures mainly ldquohardrdquo variables and also ldquosoftrdquoones from sources such as the World Bank the International TelecommunicationsUnion Freedom House and the Business Software Alliance were used Seconddata collected from the questionnaire responses of more than 4500 business andgovernment leaders surveyed in 75 countries by the Global Competitiveness Reportrsquos2001 Global Executive Opinion Survey conducted by Harvard University and theWorld Economic Forum were heavily relied upon
The Network Readiness Index is an assessment of a countryrsquos capacity to makeuse of ICT resources It shows how nations are performing with regards to theirparticipation in the Networked World Seventy-five countries were computed NRIs
B The Network Readiness Index Measuring thepreparedness of nations for the networked world
A Survey of information and communicationstechnology in schools 2001 in England
36 Developing and Using Indicators of ICT Use in Education
and the United States of America tops the NRI ranking making it the most highlydeveloped ICT network and it has the greatest potential to exploit networkrsquos capacityIceland Finland Sweden Norway and Netherlands follow USA Another NorthernEuropean country Denmark ranks 7th followed by Singapore in 8th Austria in 9th
and the United Kingdom in the 10th place Among the countries in the region whichwere included are Korea rank number 20 followed by Japan in the 21st placeMalaysia in number 26 Thailand number 43 India number 54 Philippines number58 followed by Indonesia in number 59 Sri Lanka in number 62 China in 64Bangladesh in 73 and Viet Nam in 74
Two components were taken into consideration in the computation of the NRIThese are network use and enabling factors Network use is defined as the measureof the extent of increase in the use of ICT in a specific country This is still narroweddown to five more catagories Internet users per hundred inhabitants cellularsubscribers per hundred inhabitants internet users per host percentage ofcomputers connected to the internet and availability of public access to the internet
Enabling factors is made up of four sub-indices network access network policynetworked society and networked economy Network access includes variablesrelated to the information infrastructure hardware software and support Itmeasures the extent and quality of the network infrastructure and the existence ofequipment programmes and support services that enable ICT use Network policyrefers to the information and communications policy environment and the businessand economic climate It also deals with the levels of competition in thetelecommnications and ICT sectors Networked society measures the quality andextent of use of ICT facilities in the learning process and networked economyassesses the extent of public and private sectors participation and e-governmentare considered in this sub-index
Source httpwwwcidharvardeducrpdfgitrr2002-cho02pdf
This is a national population survey of public and private elementary and secondaryschools conducted by SEAMEO INNOTECH in the Philippines under Project TAOCARES last March 2001 Its main objective was to determine the ICT capabilitiesof schools A total of 45811 schools were given questionnaires with the schoolheads as respondent of which 7937 per cent responded The survey questionnaireconsisted of 42 items mostly focused on the readiness of schools in terms ofinfrastructure hardware software and manpower capabilities on ICT Outputs ofthe survey were sixteen regional profiles on the ICT-preparedness of schools whichincluded data on the availability of electricity access of schools to communicationfacilities presence of computers computer peripherals and other multi-mediaequipment in schools sources of funds to maintain ICT-related operations proficiencyof school staff in the use of computers training received on ICT computer coursesbeing offered in schools and other ICT-related information
Some of the major findings of the survey at the national level are the following
Only 6607 per cent of schools have electrical connections
Only 1330 per cent have landline telephones 290 per cent have fax machinesand 200 per cent have internet connections
5217 schools only or 1428 per cent have computers with the National CapitalRegion having the highest percentage at 8730 per cent
Only 1824 per cent of schools have staff proficient in the use of computers
C Profile on the capabilities of elementary and secondary schools in the Philippines 2000-2001
37 37Final Report
7862 per cent of schools get funding to maintain ICT related operations fromthe PTCA
Only very few schools (1313 per cent) have school heads who have receivedICT training in the past five years
6436 per cent of school heads need training on basic computer literacy
This study was conducted by the New Educational Technologies Foundation Inc anon-profit organisation composed of schools that believe in the capacity of IT toimprove the quality of student learning and efficiency of teaching A total of 794schools participated in the survey with school heads in the public and private schoolsas respondents The questionnaire was divided into two parts the first part askedabout perceptions level of awareness and attitudes regarding the value of computereducation and was answered by users and non-users of computers The secondpart which dealt with the actual use of computers was answered by users onlyAmong the findings are the following
The number of computers owned by a private schools is twice as much aswhat a public school can afford
Computers available in schools are mostly the models AT486
Most computer units in the public elementary schools were acquired throughdonations in the secondary and tertiary schools most computers were acquiredthrough purchase
Computers are mostly used to teach different application programmes
Source The 1996 National Survey on Computer Education New Educational TechnologiesFoundation Inc
D The 1996 national survey on computereducation in the Philippines
In a primary school in Sunnyside Elementary School Pullman Washington studentsare using e-mails web sites videos and video conferencing technology tools todevelop their learning skills Through these mediums the students alongside theirglobal peers identify and share their cultures with one another in new waysTraditionally students learn about the world through books but new technologyallows the students to get in depth information about different cultures throughwriting reading and communicating with their global peers The following are theassessment tools used Assessment rublics designed for specific projects lessonandor classroom experiences standard assessment tools (ie DRA and WrightGroup Reading Assessments) teacher anecdotal notes childrenrsquos ownmetacognitive voices in the process of learning in conference with the teacherand in self-reflection of work and presentations parentsrsquo reports of student learningprogress
Teaching in non-traditional ways can sometimes be a risky business - with all eyesupon the class to see if learning is taking place It has been shown that studentsform teams to read write and communicate using technology at rates that meetand exceed standards for primary classes But along the way the added value oftechnology contributes in areas such as thinking skills social skills engagement inlearning motivation teaching and collaborating as the class sees what is essentialto learn in the context of the real world
Source httpwwwncrelorgengaugeframeworkefpalignefpalisuhtm
E Use of multiple assessment tools
38 Developing and Using Indicators of ICT Use in Education
F Technology A major catalyst for increasing learning by Jody C Isernhagen University of Nebraska-Lincoinby Jody C Isernhagen University of Nebraska-Lincoinby Jody C Isernhagen University of Nebraska-Lincoinby Jody C Isernhagen University of Nebraska-Lincoinby Jody C Isernhagen University of Nebraska-Lincoin TTTTTechnologechnologechnologechnologechnology Horizons in Educay Horizons in Educay Horizons in Educay Horizons in Educay Horizons in Educationtiontiontiontion Journal Online Journal Online Journal Online Journal Online Journal Online August 1999 - FeaAugust 1999 - FeaAugust 1999 - FeaAugust 1999 - FeaAugust 1999 - Featuretureturetureture
A rural public school in Nebraska composed of 1400 students applied for a three-year competitive Excellence in Education Grant in late 1995 Six schooladministrators and 18 staff members designed a plan to restructure their schooland classrooms The staff members defined that the major skills needed by studentsare comprehension reasoning composition and experimentation A computerwas placed in each classroom (80 classrooms) and 27 computers were located inthe elementary Integrated Learning Lab with Computer Curriculum CorporationSuccess Maker Software This software automatically diagnoses and placesstudents on the appropriate skill level while using the computer The computer labwas used by 314 students and 13 teachers in grades 1-3 from January 1996through May 1998 Teachers were trained on the use of ClarisWorks MicrosoftWord E-mail Internet Presentation Stations and the integration technology as atook in teaching and learning Activities of the students involved computer buildingdesigning of web pages to help maintain the schoolrsquos web pages digitizing video topresent to the community creating panoramic views and interactive virtual realityscenes preparing letters of application resumes and cover letters and to searchthe web for jobs With all the activities the teacher served as guides figuring outwith the students how to arrive at a productive presentation
The CAT scores in reading and math for students using an Integrated Learning Labfor 25 years showed a significant difference between the means The scores ofstudents testing below the 50th percentile at grades 1-3 in reading and math increasedsignificantly over time These findings suggest that using an Integrated LearningLab with rural primary age children daily over an extended period of time maypositively impact achievement for students particularly those students functioningbelow the 50th percentile
Source httpwwwthejournalcommagazinevaultarticleprintversioncfmaid=2126
G The impact of ICT on literacy learning in English
This report is the result of a literature review conducted first to identify a number ofstudies that might shed light on the major impact of ICT on literacy learning inEnglish for 5 to 16 year olds and the second to undertake an in-depth review ofthe papers that were identified as being on the impact of networked ICT on literacylearning in English for ages 5 to 16 There were 1871 studies screened following acriteria to identify relevant reports 188 studies were found that met the criteria inthe protocol These studies were then keyworded or indexed and the results filedon an electronic database
Of the 188 studies relevant to the mapping study 16 pertained to the topic of theimpact of networked ICT on literacy learning Data were extracted from these 16studies and were used as basis for an in-depth review Of these half were outcomeevaluations (evaluations of the results of an experiment or innovation) seven wereprocess evaluations (evaluations on how an intervention was delivered rather thanwhether it worked or not) and one was a needs assessment
Results show that as far as the in-depth study on networked ICT goes results areinconclusive Concerning policy and practice the recommendations of this revieware highly tentative and take the form of implications or pointers With regard topolicy they are to focus research funding for large-scale studies to give considerationto the balance of study type expertise in research teams and to give consideration
39 39Final Report
to the fact that the provision of computer hardware and software to schools andthe application of ICT in teaching and learning need to be informed by researchand evaluation
Source httpeppiioeacukEPPEWebhomeaspxpage=reelreview_groupreview_ one_abstractht
H Education Research Fund Effective Integrationof IT in Singapore Schools Pedagogical
and Policy ImplicationsThis is a report on the key findings of a questionnaire survey aimed at identifying thedegree of information technology (IT) integration among Singapore schools Thesurvey is the first part (Phase One) of a larger study funded by the Ministry ofEducation of Singapore aimed to examine and analyze where and how IT is integratedin Singapore schools to develop pupilsrsquo higher order thinking skills A total of 328schools responded to the survey of which 168 are primary schools 144 secondaryschools and 16 junior collegescentralized institutes (JCCs)
Major findings of the questionnaire survey include
Phase I schools in the IT Masterplan have significantly higher pupil and teacheruse of IT greater opportunities for staff development of teachers and moreconducive IT culture than Phase III schools
Independent-autonomous schools have significantly better management of ITresources higher teacher and pupils use of IT greater opportunities for staffdevelopment for teachers and more conducive IT culture than governmentschools
There are no significant differences among the primary schools secondaryschools and JCCs in terms of the management of IT resources pupil andteacher use of IT staff development and school IT culture
The correlations among management of IT resources pupil use of IT teacheruse of IT staff development and IT culture are significant and highly positive
- Contents
-

1
14Section
Various Software orDatabase Systems for
Storing Indicators
13 13Final Report
Below are a few of the software or database systems worth considering in developingthe databases for ICT indicators
Spreadsheet programmes such as IBM Lotus 123 and MS Excel
Statistical programmes such as Statistical Package for the Social Sciences(SPSS)
Customized database programmes using MS Access (for small databases)
SQL Server MAGIC (for big databases)
For data-based driven web applications (Visual Interdev Java Visual Basic) thereis anoother software available in the market which can be used to create the ICTdatabases Technical staff will be able to assist in determining the most feasible anduser-friendly software adequate to answer specific needs
1
1IAttachment
ICT IndicatorsUsed in
Different Countries
15 15Final Report
Government What students should know and be able to do at a certain level
Connectivity Number of teachers with notebook Computer student ratio Bandwidth available in schools Type of internet connection
Changes in studentperformances afterintegrating ICT intoeducation
Increase in student engagement enthusiasm and motivation If student-centred learning took place Improvement in studentsrsquo high-order thinking skills improved Occurrence of changes in teaching practices Improvement in the ability to use emerging technologies
University of Sydney
ICT Indicators in Baltic and CIS Countries
Hardware equipment Computer classroom availability in educational institutions (EI) The average number of students per one computer in EI equipped
with computer classrooms Percentage of IBM- and Apple-compatible computers in total
number of EI computers Percentage of EI equipped with one or more multimedia system in
total EI equipped with computer classroom number Percentage of EI equipped with local network to total EI equipped
with computer classrooms number
Software Percentage of computers with installed OS DOSTM to total numberof computers in computer classes
Percentage of computers with OS WindowsTM of Apple Macintoshto total computer number in computer classes
Per cent of computers with other OS to total computer number incomputer classes
Percentage of EI with any educational software for teaching thecorresponding subjects to total EI number with computer classes1 Elementary School subjects2 Science subjects3 Humanities4 Informatics or information technologies
Percentage of educational software designed by the specialistswithin the country to total number of educational software usedin EI for teaching of the corresponding subject curriculum(elementary school science subjects humanities informationsinformation technologies)
Percentage of educational software designed by foreign specialiststo total number of educational software used in EI for teaching ofthe corresponding curriculum (elementary school science subjectshumanities informaticsinformation technologies
Components of ICT Indicators
UNESCO Institute ofInformationTechnology inEducation
Official documents Official documents in ITICTs in secondary education Official documents in ITICTs in secondary education currently
in force
ICT in curricula Available state curriculum on informatics andor InformationTechnologies
Informatics andor Information Technologies as a separate subject ICT usage to support other subjects implied in curricula on these
subjects
Global communication Percentage of EI without internet access Percentage of EI with limited internet access - only e-mail Percentage of EI with access via dial-up channel Percentage of EI with access via dedicated line Percentage of EI with own web-pages
ICT Indicators in AustraliaAgency responsiblefor data gathering ICT indicators Components of ICT indicators
Agency responsiblefor data gathering ICT indicators Components of ICT indicators
16 Developing and Using Indicators of ICT Use in Education
Personnel development Percentage of elementary school teachers subject teachers(except teachers of Informatics andor Information Technologies)teachers of informatics and EI administration who haveundertaken the computer literacy course from 1 September 1999until present time1 Less than 50 hours (Index 1)2 50-100 hours (Index 2)3 Over 100 hours (Index 3)
Computer skills of elementary school teachers subject teachersand teachers of Informatics and administration1 Elementary computer literacy2 Proficiency in ICT field
ICT Indicators in Baltic and CIS Countries (contrsquod)Agency responsiblefor data gathering ICT indicators Components of ICT indicators
ICT Indicators in Canada
Pan-CanadianEducation IndicatorsProgramme (PCEIP)
The pupil-computer ratio is a proxy measure of the access of availabilityof computer to students in schools Only computers used for educationalpurposes are included in the ratio
Internet connectivity This is a measure of the percentage of students attending schools thatwere connected to the internet for educational purposes at the time ofthe survey Schools that were connected for administrative purposesonly were excluded
Internet activities ofstudents
School ICT co-ordinators were questioned about instructional activitiesinvolving the use of the internet They were asked to identify typicalactivities that students at certain grade levels would have engaged in bythe end of the school year
Obstacles to fulleruse of informationand communicationstechnologies
Principals were asked to identify the major barriers hindering theachievement of their schoolrsquos computer-related goals for students Inthis section items are presented that are identified as major obstaclesby principals of schools representing at least 50 per cent of enrolmentsat each of the three levels of schools The obstacles noted have beengrouped into three categories those relating to hardware and softwarethose relating to instruction and those relating to the training of teachers
Agency responsiblefor data gathering
ICT indicators Components of ICT indicators
ICT Indicators Used in Europe (Denmark Sweden Finland Norway and UK)
Information SocietyTechnologyProgramme fundedby the EuropeanCommunity
Policy and strategy Countries with an official policy on the use of ICT
Schedule for implementing national ICT education projects
Responsibility for the purchase and maintenance of hardware
Objectives in national ICT projects
Inclusion of ICT in the national curriculum
Schools with ICT implementation plan (simple)
Schools with ICT implementation plan (detailed)
Approaches of ICT defined in the curriculum
Objectives defined in the curriculum for the teaching or use of ICT
Schools with autonomous decision power
Agency responsiblefor data gathering ICT indicators Components of ICT indicators
Pupil-computerratio
17 17Final Report
Use and access Pupils and teachers with a personal e-mail address
Use of ICT in areas of the curriculum
Use of external electronic communication services
Teachers use the internet for non-computing teaching
Internet use in teaching
Teachers opinion about the internet as a tool
Pupils access to the internet
Teachers access to computer and internet at home
Who pays teachers home access
Teachers who connect with other schools via the internet
Competencies New ICT and media students in percentages of all students
New ICT and media students by level of education
Qualifications and degrees in information technology and mediastudies
Population with a degree of qualification in ICT and media studies byfield of study and level of education
Hoursyears spent to pedagogical IT guidance
Hoursyears spent to technical IT guidance
Teachers confidence in the use of ICT
Students and teachers knowledge regarding ICT
Specialist ICT teachers
ICT courses during initial training of general class teachers
ICT trained teachers
Change in teaching methods
Average expenditure on ICT in schools
Sources of funding for ICT in schools
Total expenditures on ICT in schools
Distribution of the specific budget between the purchase ofequipment and expenditure on human resources
Number of computers per 100 pupils
Number and quality of computers available for administration pupilsand teachers
Expected increase in the number of computers
Computers with access to school net andor internet
Quality of internet access in schools
Placement of the computers
Schools with own website
Schools with on-line services
Schools with intranet website e-mail
Economy andinfrastructure
ICT Indicators Used in Europe (Denmark Sweden Finland Norway and UK) (contrsquod)Agency responsiblefor data gathering ICT indicators Components of ICT indicators
18 Developing and Using Indicators of ICT Use in Education
Inclusion of ICT in the curriculum
Percentage of teachers who use computers andor internet in theclassroom
Approaches to ICT defined in the curriculum
Objectives defined in the curriculum for the teachingor the use of ICT
Inclusion of ICT in the initial training of all teachers (except specialistICT teachers)
Inclusion of ICT in the curriculum
Percentage of teachers who use computers andor internet in theclassroom
Reasons given for not using internet with pupils
Approaches to ICT defined in the curriculum
Annual number of hours recommended for teaching ICT as a subjectin its own right
Objectives defined in the curriculum for the teaching or the use ofICT
Inclusion of ICT in the initial training of all teachers (except specialistICT teachers)
Percentage share of compulsory teaching related to ICT and thenumber of hours devoted to such teaching in the initial training of allteachers (except specialist ICT teachers)
Desirable ICT skills according to official recommendations for theinitial training of all teachers (except specialist ICT teachers)
Secondary (lowerand uppersecondaryeducation)
Both Number of pupils per computer and number of pupils per computerwith an internet connection (primary and secondary education)
Responsibility for the purchase and maintenance of hardware(primary and secondary education)
Distribution of the special budget between the purchase ofequipment and expenditure on human resources (primary educationgeneral lower secondary education general upper secondaryeducation)
Average periods during which primary school teachers usecomputers (with or without internet connection) in the classroomhours per week
Specialist ICT teachers
Percentages of primary and secondary school teachers in Europewho have received official training in the use of computers andorinternet in their teaching
ICT Indicators Used in IndiaAgency responsiblefor data gathering
ICT indicators Components of ICT indicators
Ministry of HumanResourceDevelopment
Presence of MIS
Presence of software
ICT in textbooks
ICT in computer subjects
In-serv ice and pre-service training of teachers
Primary
ICT Indicators Used in EuropeAgency responsiblefor data gathering ICT indicators Components of ICT indicators
19 19Final Report
Student understanding of ICTrsquos benefits disadvantages as well aschallenges in information technology
Studentrsquos use of ICT knowledge in getting processing arrangingdistributing and keeping information
Governmentrsquos goalsand objectives
ICT Indicators Used in IndonesiaAgency responsiblefor data gathering ICT indicators Components of ICT indicators
Student application of knowledge skills and attitudes in designinginformation technology systems solving problems relating to ICT
Includes public halls libraries
Training hours of the principal Training hours of teachers implemented by the school itself Training hours on ICT use in education per teacher Percentage of operating budget vis-a-vis the total budget Percentage of teachers in the department of ICT Whether an ICT yearly plan exists or not Whether an incentive system for ICT personnel exists or not
ICT Indicators Used in Republic of Korea
Support
Agency responsiblefor data gathering ICT indicators Components of ICT indicators
bull Ministry ofEducation
bull KoreanEducationalResearch andInformationService (KERIS)
Inputs (infrastructurehardware software)
Number of students per computer Number of computers per teacher Percentage of computers less than 3 years old Percentage of computers connected to internet Speed of internet connection Number of educational software (CD-titles) Percentage of computers equipped with 5 basic applications
Number of students per PC
Internet access of students
Number of teachers inpublic schools who canoperate PCs
Number of teachers at elementary lower and uppersecondary schools and special education schools
Number of humanresources with IT-relatedmasterrsquos and doctoraldegrees
Number who graduated from masterrsquos course
Number who graduated from doctoral course
Number of foreign nationalswith the status of residenceldquoEngineerrdquo and number ofnationals entering Japanwith the status of residenceldquoEngineerrdquo
Number of registered foreign nationals
Number of foreign nationals entering Japan
Ensuring security andreliability
IT security measures (information security policies presenceof firewalls and back-up systems)
Number of public schoolswith internet access andcomputers
In households
In SMEs (companies with five employees or more)
In corporate (companies with 300 employees or more)
Number of internet users
ICT Indicators Used in JapanAgency responsiblefor data gathering ICT indicators Components of ICT indicators
e-Japan PriorityPolicy Programme
Public facilities withinternet access
20 Developing and Using Indicators of ICT Use in Education
Teachers
Percentage of subjects utilising multimedia materials for teachingand learning through WWW
Percentage of classes using web-board
Percentage of subjects using web-board
Percentage of teachers participating in an association regardingICT use
Percentage of subjects using computer lab
Percentage of functions of the Information System being used
Whether to use electronic decision system
Number of posting written for and by parents
Students
Hours of use of computer per student
Percentage of students participating in ICT special programmesafter school (Elementary)
Whether to teach on computer (Secondary)
Percentage of subjects collecting assignments through web board
Number of search library DB per students
Percentage of student-governing community utilising webenvironment
Whether a programme regarding internet ethics exists
Number of web communities per class
Internet
Usage of internet
Number of access to school website per week
How often school websites are revised
Output Teachers
Percentage of teachers having e-mail address
Percentage of teachers having homepage
Percentage of teachers having ICT certificates
Percentage of teachers participating in educational SW contests
Students
Percentage of students having e-mail address
Percentage of students having homepage
Percentage of students having ICT certificates
Percentage of students participating in educational SW contests
Percentage of students completing the ICT course (32 hours)
Utilization
Agency responsiblefor data gathering ICT indicators Components of ICT indicators
ICT Indicators Used in Republic of Korea (contrsquod)
21 21Final Report
Malaysian smart schoolsuse of technology forinformation processing andas a productivity tool toenhance professionaldevelopment and toautomate instruction
Malaysian government(Ministry of Education)
ICT in curriculum
ICT in pedagogy
ICT in assessment
ICT in materials
ICT Indicators Used in MalaysiaAgency responsiblefor data gathering ICT indicators Components of ICT indicators
How schools teachersand students usetelecommunicationstechnologies
Number of teachers taking in-service training using a tele-learningapproach
Obstacles faced by teachers in using telecommunicationstechnologies
Factors that encouraged telecommunications technology use
Percentage of teachers agreeing that telecommunicationstechnology can enhance learning and teaching
Percentage of students who had positive views about technologyactivities in school
Telecommunicationsequipment
Paper by David HarrisNZCER
Percentage of schools with telephone lines
Percentage of schools with classrooms that has telephone lines
Percentage of schools with fax machines
Percentage of schools with computers that has access to amodem
ICT Indicators Used in New ZealandAgency responsiblefor data gathering ICT indicators Components of ICT indicators
Availability of publiccommercial utilities andservices
Project TAO Cares(computer-assistedreforms for schools)senate committee oneducation arts andculture
Government throughthe Department ofEducation
Percentage of schools with electricity
Percentage of schools whose electricity is available for 24 hoursper day
Percentage of schools whose electricity is available year-round
Percentage of schools with ICT equipment
Percentage of schools where publiccommercial utilities andservices are available
Percentage of schools located in communities where publiccommercial utilities and services are available
ICT Indicators Used in The PhilippinesAgency responsiblefor data gathering ICT indicators Components of ICT indicators
Computer skills ofschool personnel
Percentage of schools staff who has computer skills
How school staff acquired computers skills
Percentage of school staff with expertise in using differentcomputer software
22 Developing and Using Indicators of ICT Use in Education
How were computers in the schools acquired
Location of computers in the school
Modes of set-up of the schools computers
Purposes for which computers are used
Operating system used
Software used for teaching and learning
How school acquired software programmes
Percentage of schools with internet access
Source of funds to pay for internet access
Internet connection arrangement (eg dial-up dedicated dial-upor leased line connection)
Who are given access to the internet (eg students principaladministrative staff etc)
Financial capacity to have internet access
How often computers are upgraded
Availability of funds for computer maintenance
Instructionalacademicuse of computers
Percentage of schools offering computer literacy subjects
How computer literacy subjects are offered (eg as part of regularcurriculum integrated with other subjects etc)
School personnel handling computer courses in the school
Purposes for which computers are used as part of instruction
Fees collected for computer use internet access
Computer use by non-formal education learners
Presence of computersin schools
ICT Indicators Used in The Philippines (contrsquod)Agency responsiblefor data gathering ICT indicators Components of ICT indicators
ICT Indicators Used in Slovenia
Information-telecommunicationsinfrastructure
Research on internetin Slovenia
Agency responsiblefor data gathering ICT indicators Components of ICT indicators
Telecommunication No of telephone connections No of telephone connections per 100 residents No of cellular phone connections NMT GSM No of cellular phone connections per 100 residents No of ISDN connections
Internet
No of internet providers No of backbone providers No of computers connected to the internet per 100000
residents No of wwwdomainsi web sites
Schools and relatedinstitutions
Internet
Schools with internet access (secondary schools primaryschools youth hostels kindergartens)
Pupils with internet access Schools with homepage
Computers networks and ISDN
Average number of computers per 100 employees Average number of computers per 100 pupils Share of schools with computers connected to network and
ISDN
23 23Final Report
ICT Indicators Used in Africa
Impact of ICT on qualityteaching and learning
School net educatordevelopmentprogramme
Agency responsiblefor data gathering ICT indicators Components of ICT indicators
1 ICT Skills Level of educator - includes assessment on skills suchas basic word processing e-mail and electronic informationaccessing skills
2 Integration Level - to be measured using the following guidelines
Educatorsrsquo Competence with ICT
Educators should be able to draw on generic ICT applications inorder to prepare for teaching
Educators should be generally competent in those ICTresources that could most benefit their teaching and the learnersrsquolearning
Educators should understand how to access and use electronicinformation and communications resources such as the internetfor the benefit of both the educator and the learner
Educators should know how to use ICT to improve theirprofessional and administrative efficiency
Educators should know how to encourage the development oflearnersrsquo ICT skills within the context of the lessons being taught
Integration of ICT with the curriculum
Educators should understand the key learning strategies thatinfluence the use of ICT to support teaching and learning
Educators should know how to organise their class andclassroom when making use of ICT to achieve lesson outcomes
Educators should understand the role of computer literacy withparticular reference to the educational use of computers as atool in a diverse and developing country like South Africa
Educators should know and understand the characteristics ofinformation particularly its role in learning and its ethical use andits credibility
Educators should be aware of current health legal and ethicalissues regarding the use of ICT in the classroom
Educators should understand how to assess the contributionof ICT to the process of learning
An evaluation instrument is created for assessments in this category
3 The Professional Growth of the educator - This is measuredinitially by conducting pre-course baseline studies in which theeducator reflects on existing practice and perceivedshortcomings This process begins with a workshop and isfurther pursued by the mentor in the follow-up period Progressevaluation of the impact of ICT and the development programmeon the educator as a professional is monitored by promptingfrom the mentor and the educator recording entries in anelectronic journal
4 Whole school levels - Whole school ICT use is measured in anumber of ways Staff ICT and integration-related proficienciesare measured individually or on a departmental or whole-staffbasis This is the choice of the school An instrument is used tomeasure the instructional use of technology in a school Thisinstrument categorises 6 levels of computer efficiency rangingfrom non-use to refinement The emphasis in this framework isgiven to the degree to which technology is used to support aconstructivist orientation to classroom pedagogy
24 Developing and Using Indicators of ICT Use in Education
Quantum jumpstrategy
All teachers and students to be IT and internet-literate by theyear 2002
Production of 250 titles of academic software and contentsannually and provision of funding worth 500 million Baht perannum to various communities for content development as wellas provide budget for localizing 2000 titles of useful foreigncontent
PC density target by the year 2006 as follows
1 20 for secondary school level
1 40 for primary school level
Investment in the production of IT and network equipment foruse in the education sector including software and multimedia
Provision of IT for education and professional development tothe under-privileged the disabled and common people seekinglifelong education
Provision of adequate radio frequencies for the education sector
Investment in research and development in IT for education atleast 400 million Baht per year
Establishment of monitoring and evaluating procedures andprotocols
Establishment of a National Institute of Technology for Education
ICT Indicators Used in Thailand
Value-added strategyGovernment ofThailand
Agency responsiblefor data gathering
ICT indicators Components of ICT indicators
Provision of software content and necessary supporting ITcurriculum via searching localizing producing to make betteruse of existing hardware in schools
Training of teachers to gain literacy in computer and internetuses
Establishment of maintenance programme for the existinghardware
Enhancement of the capabilities of organizations that can providesupport and services to schools by forming network of agenciesand individuals
Monitoring and evaluation of the use of technology for educationand collect data for planning purpose
Equity strategy Provision of a set of minimum requirement equipment andfacilities to needy schools including electricity 3 telephone lines5 computer sets 1 printer 3 sets of television 5 sets of radio 3internet accounts 100 hours per month via SchoolNetprogramme
Provision of a ldquoDigital Learning Centrerdquo (DLC) to the community
Training of teachers and trainers in IT and internet literacy
25 25Final Report
ICT Indicators Used in UK
Computers in schoolsNational Grid forLearning (NGFL)
Agency responsiblefor data gathering ICT indicators Components of ICT indicators
Computerpupil ratio
Average number of computers per school
Type age and multimedia capability of computers
Average number of computers used for management andadministrative purposes
Average number of computers linked to an international schoolnetwork
Different types of computer peripherals available
Internet and electronic Connectivity to the net
Number of schools connected to the internet at broadband level
Percentage and number of schools who have their own website
At least one networked computer with internet access in eachschooll for management and administration
E-mail access
Teacher confidence anduse of ICT in teaching
Teacher confidence
Use of ICT in subjects
Benefit of ICT in subject
Expenditure on ICT Estimated total
Average per school
Average per pupil
ICT Indicators Used in the United States of America
Internet use by teachers
Agency responsiblefor data gathering ICT indicators Components of ICT indicators
Teaching learning andcomputing A nationalsurvey of schools andteachers Centre forResearch onInformationTechnology andOrganizations
Public schools with internet access
Internet connections in classrooms of teachers
Teacherrsquos internet access at home and in their classroom
How often teachers use information from internet in lessons
Teacherrsquos use of electronic mail to communicate with teachers inother schools
Per cent of teachers having their students use different types ofsoftware
Student use of web browser software in lessons
Internet use for beyond classroom student projects andpublishing
Teacherrsquos perceived value of having a computer with electronicmail on their own desk
Teacherrsquos perceived value of classroom world wide web access
Internet use from various locations (home school etc)
Internet use by subject matter taught
Internet use by school level taught
Ability to use web search engine
26 Developing and Using Indicators of ICT Use in Education
Teacher and teacherdirected student useof computers andsoftware
Teacher directed student use of computers
1 Access to classroom computers
Computer-student ratios on classrooms
Number of classroom computers
Computer access in lab and media centres versus classrooms
2 Computer platforms used by student
Extent and variety of software used and teachers objectives for use
1 Type of software used
2 Software that teachers judge as most valuable for students
3 Objectives for computer use
4 Student computer use for school work on their own time
Teacher computer extertise and professional use
1 Use of software in profession
2 Expertise with computers
Technology support Average weekly hours spent by technology co-ordinator ondesignated job tasks
Average minutes spent per week by technology co-ordinatoron job tasks per teacher
Percentage of technology co-ordinators reporting additionalsupport from others (eg teachers district officers aidesadministrators etc)
Teacher rating of availability of technology support (per schoollevel and per type of school)
Total support hours per teacher (per school level and per typeof school)
Number of development occasions for teachers (per schoollevel and per type of school)
Technology support content used to deliver technologyservices to teachers [eg (1) facilities network and internetaccess hardware software (2) staff assistance and necessaryservices technical support help desk network services (3)one-on-one personal guidance computer experts for troubleshooting]
Percentage of teachers who have resource (ICT) available foruse
ICT Indicators Used in the United States of America (contrsquod)Agency responsiblefor data gathering ICT indicators Components of ICT indicators
Presence of computersin American schools
Total instructional computers
Students per computer
Type of computer in each school level
Per cent of computers with selected attached peripherals
Locations of instructional computers
Per cent technology-intensive by school level
Software saturation
Software diversity
Type of internet access
Public schools with internet access
27 27Final Report
Per student expenditure on hardware software and supportper school level
Instructional technology expenditure by US schools (hardwaresoftware and support
Per student expenditure on hardware software and supportfor one year vs five-year estimates
Five-year technology expenditures per student for schools withand without their own technology budgets
Five-year technology expenditures (per student) for public andnon-public schools
School technology expenditures (per student) by communityincome level
Five year school technology expenditures (per student) by levelof technology penetration
ICT Indicators Used in the United States of America (contrsquod)Agency responsiblefor data gathering ICT indicators Components of ICT indicators
School investments ininstructional technology
ICT Indicators in UzbekistanAgency responsiblefor data gathering ICT indicators Components of ICT indicators
Number of computer classes
ICT integration in subjects like physics chemistry and biology
Teacher training
Establishment of ICT departments in universities to train teachers for school
IT as a subject in general education
Number of trained teachers
Provision of computer labs in schools
Collaboration in international training about IT
Application of IT in school management
Government
ICT Indicators in Viet NamAgency responsiblefor data gathering ICT indicators Components of ICT indicators
Establishment of ICT departments in universities to train teachers for school
IT as a subject in general education
Number of trained teachers
Provision of computer labs in schools
Collaboration in international training about IT
Application of IT in school management
Government
1
1IIAttachment
Comparison ofICT Indicator Themesin Selected Countries
29
29
Final Rep
ort
Basis for ICTindicatorsagency
who formulatedICT indicators
Presence ofstandards for
technology use
Educationallevel covered
Respondents of studies
Technologiescovered
in studiesType of indicators
Presence ofindicators
addressing equityethics and
investment issues
Presence ofindicators on ICT
integration incurriculumimpact etc
Goals and objectivesof the governmentAll students will leaveschool as confidentcreative andproductive users ofnew technologiesparticularlyinformation andcommunicationstechnologies andunderstand theimpact of thosetechnologies insociety
Yes Curriculumand StandardsFramework (CSF)
Primary secondarynon-formal
Teachers students Computers internetuse of satellite TV
Quantitative andqualitative
Not specified Yes specificallythe studyconducted by theUniversity ofSydney Includestudies on studentengagemententhusiasm andmovitationimprovement ofhigher-orderthinking skills etc
Based on a meetingconvened in IITEMoscow in 2000 todevelop a set of ICTindicators
None Primarysecondary andtertiary levels
Heads ofdepartmentssenior specialistsstaff of nationalCentres ofInformationalTechnologies andEducation orCentres of TeacherTraining Retrainingand EducationalSupport
Computers andinternet
Quantitative -policy documentsICTs in curriculumhardware andequipmentsoftware Globalcommunicationmeans andpersonneldevelopment
None Partly
Australia
Baltic andCIScountries
30
Develop
ing and U
sing Indicators of IC
T Use in E
ducation
Basis for ICTindicatorsagency
who formulatedICT indicators
Presence ofstandards for
technology use
Educationallevel covered
Respondents of studies
Technologiescovered
in studiesType of indicators
Presence ofindicators
addressing equityethics and
investment issues
Presence ofindicators on ICT
integration incurriculum impact
etc
Canada Two criteria fordevelopment ofindicator set
Type of educationinformation neededfor policydevelopment
Practical availabilityof dataindicatorsdeveloped by Pan-CanadianEducationIndicatorsProgramme (PCEIP)
None Elementary andsecondary level
Not specified Computers andinternet
Quantitative andqualitative
Pupil-computerratio
Internetconnectivity
Internet activitiesof students
Obstacles to fulleruse of informationandcommunicationstechnologies
None Yes specificallyon whatencouragesteachers andstudents to usecomputers
Europe 1 Indicators based onthe eEurope initiativeof the EuropeanUnion Action lineldquoEuropean youth intothe digital agerdquo Thegoal for the saidobjective is to turndigital literacy to abasic competence forall young EuropeansSIBIS Study
Yes ISTE (NETS)standards
Various researcherscovered differentlevel public primaryand lowersecondary primarysecondary andspecial schoolshead teachers andteachers
School headsteachers
ICT in generalcomputers andinternet access
Quantitative andqualitative
Policy andstrategy
Economy andinfrastructure
Use and access
Competencies
Yes specifically onnational policiesand expenditure
Yes oncompetency ofICT instructors
Europe 2 Eurydice Yes ISTE(NETS)standards
Primary andsecondary level
Not specified Computers andinternet
Mostly quantitativevery little on qualita-tive indicatorsExamples
Number of pupilsper computer
Desirable ICTskills according toofficial recom-mendations forthe initial trainingof all teachers(except specialistICT teachers)
Mainly onexpendituredistribution ofbudget
Yes on integrationof ICT in subjects
31
31
Final Rep
ort
Basis for ICTindicatorsagency
who formulatedICT indicators
Presence ofstandards for
technology use
Educationallevel covered
Respondents of studies
Technologiescovered
in studiesType of indicators
Presence ofindicators
addressing equityethics and
investment issues
Presence ofindicators on ICT
integration incurriculumimpact etc
India Government None Elementary andsecondary schools
Not specified Computersinternet software
Quantitative None None
Indonesia Curriculum Centre
Governmentrsquos goalsand objectives
None Elementary andsecondary schools
Not specified Computers andthe internet
Quantitative Moreof internet andcomputer use andaccess
None None
Japan eJapan priority policyprogrammevarioussurveys conducted bygovernment agencieson ICT in general Likethose conducted bythe Ministry of PostsandTelecommunicationsSurvey on SocialEducation
None Elementary andsecondary in someindicators notspecified in otherindicators
Not specified Computers andinternet
Quantitative Moreof internet andcomputer use andaccess
Yes Governmentgeneral IT policy onelementary andsecondary schoolsthe same forschools for theblind and disabled
None
Republic ofKorea
Cyber Korea 21Vision To preparestudents forknowledge basedsociety by realizinglife-long learning viacyber-educationsystemrdquoKoreaNational StatisticsOffice
Yes - based onthe documententitled Adaptingeducation to theinformation ageA white paper
Elementarysecondary
Teachers andstudents andschoolheadmasters
Computersinternet andmultimedia
Quantitative Moreof internet andcomputer use andaccess throughinput utilizationand outputindicators
None None
Malaysia Government None Elementary andsecondary schools
Not specified Computers andthe internet
Quantitative None None
Quantitative andqualitative
Telecommunica-tions equipment
How schoolsteachers andstudents usetelecommuni-cationstechnologies
New Zealand Research conductedby the TelecomEducation Foundation
None Not specified Teachers andprincipals
Telephone linesfax machinescomputers andinternet
None Yes specificallyon whatencouragesteachers andstudents to usecomputers
32
Develop
ing and U
sing Indicators of IC
T Use in E
ducation
Philippines
Basis for ICTindicatorsagency
who formulatedICT indicators
Presence ofstandards for
technology use
Educationallevel covered
Respondents of studies
Technologiescovered
in studiesType of indicators
Presence ofindicators
addressing equityethics and
investment issues
Presence ofindicators on ICT
integration incurriculumimpact etc
Senate Committee onEducation Arts andCulture with SEAMEO-INNOTECH
Department ofEducation
None Public and privateelementary andsecondary schools
School heads All ICT relatedtechnologies suchas televisionprojectors radiocassette playerscomputersperipherals andinternet access
Quantitative Availability of
publiccommercialutilities andservices
Computer skillsof schoolpersonnel
Presence ofcomputers inschools
Instructionalacademic useof computers
Yes specificallythose pertaining touse of computers bynon-formaleducation students
None
Research on internetin Slovenia
None Primary secondaryyouth hostels andkindergartens
Not specified Computers andinternet access
Quantitative
Internet access
Computersnetworks
None None
School net None Not specified Students andteachers
Computers andinternet access
QualitativeexamplesIntegration of ICTwith curriculuminstructionalpractices barriersto computer use
None Yes oncompetency ofICT instructors
Government NationalEducation Act of1999
None Primary andsecondary schools
Not specified Computersinternettelephonescomputerperipherals ratio
Quantitative None None
Philippines
Slovenia
South Africa
Thailand
33
33
Final Rep
ort
Basis for ICTindicatorsagency
who formulatedICT indicators
Presence ofstandards for
technology use
Educationallevel covered
Respondents of studies
Technologiescovered
in studiesType of indicators
Presence ofindicators
addressing equityethics and
investment issues
Presence ofindicators on ICT
integrationin curriculumimpact etc
UK National grid forlearning
ISTE (NETS)standards
Primary andsecondary schools
Students andteachers
Computers and theinternet
Quantitative andqualitative
Computers inschools
Internet andelectroniccommunication
Teachercondidence anduse of ICT inteaching
Expenditure onICT
Yes mainly onexpenditure andbudget allocation
Yes includesteacherconfidence in theuse of ICT andbenefit of ICT
US Teaching learningand computing - astudy of teacherrsquosuse of computertechnology theirpedagogies andtheir school context
ISTE (NETS)standards
Public and privateschoolselementary middleschool and highschool all subjectsexcept physicaleducation andspecial education
Teachers Computers internetuse (includes use ofvarious softwareCDRom etc
Quantitative andqualitative School
technologyleadership andtechnologyoutcomes
Pedagogicalmotivations forstudent computeruse
Internet use byteachers
Presence ofcomputers inAmerican schools
Teacher andteacher directedstudent use ofcomputers andsoftware
Technologysupport
Schoolinvestments ininstructionaltechnology
Yes includesindicators thatdeterminestechnology intensiveareas softwaresaturation etc
Yes specificallypedagogicalmotivations forstudent computeruse
UK
US
34
Develop
ing and U
sing Indicators of IC
T Use in E
ducation
Basis for ICTindicatorsagency
who formulatedICT indicators
Presence ofstandards for
technology use
Educationallevel covered
Respondents of studies
Technologiescovered
in studiesType of indicators
Presence ofindicators
addressing equityethics and
investment issues
Presence ofindicators on ICT
integration incurriculumimpact etc
NoneUzbekistan Government Lawon Education
None Primary andsecondaryeducation
Not specified Computer andinternet
Quantitative None
Viet Nam Government
Governmentrsquos goalto ldquouniversalizerdquoeducation
None Primary andsecondary
Not specified Computer andinternet
Quantitative None None
1
1IIIAttachment
Studies on the Use andImpact of ICTin Education
35 35Final Report
Several studies have been conducted on ICT and its use and impact on educationsome of which are included below
This survey on the information and communications technology (ICT) provisions inschools in England was carried out in April 2001 the findings of which were comparedto similar surveys conducted in 1998 1999 and 2000 The surveys collectedinformation on the number and type of computers available in schools expenditurein schools the extent and benefit of the use of ICT across curriculum subjects theuse of internet and other electronic network communication links and teacherusage of computers and their confidence in the use of ICT in the curriculum It is asample survey and the sample is chosen to be representative of different types ofschools throughout the country Some of the findings as categorised are thefollowing
a Computers in schools
average number of computers per school increased steadily in all types ofschools between 1998 and 2001 the increase was noted to be greatbetween 2000 and 2001
b Internet usage and other external electronic communication services
between 1998 and 2001 there was a considerable increase in thepercentage of schools connected to the internet
c Use of ICT in teaching and teacher confidence
in each type of school there was an increase in the percentage of teachersreported to feel confident in the use of ICT in 2001
d Expenditure on ICT
the average expenditure on computers per school increased steadily in allschool types between 1998 and 2001
Source Statistics of EducationSurvey of Information and Communications Technology in Schools 2001National Statistics BulletinDepartment for Education and SkillsIssue No 0901October 2001
The Center for International Development (CID) at Harvard University conducted aresearch which came up with the Network Readiness Index (NRI) a majorinternational assessment of countriesrsquo capacity to exploit the opportunities offeredby ICTs In the development of the NRI data sources fall under two generalcategories First a variety of measures mainly ldquohardrdquo variables and also ldquosoftrdquoones from sources such as the World Bank the International TelecommunicationsUnion Freedom House and the Business Software Alliance were used Seconddata collected from the questionnaire responses of more than 4500 business andgovernment leaders surveyed in 75 countries by the Global Competitiveness Reportrsquos2001 Global Executive Opinion Survey conducted by Harvard University and theWorld Economic Forum were heavily relied upon
The Network Readiness Index is an assessment of a countryrsquos capacity to makeuse of ICT resources It shows how nations are performing with regards to theirparticipation in the Networked World Seventy-five countries were computed NRIs
B The Network Readiness Index Measuring thepreparedness of nations for the networked world
A Survey of information and communicationstechnology in schools 2001 in England
36 Developing and Using Indicators of ICT Use in Education
and the United States of America tops the NRI ranking making it the most highlydeveloped ICT network and it has the greatest potential to exploit networkrsquos capacityIceland Finland Sweden Norway and Netherlands follow USA Another NorthernEuropean country Denmark ranks 7th followed by Singapore in 8th Austria in 9th
and the United Kingdom in the 10th place Among the countries in the region whichwere included are Korea rank number 20 followed by Japan in the 21st placeMalaysia in number 26 Thailand number 43 India number 54 Philippines number58 followed by Indonesia in number 59 Sri Lanka in number 62 China in 64Bangladesh in 73 and Viet Nam in 74
Two components were taken into consideration in the computation of the NRIThese are network use and enabling factors Network use is defined as the measureof the extent of increase in the use of ICT in a specific country This is still narroweddown to five more catagories Internet users per hundred inhabitants cellularsubscribers per hundred inhabitants internet users per host percentage ofcomputers connected to the internet and availability of public access to the internet
Enabling factors is made up of four sub-indices network access network policynetworked society and networked economy Network access includes variablesrelated to the information infrastructure hardware software and support Itmeasures the extent and quality of the network infrastructure and the existence ofequipment programmes and support services that enable ICT use Network policyrefers to the information and communications policy environment and the businessand economic climate It also deals with the levels of competition in thetelecommnications and ICT sectors Networked society measures the quality andextent of use of ICT facilities in the learning process and networked economyassesses the extent of public and private sectors participation and e-governmentare considered in this sub-index
Source httpwwwcidharvardeducrpdfgitrr2002-cho02pdf
This is a national population survey of public and private elementary and secondaryschools conducted by SEAMEO INNOTECH in the Philippines under Project TAOCARES last March 2001 Its main objective was to determine the ICT capabilitiesof schools A total of 45811 schools were given questionnaires with the schoolheads as respondent of which 7937 per cent responded The survey questionnaireconsisted of 42 items mostly focused on the readiness of schools in terms ofinfrastructure hardware software and manpower capabilities on ICT Outputs ofthe survey were sixteen regional profiles on the ICT-preparedness of schools whichincluded data on the availability of electricity access of schools to communicationfacilities presence of computers computer peripherals and other multi-mediaequipment in schools sources of funds to maintain ICT-related operations proficiencyof school staff in the use of computers training received on ICT computer coursesbeing offered in schools and other ICT-related information
Some of the major findings of the survey at the national level are the following
Only 6607 per cent of schools have electrical connections
Only 1330 per cent have landline telephones 290 per cent have fax machinesand 200 per cent have internet connections
5217 schools only or 1428 per cent have computers with the National CapitalRegion having the highest percentage at 8730 per cent
Only 1824 per cent of schools have staff proficient in the use of computers
C Profile on the capabilities of elementary and secondary schools in the Philippines 2000-2001
37 37Final Report
7862 per cent of schools get funding to maintain ICT related operations fromthe PTCA
Only very few schools (1313 per cent) have school heads who have receivedICT training in the past five years
6436 per cent of school heads need training on basic computer literacy
This study was conducted by the New Educational Technologies Foundation Inc anon-profit organisation composed of schools that believe in the capacity of IT toimprove the quality of student learning and efficiency of teaching A total of 794schools participated in the survey with school heads in the public and private schoolsas respondents The questionnaire was divided into two parts the first part askedabout perceptions level of awareness and attitudes regarding the value of computereducation and was answered by users and non-users of computers The secondpart which dealt with the actual use of computers was answered by users onlyAmong the findings are the following
The number of computers owned by a private schools is twice as much aswhat a public school can afford
Computers available in schools are mostly the models AT486
Most computer units in the public elementary schools were acquired throughdonations in the secondary and tertiary schools most computers were acquiredthrough purchase
Computers are mostly used to teach different application programmes
Source The 1996 National Survey on Computer Education New Educational TechnologiesFoundation Inc
D The 1996 national survey on computereducation in the Philippines
In a primary school in Sunnyside Elementary School Pullman Washington studentsare using e-mails web sites videos and video conferencing technology tools todevelop their learning skills Through these mediums the students alongside theirglobal peers identify and share their cultures with one another in new waysTraditionally students learn about the world through books but new technologyallows the students to get in depth information about different cultures throughwriting reading and communicating with their global peers The following are theassessment tools used Assessment rublics designed for specific projects lessonandor classroom experiences standard assessment tools (ie DRA and WrightGroup Reading Assessments) teacher anecdotal notes childrenrsquos ownmetacognitive voices in the process of learning in conference with the teacherand in self-reflection of work and presentations parentsrsquo reports of student learningprogress
Teaching in non-traditional ways can sometimes be a risky business - with all eyesupon the class to see if learning is taking place It has been shown that studentsform teams to read write and communicate using technology at rates that meetand exceed standards for primary classes But along the way the added value oftechnology contributes in areas such as thinking skills social skills engagement inlearning motivation teaching and collaborating as the class sees what is essentialto learn in the context of the real world
Source httpwwwncrelorgengaugeframeworkefpalignefpalisuhtm
E Use of multiple assessment tools
38 Developing and Using Indicators of ICT Use in Education
F Technology A major catalyst for increasing learning by Jody C Isernhagen University of Nebraska-Lincoinby Jody C Isernhagen University of Nebraska-Lincoinby Jody C Isernhagen University of Nebraska-Lincoinby Jody C Isernhagen University of Nebraska-Lincoinby Jody C Isernhagen University of Nebraska-Lincoin TTTTTechnologechnologechnologechnologechnology Horizons in Educay Horizons in Educay Horizons in Educay Horizons in Educay Horizons in Educationtiontiontiontion Journal Online Journal Online Journal Online Journal Online Journal Online August 1999 - FeaAugust 1999 - FeaAugust 1999 - FeaAugust 1999 - FeaAugust 1999 - Featuretureturetureture
A rural public school in Nebraska composed of 1400 students applied for a three-year competitive Excellence in Education Grant in late 1995 Six schooladministrators and 18 staff members designed a plan to restructure their schooland classrooms The staff members defined that the major skills needed by studentsare comprehension reasoning composition and experimentation A computerwas placed in each classroom (80 classrooms) and 27 computers were located inthe elementary Integrated Learning Lab with Computer Curriculum CorporationSuccess Maker Software This software automatically diagnoses and placesstudents on the appropriate skill level while using the computer The computer labwas used by 314 students and 13 teachers in grades 1-3 from January 1996through May 1998 Teachers were trained on the use of ClarisWorks MicrosoftWord E-mail Internet Presentation Stations and the integration technology as atook in teaching and learning Activities of the students involved computer buildingdesigning of web pages to help maintain the schoolrsquos web pages digitizing video topresent to the community creating panoramic views and interactive virtual realityscenes preparing letters of application resumes and cover letters and to searchthe web for jobs With all the activities the teacher served as guides figuring outwith the students how to arrive at a productive presentation
The CAT scores in reading and math for students using an Integrated Learning Labfor 25 years showed a significant difference between the means The scores ofstudents testing below the 50th percentile at grades 1-3 in reading and math increasedsignificantly over time These findings suggest that using an Integrated LearningLab with rural primary age children daily over an extended period of time maypositively impact achievement for students particularly those students functioningbelow the 50th percentile
Source httpwwwthejournalcommagazinevaultarticleprintversioncfmaid=2126
G The impact of ICT on literacy learning in English
This report is the result of a literature review conducted first to identify a number ofstudies that might shed light on the major impact of ICT on literacy learning inEnglish for 5 to 16 year olds and the second to undertake an in-depth review ofthe papers that were identified as being on the impact of networked ICT on literacylearning in English for ages 5 to 16 There were 1871 studies screened following acriteria to identify relevant reports 188 studies were found that met the criteria inthe protocol These studies were then keyworded or indexed and the results filedon an electronic database
Of the 188 studies relevant to the mapping study 16 pertained to the topic of theimpact of networked ICT on literacy learning Data were extracted from these 16studies and were used as basis for an in-depth review Of these half were outcomeevaluations (evaluations of the results of an experiment or innovation) seven wereprocess evaluations (evaluations on how an intervention was delivered rather thanwhether it worked or not) and one was a needs assessment
Results show that as far as the in-depth study on networked ICT goes results areinconclusive Concerning policy and practice the recommendations of this revieware highly tentative and take the form of implications or pointers With regard topolicy they are to focus research funding for large-scale studies to give considerationto the balance of study type expertise in research teams and to give consideration
39 39Final Report
to the fact that the provision of computer hardware and software to schools andthe application of ICT in teaching and learning need to be informed by researchand evaluation
Source httpeppiioeacukEPPEWebhomeaspxpage=reelreview_groupreview_ one_abstractht
H Education Research Fund Effective Integrationof IT in Singapore Schools Pedagogical
and Policy ImplicationsThis is a report on the key findings of a questionnaire survey aimed at identifying thedegree of information technology (IT) integration among Singapore schools Thesurvey is the first part (Phase One) of a larger study funded by the Ministry ofEducation of Singapore aimed to examine and analyze where and how IT is integratedin Singapore schools to develop pupilsrsquo higher order thinking skills A total of 328schools responded to the survey of which 168 are primary schools 144 secondaryschools and 16 junior collegescentralized institutes (JCCs)
Major findings of the questionnaire survey include
Phase I schools in the IT Masterplan have significantly higher pupil and teacheruse of IT greater opportunities for staff development of teachers and moreconducive IT culture than Phase III schools
Independent-autonomous schools have significantly better management of ITresources higher teacher and pupils use of IT greater opportunities for staffdevelopment for teachers and more conducive IT culture than governmentschools
There are no significant differences among the primary schools secondaryschools and JCCs in terms of the management of IT resources pupil andteacher use of IT staff development and school IT culture
The correlations among management of IT resources pupil use of IT teacheruse of IT staff development and IT culture are significant and highly positive
- Contents
-

1
1IAttachment
ICT IndicatorsUsed in
Different Countries
15 15Final Report
Government What students should know and be able to do at a certain level
Connectivity Number of teachers with notebook Computer student ratio Bandwidth available in schools Type of internet connection
Changes in studentperformances afterintegrating ICT intoeducation
Increase in student engagement enthusiasm and motivation If student-centred learning took place Improvement in studentsrsquo high-order thinking skills improved Occurrence of changes in teaching practices Improvement in the ability to use emerging technologies
University of Sydney
ICT Indicators in Baltic and CIS Countries
Hardware equipment Computer classroom availability in educational institutions (EI) The average number of students per one computer in EI equipped
with computer classrooms Percentage of IBM- and Apple-compatible computers in total
number of EI computers Percentage of EI equipped with one or more multimedia system in
total EI equipped with computer classroom number Percentage of EI equipped with local network to total EI equipped
with computer classrooms number
Software Percentage of computers with installed OS DOSTM to total numberof computers in computer classes
Percentage of computers with OS WindowsTM of Apple Macintoshto total computer number in computer classes
Per cent of computers with other OS to total computer number incomputer classes
Percentage of EI with any educational software for teaching thecorresponding subjects to total EI number with computer classes1 Elementary School subjects2 Science subjects3 Humanities4 Informatics or information technologies
Percentage of educational software designed by the specialistswithin the country to total number of educational software usedin EI for teaching of the corresponding subject curriculum(elementary school science subjects humanities informationsinformation technologies)
Percentage of educational software designed by foreign specialiststo total number of educational software used in EI for teaching ofthe corresponding curriculum (elementary school science subjectshumanities informaticsinformation technologies
Components of ICT Indicators
UNESCO Institute ofInformationTechnology inEducation
Official documents Official documents in ITICTs in secondary education Official documents in ITICTs in secondary education currently
in force
ICT in curricula Available state curriculum on informatics andor InformationTechnologies
Informatics andor Information Technologies as a separate subject ICT usage to support other subjects implied in curricula on these
subjects
Global communication Percentage of EI without internet access Percentage of EI with limited internet access - only e-mail Percentage of EI with access via dial-up channel Percentage of EI with access via dedicated line Percentage of EI with own web-pages
ICT Indicators in AustraliaAgency responsiblefor data gathering ICT indicators Components of ICT indicators
Agency responsiblefor data gathering ICT indicators Components of ICT indicators
16 Developing and Using Indicators of ICT Use in Education
Personnel development Percentage of elementary school teachers subject teachers(except teachers of Informatics andor Information Technologies)teachers of informatics and EI administration who haveundertaken the computer literacy course from 1 September 1999until present time1 Less than 50 hours (Index 1)2 50-100 hours (Index 2)3 Over 100 hours (Index 3)
Computer skills of elementary school teachers subject teachersand teachers of Informatics and administration1 Elementary computer literacy2 Proficiency in ICT field
ICT Indicators in Baltic and CIS Countries (contrsquod)Agency responsiblefor data gathering ICT indicators Components of ICT indicators
ICT Indicators in Canada
Pan-CanadianEducation IndicatorsProgramme (PCEIP)
The pupil-computer ratio is a proxy measure of the access of availabilityof computer to students in schools Only computers used for educationalpurposes are included in the ratio
Internet connectivity This is a measure of the percentage of students attending schools thatwere connected to the internet for educational purposes at the time ofthe survey Schools that were connected for administrative purposesonly were excluded
Internet activities ofstudents
School ICT co-ordinators were questioned about instructional activitiesinvolving the use of the internet They were asked to identify typicalactivities that students at certain grade levels would have engaged in bythe end of the school year
Obstacles to fulleruse of informationand communicationstechnologies
Principals were asked to identify the major barriers hindering theachievement of their schoolrsquos computer-related goals for students Inthis section items are presented that are identified as major obstaclesby principals of schools representing at least 50 per cent of enrolmentsat each of the three levels of schools The obstacles noted have beengrouped into three categories those relating to hardware and softwarethose relating to instruction and those relating to the training of teachers
Agency responsiblefor data gathering
ICT indicators Components of ICT indicators
ICT Indicators Used in Europe (Denmark Sweden Finland Norway and UK)
Information SocietyTechnologyProgramme fundedby the EuropeanCommunity
Policy and strategy Countries with an official policy on the use of ICT
Schedule for implementing national ICT education projects
Responsibility for the purchase and maintenance of hardware
Objectives in national ICT projects
Inclusion of ICT in the national curriculum
Schools with ICT implementation plan (simple)
Schools with ICT implementation plan (detailed)
Approaches of ICT defined in the curriculum
Objectives defined in the curriculum for the teaching or use of ICT
Schools with autonomous decision power
Agency responsiblefor data gathering ICT indicators Components of ICT indicators
Pupil-computerratio
17 17Final Report
Use and access Pupils and teachers with a personal e-mail address
Use of ICT in areas of the curriculum
Use of external electronic communication services
Teachers use the internet for non-computing teaching
Internet use in teaching
Teachers opinion about the internet as a tool
Pupils access to the internet
Teachers access to computer and internet at home
Who pays teachers home access
Teachers who connect with other schools via the internet
Competencies New ICT and media students in percentages of all students
New ICT and media students by level of education
Qualifications and degrees in information technology and mediastudies
Population with a degree of qualification in ICT and media studies byfield of study and level of education
Hoursyears spent to pedagogical IT guidance
Hoursyears spent to technical IT guidance
Teachers confidence in the use of ICT
Students and teachers knowledge regarding ICT
Specialist ICT teachers
ICT courses during initial training of general class teachers
ICT trained teachers
Change in teaching methods
Average expenditure on ICT in schools
Sources of funding for ICT in schools
Total expenditures on ICT in schools
Distribution of the specific budget between the purchase ofequipment and expenditure on human resources
Number of computers per 100 pupils
Number and quality of computers available for administration pupilsand teachers
Expected increase in the number of computers
Computers with access to school net andor internet
Quality of internet access in schools
Placement of the computers
Schools with own website
Schools with on-line services
Schools with intranet website e-mail
Economy andinfrastructure
ICT Indicators Used in Europe (Denmark Sweden Finland Norway and UK) (contrsquod)Agency responsiblefor data gathering ICT indicators Components of ICT indicators
18 Developing and Using Indicators of ICT Use in Education
Inclusion of ICT in the curriculum
Percentage of teachers who use computers andor internet in theclassroom
Approaches to ICT defined in the curriculum
Objectives defined in the curriculum for the teachingor the use of ICT
Inclusion of ICT in the initial training of all teachers (except specialistICT teachers)
Inclusion of ICT in the curriculum
Percentage of teachers who use computers andor internet in theclassroom
Reasons given for not using internet with pupils
Approaches to ICT defined in the curriculum
Annual number of hours recommended for teaching ICT as a subjectin its own right
Objectives defined in the curriculum for the teaching or the use ofICT
Inclusion of ICT in the initial training of all teachers (except specialistICT teachers)
Percentage share of compulsory teaching related to ICT and thenumber of hours devoted to such teaching in the initial training of allteachers (except specialist ICT teachers)
Desirable ICT skills according to official recommendations for theinitial training of all teachers (except specialist ICT teachers)
Secondary (lowerand uppersecondaryeducation)
Both Number of pupils per computer and number of pupils per computerwith an internet connection (primary and secondary education)
Responsibility for the purchase and maintenance of hardware(primary and secondary education)
Distribution of the special budget between the purchase ofequipment and expenditure on human resources (primary educationgeneral lower secondary education general upper secondaryeducation)
Average periods during which primary school teachers usecomputers (with or without internet connection) in the classroomhours per week
Specialist ICT teachers
Percentages of primary and secondary school teachers in Europewho have received official training in the use of computers andorinternet in their teaching
ICT Indicators Used in IndiaAgency responsiblefor data gathering
ICT indicators Components of ICT indicators
Ministry of HumanResourceDevelopment
Presence of MIS
Presence of software
ICT in textbooks
ICT in computer subjects
In-serv ice and pre-service training of teachers
Primary
ICT Indicators Used in EuropeAgency responsiblefor data gathering ICT indicators Components of ICT indicators
19 19Final Report
Student understanding of ICTrsquos benefits disadvantages as well aschallenges in information technology
Studentrsquos use of ICT knowledge in getting processing arrangingdistributing and keeping information
Governmentrsquos goalsand objectives
ICT Indicators Used in IndonesiaAgency responsiblefor data gathering ICT indicators Components of ICT indicators
Student application of knowledge skills and attitudes in designinginformation technology systems solving problems relating to ICT
Includes public halls libraries
Training hours of the principal Training hours of teachers implemented by the school itself Training hours on ICT use in education per teacher Percentage of operating budget vis-a-vis the total budget Percentage of teachers in the department of ICT Whether an ICT yearly plan exists or not Whether an incentive system for ICT personnel exists or not
ICT Indicators Used in Republic of Korea
Support
Agency responsiblefor data gathering ICT indicators Components of ICT indicators
bull Ministry ofEducation
bull KoreanEducationalResearch andInformationService (KERIS)
Inputs (infrastructurehardware software)
Number of students per computer Number of computers per teacher Percentage of computers less than 3 years old Percentage of computers connected to internet Speed of internet connection Number of educational software (CD-titles) Percentage of computers equipped with 5 basic applications
Number of students per PC
Internet access of students
Number of teachers inpublic schools who canoperate PCs
Number of teachers at elementary lower and uppersecondary schools and special education schools
Number of humanresources with IT-relatedmasterrsquos and doctoraldegrees
Number who graduated from masterrsquos course
Number who graduated from doctoral course
Number of foreign nationalswith the status of residenceldquoEngineerrdquo and number ofnationals entering Japanwith the status of residenceldquoEngineerrdquo
Number of registered foreign nationals
Number of foreign nationals entering Japan
Ensuring security andreliability
IT security measures (information security policies presenceof firewalls and back-up systems)
Number of public schoolswith internet access andcomputers
In households
In SMEs (companies with five employees or more)
In corporate (companies with 300 employees or more)
Number of internet users
ICT Indicators Used in JapanAgency responsiblefor data gathering ICT indicators Components of ICT indicators
e-Japan PriorityPolicy Programme
Public facilities withinternet access
20 Developing and Using Indicators of ICT Use in Education
Teachers
Percentage of subjects utilising multimedia materials for teachingand learning through WWW
Percentage of classes using web-board
Percentage of subjects using web-board
Percentage of teachers participating in an association regardingICT use
Percentage of subjects using computer lab
Percentage of functions of the Information System being used
Whether to use electronic decision system
Number of posting written for and by parents
Students
Hours of use of computer per student
Percentage of students participating in ICT special programmesafter school (Elementary)
Whether to teach on computer (Secondary)
Percentage of subjects collecting assignments through web board
Number of search library DB per students
Percentage of student-governing community utilising webenvironment
Whether a programme regarding internet ethics exists
Number of web communities per class
Internet
Usage of internet
Number of access to school website per week
How often school websites are revised
Output Teachers
Percentage of teachers having e-mail address
Percentage of teachers having homepage
Percentage of teachers having ICT certificates
Percentage of teachers participating in educational SW contests
Students
Percentage of students having e-mail address
Percentage of students having homepage
Percentage of students having ICT certificates
Percentage of students participating in educational SW contests
Percentage of students completing the ICT course (32 hours)
Utilization
Agency responsiblefor data gathering ICT indicators Components of ICT indicators
ICT Indicators Used in Republic of Korea (contrsquod)
21 21Final Report
Malaysian smart schoolsuse of technology forinformation processing andas a productivity tool toenhance professionaldevelopment and toautomate instruction
Malaysian government(Ministry of Education)
ICT in curriculum
ICT in pedagogy
ICT in assessment
ICT in materials
ICT Indicators Used in MalaysiaAgency responsiblefor data gathering ICT indicators Components of ICT indicators
How schools teachersand students usetelecommunicationstechnologies
Number of teachers taking in-service training using a tele-learningapproach
Obstacles faced by teachers in using telecommunicationstechnologies
Factors that encouraged telecommunications technology use
Percentage of teachers agreeing that telecommunicationstechnology can enhance learning and teaching
Percentage of students who had positive views about technologyactivities in school
Telecommunicationsequipment
Paper by David HarrisNZCER
Percentage of schools with telephone lines
Percentage of schools with classrooms that has telephone lines
Percentage of schools with fax machines
Percentage of schools with computers that has access to amodem
ICT Indicators Used in New ZealandAgency responsiblefor data gathering ICT indicators Components of ICT indicators
Availability of publiccommercial utilities andservices
Project TAO Cares(computer-assistedreforms for schools)senate committee oneducation arts andculture
Government throughthe Department ofEducation
Percentage of schools with electricity
Percentage of schools whose electricity is available for 24 hoursper day
Percentage of schools whose electricity is available year-round
Percentage of schools with ICT equipment
Percentage of schools where publiccommercial utilities andservices are available
Percentage of schools located in communities where publiccommercial utilities and services are available
ICT Indicators Used in The PhilippinesAgency responsiblefor data gathering ICT indicators Components of ICT indicators
Computer skills ofschool personnel
Percentage of schools staff who has computer skills
How school staff acquired computers skills
Percentage of school staff with expertise in using differentcomputer software
22 Developing and Using Indicators of ICT Use in Education
How were computers in the schools acquired
Location of computers in the school
Modes of set-up of the schools computers
Purposes for which computers are used
Operating system used
Software used for teaching and learning
How school acquired software programmes
Percentage of schools with internet access
Source of funds to pay for internet access
Internet connection arrangement (eg dial-up dedicated dial-upor leased line connection)
Who are given access to the internet (eg students principaladministrative staff etc)
Financial capacity to have internet access
How often computers are upgraded
Availability of funds for computer maintenance
Instructionalacademicuse of computers
Percentage of schools offering computer literacy subjects
How computer literacy subjects are offered (eg as part of regularcurriculum integrated with other subjects etc)
School personnel handling computer courses in the school
Purposes for which computers are used as part of instruction
Fees collected for computer use internet access
Computer use by non-formal education learners
Presence of computersin schools
ICT Indicators Used in The Philippines (contrsquod)Agency responsiblefor data gathering ICT indicators Components of ICT indicators
ICT Indicators Used in Slovenia
Information-telecommunicationsinfrastructure
Research on internetin Slovenia
Agency responsiblefor data gathering ICT indicators Components of ICT indicators
Telecommunication No of telephone connections No of telephone connections per 100 residents No of cellular phone connections NMT GSM No of cellular phone connections per 100 residents No of ISDN connections
Internet
No of internet providers No of backbone providers No of computers connected to the internet per 100000
residents No of wwwdomainsi web sites
Schools and relatedinstitutions
Internet
Schools with internet access (secondary schools primaryschools youth hostels kindergartens)
Pupils with internet access Schools with homepage
Computers networks and ISDN
Average number of computers per 100 employees Average number of computers per 100 pupils Share of schools with computers connected to network and
ISDN
23 23Final Report
ICT Indicators Used in Africa
Impact of ICT on qualityteaching and learning
School net educatordevelopmentprogramme
Agency responsiblefor data gathering ICT indicators Components of ICT indicators
1 ICT Skills Level of educator - includes assessment on skills suchas basic word processing e-mail and electronic informationaccessing skills
2 Integration Level - to be measured using the following guidelines
Educatorsrsquo Competence with ICT
Educators should be able to draw on generic ICT applications inorder to prepare for teaching
Educators should be generally competent in those ICTresources that could most benefit their teaching and the learnersrsquolearning
Educators should understand how to access and use electronicinformation and communications resources such as the internetfor the benefit of both the educator and the learner
Educators should know how to use ICT to improve theirprofessional and administrative efficiency
Educators should know how to encourage the development oflearnersrsquo ICT skills within the context of the lessons being taught
Integration of ICT with the curriculum
Educators should understand the key learning strategies thatinfluence the use of ICT to support teaching and learning
Educators should know how to organise their class andclassroom when making use of ICT to achieve lesson outcomes
Educators should understand the role of computer literacy withparticular reference to the educational use of computers as atool in a diverse and developing country like South Africa
Educators should know and understand the characteristics ofinformation particularly its role in learning and its ethical use andits credibility
Educators should be aware of current health legal and ethicalissues regarding the use of ICT in the classroom
Educators should understand how to assess the contributionof ICT to the process of learning
An evaluation instrument is created for assessments in this category
3 The Professional Growth of the educator - This is measuredinitially by conducting pre-course baseline studies in which theeducator reflects on existing practice and perceivedshortcomings This process begins with a workshop and isfurther pursued by the mentor in the follow-up period Progressevaluation of the impact of ICT and the development programmeon the educator as a professional is monitored by promptingfrom the mentor and the educator recording entries in anelectronic journal
4 Whole school levels - Whole school ICT use is measured in anumber of ways Staff ICT and integration-related proficienciesare measured individually or on a departmental or whole-staffbasis This is the choice of the school An instrument is used tomeasure the instructional use of technology in a school Thisinstrument categorises 6 levels of computer efficiency rangingfrom non-use to refinement The emphasis in this framework isgiven to the degree to which technology is used to support aconstructivist orientation to classroom pedagogy
24 Developing and Using Indicators of ICT Use in Education
Quantum jumpstrategy
All teachers and students to be IT and internet-literate by theyear 2002
Production of 250 titles of academic software and contentsannually and provision of funding worth 500 million Baht perannum to various communities for content development as wellas provide budget for localizing 2000 titles of useful foreigncontent
PC density target by the year 2006 as follows
1 20 for secondary school level
1 40 for primary school level
Investment in the production of IT and network equipment foruse in the education sector including software and multimedia
Provision of IT for education and professional development tothe under-privileged the disabled and common people seekinglifelong education
Provision of adequate radio frequencies for the education sector
Investment in research and development in IT for education atleast 400 million Baht per year
Establishment of monitoring and evaluating procedures andprotocols
Establishment of a National Institute of Technology for Education
ICT Indicators Used in Thailand
Value-added strategyGovernment ofThailand
Agency responsiblefor data gathering
ICT indicators Components of ICT indicators
Provision of software content and necessary supporting ITcurriculum via searching localizing producing to make betteruse of existing hardware in schools
Training of teachers to gain literacy in computer and internetuses
Establishment of maintenance programme for the existinghardware
Enhancement of the capabilities of organizations that can providesupport and services to schools by forming network of agenciesand individuals
Monitoring and evaluation of the use of technology for educationand collect data for planning purpose
Equity strategy Provision of a set of minimum requirement equipment andfacilities to needy schools including electricity 3 telephone lines5 computer sets 1 printer 3 sets of television 5 sets of radio 3internet accounts 100 hours per month via SchoolNetprogramme
Provision of a ldquoDigital Learning Centrerdquo (DLC) to the community
Training of teachers and trainers in IT and internet literacy
25 25Final Report
ICT Indicators Used in UK
Computers in schoolsNational Grid forLearning (NGFL)
Agency responsiblefor data gathering ICT indicators Components of ICT indicators
Computerpupil ratio
Average number of computers per school
Type age and multimedia capability of computers
Average number of computers used for management andadministrative purposes
Average number of computers linked to an international schoolnetwork
Different types of computer peripherals available
Internet and electronic Connectivity to the net
Number of schools connected to the internet at broadband level
Percentage and number of schools who have their own website
At least one networked computer with internet access in eachschooll for management and administration
E-mail access
Teacher confidence anduse of ICT in teaching
Teacher confidence
Use of ICT in subjects
Benefit of ICT in subject
Expenditure on ICT Estimated total
Average per school
Average per pupil
ICT Indicators Used in the United States of America
Internet use by teachers
Agency responsiblefor data gathering ICT indicators Components of ICT indicators
Teaching learning andcomputing A nationalsurvey of schools andteachers Centre forResearch onInformationTechnology andOrganizations
Public schools with internet access
Internet connections in classrooms of teachers
Teacherrsquos internet access at home and in their classroom
How often teachers use information from internet in lessons
Teacherrsquos use of electronic mail to communicate with teachers inother schools
Per cent of teachers having their students use different types ofsoftware
Student use of web browser software in lessons
Internet use for beyond classroom student projects andpublishing
Teacherrsquos perceived value of having a computer with electronicmail on their own desk
Teacherrsquos perceived value of classroom world wide web access
Internet use from various locations (home school etc)
Internet use by subject matter taught
Internet use by school level taught
Ability to use web search engine
26 Developing and Using Indicators of ICT Use in Education
Teacher and teacherdirected student useof computers andsoftware
Teacher directed student use of computers
1 Access to classroom computers
Computer-student ratios on classrooms
Number of classroom computers
Computer access in lab and media centres versus classrooms
2 Computer platforms used by student
Extent and variety of software used and teachers objectives for use
1 Type of software used
2 Software that teachers judge as most valuable for students
3 Objectives for computer use
4 Student computer use for school work on their own time
Teacher computer extertise and professional use
1 Use of software in profession
2 Expertise with computers
Technology support Average weekly hours spent by technology co-ordinator ondesignated job tasks
Average minutes spent per week by technology co-ordinatoron job tasks per teacher
Percentage of technology co-ordinators reporting additionalsupport from others (eg teachers district officers aidesadministrators etc)
Teacher rating of availability of technology support (per schoollevel and per type of school)
Total support hours per teacher (per school level and per typeof school)
Number of development occasions for teachers (per schoollevel and per type of school)
Technology support content used to deliver technologyservices to teachers [eg (1) facilities network and internetaccess hardware software (2) staff assistance and necessaryservices technical support help desk network services (3)one-on-one personal guidance computer experts for troubleshooting]
Percentage of teachers who have resource (ICT) available foruse
ICT Indicators Used in the United States of America (contrsquod)Agency responsiblefor data gathering ICT indicators Components of ICT indicators
Presence of computersin American schools
Total instructional computers
Students per computer
Type of computer in each school level
Per cent of computers with selected attached peripherals
Locations of instructional computers
Per cent technology-intensive by school level
Software saturation
Software diversity
Type of internet access
Public schools with internet access
27 27Final Report
Per student expenditure on hardware software and supportper school level
Instructional technology expenditure by US schools (hardwaresoftware and support
Per student expenditure on hardware software and supportfor one year vs five-year estimates
Five-year technology expenditures per student for schools withand without their own technology budgets
Five-year technology expenditures (per student) for public andnon-public schools
School technology expenditures (per student) by communityincome level
Five year school technology expenditures (per student) by levelof technology penetration
ICT Indicators Used in the United States of America (contrsquod)Agency responsiblefor data gathering ICT indicators Components of ICT indicators
School investments ininstructional technology
ICT Indicators in UzbekistanAgency responsiblefor data gathering ICT indicators Components of ICT indicators
Number of computer classes
ICT integration in subjects like physics chemistry and biology
Teacher training
Establishment of ICT departments in universities to train teachers for school
IT as a subject in general education
Number of trained teachers
Provision of computer labs in schools
Collaboration in international training about IT
Application of IT in school management
Government
ICT Indicators in Viet NamAgency responsiblefor data gathering ICT indicators Components of ICT indicators
Establishment of ICT departments in universities to train teachers for school
IT as a subject in general education
Number of trained teachers
Provision of computer labs in schools
Collaboration in international training about IT
Application of IT in school management
Government
1
1IIAttachment
Comparison ofICT Indicator Themesin Selected Countries
29
29
Final Rep
ort
Basis for ICTindicatorsagency
who formulatedICT indicators
Presence ofstandards for
technology use
Educationallevel covered
Respondents of studies
Technologiescovered
in studiesType of indicators
Presence ofindicators
addressing equityethics and
investment issues
Presence ofindicators on ICT
integration incurriculumimpact etc
Goals and objectivesof the governmentAll students will leaveschool as confidentcreative andproductive users ofnew technologiesparticularlyinformation andcommunicationstechnologies andunderstand theimpact of thosetechnologies insociety
Yes Curriculumand StandardsFramework (CSF)
Primary secondarynon-formal
Teachers students Computers internetuse of satellite TV
Quantitative andqualitative
Not specified Yes specificallythe studyconducted by theUniversity ofSydney Includestudies on studentengagemententhusiasm andmovitationimprovement ofhigher-orderthinking skills etc
Based on a meetingconvened in IITEMoscow in 2000 todevelop a set of ICTindicators
None Primarysecondary andtertiary levels
Heads ofdepartmentssenior specialistsstaff of nationalCentres ofInformationalTechnologies andEducation orCentres of TeacherTraining Retrainingand EducationalSupport
Computers andinternet
Quantitative -policy documentsICTs in curriculumhardware andequipmentsoftware Globalcommunicationmeans andpersonneldevelopment
None Partly
Australia
Baltic andCIScountries
30
Develop
ing and U
sing Indicators of IC
T Use in E
ducation
Basis for ICTindicatorsagency
who formulatedICT indicators
Presence ofstandards for
technology use
Educationallevel covered
Respondents of studies
Technologiescovered
in studiesType of indicators
Presence ofindicators
addressing equityethics and
investment issues
Presence ofindicators on ICT
integration incurriculum impact
etc
Canada Two criteria fordevelopment ofindicator set
Type of educationinformation neededfor policydevelopment
Practical availabilityof dataindicatorsdeveloped by Pan-CanadianEducationIndicatorsProgramme (PCEIP)
None Elementary andsecondary level
Not specified Computers andinternet
Quantitative andqualitative
Pupil-computerratio
Internetconnectivity
Internet activitiesof students
Obstacles to fulleruse of informationandcommunicationstechnologies
None Yes specificallyon whatencouragesteachers andstudents to usecomputers
Europe 1 Indicators based onthe eEurope initiativeof the EuropeanUnion Action lineldquoEuropean youth intothe digital agerdquo Thegoal for the saidobjective is to turndigital literacy to abasic competence forall young EuropeansSIBIS Study
Yes ISTE (NETS)standards
Various researcherscovered differentlevel public primaryand lowersecondary primarysecondary andspecial schoolshead teachers andteachers
School headsteachers
ICT in generalcomputers andinternet access
Quantitative andqualitative
Policy andstrategy
Economy andinfrastructure
Use and access
Competencies
Yes specifically onnational policiesand expenditure
Yes oncompetency ofICT instructors
Europe 2 Eurydice Yes ISTE(NETS)standards
Primary andsecondary level
Not specified Computers andinternet
Mostly quantitativevery little on qualita-tive indicatorsExamples
Number of pupilsper computer
Desirable ICTskills according toofficial recom-mendations forthe initial trainingof all teachers(except specialistICT teachers)
Mainly onexpendituredistribution ofbudget
Yes on integrationof ICT in subjects
31
31
Final Rep
ort
Basis for ICTindicatorsagency
who formulatedICT indicators
Presence ofstandards for
technology use
Educationallevel covered
Respondents of studies
Technologiescovered
in studiesType of indicators
Presence ofindicators
addressing equityethics and
investment issues
Presence ofindicators on ICT
integration incurriculumimpact etc
India Government None Elementary andsecondary schools
Not specified Computersinternet software
Quantitative None None
Indonesia Curriculum Centre
Governmentrsquos goalsand objectives
None Elementary andsecondary schools
Not specified Computers andthe internet
Quantitative Moreof internet andcomputer use andaccess
None None
Japan eJapan priority policyprogrammevarioussurveys conducted bygovernment agencieson ICT in general Likethose conducted bythe Ministry of PostsandTelecommunicationsSurvey on SocialEducation
None Elementary andsecondary in someindicators notspecified in otherindicators
Not specified Computers andinternet
Quantitative Moreof internet andcomputer use andaccess
Yes Governmentgeneral IT policy onelementary andsecondary schoolsthe same forschools for theblind and disabled
None
Republic ofKorea
Cyber Korea 21Vision To preparestudents forknowledge basedsociety by realizinglife-long learning viacyber-educationsystemrdquoKoreaNational StatisticsOffice
Yes - based onthe documententitled Adaptingeducation to theinformation ageA white paper
Elementarysecondary
Teachers andstudents andschoolheadmasters
Computersinternet andmultimedia
Quantitative Moreof internet andcomputer use andaccess throughinput utilizationand outputindicators
None None
Malaysia Government None Elementary andsecondary schools
Not specified Computers andthe internet
Quantitative None None
Quantitative andqualitative
Telecommunica-tions equipment
How schoolsteachers andstudents usetelecommuni-cationstechnologies
New Zealand Research conductedby the TelecomEducation Foundation
None Not specified Teachers andprincipals
Telephone linesfax machinescomputers andinternet
None Yes specificallyon whatencouragesteachers andstudents to usecomputers
32
Develop
ing and U
sing Indicators of IC
T Use in E
ducation
Philippines
Basis for ICTindicatorsagency
who formulatedICT indicators
Presence ofstandards for
technology use
Educationallevel covered
Respondents of studies
Technologiescovered
in studiesType of indicators
Presence ofindicators
addressing equityethics and
investment issues
Presence ofindicators on ICT
integration incurriculumimpact etc
Senate Committee onEducation Arts andCulture with SEAMEO-INNOTECH
Department ofEducation
None Public and privateelementary andsecondary schools
School heads All ICT relatedtechnologies suchas televisionprojectors radiocassette playerscomputersperipherals andinternet access
Quantitative Availability of
publiccommercialutilities andservices
Computer skillsof schoolpersonnel
Presence ofcomputers inschools
Instructionalacademic useof computers
Yes specificallythose pertaining touse of computers bynon-formaleducation students
None
Research on internetin Slovenia
None Primary secondaryyouth hostels andkindergartens
Not specified Computers andinternet access
Quantitative
Internet access
Computersnetworks
None None
School net None Not specified Students andteachers
Computers andinternet access
QualitativeexamplesIntegration of ICTwith curriculuminstructionalpractices barriersto computer use
None Yes oncompetency ofICT instructors
Government NationalEducation Act of1999
None Primary andsecondary schools
Not specified Computersinternettelephonescomputerperipherals ratio
Quantitative None None
Philippines
Slovenia
South Africa
Thailand
33
33
Final Rep
ort
Basis for ICTindicatorsagency
who formulatedICT indicators
Presence ofstandards for
technology use
Educationallevel covered
Respondents of studies
Technologiescovered
in studiesType of indicators
Presence ofindicators
addressing equityethics and
investment issues
Presence ofindicators on ICT
integrationin curriculumimpact etc
UK National grid forlearning
ISTE (NETS)standards
Primary andsecondary schools
Students andteachers
Computers and theinternet
Quantitative andqualitative
Computers inschools
Internet andelectroniccommunication
Teachercondidence anduse of ICT inteaching
Expenditure onICT
Yes mainly onexpenditure andbudget allocation
Yes includesteacherconfidence in theuse of ICT andbenefit of ICT
US Teaching learningand computing - astudy of teacherrsquosuse of computertechnology theirpedagogies andtheir school context
ISTE (NETS)standards
Public and privateschoolselementary middleschool and highschool all subjectsexcept physicaleducation andspecial education
Teachers Computers internetuse (includes use ofvarious softwareCDRom etc
Quantitative andqualitative School
technologyleadership andtechnologyoutcomes
Pedagogicalmotivations forstudent computeruse
Internet use byteachers
Presence ofcomputers inAmerican schools
Teacher andteacher directedstudent use ofcomputers andsoftware
Technologysupport
Schoolinvestments ininstructionaltechnology
Yes includesindicators thatdeterminestechnology intensiveareas softwaresaturation etc
Yes specificallypedagogicalmotivations forstudent computeruse
UK
US
34
Develop
ing and U
sing Indicators of IC
T Use in E
ducation
Basis for ICTindicatorsagency
who formulatedICT indicators
Presence ofstandards for
technology use
Educationallevel covered
Respondents of studies
Technologiescovered
in studiesType of indicators
Presence ofindicators
addressing equityethics and
investment issues
Presence ofindicators on ICT
integration incurriculumimpact etc
NoneUzbekistan Government Lawon Education
None Primary andsecondaryeducation
Not specified Computer andinternet
Quantitative None
Viet Nam Government
Governmentrsquos goalto ldquouniversalizerdquoeducation
None Primary andsecondary
Not specified Computer andinternet
Quantitative None None
1
1IIIAttachment
Studies on the Use andImpact of ICTin Education
35 35Final Report
Several studies have been conducted on ICT and its use and impact on educationsome of which are included below
This survey on the information and communications technology (ICT) provisions inschools in England was carried out in April 2001 the findings of which were comparedto similar surveys conducted in 1998 1999 and 2000 The surveys collectedinformation on the number and type of computers available in schools expenditurein schools the extent and benefit of the use of ICT across curriculum subjects theuse of internet and other electronic network communication links and teacherusage of computers and their confidence in the use of ICT in the curriculum It is asample survey and the sample is chosen to be representative of different types ofschools throughout the country Some of the findings as categorised are thefollowing
a Computers in schools
average number of computers per school increased steadily in all types ofschools between 1998 and 2001 the increase was noted to be greatbetween 2000 and 2001
b Internet usage and other external electronic communication services
between 1998 and 2001 there was a considerable increase in thepercentage of schools connected to the internet
c Use of ICT in teaching and teacher confidence
in each type of school there was an increase in the percentage of teachersreported to feel confident in the use of ICT in 2001
d Expenditure on ICT
the average expenditure on computers per school increased steadily in allschool types between 1998 and 2001
Source Statistics of EducationSurvey of Information and Communications Technology in Schools 2001National Statistics BulletinDepartment for Education and SkillsIssue No 0901October 2001
The Center for International Development (CID) at Harvard University conducted aresearch which came up with the Network Readiness Index (NRI) a majorinternational assessment of countriesrsquo capacity to exploit the opportunities offeredby ICTs In the development of the NRI data sources fall under two generalcategories First a variety of measures mainly ldquohardrdquo variables and also ldquosoftrdquoones from sources such as the World Bank the International TelecommunicationsUnion Freedom House and the Business Software Alliance were used Seconddata collected from the questionnaire responses of more than 4500 business andgovernment leaders surveyed in 75 countries by the Global Competitiveness Reportrsquos2001 Global Executive Opinion Survey conducted by Harvard University and theWorld Economic Forum were heavily relied upon
The Network Readiness Index is an assessment of a countryrsquos capacity to makeuse of ICT resources It shows how nations are performing with regards to theirparticipation in the Networked World Seventy-five countries were computed NRIs
B The Network Readiness Index Measuring thepreparedness of nations for the networked world
A Survey of information and communicationstechnology in schools 2001 in England
36 Developing and Using Indicators of ICT Use in Education
and the United States of America tops the NRI ranking making it the most highlydeveloped ICT network and it has the greatest potential to exploit networkrsquos capacityIceland Finland Sweden Norway and Netherlands follow USA Another NorthernEuropean country Denmark ranks 7th followed by Singapore in 8th Austria in 9th
and the United Kingdom in the 10th place Among the countries in the region whichwere included are Korea rank number 20 followed by Japan in the 21st placeMalaysia in number 26 Thailand number 43 India number 54 Philippines number58 followed by Indonesia in number 59 Sri Lanka in number 62 China in 64Bangladesh in 73 and Viet Nam in 74
Two components were taken into consideration in the computation of the NRIThese are network use and enabling factors Network use is defined as the measureof the extent of increase in the use of ICT in a specific country This is still narroweddown to five more catagories Internet users per hundred inhabitants cellularsubscribers per hundred inhabitants internet users per host percentage ofcomputers connected to the internet and availability of public access to the internet
Enabling factors is made up of four sub-indices network access network policynetworked society and networked economy Network access includes variablesrelated to the information infrastructure hardware software and support Itmeasures the extent and quality of the network infrastructure and the existence ofequipment programmes and support services that enable ICT use Network policyrefers to the information and communications policy environment and the businessand economic climate It also deals with the levels of competition in thetelecommnications and ICT sectors Networked society measures the quality andextent of use of ICT facilities in the learning process and networked economyassesses the extent of public and private sectors participation and e-governmentare considered in this sub-index
Source httpwwwcidharvardeducrpdfgitrr2002-cho02pdf
This is a national population survey of public and private elementary and secondaryschools conducted by SEAMEO INNOTECH in the Philippines under Project TAOCARES last March 2001 Its main objective was to determine the ICT capabilitiesof schools A total of 45811 schools were given questionnaires with the schoolheads as respondent of which 7937 per cent responded The survey questionnaireconsisted of 42 items mostly focused on the readiness of schools in terms ofinfrastructure hardware software and manpower capabilities on ICT Outputs ofthe survey were sixteen regional profiles on the ICT-preparedness of schools whichincluded data on the availability of electricity access of schools to communicationfacilities presence of computers computer peripherals and other multi-mediaequipment in schools sources of funds to maintain ICT-related operations proficiencyof school staff in the use of computers training received on ICT computer coursesbeing offered in schools and other ICT-related information
Some of the major findings of the survey at the national level are the following
Only 6607 per cent of schools have electrical connections
Only 1330 per cent have landline telephones 290 per cent have fax machinesand 200 per cent have internet connections
5217 schools only or 1428 per cent have computers with the National CapitalRegion having the highest percentage at 8730 per cent
Only 1824 per cent of schools have staff proficient in the use of computers
C Profile on the capabilities of elementary and secondary schools in the Philippines 2000-2001
37 37Final Report
7862 per cent of schools get funding to maintain ICT related operations fromthe PTCA
Only very few schools (1313 per cent) have school heads who have receivedICT training in the past five years
6436 per cent of school heads need training on basic computer literacy
This study was conducted by the New Educational Technologies Foundation Inc anon-profit organisation composed of schools that believe in the capacity of IT toimprove the quality of student learning and efficiency of teaching A total of 794schools participated in the survey with school heads in the public and private schoolsas respondents The questionnaire was divided into two parts the first part askedabout perceptions level of awareness and attitudes regarding the value of computereducation and was answered by users and non-users of computers The secondpart which dealt with the actual use of computers was answered by users onlyAmong the findings are the following
The number of computers owned by a private schools is twice as much aswhat a public school can afford
Computers available in schools are mostly the models AT486
Most computer units in the public elementary schools were acquired throughdonations in the secondary and tertiary schools most computers were acquiredthrough purchase
Computers are mostly used to teach different application programmes
Source The 1996 National Survey on Computer Education New Educational TechnologiesFoundation Inc
D The 1996 national survey on computereducation in the Philippines
In a primary school in Sunnyside Elementary School Pullman Washington studentsare using e-mails web sites videos and video conferencing technology tools todevelop their learning skills Through these mediums the students alongside theirglobal peers identify and share their cultures with one another in new waysTraditionally students learn about the world through books but new technologyallows the students to get in depth information about different cultures throughwriting reading and communicating with their global peers The following are theassessment tools used Assessment rublics designed for specific projects lessonandor classroom experiences standard assessment tools (ie DRA and WrightGroup Reading Assessments) teacher anecdotal notes childrenrsquos ownmetacognitive voices in the process of learning in conference with the teacherand in self-reflection of work and presentations parentsrsquo reports of student learningprogress
Teaching in non-traditional ways can sometimes be a risky business - with all eyesupon the class to see if learning is taking place It has been shown that studentsform teams to read write and communicate using technology at rates that meetand exceed standards for primary classes But along the way the added value oftechnology contributes in areas such as thinking skills social skills engagement inlearning motivation teaching and collaborating as the class sees what is essentialto learn in the context of the real world
Source httpwwwncrelorgengaugeframeworkefpalignefpalisuhtm
E Use of multiple assessment tools
38 Developing and Using Indicators of ICT Use in Education
F Technology A major catalyst for increasing learning by Jody C Isernhagen University of Nebraska-Lincoinby Jody C Isernhagen University of Nebraska-Lincoinby Jody C Isernhagen University of Nebraska-Lincoinby Jody C Isernhagen University of Nebraska-Lincoinby Jody C Isernhagen University of Nebraska-Lincoin TTTTTechnologechnologechnologechnologechnology Horizons in Educay Horizons in Educay Horizons in Educay Horizons in Educay Horizons in Educationtiontiontiontion Journal Online Journal Online Journal Online Journal Online Journal Online August 1999 - FeaAugust 1999 - FeaAugust 1999 - FeaAugust 1999 - FeaAugust 1999 - Featuretureturetureture
A rural public school in Nebraska composed of 1400 students applied for a three-year competitive Excellence in Education Grant in late 1995 Six schooladministrators and 18 staff members designed a plan to restructure their schooland classrooms The staff members defined that the major skills needed by studentsare comprehension reasoning composition and experimentation A computerwas placed in each classroom (80 classrooms) and 27 computers were located inthe elementary Integrated Learning Lab with Computer Curriculum CorporationSuccess Maker Software This software automatically diagnoses and placesstudents on the appropriate skill level while using the computer The computer labwas used by 314 students and 13 teachers in grades 1-3 from January 1996through May 1998 Teachers were trained on the use of ClarisWorks MicrosoftWord E-mail Internet Presentation Stations and the integration technology as atook in teaching and learning Activities of the students involved computer buildingdesigning of web pages to help maintain the schoolrsquos web pages digitizing video topresent to the community creating panoramic views and interactive virtual realityscenes preparing letters of application resumes and cover letters and to searchthe web for jobs With all the activities the teacher served as guides figuring outwith the students how to arrive at a productive presentation
The CAT scores in reading and math for students using an Integrated Learning Labfor 25 years showed a significant difference between the means The scores ofstudents testing below the 50th percentile at grades 1-3 in reading and math increasedsignificantly over time These findings suggest that using an Integrated LearningLab with rural primary age children daily over an extended period of time maypositively impact achievement for students particularly those students functioningbelow the 50th percentile
Source httpwwwthejournalcommagazinevaultarticleprintversioncfmaid=2126
G The impact of ICT on literacy learning in English
This report is the result of a literature review conducted first to identify a number ofstudies that might shed light on the major impact of ICT on literacy learning inEnglish for 5 to 16 year olds and the second to undertake an in-depth review ofthe papers that were identified as being on the impact of networked ICT on literacylearning in English for ages 5 to 16 There were 1871 studies screened following acriteria to identify relevant reports 188 studies were found that met the criteria inthe protocol These studies were then keyworded or indexed and the results filedon an electronic database
Of the 188 studies relevant to the mapping study 16 pertained to the topic of theimpact of networked ICT on literacy learning Data were extracted from these 16studies and were used as basis for an in-depth review Of these half were outcomeevaluations (evaluations of the results of an experiment or innovation) seven wereprocess evaluations (evaluations on how an intervention was delivered rather thanwhether it worked or not) and one was a needs assessment
Results show that as far as the in-depth study on networked ICT goes results areinconclusive Concerning policy and practice the recommendations of this revieware highly tentative and take the form of implications or pointers With regard topolicy they are to focus research funding for large-scale studies to give considerationto the balance of study type expertise in research teams and to give consideration
39 39Final Report
to the fact that the provision of computer hardware and software to schools andthe application of ICT in teaching and learning need to be informed by researchand evaluation
Source httpeppiioeacukEPPEWebhomeaspxpage=reelreview_groupreview_ one_abstractht
H Education Research Fund Effective Integrationof IT in Singapore Schools Pedagogical
and Policy ImplicationsThis is a report on the key findings of a questionnaire survey aimed at identifying thedegree of information technology (IT) integration among Singapore schools Thesurvey is the first part (Phase One) of a larger study funded by the Ministry ofEducation of Singapore aimed to examine and analyze where and how IT is integratedin Singapore schools to develop pupilsrsquo higher order thinking skills A total of 328schools responded to the survey of which 168 are primary schools 144 secondaryschools and 16 junior collegescentralized institutes (JCCs)
Major findings of the questionnaire survey include
Phase I schools in the IT Masterplan have significantly higher pupil and teacheruse of IT greater opportunities for staff development of teachers and moreconducive IT culture than Phase III schools
Independent-autonomous schools have significantly better management of ITresources higher teacher and pupils use of IT greater opportunities for staffdevelopment for teachers and more conducive IT culture than governmentschools
There are no significant differences among the primary schools secondaryschools and JCCs in terms of the management of IT resources pupil andteacher use of IT staff development and school IT culture
The correlations among management of IT resources pupil use of IT teacheruse of IT staff development and IT culture are significant and highly positive
- Contents
-

1
1IIAttachment
Comparison ofICT Indicator Themesin Selected Countries
29
29
Final Rep
ort
Basis for ICTindicatorsagency
who formulatedICT indicators
Presence ofstandards for
technology use
Educationallevel covered
Respondents of studies
Technologiescovered
in studiesType of indicators
Presence ofindicators
addressing equityethics and
investment issues
Presence ofindicators on ICT
integration incurriculumimpact etc
Goals and objectivesof the governmentAll students will leaveschool as confidentcreative andproductive users ofnew technologiesparticularlyinformation andcommunicationstechnologies andunderstand theimpact of thosetechnologies insociety
Yes Curriculumand StandardsFramework (CSF)
Primary secondarynon-formal
Teachers students Computers internetuse of satellite TV
Quantitative andqualitative
Not specified Yes specificallythe studyconducted by theUniversity ofSydney Includestudies on studentengagemententhusiasm andmovitationimprovement ofhigher-orderthinking skills etc
Based on a meetingconvened in IITEMoscow in 2000 todevelop a set of ICTindicators
None Primarysecondary andtertiary levels
Heads ofdepartmentssenior specialistsstaff of nationalCentres ofInformationalTechnologies andEducation orCentres of TeacherTraining Retrainingand EducationalSupport
Computers andinternet
Quantitative -policy documentsICTs in curriculumhardware andequipmentsoftware Globalcommunicationmeans andpersonneldevelopment
None Partly
Australia
Baltic andCIScountries
30
Develop
ing and U
sing Indicators of IC
T Use in E
ducation
Basis for ICTindicatorsagency
who formulatedICT indicators
Presence ofstandards for
technology use
Educationallevel covered
Respondents of studies
Technologiescovered
in studiesType of indicators
Presence ofindicators
addressing equityethics and
investment issues
Presence ofindicators on ICT
integration incurriculum impact
etc
Canada Two criteria fordevelopment ofindicator set
Type of educationinformation neededfor policydevelopment
Practical availabilityof dataindicatorsdeveloped by Pan-CanadianEducationIndicatorsProgramme (PCEIP)
None Elementary andsecondary level
Not specified Computers andinternet
Quantitative andqualitative
Pupil-computerratio
Internetconnectivity
Internet activitiesof students
Obstacles to fulleruse of informationandcommunicationstechnologies
None Yes specificallyon whatencouragesteachers andstudents to usecomputers
Europe 1 Indicators based onthe eEurope initiativeof the EuropeanUnion Action lineldquoEuropean youth intothe digital agerdquo Thegoal for the saidobjective is to turndigital literacy to abasic competence forall young EuropeansSIBIS Study
Yes ISTE (NETS)standards
Various researcherscovered differentlevel public primaryand lowersecondary primarysecondary andspecial schoolshead teachers andteachers
School headsteachers
ICT in generalcomputers andinternet access
Quantitative andqualitative
Policy andstrategy
Economy andinfrastructure
Use and access
Competencies
Yes specifically onnational policiesand expenditure
Yes oncompetency ofICT instructors
Europe 2 Eurydice Yes ISTE(NETS)standards
Primary andsecondary level
Not specified Computers andinternet
Mostly quantitativevery little on qualita-tive indicatorsExamples
Number of pupilsper computer
Desirable ICTskills according toofficial recom-mendations forthe initial trainingof all teachers(except specialistICT teachers)
Mainly onexpendituredistribution ofbudget
Yes on integrationof ICT in subjects
31
31
Final Rep
ort
Basis for ICTindicatorsagency
who formulatedICT indicators
Presence ofstandards for
technology use
Educationallevel covered
Respondents of studies
Technologiescovered
in studiesType of indicators
Presence ofindicators
addressing equityethics and
investment issues
Presence ofindicators on ICT
integration incurriculumimpact etc
India Government None Elementary andsecondary schools
Not specified Computersinternet software
Quantitative None None
Indonesia Curriculum Centre
Governmentrsquos goalsand objectives
None Elementary andsecondary schools
Not specified Computers andthe internet
Quantitative Moreof internet andcomputer use andaccess
None None
Japan eJapan priority policyprogrammevarioussurveys conducted bygovernment agencieson ICT in general Likethose conducted bythe Ministry of PostsandTelecommunicationsSurvey on SocialEducation
None Elementary andsecondary in someindicators notspecified in otherindicators
Not specified Computers andinternet
Quantitative Moreof internet andcomputer use andaccess
Yes Governmentgeneral IT policy onelementary andsecondary schoolsthe same forschools for theblind and disabled
None
Republic ofKorea
Cyber Korea 21Vision To preparestudents forknowledge basedsociety by realizinglife-long learning viacyber-educationsystemrdquoKoreaNational StatisticsOffice
Yes - based onthe documententitled Adaptingeducation to theinformation ageA white paper
Elementarysecondary
Teachers andstudents andschoolheadmasters
Computersinternet andmultimedia
Quantitative Moreof internet andcomputer use andaccess throughinput utilizationand outputindicators
None None
Malaysia Government None Elementary andsecondary schools
Not specified Computers andthe internet
Quantitative None None
Quantitative andqualitative
Telecommunica-tions equipment
How schoolsteachers andstudents usetelecommuni-cationstechnologies
New Zealand Research conductedby the TelecomEducation Foundation
None Not specified Teachers andprincipals
Telephone linesfax machinescomputers andinternet
None Yes specificallyon whatencouragesteachers andstudents to usecomputers
32
Develop
ing and U
sing Indicators of IC
T Use in E
ducation
Philippines
Basis for ICTindicatorsagency
who formulatedICT indicators
Presence ofstandards for
technology use
Educationallevel covered
Respondents of studies
Technologiescovered
in studiesType of indicators
Presence ofindicators
addressing equityethics and
investment issues
Presence ofindicators on ICT
integration incurriculumimpact etc
Senate Committee onEducation Arts andCulture with SEAMEO-INNOTECH
Department ofEducation
None Public and privateelementary andsecondary schools
School heads All ICT relatedtechnologies suchas televisionprojectors radiocassette playerscomputersperipherals andinternet access
Quantitative Availability of
publiccommercialutilities andservices
Computer skillsof schoolpersonnel
Presence ofcomputers inschools
Instructionalacademic useof computers
Yes specificallythose pertaining touse of computers bynon-formaleducation students
None
Research on internetin Slovenia
None Primary secondaryyouth hostels andkindergartens
Not specified Computers andinternet access
Quantitative
Internet access
Computersnetworks
None None
School net None Not specified Students andteachers
Computers andinternet access
QualitativeexamplesIntegration of ICTwith curriculuminstructionalpractices barriersto computer use
None Yes oncompetency ofICT instructors
Government NationalEducation Act of1999
None Primary andsecondary schools
Not specified Computersinternettelephonescomputerperipherals ratio
Quantitative None None
Philippines
Slovenia
South Africa
Thailand
33
33
Final Rep
ort
Basis for ICTindicatorsagency
who formulatedICT indicators
Presence ofstandards for
technology use
Educationallevel covered
Respondents of studies
Technologiescovered
in studiesType of indicators
Presence ofindicators
addressing equityethics and
investment issues
Presence ofindicators on ICT
integrationin curriculumimpact etc
UK National grid forlearning
ISTE (NETS)standards
Primary andsecondary schools
Students andteachers
Computers and theinternet
Quantitative andqualitative
Computers inschools
Internet andelectroniccommunication
Teachercondidence anduse of ICT inteaching
Expenditure onICT
Yes mainly onexpenditure andbudget allocation
Yes includesteacherconfidence in theuse of ICT andbenefit of ICT
US Teaching learningand computing - astudy of teacherrsquosuse of computertechnology theirpedagogies andtheir school context
ISTE (NETS)standards
Public and privateschoolselementary middleschool and highschool all subjectsexcept physicaleducation andspecial education
Teachers Computers internetuse (includes use ofvarious softwareCDRom etc
Quantitative andqualitative School
technologyleadership andtechnologyoutcomes
Pedagogicalmotivations forstudent computeruse
Internet use byteachers
Presence ofcomputers inAmerican schools
Teacher andteacher directedstudent use ofcomputers andsoftware
Technologysupport
Schoolinvestments ininstructionaltechnology
Yes includesindicators thatdeterminestechnology intensiveareas softwaresaturation etc
Yes specificallypedagogicalmotivations forstudent computeruse
UK
US
34
Develop
ing and U
sing Indicators of IC
T Use in E
ducation
Basis for ICTindicatorsagency
who formulatedICT indicators
Presence ofstandards for
technology use
Educationallevel covered
Respondents of studies
Technologiescovered
in studiesType of indicators
Presence ofindicators
addressing equityethics and
investment issues
Presence ofindicators on ICT
integration incurriculumimpact etc
NoneUzbekistan Government Lawon Education
None Primary andsecondaryeducation
Not specified Computer andinternet
Quantitative None
Viet Nam Government
Governmentrsquos goalto ldquouniversalizerdquoeducation
None Primary andsecondary
Not specified Computer andinternet
Quantitative None None
1
1IIIAttachment
Studies on the Use andImpact of ICTin Education
35 35Final Report
Several studies have been conducted on ICT and its use and impact on educationsome of which are included below
This survey on the information and communications technology (ICT) provisions inschools in England was carried out in April 2001 the findings of which were comparedto similar surveys conducted in 1998 1999 and 2000 The surveys collectedinformation on the number and type of computers available in schools expenditurein schools the extent and benefit of the use of ICT across curriculum subjects theuse of internet and other electronic network communication links and teacherusage of computers and their confidence in the use of ICT in the curriculum It is asample survey and the sample is chosen to be representative of different types ofschools throughout the country Some of the findings as categorised are thefollowing
a Computers in schools
average number of computers per school increased steadily in all types ofschools between 1998 and 2001 the increase was noted to be greatbetween 2000 and 2001
b Internet usage and other external electronic communication services
between 1998 and 2001 there was a considerable increase in thepercentage of schools connected to the internet
c Use of ICT in teaching and teacher confidence
in each type of school there was an increase in the percentage of teachersreported to feel confident in the use of ICT in 2001
d Expenditure on ICT
the average expenditure on computers per school increased steadily in allschool types between 1998 and 2001
Source Statistics of EducationSurvey of Information and Communications Technology in Schools 2001National Statistics BulletinDepartment for Education and SkillsIssue No 0901October 2001
The Center for International Development (CID) at Harvard University conducted aresearch which came up with the Network Readiness Index (NRI) a majorinternational assessment of countriesrsquo capacity to exploit the opportunities offeredby ICTs In the development of the NRI data sources fall under two generalcategories First a variety of measures mainly ldquohardrdquo variables and also ldquosoftrdquoones from sources such as the World Bank the International TelecommunicationsUnion Freedom House and the Business Software Alliance were used Seconddata collected from the questionnaire responses of more than 4500 business andgovernment leaders surveyed in 75 countries by the Global Competitiveness Reportrsquos2001 Global Executive Opinion Survey conducted by Harvard University and theWorld Economic Forum were heavily relied upon
The Network Readiness Index is an assessment of a countryrsquos capacity to makeuse of ICT resources It shows how nations are performing with regards to theirparticipation in the Networked World Seventy-five countries were computed NRIs
B The Network Readiness Index Measuring thepreparedness of nations for the networked world
A Survey of information and communicationstechnology in schools 2001 in England
36 Developing and Using Indicators of ICT Use in Education
and the United States of America tops the NRI ranking making it the most highlydeveloped ICT network and it has the greatest potential to exploit networkrsquos capacityIceland Finland Sweden Norway and Netherlands follow USA Another NorthernEuropean country Denmark ranks 7th followed by Singapore in 8th Austria in 9th
and the United Kingdom in the 10th place Among the countries in the region whichwere included are Korea rank number 20 followed by Japan in the 21st placeMalaysia in number 26 Thailand number 43 India number 54 Philippines number58 followed by Indonesia in number 59 Sri Lanka in number 62 China in 64Bangladesh in 73 and Viet Nam in 74
Two components were taken into consideration in the computation of the NRIThese are network use and enabling factors Network use is defined as the measureof the extent of increase in the use of ICT in a specific country This is still narroweddown to five more catagories Internet users per hundred inhabitants cellularsubscribers per hundred inhabitants internet users per host percentage ofcomputers connected to the internet and availability of public access to the internet
Enabling factors is made up of four sub-indices network access network policynetworked society and networked economy Network access includes variablesrelated to the information infrastructure hardware software and support Itmeasures the extent and quality of the network infrastructure and the existence ofequipment programmes and support services that enable ICT use Network policyrefers to the information and communications policy environment and the businessand economic climate It also deals with the levels of competition in thetelecommnications and ICT sectors Networked society measures the quality andextent of use of ICT facilities in the learning process and networked economyassesses the extent of public and private sectors participation and e-governmentare considered in this sub-index
Source httpwwwcidharvardeducrpdfgitrr2002-cho02pdf
This is a national population survey of public and private elementary and secondaryschools conducted by SEAMEO INNOTECH in the Philippines under Project TAOCARES last March 2001 Its main objective was to determine the ICT capabilitiesof schools A total of 45811 schools were given questionnaires with the schoolheads as respondent of which 7937 per cent responded The survey questionnaireconsisted of 42 items mostly focused on the readiness of schools in terms ofinfrastructure hardware software and manpower capabilities on ICT Outputs ofthe survey were sixteen regional profiles on the ICT-preparedness of schools whichincluded data on the availability of electricity access of schools to communicationfacilities presence of computers computer peripherals and other multi-mediaequipment in schools sources of funds to maintain ICT-related operations proficiencyof school staff in the use of computers training received on ICT computer coursesbeing offered in schools and other ICT-related information
Some of the major findings of the survey at the national level are the following
Only 6607 per cent of schools have electrical connections
Only 1330 per cent have landline telephones 290 per cent have fax machinesand 200 per cent have internet connections
5217 schools only or 1428 per cent have computers with the National CapitalRegion having the highest percentage at 8730 per cent
Only 1824 per cent of schools have staff proficient in the use of computers
C Profile on the capabilities of elementary and secondary schools in the Philippines 2000-2001
37 37Final Report
7862 per cent of schools get funding to maintain ICT related operations fromthe PTCA
Only very few schools (1313 per cent) have school heads who have receivedICT training in the past five years
6436 per cent of school heads need training on basic computer literacy
This study was conducted by the New Educational Technologies Foundation Inc anon-profit organisation composed of schools that believe in the capacity of IT toimprove the quality of student learning and efficiency of teaching A total of 794schools participated in the survey with school heads in the public and private schoolsas respondents The questionnaire was divided into two parts the first part askedabout perceptions level of awareness and attitudes regarding the value of computereducation and was answered by users and non-users of computers The secondpart which dealt with the actual use of computers was answered by users onlyAmong the findings are the following
The number of computers owned by a private schools is twice as much aswhat a public school can afford
Computers available in schools are mostly the models AT486
Most computer units in the public elementary schools were acquired throughdonations in the secondary and tertiary schools most computers were acquiredthrough purchase
Computers are mostly used to teach different application programmes
Source The 1996 National Survey on Computer Education New Educational TechnologiesFoundation Inc
D The 1996 national survey on computereducation in the Philippines
In a primary school in Sunnyside Elementary School Pullman Washington studentsare using e-mails web sites videos and video conferencing technology tools todevelop their learning skills Through these mediums the students alongside theirglobal peers identify and share their cultures with one another in new waysTraditionally students learn about the world through books but new technologyallows the students to get in depth information about different cultures throughwriting reading and communicating with their global peers The following are theassessment tools used Assessment rublics designed for specific projects lessonandor classroom experiences standard assessment tools (ie DRA and WrightGroup Reading Assessments) teacher anecdotal notes childrenrsquos ownmetacognitive voices in the process of learning in conference with the teacherand in self-reflection of work and presentations parentsrsquo reports of student learningprogress
Teaching in non-traditional ways can sometimes be a risky business - with all eyesupon the class to see if learning is taking place It has been shown that studentsform teams to read write and communicate using technology at rates that meetand exceed standards for primary classes But along the way the added value oftechnology contributes in areas such as thinking skills social skills engagement inlearning motivation teaching and collaborating as the class sees what is essentialto learn in the context of the real world
Source httpwwwncrelorgengaugeframeworkefpalignefpalisuhtm
E Use of multiple assessment tools
38 Developing and Using Indicators of ICT Use in Education
F Technology A major catalyst for increasing learning by Jody C Isernhagen University of Nebraska-Lincoinby Jody C Isernhagen University of Nebraska-Lincoinby Jody C Isernhagen University of Nebraska-Lincoinby Jody C Isernhagen University of Nebraska-Lincoinby Jody C Isernhagen University of Nebraska-Lincoin TTTTTechnologechnologechnologechnologechnology Horizons in Educay Horizons in Educay Horizons in Educay Horizons in Educay Horizons in Educationtiontiontiontion Journal Online Journal Online Journal Online Journal Online Journal Online August 1999 - FeaAugust 1999 - FeaAugust 1999 - FeaAugust 1999 - FeaAugust 1999 - Featuretureturetureture
A rural public school in Nebraska composed of 1400 students applied for a three-year competitive Excellence in Education Grant in late 1995 Six schooladministrators and 18 staff members designed a plan to restructure their schooland classrooms The staff members defined that the major skills needed by studentsare comprehension reasoning composition and experimentation A computerwas placed in each classroom (80 classrooms) and 27 computers were located inthe elementary Integrated Learning Lab with Computer Curriculum CorporationSuccess Maker Software This software automatically diagnoses and placesstudents on the appropriate skill level while using the computer The computer labwas used by 314 students and 13 teachers in grades 1-3 from January 1996through May 1998 Teachers were trained on the use of ClarisWorks MicrosoftWord E-mail Internet Presentation Stations and the integration technology as atook in teaching and learning Activities of the students involved computer buildingdesigning of web pages to help maintain the schoolrsquos web pages digitizing video topresent to the community creating panoramic views and interactive virtual realityscenes preparing letters of application resumes and cover letters and to searchthe web for jobs With all the activities the teacher served as guides figuring outwith the students how to arrive at a productive presentation
The CAT scores in reading and math for students using an Integrated Learning Labfor 25 years showed a significant difference between the means The scores ofstudents testing below the 50th percentile at grades 1-3 in reading and math increasedsignificantly over time These findings suggest that using an Integrated LearningLab with rural primary age children daily over an extended period of time maypositively impact achievement for students particularly those students functioningbelow the 50th percentile
Source httpwwwthejournalcommagazinevaultarticleprintversioncfmaid=2126
G The impact of ICT on literacy learning in English
This report is the result of a literature review conducted first to identify a number ofstudies that might shed light on the major impact of ICT on literacy learning inEnglish for 5 to 16 year olds and the second to undertake an in-depth review ofthe papers that were identified as being on the impact of networked ICT on literacylearning in English for ages 5 to 16 There were 1871 studies screened following acriteria to identify relevant reports 188 studies were found that met the criteria inthe protocol These studies were then keyworded or indexed and the results filedon an electronic database
Of the 188 studies relevant to the mapping study 16 pertained to the topic of theimpact of networked ICT on literacy learning Data were extracted from these 16studies and were used as basis for an in-depth review Of these half were outcomeevaluations (evaluations of the results of an experiment or innovation) seven wereprocess evaluations (evaluations on how an intervention was delivered rather thanwhether it worked or not) and one was a needs assessment
Results show that as far as the in-depth study on networked ICT goes results areinconclusive Concerning policy and practice the recommendations of this revieware highly tentative and take the form of implications or pointers With regard topolicy they are to focus research funding for large-scale studies to give considerationto the balance of study type expertise in research teams and to give consideration
39 39Final Report
to the fact that the provision of computer hardware and software to schools andthe application of ICT in teaching and learning need to be informed by researchand evaluation
Source httpeppiioeacukEPPEWebhomeaspxpage=reelreview_groupreview_ one_abstractht
H Education Research Fund Effective Integrationof IT in Singapore Schools Pedagogical
and Policy ImplicationsThis is a report on the key findings of a questionnaire survey aimed at identifying thedegree of information technology (IT) integration among Singapore schools Thesurvey is the first part (Phase One) of a larger study funded by the Ministry ofEducation of Singapore aimed to examine and analyze where and how IT is integratedin Singapore schools to develop pupilsrsquo higher order thinking skills A total of 328schools responded to the survey of which 168 are primary schools 144 secondaryschools and 16 junior collegescentralized institutes (JCCs)
Major findings of the questionnaire survey include
Phase I schools in the IT Masterplan have significantly higher pupil and teacheruse of IT greater opportunities for staff development of teachers and moreconducive IT culture than Phase III schools
Independent-autonomous schools have significantly better management of ITresources higher teacher and pupils use of IT greater opportunities for staffdevelopment for teachers and more conducive IT culture than governmentschools
There are no significant differences among the primary schools secondaryschools and JCCs in terms of the management of IT resources pupil andteacher use of IT staff development and school IT culture
The correlations among management of IT resources pupil use of IT teacheruse of IT staff development and IT culture are significant and highly positive
- Contents
-

29
29
Final Rep
ort
Basis for ICTindicatorsagency
who formulatedICT indicators
Presence ofstandards for
technology use
Educationallevel covered
Respondents of studies
Technologiescovered
in studiesType of indicators
Presence ofindicators
addressing equityethics and
investment issues
Presence ofindicators on ICT
integration incurriculumimpact etc
Goals and objectivesof the governmentAll students will leaveschool as confidentcreative andproductive users ofnew technologiesparticularlyinformation andcommunicationstechnologies andunderstand theimpact of thosetechnologies insociety
Yes Curriculumand StandardsFramework (CSF)
Primary secondarynon-formal
Teachers students Computers internetuse of satellite TV
Quantitative andqualitative
Not specified Yes specificallythe studyconducted by theUniversity ofSydney Includestudies on studentengagemententhusiasm andmovitationimprovement ofhigher-orderthinking skills etc
Based on a meetingconvened in IITEMoscow in 2000 todevelop a set of ICTindicators
None Primarysecondary andtertiary levels
Heads ofdepartmentssenior specialistsstaff of nationalCentres ofInformationalTechnologies andEducation orCentres of TeacherTraining Retrainingand EducationalSupport
Computers andinternet
Quantitative -policy documentsICTs in curriculumhardware andequipmentsoftware Globalcommunicationmeans andpersonneldevelopment
None Partly
Australia
Baltic andCIScountries
30
Develop
ing and U
sing Indicators of IC
T Use in E
ducation
Basis for ICTindicatorsagency
who formulatedICT indicators
Presence ofstandards for
technology use
Educationallevel covered
Respondents of studies
Technologiescovered
in studiesType of indicators
Presence ofindicators
addressing equityethics and
investment issues
Presence ofindicators on ICT
integration incurriculum impact
etc
Canada Two criteria fordevelopment ofindicator set
Type of educationinformation neededfor policydevelopment
Practical availabilityof dataindicatorsdeveloped by Pan-CanadianEducationIndicatorsProgramme (PCEIP)
None Elementary andsecondary level
Not specified Computers andinternet
Quantitative andqualitative
Pupil-computerratio
Internetconnectivity
Internet activitiesof students
Obstacles to fulleruse of informationandcommunicationstechnologies
None Yes specificallyon whatencouragesteachers andstudents to usecomputers
Europe 1 Indicators based onthe eEurope initiativeof the EuropeanUnion Action lineldquoEuropean youth intothe digital agerdquo Thegoal for the saidobjective is to turndigital literacy to abasic competence forall young EuropeansSIBIS Study
Yes ISTE (NETS)standards
Various researcherscovered differentlevel public primaryand lowersecondary primarysecondary andspecial schoolshead teachers andteachers
School headsteachers
ICT in generalcomputers andinternet access
Quantitative andqualitative
Policy andstrategy
Economy andinfrastructure
Use and access
Competencies
Yes specifically onnational policiesand expenditure
Yes oncompetency ofICT instructors
Europe 2 Eurydice Yes ISTE(NETS)standards
Primary andsecondary level
Not specified Computers andinternet
Mostly quantitativevery little on qualita-tive indicatorsExamples
Number of pupilsper computer
Desirable ICTskills according toofficial recom-mendations forthe initial trainingof all teachers(except specialistICT teachers)
Mainly onexpendituredistribution ofbudget
Yes on integrationof ICT in subjects
31
31
Final Rep
ort
Basis for ICTindicatorsagency
who formulatedICT indicators
Presence ofstandards for
technology use
Educationallevel covered
Respondents of studies
Technologiescovered
in studiesType of indicators
Presence ofindicators
addressing equityethics and
investment issues
Presence ofindicators on ICT
integration incurriculumimpact etc
India Government None Elementary andsecondary schools
Not specified Computersinternet software
Quantitative None None
Indonesia Curriculum Centre
Governmentrsquos goalsand objectives
None Elementary andsecondary schools
Not specified Computers andthe internet
Quantitative Moreof internet andcomputer use andaccess
None None
Japan eJapan priority policyprogrammevarioussurveys conducted bygovernment agencieson ICT in general Likethose conducted bythe Ministry of PostsandTelecommunicationsSurvey on SocialEducation
None Elementary andsecondary in someindicators notspecified in otherindicators
Not specified Computers andinternet
Quantitative Moreof internet andcomputer use andaccess
Yes Governmentgeneral IT policy onelementary andsecondary schoolsthe same forschools for theblind and disabled
None
Republic ofKorea
Cyber Korea 21Vision To preparestudents forknowledge basedsociety by realizinglife-long learning viacyber-educationsystemrdquoKoreaNational StatisticsOffice
Yes - based onthe documententitled Adaptingeducation to theinformation ageA white paper
Elementarysecondary
Teachers andstudents andschoolheadmasters
Computersinternet andmultimedia
Quantitative Moreof internet andcomputer use andaccess throughinput utilizationand outputindicators
None None
Malaysia Government None Elementary andsecondary schools
Not specified Computers andthe internet
Quantitative None None
Quantitative andqualitative
Telecommunica-tions equipment
How schoolsteachers andstudents usetelecommuni-cationstechnologies
New Zealand Research conductedby the TelecomEducation Foundation
None Not specified Teachers andprincipals
Telephone linesfax machinescomputers andinternet
None Yes specificallyon whatencouragesteachers andstudents to usecomputers
32
Develop
ing and U
sing Indicators of IC
T Use in E
ducation
Philippines
Basis for ICTindicatorsagency
who formulatedICT indicators
Presence ofstandards for
technology use
Educationallevel covered
Respondents of studies
Technologiescovered
in studiesType of indicators
Presence ofindicators
addressing equityethics and
investment issues
Presence ofindicators on ICT
integration incurriculumimpact etc
Senate Committee onEducation Arts andCulture with SEAMEO-INNOTECH
Department ofEducation
None Public and privateelementary andsecondary schools
School heads All ICT relatedtechnologies suchas televisionprojectors radiocassette playerscomputersperipherals andinternet access
Quantitative Availability of
publiccommercialutilities andservices
Computer skillsof schoolpersonnel
Presence ofcomputers inschools
Instructionalacademic useof computers
Yes specificallythose pertaining touse of computers bynon-formaleducation students
None
Research on internetin Slovenia
None Primary secondaryyouth hostels andkindergartens
Not specified Computers andinternet access
Quantitative
Internet access
Computersnetworks
None None
School net None Not specified Students andteachers
Computers andinternet access
QualitativeexamplesIntegration of ICTwith curriculuminstructionalpractices barriersto computer use
None Yes oncompetency ofICT instructors
Government NationalEducation Act of1999
None Primary andsecondary schools
Not specified Computersinternettelephonescomputerperipherals ratio
Quantitative None None
Philippines
Slovenia
South Africa
Thailand
33
33
Final Rep
ort
Basis for ICTindicatorsagency
who formulatedICT indicators
Presence ofstandards for
technology use
Educationallevel covered
Respondents of studies
Technologiescovered
in studiesType of indicators
Presence ofindicators
addressing equityethics and
investment issues
Presence ofindicators on ICT
integrationin curriculumimpact etc
UK National grid forlearning
ISTE (NETS)standards
Primary andsecondary schools
Students andteachers
Computers and theinternet
Quantitative andqualitative
Computers inschools
Internet andelectroniccommunication
Teachercondidence anduse of ICT inteaching
Expenditure onICT
Yes mainly onexpenditure andbudget allocation
Yes includesteacherconfidence in theuse of ICT andbenefit of ICT
US Teaching learningand computing - astudy of teacherrsquosuse of computertechnology theirpedagogies andtheir school context
ISTE (NETS)standards
Public and privateschoolselementary middleschool and highschool all subjectsexcept physicaleducation andspecial education
Teachers Computers internetuse (includes use ofvarious softwareCDRom etc
Quantitative andqualitative School
technologyleadership andtechnologyoutcomes
Pedagogicalmotivations forstudent computeruse
Internet use byteachers
Presence ofcomputers inAmerican schools
Teacher andteacher directedstudent use ofcomputers andsoftware
Technologysupport
Schoolinvestments ininstructionaltechnology
Yes includesindicators thatdeterminestechnology intensiveareas softwaresaturation etc
Yes specificallypedagogicalmotivations forstudent computeruse
UK
US
34
Develop
ing and U
sing Indicators of IC
T Use in E
ducation
Basis for ICTindicatorsagency
who formulatedICT indicators
Presence ofstandards for
technology use
Educationallevel covered
Respondents of studies
Technologiescovered
in studiesType of indicators
Presence ofindicators
addressing equityethics and
investment issues
Presence ofindicators on ICT
integration incurriculumimpact etc
NoneUzbekistan Government Lawon Education
None Primary andsecondaryeducation
Not specified Computer andinternet
Quantitative None
Viet Nam Government
Governmentrsquos goalto ldquouniversalizerdquoeducation
None Primary andsecondary
Not specified Computer andinternet
Quantitative None None
1
1IIIAttachment
Studies on the Use andImpact of ICTin Education
35 35Final Report
Several studies have been conducted on ICT and its use and impact on educationsome of which are included below
This survey on the information and communications technology (ICT) provisions inschools in England was carried out in April 2001 the findings of which were comparedto similar surveys conducted in 1998 1999 and 2000 The surveys collectedinformation on the number and type of computers available in schools expenditurein schools the extent and benefit of the use of ICT across curriculum subjects theuse of internet and other electronic network communication links and teacherusage of computers and their confidence in the use of ICT in the curriculum It is asample survey and the sample is chosen to be representative of different types ofschools throughout the country Some of the findings as categorised are thefollowing
a Computers in schools
average number of computers per school increased steadily in all types ofschools between 1998 and 2001 the increase was noted to be greatbetween 2000 and 2001
b Internet usage and other external electronic communication services
between 1998 and 2001 there was a considerable increase in thepercentage of schools connected to the internet
c Use of ICT in teaching and teacher confidence
in each type of school there was an increase in the percentage of teachersreported to feel confident in the use of ICT in 2001
d Expenditure on ICT
the average expenditure on computers per school increased steadily in allschool types between 1998 and 2001
Source Statistics of EducationSurvey of Information and Communications Technology in Schools 2001National Statistics BulletinDepartment for Education and SkillsIssue No 0901October 2001
The Center for International Development (CID) at Harvard University conducted aresearch which came up with the Network Readiness Index (NRI) a majorinternational assessment of countriesrsquo capacity to exploit the opportunities offeredby ICTs In the development of the NRI data sources fall under two generalcategories First a variety of measures mainly ldquohardrdquo variables and also ldquosoftrdquoones from sources such as the World Bank the International TelecommunicationsUnion Freedom House and the Business Software Alliance were used Seconddata collected from the questionnaire responses of more than 4500 business andgovernment leaders surveyed in 75 countries by the Global Competitiveness Reportrsquos2001 Global Executive Opinion Survey conducted by Harvard University and theWorld Economic Forum were heavily relied upon
The Network Readiness Index is an assessment of a countryrsquos capacity to makeuse of ICT resources It shows how nations are performing with regards to theirparticipation in the Networked World Seventy-five countries were computed NRIs
B The Network Readiness Index Measuring thepreparedness of nations for the networked world
A Survey of information and communicationstechnology in schools 2001 in England
36 Developing and Using Indicators of ICT Use in Education
and the United States of America tops the NRI ranking making it the most highlydeveloped ICT network and it has the greatest potential to exploit networkrsquos capacityIceland Finland Sweden Norway and Netherlands follow USA Another NorthernEuropean country Denmark ranks 7th followed by Singapore in 8th Austria in 9th
and the United Kingdom in the 10th place Among the countries in the region whichwere included are Korea rank number 20 followed by Japan in the 21st placeMalaysia in number 26 Thailand number 43 India number 54 Philippines number58 followed by Indonesia in number 59 Sri Lanka in number 62 China in 64Bangladesh in 73 and Viet Nam in 74
Two components were taken into consideration in the computation of the NRIThese are network use and enabling factors Network use is defined as the measureof the extent of increase in the use of ICT in a specific country This is still narroweddown to five more catagories Internet users per hundred inhabitants cellularsubscribers per hundred inhabitants internet users per host percentage ofcomputers connected to the internet and availability of public access to the internet
Enabling factors is made up of four sub-indices network access network policynetworked society and networked economy Network access includes variablesrelated to the information infrastructure hardware software and support Itmeasures the extent and quality of the network infrastructure and the existence ofequipment programmes and support services that enable ICT use Network policyrefers to the information and communications policy environment and the businessand economic climate It also deals with the levels of competition in thetelecommnications and ICT sectors Networked society measures the quality andextent of use of ICT facilities in the learning process and networked economyassesses the extent of public and private sectors participation and e-governmentare considered in this sub-index
Source httpwwwcidharvardeducrpdfgitrr2002-cho02pdf
This is a national population survey of public and private elementary and secondaryschools conducted by SEAMEO INNOTECH in the Philippines under Project TAOCARES last March 2001 Its main objective was to determine the ICT capabilitiesof schools A total of 45811 schools were given questionnaires with the schoolheads as respondent of which 7937 per cent responded The survey questionnaireconsisted of 42 items mostly focused on the readiness of schools in terms ofinfrastructure hardware software and manpower capabilities on ICT Outputs ofthe survey were sixteen regional profiles on the ICT-preparedness of schools whichincluded data on the availability of electricity access of schools to communicationfacilities presence of computers computer peripherals and other multi-mediaequipment in schools sources of funds to maintain ICT-related operations proficiencyof school staff in the use of computers training received on ICT computer coursesbeing offered in schools and other ICT-related information
Some of the major findings of the survey at the national level are the following
Only 6607 per cent of schools have electrical connections
Only 1330 per cent have landline telephones 290 per cent have fax machinesand 200 per cent have internet connections
5217 schools only or 1428 per cent have computers with the National CapitalRegion having the highest percentage at 8730 per cent
Only 1824 per cent of schools have staff proficient in the use of computers
C Profile on the capabilities of elementary and secondary schools in the Philippines 2000-2001
37 37Final Report
7862 per cent of schools get funding to maintain ICT related operations fromthe PTCA
Only very few schools (1313 per cent) have school heads who have receivedICT training in the past five years
6436 per cent of school heads need training on basic computer literacy
This study was conducted by the New Educational Technologies Foundation Inc anon-profit organisation composed of schools that believe in the capacity of IT toimprove the quality of student learning and efficiency of teaching A total of 794schools participated in the survey with school heads in the public and private schoolsas respondents The questionnaire was divided into two parts the first part askedabout perceptions level of awareness and attitudes regarding the value of computereducation and was answered by users and non-users of computers The secondpart which dealt with the actual use of computers was answered by users onlyAmong the findings are the following
The number of computers owned by a private schools is twice as much aswhat a public school can afford
Computers available in schools are mostly the models AT486
Most computer units in the public elementary schools were acquired throughdonations in the secondary and tertiary schools most computers were acquiredthrough purchase
Computers are mostly used to teach different application programmes
Source The 1996 National Survey on Computer Education New Educational TechnologiesFoundation Inc
D The 1996 national survey on computereducation in the Philippines
In a primary school in Sunnyside Elementary School Pullman Washington studentsare using e-mails web sites videos and video conferencing technology tools todevelop their learning skills Through these mediums the students alongside theirglobal peers identify and share their cultures with one another in new waysTraditionally students learn about the world through books but new technologyallows the students to get in depth information about different cultures throughwriting reading and communicating with their global peers The following are theassessment tools used Assessment rublics designed for specific projects lessonandor classroom experiences standard assessment tools (ie DRA and WrightGroup Reading Assessments) teacher anecdotal notes childrenrsquos ownmetacognitive voices in the process of learning in conference with the teacherand in self-reflection of work and presentations parentsrsquo reports of student learningprogress
Teaching in non-traditional ways can sometimes be a risky business - with all eyesupon the class to see if learning is taking place It has been shown that studentsform teams to read write and communicate using technology at rates that meetand exceed standards for primary classes But along the way the added value oftechnology contributes in areas such as thinking skills social skills engagement inlearning motivation teaching and collaborating as the class sees what is essentialto learn in the context of the real world
Source httpwwwncrelorgengaugeframeworkefpalignefpalisuhtm
E Use of multiple assessment tools
38 Developing and Using Indicators of ICT Use in Education
F Technology A major catalyst for increasing learning by Jody C Isernhagen University of Nebraska-Lincoinby Jody C Isernhagen University of Nebraska-Lincoinby Jody C Isernhagen University of Nebraska-Lincoinby Jody C Isernhagen University of Nebraska-Lincoinby Jody C Isernhagen University of Nebraska-Lincoin TTTTTechnologechnologechnologechnologechnology Horizons in Educay Horizons in Educay Horizons in Educay Horizons in Educay Horizons in Educationtiontiontiontion Journal Online Journal Online Journal Online Journal Online Journal Online August 1999 - FeaAugust 1999 - FeaAugust 1999 - FeaAugust 1999 - FeaAugust 1999 - Featuretureturetureture
A rural public school in Nebraska composed of 1400 students applied for a three-year competitive Excellence in Education Grant in late 1995 Six schooladministrators and 18 staff members designed a plan to restructure their schooland classrooms The staff members defined that the major skills needed by studentsare comprehension reasoning composition and experimentation A computerwas placed in each classroom (80 classrooms) and 27 computers were located inthe elementary Integrated Learning Lab with Computer Curriculum CorporationSuccess Maker Software This software automatically diagnoses and placesstudents on the appropriate skill level while using the computer The computer labwas used by 314 students and 13 teachers in grades 1-3 from January 1996through May 1998 Teachers were trained on the use of ClarisWorks MicrosoftWord E-mail Internet Presentation Stations and the integration technology as atook in teaching and learning Activities of the students involved computer buildingdesigning of web pages to help maintain the schoolrsquos web pages digitizing video topresent to the community creating panoramic views and interactive virtual realityscenes preparing letters of application resumes and cover letters and to searchthe web for jobs With all the activities the teacher served as guides figuring outwith the students how to arrive at a productive presentation
The CAT scores in reading and math for students using an Integrated Learning Labfor 25 years showed a significant difference between the means The scores ofstudents testing below the 50th percentile at grades 1-3 in reading and math increasedsignificantly over time These findings suggest that using an Integrated LearningLab with rural primary age children daily over an extended period of time maypositively impact achievement for students particularly those students functioningbelow the 50th percentile
Source httpwwwthejournalcommagazinevaultarticleprintversioncfmaid=2126
G The impact of ICT on literacy learning in English
This report is the result of a literature review conducted first to identify a number ofstudies that might shed light on the major impact of ICT on literacy learning inEnglish for 5 to 16 year olds and the second to undertake an in-depth review ofthe papers that were identified as being on the impact of networked ICT on literacylearning in English for ages 5 to 16 There were 1871 studies screened following acriteria to identify relevant reports 188 studies were found that met the criteria inthe protocol These studies were then keyworded or indexed and the results filedon an electronic database
Of the 188 studies relevant to the mapping study 16 pertained to the topic of theimpact of networked ICT on literacy learning Data were extracted from these 16studies and were used as basis for an in-depth review Of these half were outcomeevaluations (evaluations of the results of an experiment or innovation) seven wereprocess evaluations (evaluations on how an intervention was delivered rather thanwhether it worked or not) and one was a needs assessment
Results show that as far as the in-depth study on networked ICT goes results areinconclusive Concerning policy and practice the recommendations of this revieware highly tentative and take the form of implications or pointers With regard topolicy they are to focus research funding for large-scale studies to give considerationto the balance of study type expertise in research teams and to give consideration
39 39Final Report
to the fact that the provision of computer hardware and software to schools andthe application of ICT in teaching and learning need to be informed by researchand evaluation
Source httpeppiioeacukEPPEWebhomeaspxpage=reelreview_groupreview_ one_abstractht
H Education Research Fund Effective Integrationof IT in Singapore Schools Pedagogical
and Policy ImplicationsThis is a report on the key findings of a questionnaire survey aimed at identifying thedegree of information technology (IT) integration among Singapore schools Thesurvey is the first part (Phase One) of a larger study funded by the Ministry ofEducation of Singapore aimed to examine and analyze where and how IT is integratedin Singapore schools to develop pupilsrsquo higher order thinking skills A total of 328schools responded to the survey of which 168 are primary schools 144 secondaryschools and 16 junior collegescentralized institutes (JCCs)
Major findings of the questionnaire survey include
Phase I schools in the IT Masterplan have significantly higher pupil and teacheruse of IT greater opportunities for staff development of teachers and moreconducive IT culture than Phase III schools
Independent-autonomous schools have significantly better management of ITresources higher teacher and pupils use of IT greater opportunities for staffdevelopment for teachers and more conducive IT culture than governmentschools
There are no significant differences among the primary schools secondaryschools and JCCs in terms of the management of IT resources pupil andteacher use of IT staff development and school IT culture
The correlations among management of IT resources pupil use of IT teacheruse of IT staff development and IT culture are significant and highly positive
- Contents
-
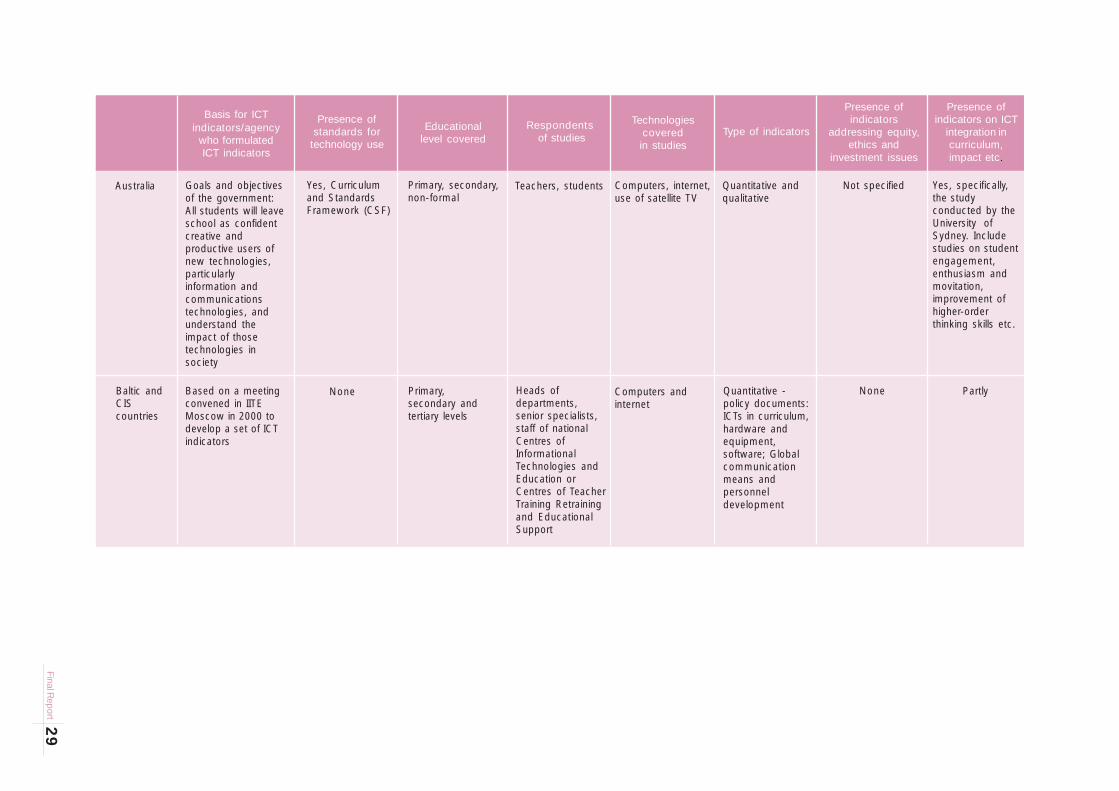

31
31
Final Rep
ort
Basis for ICTindicatorsagency
who formulatedICT indicators
Presence ofstandards for
technology use
Educationallevel covered
Respondents of studies
Technologiescovered
in studiesType of indicators
Presence ofindicators
addressing equityethics and
investment issues
Presence ofindicators on ICT
integration incurriculumimpact etc
India Government None Elementary andsecondary schools
Not specified Computersinternet software
Quantitative None None
Indonesia Curriculum Centre
Governmentrsquos goalsand objectives
None Elementary andsecondary schools
Not specified Computers andthe internet
Quantitative Moreof internet andcomputer use andaccess
None None
Japan eJapan priority policyprogrammevarioussurveys conducted bygovernment agencieson ICT in general Likethose conducted bythe Ministry of PostsandTelecommunicationsSurvey on SocialEducation
None Elementary andsecondary in someindicators notspecified in otherindicators
Not specified Computers andinternet
Quantitative Moreof internet andcomputer use andaccess
Yes Governmentgeneral IT policy onelementary andsecondary schoolsthe same forschools for theblind and disabled
None
Republic ofKorea
Cyber Korea 21Vision To preparestudents forknowledge basedsociety by realizinglife-long learning viacyber-educationsystemrdquoKoreaNational StatisticsOffice
Yes - based onthe documententitled Adaptingeducation to theinformation ageA white paper
Elementarysecondary
Teachers andstudents andschoolheadmasters
Computersinternet andmultimedia
Quantitative Moreof internet andcomputer use andaccess throughinput utilizationand outputindicators
None None
Malaysia Government None Elementary andsecondary schools
Not specified Computers andthe internet
Quantitative None None
Quantitative andqualitative
Telecommunica-tions equipment
How schoolsteachers andstudents usetelecommuni-cationstechnologies
New Zealand Research conductedby the TelecomEducation Foundation
None Not specified Teachers andprincipals
Telephone linesfax machinescomputers andinternet
None Yes specificallyon whatencouragesteachers andstudents to usecomputers
32
Develop
ing and U
sing Indicators of IC
T Use in E
ducation
Philippines
Basis for ICTindicatorsagency
who formulatedICT indicators
Presence ofstandards for
technology use
Educationallevel covered
Respondents of studies
Technologiescovered
in studiesType of indicators
Presence ofindicators
addressing equityethics and
investment issues
Presence ofindicators on ICT
integration incurriculumimpact etc
Senate Committee onEducation Arts andCulture with SEAMEO-INNOTECH
Department ofEducation
None Public and privateelementary andsecondary schools
School heads All ICT relatedtechnologies suchas televisionprojectors radiocassette playerscomputersperipherals andinternet access
Quantitative Availability of
publiccommercialutilities andservices
Computer skillsof schoolpersonnel
Presence ofcomputers inschools
Instructionalacademic useof computers
Yes specificallythose pertaining touse of computers bynon-formaleducation students
None
Research on internetin Slovenia
None Primary secondaryyouth hostels andkindergartens
Not specified Computers andinternet access
Quantitative
Internet access
Computersnetworks
None None
School net None Not specified Students andteachers
Computers andinternet access
QualitativeexamplesIntegration of ICTwith curriculuminstructionalpractices barriersto computer use
None Yes oncompetency ofICT instructors
Government NationalEducation Act of1999
None Primary andsecondary schools
Not specified Computersinternettelephonescomputerperipherals ratio
Quantitative None None
Philippines
Slovenia
South Africa
Thailand
33
33
Final Rep
ort
Basis for ICTindicatorsagency
who formulatedICT indicators
Presence ofstandards for
technology use
Educationallevel covered
Respondents of studies
Technologiescovered
in studiesType of indicators
Presence ofindicators
addressing equityethics and
investment issues
Presence ofindicators on ICT
integrationin curriculumimpact etc
UK National grid forlearning
ISTE (NETS)standards
Primary andsecondary schools
Students andteachers
Computers and theinternet
Quantitative andqualitative
Computers inschools
Internet andelectroniccommunication
Teachercondidence anduse of ICT inteaching
Expenditure onICT
Yes mainly onexpenditure andbudget allocation
Yes includesteacherconfidence in theuse of ICT andbenefit of ICT
US Teaching learningand computing - astudy of teacherrsquosuse of computertechnology theirpedagogies andtheir school context
ISTE (NETS)standards
Public and privateschoolselementary middleschool and highschool all subjectsexcept physicaleducation andspecial education
Teachers Computers internetuse (includes use ofvarious softwareCDRom etc
Quantitative andqualitative School
technologyleadership andtechnologyoutcomes
Pedagogicalmotivations forstudent computeruse
Internet use byteachers
Presence ofcomputers inAmerican schools
Teacher andteacher directedstudent use ofcomputers andsoftware
Technologysupport
Schoolinvestments ininstructionaltechnology
Yes includesindicators thatdeterminestechnology intensiveareas softwaresaturation etc
Yes specificallypedagogicalmotivations forstudent computeruse
UK
US
34
Develop
ing and U
sing Indicators of IC
T Use in E
ducation
Basis for ICTindicatorsagency
who formulatedICT indicators
Presence ofstandards for
technology use
Educationallevel covered
Respondents of studies
Technologiescovered
in studiesType of indicators
Presence ofindicators
addressing equityethics and
investment issues
Presence ofindicators on ICT
integration incurriculumimpact etc
NoneUzbekistan Government Lawon Education
None Primary andsecondaryeducation
Not specified Computer andinternet
Quantitative None
Viet Nam Government
Governmentrsquos goalto ldquouniversalizerdquoeducation
None Primary andsecondary
Not specified Computer andinternet
Quantitative None None
1
1IIIAttachment
Studies on the Use andImpact of ICTin Education
35 35Final Report
Several studies have been conducted on ICT and its use and impact on educationsome of which are included below
This survey on the information and communications technology (ICT) provisions inschools in England was carried out in April 2001 the findings of which were comparedto similar surveys conducted in 1998 1999 and 2000 The surveys collectedinformation on the number and type of computers available in schools expenditurein schools the extent and benefit of the use of ICT across curriculum subjects theuse of internet and other electronic network communication links and teacherusage of computers and their confidence in the use of ICT in the curriculum It is asample survey and the sample is chosen to be representative of different types ofschools throughout the country Some of the findings as categorised are thefollowing
a Computers in schools
average number of computers per school increased steadily in all types ofschools between 1998 and 2001 the increase was noted to be greatbetween 2000 and 2001
b Internet usage and other external electronic communication services
between 1998 and 2001 there was a considerable increase in thepercentage of schools connected to the internet
c Use of ICT in teaching and teacher confidence
in each type of school there was an increase in the percentage of teachersreported to feel confident in the use of ICT in 2001
d Expenditure on ICT
the average expenditure on computers per school increased steadily in allschool types between 1998 and 2001
Source Statistics of EducationSurvey of Information and Communications Technology in Schools 2001National Statistics BulletinDepartment for Education and SkillsIssue No 0901October 2001
The Center for International Development (CID) at Harvard University conducted aresearch which came up with the Network Readiness Index (NRI) a majorinternational assessment of countriesrsquo capacity to exploit the opportunities offeredby ICTs In the development of the NRI data sources fall under two generalcategories First a variety of measures mainly ldquohardrdquo variables and also ldquosoftrdquoones from sources such as the World Bank the International TelecommunicationsUnion Freedom House and the Business Software Alliance were used Seconddata collected from the questionnaire responses of more than 4500 business andgovernment leaders surveyed in 75 countries by the Global Competitiveness Reportrsquos2001 Global Executive Opinion Survey conducted by Harvard University and theWorld Economic Forum were heavily relied upon
The Network Readiness Index is an assessment of a countryrsquos capacity to makeuse of ICT resources It shows how nations are performing with regards to theirparticipation in the Networked World Seventy-five countries were computed NRIs
B The Network Readiness Index Measuring thepreparedness of nations for the networked world
A Survey of information and communicationstechnology in schools 2001 in England
36 Developing and Using Indicators of ICT Use in Education
and the United States of America tops the NRI ranking making it the most highlydeveloped ICT network and it has the greatest potential to exploit networkrsquos capacityIceland Finland Sweden Norway and Netherlands follow USA Another NorthernEuropean country Denmark ranks 7th followed by Singapore in 8th Austria in 9th
and the United Kingdom in the 10th place Among the countries in the region whichwere included are Korea rank number 20 followed by Japan in the 21st placeMalaysia in number 26 Thailand number 43 India number 54 Philippines number58 followed by Indonesia in number 59 Sri Lanka in number 62 China in 64Bangladesh in 73 and Viet Nam in 74
Two components were taken into consideration in the computation of the NRIThese are network use and enabling factors Network use is defined as the measureof the extent of increase in the use of ICT in a specific country This is still narroweddown to five more catagories Internet users per hundred inhabitants cellularsubscribers per hundred inhabitants internet users per host percentage ofcomputers connected to the internet and availability of public access to the internet
Enabling factors is made up of four sub-indices network access network policynetworked society and networked economy Network access includes variablesrelated to the information infrastructure hardware software and support Itmeasures the extent and quality of the network infrastructure and the existence ofequipment programmes and support services that enable ICT use Network policyrefers to the information and communications policy environment and the businessand economic climate It also deals with the levels of competition in thetelecommnications and ICT sectors Networked society measures the quality andextent of use of ICT facilities in the learning process and networked economyassesses the extent of public and private sectors participation and e-governmentare considered in this sub-index
Source httpwwwcidharvardeducrpdfgitrr2002-cho02pdf
This is a national population survey of public and private elementary and secondaryschools conducted by SEAMEO INNOTECH in the Philippines under Project TAOCARES last March 2001 Its main objective was to determine the ICT capabilitiesof schools A total of 45811 schools were given questionnaires with the schoolheads as respondent of which 7937 per cent responded The survey questionnaireconsisted of 42 items mostly focused on the readiness of schools in terms ofinfrastructure hardware software and manpower capabilities on ICT Outputs ofthe survey were sixteen regional profiles on the ICT-preparedness of schools whichincluded data on the availability of electricity access of schools to communicationfacilities presence of computers computer peripherals and other multi-mediaequipment in schools sources of funds to maintain ICT-related operations proficiencyof school staff in the use of computers training received on ICT computer coursesbeing offered in schools and other ICT-related information
Some of the major findings of the survey at the national level are the following
Only 6607 per cent of schools have electrical connections
Only 1330 per cent have landline telephones 290 per cent have fax machinesand 200 per cent have internet connections
5217 schools only or 1428 per cent have computers with the National CapitalRegion having the highest percentage at 8730 per cent
Only 1824 per cent of schools have staff proficient in the use of computers
C Profile on the capabilities of elementary and secondary schools in the Philippines 2000-2001
37 37Final Report
7862 per cent of schools get funding to maintain ICT related operations fromthe PTCA
Only very few schools (1313 per cent) have school heads who have receivedICT training in the past five years
6436 per cent of school heads need training on basic computer literacy
This study was conducted by the New Educational Technologies Foundation Inc anon-profit organisation composed of schools that believe in the capacity of IT toimprove the quality of student learning and efficiency of teaching A total of 794schools participated in the survey with school heads in the public and private schoolsas respondents The questionnaire was divided into two parts the first part askedabout perceptions level of awareness and attitudes regarding the value of computereducation and was answered by users and non-users of computers The secondpart which dealt with the actual use of computers was answered by users onlyAmong the findings are the following
The number of computers owned by a private schools is twice as much aswhat a public school can afford
Computers available in schools are mostly the models AT486
Most computer units in the public elementary schools were acquired throughdonations in the secondary and tertiary schools most computers were acquiredthrough purchase
Computers are mostly used to teach different application programmes
Source The 1996 National Survey on Computer Education New Educational TechnologiesFoundation Inc
D The 1996 national survey on computereducation in the Philippines
In a primary school in Sunnyside Elementary School Pullman Washington studentsare using e-mails web sites videos and video conferencing technology tools todevelop their learning skills Through these mediums the students alongside theirglobal peers identify and share their cultures with one another in new waysTraditionally students learn about the world through books but new technologyallows the students to get in depth information about different cultures throughwriting reading and communicating with their global peers The following are theassessment tools used Assessment rublics designed for specific projects lessonandor classroom experiences standard assessment tools (ie DRA and WrightGroup Reading Assessments) teacher anecdotal notes childrenrsquos ownmetacognitive voices in the process of learning in conference with the teacherand in self-reflection of work and presentations parentsrsquo reports of student learningprogress
Teaching in non-traditional ways can sometimes be a risky business - with all eyesupon the class to see if learning is taking place It has been shown that studentsform teams to read write and communicate using technology at rates that meetand exceed standards for primary classes But along the way the added value oftechnology contributes in areas such as thinking skills social skills engagement inlearning motivation teaching and collaborating as the class sees what is essentialto learn in the context of the real world
Source httpwwwncrelorgengaugeframeworkefpalignefpalisuhtm
E Use of multiple assessment tools
38 Developing and Using Indicators of ICT Use in Education
F Technology A major catalyst for increasing learning by Jody C Isernhagen University of Nebraska-Lincoinby Jody C Isernhagen University of Nebraska-Lincoinby Jody C Isernhagen University of Nebraska-Lincoinby Jody C Isernhagen University of Nebraska-Lincoinby Jody C Isernhagen University of Nebraska-Lincoin TTTTTechnologechnologechnologechnologechnology Horizons in Educay Horizons in Educay Horizons in Educay Horizons in Educay Horizons in Educationtiontiontiontion Journal Online Journal Online Journal Online Journal Online Journal Online August 1999 - FeaAugust 1999 - FeaAugust 1999 - FeaAugust 1999 - FeaAugust 1999 - Featuretureturetureture
A rural public school in Nebraska composed of 1400 students applied for a three-year competitive Excellence in Education Grant in late 1995 Six schooladministrators and 18 staff members designed a plan to restructure their schooland classrooms The staff members defined that the major skills needed by studentsare comprehension reasoning composition and experimentation A computerwas placed in each classroom (80 classrooms) and 27 computers were located inthe elementary Integrated Learning Lab with Computer Curriculum CorporationSuccess Maker Software This software automatically diagnoses and placesstudents on the appropriate skill level while using the computer The computer labwas used by 314 students and 13 teachers in grades 1-3 from January 1996through May 1998 Teachers were trained on the use of ClarisWorks MicrosoftWord E-mail Internet Presentation Stations and the integration technology as atook in teaching and learning Activities of the students involved computer buildingdesigning of web pages to help maintain the schoolrsquos web pages digitizing video topresent to the community creating panoramic views and interactive virtual realityscenes preparing letters of application resumes and cover letters and to searchthe web for jobs With all the activities the teacher served as guides figuring outwith the students how to arrive at a productive presentation
The CAT scores in reading and math for students using an Integrated Learning Labfor 25 years showed a significant difference between the means The scores ofstudents testing below the 50th percentile at grades 1-3 in reading and math increasedsignificantly over time These findings suggest that using an Integrated LearningLab with rural primary age children daily over an extended period of time maypositively impact achievement for students particularly those students functioningbelow the 50th percentile
Source httpwwwthejournalcommagazinevaultarticleprintversioncfmaid=2126
G The impact of ICT on literacy learning in English
This report is the result of a literature review conducted first to identify a number ofstudies that might shed light on the major impact of ICT on literacy learning inEnglish for 5 to 16 year olds and the second to undertake an in-depth review ofthe papers that were identified as being on the impact of networked ICT on literacylearning in English for ages 5 to 16 There were 1871 studies screened following acriteria to identify relevant reports 188 studies were found that met the criteria inthe protocol These studies were then keyworded or indexed and the results filedon an electronic database
Of the 188 studies relevant to the mapping study 16 pertained to the topic of theimpact of networked ICT on literacy learning Data were extracted from these 16studies and were used as basis for an in-depth review Of these half were outcomeevaluations (evaluations of the results of an experiment or innovation) seven wereprocess evaluations (evaluations on how an intervention was delivered rather thanwhether it worked or not) and one was a needs assessment
Results show that as far as the in-depth study on networked ICT goes results areinconclusive Concerning policy and practice the recommendations of this revieware highly tentative and take the form of implications or pointers With regard topolicy they are to focus research funding for large-scale studies to give considerationto the balance of study type expertise in research teams and to give consideration
39 39Final Report
to the fact that the provision of computer hardware and software to schools andthe application of ICT in teaching and learning need to be informed by researchand evaluation
Source httpeppiioeacukEPPEWebhomeaspxpage=reelreview_groupreview_ one_abstractht
H Education Research Fund Effective Integrationof IT in Singapore Schools Pedagogical
and Policy ImplicationsThis is a report on the key findings of a questionnaire survey aimed at identifying thedegree of information technology (IT) integration among Singapore schools Thesurvey is the first part (Phase One) of a larger study funded by the Ministry ofEducation of Singapore aimed to examine and analyze where and how IT is integratedin Singapore schools to develop pupilsrsquo higher order thinking skills A total of 328schools responded to the survey of which 168 are primary schools 144 secondaryschools and 16 junior collegescentralized institutes (JCCs)
Major findings of the questionnaire survey include
Phase I schools in the IT Masterplan have significantly higher pupil and teacheruse of IT greater opportunities for staff development of teachers and moreconducive IT culture than Phase III schools
Independent-autonomous schools have significantly better management of ITresources higher teacher and pupils use of IT greater opportunities for staffdevelopment for teachers and more conducive IT culture than governmentschools
There are no significant differences among the primary schools secondaryschools and JCCs in terms of the management of IT resources pupil andteacher use of IT staff development and school IT culture
The correlations among management of IT resources pupil use of IT teacheruse of IT staff development and IT culture are significant and highly positive
- Contents
-

33
33
Final Rep
ort
Basis for ICTindicatorsagency
who formulatedICT indicators
Presence ofstandards for
technology use
Educationallevel covered
Respondents of studies
Technologiescovered
in studiesType of indicators
Presence ofindicators
addressing equityethics and
investment issues
Presence ofindicators on ICT
integrationin curriculumimpact etc
UK National grid forlearning
ISTE (NETS)standards
Primary andsecondary schools
Students andteachers
Computers and theinternet
Quantitative andqualitative
Computers inschools
Internet andelectroniccommunication
Teachercondidence anduse of ICT inteaching
Expenditure onICT
Yes mainly onexpenditure andbudget allocation
Yes includesteacherconfidence in theuse of ICT andbenefit of ICT
US Teaching learningand computing - astudy of teacherrsquosuse of computertechnology theirpedagogies andtheir school context
ISTE (NETS)standards
Public and privateschoolselementary middleschool and highschool all subjectsexcept physicaleducation andspecial education
Teachers Computers internetuse (includes use ofvarious softwareCDRom etc
Quantitative andqualitative School
technologyleadership andtechnologyoutcomes
Pedagogicalmotivations forstudent computeruse
Internet use byteachers
Presence ofcomputers inAmerican schools
Teacher andteacher directedstudent use ofcomputers andsoftware
Technologysupport
Schoolinvestments ininstructionaltechnology
Yes includesindicators thatdeterminestechnology intensiveareas softwaresaturation etc
Yes specificallypedagogicalmotivations forstudent computeruse
UK
US
34
Develop
ing and U
sing Indicators of IC
T Use in E
ducation
Basis for ICTindicatorsagency
who formulatedICT indicators
Presence ofstandards for
technology use
Educationallevel covered
Respondents of studies
Technologiescovered
in studiesType of indicators
Presence ofindicators
addressing equityethics and
investment issues
Presence ofindicators on ICT
integration incurriculumimpact etc
NoneUzbekistan Government Lawon Education
None Primary andsecondaryeducation
Not specified Computer andinternet
Quantitative None
Viet Nam Government
Governmentrsquos goalto ldquouniversalizerdquoeducation
None Primary andsecondary
Not specified Computer andinternet
Quantitative None None
1
1IIIAttachment
Studies on the Use andImpact of ICTin Education
35 35Final Report
Several studies have been conducted on ICT and its use and impact on educationsome of which are included below
This survey on the information and communications technology (ICT) provisions inschools in England was carried out in April 2001 the findings of which were comparedto similar surveys conducted in 1998 1999 and 2000 The surveys collectedinformation on the number and type of computers available in schools expenditurein schools the extent and benefit of the use of ICT across curriculum subjects theuse of internet and other electronic network communication links and teacherusage of computers and their confidence in the use of ICT in the curriculum It is asample survey and the sample is chosen to be representative of different types ofschools throughout the country Some of the findings as categorised are thefollowing
a Computers in schools
average number of computers per school increased steadily in all types ofschools between 1998 and 2001 the increase was noted to be greatbetween 2000 and 2001
b Internet usage and other external electronic communication services
between 1998 and 2001 there was a considerable increase in thepercentage of schools connected to the internet
c Use of ICT in teaching and teacher confidence
in each type of school there was an increase in the percentage of teachersreported to feel confident in the use of ICT in 2001
d Expenditure on ICT
the average expenditure on computers per school increased steadily in allschool types between 1998 and 2001
Source Statistics of EducationSurvey of Information and Communications Technology in Schools 2001National Statistics BulletinDepartment for Education and SkillsIssue No 0901October 2001
The Center for International Development (CID) at Harvard University conducted aresearch which came up with the Network Readiness Index (NRI) a majorinternational assessment of countriesrsquo capacity to exploit the opportunities offeredby ICTs In the development of the NRI data sources fall under two generalcategories First a variety of measures mainly ldquohardrdquo variables and also ldquosoftrdquoones from sources such as the World Bank the International TelecommunicationsUnion Freedom House and the Business Software Alliance were used Seconddata collected from the questionnaire responses of more than 4500 business andgovernment leaders surveyed in 75 countries by the Global Competitiveness Reportrsquos2001 Global Executive Opinion Survey conducted by Harvard University and theWorld Economic Forum were heavily relied upon
The Network Readiness Index is an assessment of a countryrsquos capacity to makeuse of ICT resources It shows how nations are performing with regards to theirparticipation in the Networked World Seventy-five countries were computed NRIs
B The Network Readiness Index Measuring thepreparedness of nations for the networked world
A Survey of information and communicationstechnology in schools 2001 in England
36 Developing and Using Indicators of ICT Use in Education
and the United States of America tops the NRI ranking making it the most highlydeveloped ICT network and it has the greatest potential to exploit networkrsquos capacityIceland Finland Sweden Norway and Netherlands follow USA Another NorthernEuropean country Denmark ranks 7th followed by Singapore in 8th Austria in 9th
and the United Kingdom in the 10th place Among the countries in the region whichwere included are Korea rank number 20 followed by Japan in the 21st placeMalaysia in number 26 Thailand number 43 India number 54 Philippines number58 followed by Indonesia in number 59 Sri Lanka in number 62 China in 64Bangladesh in 73 and Viet Nam in 74
Two components were taken into consideration in the computation of the NRIThese are network use and enabling factors Network use is defined as the measureof the extent of increase in the use of ICT in a specific country This is still narroweddown to five more catagories Internet users per hundred inhabitants cellularsubscribers per hundred inhabitants internet users per host percentage ofcomputers connected to the internet and availability of public access to the internet
Enabling factors is made up of four sub-indices network access network policynetworked society and networked economy Network access includes variablesrelated to the information infrastructure hardware software and support Itmeasures the extent and quality of the network infrastructure and the existence ofequipment programmes and support services that enable ICT use Network policyrefers to the information and communications policy environment and the businessand economic climate It also deals with the levels of competition in thetelecommnications and ICT sectors Networked society measures the quality andextent of use of ICT facilities in the learning process and networked economyassesses the extent of public and private sectors participation and e-governmentare considered in this sub-index
Source httpwwwcidharvardeducrpdfgitrr2002-cho02pdf
This is a national population survey of public and private elementary and secondaryschools conducted by SEAMEO INNOTECH in the Philippines under Project TAOCARES last March 2001 Its main objective was to determine the ICT capabilitiesof schools A total of 45811 schools were given questionnaires with the schoolheads as respondent of which 7937 per cent responded The survey questionnaireconsisted of 42 items mostly focused on the readiness of schools in terms ofinfrastructure hardware software and manpower capabilities on ICT Outputs ofthe survey were sixteen regional profiles on the ICT-preparedness of schools whichincluded data on the availability of electricity access of schools to communicationfacilities presence of computers computer peripherals and other multi-mediaequipment in schools sources of funds to maintain ICT-related operations proficiencyof school staff in the use of computers training received on ICT computer coursesbeing offered in schools and other ICT-related information
Some of the major findings of the survey at the national level are the following
Only 6607 per cent of schools have electrical connections
Only 1330 per cent have landline telephones 290 per cent have fax machinesand 200 per cent have internet connections
5217 schools only or 1428 per cent have computers with the National CapitalRegion having the highest percentage at 8730 per cent
Only 1824 per cent of schools have staff proficient in the use of computers
C Profile on the capabilities of elementary and secondary schools in the Philippines 2000-2001
37 37Final Report
7862 per cent of schools get funding to maintain ICT related operations fromthe PTCA
Only very few schools (1313 per cent) have school heads who have receivedICT training in the past five years
6436 per cent of school heads need training on basic computer literacy
This study was conducted by the New Educational Technologies Foundation Inc anon-profit organisation composed of schools that believe in the capacity of IT toimprove the quality of student learning and efficiency of teaching A total of 794schools participated in the survey with school heads in the public and private schoolsas respondents The questionnaire was divided into two parts the first part askedabout perceptions level of awareness and attitudes regarding the value of computereducation and was answered by users and non-users of computers The secondpart which dealt with the actual use of computers was answered by users onlyAmong the findings are the following
The number of computers owned by a private schools is twice as much aswhat a public school can afford
Computers available in schools are mostly the models AT486
Most computer units in the public elementary schools were acquired throughdonations in the secondary and tertiary schools most computers were acquiredthrough purchase
Computers are mostly used to teach different application programmes
Source The 1996 National Survey on Computer Education New Educational TechnologiesFoundation Inc
D The 1996 national survey on computereducation in the Philippines
In a primary school in Sunnyside Elementary School Pullman Washington studentsare using e-mails web sites videos and video conferencing technology tools todevelop their learning skills Through these mediums the students alongside theirglobal peers identify and share their cultures with one another in new waysTraditionally students learn about the world through books but new technologyallows the students to get in depth information about different cultures throughwriting reading and communicating with their global peers The following are theassessment tools used Assessment rublics designed for specific projects lessonandor classroom experiences standard assessment tools (ie DRA and WrightGroup Reading Assessments) teacher anecdotal notes childrenrsquos ownmetacognitive voices in the process of learning in conference with the teacherand in self-reflection of work and presentations parentsrsquo reports of student learningprogress
Teaching in non-traditional ways can sometimes be a risky business - with all eyesupon the class to see if learning is taking place It has been shown that studentsform teams to read write and communicate using technology at rates that meetand exceed standards for primary classes But along the way the added value oftechnology contributes in areas such as thinking skills social skills engagement inlearning motivation teaching and collaborating as the class sees what is essentialto learn in the context of the real world
Source httpwwwncrelorgengaugeframeworkefpalignefpalisuhtm
E Use of multiple assessment tools
38 Developing and Using Indicators of ICT Use in Education
F Technology A major catalyst for increasing learning by Jody C Isernhagen University of Nebraska-Lincoinby Jody C Isernhagen University of Nebraska-Lincoinby Jody C Isernhagen University of Nebraska-Lincoinby Jody C Isernhagen University of Nebraska-Lincoinby Jody C Isernhagen University of Nebraska-Lincoin TTTTTechnologechnologechnologechnologechnology Horizons in Educay Horizons in Educay Horizons in Educay Horizons in Educay Horizons in Educationtiontiontiontion Journal Online Journal Online Journal Online Journal Online Journal Online August 1999 - FeaAugust 1999 - FeaAugust 1999 - FeaAugust 1999 - FeaAugust 1999 - Featuretureturetureture
A rural public school in Nebraska composed of 1400 students applied for a three-year competitive Excellence in Education Grant in late 1995 Six schooladministrators and 18 staff members designed a plan to restructure their schooland classrooms The staff members defined that the major skills needed by studentsare comprehension reasoning composition and experimentation A computerwas placed in each classroom (80 classrooms) and 27 computers were located inthe elementary Integrated Learning Lab with Computer Curriculum CorporationSuccess Maker Software This software automatically diagnoses and placesstudents on the appropriate skill level while using the computer The computer labwas used by 314 students and 13 teachers in grades 1-3 from January 1996through May 1998 Teachers were trained on the use of ClarisWorks MicrosoftWord E-mail Internet Presentation Stations and the integration technology as atook in teaching and learning Activities of the students involved computer buildingdesigning of web pages to help maintain the schoolrsquos web pages digitizing video topresent to the community creating panoramic views and interactive virtual realityscenes preparing letters of application resumes and cover letters and to searchthe web for jobs With all the activities the teacher served as guides figuring outwith the students how to arrive at a productive presentation
The CAT scores in reading and math for students using an Integrated Learning Labfor 25 years showed a significant difference between the means The scores ofstudents testing below the 50th percentile at grades 1-3 in reading and math increasedsignificantly over time These findings suggest that using an Integrated LearningLab with rural primary age children daily over an extended period of time maypositively impact achievement for students particularly those students functioningbelow the 50th percentile
Source httpwwwthejournalcommagazinevaultarticleprintversioncfmaid=2126
G The impact of ICT on literacy learning in English
This report is the result of a literature review conducted first to identify a number ofstudies that might shed light on the major impact of ICT on literacy learning inEnglish for 5 to 16 year olds and the second to undertake an in-depth review ofthe papers that were identified as being on the impact of networked ICT on literacylearning in English for ages 5 to 16 There were 1871 studies screened following acriteria to identify relevant reports 188 studies were found that met the criteria inthe protocol These studies were then keyworded or indexed and the results filedon an electronic database
Of the 188 studies relevant to the mapping study 16 pertained to the topic of theimpact of networked ICT on literacy learning Data were extracted from these 16studies and were used as basis for an in-depth review Of these half were outcomeevaluations (evaluations of the results of an experiment or innovation) seven wereprocess evaluations (evaluations on how an intervention was delivered rather thanwhether it worked or not) and one was a needs assessment
Results show that as far as the in-depth study on networked ICT goes results areinconclusive Concerning policy and practice the recommendations of this revieware highly tentative and take the form of implications or pointers With regard topolicy they are to focus research funding for large-scale studies to give considerationto the balance of study type expertise in research teams and to give consideration
39 39Final Report
to the fact that the provision of computer hardware and software to schools andthe application of ICT in teaching and learning need to be informed by researchand evaluation
Source httpeppiioeacukEPPEWebhomeaspxpage=reelreview_groupreview_ one_abstractht
H Education Research Fund Effective Integrationof IT in Singapore Schools Pedagogical
and Policy ImplicationsThis is a report on the key findings of a questionnaire survey aimed at identifying thedegree of information technology (IT) integration among Singapore schools Thesurvey is the first part (Phase One) of a larger study funded by the Ministry ofEducation of Singapore aimed to examine and analyze where and how IT is integratedin Singapore schools to develop pupilsrsquo higher order thinking skills A total of 328schools responded to the survey of which 168 are primary schools 144 secondaryschools and 16 junior collegescentralized institutes (JCCs)
Major findings of the questionnaire survey include
Phase I schools in the IT Masterplan have significantly higher pupil and teacheruse of IT greater opportunities for staff development of teachers and moreconducive IT culture than Phase III schools
Independent-autonomous schools have significantly better management of ITresources higher teacher and pupils use of IT greater opportunities for staffdevelopment for teachers and more conducive IT culture than governmentschools
There are no significant differences among the primary schools secondaryschools and JCCs in terms of the management of IT resources pupil andteacher use of IT staff development and school IT culture
The correlations among management of IT resources pupil use of IT teacheruse of IT staff development and IT culture are significant and highly positive
- Contents
-