developing a reduced gravity testbed for the nanoparticle
TRANSCRIPT
American Institute of Aeronautics and Astronautics
1
Developing a Reduced Gravity Testbed for the Nanoparticle
Field Extraction Thruster
Brittany D. Drenkow*, Thomas M. Liu
†, John L. Bell
‡, Mike X. Huang
§, Shane P. Moore
¶, Joshua R. Robinson
#,
Vritika Singh**
, Rachel E. Trabert††
, Brian E. Gilchrist‡‡
, and Alec D. Gallimore§§
University of Michigan, Ann Arbor, MI, 48109
The Nanoparticle Field Extraction Thruster (NanoFET) is an electric propulsion device
under development at the University of Michigan to electrostatically charge and accelerate
micro- and nano-particle propellant. During the 2008-2009 academic year, undergraduates
comprising the Zero-g ElectroStatic Thruster Testbed team within the Student Space
Systems Fabrication Laboratory completed a full design-build-test-fly cycle to develop the
first NanoFET prototype with a piezoelectric-based feed system and to implement a thruster
testbed for future microgravity flights. Reduced gravity testing was conducted via NASA’s
Reduced Gravity Student Flight Opportunities Program based at NASA Johnson Space
Center. During the course of the project, the team promoted student growth and future
sustainability. The team’s organization, work completed, and educational benefits are
presented.
I. Introduction
lectric propulsion, unlike chemical rockets, utilizes electric and magnetic forces to create thrust and provide
efficient propellant usage for deep space missions and orbital maneuvering. The Nanoparticle Field Extraction
Thruster (NanoFET) is an electric propulsion device for small spacecraft under development at the University of
Michigan. NanoFET electrostatically charges and accelerates solid micro- and nano-particles to produce thrust. The
goal of NanoFET is to leverage a single, flexible electric propulsion thruster to enhance and enable a broad range of
missions.1
ZESTT (Zero-g ElectroStatic Thruster Testbed) is an undergraduate team affiliated with the University of
Michigan’s Student Space Systems Fabrication Laboratory (S3FL). Unlike previous S3FL reduced gravity
experiments that worked with a liquid-based NanoFET configuration2, ZESTT focused on testing a dry propellant
configuration of NanoFET through NASA’s Reduced Gravity Student Flight Opportunities Program based at
Johnson Space Center. During 2008-2009, the team developed a NanoFET prototype and a vacuum testbed usable
in both terrestrial and microgravity environments to better understand NanoFET’s operational parameters and design
drivers.
S3FL is a student-run laboratory dedicated to providing undergraduate students with hands-on research
experience through real-world, multidisciplinary space systems projects.3 The design-build-test-fly philosophy is
central to S3FL projects requiring students with diverse skill sets from a variety of disciplines. The organization is
overseen by an Executive Committee (Excom) who organizes, advises, and assesses the progress of each project.
Teams are divided into smaller subsystem groups focused on specific aspects such as the structural or electrical
* Undergraduate Student, Aerospace Engineering, [email protected], AIAA Student Member
† Graduate Student, Aerospace Engineering, [email protected], AIAA Student Member
‡ Undergraduate Student, Electrical Engineering, [email protected]
§ Undergraduate Student, Electrical Engineering, [email protected]
¶ Undergraduate Student, Aerospace Engineering, [email protected]
# Undergraduate Student, Aerospace Engineering, [email protected]
** Undergraduate Student, Aerospace Engineering, [email protected]
†† Undergraduate Student, Aerospace Engineering, [email protected]
‡‡ Professor, Electrical Engineering & Space Systems, [email protected], AIAA Associate Fellow
§§ Arthur F. Thurnau Professor, Aerospace Engineering & Applied Physics, [email protected], AIAA Associate
Fellow
E
45th AIAA/ASME/SAE/ASEE Joint Propulsion Conference & Exhibit2 - 5 August 2009, Denver, Colorado
AIAA 2009-5194
Copyright © 2009 by Brittany Drenkow. Published by the American Institute of Aeronautics and Astronautics, Inc., with permission.
American Institute of Aeronautics and Astronautics
2
systems. Students start in the lab as subsystem team members and, depending on their technical and leadership
skills acquired over time, are able to work their way up the project hierarchy. Capable and dedicated team leaders
are invited to become Excom members to oversee and direct laboratory activities. Involvement in S3FL enhances
technical skills learned in the classroom and provides students with valuable real-world project experience.
Team ZESTT positively impacts not only the development of the future technical workforce but also enhances
space technology development. By allowing NanoFET prototypes to be tested in “space-like” environments (i.e.,
both vacuum and microgravity), ZESTT provides an opportunity to increase the NanoFET concept’s Technology
Readiness Level (TRL)4, thus raising confidence in the technology’s growing maturity. In addition, reduced gravity
demonstrations like ZESTT help qualify NanoFET systems for use in future missions onboard microgravity flights
or small satellite platforms involving free-floating units whose dynamics can be controlled by NanoFET operations.
II. ZESTT Objectives and Team Organization
The ZESTT project was created to aid in NanoFET’s technical development while providing an educational
experience to undergraduate students. A set of objectives (technical and educational) provided overall direction for
the project. The team’s organization supplied the means for these objectives to be implemented.
A. Objectives
The technical objectives set the overarching requirements for advancing NanoFET and provided future
sustainability of microgravity experiments. These objectives were as follows:
1) Prototype a dry, piezoelectric-based feed system using microparticles.
2) Demonstrate the feed system’s feasibility under vacuum conditions in terrestrial and microgravity
environments.
3) Determine the feed system’s throughput, emission uniformity, and efficiency for various throttling
conditions.
4) Validate NanoFET performance models for particle charging, liftoff, and acceleration.
5) Implement a thruster testbed for future microgravity experiments.
The development of a prototype piezoelectric-based propellant feed system for NanoFET lies at the heart of the
ZESTT project. As part of demonstrating the feasibility of this system, the prototype needed to undergo ground
testing followed by a reduced gravity flight demonstration. In preparation for ZESTT’s microgravity flight, a
thruster testbed was created to provide future sustainability of NanoFET testing. From these objectives, team
members formulated specific requirements to drive the design process.
While ZESTT is a technically-driven project, several educational objectives were derived from the team’s
involvement with S3FL to provide a challenging learning environment for each student, promote outreach activities,
and compile documentation as a reference for future projects. The educational objectives for the ZESTT project
were as follows:
6) Implement S3FL’s design-build-test-fly methodology and track student development.
7) Provide “beyond the classroom learning” opportunities to engage pre-college students.
8) Compile standard project policies, procedures, and lessons learned for future S3FL teams.
B. Team Organization
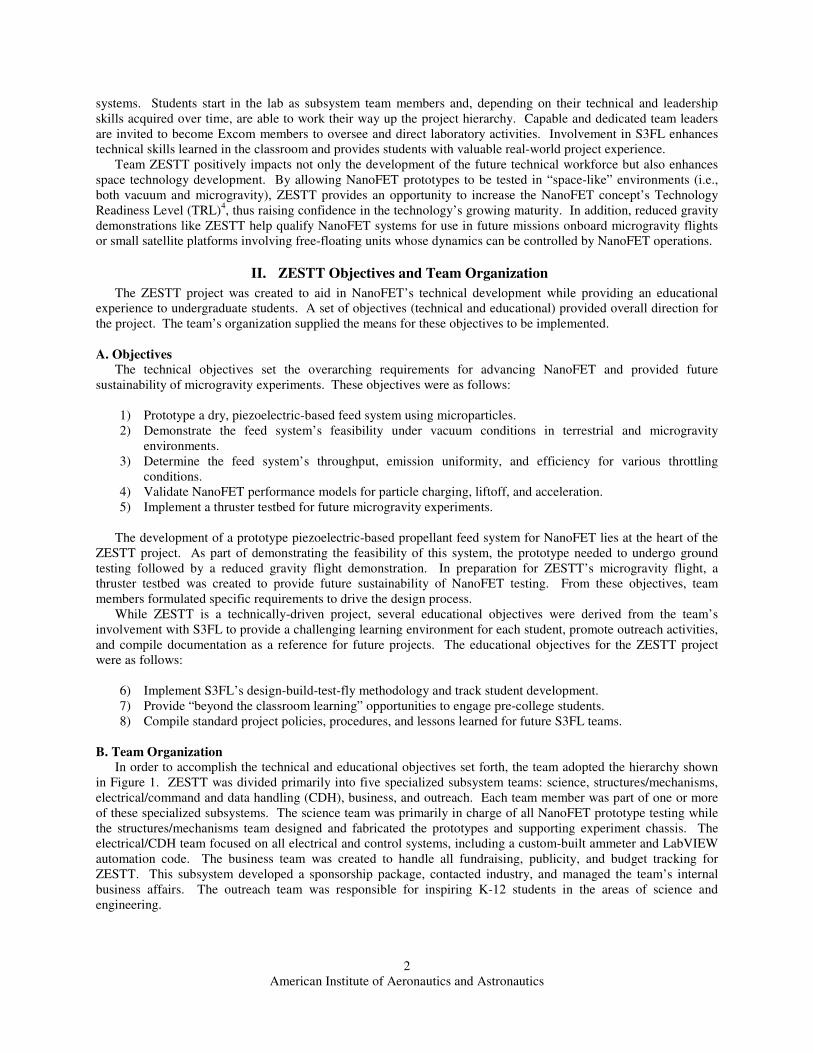
In order to accomplish the technical and educational objectives set forth, the team adopted the hierarchy shown
in Figure 1. ZESTT was divided primarily into five specialized subsystem teams: science, structures/mechanisms,
electrical/command and data handling (CDH), business, and outreach. Each team member was part of one or more
of these specialized subsystems. The science team was primarily in charge of all NanoFET prototype testing while
the structures/mechanisms team designed and fabricated the prototypes and supporting experiment chassis. The
electrical/CDH team focused on all electrical and control systems, including a custom-built ammeter and LabVIEW
automation code. The business team was created to handle all fundraising, publicity, and budget tracking for
ZESTT. This subsystem developed a sponsorship package, contacted industry, and managed the team’s internal
business affairs. The outreach team was responsible for inspiring K-12 students in the areas of science and
engineering.
American Institute of Aeronautics and Astronautics
3
All subsystems were led by a subsystem lead that, in conjunction with other subsystem leads, comprised the
systems/operations team. The systems/operations team was overseen by the project manager who was advised by
the principle investigator and S3FL Excom. In such a fast-paced technical project, communication between team
members was especially important. Weekly meetings between the project manager and systems/operations team
were held to allow each subsystem to update each other on their team’s progress towards the overall objectives as
well as to distribute action items. An online worksite with forums and resources was established as a means of
sharing documents and information with the entire team. This site enhanced communication across subsystems,
allowed for an organized means of compiling documentation, and aided the project’s overall integration.
The ZESTT project’s schedule was designed around four major milestones or reviews prior to flight. The first
milestone was the Mission Definition Review (MDR). This review provided team members with the opportunity to
communicate their preliminary baseline design to knowledgeable reviewers in exchange for feedback and advice.
MDR was also a means to determine the objectives and driving requirements, identify high-risk items and mitigation
strategies, and prepare the experiment proposal for submission to NASA’s Reduced Gravity Student Flight
Opportunities Program.
Following MDR and the proposal’s selection, the team further developed the design and presented more
specialized Preliminary Design Reviews (PDR) for separate aspects of the project including the NanoFET prototype,
chassis and vacuum chamber, electrical/CDH systems, business, and outreach. These reviews were intended to
establish a more detailed baseline design in preparation for the experiment’s fabrication, identify additional high-risk
items and mitigation strategies, and solicit expert advice. In April, a Go/No-Go demonstration was held to prove the
experiment’s functionality, and the Test Equipment Data Package (TEDP) was submitted to NASA to provide full
documentation of the experiment’s operation and potential safety concerns in preparation for microgravity flight
testing. The team successfully passed all objectives of this review. Finally, once in Houston, the team had to pass a
Test Readiness Review (TRR) conducted by NASA in order to fly. This review was intended to allow the test
directors, flight operators, and other officials to identify any safety concerns and to ensure compliance with all
regulations.
Each of these reviews presented the team with challenges. They learned how to work together under pressure to
meet the deadlines, identify problems, and develop mitigation strategies early on. Technical communication skills
were also enhanced through the development and execution of the presentations that involved a varied audience of
faculty, peers, and professionals.
Figure 1. ZESTT Team Hierarchy. Each of the five focused subsystem teams was led by their own lead that
together made up the Systems/Operations team.
American Institute of Aeronautics and Astronautics
4
III. Experiment Design and Fabrication
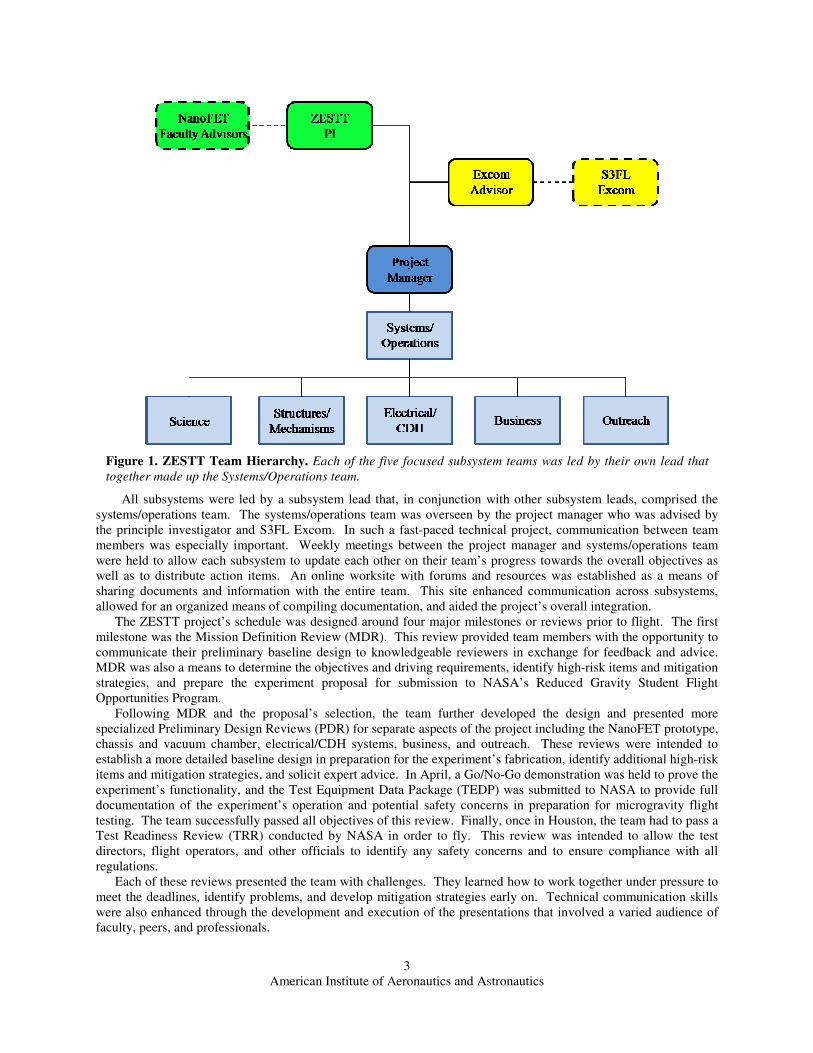
The NanoFET concept, schematically shown in Figure 2, requires that solid particles be electrostatically charged
and accelerated to produce thrust. A charging electric field is generated via a potential bias between the particle
sieve and the extraction gate electrode. Implementation of a piezoelectric-based feed system provides an inertial
“kick-off” force at the particle sieve that allows for controlled particle liftoff and extraction.5
A. M-1 NanoFET Prototype Development
The NanoFET prototype, designed and built by the structures/mechanisms team, was the first generation
prototype to use single micron-sized particles (1-10 µm silver-coated soda lime glass spheres) and was thereby
designated the “M-1.” The M-1 had a development life of approximately nine months. During this time, team
members learned how to model their ideas using computer aided design (CAD) software such as SolidWorks
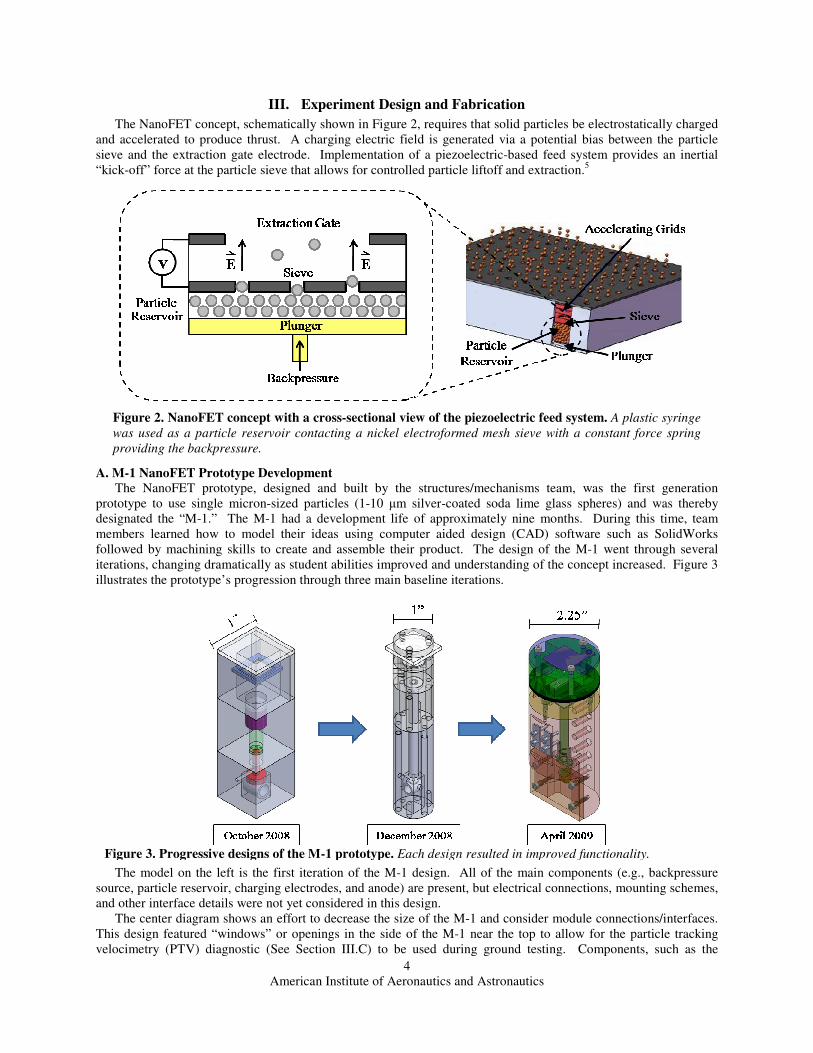
followed by machining skills to create and assemble their product. The design of the M-1 went through several
iterations, changing dramatically as student abilities improved and understanding of the concept increased. Figure 3
illustrates the prototype’s progression through three main baseline iterations.
The model on the left is the first iteration of the M-1 design. All of the main components (e.g., backpressure
source, particle reservoir, charging electrodes, and anode) are present, but electrical connections, mounting schemes,
and other interface details were not yet considered in this design.
The center diagram shows an effort to decrease the size of the M-1 and consider module connections/interfaces.
This design featured “windows” or openings in the side of the M-1 near the top to allow for the particle tracking
velocimetry (PTV) diagnostic (See Section III.C) to be used during ground testing. Components, such as the
Figure 3. Progressive designs of the M-1 prototype. Each design resulted in improved functionality.
Figure 2. NanoFET concept with a cross-sectional view of the piezoelectric feed system. A plastic syringe
was used as a particle reservoir contacting a nickel electroformed mesh sieve with a constant force spring
providing the backpressure.
American Institute of Aeronautics and Astronautics
5
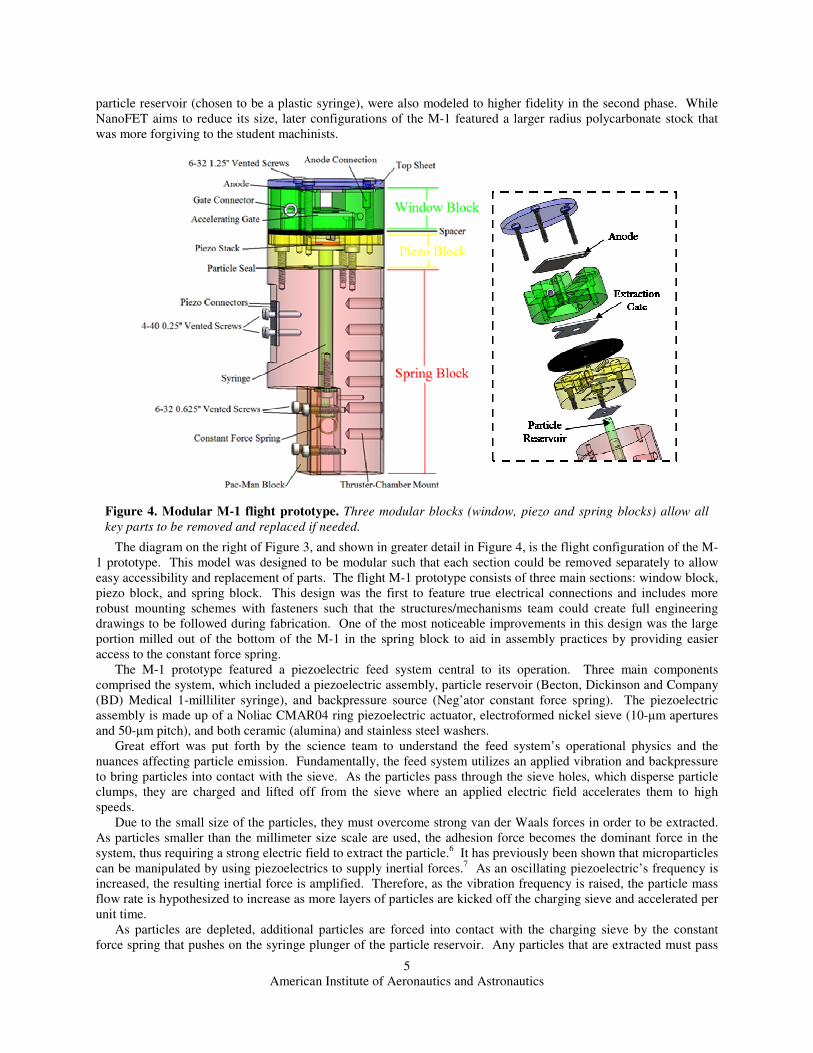
particle reservoir (chosen to be a plastic syringe), were also modeled to higher fidelity in the second phase. While
NanoFET aims to reduce its size, later configurations of the M-1 featured a larger radius polycarbonate stock that
was more forgiving to the student machinists.
The diagram on the right of Figure 3, and shown in greater detail in Figure 4, is the flight configuration of the M-
1 prototype. This model was designed to be modular such that each section could be removed separately to allow
easy accessibility and replacement of parts. The flight M-1 prototype consists of three main sections: window block,
piezo block, and spring block. This design was the first to feature true electrical connections and includes more
robust mounting schemes with fasteners such that the structures/mechanisms team could create full engineering
drawings to be followed during fabrication. One of the most noticeable improvements in this design was the large
portion milled out of the bottom of the M-1 in the spring block to aid in assembly practices by providing easier
access to the constant force spring.
The M-1 prototype featured a piezoelectric feed system central to its operation. Three main components
comprised the system, which included a piezoelectric assembly, particle reservoir (Becton, Dickinson and Company
(BD) Medical 1-milliliter syringe), and backpressure source (Neg’ator constant force spring). The piezoelectric
assembly is made up of a Noliac CMAR04 ring piezoelectric actuator, electroformed nickel sieve (10-µm apertures
and 50-µm pitch), and both ceramic (alumina) and stainless steel washers.
Great effort was put forth by the science team to understand the feed system’s operational physics and the
nuances affecting particle emission. Fundamentally, the feed system utilizes an applied vibration and backpressure
to bring particles into contact with the sieve. As the particles pass through the sieve holes, which disperse particle
clumps, they are charged and lifted off from the sieve where an applied electric field accelerates them to high
speeds.
Due to the small size of the particles, they must overcome strong van der Waals forces in order to be extracted.
As particles smaller than the millimeter size scale are used, the adhesion force becomes the dominant force in the
system, thus requiring a strong electric field to extract the particle.6 It has previously been shown that microparticles
can be manipulated by using piezoelectrics to supply inertial forces.7 As an oscillating piezoelectric’s frequency is
increased, the resulting inertial force is amplified. Therefore, as the vibration frequency is raised, the particle mass
flow rate is hypothesized to increase as more layers of particles are kicked off the charging sieve and accelerated per
unit time.
As particles are depleted, additional particles are forced into contact with the charging sieve by the constant
force spring that pushes on the syringe plunger of the particle reservoir. Any particles that are extracted must pass
Figure 4. Modular M-1 flight prototype. Three modular blocks (window, piezo and spring blocks) allow all
key parts to be removed and replaced if needed.
American Institute of Aeronautics and Astronautics
6
through an extraction gate to impact the collection anode. Inefficiencies arise when some particles are diverted to
the walls and gate rather than passing through towards the anode.
All of the M-1 components, with the exception of the stainless steel extraction gates, were fabricated in-house by
the structures/mechanisms team at the Wilson Student Project Center on the University of Michigan’s campus.
Within this facility, the team could take advantage of a fully equipped machine shop (including basic tools, milling
and lathing machines with CNC capabilities, and welding equipment), computer workstations, and individual space
provided solely for sponsored student organizations such as S3FL. To operate the M-1 inside a vacuum chamber,
special consideration was given to the components procured such that each had a low percentage (less than 1%) of
total mass loss (TML) in vacuum. A low TML reduces outgassing effects inside the vacuum chamber and therefore
reduces the chances of contamination and undesirable electrical breakdown. Polycarbonate (0.1% TML) was
chosen for the M-1 prototype body, whose properties also allowed it to be easily machined while remaining highly
durable without being brittle. Training on all machinery was conducted during the design phase, which team
members then put to practice as they learned the process of fabricating the designs they created.
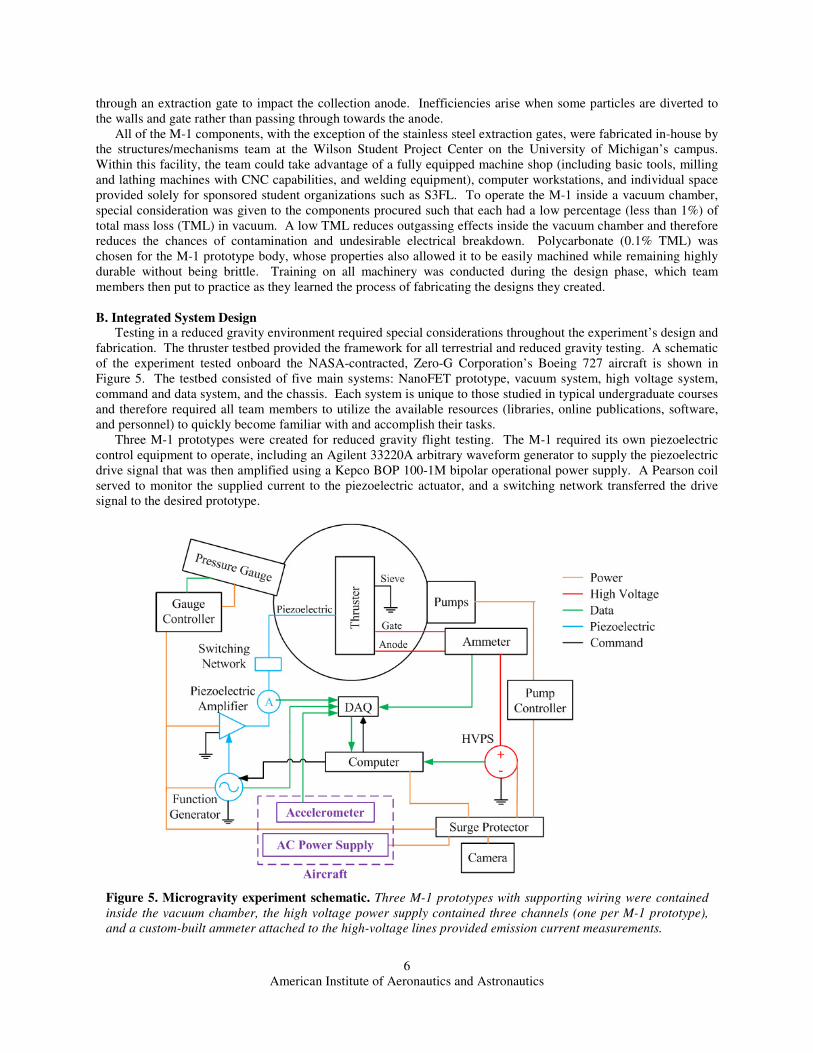
B. Integrated System Design Testing in a reduced gravity environment required special considerations throughout the experiment’s design and
fabrication. The thruster testbed provided the framework for all terrestrial and reduced gravity testing. A schematic
of the experiment tested onboard the NASA-contracted, Zero-G Corporation’s Boeing 727 aircraft is shown in
Figure 5. The testbed consisted of five main systems: NanoFET prototype, vacuum system, high voltage system,
command and data system, and the chassis. Each system is unique to those studied in typical undergraduate courses
and therefore required all team members to utilize the available resources (libraries, online publications, software,
and personnel) to quickly become familiar with and accomplish their tasks.
Three M-1 prototypes were created for reduced gravity flight testing. The M-1 required its own piezoelectric
control equipment to operate, including an Agilent 33220A arbitrary waveform generator to supply the piezoelectric
drive signal that was then amplified using a Kepco BOP 100-1M bipolar operational power supply. A Pearson coil
served to monitor the supplied current to the piezoelectric actuator, and a switching network transferred the drive
signal to the desired prototype.
Figure 5. Microgravity experiment schematic. Three M-1 prototypes with supporting wiring were contained
inside the vacuum chamber, the high voltage power supply contained three channels (one per M-1 prototype),
and a custom-built ammeter attached to the high-voltage lines provided emission current measurements.
American Institute of Aeronautics and Astronautics
7
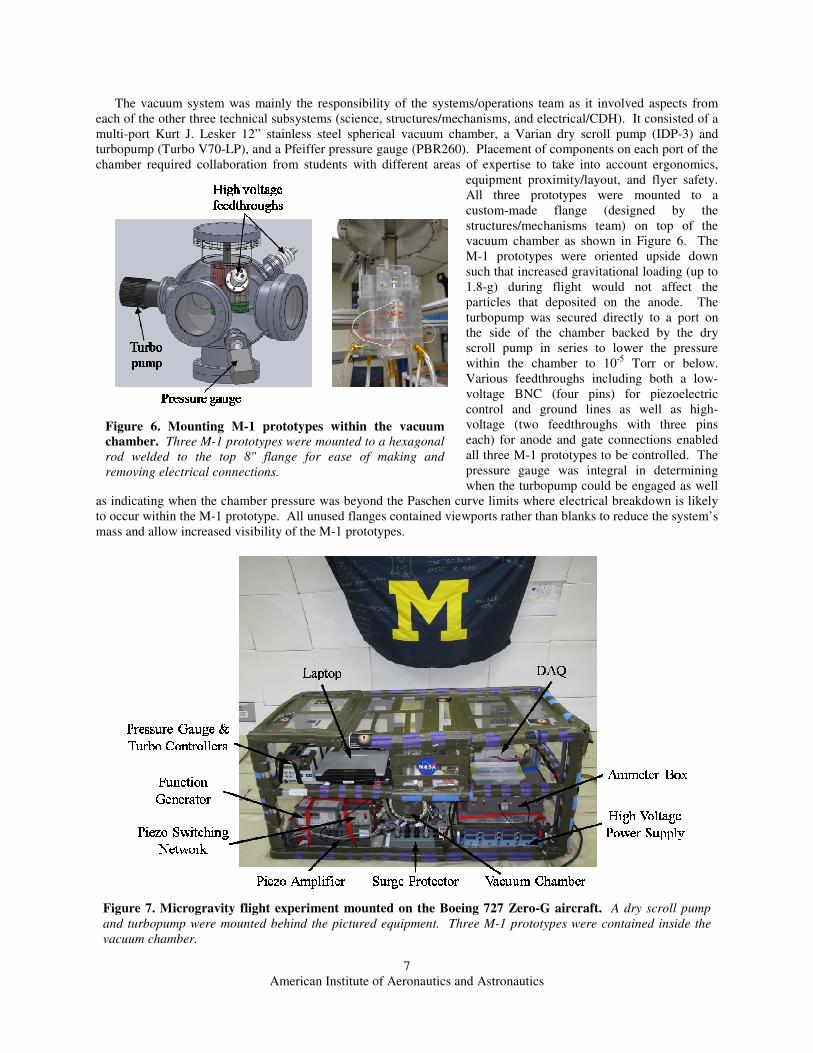
The vacuum system was mainly the responsibility of the systems/operations team as it involved aspects from
each of the other three technical subsystems (science, structures/mechanisms, and electrical/CDH). It consisted of a
multi-port Kurt J. Lesker 12” stainless steel spherical vacuum chamber, a Varian dry scroll pump (IDP-3) and
turbopump (Turbo V70-LP), and a Pfeiffer pressure gauge (PBR260). Placement of components on each port of the
chamber required collaboration from students with different areas of expertise to take into account ergonomics,
equipment proximity/layout, and flyer safety.
All three prototypes were mounted to a
custom-made flange (designed by the
structures/mechanisms team) on top of the
vacuum chamber as shown in Figure 6. The
M-1 prototypes were oriented upside down
such that increased gravitational loading (up to
1.8-g) during flight would not affect the
particles that deposited on the anode. The
turbopump was secured directly to a port on
the side of the chamber backed by the dry
scroll pump in series to lower the pressure
within the chamber to 10-5
Torr or below.
Various feedthroughs including both a low-
voltage BNC (four pins) for piezoelectric
control and ground lines as well as high-
voltage (two feedthroughs with three pins
each) for anode and gate connections enabled
all three M-1 prototypes to be controlled. The
pressure gauge was integral in determining
when the turbopump could be engaged as well
as indicating when the chamber pressure was beyond the Paschen curve limits where electrical breakdown is likely
to occur within the M-1 prototype. All unused flanges contained viewports rather than blanks to reduce the system’s
mass and allow increased visibility of the M-1 prototypes.
Figure 7. Microgravity flight experiment mounted on the Boeing 727 Zero-G aircraft. A dry scroll pump
and turbopump were mounted behind the pictured equipment. Three M-1 prototypes were contained inside the
vacuum chamber.
Figure 6. Mounting M-1 prototypes within the vacuum
chamber. Three M-1 prototypes were mounted to a hexagonal
rod welded to the top 8" flange for ease of making and
removing electrical connections.
American Institute of Aeronautics and Astronautics
8
In order to produce an electric field to charge and accelerate the microparticles within the M-1, high voltage was
provided by an UltraVolt multichannel high-voltage power supply (HVPS). The electrical/CDH subsystem
developed three custom-built ammeter circuits for emission current measurements on the high voltage lines.
The command and data system consisted of a Panasonic Toughbook 52 semi-rugged laptop enabling automation
of the experiment via LabVIEW and a National Instruments USB-6218 data acquisition system (DAQ). The DAQ,
having a total sampling rate of 250 kSamples/s, acquired seven channels of data for the custom-built ammeter
current, HVPS sense current and voltage, piezoelectric current and voltage, function generator output, and
acceleration from the aircraft’s onboard accelerometer. All data was sent and stored on the laptop computer for
post-test analysis.
All of the equipment used in operating the M-1 prototypes in a vacuum environment was attached to a chassis
housing, which provided the main structure that bolted to the aircraft as shown in Figure 7. The experiment chassis
(59” long x 24” wide x 28” tall) had strategically placed components for use by specific flyers during flight. Three
flyers on each flight day were positioned next to each other in front of the chassis. Flyer 1 was primarily responsible
for running the laptop, which contained the LabVIEW code (Section III.D) that automated the majority of the
experiment. Flyer 2 observed the M-1 prototypes in the chamber and watched for possible arcs during operation.
Flyer 3 operated the high voltage power supply and adjusted it accordingly if arcing occurred. Precaution was taken
to protect the flyers and equipment during the 1.8-g period of the microgravity flight by covering the structure itself
in foam padding and enclosing all sides in strong plastic shrink wrap.
Mass was a significant design driver for the experiment chassis. The team carefully kept a mass budget that
tracked each component’s weight to ensure everything was kept within NASA’s limit (300 lbs + 50 lb waiver).
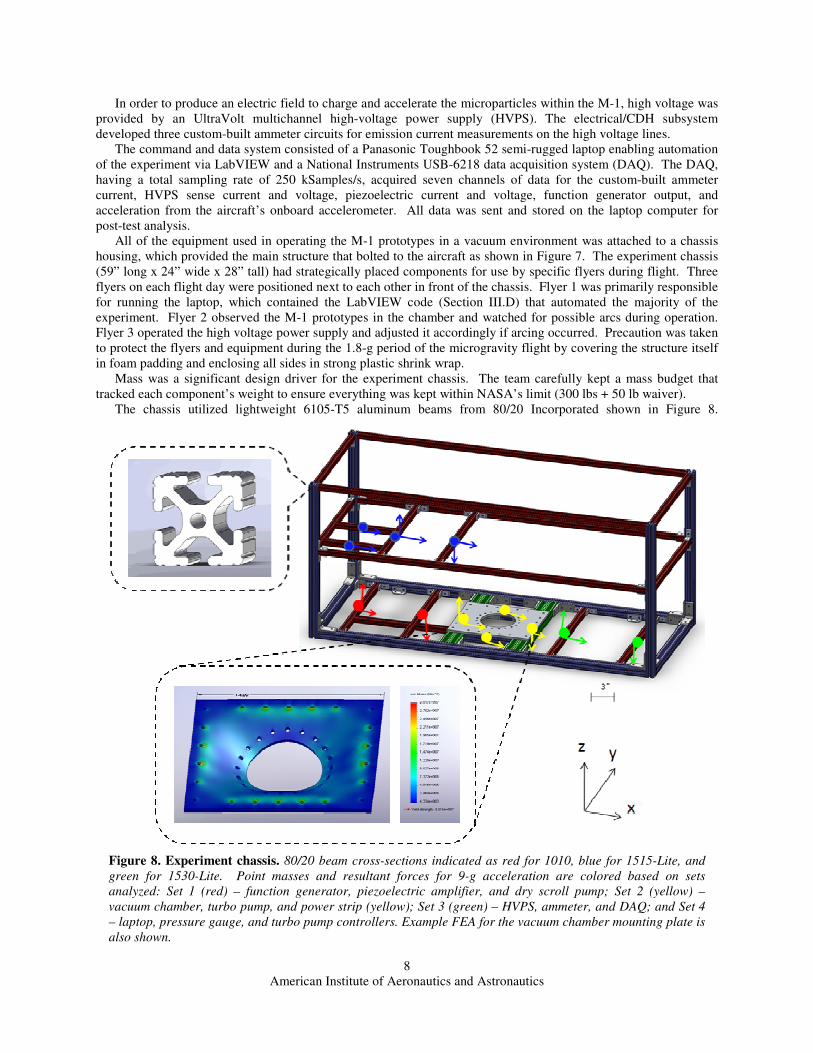
The chassis utilized lightweight 6105-T5 aluminum beams from 80/20 Incorporated shown in Figure 8.
Figure 8. Experiment chassis. 80/20 beam cross-sections indicated as red for 1010, blue for 1515-Lite, and
green for 1530-Lite. Point masses and resultant forces for 9-g acceleration are colored based on sets
analyzed: Set 1 (red) – function generator, piezoelectric amplifier, and dry scroll pump; Set 2 (yellow) –
vacuum chamber, turbo pump, and power strip (yellow); Set 3 (green) – HVPS, ammeter, and DAQ; and Set 4
– laptop, pressure gauge, and turbo pump controllers. Example FEA for the vacuum chamber mounting plate is
also shown.
American Institute of Aeronautics and Astronautics
9
Structural verification techniques introduced in the classroom (a combination of hand calculations and finite element
analysis (FEA) using NX I-DEAS V5.0) were applied to prove the chassis structure could survive under a variety of
gravitational loading scenarios (9-g forward, 3-g aft, 6-g down, 2-g up, and 2-g lateral). Analysis and testing was
also performed for impact and “kick loads” on both the chassis structure and the plastic wrap that enclosed the
chassis. To ensure it would survive the worst case flight scenario, a minimum factor of safety of two was
maintained. All requirements were successfully met with a minimum factor of safety of 2.86. Hand calculations
were performed using Euler-Bernoulli beam theory and simple free body diagrams. Stress levels were
overestimated using this method as loads were concentrated at the beam midpoints and at locations where beam
failures were most likely to occur. All hand calculations agreed with the FEA results obtained to within 15%.
C. M-1 Diagnostics
In addition to developing the M-1 prototype and supporting systems, the ZESTT team also developed unique
diagnostic tools to characterize the prototypes. Three main diagnostic techniques were implemented: particle
tracking velocimetry (PTV), ammeter data collection, and anode deposition analysis.
1. Particle Tracking Velocimetry
Typically, particle tracking velocimetry is a method utilized to characterize fluid dynamics by placing tracer
particles in the fluid to be tracked and recorded. For the M-1, PTV is used as the primary ground testing diagnostic
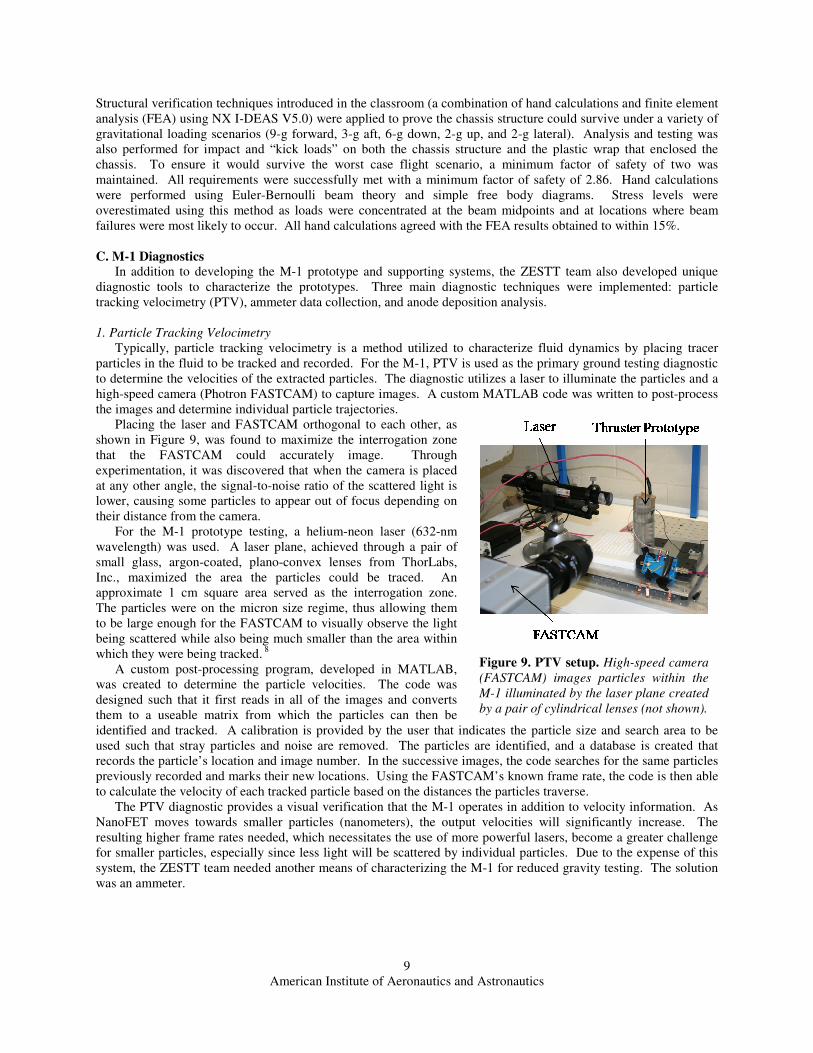
to determine the velocities of the extracted particles. The diagnostic utilizes a laser to illuminate the particles and a
high-speed camera (Photron FASTCAM) to capture images. A custom MATLAB code was written to post-process
the images and determine individual particle trajectories.
Placing the laser and FASTCAM orthogonal to each other, as
shown in Figure 9, was found to maximize the interrogation zone
that the FASTCAM could accurately image. Through
experimentation, it was discovered that when the camera is placed
at any other angle, the signal-to-noise ratio of the scattered light is
lower, causing some particles to appear out of focus depending on
their distance from the camera.
For the M-1 prototype testing, a helium-neon laser (632-nm
wavelength) was used. A laser plane, achieved through a pair of
small glass, argon-coated, plano-convex lenses from ThorLabs,
Inc., maximized the area the particles could be traced. An
approximate 1 cm square area served as the interrogation zone.
The particles were on the micron size regime, thus allowing them
to be large enough for the FASTCAM to visually observe the light
being scattered while also being much smaller than the area within
which they were being tracked. 8
A custom post-processing program, developed in MATLAB,
was created to determine the particle velocities. The code was
designed such that it first reads in all of the images and converts
them to a useable matrix from which the particles can then be
identified and tracked. A calibration is provided by the user that indicates the particle size and search area to be
used such that stray particles and noise are removed. The particles are identified, and a database is created that
records the particle’s location and image number. In the successive images, the code searches for the same particles
previously recorded and marks their new locations. Using the FASTCAM’s known frame rate, the code is then able
to calculate the velocity of each tracked particle based on the distances the particles traverse.
The PTV diagnostic provides a visual verification that the M-1 operates in addition to velocity information. As
NanoFET moves towards smaller particles (nanometers), the output velocities will significantly increase. The
resulting higher frame rates needed, which necessitates the use of more powerful lasers, become a greater challenge
for smaller particles, especially since less light will be scattered by individual particles. Due to the expense of this
system, the ZESTT team needed another means of characterizing the M-1 for reduced gravity testing. The solution
was an ammeter.
Figure 9. PTV setup. High-speed camera
(FASTCAM) images particles within the
M-1 illuminated by the laser plane created
by a pair of cylindrical lenses (not shown).
American Institute of Aeronautics and Astronautics
10
2. Ammeter Design
A custom ammeter was designed and built by the electrical/CDH subsystem as the main flight diagnostic used to
measure particle emission as particles strike the collection anode. While the PTV diagnostic system offered
simplicity, the team was challenged to develop a smaller, lighter method capable of being used in flight.
Several conventional devices were first investigated; however, none were found to have the ability of interfacing
with the prototype to obtain the desired measurements. Hall effect sensors were considered but could not provide
the nano-amp resolution that was expected from the microparticles emitted by the M-1 prototype. A Faraday cup,
often used for similar purposes, was impractical since high voltage for the M-1 had to be applied on the collection
end, rather than ground as is typical for Faraday cup collection. The team’s custom ammeter diagnostic, similar to a
Faraday cup, was therefore designed to measure current caused by particle charge transferred to the collection
anode.
Several design iterations were conducted as electrical subsystem members learned how to isolate noise to
measure nano-amp currents on a high voltage data line. Technicians and faculty were sought out to gain insight
especially on high voltage operations and electrical noise. Circuitry knowledge taught in electrical engineering
courses was put to use as the students prototyped each design, first on breadboards, before moving to PCB boards
for the final configuration.
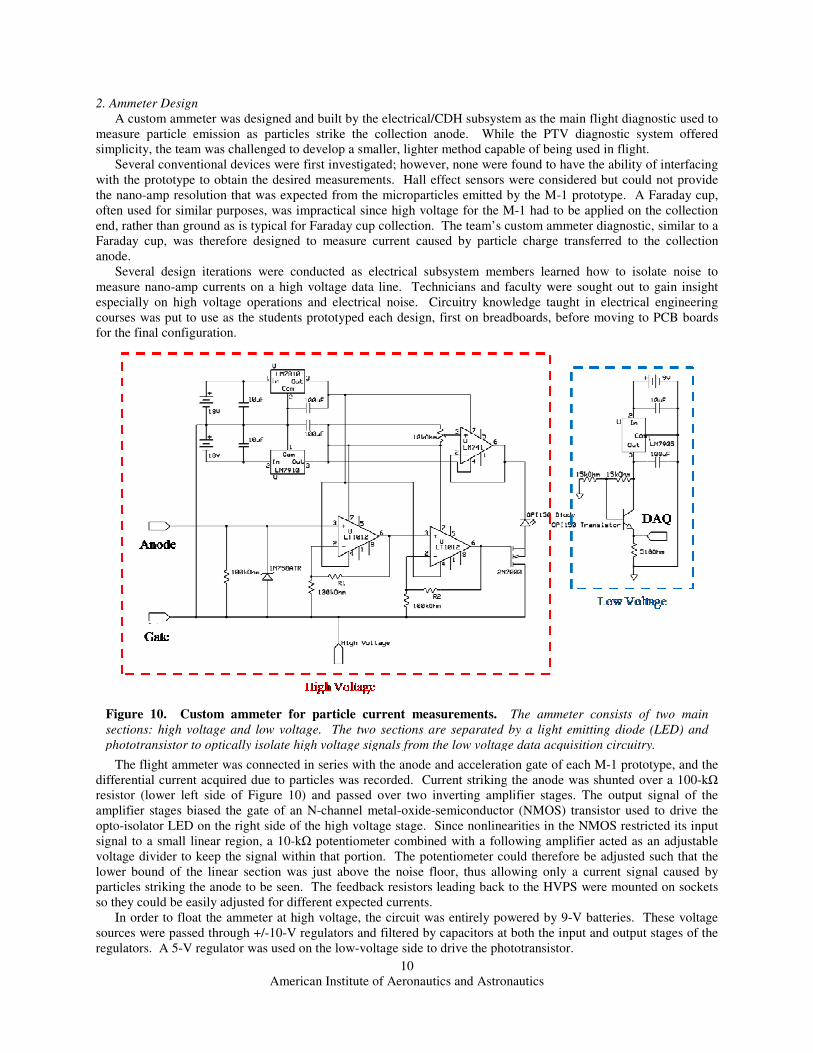
The flight ammeter was connected in series with the anode and acceleration gate of each M-1 prototype, and the
differential current acquired due to particles was recorded. Current striking the anode was shunted over a 100-kΩ
resistor (lower left side of Figure 10) and passed over two inverting amplifier stages. The output signal of the
amplifier stages biased the gate of an N-channel metal-oxide-semiconductor (NMOS) transistor used to drive the
opto-isolator LED on the right side of the high voltage stage. Since nonlinearities in the NMOS restricted its input
signal to a small linear region, a 10-kΩ potentiometer combined with a following amplifier acted as an adjustable
voltage divider to keep the signal within that portion. The potentiometer could therefore be adjusted such that the
lower bound of the linear section was just above the noise floor, thus allowing only a current signal caused by
particles striking the anode to be seen. The feedback resistors leading back to the HVPS were mounted on sockets
so they could be easily adjusted for different expected currents.
In order to float the ammeter at high voltage, the circuit was entirely powered by 9-V batteries. These voltage
sources were passed through +/-10-V regulators and filtered by capacitors at both the input and output stages of the
regulators. A 5-V regulator was used on the low-voltage side to drive the phototransistor.
Figure 10. Custom ammeter for particle current measurements. The ammeter consists of two main
sections: high voltage and low voltage. The two sections are separated by a light emitting diode (LED) and
phototransistor to optically isolate high voltage signals from the low voltage data acquisition circuitry.
American Institute of Aeronautics and Astronautics
11
3. Anode Deposition
The deposition on the prototypes’ anodes could be analyzed to determine beam characteristics. As particles
being exhausted by the M-1 impact the anode, they adhere to its surface. The beam’s divergence and uniformity
could then be ascertained by observing the anode deposition.
The anode material needed to have surface properties such that the majority of the particles striking its surface
were retained, thus reducing backsplash of particles that could interfere with those incoming. The anode needed to
be electrically conductive such that minimal variation in the electric field existed between the anode and the
accelerating gate. This condition meant that in vacuum, particle velocities should remain constant between the gate
and the anode. Once the particles were collected on the anode, the deposition could be analyzed using both an
optical microscope and a scanning electron microscope (SEM). The optical microscope provides a more global
view of the anode deposition while the SEM allowed a close-up, detailed view providing insight on particle layering.
The M-1 prototype implemented mirror-finished stainless steel for the anode. The mirror-finish was chosen for
the anode over the standard stainless steel used for the accelerating gate to ensure the surface was flat, uniform, and
clean during prototype operation. Future prototype designs may consider applying a coating to the anode to improve
particle adhesion.
D. Automation Code and Data Acquisition
Reduced gravity testing presents a unique environment for equipment operation and to the human body. To
ensure data was achieved as consistently in flight as it was on the ground, experiment operation and data collection
were streamlined using a LabVIEW automation program written by a ZESTT team member. The intent of this
program was to minimize action needed by the flyers in case they became incapable of operating the experiment due
to illness or other extenuating circumstances.
1. Graphical User Interface Organization
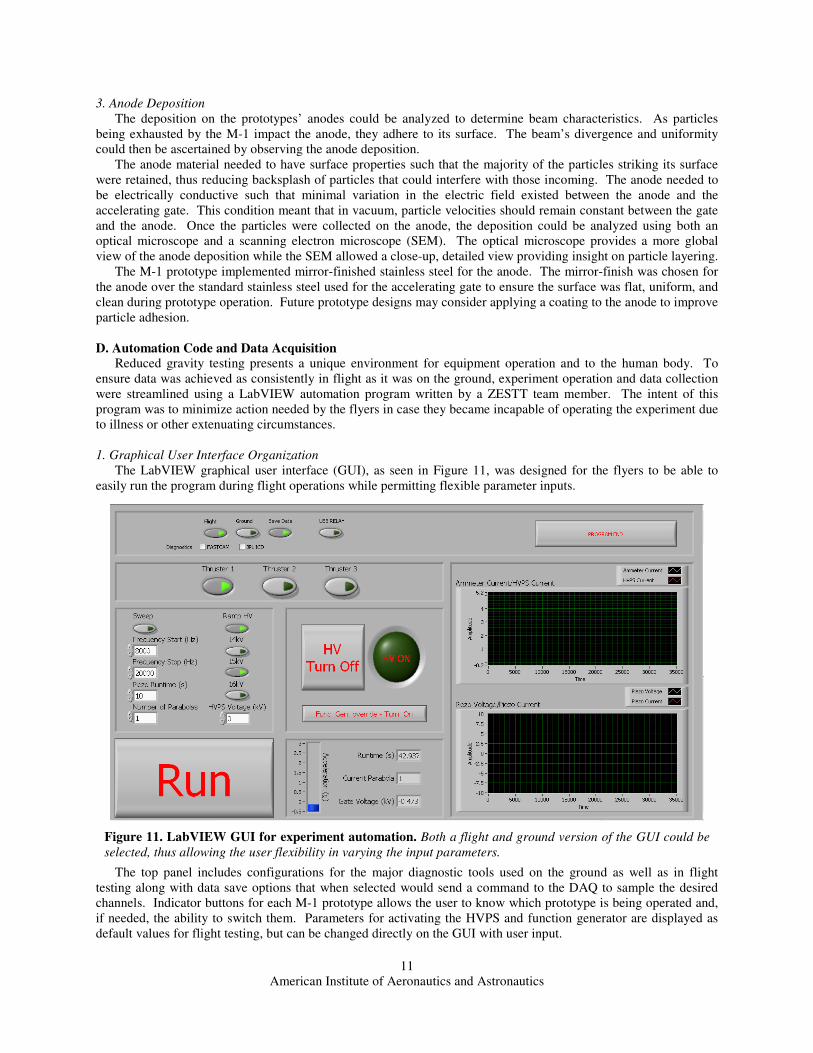
The LabVIEW graphical user interface (GUI), as seen in Figure 11, was designed for the flyers to be able to
easily run the program during flight operations while permitting flexible parameter inputs.
The top panel includes configurations for the major diagnostic tools used on the ground as well as in flight
testing along with data save options that when selected would send a command to the DAQ to sample the desired
channels. Indicator buttons for each M-1 prototype allows the user to know which prototype is being operated and,
if needed, the ability to switch them. Parameters for activating the HVPS and function generator are displayed as
default values for flight testing, but can be changed directly on the GUI with user input.
Figure 11. LabVIEW GUI for experiment automation. Both a flight and ground version of the GUI could be
selected, thus allowing the user flexibility in varying the input parameters.
American Institute of Aeronautics and Astronautics
12
A virtual LED is included to indicate when the high voltage is being recorded. Flight acceleration, runtime
during the current microgravity parabola, and HVPS-sourced voltage are provided on the GUI to allow the flyers to
monitor flight and M-1 conditions. During ground testing, no acceleration signal is present, and therefore the
function generator override button (center of the GUI) allows the user to manually engage the piezoelectric. This
override was also available during flight (but was never needed) had the aircraft’s accelerometer signal been too
noisy to provide proper triggering.
Plots of the data collected by the DAQ allowed flyers to monitor the ammeter and HVPS-supplied current as
well as the piezoelectric voltage and current for the active M-1 prototype in real-time. The “Run” button initiates
HVPS and function generator output as well as the data collection. Once pressed, this button reverts to a “Stop”
button that serves as the automation master kill switch.
2. Experiment Automation and Data Collection Scheme
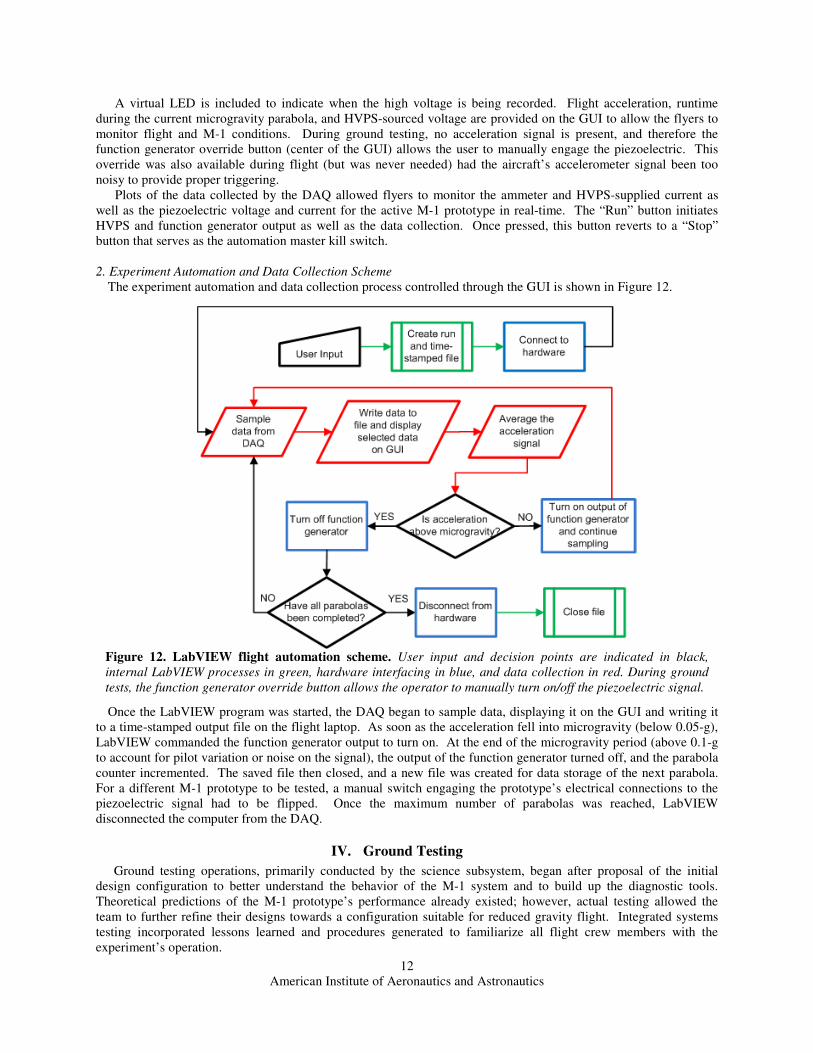
The experiment automation and data collection process controlled through the GUI is shown in Figure 12.
Once the LabVIEW program was started, the DAQ began to sample data, displaying it on the GUI and writing it
to a time-stamped output file on the flight laptop. As soon as the acceleration fell into microgravity (below 0.05-g),
LabVIEW commanded the function generator output to turn on. At the end of the microgravity period (above 0.1-g
to account for pilot variation or noise on the signal), the output of the function generator turned off, and the parabola
counter incremented. The saved file then closed, and a new file was created for data storage of the next parabola.
For a different M-1 prototype to be tested, a manual switch engaging the prototype’s electrical connections to the
piezoelectric signal had to be flipped. Once the maximum number of parabolas was reached, LabVIEW
disconnected the computer from the DAQ.
IV. Ground Testing
Ground testing operations, primarily conducted by the science subsystem, began after proposal of the initial
design configuration to better understand the behavior of the M-1 system and to build up the diagnostic tools.
Theoretical predictions of the M-1 prototype’s performance already existed; however, actual testing allowed the
team to further refine their designs towards a configuration suitable for reduced gravity flight. Integrated systems
testing incorporated lessons learned and procedures generated to familiarize all flight crew members with the
experiment’s operation.
Figure 12. LabVIEW flight automation scheme. User input and decision points are indicated in black,
internal LabVIEW processes in green, hardware interfacing in blue, and data collection in red. During ground
tests, the function generator override button allows the operator to manually turn on/off the piezoelectric signal.
American Institute of Aeronautics and Astronautics
13
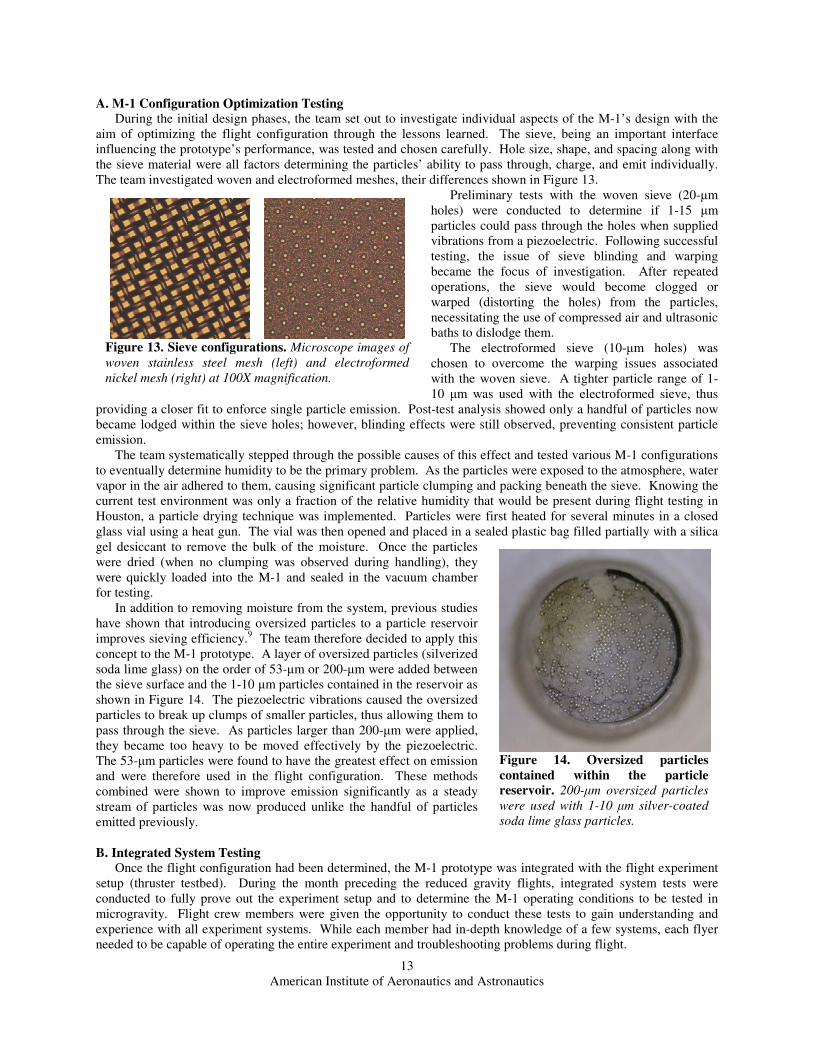
A. M-1 Configuration Optimization Testing
During the initial design phases, the team set out to investigate individual aspects of the M-1’s design with the
aim of optimizing the flight configuration through the lessons learned. The sieve, being an important interface
influencing the prototype’s performance, was tested and chosen carefully. Hole size, shape, and spacing along with
the sieve material were all factors determining the particles’ ability to pass through, charge, and emit individually.
The team investigated woven and electroformed meshes, their differences shown in Figure 13.
Preliminary tests with the woven sieve (20-µm
holes) were conducted to determine if 1-15 µm
particles could pass through the holes when supplied
vibrations from a piezoelectric. Following successful
testing, the issue of sieve blinding and warping
became the focus of investigation. After repeated
operations, the sieve would become clogged or
warped (distorting the holes) from the particles,
necessitating the use of compressed air and ultrasonic
baths to dislodge them.
The electroformed sieve (10-µm holes) was
chosen to overcome the warping issues associated
with the woven sieve. A tighter particle range of 1-
10 µm was used with the electroformed sieve, thus
providing a closer fit to enforce single particle emission. Post-test analysis showed only a handful of particles now
became lodged within the sieve holes; however, blinding effects were still observed, preventing consistent particle
emission.
The team systematically stepped through the possible causes of this effect and tested various M-1 configurations
to eventually determine humidity to be the primary problem. As the particles were exposed to the atmosphere, water
vapor in the air adhered to them, causing significant particle clumping and packing beneath the sieve. Knowing the
current test environment was only a fraction of the relative humidity that would be present during flight testing in
Houston, a particle drying technique was implemented. Particles were first heated for several minutes in a closed
glass vial using a heat gun. The vial was then opened and placed in a sealed plastic bag filled partially with a silica
gel desiccant to remove the bulk of the moisture. Once the particles
were dried (when no clumping was observed during handling), they
were quickly loaded into the M-1 and sealed in the vacuum chamber
for testing.
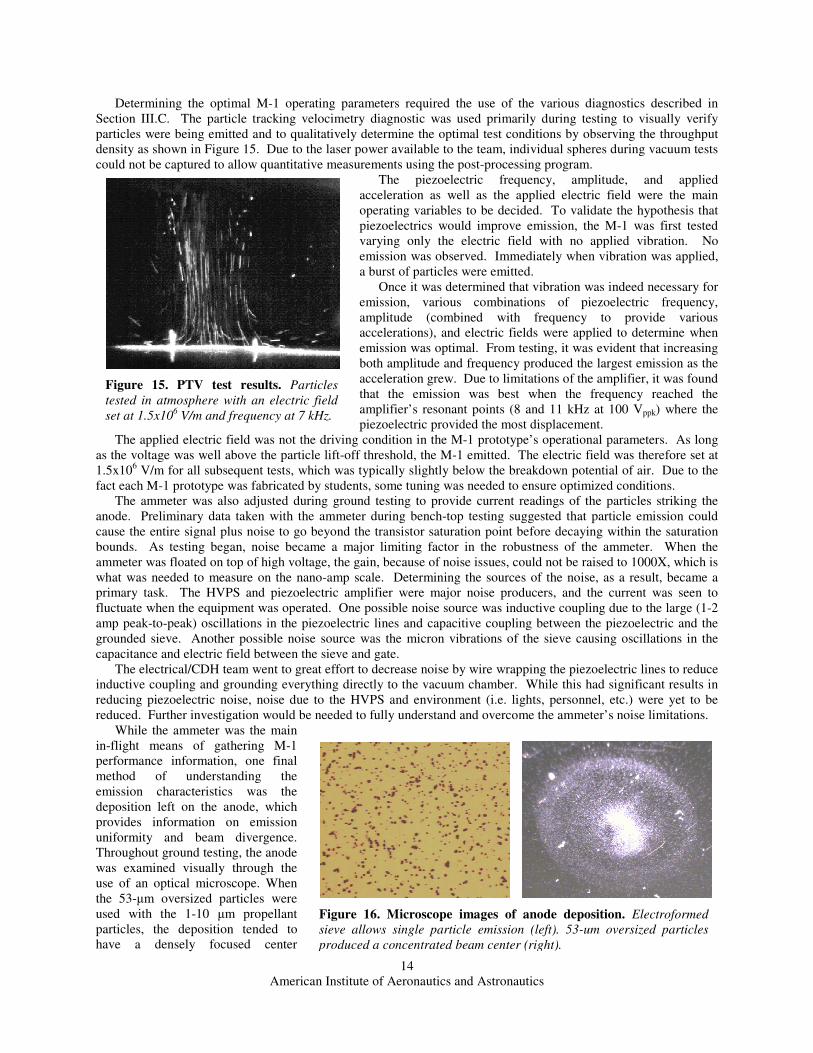
In addition to removing moisture from the system, previous studies
have shown that introducing oversized particles to a particle reservoir
improves sieving efficiency.9 The team therefore decided to apply this
concept to the M-1 prototype. A layer of oversized particles (silverized
soda lime glass) on the order of 53-µm or 200-µm were added between
the sieve surface and the 1-10 µm particles contained in the reservoir as
shown in Figure 14. The piezoelectric vibrations caused the oversized
particles to break up clumps of smaller particles, thus allowing them to
pass through the sieve. As particles larger than 200-µm were applied,
they became too heavy to be moved effectively by the piezoelectric.
The 53-µm particles were found to have the greatest effect on emission
and were therefore used in the flight configuration. These methods
combined were shown to improve emission significantly as a steady
stream of particles was now produced unlike the handful of particles
emitted previously.
B. Integrated System Testing
Once the flight configuration had been determined, the M-1 prototype was integrated with the flight experiment
setup (thruster testbed). During the month preceding the reduced gravity flights, integrated system tests were
conducted to fully prove out the experiment setup and to determine the M-1 operating conditions to be tested in
microgravity. Flight crew members were given the opportunity to conduct these tests to gain understanding and
experience with all experiment systems. While each member had in-depth knowledge of a few systems, each flyer
needed to be capable of operating the entire experiment and troubleshooting problems during flight.
Figure 14. Oversized particles
contained within the particle
reservoir. 200-µm oversized particles
were used with 1-10 µm silver-coated
soda lime glass particles.
Figure 13. Sieve configurations. Microscope images of
woven stainless steel mesh (left) and electroformed
nickel mesh (right) at 100X magnification.
American Institute of Aeronautics and Astronautics
14
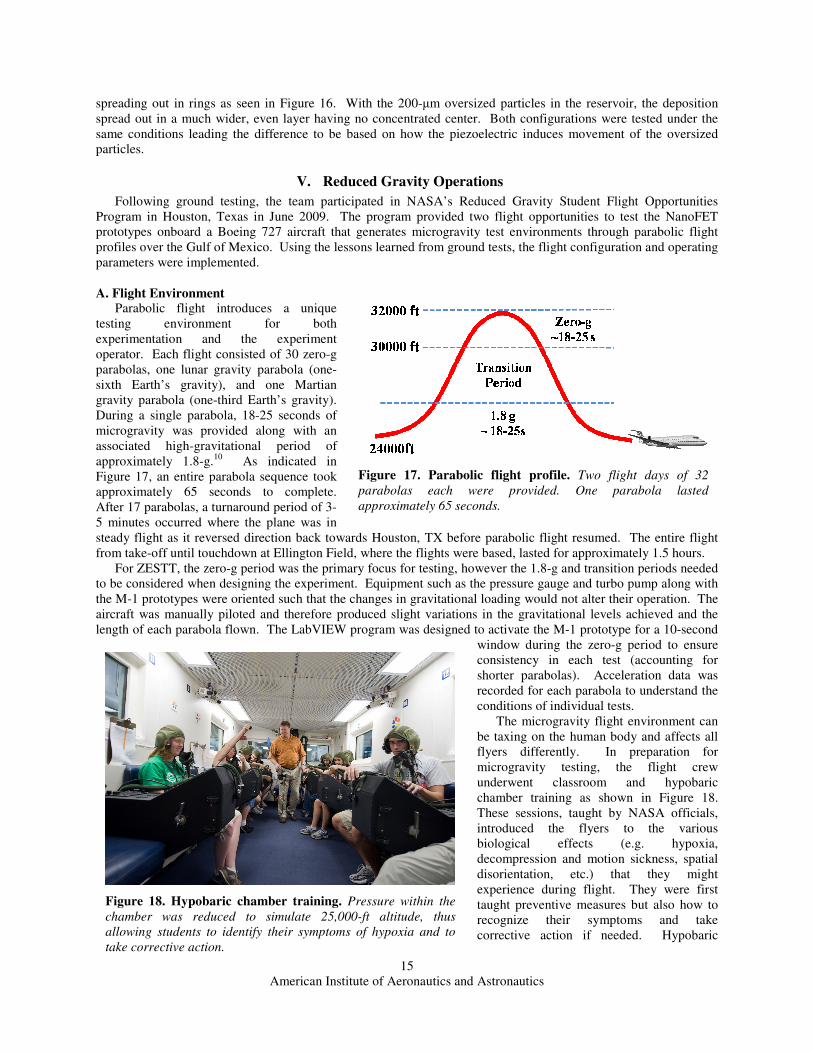
Determining the optimal M-1 operating parameters required the use of the various diagnostics described in
Section III.C. The particle tracking velocimetry diagnostic was used primarily during testing to visually verify
particles were being emitted and to qualitatively determine the optimal test conditions by observing the throughput
density as shown in Figure 15. Due to the laser power available to the team, individual spheres during vacuum tests
could not be captured to allow quantitative measurements using the post-processing program.
The piezoelectric frequency, amplitude, and applied
acceleration as well as the applied electric field were the main
operating variables to be decided. To validate the hypothesis that
piezoelectrics would improve emission, the M-1 was first tested
varying only the electric field with no applied vibration. No
emission was observed. Immediately when vibration was applied,
a burst of particles were emitted.
Once it was determined that vibration was indeed necessary for
emission, various combinations of piezoelectric frequency,
amplitude (combined with frequency to provide various
accelerations), and electric fields were applied to determine when
emission was optimal. From testing, it was evident that increasing
both amplitude and frequency produced the largest emission as the
acceleration grew. Due to limitations of the amplifier, it was found
that the emission was best when the frequency reached the
amplifier’s resonant points (8 and 11 kHz at 100 Vppk) where the
piezoelectric provided the most displacement.
The applied electric field was not the driving condition in the M-1 prototype’s operational parameters. As long
as the voltage was well above the particle lift-off threshold, the M-1 emitted. The electric field was therefore set at
1.5x10⁶ V/m for all subsequent tests, which was typically slightly below the breakdown potential of air. Due to the
fact each M-1 prototype was fabricated by students, some tuning was needed to ensure optimized conditions.
The ammeter was also adjusted during ground testing to provide current readings of the particles striking the
anode. Preliminary data taken with the ammeter during bench-top testing suggested that particle emission could
cause the entire signal plus noise to go beyond the transistor saturation point before decaying within the saturation
bounds. As testing began, noise became a major limiting factor in the robustness of the ammeter. When the
ammeter was floated on top of high voltage, the gain, because of noise issues, could not be raised to 1000X, which is
what was needed to measure on the nano-amp scale. Determining the sources of the noise, as a result, became a
primary task. The HVPS and piezoelectric amplifier were major noise producers, and the current was seen to
fluctuate when the equipment was operated. One possible noise source was inductive coupling due to the large (1-2
amp peak-to-peak) oscillations in the piezoelectric lines and capacitive coupling between the piezoelectric and the
grounded sieve. Another possible noise source was the micron vibrations of the sieve causing oscillations in the
capacitance and electric field between the sieve and gate.
The electrical/CDH team went to great effort to decrease noise by wire wrapping the piezoelectric lines to reduce
inductive coupling and grounding everything directly to the vacuum chamber. While this had significant results in
reducing piezoelectric noise, noise due to the HVPS and environment (i.e. lights, personnel, etc.) were yet to be
reduced. Further investigation would be needed to fully understand and overcome the ammeter’s noise limitations.
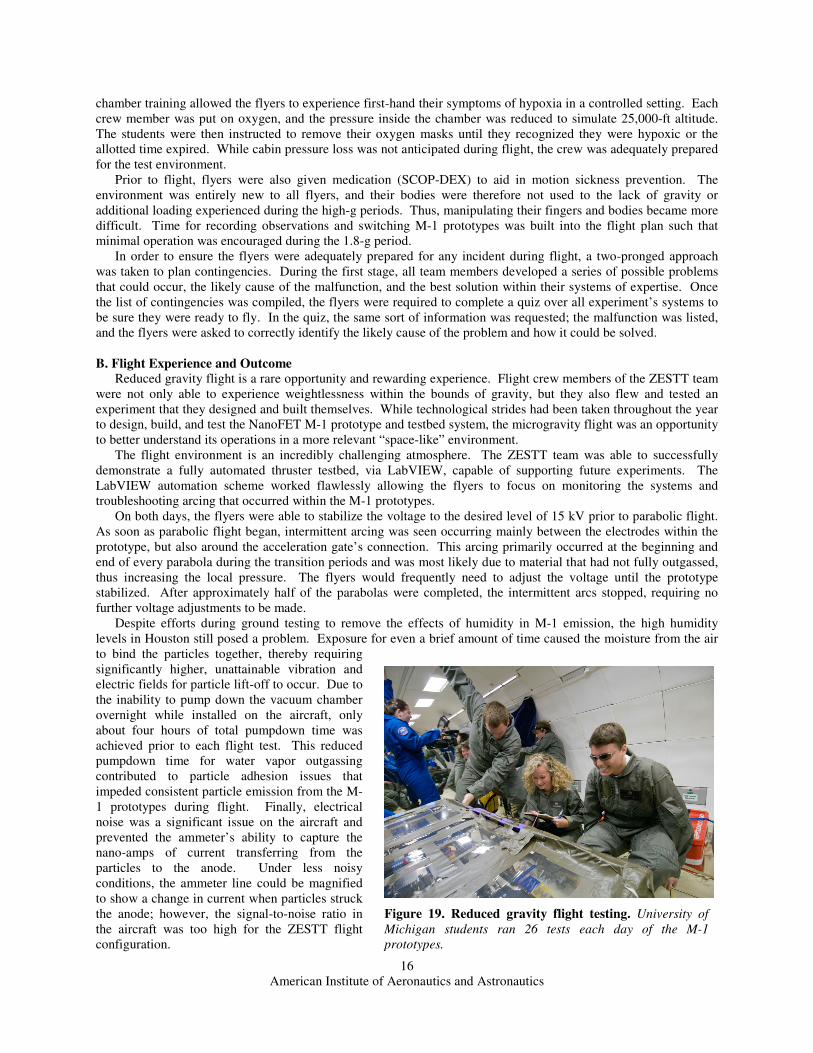
While the ammeter was the main
in-flight means of gathering M-1
performance information, one final
method of understanding the
emission characteristics was the
deposition left on the anode, which
provides information on emission
uniformity and beam divergence.
Throughout ground testing, the anode
was examined visually through the
use of an optical microscope. When
the 53-µm oversized particles were
used with the 1-10 µm propellant
particles, the deposition tended to
have a densely focused center
Figure 15. PTV test results. Particles
tested in atmosphere with an electric field
set at 1.5x10⁶ V/m and frequency at 7 kHz.
Figure 16. Microscope images of anode deposition. Electroformed
sieve allows single particle emission (left). 53-um oversized particles
produced a concentrated beam center (right).
American Institute of Aeronautics and Astronautics
15
spreading out in rings as seen in Figure 16. With the 200-µm oversized particles in the reservoir, the deposition
spread out in a much wider, even layer having no concentrated center. Both configurations were tested under the
same conditions leading the difference to be based on how the piezoelectric induces movement of the oversized
particles.
V. Reduced Gravity Operations
Following ground testing, the team participated in NASA’s Reduced Gravity Student Flight Opportunities
Program in Houston, Texas in June 2009. The program provided two flight opportunities to test the NanoFET
prototypes onboard a Boeing 727 aircraft that generates microgravity test environments through parabolic flight
profiles over the Gulf of Mexico. Using the lessons learned from ground tests, the flight configuration and operating
parameters were implemented.
A. Flight Environment Parabolic flight introduces a unique
testing environment for both
experimentation and the experiment
operator. Each flight consisted of 30 zero-g
parabolas, one lunar gravity parabola (one-
sixth Earth’s gravity), and one Martian
gravity parabola (one-third Earth’s gravity).
During a single parabola, 18-25 seconds of
microgravity was provided along with an
associated high-gravitational period of
approximately 1.8-g.10
As indicated in
Figure 17, an entire parabola sequence took
approximately 65 seconds to complete.
After 17 parabolas, a turnaround period of 3-
5 minutes occurred where the plane was in
steady flight as it reversed direction back towards Houston, TX before parabolic flight resumed. The entire flight
from take-off until touchdown at Ellington Field, where the flights were based, lasted for approximately 1.5 hours.
For ZESTT, the zero-g period was the primary focus for testing, however the 1.8-g and transition periods needed
to be considered when designing the experiment. Equipment such as the pressure gauge and turbo pump along with
the M-1 prototypes were oriented such that the changes in gravitational loading would not alter their operation. The
aircraft was manually piloted and therefore produced slight variations in the gravitational levels achieved and the
length of each parabola flown. The LabVIEW program was designed to activate the M-1 prototype for a 10-second
window during the zero-g period to ensure
consistency in each test (accounting for
shorter parabolas). Acceleration data was
recorded for each parabola to understand the
conditions of individual tests.
The microgravity flight environment can
be taxing on the human body and affects all
flyers differently. In preparation for
microgravity testing, the flight crew
underwent classroom and hypobaric
chamber training as shown in Figure 18.
These sessions, taught by NASA officials,
introduced the flyers to the various
biological effects (e.g. hypoxia,
decompression and motion sickness, spatial
disorientation, etc.) that they might
experience during flight. They were first
taught preventive measures but also how to
recognize their symptoms and take
corrective action if needed. Hypobaric
Figure 17. Parabolic flight profile. Two flight days of 32
parabolas each were provided. One parabola lasted
approximately 65 seconds.
Figure 18. Hypobaric chamber training. Pressure within the
chamber was reduced to simulate 25,000-ft altitude, thus
allowing students to identify their symptoms of hypoxia and to
take corrective action.
American Institute of Aeronautics and Astronautics
16
chamber training allowed the flyers to experience first-hand their symptoms of hypoxia in a controlled setting. Each
crew member was put on oxygen, and the pressure inside the chamber was reduced to simulate 25,000-ft altitude.
The students were then instructed to remove their oxygen masks until they recognized they were hypoxic or the
allotted time expired. While cabin pressure loss was not anticipated during flight, the crew was adequately prepared
for the test environment.
Prior to flight, flyers were also given medication (SCOP-DEX) to aid in motion sickness prevention. The
environment was entirely new to all flyers, and their bodies were therefore not used to the lack of gravity or
additional loading experienced during the high-g periods. Thus, manipulating their fingers and bodies became more
difficult. Time for recording observations and switching M-1 prototypes was built into the flight plan such that
minimal operation was encouraged during the 1.8-g period.
In order to ensure the flyers were adequately prepared for any incident during flight, a two-pronged approach
was taken to plan contingencies. During the first stage, all team members developed a series of possible problems
that could occur, the likely cause of the malfunction, and the best solution within their systems of expertise. Once
the list of contingencies was compiled, the flyers were required to complete a quiz over all experiment’s systems to
be sure they were ready to fly. In the quiz, the same sort of information was requested; the malfunction was listed,
and the flyers were asked to correctly identify the likely cause of the problem and how it could be solved.
B. Flight Experience and Outcome
Reduced gravity flight is a rare opportunity and rewarding experience. Flight crew members of the ZESTT team
were not only able to experience weightlessness within the bounds of gravity, but they also flew and tested an
experiment that they designed and built themselves. While technological strides had been taken throughout the year
to design, build, and test the NanoFET M-1 prototype and testbed system, the microgravity flight was an opportunity
to better understand its operations in a more relevant “space-like” environment.
The flight environment is an incredibly challenging atmosphere. The ZESTT team was able to successfully
demonstrate a fully automated thruster testbed, via LabVIEW, capable of supporting future experiments. The
LabVIEW automation scheme worked flawlessly allowing the flyers to focus on monitoring the systems and
troubleshooting arcing that occurred within the M-1 prototypes.
On both days, the flyers were able to stabilize the voltage to the desired level of 15 kV prior to parabolic flight.
As soon as parabolic flight began, intermittent arcing was seen occurring mainly between the electrodes within the
prototype, but also around the acceleration gate’s connection. This arcing primarily occurred at the beginning and
end of every parabola during the transition periods and was most likely due to material that had not fully outgassed,
thus increasing the local pressure. The flyers would frequently need to adjust the voltage until the prototype
stabilized. After approximately half of the parabolas were completed, the intermittent arcs stopped, requiring no
further voltage adjustments to be made.
Despite efforts during ground testing to remove the effects of humidity in M-1 emission, the high humidity
levels in Houston still posed a problem. Exposure for even a brief amount of time caused the moisture from the air
to bind the particles together, thereby requiring
significantly higher, unattainable vibration and
electric fields for particle lift-off to occur. Due to
the inability to pump down the vacuum chamber
overnight while installed on the aircraft, only
about four hours of total pumpdown time was
achieved prior to each flight test. This reduced
pumpdown time for water vapor outgassing
contributed to particle adhesion issues that
impeded consistent particle emission from the M-
1 prototypes during flight. Finally, electrical
noise was a significant issue on the aircraft and
prevented the ammeter’s ability to capture the
nano-amps of current transferring from the
particles to the anode. Under less noisy
conditions, the ammeter line could be magnified
to show a change in current when particles struck
the anode; however, the signal-to-noise ratio in
the aircraft was too high for the ZESTT flight
configuration.
Figure 19. Reduced gravity flight testing. University of
Michigan students ran 26 tests each day of the M-1
prototypes.
American Institute of Aeronautics and Astronautics
17
While the team put forth a strong effort to plan for contingencies, the issues that occurred during flight testing
limited the useable experimental data that could be gathered. The lessons learned through the experience, however,
have provided greater insight into flight operations and will be implemented in future NanoFET designs.
Conducting an experiment in reduced gravity provided each flyer with a unique flight experience that they will carry
with them into their professional careers.
VI. ZESTT Project Benefits
While technology development drove the ZESTT project, the educational experience was also important. The
technical and personal lessons learned were unique to each individual and significantly contributed to their academic
development. Transferring their engineering drive and experience, ZESTT students sought to inspire younger
students to enter STEM (science, technology, engineering, and mathematics) fields.
1. Educational Benefits
Student development was an important aspect of the ZESTT project. The project’s aim was to enhance the
lessons that all team members have learned from their formal classroom training by providing a hands-on, fast-paced
experience with real-world engineering. In addition, each student was exposed to various fields (e.g. vacuum
systems, high voltage, electric propulsion, etc.) not commonly taught in the undergraduate curriculum.
Working on ZESTT was not only a great experience for students to take part in working on something new and
exciting, but it also provided them with real, first-hand engineering experience. For many students, this was their
first in-depth exposure to all stages of the design-build-test-fly cycle, and for some students, this was their first
engineering team. Those with prior experience took on leadership positions. These students learned the importance
of task delegation, decision making, conflict resolution, and mentoring their fellow team members to bring them to a
level where they could complete the job. Younger team members focused on specific areas to develop their
technical skills as they experienced the full project cycle.
Teamwork and communication were some of the most important skills ZESTT members gained over the course
of the year. While sometimes frustrating, constant design modifications were necessary to produce a well-refined
product compliant with all requirements and objectives. Once the design was created, team members had to learn
how to fabricate it, often incorporating modifications as they understood their own fabrication capabilities. Team
members involved in testing discovered needed improvements for each design iteration. Communicating
specifically what needed to be done was critical in preparation for flight. Students learned how to be flexible and
quickly adjust when problems or changes arose.
The benefits of the ZESTT project are numerous and extend far beyond those of a typical extra-curricular
activity. The complex project provided a challenging atmosphere for student growth. ZESTT placed high demands
on each individual as they worked to meet deadlines while taking classes full-time. The lessons learned and skills
gained, however, provided these undergraduate students with a solid foundation and introduction to the professional
world.
2. Outreach
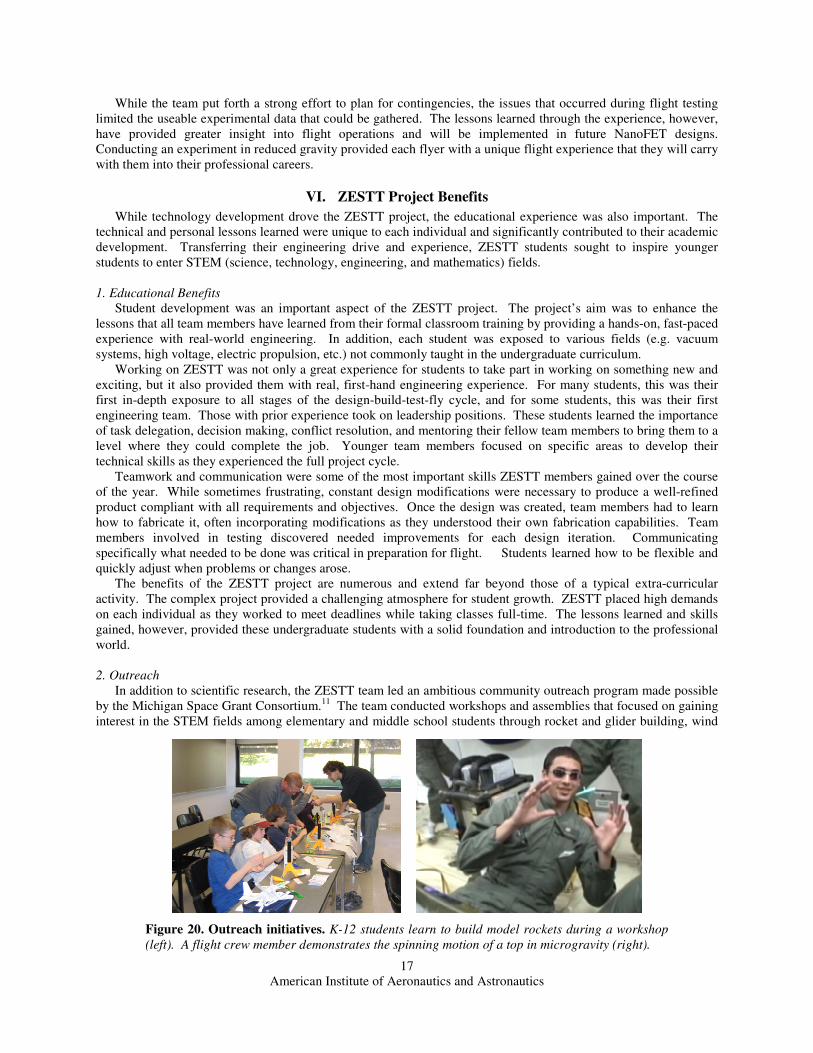
In addition to scientific research, the ZESTT team led an ambitious community outreach program made possible
by the Michigan Space Grant Consortium.11
The team conducted workshops and assemblies that focused on gaining
interest in the STEM fields among elementary and middle school students through rocket and glider building, wind
Figure 20. Outreach initiatives. K-12 students learn to build model rockets during a workshop
(left). A flight crew member demonstrates the spinning motion of a top in microgravity (right).
American Institute of Aeronautics and Astronautics
18
tunnel tours, and other activities. The workshops were expanded upon those previously given to include more
multidisciplinary engineering and teambuilding activities. Assemblies were also conducted for grade-school
children. These assemblies consisted of three main components: a video produced by the team showing past
experiments and talking about microgravity, a discussion about engineering and sciences, and a few interactive and
educational games in which students could take part. Each assembly was tuned to the needs of the school and
location giving it a life of its own.
This year, the team began working with a local museum to create an interactive hands-on exhibit to expand the
audience that could be reached. The exhibit would provide both students and their parents with a unique experience
that teaches them fundamentals about space. Due to time and resources, the exhibit was not produced; however, the
fundamental research and designs could be used in the coming years to complete the project.
A major portion of the team’s outreach initiatives was a secondary outreach competition, which gave K-12
students the opportunity to design their own mini-experiment to be flown in microgravity. The team dedicated two
parabolas to fly the chosen experiments. The nature of this experiment, to showcase interesting behavior in
microgravity, was proposed by the students who attended the workshops and assemblies. The chosen ideas included
demonstrating the gyroscopic motion of a spinning top and the precession of a yo-yo in the weightless environment.
Both experiments were videotaped to be shared with the students.
VII. Conclusion
The ZESTT project has successfully combined technical research with education to positively impact the future,
laying the groundwork for future teams to come. Students involved in the project were able to fully experience a
design-build-test-fly cycle fulfilling S3FL’s objectives and further instilling the skills learned within the classroom.
While quantitative data was not obtained during either reduced gravity flight, a vacuum testbed was implemented
with proven automation providing the means for sustaining future microgravity flights. The lessons learned can be
applied as NanoFET continues to develop.
The team accepted a challenging set of objectives at the start of the year. Not only was the first full operational
NanoFET prototype containing a piezoelectric feed system developed, but the diagnostic tools to be able to analyze
its performance were also created. Great strides have been taken to understand the dynamics of the M-1 prototype
in an effort to validate NanoFET performance models. Extensive ground testing prior to flight aided in the
optimization of the M-1 design. The changes throughout the year were well documented and tracked to ensure
improvements were made in the next NanoFET iteration.
Student growth and outreach were essential within the educational environment introduced through involvement
with S3FL. The ZESTT team successfully completed all educational objectives to ensure the team’s growth was
stimulated and progress was tracked. Team members developed a wide variety of skills throughout the year. Some
gained leadership skills learning how to manage subsystem teams, while others focused more on improving their
technical abilities such as learning software packages including SolidWorks, MATLAB, and COMSOL
Multiphysics.
Managing the team was aided through the use of subsystems (structures/mechanisms, science, electrical/CDH,
business, and outreach). Each subsystem had their own set of objectives allowing individuals to focus closely on
specific aspects while the leads from each group formed the systems/operations team to integrate the team’s work.
Structures/mechanisms team members learned how to first design the M-1 prototype, modeling and verifying the
integrity of their designs before fabricating it. Those on the science team learned how to systematically test a design
handed to them by another subsystem as well as to conduct some of the fundamental research that supported the
science behind the initial design. NanoFET challenged the electrical/CDH subsystem to expand their knowledge of
circuitry and programming.
The business and outreach teams were comprised of a collection of students from each of the three before-
mentioned subsystems. These members were not only challenged technically, but they also learned how to interact
with potential sponsors and K-12 students. Each team members participated in the outreach activities providing
“beyond the formal classroom learning” opportunities that opened the eyes of many K-12 students to engineering
and technology.
All team members learned the importance of communication. Meetings between the subsystem leads and
management provided a forum for everyone to learn about various aspects of the other systems. In addition, an
online worksite provided the means for compiling procedures and lessons learned for all members to see. Design
reviews primarily set the milestones the team worked towards as they prepared for microgravity testing. Each
review allowed the students to communicate with professionals on what they had done and to receive feedback on
their designs.
American Institute of Aeronautics and Astronautics
19
Using the knowledge acquired through the ZESTT project and the work done over the course of the year,
NanoFET will continue to move forward. The M-1 design will continue to be improved upon as the NanoFET
prototypes move into the nanometer-sized particle regime. ZESTT has implemented a testbed in which new
NanoFET prototype designs can be investigated in the unique microgravity environment made available through
NASA’s Reduced Gravity Student Flight Opportunities Program. The experiences the students have gained as being
part of this project will carry with them in their future endeavors.
Acknowledgments
The ZESTT project was financially supported by the Michigan Space Grant Consortium (MSGC), Women in
Science and Engineering (WISE), and the University of Michigan (UM) College of Engineering. Special thanks go
to the ZESTT project team members including Theresa Biehle, Benjamin Brierty, Nicholas Ciarelli, Alexandra
Doan, Michelle Knapp, Phil Le, Huy Nguyen, Michael Ramirez, and Yuly Wung who made this project possible. In
addition, thanks go to Mark Stakhiv and Jeffrey Schloemer who were instrumental in the PTV diagnostic
development. ZESTT would like to thank NASA’s Reduced Gravity Office staff for providing the two microgravity
flight test opportunities and their help throughout the preparation process. Additional thanks go to the UM Student
Space Systems Fabrication Laboratory (S3FL) and the Plasmadynamics and Electric Propulsion Laboratory (PEPL)
for providing resources and support. The Space Physics Research Laboratory (SPRL), specifically Robb Gillespie
and Ken Arnett, provided valuable technical advice and resources. Finally, thanks go to the UM Aerospace
Engineering technical staff (Thomas Griffin and David McLean), Professor Peter Washabaugh (Aerospace), and
Michael Lee with the Wilson Student Project Center who were all especially instrumental during the experiment’s
fabrication.
References
1 Liu, T., Musinski, L., Patel, P., Gallimore, A., Gilchrist, B., and Keidar, M., “Nanoparticle Electric Propulsion
for Space Exploration,” in Space Technology and Applications International Forum − STAIF 2007, edited by M. S.
El-Genk, American Institute of Physics, Albuquerque, NM, 2007, pp. 787-94. 2 Morris, S., Drenkow, B., Liu, T., Biehle, T., Munski, J., Han, H., Swieringa, K., Martinchek, P., Knapp, M.,
Trabert, R., Wind, R., Brierty, B., Gilchrist, B., and Gallimore, A., “Reduced Gravity Testing of the Nanoparticle
Field Extraction Thruster Concept,” AIAA-2008-4995, 44th AIAA/ASME/SAE/ASEE Joint Propulsion Conference,
Hartford, CT, 21-23 July 2008. 3 Liu, T., Deline, C., Ramos, R., Sandoval, S., Smetana, A., Gilchrist, B., Washabaugh, P., and Renno, N., “The
Student Space Systems Fabrication Laboratory: An Approach to Space Systems Engineering Education,” ASEE-
2006-1917, 113th ASEE Conference, Chicago, IL, 18-21 June 2006. 4 Mankins, John. “Technology Readiness Levels: A White Paper”, Office of Space Access and Technology,
NASA, 1995. 5 Liu, T., Drenkow, B., Musinski, L., Gallimore, A., Gilchrist, B., Mirecki-Millunchick, J., Morris, D., Doan, A.,
Munski, J., and Muldoon, A., “Developmental Progress of the Nanoparticle Field Extraction Thruster,” AIAA-2008-
5096, 44th AIAA/ASME/SAE/ASEE Joint Propulsion Conference, Hartford, CT, 21-23 July 2008. 6 Musinski, L., Liu, T., Eu, I., Gilchrist, B., Gallimore, A., Millunchick, J., and Morris, D., “Nanoparticle Field
Extraction Thruster (NanoFET): Introduction to, Analysis of, and Experimental Results from the ‘No Liquid’
Configuration,” AIAA-2008-5097, 44th AIAA/ASME/SAE/ASEE Joint Propulsion Conference, Hartford, CT, 21-
23 July 2008. 7 Hein, K., Hucke, T., Stintz, M., and Ripperger, S., “Analysis of Adhesion Forces Between Particles and Walls
Based on the Vibration Method,” Part. Part. Syst. Charact., (2002). 8 Devasenathipathy, S., Santiago, J.G., Wereley, S.T., Meinhart, C.D., Takehara, K., “Particle imaging
techniques for microfabricated fluidic systems,” Experiments in Fluids, 34 (2003), pp. 504-514. 9 Liu, K., “Some factors effecting sieving performance and efficiency,” Powder Technology, 193 (2009), pp.
208-213. 10
Sopensky, E., “Trying out zero gravity,” Potentials, IEEE, Vol.17, No.3, pp.38-41, Aug/Sep 1998. 11
Liu, T., and Richards, B., “Saturday Aerospace Workshops,” Michigan in Space, Vol. 8, September 2005,
pp. 15-16.