determination of the solid-liquid phase diagram for...
TRANSCRIPT

University of Waterloo Chemical Engineering Department
ChE101: Chemical Engineering Concepts 2: Laboratory
Experiment #1:
Determination of the Solid-Liquid Phase Diagram for Naphthalene-Biphenyl Using Thermal Analysis
Hilary Lockie 20168263
Group #1 Hilary Lockie Performed: May 13th, 2005 Alvin Wan Submitted: May 24th, 2005 Adil Habib

1.0 INTRODUCTION 1.1 Objective: The purpose of this experiment is to use thermal analysis to study
naphthalene-biphenyl (two combined components) to determine the freezing point of the
system at atmospheric pressure. From the experiment, it will be possible to develop the
resulting solid-liquid phase diagram.
1.2 Theoretical Principles:
• Gibbs Phase Rule
The Gibbs phase rule is a method of calculating degrees of freedom of a system.
Degrees of freedom are the intensive properties (independent of system size) for the
system. The phase rule is given by the following equation:
π−+= cDF 2 (1)
where: DF = degrees of freedom (intensive properties)
c = number of chemical species
π = number of phases in the system
In a system with two components and two phases, like the naphthalene-biphenyl
mixture used in this lab, the degree of freedom is 2 (2 + 2 components – 2 phases).1
• Freezing Point
The freezing point of a solution indicates the point at which a solid begins to form as
the solution cools. This is a determined point that depends on the composition of the
solution.
• Lever Rule
The lever rule provides a method for finding the fraction of liquid and vapor (or solid,
in the case of this lab) in a two-phase, two-component system when the temperature
and pressure are known, as well as the overall composition.
The fraction of the masses of the phases is found through the following equation:
LF
FS
xxxx
SL
−−
= (2)
where: L and S are the mass of the liquid and solid phases, respectively
xS, xL and xF are the mass fractions of the solid phase, liquid phase
and total mixture
These are all calculated with respect to one component of the solution.1
• Phase Diagrams
Phase diagrams are graphs that give information on the equilibrium temperature and
pressure for a particular compound. The equilibria occur for the solid-liquid plateau,
liquid-vapor plateau and solid-vapor plateau. In this experiment, the phase diagram is
shown for the solid-liquid equilibrium point, and varies from 100% composition of
naphthalene to 100% composition of biphenyl. Further examples of this particular type of
phase diagram are in the ChE101 lab manual and in the preliminary report questions.
Theoretical phase diagrams can be developed from the following equation:
mKT ff =∆ (3)
where: ∆Tf is the freezing point depression
Kf is a proportionality constant
m is the molality (mol solute/kg solvent)1
• Cooling Curves (from the ChE101 lab manual)
Cooling curves have characteristics that are distinct:
(a) The rate of cooling lessens with time, since the cooling process releases heat from
the system. The curve will become less steep.
(b) A plateau occurs at the eutectic temperature (lowest possible for solidification). The
temperature stays constant until all of the liquid has solidified, at which time the solid
finishes cooling.
(c) A sudden dip and rise in temperature can occur from supercooling the liquid. The
solution cools below its normal freezing point and becomes unstable, so solidification is
sudden. This is avoidable by continuously stirring the liquid.
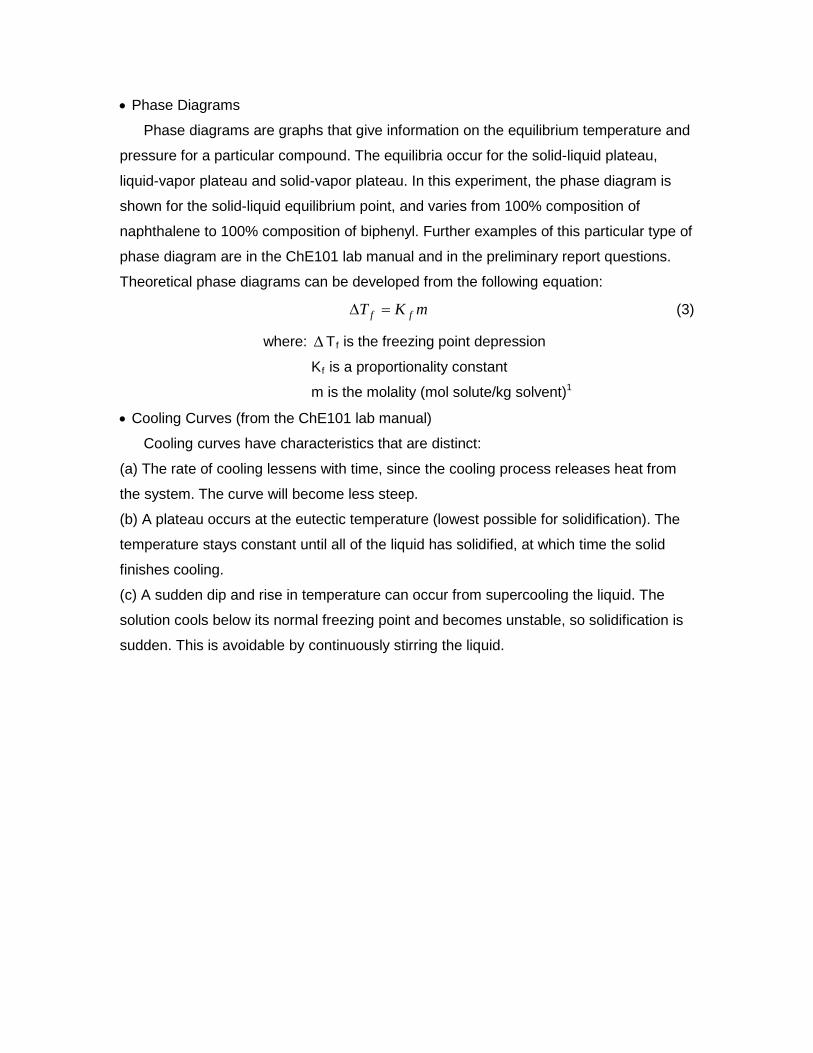
Test tube
Naphthalene-biphenyl mixture
H2O (boiling)
Hot plate
Beaker
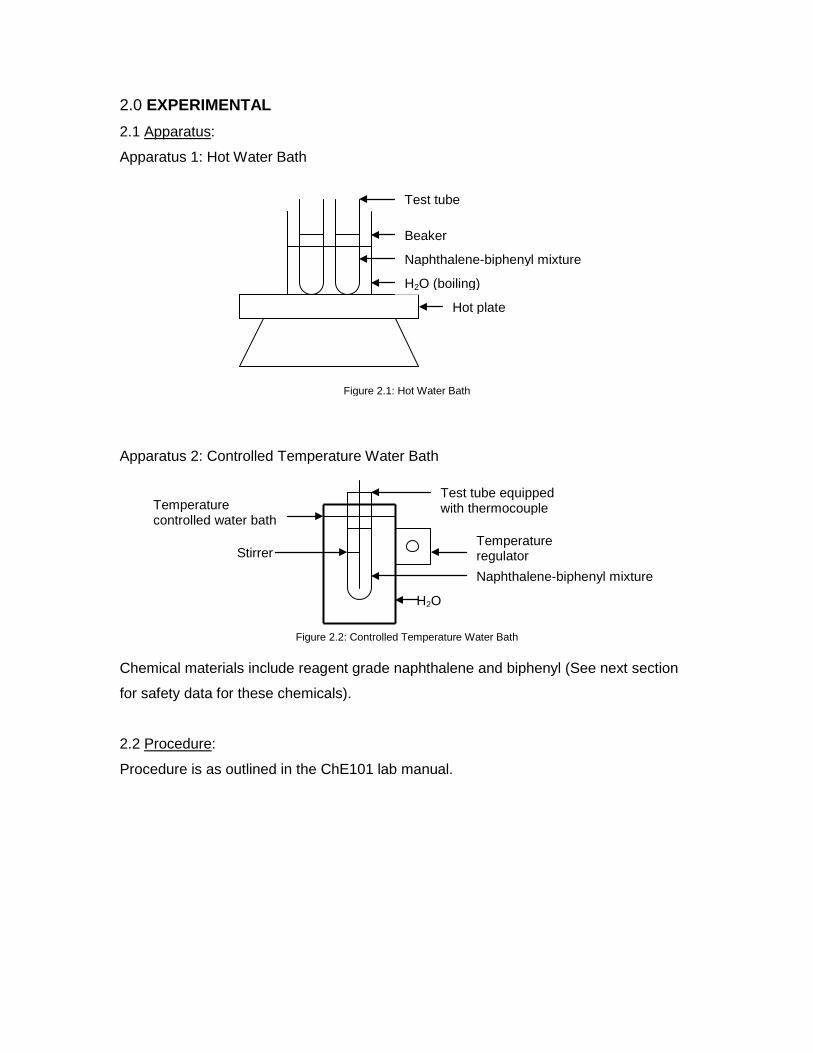
H2O
Test tube equipped with thermocouple
Temperature regulator Stirrer
Naphthalene-biphenyl mixture
Temperature controlled water bath
2.0 EXPERIMENTAL
2.1 Apparatus:
Apparatus 1: Hot Water Bath
Apparatus 2: Controlled Temperature Water Bath
Chemical materials include reagent grade naphthalene and biphenyl (See next section
for safety data for these chemicals).
2.2 Procedure:
Procedure is as outlined in the ChE101 lab manual.
Figure 2.1: Hot Water Bath
Figure 2.2: Controlled Temperature Water Bath

3.0 SAFETY 3.1 Biphenyl Major handling and hazard issues with biphenyl stem from its organic nature, and its
effect on the environment. Biphenyl is toxic to aquatic organisms and can cause long
term damage. This means that the chemical should be disposed of in an organic waste
container. It is also an irritant for the eyes, respiratory system and skin, so lab workers
should be cautious to avoid inhaling the fumes and should wear protective eyewear at all
times, and gloves when handling the chemical in potentially hazardous situations (i.e. if
the biphenyl is in an open container).
First aid procedures for contact with skin or eyes are to wash the area extensively
with large volumes of water. In the case of skin contact, soap is also recommended. In a
case of inhalation, remove the person to an area of fresh air. In case of ingestion, wash
mouth out with copious amounts of water and contact poison control.
3.2 Naphthalene
Naphthalene, like biphenyl, is very hazardous to the environment and should be
disposed of in an organic waste container. It is an irritant like biphenyl, to the eyes, skin
and respiratory system. Lab workers should be cautious to avoid inhaling fumes, and
should wear protective eyewear and gloves when handling the chemical.
First aid procedures are the same as with biphenyl. Poison control should be
contacted in cases of dermal contact, eye contact or ingestion. Area of contact should be
washed extensively with water and clothing should be disposed of in a safe manner.
Naphthalene has a flash point of 80°C, so it should be kept away from hot plates and
other areas of high heat. In case of a flare-up, the fire can be extinguished with water or
a fire extinguisher. The fumes from ignited naphthalene are toxic, so extreme care
should be taken to avoid fire.
3.3 Other Hazards
Other aspects of the experiment that could be potentially dangerous include the hot
water being used to heat the chemicals and the hot plate. Workers should be cautious to
keep hands well away from hot surfaces and mixtures, and should use appropriate
handling devices (gloves, test tube tongs, etc.) when necessary.
4.0 RESULTS AND DISCUSSION 4.1 Results:
Table 4.1: Composition of Naphthalene-Biphenyl for Each Test
Mixture Mass (g) Naphthalene
Mass (g) Biphenyl
Total Mass (g) Start Temperature (°C)
1 17 0 17 85 2 17 3 20 80 3 17 7 24 70 4 17 14 31 60 5 0 18 18 75 6 2 18 20 70 7 6 18 24 60 8 12 18 30 45
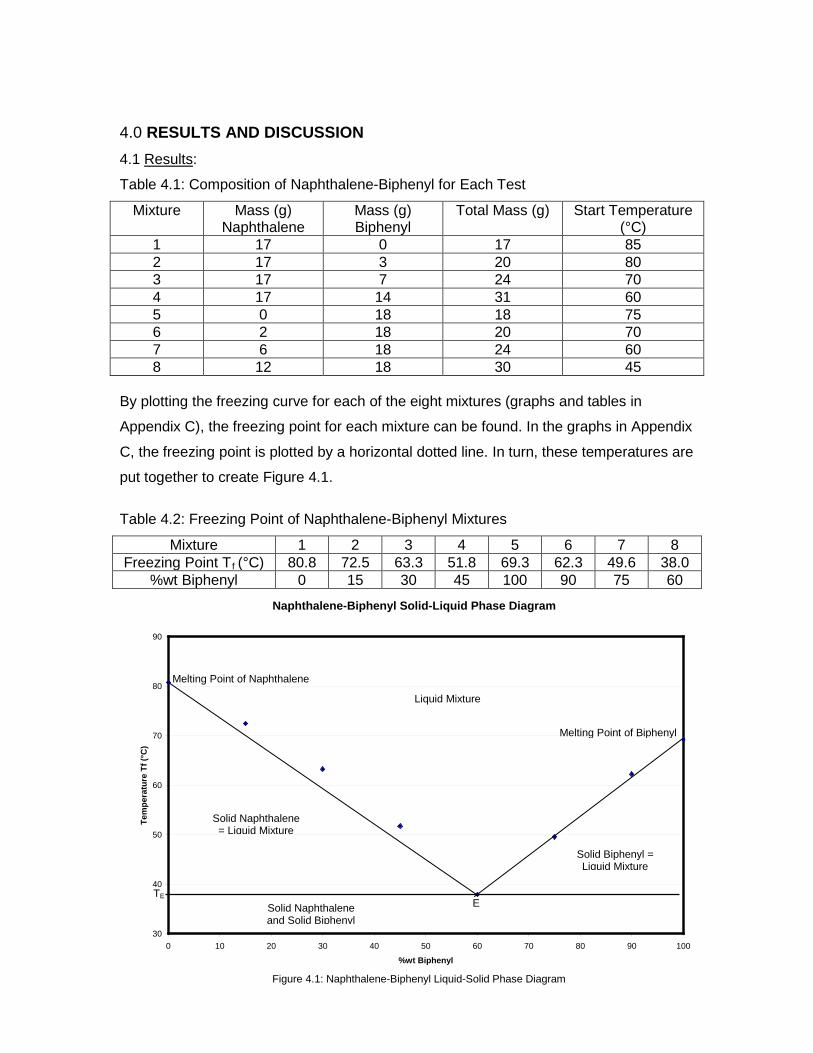
By plotting the freezing curve for each of the eight mixtures (graphs and tables in
Appendix C), the freezing point for each mixture can be found. In the graphs in Appendix
C, the freezing point is plotted by a horizontal dotted line. In turn, these temperatures are
put together to create Figure 4.1.
Table 4.2: Freezing Point of Naphthalene-Biphenyl Mixtures
Mixture 1 2 3 4 5 6 7 8 Freezing Point Tf (°C) 80.8 72.5 63.3 51.8 69.3 62.3 49.6 38.0
%wt Biphenyl 0 15 30 45 100 90 75 60
Figure 4.1: Naphthalene-Biphenyl Liquid-Solid Phase Diagram
Naphthalene-Biphenyl Solid-Liquid Phase Diagram
30
40
50
60
70
80
90
0 10 20 30 40 50 60 70 80 90 100
%wt Biphenyl
Tem
pera
ture
Tf (
°C)
Solid Naphthalene = Liquid Mixture
Solid Biphenyl = Liquid Mixture
Solid Naphthalene and Solid Biphenyl
Liquid Mixture
E TE
Melting Point of Naphthalene
Melting Point of Biphenyl
4.2 Discussion:
From this diagram, it can be shown that the melting point of naphthalene is
approximately 81°C and that of biphenyl is approximately 69.5°C. These values are quite
accurate compared to the sample data given, giving error of only about 1% from the data
table. From physical property tables, the actual melting point of naphthalene is 80.0°C1
and of biphenyl is 70°C2. This means the data gathered in the experiment are also
precise. The eutectic point was found to be 38°C. This was not as accurate as the
melting point temperatures (it was off by 2.3°C from the sample data). This difference
can be accounted for by experimental errors.
The difference between the freezing points plotted for 15%, 30% and 45% biphenyl
and the solid-liquid equilibrium line is larger than expected. This could be because the
experiment was halted prematurely for these mixtures, so the temperature was not as
low as it should have been. It is also possible that the compounds did not contain the
right percentage of biphenyl (this is discussed in Sources of Error), so the temperature
would be accurate for the amount of biphenyl the mixture contained. Mixture 4, in
particular, was stopped when the temperature began to drop at 0.1°C per second as
opposed to 0.2 - 0.3°C each second (Figure C1.4).
Overall, the results appear fairly precise. None of the values stray too far from the
fitted line of equilibrium. This can be used to conclude that there were no extreme errors
in calculations or measurements.
4.3 Sources of Error:
• There were a few sources of error in this experiment, but the largest source
involved the mixing of chemicals. Each time more biphenyl was added to the
compound, some residue was left in the plastic tray. Another aspect of this
occurred because, as the experiment progressed, the temperature was lowered.
This caused the solution, while in liquid form, to solidify on the upper portion of
the test tube. This inhibited the stirring and lessened the volume of the solution
that was being cooled to the freezing point.
• To accommodate for solution solidifying at the top of the test tube, it would be
useful to use either bigger test tubes or less substance so the test tube does not
become overfilled – and can therefore be completely submerged into the water
bath to above the level of the solution. This way, all of the solution melts each
time more solid chemical is added.
• Test tube tongs and a scale closer to the laboratory site would be beneficial for
safety concerns. Workers used bare hands (or latex gloved hands) to carry hot
test tube, increasing the risk of burns. Carrying chemicals across the room is also
potentially hazardous should one trip. A shorter distance minimizes that risk.
5.0 CONCLUSIONS • The solid-liquid phase diagram for naphthalene-biphenyl is shown in figure 4.1. It
reflects closely the sample data given, and the freezing points of both
components are precise to reference numbers.
• Error from loss of substance accounted partially for variances in points from the
melting (freezing) point line.
• The eutectic point calculated from this lab is approximately 38.0°C. Melting point
of biphenyl was calculated to be about 69.5°C and that of naphthalene was about
81°C.
6.0 REFERENCES 1. Felder and Rousseau, Elementary Principles of Chemical Processes (Third Edition),
Wiley, USA: 2000.
2. “Biphenyl,” http://en.wikipedia.org/wiki/Biphenyl, 27 Apr 2005, accessed 23 May 2005.
APPENDIX A
Sample Calculations
(PreLab Questions)
Cooling Curve for a Mixture of 17g Naphthalene and 3g Biphenyl
70
72
74
76
78
80
82
84
86
88
0 20 40 60 80 100 120 140 160 180 200 220 240
time (s)
tem
pera
ture
(°C
)
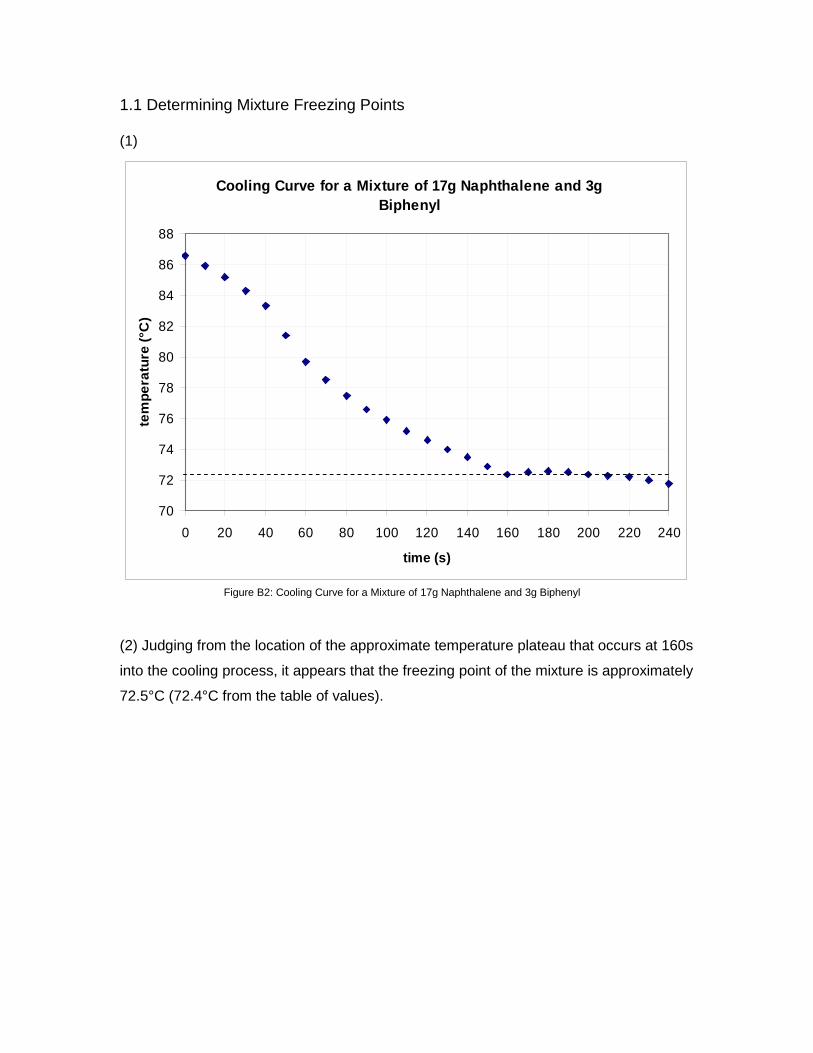
1.1 Determining Mixture Freezing Points
(1)
(2) Judging from the location of the approximate temperature plateau that occurs at 160s
into the cooling process, it appears that the freezing point of the mixture is approximately
72.5°C (72.4°C from the table of values).
Figure B2: Cooling Curve for a Mixture of 17g Naphthalene and 3g Biphenyl

Naphthalene-Biphenyl Solid-Liquid Phase Diagram
30
35
40
45
50
55
60
65
70
75
80
85
0 10 20 30 40 50 60 70 80 90 100
Weight Percent Biphenyl
Free
zing
Poi
nt T
f (°C
)
1.2 Generating the Naphthalene-Biphenyl Solid-Liquid Phase Diagram
(3)
(4) Lines AE and BE are freezing point curves. The freezing point for each chemical
(either naphthalene or biphenyl) lessens when more of the opposing chemical is added.
Point E is the eutectic point, the point at which the freezing point is the lowest for any
composition of the mixture. It occurs when there is 60% by weight of biphenyl (40%
naphthalene).
Below line BE and above line C, solid naphthalene can exist in equilibrium with the
liquid mixture of the two chemicals. This is true below the line AE and above line C for
solid biphenyl and the solution.
Above BEA, the chemicals exist in liquid phase only.
Below line C, the chemicals exist in solid phase only.
Line C is the temperature (40°C) at which solid biphenyl and solid naphthalene can
exist in equilibrium with the liquid mixture.
Melting Point of Naphthalene
Melting Point of Biphenyl
E
Solid Biphenyl ⇋ Liquid Mixture
Solid Naphthalene and Solid Biphenyl (no liquid)
A
B
C
Solid Naphthalene ⇋ Liquid Mixture
Bs BL P
Figure B3: Naphthalene-Biphenyl Solid-Liquid Phase Diagram
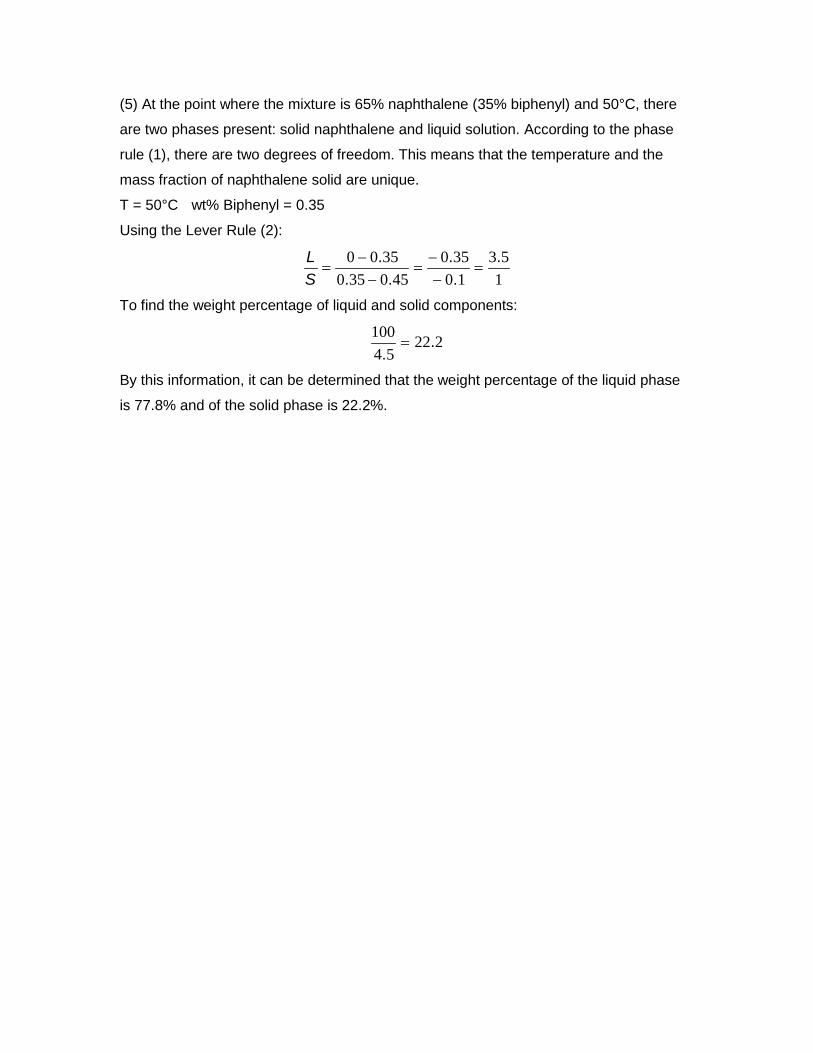
(5) At the point where the mixture is 65% naphthalene (35% biphenyl) and 50°C, there
are two phases present: solid naphthalene and liquid solution. According to the phase
rule (1), there are two degrees of freedom. This means that the temperature and the
mass fraction of naphthalene solid are unique.
T = 50°C wt% Biphenyl = 0.35
Using the Lever Rule (2):
153
10350
4503503500 .
..
...
=−−
=−
−=
SL
To find the weight percentage of liquid and solid components:
22254
100 ..
=
By this information, it can be determined that the weight percentage of the liquid phase
is 77.8% and of the solid phase is 22.2%.
APPENDIX B
Lab Questions
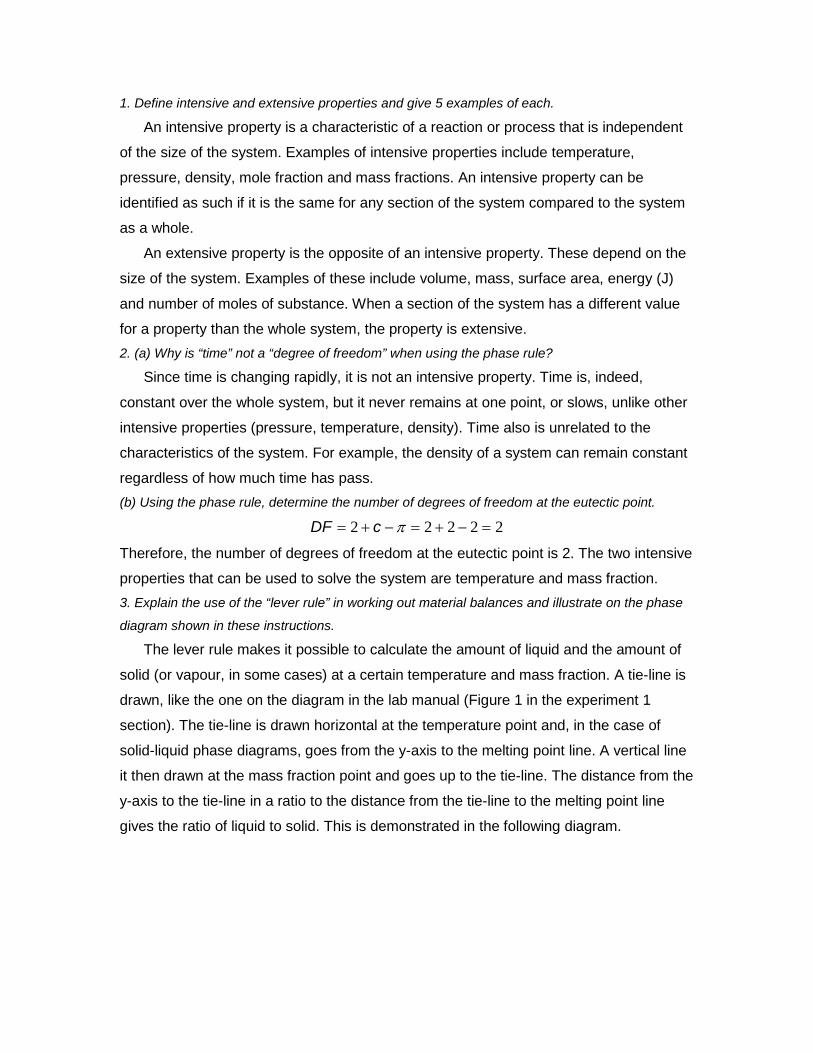
1. Define intensive and extensive properties and give 5 examples of each.
An intensive property is a characteristic of a reaction or process that is independent
of the size of the system. Examples of intensive properties include temperature,
pressure, density, mole fraction and mass fractions. An intensive property can be
identified as such if it is the same for any section of the system compared to the system
as a whole.
An extensive property is the opposite of an intensive property. These depend on the
size of the system. Examples of these include volume, mass, surface area, energy (J)
and number of moles of substance. When a section of the system has a different value
for a property than the whole system, the property is extensive. 2. (a) Why is “time” not a “degree of freedom” when using the phase rule?
Since time is changing rapidly, it is not an intensive property. Time is, indeed,
constant over the whole system, but it never remains at one point, or slows, unlike other
intensive properties (pressure, temperature, density). Time also is unrelated to the
characteristics of the system. For example, the density of a system can remain constant
regardless of how much time has pass. (b) Using the phase rule, determine the number of degrees of freedom at the eutectic point.
22222 =−+=−+= πcDF
Therefore, the number of degrees of freedom at the eutectic point is 2. The two intensive
properties that can be used to solve the system are temperature and mass fraction. 3. Explain the use of the “lever rule” in working out material balances and illustrate on the phase
diagram shown in these instructions.
The lever rule makes it possible to calculate the amount of liquid and the amount of
solid (or vapour, in some cases) at a certain temperature and mass fraction. A tie-line is
drawn, like the one on the diagram in the lab manual (Figure 1 in the experiment 1
section). The tie-line is drawn horizontal at the temperature point and, in the case of
solid-liquid phase diagrams, goes from the y-axis to the melting point line. A vertical line
it then drawn at the mass fraction point and goes up to the tie-line. The distance from the
y-axis to the tie-line in a ratio to the distance from the tie-line to the melting point line
gives the ratio of liquid to solid. This is demonstrated in the following diagram.
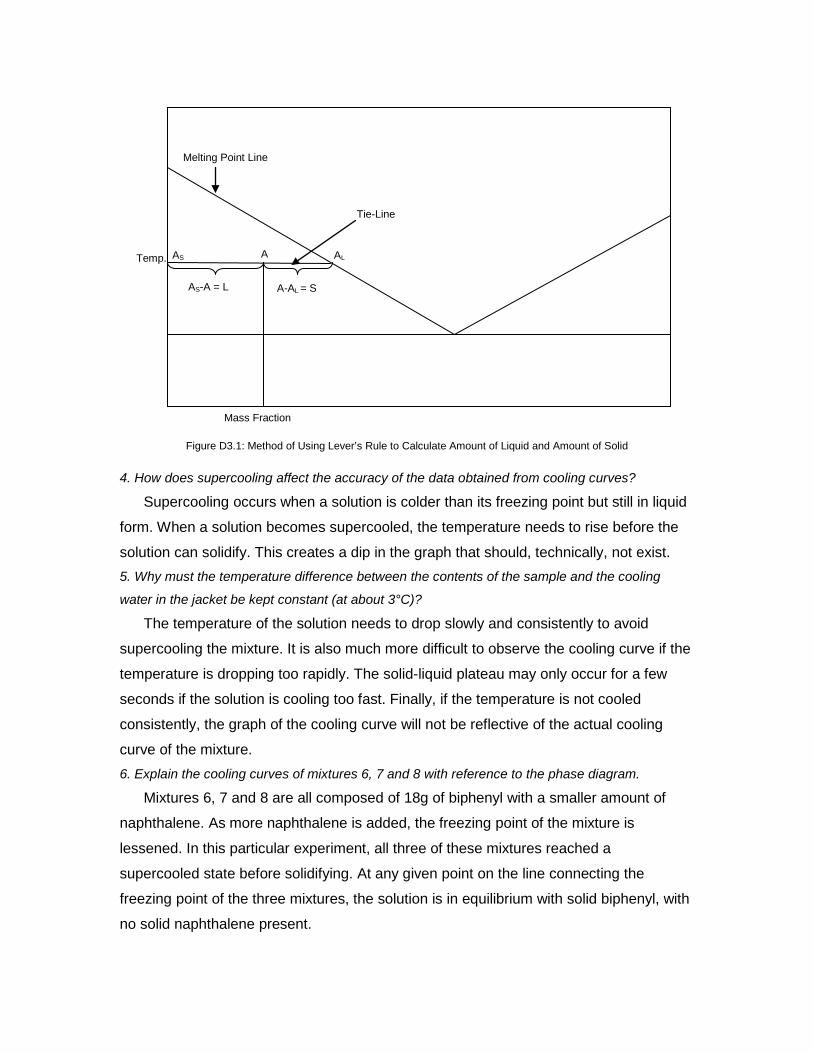
Figure D3.1: Method of Using Lever’s Rule to Calculate Amount of Liquid and Amount of Solid
4. How does supercooling affect the accuracy of the data obtained from cooling curves?
Supercooling occurs when a solution is colder than its freezing point but still in liquid
form. When a solution becomes supercooled, the temperature needs to rise before the
solution can solidify. This creates a dip in the graph that should, technically, not exist. 5. Why must the temperature difference between the contents of the sample and the cooling
water in the jacket be kept constant (at about 3°C)?
The temperature of the solution needs to drop slowly and consistently to avoid
supercooling the mixture. It is also much more difficult to observe the cooling curve if the
temperature is dropping too rapidly. The solid-liquid plateau may only occur for a few
seconds if the solution is cooling too fast. Finally, if the temperature is not cooled
consistently, the graph of the cooling curve will not be reflective of the actual cooling
curve of the mixture. 6. Explain the cooling curves of mixtures 6, 7 and 8 with reference to the phase diagram.
Mixtures 6, 7 and 8 are all composed of 18g of biphenyl with a smaller amount of
naphthalene. As more naphthalene is added, the freezing point of the mixture is
lessened. In this particular experiment, all three of these mixtures reached a
supercooled state before solidifying. At any given point on the line connecting the
freezing point of the three mixtures, the solution is in equilibrium with solid biphenyl, with
no solid naphthalene present.
Tie-Line
Melting Point Line
AS AL A
Mass Fraction
Temp.
AS-A = L A-AL = S
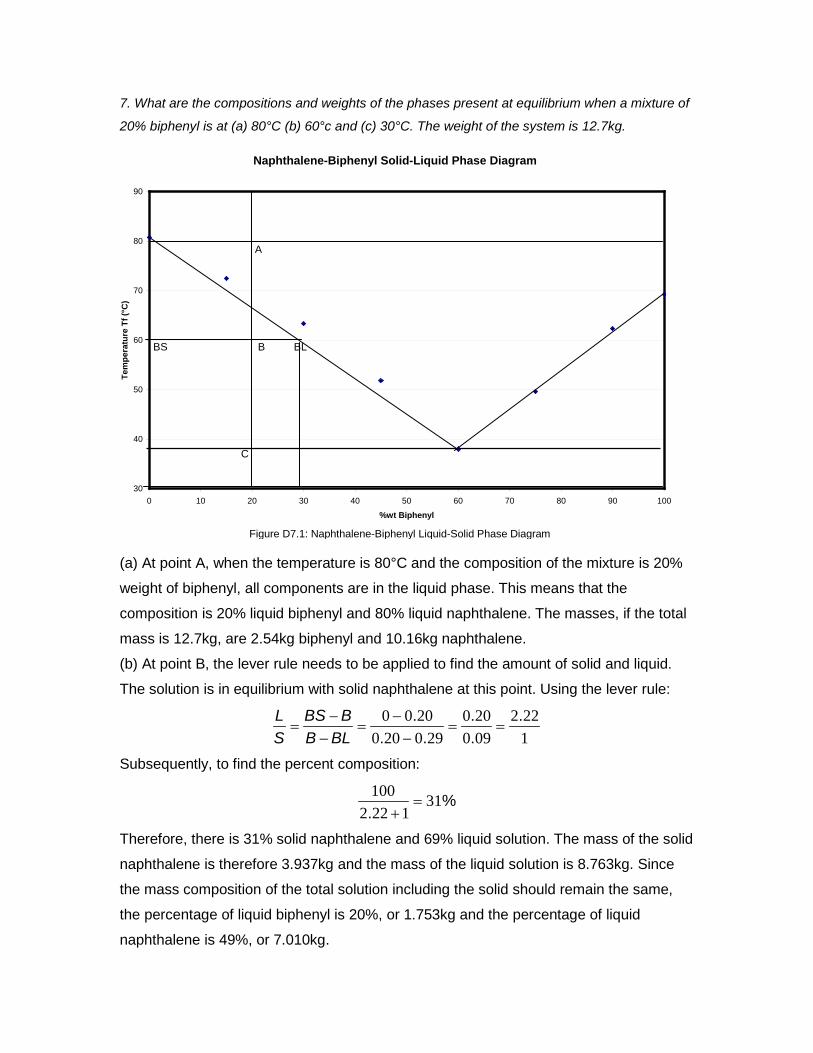
Figure D7.1: Naphthalene-Biphenyl Liquid-Solid Phase Diagram
Naphthalene-Biphenyl Solid-Liquid Phase Diagram
30
40
50
60
70
80
90
0 10 20 30 40 50 60 70 80 90 100
%wt Biphenyl
Tem
pera
ture
Tf (
°C)
7. What are the compositions and weights of the phases present at equilibrium when a mixture of
20% biphenyl is at (a) 80°C (b) 60°c and (c) 30°C. The weight of the system is 12.7kg.
(a) At point A, when the temperature is 80°C and the composition of the mixture is 20%
weight of biphenyl, all components are in the liquid phase. This means that the
composition is 20% liquid biphenyl and 80% liquid naphthalene. The masses, if the total
mass is 12.7kg, are 2.54kg biphenyl and 10.16kg naphthalene.
(b) At point B, the lever rule needs to be applied to find the amount of solid and liquid.
The solution is in equilibrium with solid naphthalene at this point. Using the lever rule:
1222
090200
2902002000 .
.
...
.==
−−
=−−
=BLB
BBSSL
Subsequently, to find the percent composition:
%.
311222
100=
+
Therefore, there is 31% solid naphthalene and 69% liquid solution. The mass of the solid
naphthalene is therefore 3.937kg and the mass of the liquid solution is 8.763kg. Since
the mass composition of the total solution including the solid should remain the same,
the percentage of liquid biphenyl is 20%, or 1.753kg and the percentage of liquid
naphthalene is 49%, or 7.010kg.
A
B BS
C
BL
Naphthalene-Biphenyl Solid-Liquid Phase Diagram
30
40
50
60
70
80
90
0 10 20 30 40 50 60 70 80 90 100
%wt Biphenyl
Tem
pera
ture
Tf (
°C)
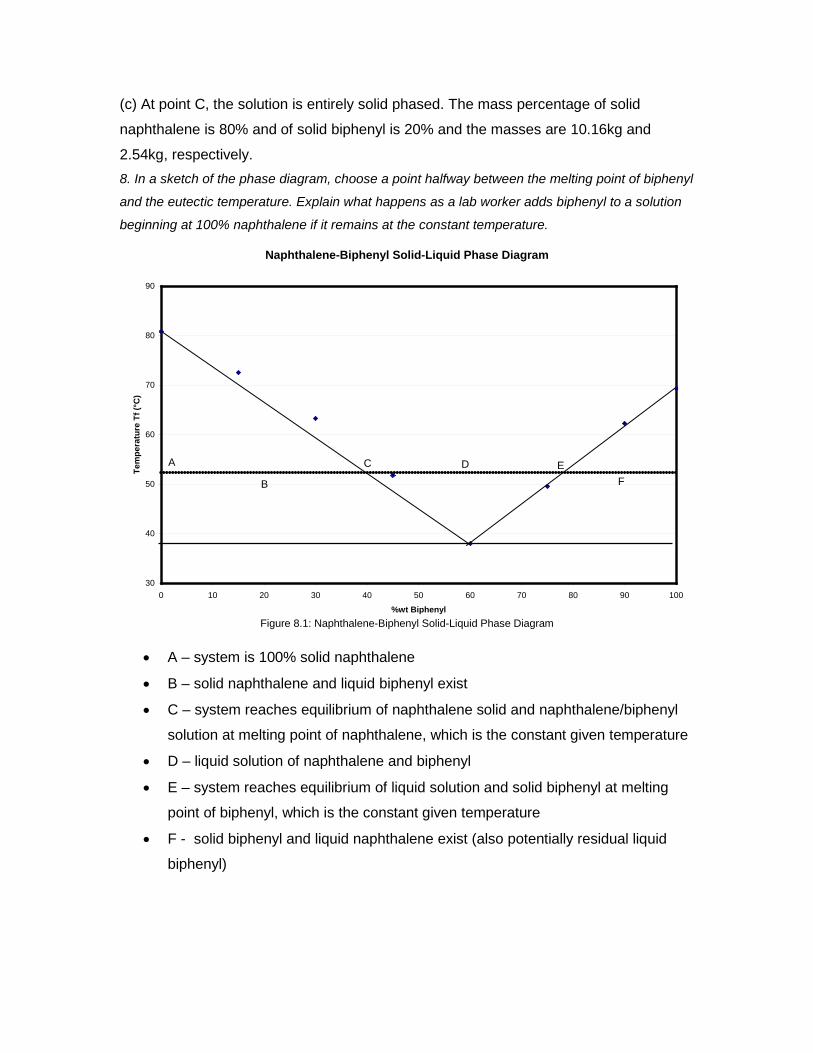
(c) At point C, the solution is entirely solid phased. The mass percentage of solid
naphthalene is 80% and of solid biphenyl is 20% and the masses are 10.16kg and
2.54kg, respectively. 8. In a sketch of the phase diagram, choose a point halfway between the melting point of biphenyl
and the eutectic temperature. Explain what happens as a lab worker adds biphenyl to a solution
beginning at 100% naphthalene if it remains at the constant temperature.
• A – system is 100% solid naphthalene
• B – solid naphthalene and liquid biphenyl exist
• C – system reaches equilibrium of naphthalene solid and naphthalene/biphenyl
solution at melting point of naphthalene, which is the constant given temperature
• D – liquid solution of naphthalene and biphenyl
• E – system reaches equilibrium of liquid solution and solid biphenyl at melting
point of biphenyl, which is the constant given temperature
• F - solid biphenyl and liquid naphthalene exist (also potentially residual liquid
biphenyl)
Figure 8.1: Naphthalene-Biphenyl Solid-Liquid Phase Diagram
A
B F
C E D
APPENDIX C
Raw Data

Mixture 1: 17g Naphthalene
80
80.5
81
81.5
82
82.5
83
83.5
84
84.5
85
85.5
0 20 40 60 80 100 120 140 160
Time t (s)
Tem
pera
ture
T (°
C)
Figure B1.1: Mixture 1 – 17g Naphthalene, No Biphenyl
Mixture 2: 17g Naphthalene, 3g Biphenyl
72
73
74
75
76
77
78
79
80
81
0 50 100 150 200 250
Time t (s)
Tem
pera
ture
T (°
C)
Figure C1.2: Mixture 2 – 17g Naphthalene, 3g Biphenyl

Figure C1.3: Mixture 3 – 17g Naphthalene, 7g Biphenyl
Figure C1.4: Mixture 4 – 17g Naphthalene, 14g Biphenyl
Mixture 3: 17g Napthlalene, 7g Biphenyl
62
63
64
65
66
67
68
69
70
71
0 50 100 150 200 250 300 350
Time t (s)
Tem
pera
ture
T (°
C)
Mixture 4: 17g Naphthalene, 14g Biphenyl
50
51
52
53
54
55
56
57
58
59
60
61
0 50 100 150 200 250 300 350 400
Time t (s)
Tem
pera
ture
T (°
C)
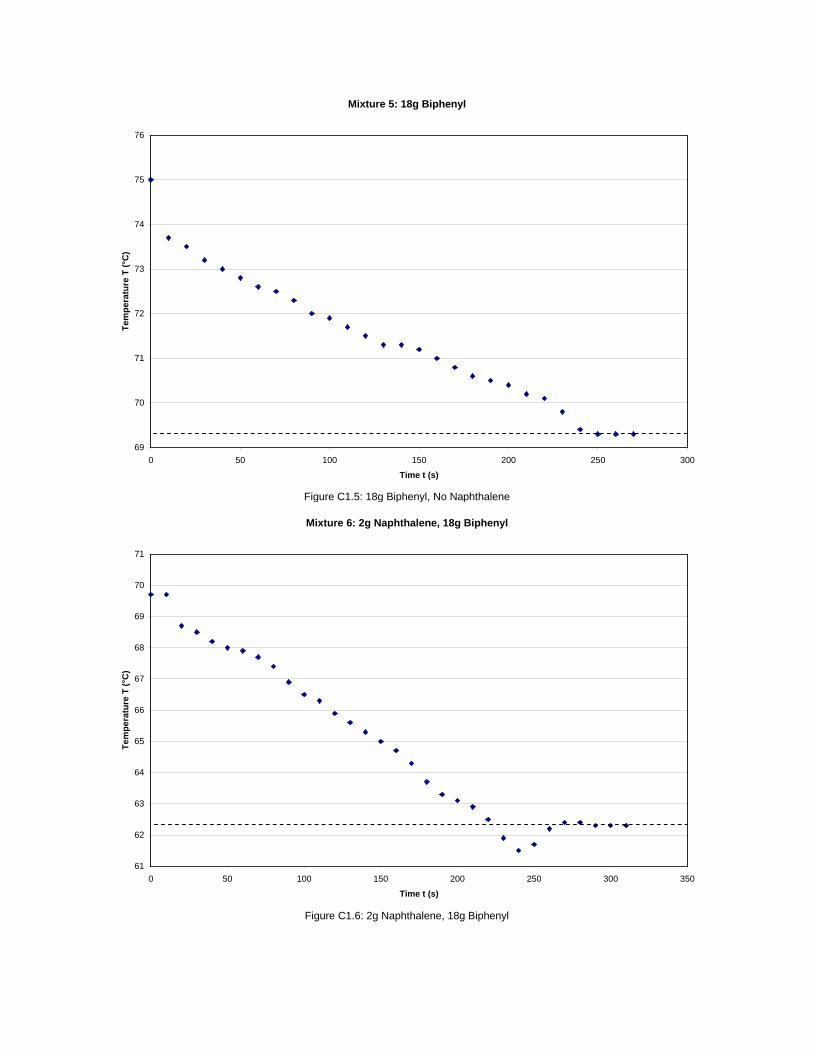
Figure C1.5: 18g Biphenyl, No Naphthalene
Figure C1.6: 2g Naphthalene, 18g Biphenyl
Mixture 5: 18g Biphenyl
69
70
71
72
73
74
75
76
0 50 100 150 200 250 300
Time t (s)
Tem
pera
ture
T (°
C)
Mixture 6: 2g Naphthalene, 18g Biphenyl
61
62
63
64
65
66
67
68
69
70
71
0 50 100 150 200 250 300 350
Time t (s)
Tem
pera
ture
T (°
C)
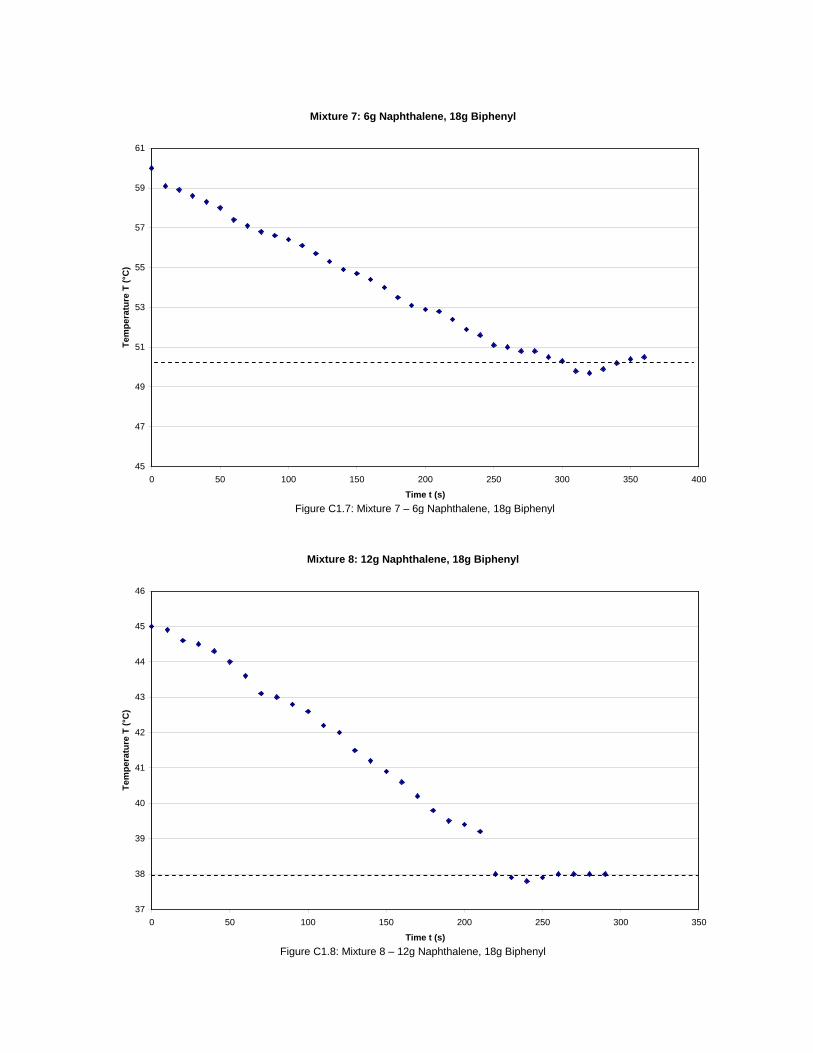
Figure C1.7: Mixture 7 – 6g Naphthalene, 18g Biphenyl
Figure C1.8: Mixture 8 – 12g Naphthalene, 18g Biphenyl
Mixture 7: 6g Naphthalene, 18g Biphenyl
45
47
49
51
53
55
57
59
61
0 50 100 150 200 250 300 350 400
Time t (s)
Tem
pera
ture
T (°
C)
Mixture 8: 12g Naphthalene, 18g Biphenyl
37
38
39
40
41
42
43
44
45
46
0 50 100 150 200 250 300 350
Time t (s)
Tem
pera
ture
T (°
C)