determination of the equivalence ratio during fire, comparison of techniques · determination of...
TRANSCRIPT

FIRE SAFETY SCIENCE--PROCEEDINGS OF THE SEVENTH INTERNATIONAL SYMPOSIUM, pp. 295- 306 295
Determination of the equivalence ratio during fire, comparison of techniques BERIT ANDERSSON*, GÖRAN HOLMSTEDT and ANDERS DAGNERYD Department of Fire Safety Engineering, Lund University, P.O. Box 118, S-221 00, Sweden
ABSTRACT: Equivalence ratios have been determined with two different techniques. The first, called the phi-meter, is a modification of the phi-meter earlier presented by Babrauskas et al. [1], while the other utilises a mass spectrometer as the analysing instrument. Results are presented from experiments with both techniques and a discussion concerning the deviations from theoretically calculated results is presented. The two methods presented are possible candidates in situations where global and/or local equivalence ratios need to be measured. In its present conformation, the phi-meter gives more consistent results than the mass spectrometer approach but the latter can be considerably improved by using a mass spectrometer with better resolution. KEYWORDS: Equivalence ratio, phi value, global equivalence ratio, phi-meter, mass spectrometer.
INTRODUCTION There are many reasons why unwanted fires can be a threat to life and to the environment. Especially fires where the amount of oxygen available for combustion is low, thus leading to an under-ventilated or oxidizer-controlled fire, can be life threatening. The production of CO is promoted by a low oxygen concentration, and as CO is preferentially taken up by the human body the threat to life increases as the CO concentration increases. The production and composition of fire gases is also influenced by the amount of oxygen available; more pure pyrolysed products and less combustion products being formed in a low-oxygen atmosphere. For these reasons, it is vital to be able to measure or estimate the degree of ventilation during the course of a fire. The degree of ventilation can be defined as the actual fuel/oxygen ratio compared with the stoichiometric fuel/oxygen ratio, as in Eq. 1. When the overall combustion process is studied the ratio is usually called the Global Equivalence Ratio, GER. A thorough presentation of the GER concept is given by Pitts [2]. The GER can be determined in well-controlled experiments where measurements of mass loss, as well as fuel and airflows, can be made. In many experimental situations this is not readily achievable and the need for other techniques is apparent. Optical techniques using laser-induced fluorescence (LIF) and Rayleigh scattering are suitable for measuring the equivalence ratio under certain conditions [3, 4]. However, LIF measurements include complex corrections for the sensitivity of the signal to collision partners and the use of Rayleigh scattering is limited to cases in which no macroscopic particles (soot) are present. Babrauskas et al. presented an apparatus suitable for measuring the equivalence ratio using a probe technique [1]. This apparatus has been developed further in order to make it more versatile and easier to use in non-laboratory environments. The apparatus is referred to as a phi-meter since the Greek letter phi, φ, is frequently used to denote the equivalence ratio. Depending on how the sample to be analysed is collected the measured value can be a local phi value or a global phi value. The results from measurements with the phi-meter are in this work compared with results from measurements with a mass spectrometer. In order to investigate the versatility of the methods, experiments were performed with a number of mixtures of propane/air and propene/air. Combustion gases from a diffusion flame of propene
Copyright © International Association for Fire Safety Science

296
were also analysed. Propene was chosen for the latter experiments because of its ability to produce large amounts of soot under low-ventilation conditions.
( )stoichoxygenfuel
oxygenfuel
mmmm
&&
&&
//
=φ [Eq. 1]
For measurement of the GER in enclosure fires Gottuk [5] used another approach.. A special enclosure was constructed so that air entered only through an inlet duct located beneath the floor of the enclosure. Narrow openings along the edge of the floor allowed the air into the enclosure. This made it possible to measure the airflow into the enclosure. The outflow of combustion gases was through a single window in one of the sides of the enclosure. It was ensured that no air was entrained through the window. The combustion gases were collected in a hood and drawn through an exhaust duct. The GER was determined by measuring the fuel mass loss and the air mass inflow and dividing their ratio with the ratio for stoichiometric burning. Beyler [6] introduced yet another. The fuel was allowed to burn freely under a hood without any surrounding structures. The combustion gases were trapped inside the hood. Eventually the hood was filled with combustion gases and a hot upper layer was formed in the hood. The fires were allowed to burn long enough for steady-state behaviour to be attained in the upper layer. Concentration measurements of different combustion products were made in the upper layer. The GER could be determined by measuring the mass of gas in the upper layer derived from the fuel divided by the mass of gas introduced from air and then normalised by the stoichiometric ratio.
EXPERIMENTAL Different approaches have been used in order to measure the local equivalence ratio. In the first one here referred to as the phi-meter the local equivalence ratio is calculated from the measured O2 - N2 ratio. In the second one here referred to as the mass spectrometer method the local equivalence ratio is calculated from the measured N2 - CO2 ratio. In order to measure the GER in a room fire a phi-meter with a sampling probe mounted diagonally across the upper part of the enclosure opening was tested and compared with GER calculated from measurements of fuel mass loss rate and air inflow. The general technique employed with the phi-meter and the mass spectrometer technique is to lead a flow of combustion gases through a heated catalytic bed, where remaining uncombusted fuel is burnt. Choice of catalyst In order two achieve complete combustion in the reactor, a sufficient supply of oxygen is necessary as well as the presence of an effective catalyst. A small investigation was undertaken two find a suitable catalyst and its optimal working temperature. Two different catalysts were tested in these experiments, as mentioned above; a platinum catalyst and another made of metal oxides of Al, Cu and Mn. Tests were carried out with methane, propane and propene. Methane was included since it is known that methane requires a higher temperature for combustion than the gases used in the other experiments reported here. A sample of a mixture of fuel gas and air was drawn through the heated reactor in the same way as in the experiments for phi value determination. The gases leaving the reactor were analysed in a flame ionisation detector (Siemens Fidamat K, M52044) in order to detect any uncombusted hydrocarbons. The temperature of the reactor was varied from 50°C up to 800°C

297
in steps of 50°. Tests were run for all combinations of catalyst and gas. The results of these tests are presented in Fig. 1.
Figure 1. The catalytic efficiency dependency on the temperature for platinum (Pt) and metallic oxide (M) catalysts is presented for the combustion of methane, propane and propene. As can be seen in the figure considerably lower temperatures were needed for the metal oxide catalyst than for the platinum catalyst for complete combustion of propane and methane. The results for propene are more difficult to interpret. Since no large difference can be seen in the optimal temperature for propene both catalysts should be acceptable for this fuel. The decision was taken to use the metal oxide catalyst at 350°C in most of the experiments with propane and propene. Some preliminary tests with propane were, however, carried out with the Pt catalyst at 350°C and 400°C. No significant differences could be seen between these experiments and similar experiments with metal oxide catalyst. The experiments with a propene diffusion flame gave the same results with both the Pt catalyst and the metal oxide catalyst. Experiments were conducted at 450°C, 550°C and 600°C. Increasing the temperature did not seem to have any influence on the combustion in the reactor since the ratio between the measured phi value and the calculated phi value remained the same. Description of the phi-meter, using the nitrogen and oxygen balance The phi-meter utilises the oxygen consumption technique, which is widely used to determine the heat release rate during combustion [7, 8, 9]. After the catalyst the gases are cooled and freed from CO2 and H2O. Thereafter, the oxygen content is measured with a paramagnetic oxygen analyser. An overview of the apparatus is given in Fig. 2. The original phi-meter was presented by Babrauskas et al. in 1994 [1]. The combustion gases are drawn through the phi-meter by a 12 V DC pump. In order to ensure that all the uncombusted gases are fully reacted, a known quantity of oxygen, measured with a mass flow controller (Aalborg Instruments, Denmark) is added just before the inlet to the reactor. The reactor with the catalytic bed is mounted in an electrically heated furnace that can be heated up to 1100°C. Temperatures in the range between 350 and 600°C were used in this series of experiments. Two different catalysts were tested, one made of silica beads covered with platinum, and the other of metal oxides of Al, Cu and Mn. The catalyst consisting of metal oxides was homogeneous with cylindrically shaped particles with a length of ∼7 mm and a diameter of 3 mm. The platinum catalyst consisted of platinum-coated silica beads with a diameter of 4 mm.
0
5 0 0 0 0
1 0 0 0 0 0
1 5 0 0 0 0
2 0 0 0 0 0
2 5 0 0 0 0
3 0 0 0 0 0
3 5 0 0 0 0
4 0 0 0 0 0
4 5 0 0 0 0
0 2 0 0 4 0 0 6 0 0 8 0 0 1 0 0 0
Te m pe ra tu re [C ]
Unb
urne
d H
C [p
pm]
P t -p ro p an e
M -p ro p an e
P t -p ro p en e
M -p ro p en e
P t -m et h an e
M -m et h an e

298
After passage through the reactor, the gases ideally consist of CO2, H2O, N2 and O2. Should the fuel contain heteroatoms these will also be present in the gases leaving the reactor. The hot gases are cooled in an ice-water trap and then led through a series of absorbers consisting of silica gel to remove water, NaOH (s) and Ascarite to absorb CO2, and finally through silica gel again to absorb any remaining water. The mass flow controller was used to ensure a constant flow of gases. Finally, the oxygen content was determined with a paramagnetic oxygen analyser; model PMA 10 (M&C Instruments, The Netherlands). Details of the equipment are presented in Table 1. Figure 2. The overall layout of the experimental set-up, including the phi-meter.
Table 1 Details of the equipment in the phi-meter.
Reactor Mass flow controller Catalyst O2 analyser Length: 300 mm Diameterinner: 30 mm Material: steel
Aalborg Instruments Max pressure: 3400 kPa Gas: air Flow range: 0-1000 cm3 Gas: O2 Flow range: 0-500 cm3 Accuracy: +1% of full scale
a) Pt beads Diameter: 4 mm b) Cylinders of Al, Cu and Mn oxides Diameter: 3.1 mm Length: 6.8 mm
M&C Instruments, PMA 10 0-100 vol% Accuracy: +0.1 vol%
One way to determine the equivalence ratio is to use known flows of fuel and air and a specified chemical composition of the fuel. The mass-burning rate of the fuel must also be determined. This is possible during well-controlled laboratory experiments, but can be difficult in other situations. The phi-meter arrangement reduces the variables that must be measured to three different oxygen concentrations, and an oxygen analyser is therefore the only analysis instrument required. The phi value can be calculated according to Eq. 2, where
2OX is the
amount of oxygen measured when extra oxygen is added and no fuel is present, 0X is the
oxygen concentration under ambient conditions and mX is the oxygen concentration during combustion.

299
( ) ( ))1(/ 02 mmO XXXX −⋅−=φ [Eq. 2]
Measurements of the equivalence ratio with a mass spectrometer using the nitrogen and carbon balance The second technique used for measuring the equivalence ratio utilises a mass spectrometer as the analysing instrument. The method is based on the fact that the ratio between the partial pressures of nitrogen and carbon dioxide can be used to calculate the phi value as in Eq. 3. The nitrogen represents the amount of air in the sample and the carbon dioxide represents the fuel.
( )stoichNCO
NCO
pppp
22
22
//
=φ [Eq. 3]
In analogy with the phi-meter method, described above, the combustion gases are completely oxidised in a heated reactor filled with a catalyst. Extra oxygen is added to the sample stream in order to ensure that all unreacted carbon is oxidised to CO2. The sample is continuously collected using a gas pump. The sample collection rate does not affect the mass spectrometer as long as the sample flow rate is higher than the flow through the mass spectrometer. After the reactor the sample gas is drawn through a glass orifice connected to a high-vacuum cell, which is connected to the mass spectrometer. In order to maintain a high vacuum, an Edwards’s pre-vacuum pump and an oil diffusion pump are used. The vacuum created by the high-vacuum oil diffusion pump is of the order of 10-5 Pa. When the sample gas is let into the high-vacuum cell via the glass orifice, the pressure rises to approximately 10-3 Pa. Mass spectrometer scans are made of the sample in order to detect N2 and CO2. Maximum points are detected for both N2 and CO2 together with a baseline. Subtracting the relevant baseline value for the gases from the maximum values gives the partial pressures of the two gases in the cell. Dividing the partial pressure of CO2 by that of N2 gives a ratio from which the phi value can be calculated. The results from these measurements are quantitative but not absolute and this simplifies the measurement procedure, as there is no need for calibration of the equipment or regulation of the flow, as long as it is held constant during the measuring period. The presence of gases other than N2 and CO2 does not affect the results since the relationship between the partial pressures of the studied gases is independent of additional partial pressures. An Anavac-2 mass spectrometer (Micromass, UK) was used in these experiments. The analysis head was connected directly to the high-vacuum cell in order to analyse the gas content in real time. A data logger was used to collect the data from the mass spectrometer. An example of a mass-spectrum is given in Fig. 3.

300
Figure 3 Mass-spectrum from a mixture of propene and air after the catalyst. The mass spectrometer was calibrated using pure gas mixtures with different CO2 / N2 ratios. In Fig. 4 the phi-values for propane and propene, calculated from the different CO2 / N2 ratios in the gas mixtures are shown as a function of the measured CO2 / N2 ratio. Figure 4. Phi-value as a function of the measured CO2 / N2 ratio. Solid line = propene, dashed line = propane. Description of the experiments In order to evaluate the capability of the two measuring techniques a number of experiments were performed with gaseous fuels. Propane and propene were chosen since they are readily available and they represent fuels with quite different combustion characteristics. The tests were carried out by mixing the fuel gas and air in a mixing tube and drawing a partial flow of the mixture and a known quantity of extra oxygen through a heated reactor containing a catalyst where the gas/air mixture could be fully reacted to carbon monoxide and water. The surplus fuel/air mixture was burnt at the top of the mixing tube where a propane flame was constantly burning.
0
2
4
6
8
10
12
14
16
18
0 10 20 30 40 50 60
Mass number
Sign
al
0
1
2
3
4
5
6
0 0.5 1 1.5 2 2.5 3
Measured CO 2/N2 ratio
Phi v
alue
[-]

301
In many fire situations it is desirable to be able to measure the ventilation conditions in an atmosphere where there is a high amount of unburned gases and soot. In order to investigate the versatility of the phi-meter in such situations, experiments were carried out with combustion gases. In these experiments, propene was burnt under vitiated conditions and thus a large amount of soot was produced. A sample flow from the sooty combustion gases was led into the reactor together with a surplus of oxygen. The sample gas was taken through a sampling line heated to about 200°C in order to minimise the amount of soot that collected at the inlet and inside the sampling line. The propene was burnt as a diffusion flame from a gravel-filled burner with a base diameter of 28 mm. The burner was placed at the bottom of a quartz tube, with an inner diameter of 100 mm and a height of 540 mm and the sample was withdrawn about 100 mm from the top of the tube.
RESULTS Numerous experiments were performed in order to evaluate the performance of the phi-meter. Examples from two experiments are presented in Fig. 5. In Fig. 5a results from a propane experiment are presented. A series of three experiments with varying phi values was run and relatively good agreement was found between the measured and calculated values. There is a time delay at the beginning of the experiments due to the residence time in the reactor and in the adsorbents. This time is shorter when the system is running, as can be seen at the changeover points between different phi values. In Fig. 5b results from an experiment with propene are presented. They strongly resemble the results from the propane experiment. The peak at the beginning of the experiment is due to poor adjustment of the flow meter.
Figure 5. Measured and calculated phi values from an experiment on the combustion of a) propane and b) propene. The results can, of course, be evaluated and presented in many ways. Comparisons between results from the phi-meter and calculated values of the GER were chosen here and are presented in Fig. 6 for gaseous fuels. As can be seen in Fig. 6 the results from the measurements and the calculated values generally are in good agreement for fuel/air mixtures with propane and propene. The measurements with the mass spectrometer, presented in Fig. 6b, show a slightly higher tendency of this system to overestimate the phi value for propane and propene.
0.0
0.2
0.4
0.6
0.8
1.0
1.2
0 500 1000 1500 2000 2500 3000 3500 4000
T i m e [s]
Phi v
alue
[-]
Calculatedphi value
Measuredphi value
a)
0.0
0.2
0.4
0.6
0.8
1.0
1.2
0 500 1000 1500 2000 2500 3000 3500 4000
T i m e [s]
Phi v
alue
[-]
Measuredphi value
Calculatedphi value
b)

302
Figure 6. Measured versus calculated phi value for experiments with propane and propene. The solid straight line represents the ideal result when measured and calculated values are equal and the dotted line represents the result of a linear regression. a) Measurements using the phi-meter, the linear regression gives a constant of determination R2=0.969. b) Measurements using the mass spectrometer, the linear regression gives a constant of determination R2=0.957 Experiments with a propene diffusion flame were also performed and the results from the measurements with the phi-meter are presented in Fig. 7.
Figure 7. Measured versus calculated phi value for measurements with the phi meter. Experiments with propane, propene and a propene diffusion flame are included in the diagram. The solid straight line represents the ideal result when measured and calculated values are equal and the dotted line represents the result of a linear regression which gives a constant of determination R2=0.950. The ratio between the measured and the calculated phi values should ideally be 1.0. This ratio for the two methods presented is illustrated in Fig. 6 and 7. As can be seen in Fig. 7 the
0.0
0.2
0.4
0.6
0.8
1.0
1.2
1.4
1.6
1.8
2.0
0.0 0.5 1.0 1.5 2.0
Cal cul at e d phi val ue [ - ]
Mea
sure
dph
ival
ue[-
]
PropanePropene
a)
0.0
0.2
0.4
0.6
0.8
1.0
1.2
1.4
1.6
1.8
2.0
0.0 0.5 1.0 1.5 2.0
Calculated phi value [-]
Mea
sure
dph
ival
ue[ -
]
PropanePropene
b)
0.0
0.2
0.4
0.6
0.8
1.0
1.2
1.4
1.6
1.8
2.0
0.0 0.5 1.0 1.5 2.0
C alculate d phi value [-]
Mea
sure
d ph
i val
ue [-
]
PropanePrope neDifussion flame
303
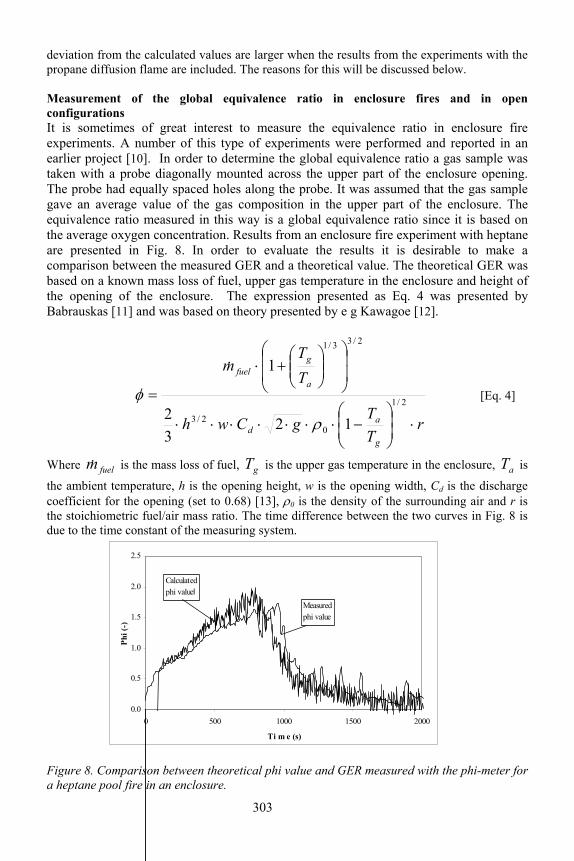
deviation from the calculated values are larger when the results from the experiments with the propane diffusion flame are included. The reasons for this will be discussed below. Measurement of the global equivalence ratio in enclosure fires and in open configurations It is sometimes of great interest to measure the equivalence ratio in enclosure fire experiments. A number of this type of experiments were performed and reported in an earlier project [10]. In order to determine the global equivalence ratio a gas sample was taken with a probe diagonally mounted across the upper part of the enclosure opening. The probe had equally spaced holes along the probe. It was assumed that the gas sample gave an average value of the gas composition in the upper part of the enclosure. The equivalence ratio measured in this way is a global equivalence ratio since it is based on the average oxygen concentration. Results from an enclosure fire experiment with heptane are presented in Fig. 8. In order to evaluate the results it is desirable to make a comparison between the measured GER and a theoretical value. The theoretical GER was based on a known mass loss of fuel, upper gas temperature in the enclosure and height of the opening of the enclosure. The expression presented as Eq. 4 was presented by Babrauskas [11] and was based on theory presented by e g Kawagoe [12].
rTT
gCwh
TT
m
g
ad
a
gfuel
⋅
−⋅⋅⋅⋅⋅⋅⋅
+⋅
= 2/1
02/3
2/33/1
1232
1
ρ
φ
&
[Eq. 4]
Where fuelm& is the mass loss of fuel, gT is the upper gas temperature in the enclosure, aT is
the ambient temperature, h is the opening height, w is the opening width, Cd is the discharge coefficient for the opening (set to 0.68) [13], ρ0 is the density of the surrounding air and r is the stoichiometric fuel/air mass ratio. The time difference between the two curves in Fig. 8 is due to the time constant of the measuring system.
Figure 8. Comparison between theoretical phi value and GER measured with the phi-meter for a heptane pool fire in an enclosure.
0.0
0.5
1.0
1.5
2.0
2.5
0 500 1000 1500 2000
T i m e (s)
Phi (
-)
Measuredphi value
Calculatedphi valuel

304
DISCUSSION AND CONCLUSIONS The ventilation conditions during combustion or during a fire constitute an important variable, which governs the production of combustion gases such as CO and CO2. In order to find a useful way of determining the equivalence ratio the phi-meter concept presented in [1] was evaluated and compared with a technique using mass spectrometer analysis. The two methods have some features in common as regards their suitability for measuring the equivalence ratio in different situations and experimental set-ups. Both methods can be used to measure the GER as well as the local equivalence ratio. The probe size can, however, be much smaller when the mass spectrometer approach is used, thus making it possible to measure spatially very small differences in composition of the combustion gases. The probe in this case can have a diameter less than 1 mm while for the phi-meter the probe diameter is of the order of 3-8 mm. Absorption media for H2O and CO2 are an important component in the phi-meter concept since the whole technique is based on the assumption that measurements can be made on pure O2 and N2. These absorption media can, however, cause some problems since Ascarite and NaOH are prone to clogging when a large amount of CO2 has been absorbed. It is vital that the absorbents are fresh when a new measurement is started. The amount of absorbent is, of course, also a matter of interest since larger amounts of absorbents take longer to clog, but the time constant of the system also increases which is undesirable. Clogging is not a problem with the H2O absorbent. The sample flow required for analysis also differs for the two methods. The flow necessary for the phi-meter is governed by the demand of the oxygen meter, and in this case a flow of 8⋅10-
6m3/s was used. The flow for the mass spectrometer is less than 10-9m3/s at atmospheric pressure. The experimental results presented are in relatively good agreement with the theoretically calculated values for propane and propene. Some of the discrepancies may be due to the accuracy of the flow meters for fuel and air. These were ordinary glass-tube variable-area flow meters from Fischer & Porter and especially at the low flow end of the scale the accuracy is not very good. In order to identify possible reasons for the discrepancies between the measured and calculated phi values for the propene diffusion flame a number of tests were performed in which soot was collected on filters at the inlet and outlet of the reactor. Experiments were made with reactor temperatures from 300°C to 800°C in order to study the influence of the reactor temperature. All these experiments were performed with the Pt-catalyst. The results from this exercise are presented in Fig. 9. It was found that the reactor temperature seemed to have no effect on the efficiency of the combustion of the soot. About 10% of the soot entering the reactor is not combusted. The reasons for this are not fully understood but some suggestions can be made. The combustion gases are introduced at one end of the reactor through a 6 mm sampling line into the 30 mm wide reactor filled with catalyst. If the sooty combustion gases are cooler than the reactor they will lower the temperature at the inlet side of the reactor thus causing a conglomerate of soot particles there, which will not be as easily combusted as the rest of the sample gas. This soot at the inlet might hinder the rest of the soot from being evenly distributed throughout the catalyst and the soot will therefore take the easiest way through the reactor and complete combustion will not be achieved.

305
Figure 9. Soot from the propene diffusion flame collected on filters at the entrance to the reactor and after the reactor. In calculating the theoretical phi value the assumption was made that everything that entered the reactor was combusted to CO2 and H2O. In the case of the propene diffusion flame it was found that this was not the case, since small amounts of soot was collected after the reactor. According to the SFPE [14] under well-ventilated conditions about 10% of the mass burnt are in the form of soot and at equivalence ratios around 2 some 20% is converted to soot. This was taken into account when presenting calculated phi values for the propane diffusion flame experiments in Fig. 7. There is a need for a versatile method that can be used to measure the local or global equivalence ratio during a fire or in combustion experiments. The two methods presented above are possible candidates in situations where global and local equivalence ratios need to be measured. In its present conformation, the phi-meter gives more consistent results than the mass spectrometer approach but the latter can be considerably improved by using a mass spectrometer with better resolution. The primary disadvantages of the phi-meter are the need for fresh adsorbents. Of course, large amounts of adsorbents can be included, but this increases the time constant of the system, which is undesirable. In order to improve the phi-meter a more thorough investigation of the performance of the catalyst should be made so that the amount and the working temperature of the catalyst can be optimised. The sample lines could also be made shorter, thus improving the time constant. The problem associated with the accuracy of the flow meters can, of course, also be solved but this is a minor problem since it is proposed that the phi meter be used primarily in experiments where the complete flow of combustion gases is measured with one flow meter, and thus the small flows encountered during calibration will not be employed. It can be concluded that both methods are possible candidates for measurement of the equivalence ratio in a fire and in combustion experiments, but more work is needed in order to develop a method that is reliable and easy to include in a measuring system.
0
5
10
15
20
25
30
35
40
0 200 400 600 800 1000
Temperature [C]
Soot
form
atio
n *1
0-6
[g/s]
Soot into reactor
Soot after reactor

306
REFERENCES 1 Babrauskas, V., Parker, W. J,. Mullholland, G. and Twilley, W. H., “The phi meter: A simple, fuel-independent instrument for monitoring combustion equivalence ratio.”, Rev. Sci. Instrum. Vol 65, No. 7: 2367-2375 (1994). 2 Pitts, W. P., ”The Global Equivalence Ratio Concept and the Prediction of Carbon Monoxide Formation in Enclosure Fires”, National Institute of Standards and Technology Monograph 179, Gaithersburg, MD, 1994, 171 p. 3 Neij, H., Thesis “Fluorescence for Precombustion Diagnostics in Spark-Ignition Engines”, ISRN LUTFD”/TFCP-41-SE, 1998. 4 Andersson, Ö., Thesis “Development and application of Laser Techniques for Studying Fuel Dynamics and NO Formation in Engines”, ISRN LUTFD”/TFCP-61-SE, 2000. 5 Gottuk, D. T., ”Generation of carbon monoxide in compartment fires”, National Institute of Standards and Technology NIST-GCR-92-619, , December 1992, 265 p. 6 Beyler, C. L., ”Major Species Production by Diffusion Flames in a Two-layer Compartment Fire Environment”, Fire Safety Journal Vol. 10, No. 1, 47-56 (1986). 7 Thornton, W. M., “The Relation of Oxygen to the Heat of Combustion of Organic Compounds”, Philosophical Magazine and Journal of Science, Vol.33, No. 196: 196-203 (1917). 8 Parker, W. J., ”Calculations of the Heat Release Rate by Oxygen Consumption for Various Applications”, National Bureau of Standards NBSIR 81-2427-1, Center for Fire Research Washington, DC 20234, March 1982, 41p. 9 “Heat Release in Fires”, edited by Babrauskas, V and Grayson, S. J., Elsevier Applied Science, London, Chapter 3, p. 31-59, 1992. 10 Anderson, B., Babrauskas, V., Holmstedt, G. Särdqvist, S., Winter, G., ”Simulated fires in substances of pesticide type”, Department of Fire Safety Engineering, Lund University, Report No. 3087, 1999, 95 p. 11 Babrauskas, V., Thesis “Fire Endurance in Buildings”, Report No. UCB FRG 76-16, Fire Research Group, University of California, Berkeley, U.S., November 1976. 12 Kawagoe, K., “Fire Behaviour in Rooms”, Report of the Building Research Institute of Japan, No. 27, September 1958, 73 p. 13 Prahl, J. and Emmons, H. W., Fire Induced Flow through an opening”, Technical report No 12, 1975, 41 p. 14 Tewarson, A., “Generation of Heat and Chemical Compounds in Fires”, Section 3, Chapter 4 in The SFPE Handbook of Fire Protection Engineering, 2nd ed, NFPA publication number:HFPE-95, National Fire Protection Association, 1995.

RISK AND DECISION ANALYSIS
