determination of biogenic component in waste and liquid
TRANSCRIPT

Determination of biogenic component in waste and liquid
fuels by the 14C method
Ines Krajcar Bronić, Jadranka Barešić, Nada Horvatinčić
Ruđer Bošković Institute, Zagreb, Croatia

Intensive use of fossil fuels for energy production and transport during 20th century caused an increase of CO2 concentration in the atmosphere. How do we know that excess-CO2 comes from fossil fuels? What to do to stop or at least slow-down the increase of atmospheric CO2 concentration? The increase of CO2 concentration can be slowed down by the use of renewable energy sources - biogenic materials for energy production and/or transport biogenic – produced in natural processes by living organisms but not fossilized or derived from fossil resources How can we determine the biogenic fraction in any type of fuel? The 14C method, which is based on different content of 14C in biogenic and in fossil component, is a reliable method and can be used for various types of fuels.

Comparison of „human” (anthropogenic) CO2 emission and atmospheric CO2 concentration, 1970 – 2010
http://www.skepticalscience.com/co2-increase-is-natural-not-human-caused.htm

https://scripps.ucsd.edu/programs/keelingcurve/wp-content/plugins/sio-bluemoon/graphs/mlo_full_record.png

CO2
Biogenic carbon
All carbon isotopes take part
12C 13C 14C
Carbon cycle

14CO2
O2
AS
14 14N +n C+p
14 14C N +e+ ν
Carbon on Earth
12C: 98.89 %
13C: 1.1 %
14C: 1.18 x 10⁻¹⁰ %
6
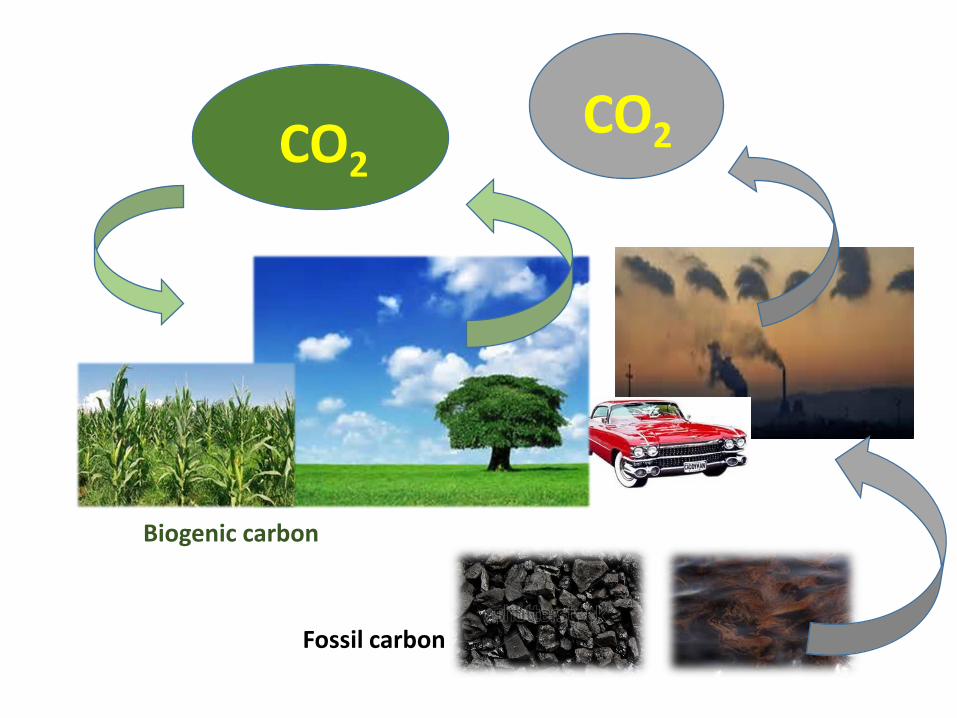
CO2
Fossil carbon
Biogenic carbon
CO2

CO2
Biogenic carbon
CO2
Carbon isotope fingerprint
Atmosphere a14C = 100 pMC d13C = -8 ‰
Plants (biosphere) a14C = 100 pMC d13C = -25 ‰ (-12 ‰)
Fossil carbon a14C = 0 pMC d13C = -25 ‰

270 280 290 300 310 320 330 340 350 360-8.0
-7.5
-7.0
-6.5
-6.0
d13C
(‰
)
concentration CO2 (ppm)

10
From the presented data we can conclude • Intensive use of fossil fuels for energy production and transport during
20th century caused an increase of CO2 concentration in the
atmosphere
What to do to stop or at least slow-down the increase of atmospheric
CO2 concentration?
The increase of CO2
concentration can be slowed
down by the use of biogenic
materials for energy production
and/or transport.

11
Production of biofuel is more expensive than the use of fossil fuel
The "environmentally kind politics" of the European Union
stimulates the use of biogenic fuels by lower excise and income
tax relief.
Countries throughout the world have set new targets for the
minimum content of biogenic materials in fuel (5.75% until 2010 in
Europe, 2003/30/EC; EU Directive 2009/28/EC at least 10 % of bio-
fuel in all (liquid) fuels by 2020).
Thus, there is a need for independent determination of the
fraction of the biogenic component in various types of fuels by
reliable and accurate methods.

14C method is based on different content of 14C in biogenic and in fossil component: while the biogenic component reflects the modern atmospheric 14C activity, no 14C is present in fossil fuels. 14C method is suitable for samples of all types of fuel
“Problems” or limitations: i) the measurement of 14C content requires highly specialized instruments and personnel (this standard gives a number of about 100 radiometric and 40 AMS laboratories on the global scale!), ii) 14C releases in the 1950’s (“bomb-peak”) has diminished the accuracy of the 14C method in some cases
Methods for determination of fraction of biogenic component in any type of fuel or waste used in waste-to-energy plants
1 - manual sorting
2 - chemical dissolution
3 - 14C method
ASTM D6866-12 Standard Test Methods for Determining the Biobased Content of Solid, Liquid, and Gaseous Samples Using Radiocarbon Analysis. ASTM International. 2012.

A pure biogenic material reflects the modern atmospheric 14C activity, while no 14C is present in fossil fuels (oil, coal). Therefore, a biogenic fraction of any material of interest is proportional to its 14C content .
biogenic fraction
14C content

The 14C method is the most reliable method of determination of the biogenic fraction in fuels. It can be applied to various types of fuels used, such as solid communal waste, used car tyres, liquid fuels. It can be used also to determine the biobased content of various manufactured products (e.g., solvents and cleaners, lubricants, construction material, carpets…)
G.A. Norton and S.L. Devlin. Determining the modern carbon content of biobased products using radiocarbon analysis. Bioresource Technology 97 (2006) 2084–2090. Alternatively, the 14C method can be applied to determine 14C content of the CO2 produced by combustion of various fuels in waste-to-energy plants
J. Mohn, S. Szidat, J. Fellner, H. Rechberger, R. Quartier, B. Buchmann, L. Emmenegger. Determination of biogenic and fossil fuel CO2 emitted by waste incineration based on 14CO2 and mass balances. Bioresource Technology 99 (2008) 6471–6479
G.K.P Muir, S. Hayward, B.G. Tripney, G.T. Cook, P. Naysmith, B.M.J. Herbert, M.H. Garnet, M. Wilkinskon. Determining the biomass fraction of mixed waste fuels: A comparison of existing industry and 14C-based methodologies. Waste management 35 (2015) 293-300.

How to determine biogenic fraction
Results of measurement are presented as relative specific 14C activity, a14C, expressed in percent of modern carbon (pMC) 100 pMC = 226 Bq/kgC A material can be composed of a biogenic component (of fraction fbio) and a fossil component (ff)
ff + fbio = 1 The measured 14C activity of such a mixed material, a14Cmix, can be presented as a combination of the biogenic and fossil components:
a14Cmix = ff a14Cf + fbio a14Cbio
Since in fossil fuels all 14C had been decayed, and a14Cf = 0 pMC, it follows that the fraction of the biogenic component can be determined as
fbio = a14Cmix / a14Cbio

16
Anthropogenic activities
14C in atmospheric CO2 on the Northern Hemisphere
1950 1960 1970 1980 1990 2000 2010
100
120
140
160
180
200
nuclear test ban treaty, 1963
inte
nse
atmosp
heric
nuclear t
ests
14C
in
atm
osp
he
ric C
O2 (
pM
C)
year
fossil
fuel
com
bustion
The ASTM 6866 recommends the use of 105 pMC for biogenic material originating from last several years.
17
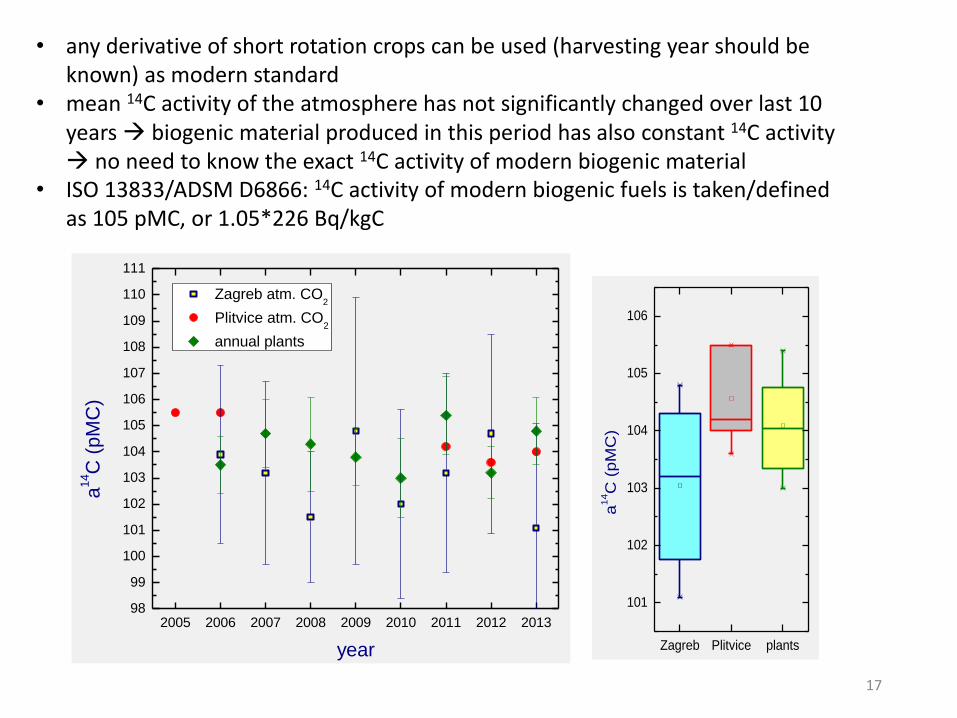
• any derivative of short rotation crops can be used (harvesting year should be known) as modern standard
• mean 14C activity of the atmosphere has not significantly changed over last 10 years biogenic material produced in this period has also constant 14C activity no need to know the exact 14C activity of modern biogenic material
• ISO 13833/ADSM D6866: 14C activity of modern biogenic fuels is taken/defined as 105 pMC, or 1.05*226 Bq/kgC
2005 2006 2007 2008 2009 2010 2011 2012 201398
99
100
101
102
103
104
105
106
107
108
109
110
111
Zagreb atm. CO2
Plitvice atm. CO2
annual plants
a14C
(pM
C)
year Zagreb Plitvice plants
101
102
103
104
105
106
a1
4C
(p
MC
)

Note: that the value of 105 pMC can be safely used for short-lived biomass that grew during last ~10 years. When the wood, wooden products or wooden pellets produced from a wood grown in the second half of the 20th century are used as fuels, 14C activities may lie in the range between 105 pMC and even ~190 pMC, depending of the year of growth. Such values would yield unrealistic fbio values of >100%, if the correct a14Cbio values were not used.
Z- Code Sample type LSC-B
a14
C (pMC)
σ
3871 X Mixture of plants and plastics, #1 58.48 0.31
3872 D Wood, sawdust, #2 140.25 0.59
3873 D Paper, #3 109.82 0.64
3874 X Plastics, #4 7.61 0.19
3875 X Plastics, various colours, #5 1.45 0.08
3876 X Mixed communal waste, #6 57.31 0.31

Measuring techniques for 14C Any measuring technique used in 14C laboratories could be used.
Radiometric measurement techniques are based on counting 14C decay rate by liquid scintillation counters (LSC)
- a sample can be prepared in form of benzene or as CO2 absorbed in a cocktail
Accelerator mass spectrometry (AMS) technique counts the number of
12C, 13C and 14C atoms - graphite targets are prepared (or CO2)

Comparison of characteristics (precision, complexity, and price) of various techniques for biogenic fraction determination by the 14C method.
Measurement technique
Sample types
Required mass of carbon
Complexity *
Precision *
Price *
Main drawback
AMS all ~1 mg 3 4 4 representativeness of the sample ##
LSC-benzene # all ~4 g 4 3 3 time-consuming
LSC-CO2 # all ~0.6 g 2 2 2 high uncertainty low sensitivity
LSC-direct liquid fuels
10 ml of liquid
1 1 1 quenching
The higher the number, the more complex the method / the lower the uncertainty / the higher the price
Oxidation is critical because samples tend to explode (liquid fuels) ## Sample heterogeneity: Advantageous to use gram size quantities and LSC

14C activity of used car tyres Certain industries use end-of-life-tyres as fuel to reduce the consumption of traditional fuels and also to reduce their energy bills. The cement industry uses more scrap tyre fuels than any other industry. Tyres provide a heat output equivalent to that of petroleum coke and coal, but also make it possible to reduce fossil CO2 emissions due to combustion significantly because of their biomass fraction of 18.3 % and 29.1 % in passenger car tyres and truck tyres, respectively. C. Clauzade. Using used tyres as an alternative source of fuel: Reference values and characterisation protocols. Reference document. ALIAPUR, R/D Department. 2009.
Car and truck tyres represent a heterogeneous material, and the sampling is a critical step of the complete process of determination of the biogenic fraction in tyres by the 14C method.

Radiocarbon laboratory of the RBI: car tyre samples obtained from cement industries. non-homogeneous bulk samples of ~1 kg consisted of several types of material
Pre-treatment: acid-base-acid method usually applied in radiocarbon dating laboratories for removal of impurities
About 90 g of homogenized tyre scraps was carbonized for 15 min at 400 °C followed by 15 min at 600 °C.
An aliquot of 7.5 g (out of ~30 g obtained after the carbonization) was taken for combustion if benzene synthesis followed, while for the CO2-absorption technique an aliquot of ~5 g produced enough CO2 to prepare duplicate CO2-cocktails. Ones the CO2 was obtained, further preparation and measurement procedure was the same as for any other sample. For AMS, about 14 mg of pre-treated and homogenized tyre scraps was taken for combustion and subsequent graphite synthesis

14C activities of several car tyre samples obtained by different measurement techniques, as well as the fraction of biogenic component
AMS gave the smallest and LSC-CO2 the highest measurement uncertainties the AMS subsample (14 mg) may not represent a perfectly homogenized mixture of various types of material in a composed sample which may cause somewhat different a14C value from that obtained by the LSC method. All techniques gave consistent results. Generally, all obtained fbio fractions are lower than the global average of biomass fraction of car tyres (18 – 29 %).
AMS LSC-benzene LSC-CO2
Sample a14C
(pMC) fbio (%)
a14C (pMC)
fbio (%)
a14C (pMC)
fbio (%)
A 4.32 ± 0.05 4.11 ± 0.05 8.3 ± 1.5 7.9 ± 1.4
B 8.7 ± 0.9 8.3 ± 0.9
C 6.2 ± 1.0 5.9 ± 1.0
D 5.8 ± 0.2 5.5 ± 0.2
E 6.0 ± 0.9 5.7 ± 0.9
F 4.3 ± 0.1 4.1 ± 0.2

Liquid fuels
According to the EU Directive 2009/28/EC [14] all (liquid) fuels have to contain at least 10 % of bio-fuel, i.e., blend of biogenic origin, by 2020. Fossil matrix of the fuels is either gasoline (benzine) or diesel (gas oil), while biogenic blends are usually bioethanol, fatty acid methyl esters (FAMEs), hydrogenated vegetable oil (HVO) and others.
Biofuels - definition are liquid or gaseous fuels for transport produced from biomass. Directive 2003/30/EC on the promotion of the use of biofuels or other renewable fuels for transport - at least the following products shall be considered as biofuels:
bioethanol, biodiesel, biogas, biomethanol, biodimethylether, bio-ETBE (ethyl-tertio-butyl-ether), bio-MTBE (methyl-tertio-butyl-ether), synthetic biofuels, biohydrogen and pure vegetable oil.

25
Direct measurement of 14C activity in liquid fuels by LSC
Advantage:
Fast sample preparation
Low cost
Problems:
Not standardized yet
Higher uncertainty
Color quenching
A large variety of mixtures fossil matrix + biogenic blend

26
Various colors of fuels cause different counting properties (SQP - quenching, counting efficiency)
Various methods have been suggested to overcome this problem
• Different quenching curves for various combinations of the fossil matrix and biogenic blends by using 14C spikes
• Various methods of decolorization - bleaching
• Different evaluation techniques of the LSC spectra for different combinations f.f. + b.b.

27
We were looking for a simple, fast, robust technique, though reliable and accurate, that would depend neither on the type of the fossil matrix nor on the type of the biogenic blend
???

28
Idea!
Convert the problem/main drawback to the advantage - quenching parameter of various samples use as the calibration parameter!
By using different 100% biogenic and 100% fossil liquids of different colors we determined a relation between the two quantities measured by LSC Quantulus: SQP parameter and count rate

29
Determine the ratio of the liquid fuel and scintillator UltimaGold F 20 mL glass vials cocktail volume 20 mL LSC Quantulus ROI 145 – 570 ch
0 2 4 6 8 10 12 14 16
600
650
700
750
800
850
900
bioethanol
fossil
SQ
P
V (mL)
0 2 4 6 8 10 12 14 160
5
10
15
20
25
30
35
40
45
50
bioethanol gross
bioethanol net
fossil
count
rate
(m
in-1)
V (mL)

30
Background calibration curve (BCC) relates the SQP and count rates of various background samples, i.e. samples that do not contain 14C
400 450 500 550 600 650 700 750 800 850 900
1.0
1.5
2.0
2.5
fossil 1
fossil 2
fossil 3
fossil 4
benzene
benzine
water
cB (
min
-1)
SQPB
BCC
linear fit
R2 = 0.94

31
Modern calibration curve (MCC)
Liquid of biogenic origin: various brand of domestic oil, (bio)etanol p.a., benzene (modern samples)
450 500 550 600 650 700 750 800 850 900 950
0
10
20
30
40
50
60
70
80
90
100
benzene 105 pMC
sunflower oil
vegetable oil
(bio)ethanol
olive oil
pumpkin oil
cb
io (
min
-1)
SQP
polinom
R2 = 0.997
MCC

The procedure of data evaluation for the unknown sample: • measurement of SQP and count rate of the sample (SQP, c) • determination of background count rate corresponding to the
measured SQP value by using BCC (b) • determination of the count rate of the biogenic sample (cbio)
corresponding to the measured SQP values by using MCC The fraction of the biogenic component in the sample is calculated as the ratio of net count rates of the sample to the biogenic material.
All samples should be measured under the same conditions: • low-potassium glass vials of 20 ml • scintillation cocktail UltimaGoldF (UGF) • the ratio sample:UGF 10 ml : 10 ml • spectra recorded by LSC Quantulus evaluated in the window
124 – 570 channels The lowest detectable biogenic fraction is 0.5 % for measurement duration of 600 minutes
fbio = (c – b) / (cbio – b)

Test and validation various mixtures of fossil and biogenic liquids in the nominal concentration ranges of the biogenic component from 0 % to 100 %. • vegetable oil and fossil fuel that both have approximately the same
value of the SQP parameter • bioethanol and fossil fuel with different SQP values • bioethanol and 14C-free benzine In all cases, the calculated biogenic fraction agreed well with the nominal fraction. • mixtures of two different biogenic liquids (vegetable oil and
bioethanol, vegetable oil and olive oil) having different SQP

mixtures of vegetable oil and fossil fuel, similar SQP The measured fbio values agree very well with the nominal fbio values while the SQP values of all mixtures remained more-or-less constant.
100% vegetable oil 80% oil + 20% fossil 60% oil + 40% fos.. 40% oil + 60% fos. 20% oil + 80% fos. 100% fossil
0 10 20 30 40 50 60 70 80 90 100
0
10
20
30
40
50
60
70
80
90
100
nominal fbio
(%)
mea
sure
d f bi
o (%
)
linear fit
y = (1.01±0.14) x + (0.3±0.8)
R2 = 0.998
800
805
810
815
820
825
SQ
P

Mixtures of two 100%-biogenic liquids with different SQP: vegetable oil and (bio)ethanol
100% vegetable oil 80% oil + 20% bioeth. 50% oil + 50% bioeth. 20% oil + 80% bioeth. 100% bioeth. 100% bioeth. (earlier pr.).
0 20 40 60 80 100
760
780
800
820
SQ
P
fraction of vegetable oil (%)
95
100
105
110
115
0 20 40 60 80 100
fraction o
f bio
genic
com
ponent (%
)
SQP values and count rates changed continuously as the mixture composition changed. The measured biogenic fraction ranged from 97 % to >100 %. The results indicate: the method should be improved, specially for low SQP.

Bioethanol and benzine p.a. mixtures (different SQP)
0 20 40 60 80 100
0
20
40
60
80
100
f bio(%
)
biogenic (%)
benzine + bioethanol
R = 0.999
0 20 40 60 80 1000
5
10
15
20
25
30
35
40
45
750
800
850
900
R = 0.984
cp
m
SQP
cpm
SQ
P
biogenic (%)
R = 0.997

37
Bioethanol and fossil fuel mixtures of different SQP
100% bioethanol 80% bioeth. + 20% fossil 60% bioeth. + 40% fos. 40% bioeth. + 60% fos.. 20% bioeth. + 80% fos. 100% fossil
0 2 4 6 8 10
700
710
720
730
740
750
760
SQ
P
volume of bioethanol (mL)
Equation
y = Intercept + B1*x^1 + B2*x^2
Weight No Weighting
Residual Sum of Squares
18.8024
Adj. R-Square 0.98542
Value Standard Error
sqp Intercept 722.64202 1.95744
sqp B1 -9.19182 0.85176
sqp B2 1.25518 0.08114
V(bioethanol) + V(fossil) = 10 mL
0 20 40 60 80 100
0
20
40
60
80
100
V(bioethanol) + V(fossil) = 10 mL
linear fit
slope 1.01 ± 0.02
R2 = 0.997
me
asu
red
% b
iog
en
ic
nominal % biogenic
polynomial fit
R2 = 0.998
Mixtures bioethanol + fossil

No change in either SQP or count rate was observed - the prepared cocktails are stable during at least 3 months after preparation.
0 20 40 60 80 100700
750
800
850
vegetable oil
(bio)ethanol
background fossil
SQ
P
days after cocktail preparation
0 20 40 60 80 1000
1
2
3
4
40
45
50
55
60
65
70
vegetable oil
(bio)ethanol
background fossil
co
un
t ra
te (
min
-1)
days after cocktail preparation
Long-term stability of SQP and count rate - aging

Intercomparison The obtained results were in good agreement with those obtained by different evaluation technique, both for the benzine and diesel as the fossil matrix and various biogenic blends.
no. Fue
l m
atri
x RBI Zagreb JSI Ljubljana SQP fbio (%) SQP fbio (%)
1
die
sel
636.3 8.2 ± 0.8 657.3 7 (nominal)
2 716.9 2.2 ± 0.3 742.4 1.73 ± 0.10
3 758.3 5.8 ± 0.3 771.8 5.17 ± 0.26
4 885.8 0 (< 0.5) 880.3 0.5 ± 0.3 (< 0.52)
5 776.8 0.64 ± 0.30 776.2 0.62 ± 0.37
6
ben
zin
e 841.6 0.1 ± 0.1 (< 0.5) 838.9 0.26 ± 0.19 (< 0.57)
7 790.7 3.1 ± 0.2 790.6 5.22 ± 0.57
823.4 3.4 ± 0.2 828.4 4.44 ± 0.43 8
I. Krajcar Bronić, J. Barešić, N. Horvatinčić, R. Krištof and J. Kožar-Logar. New technique of determination of biogenic fraction in liquid fuels by the 14C method. Proc. 10th Symp. of Croatian Radiation Protection Association, pp. 390-395, Šibenik, Croatia, 15-17 April 2015. HDZZ, Zagreb, 2015

Conclusion Determination of the biogenic fraction in various materials is an interesting topic for the scientists, for various industries and for the global environment, because the use of biogenic materials for energy production and transport may lower the increase of atmospheric CO2 conc. of fossil origin.
The 14C method is a very powerful method for determination of the biogenic fraction.
Different measurement techniques (developed for the radiocarbon dating application) can be successfully applied also for the purpose of biogenic fraction determination. Methods differ in complexity and the required mass of a sample, precision and costs.
The innovative data evaluation technique of the direct measurement of 14C activity of liquid fuels in LSC depends neither on the fossil matrix or the biogenic additive type, it does not require 14C spikes or other expensive standards. One does not need to know the qualitative composition of the fuels, as it is the case for other evaluation techniques.
Lowest detectable biogenic fraction is 0.5 %.
The method still needs some improvements, especially for highly quenched liquids, but it gives comparable results with other data evaluation techniques.