determination of acetazolamide by graphene paste electrode
TRANSCRIPT

Journal of Electroanalytical Chemistry 683 (2012) 119–124
Contents lists available at SciVerse ScienceDirect
Journal of Electroanalytical Chemistry
journal homepage: www.elsevier .com/locate / je lechem
Determination of acetazolamide by graphene paste electrode
Vida Shakibaian a, Mohammad Hadi Parvin b,⇑a Department of Organic Chemistry, Faculty of Chemistry, Razi University, Kermanshah, Iranb Department of Analytical Chemistry, Faculty of Chemistry, Razi University, Kermanshah, Iran
a r t i c l e i n f o
Article history:Received 20 April 2012Received in revised form 10 July 2012Accepted 17 July 2012Available online 28 August 2012
Keywords:Graphene paste electrode (GPE)Reduced graphene oxide (RGO)VoltammetryWorking electrodeAnalytical chemistryAcetazolamide (ACZ)
1572-6657/$ - see front matter � 2012 Elsevier B.V. Ahttp://dx.doi.org/10.1016/j.jelechem.2012.07.042
⇑ Corresponding author. Address: Department of AnChemistry, Razi University, Kermanshah, Iran, Tel.: +94274559.
E-mail address: [email protected] (M.H. Par
a b s t r a c t
Graphene is ideally suited for implementation in electrochemical applications due to its reported largeelectrical conductivity, large surface area, unique heterogeneous electron transfer rate, and low produc-tion cost. This paper presents a method for the construction of graphene paste electrode (GPE) fromreduced graphene oxide (RGO). Direct electrochemical detection of drug is of high importance in analyt-ical chemistry. Here, the GPE was successfully used for the determination of acetazolamide (ACZ). So, theinfluence of some experimental variables such as working solution pH, supporting electrolyte, scan rate,pulse amplitude, and possible interferences were studied. The proposed sensor exhibited a high sensitiv-ity and good selectivity, and it was applied for clinical evaluation of ACZ.
� 2012 Elsevier B.V. All rights reserved.
1. Introduction
Graphene is a monolayer of tightly packed carbon atoms. It is atwo-dimensional planar sheet of sp2 bonded carbon atoms ar-ranged in a hexagonal configuration, which attracts considerableattention in the scientific community from a plethora of areas[1,2]. Graphene is ideally suited for implementation in electro-chemical applications due to its reported large electrical conduc-tivity, large surface area, unique heterogeneous electron transferrate, and low production cost [3–8].
Graphene has been utilized beneficially in many areas, forexample, in fuel cells [9,10], electric double-layer capacitors [11],for modification with electro-catalytic nanoparticles [12], and inmetal oxide modified graphene hybrids for use as high-capacityanode materials for lithium ion batteries [13]. Chemically modifiedgraphene contains oxygen functional groups such as epoxide, alco-hol, and carboxylic acid. Previous studies proved that the uniqueplanar structure of graphene displayed nice properties in electro-chemistry [14–18] and there is a vast interest surrounding theuse of graphene as an electrode material for sensing a range of tar-get analytes such as dopamine [19], hydrogen peroxide [20], nitricoxide [21] and glucose biosensors [22].
The GPE can be widely used in the determination of drugs, bio-molecule and other organic species because of its easy preparation
ll rights reserved.
alytical Chemistry, Faculty of8 937 8157766; fax: +98 831
vin).
and simple modification. In experimental conditions GPE has awider potential window, and its residual currents are lower thanthose of the glassy carbon electrodes or noble metallic electrodes[16]. Reduced graphene oxide (RGO) can be fabricated in variouseffective ways [23–25]. Here, in this paper, RGO was used for theconstruction of novel type working electrode. We have describedthe construction and application of GPE as a new working electrodefor the examination of voltammetric behavior and the determina-tion of acetazolamide (ACZ). Acetazolamide (ACZ), N-(5-sulfa-moyl-1,3,4-thiadiazol-2-yl) acetamide, is a carbonic anhydraseinhibitor (CAI) used clinically in the management of glaucoma[26]. It is also used, either alone or in association with other antiepi-leptics, for the treatment of various forms of epilepsy, and it is themost frequently used drug for the prophylaxis of high-altitude disor-ders [27]. The pharmacokinetics of ACZ is well documented inhealthy subjects. The adsorption of drug is fast, reaching peak plas-ma concentrations approximately 1–3 h after oral administration.About 80% of the drug is excreted by tubular secretion of the anionicspecies, and 70–90% of the administered dose is recovered un-changed within 24 h [28]. The determination of ACZ in biological flu-ids is usually carried out by sol–gel optical biosensor [29],polarography [30], enzymatic assay [31], electron-capture GLC[32], molecular imprinted polymer (MIP) [33], carbon paste elec-trode modified with gold nanoparticle [34] and high-performance li-quid chromatography [35–39]. However, most of the above methodsrequire several time consuming manipulation steps, sophisticatedinstruments and special training. Hence, it is of primary importanceto develop an alternative method for ACZ determination with a highdegree of selectivity and sensitivity.
-20
-15
-10
-5
0
5
10
-1 -0.8 -0.6 -0.4 -0.2 0I/µ
A
E/V (Ag/Agcl)
I pc = –163.4ν –0.436
-10
00 0.1 0.2 0.3 0.4
(A)
(B)
120 V. Shakibaian, M.H. Parvin / Journal of Electroanalytical Chemistry 683 (2012) 119–124
2. Experimental
2.1. Reagents
ACZ powder (P99%) was purchased from Sigma (Madrid,Spain). A stock solution of 1.0 mM was prepared by dissolving anappropriate amount of ACZ in methanol. This solution was storedat dark and 4 �C. Other solutions were prepared by the dilutionof the stock solution. Paraffin oil and flake graphite were obtainedfrom Merck Company and were used as received. All other chemi-cals were of analytical grade and were used without further puri-fication. 0.1 M phosphate buffer with pH = 2.0 was used assupporting electrolyte. In pH < 3, we used 0.1 M HCl solution forthe reduction of pH.
2.2. Apparatus
Voltammetric experiments were performed with an Autolab(Eco Chemie B.V.) PGSTAT30 potentiostat/galvanostat. A conven-tional three-electrode system was used with a paste working elec-trode (GPE or CPE), an Ag/AgCl and a Pt wire as the reference andcounter electrode respectively. Solutions were deoxygenated withhigh purity nitrogen for 5 min prior to each experiment. The mea-surement was carried out at room temperature under the nitrogenatmosphere. A Metrohm-691 pH-meter (Switzerland) was used forpH adjustments. High performance liquid chromatography (HPLC)was performed on a KNAUER liquid chromatograph systememploying EZ-Chrome Elite software. The variable wavelengthUV–Vis detector was operated at 254 nm for ACZ determination.A 20 ll injection loop and a reversed phase C18 column(250 mm � 4.0 mm i.d., Eurospher 100-5) were used. The mobilephase was 95/3/2 (v/v/v) mixture of 0.4 M sodium acetate buffer/acetonitrile/methanol adjusted to pH 5.1 at a flow rate of2 ml min�1.
2.3. Preparation of reduced graphene oxide (RGO)
The graphene oxide (GO) was synthesized using a modifiedHummers method with a pre-oxidation treatment [23,24]. In a typ-ical experiment, concentrated H2SO4 (5 ml) was heated to 80 �C ina 25 ml round bottom flask, then K2S2O8 (0.15 g) and P2O5 (0.15 g)were added to the acid and stirred until fully dissolved. Nextgraphite flake (0.2 g) was added to the reaction and kept at 80 �Cfor 4.5 h. The mixture was then cooled naturally, diluted withdeionized (DI) water, filtered (Whatman, Grade No. 4) and rinsedwith additional DI water (100 ml) to remove residual reactants,and finally dried in air. The pre-oxidized graphite flake wascollected and transferred into a 50 ml round bottom flask with
Scheme 1. Picture of graphene paste electrode (GPE).
concentrated H2SO4 (25 ml) and chilled to 0 �C using an ice bath.KMnO4 (1.0 g) was slowly added to the mixture while stirring, tak-ing caution to keep the temperature below 10 �C. The flask wasthen moved to a 35 �C water bath and left for 2–12 h, and thentransferred into an Erlenmeyer flask (500 ml) in the ice bath. DI(100 ml) was slowly added to the flask while stirring, taking cau-tion so that the temperature does not rise above 55 �C. After dilu-tion, 5 ml of 30% H2O2 solution was added to the mixture, whichturned into bright yellow. [Warning: This process induced violentbubble formation, so the solution needed to be added slowly toprevent overflowing.] This mixture was centrifuged, rinsed with3.4% HCl solution (3 times) to remove residual salts, and thenrinsed with acetone (3 times) to remove residual acid. The final
R² = 0.999
-70
-60
-50
-40
-30
-20
I/µ
A
ν/ Vs–1
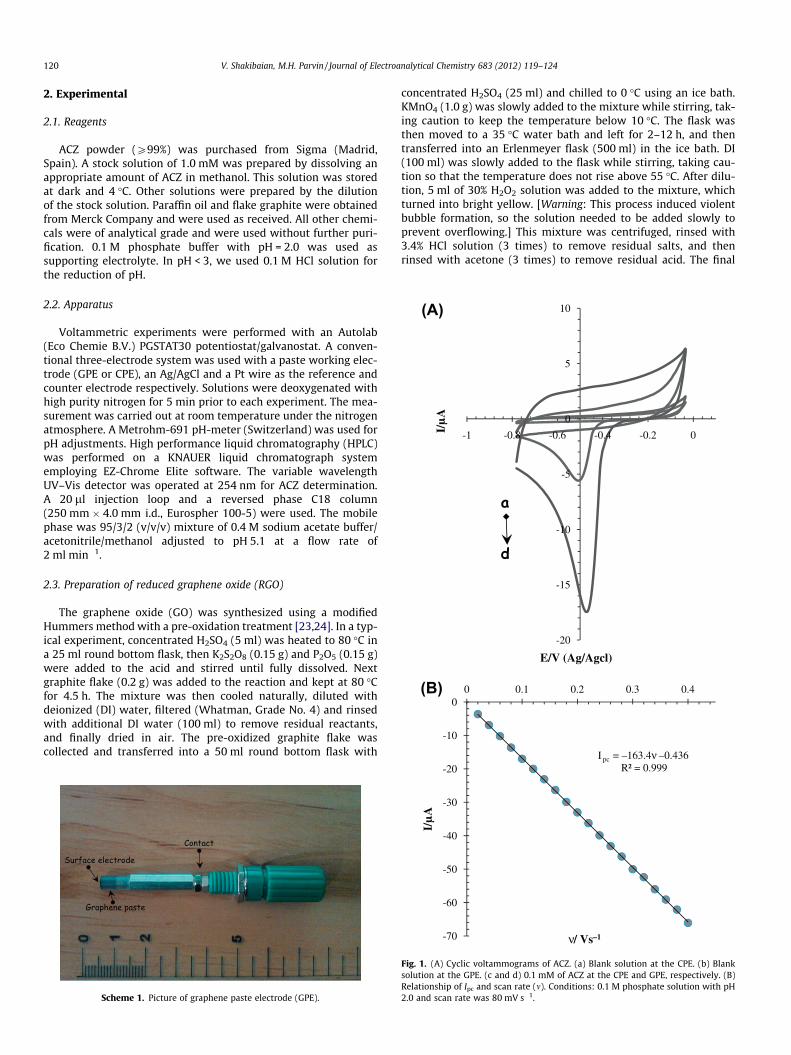
Fig. 1. (A) Cyclic voltammograms of ACZ. (a) Blank solution at the CPE. (b) Blanksolution at the GPE. (c and d) 0.1 mM of ACZ at the CPE and GPE, respectively. (B)Relationship of Ipc and scan rate (m). Conditions: 0.1 M phosphate solution with pH2.0 and scan rate was 80 mV s�1.
V. Shakibaian, M.H. Parvin / Journal of Electroanalytical Chemistry 683 (2012) 119–124 121
solid GO was dried in air or under vacuum for further use. The solidGO could be easily re-dispersed in water. The dispersion was thencentrifuged at low speed 3000 rpm for 30 min in order to removelarge chucks. In the reduction step, 100 mg of GO was dispersedin 100 mL of water and sonicated for 1 h. Two hundred mg ofNaBH4 was added to the dispersion. The mixture was stirred for30 min and heated at 125 �C for 3 h. During the reduction process,the yellow–brown solution gradually yielded a black precipitate.The black solid was isolated by centrifugation, washed with water(4 times), and finally dried. [40]
2.4. Preparation of working electrode
The graphene paste mixture and carbon paste mixture wereprepared by hand-mixing of 0.5 g RGO powder and graphite with180 lL of mineral oil respectively. The two mixtures were homog-enized (25 min) then packed into a piston-driven graphene pasteelectrode and carbon paste electrode holder (3 mm) (Scheme 1).A fresh electrode surface was obtained by squeezing out a smallportion of paste and polishing it with wet filter paper until asmooth surface was obtained.
2.5. Analytical procedure
Supporting electrolyte (10.0 mL) (phosphate buffer) was trans-ferred into the voltammetric cell and deaerated with high puritynitrogen (99.99%) for 5 min. The voltammetric curve was recordedas background voltammogram over the potential range from �0.75to �0.15 V using DPV mode on a GPE. The required aliquot of thestandard solution of ACZ was added by means of a micropipetteand its voltammogram was recorded. The pulse amplitude of50 mV, pulse width of 35 ms and a scan rate of 60 mV s�1 wereused for differential pulse voltammetry. All of the electrochemicalexperiments were carried out under nitrogen atmosphere and atambient laboratory temperature (25 �C). Between experiments,the cell was treated with concentrated nitric acid and then washedwith water.
Scheme 2. Mechanism for e
2.6. Human serum sample preparation
Serum sample was collected from a patient volunteer 1.5 h afterusing a tablet containing 250 mg ACZ and stored frozen until assay.0.2 ml methanol, as serum protein precipitating agent, was addedto 0.8 ml of the serum sample. After vortexing for 30 s, the precip-itated protein was separated out by centrifugation for 3 min at14,000 r.p.m. The clear supernatant layer was filtered through a0.45-lm milli-pore filter to produce a protein-free human serum.A 100 ll of free protein serum sample was transferred into a10 ml volumetric flask containing 9.0 ml phosphate buffer(pH = 2) and made up to the volume with distilled water.
2.7. Urine sample preparation
The fresh urine sample was collected from a 62 years old pa-tient volunteer, 3 h after using a tablet containing 250 mg of ACZ.The urine sample was filtered through a 0.45-lm milli-pore filter.The drug content of 1.0 ml of filtrated urine was extracted into0.5 ml ethyl acetate. The extract was evaporated and the residualwas dissolved in 0.5 ml ethanol. A 120.0 ll of this solution wastransferred into a 10.0 ml volumetric flasks containing phosphatebuffer (pH = 2) and different amounts of standard solution ofACZ. After adjusting the volume of solution, their ACZ contentswere determined using optimized proposed procedure.
3. Results and discussion
3.1. Electrochemical behavior of acetazolamide
To elucidate the electrode reaction of ACZ, cyclic voltammetrictechnique was used. The presentative cyclic voltammograms re-corded in 0.1 M phosphate buffer solution with pH 2.0 as support-ing electrolyte in the absence and presence of 0.1 mM of ACZ atbare CPE and GPE are shown in Fig. 1A. As it can be seen, no redoxpeaks were observed in the absence of ACZ at the surface of bothtested electrodes (curves a and b). A weak and broad cathodic peak,at –0.51 V, in curve c indicated that, the drug (ACZ) was electroac-tive at the CPE in this electrolyte solution, but this reduction peak
lectroreduction of ACZ.
-7
-6
-5
-4
-3
-2
-1
0
1
-0.95 -0.75 -0.55 -0.35 -0.15 0.05
I/µA
E/V (Ag/AgCl)
Ipc = –2.014CACZ – 0.639R² = 0.997
-8
-7
-6
-5
-4
-3
-2
-1
00 0.75 1.5 2.25 3
I/µA
[ACZ] /µA
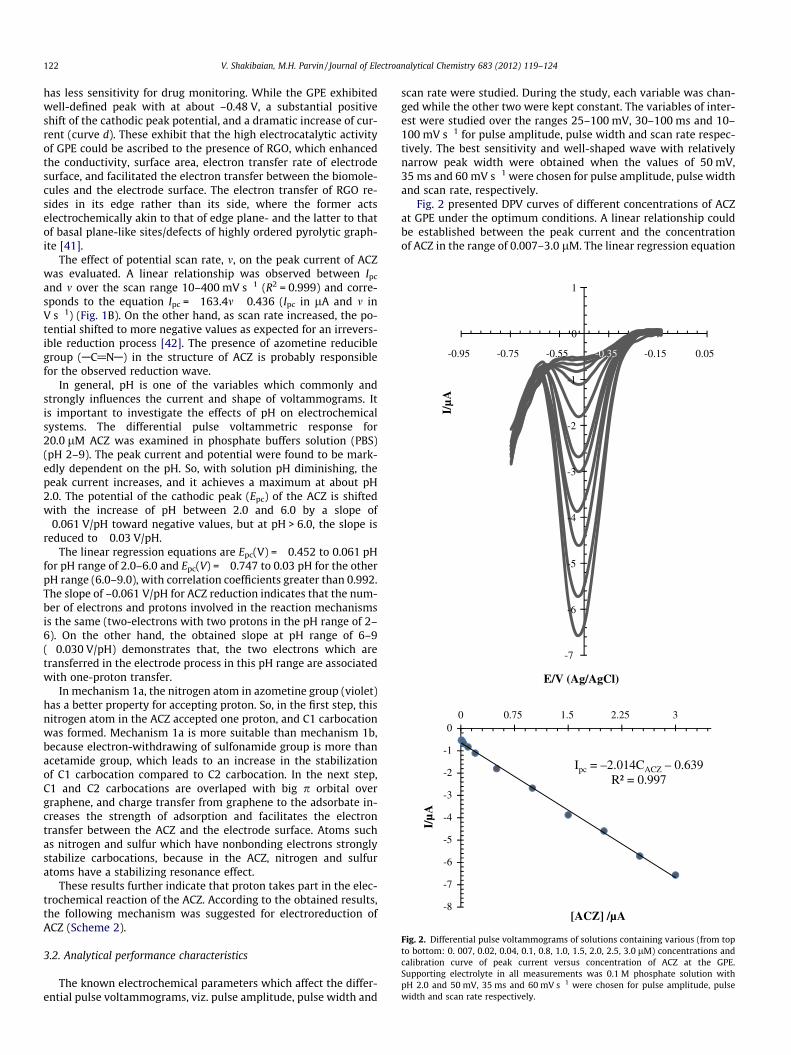
Fig. 2. Differential pulse voltammograms of solutions containing various (from topto bottom: 0. 007, 0.02, 0.04, 0.1, 0.8, 1.0, 1.5, 2.0, 2.5, 3.0 lM) concentrations andcalibration curve of peak current versus concentration of ACZ at the GPE.Supporting electrolyte in all measurements was 0.1 M phosphate solution withpH 2.0 and 50 mV, 35 ms and 60 mV s�1 were chosen for pulse amplitude, pulsewidth and scan rate respectively.
122 V. Shakibaian, M.H. Parvin / Journal of Electroanalytical Chemistry 683 (2012) 119–124
has less sensitivity for drug monitoring. While the GPE exhibitedwell-defined peak with at about –0.48 V, a substantial positiveshift of the cathodic peak potential, and a dramatic increase of cur-rent (curve d). These exhibit that the high electrocatalytic activityof GPE could be ascribed to the presence of RGO, which enhancedthe conductivity, surface area, electron transfer rate of electrodesurface, and facilitated the electron transfer between the biomole-cules and the electrode surface. The electron transfer of RGO re-sides in its edge rather than its side, where the former actselectrochemically akin to that of edge plane- and the latter to thatof basal plane-like sites/defects of highly ordered pyrolytic graph-ite [41].
The effect of potential scan rate, m, on the peak current of ACZwas evaluated. A linear relationship was observed between Ipc
and m over the scan range 10–400 mV s�1 (R2 = 0.999) and corre-sponds to the equation Ipc = �163.4m �0.436 (Ipc in lA and m inV s�1) (Fig. 1B). On the other hand, as scan rate increased, the po-tential shifted to more negative values as expected for an irrevers-ible reduction process [42]. The presence of azometine reduciblegroup (AC@NA) in the structure of ACZ is probably responsiblefor the observed reduction wave.
In general, pH is one of the variables which commonly andstrongly influences the current and shape of voltammograms. Itis important to investigate the effects of pH on electrochemicalsystems. The differential pulse voltammetric response for20.0 lM ACZ was examined in phosphate buffers solution (PBS)(pH 2–9). The peak current and potential were found to be mark-edly dependent on the pH. So, with solution pH diminishing, thepeak current increases, and it achieves a maximum at about pH2.0. The potential of the cathodic peak (Epc) of the ACZ is shiftedwith the increase of pH between 2.0 and 6.0 by a slope of�0.061 V/pH toward negative values, but at pH > 6.0, the slope isreduced to �0.03 V/pH.
The linear regression equations are Epc(V) = �0.452 to 0.061 pHfor pH range of 2.0–6.0 and Epc(V) = �0.747 to 0.03 pH for the otherpH range (6.0–9.0), with correlation coefficients greater than 0.992.The slope of –0.061 V/pH for ACZ reduction indicates that the num-ber of electrons and protons involved in the reaction mechanismsis the same (two-electrons with two protons in the pH range of 2–6). On the other hand, the obtained slope at pH range of 6–9(�0.030 V/pH) demonstrates that, the two electrons which aretransferred in the electrode process in this pH range are associatedwith one-proton transfer.
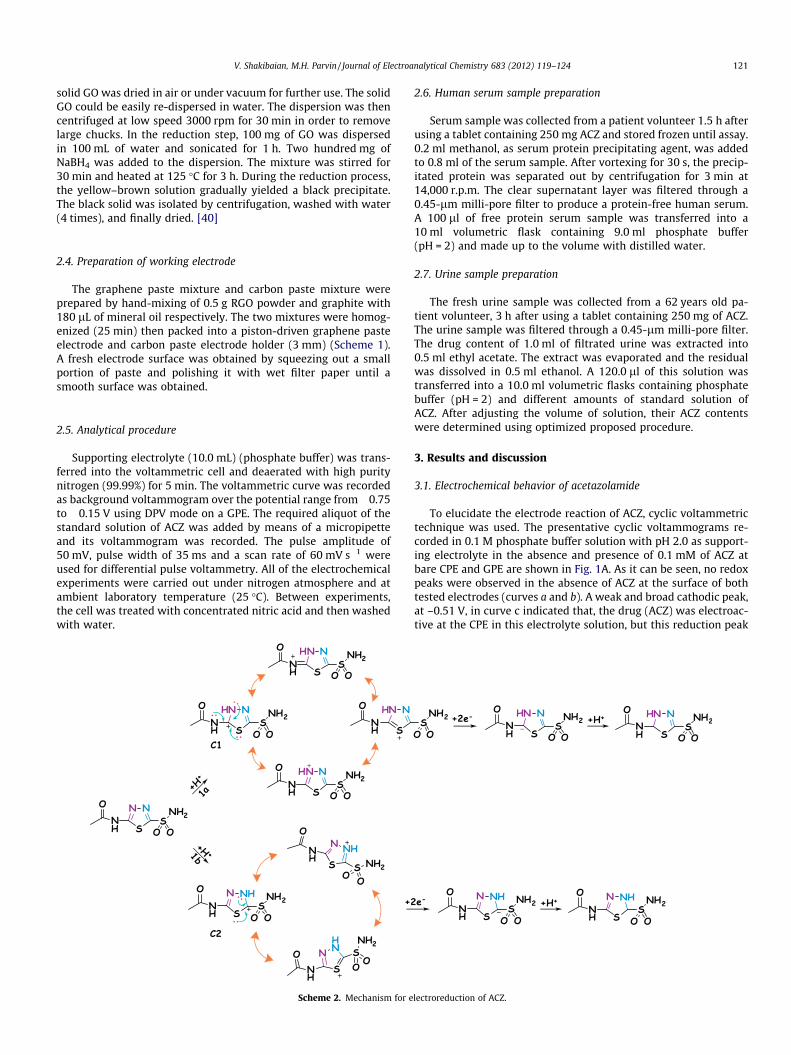
In mechanism 1a, the nitrogen atom in azometine group (violet)has a better property for accepting proton. So, in the first step, thisnitrogen atom in the ACZ accepted one proton, and C1 carbocationwas formed. Mechanism 1a is more suitable than mechanism 1b,because electron-withdrawing of sulfonamide group is more thanacetamide group, which leads to an increase in the stabilizationof C1 carbocation compared to C2 carbocation. In the next step,C1 and C2 carbocations are overlaped with big p orbital overgraphene, and charge transfer from graphene to the adsorbate in-creases the strength of adsorption and facilitates the electrontransfer between the ACZ and the electrode surface. Atoms suchas nitrogen and sulfur which have nonbonding electrons stronglystabilize carbocations, because in the ACZ, nitrogen and sulfuratoms have a stabilizing resonance effect.
These results further indicate that proton takes part in the elec-trochemical reaction of the ACZ. According to the obtained results,the following mechanism was suggested for electroreduction ofACZ (Scheme 2).
3.2. Analytical performance characteristics
The known electrochemical parameters which affect the differ-ential pulse voltammograms, viz. pulse amplitude, pulse width and
scan rate were studied. During the study, each variable was chan-ged while the other two were kept constant. The variables of inter-est were studied over the ranges 25–100 mV, 30–100 ms and 10–100 mV s�1 for pulse amplitude, pulse width and scan rate respec-tively. The best sensitivity and well-shaped wave with relativelynarrow peak width were obtained when the values of 50 mV,35 ms and 60 mV s�1 were chosen for pulse amplitude, pulse widthand scan rate, respectively.
Fig. 2 presented DPV curves of different concentrations of ACZat GPE under the optimum conditions. A linear relationship couldbe established between the peak current and the concentrationof ACZ in the range of 0.007–3.0 lM. The linear regression equation
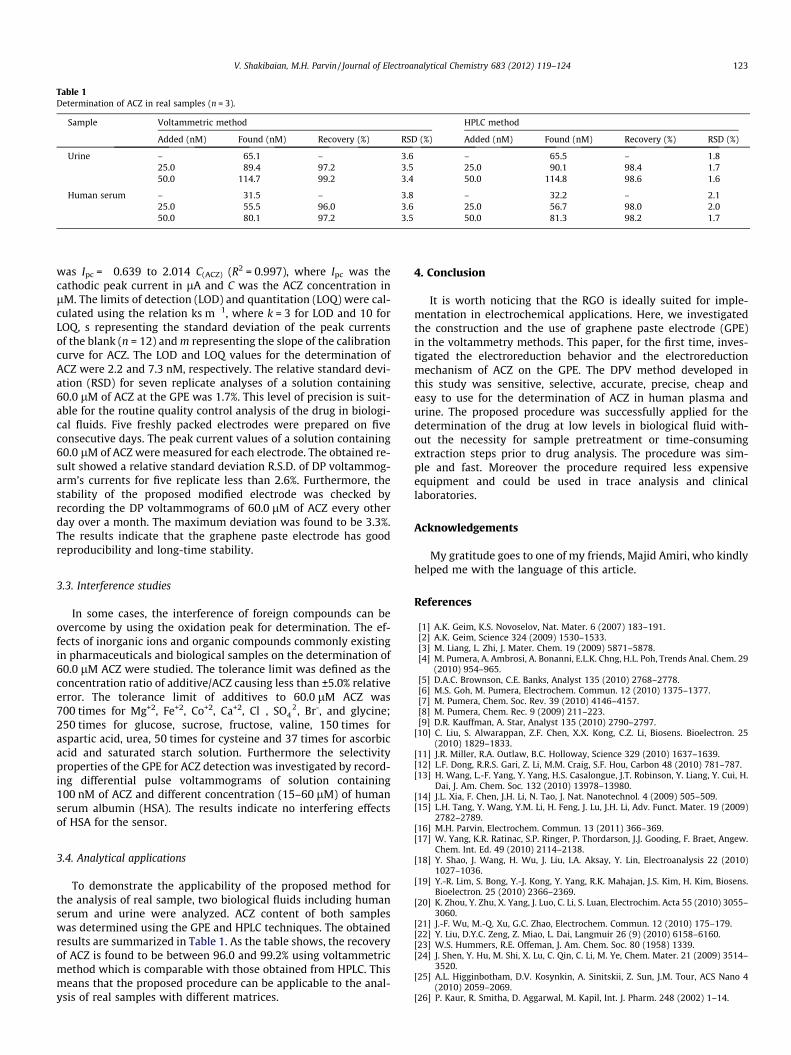
Table 1Determination of ACZ in real samples (n = 3).
Sample Voltammetric method HPLC method
Added (nM) Found (nM) Recovery (%) RSD (%) Added (nM) Found (nM) Recovery (%) RSD (%)
Urine – 65.1 – 3.6 – 65.5 – 1.825.0 89.4 97.2 3.5 25.0 90.1 98.4 1.750.0 114.7 99.2 3.4 50.0 114.8 98.6 1.6
Human serum – 31.5 – 3.8 – 32.2 – 2.125.0 55.5 96.0 3.6 25.0 56.7 98.0 2.050.0 80.1 97.2 3.5 50.0 81.3 98.2 1.7
V. Shakibaian, M.H. Parvin / Journal of Electroanalytical Chemistry 683 (2012) 119–124 123
was Ipc = �0.639 to 2.014 C(ACZ) (R2 = 0.997), where Ipc was thecathodic peak current in lA and C was the ACZ concentration inlM. The limits of detection (LOD) and quantitation (LOQ) were cal-culated using the relation ks m�1, where k = 3 for LOD and 10 forLOQ, s representing the standard deviation of the peak currentsof the blank (n = 12) and m representing the slope of the calibrationcurve for ACZ. The LOD and LOQ values for the determination ofACZ were 2.2 and 7.3 nM, respectively. The relative standard devi-ation (RSD) for seven replicate analyses of a solution containing60.0 lM of ACZ at the GPE was 1.7%. This level of precision is suit-able for the routine quality control analysis of the drug in biologi-cal fluids. Five freshly packed electrodes were prepared on fiveconsecutive days. The peak current values of a solution containing60.0 lM of ACZ were measured for each electrode. The obtained re-sult showed a relative standard deviation R.S.D. of DP voltammog-arm’s currents for five replicate less than 2.6%. Furthermore, thestability of the proposed modified electrode was checked byrecording the DP voltammograms of 60.0 lM of ACZ every otherday over a month. The maximum deviation was found to be 3.3%.The results indicate that the graphene paste electrode has goodreproducibility and long-time stability.
3.3. Interference studies
In some cases, the interference of foreign compounds can beovercome by using the oxidation peak for determination. The ef-fects of inorganic ions and organic compounds commonly existingin pharmaceuticals and biological samples on the determination of60.0 lM ACZ were studied. The tolerance limit was defined as theconcentration ratio of additive/ACZ causing less than ±5.0% relativeerror. The tolerance limit of additives to 60.0 lM ACZ was700 times for Mg+2, Fe+2, Co+2, Ca+2, Cl�, SO�2
4 , Br-, and glycine;250 times for glucose, sucrose, fructose, valine, 150 times foraspartic acid, urea, 50 times for cysteine and 37 times for ascorbicacid and saturated starch solution. Furthermore the selectivityproperties of the GPE for ACZ detection was investigated by record-ing differential pulse voltammograms of solution containing100 nM of ACZ and different concentration (15–60 lM) of humanserum albumin (HSA). The results indicate no interfering effectsof HSA for the sensor.
3.4. Analytical applications
To demonstrate the applicability of the proposed method forthe analysis of real sample, two biological fluids including humanserum and urine were analyzed. ACZ content of both sampleswas determined using the GPE and HPLC techniques. The obtainedresults are summarized in Table 1. As the table shows, the recoveryof ACZ is found to be between 96.0 and 99.2% using voltammetricmethod which is comparable with those obtained from HPLC. Thismeans that the proposed procedure can be applicable to the anal-ysis of real samples with different matrices.
4. Conclusion
It is worth noticing that the RGO is ideally suited for imple-mentation in electrochemical applications. Here, we investigatedthe construction and the use of graphene paste electrode (GPE)in the voltammetry methods. This paper, for the first time, inves-tigated the electroreduction behavior and the electroreductionmechanism of ACZ on the GPE. The DPV method developed inthis study was sensitive, selective, accurate, precise, cheap andeasy to use for the determination of ACZ in human plasma andurine. The proposed procedure was successfully applied for thedetermination of the drug at low levels in biological fluid with-out the necessity for sample pretreatment or time-consumingextraction steps prior to drug analysis. The procedure was sim-ple and fast. Moreover the procedure required less expensiveequipment and could be used in trace analysis and clinicallaboratories.
Acknowledgements
My gratitude goes to one of my friends, Majid Amiri, who kindlyhelped me with the language of this article.
References
[1] A.K. Geim, K.S. Novoselov, Nat. Mater. 6 (2007) 183–191.[2] A.K. Geim, Science 324 (2009) 1530–1533.[3] M. Liang, L. Zhi, J. Mater. Chem. 19 (2009) 5871–5878.[4] M. Pumera, A. Ambrosi, A. Bonanni, E.L.K. Chng, H.L. Poh, Trends Anal. Chem. 29
(2010) 954–965.[5] D.A.C. Brownson, C.E. Banks, Analyst 135 (2010) 2768–2778.[6] M.S. Goh, M. Pumera, Electrochem. Commun. 12 (2010) 1375–1377.[7] M. Pumera, Chem. Soc. Rev. 39 (2010) 4146–4157.[8] M. Pumera, Chem. Rec. 9 (2009) 211–223.[9] D.R. Kauffman, A. Star, Analyst 135 (2010) 2790–2797.
[10] C. Liu, S. Alwarappan, Z.F. Chen, X.X. Kong, C.Z. Li, Biosens. Bioelectron. 25(2010) 1829–1833.
[11] J.R. Miller, R.A. Outlaw, B.C. Holloway, Science 329 (2010) 1637–1639.[12] L.F. Dong, R.R.S. Gari, Z. Li, M.M. Craig, S.F. Hou, Carbon 48 (2010) 781–787.[13] H. Wang, L.-F. Yang, Y. Yang, H.S. Casalongue, J.T. Robinson, Y. Liang, Y. Cui, H.
Dai, J. Am. Chem. Soc. 132 (2010) 13978–13980.[14] J.L. Xia, F. Chen, J.H. Li, N. Tao, J. Nat. Nanotechnol. 4 (2009) 505–509.[15] L.H. Tang, Y. Wang, Y.M. Li, H. Feng, J. Lu, J.H. Li, Adv. Funct. Mater. 19 (2009)
2782–2789.[16] M.H. Parvin, Electrochem. Commun. 13 (2011) 366–369.[17] W. Yang, K.R. Ratinac, S.P. Ringer, P. Thordarson, J.J. Gooding, F. Braet, Angew.
Chem. Int. Ed. 49 (2010) 2114–2138.[18] Y. Shao, J. Wang, H. Wu, J. Liu, I.A. Aksay, Y. Lin, Electroanalysis 22 (2010)
1027–1036.[19] Y.-R. Lim, S. Bong, Y.-J. Kong, Y. Yang, R.K. Mahajan, J.S. Kim, H. Kim, Biosens.
Bioelectron. 25 (2010) 2366–2369.[20] K. Zhou, Y. Zhu, X. Yang, J. Luo, C. Li, S. Luan, Electrochim. Acta 55 (2010) 3055–
3060.[21] J.-F. Wu, M.-Q. Xu, G.C. Zhao, Electrochem. Commun. 12 (2010) 175–179.[22] Y. Liu, D.Y.C. Zeng, Z. Miao, L. Dai, Langmuir 26 (9) (2010) 6158–6160.[23] W.S. Hummers, R.E. Offeman, J. Am. Chem. Soc. 80 (1958) 1339.[24] J. Shen, Y. Hu, M. Shi, X. Lu, C. Qin, C. Li, M. Ye, Chem. Mater. 21 (2009) 3514–
3520.[25] A.L. Higginbotham, D.V. Kosynkin, A. Sinitskii, Z. Sun, J.M. Tour, ACS Nano 4
(2010) 2059–2069.[26] P. Kaur, R. Smitha, D. Aggarwal, M. Kapil, Int. J. Pharm. 248 (2002) 1–14.
124 V. Shakibaian, M.H. Parvin / Journal of Electroanalytical Chemistry 683 (2012) 119–124
[27] S.C. Sweetman (Ed.), Martindale, The Complete Drug Reference, 32nd ed.,Pharmaceutical Press, London, 1999.
[28] W.A. Ritschel, C. Paulos, A. Arancibia, M.A. Agrawal, K.M. Wetzelsberger, P.W.Lucker, J. Clin. Pharmacol. 38 (1998) 533–539.
[29] P.C.A. Jeronimo, A.N. Araujo, B.S.M. Montenegro, D. Satinsky, P. Solich, Analyst130 (2005) 1190–1197.
[30] Z.G. Balugera, M.A. Goicolea, R.J. Barrio, J. Pharm. Biomed. Anal. 12 (1994) 883–887.
[31] I.M. Greene, A.D. Kenny, J. Pharmacol. Toxicol. Meth. 28 (1992) 159–166.[32] S.M. Wallace, V.P. Shah, S. Riegelman, J. Pharm. Sci. 66 (1977) 527–530.[33] M. Khodadadiana, F. Ahmadi, Talanta 81 (2010) 1446–1453.[34] M.B. Gholivand, M.H. Parvin, J. Electroanal. Chem. 660 (2011) 163–168.[35] D.J. Chapron, L.B. White, J. Pharm. Sci. 73 (1984) 985–989.
[36] R. Hartley, M. Lucock, M. Becker, I.J. Smith, W.I. Forsythe, J. Chromatogr. 377(1986) 295–305.
[37] R.H. Hernandez, P.C. Falco, A.S. Cabeza, J. Chromatogr. 120 (1992) 181–191.[38] N. Ichikawa, K. Naora, H. Hirano, K. Iwamoto, J. Pharm. Biomed. Anal. 17 (1998)
1415–1421.[39] A. Zarghi, A. Shafaati, J. Pharm. Biomed. Anal. 28 (2002) 169–172.[40] M.J. McAllister, J.L. Li, D.H. Adamson, H.C. Schniepp, A.A. Abdala, J. Liu, M.
Herrera-Alonso, D.L. Milius, R. Car, R.K. Prudhomme, I.A. Aksay, Chem. Mater.19 (2007) 4396–4404.
[41] P.M. Hallam, C.E. Banks, Electrochem. Commun. 13 (2011) 8–11.[42] A.M. Bond, Modern Polarographic Methods in Analytical Chemistry, Dekker
(Marcel), New York, 1980.