nanostructured modified carbon paste electrode as
TRANSCRIPT
HAL Id: hal-02531286https://hal-univ-rennes1.archives-ouvertes.fr/hal-02531286
Submitted on 26 Aug 2020
HAL is a multi-disciplinary open accessarchive for the deposit and dissemination of sci-entific research documents, whether they are pub-lished or not. The documents may come fromteaching and research institutions in France orabroad, or from public or private research centers.
L’archive ouverte pluridisciplinaire HAL, estdestinée au dépôt et à la diffusion de documentsscientifiques de niveau recherche, publiés ou non,émanant des établissements d’enseignement et derecherche français ou étrangers, des laboratoirespublics ou privés.
Nanostructured Modified Carbon Paste Electrode asVoltrametric Sensor for Isoproturon Trace Analysis in
WaterSiham Amra, Thierry Bataille, Saliha Bourouina Bacha, Mustapha
Bourouina, Didier Hauchard
To cite this version:Siham Amra, Thierry Bataille, Saliha Bourouina Bacha, Mustapha Bourouina, Didier Hauchard.Nanostructured Modified Carbon Paste Electrode as Voltrametric Sensor for IsoproturonTrace Analysis in Water. Electroanalysis, Wiley-VCH Verlag, 2020, 32 (6), pp.1346-1353.�10.1002/elan.201900083�. �hal-02531286�
NANOSTRUCTURED MODIFIED CARBON PASTE ELECTRODE AS
VOLTAMMETRIC SENSOR FOR ISOPROTURON TRACE ANALYSIS IN WATER
Siham AMRAa,b, Thierry BATAILLEb, Saliha BOUROUINA BACHAc, Mustapha
BOUROUINAa, Didier HAUCHARDb*
a Département de Chimie, Faculté des Sciences Exactes, Université A. Mira, Bejaia 06000, Algérie bUniv Rennes, ENSC Rennes, CNRS, ISCR – UMR6226, F-35000 Rennes, France cDépartement de Génie des procédés, Faculté de technologie, Université A. Mira, Bejaia 06000, Algérie
Abstract
A new electrochemical sensor based on nanostructured carbon paste electrodes (CPEs) is
developed for the sensitive detection of Isoproturon in water. The CPEs were nanostructured
by incorporation of carbon nanotubes (NTCs) and synthetized copper oxide nanoparticles
(CuO). They were characterized using the X-ray diffraction spectroscopy (XRD), scanning
electron microscopy (SEM) and voltammetric methods. Electrochemical experiments showed
that the adsorption of Isoproturon on to (GC-NTC-CuO)-CPE, associated with nanomaterials
(NTCs and CuO), provided remarkable analytical performances of the sensor such as a large
quantification range from 1 to 200 µg.L-1 with a detection limit of 0.1 µg.L-1 of Isoproturon and
no interferences of some another pesticides tested (specificity of ISO adsorption in acidified
water). The tests carried out on real samples of water are conclusive. The analytical
performances of the sensor showed that it is suitable for the specific determination of pesticide
traces in water.
Keywords : Carbon Paste Electrode; nanostructured composite material; trace analysis;
Isoproturon; cyclic voltammetry.
* Corresponding author : E-mail address: [email protected] (D. Hauchard).
10.1002/elan.201900083
Acc
epte
d M
anus
crip
t
Electroanalysis
1. INTRODUCTION
The use of pesticides, although necessary to protect crops and minimize losses, is detrimental
to the ecosystem and human health by the pollution it generates. Because of their
physicochemical properties, these compounds can migrate to groundwater and surface water
and alter the quality of water and food. Among others, Isoproturon (ISO) is an herbicide of the
substituted urea family, widely used in cereal agriculture to control weeds. It is a toxic product,
likely to harm human health [1]. WHO recommends a threshold concentration of 9 µgL-1 of
ISO for water quality [2]. In addition, the European Union has set its maximum allowable
concentration at 0.1 μgL-1 in drinking water [3]. Many pesticide analysis techniques have been
developed such as capillary electrophoresis [4, 5], chromatographic techniques [6, 7, 8-10] and
chromatography coupled to mass spectroscopy. Although they are very sensitive and reliable
but have strong drawbacks such as complex and long processing samples and can only be
performed by highly qualified personnel.
In this context, electrochemical based sensing devices are a promising alternative, offering great
potentials for a broad range of analytical applications. These tools are very sensitive and
reliable, selective, fast, inexpensive and are suitable for on-site analysis.
Most of the research developed in pesticides analysis has focused on enzymatic quantification
[11-13], while current works are moving towards direct detection [14, 15]. Moreover, the
development of nanotechnology has paved the way for the manufacture of new, efficient and
inexpensive electrode materials [16, 17]. Indeed, electrochemical sensors have increasingly
used nanoparticles because of their special properties that increase the surface area of
electrodes, accelerate mass transport, control the microenvironment of electrodes and allow
efficient catalysis [16, 17]. The use of carbon, in its various forms (graphite, nanotubes,
graphene, etc.), in the design of electrochemical sensors and biosensors is widespread [18-20].
In order to improve their properties, particularly the selectivity towards target analytes,
nanostructured materials can be mixed with carbon-based materials. Furthermore, it is well
documented that materials containing nanocomposites such as copper oxide (CuO), zinc oxide
(ZnO), manganese oxide (MnO2) and others [21-23] are exploited in the detection of pesticides
in order to interact specifically with the analyte and to facilitate the charge transfer.
The aim of this work is to develop a new sensor based on carbon paste consisting of a GC
powder nanostructured by NTC and CuO in order to enhance the sensitive and selective
Isoproturon analysis in aqueous solution using the CV method.
2. Materials and methods
2.1 Reagents and Materials
All reagents used are of analytical grade. Nujol (mineral oil), graphite powder (< 20µm), carbon
nanotubes (DxL: 110-170 nm x 5-9µm), sulfuric acid (for analysis EMSURE, 98%),
ethanol(99%), acetone, Isoproturon (analytical standard 99.9%) were purchased from Sigma-
Aldrich, and ammonium carbonate (NH4)2CO3, copper sulphate pentahydrate CuSO4.5H2O,
sodium hydroxide NaOH were provide by Prolabo. All aqueous solutions were prepared with
deionized (DI) 18.2 M.cm (25 ºC) water from Millipore Direct-Q Water system.Stock
solutions of Isoproturon (0.1M) were prepared with ethanol and subsequent dilutions were
10.1002/elan.201900083
Acc
epte
d M
anus
crip
t
Electroanalysis
prepared daily with ultrapure water and stored at 4°C in the dark. Standard solutions of
pesticides used as potential interferences of Isoproturon detection were prepared with deionized
water and employed during the interference study. All experiments were performed at room
temperature (20 ± 1°C).All reagents were used as received.
2.2 Instrumentation
X-ray powder pattern was collected with a Panalytical Empyrean powder diffractometer (θ–θ
Bragg–Brentano geometry) working with the Cu Kα radiation (λ K1 = 1.5406 Å, λ K2 =
1.5444 Å) selected with a flat multilayer X-ray mirror (Bragg-Brentano HD®). Data were
collected with a Pixel 1D silicon-strip detector, in the angular range 10–80° (2θ) (step size
~0.013° (2θ)). The surface morphology of the prepared samples was characterized by scanning
electron microscope (JEOL JSM-7100F, Detector EDS Oxford Instrument 50 mm2). All
electrochemical experiments were performed with a PGSTAT20 Metrohm
potentiostat/galvanostat in combination with the NOVA 2.1 software, at room temperature,
using a traditional three-electrode electrochemical cell with a working electrode, Ag/AgCl (3
M KCl) as reference electrode, and a platinum wire counter electrode.
2.3 CuO nanoparticles synthesis
The CuO nanoparticles were synthesized by the hydrothermal method described by M. Ben
Ali et al [23]. 10 mL of a freshly prepared solution of copper sulfate 1 mol L-1 (CuSO4.5H2O)
was added dropwise to a stirred solution of 5 mL of 1M ammonium carbonate solution in 35
mL of deionized water. Then, 1 mol L-1 sodium hydroxide aqueous solution was added
dropwise to the previous mixture to form a white precipitate at pH=11. After 30 minutes of
magnetic stirring, the mixture was transferred to a teflon-coated stainless steel autoclave of 45
mL capacity for 16 hours at 160 ° C. The nanoparticles obtained were washed and then dried at
90 ° C. for 24 hours. The powder obtained was then calcined at 600 ° C for 4 hours.
2.4 Preparation of the CPEs
The carbon pastes (CPs) have been prepared by mixing the components in desired proportions
with a binder (Nujol) for about thirty minutes to have a homogeneous mixture. The resulting
paste was then packed into the cavity (2 mm deep) at the end of homemade Teflon cylindrical
tube of 3 mm (internal diameter) surrounding hermetically a graphite bar acting as electrical
contact. The surface was smoothed off by rubbing the electrode several times slowly across a
paper. Four CPs of different compositions were prepared: and composed in mass % of (i)
graphite powder (85%) and binder (15%) (GC-CP), (ii) graphite powder (60%), binder (15%)
and carbon nanotubes (25%) (GC_NTC)-CP), (iii) graphite powder (60%), binder (15%) and
nanoparticles of copper oxide (25%) ((GC-CuO)-CP) and (iv) graphite powder (60%), binder
(15%), carbon nanotubes (10%) and copper oxide nanoparticles (15%) ((GC-NTC-CuO)-CP.
The percentage of added blinder was previously optimized and the value of 15% allowed
maintaining the compacted pastes in the electrode cavity while retraining its electrical
properties. In order to compare the different nanostructured pastes the proportion of graphic
powder was kept at 60%.
10.1002/elan.201900083
Acc
epte
d M
anus
crip
t
Electroanalysis
3. Results and discussion
3.1 Characterization of CuO nanoparticles and (GC-NTC-CuO)-CP
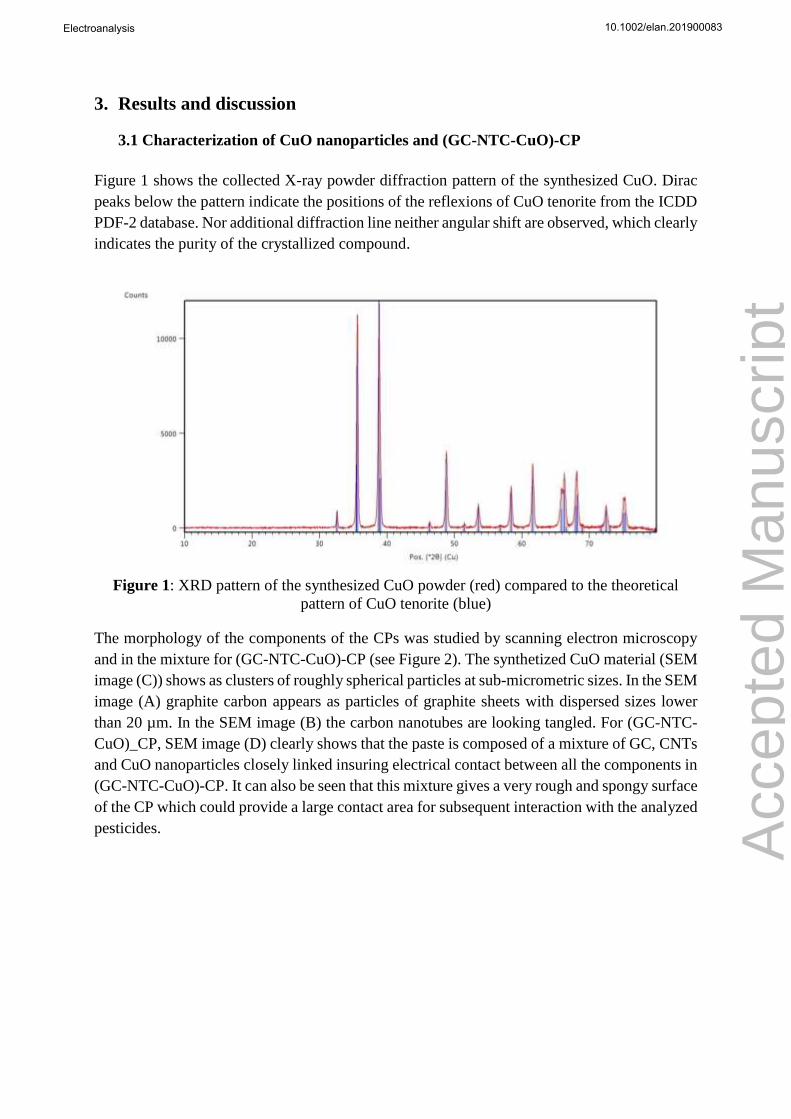
Figure 1 shows the collected X-ray powder diffraction pattern of the synthesized CuO. Dirac
peaks below the pattern indicate the positions of the reflexions of CuO tenorite from the ICDD
PDF-2 database. Nor additional diffraction line neither angular shift are observed, which clearly
indicates the purity of the crystallized compound.
Figure 1: XRD pattern of the synthesized CuO powder (red) compared to the theoretical
pattern of CuO tenorite (blue)
The morphology of the components of the CPs was studied by scanning electron microscopy
and in the mixture for (GC-NTC-CuO)-CP (see Figure 2). The synthetized CuO material (SEM
image (C)) shows as clusters of roughly spherical particles at sub-micrometric sizes. In the SEM
image (A) graphite carbon appears as particles of graphite sheets with dispersed sizes lower
than 20 µm. In the SEM image (B) the carbon nanotubes are looking tangled. For (GC-NTC-
CuO)_CP, SEM image (D) clearly shows that the paste is composed of a mixture of GC, CNTs
and CuO nanoparticles closely linked insuring electrical contact between all the components in
(GC-NTC-CuO)-CP. It can also be seen that this mixture gives a very rough and spongy surface
of the CP which could provide a large contact area for subsequent interaction with the analyzed
pesticides.
10.1002/elan.201900083
Acc
epte
d M
anus
crip
t
Electroanalysis
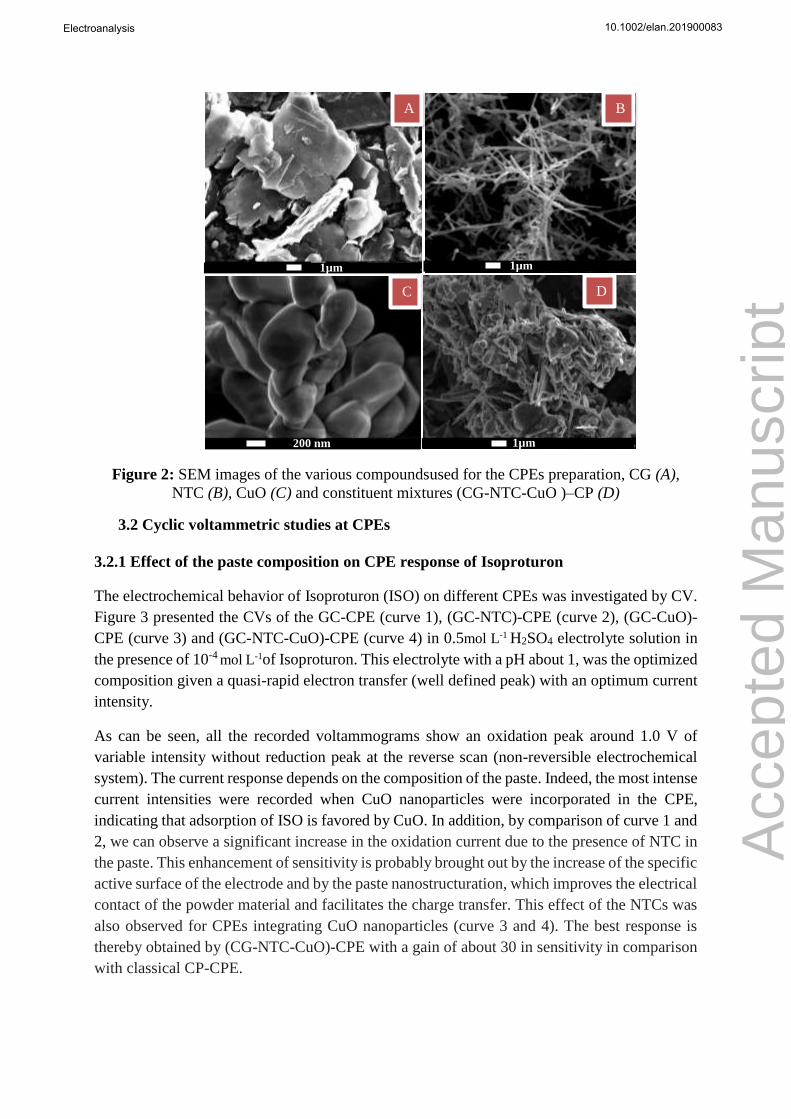
Figure 2: SEM images of the various compoundsused for the CPEs preparation, CG (A),
NTC (B), CuO (C) and constituent mixtures (CG-NTC-CuO )–CP (D)
3.2 Cyclic voltammetric studies at CPEs
3.2.1 Effect of the paste composition on CPE response of Isoproturon
The electrochemical behavior of Isoproturon (ISO) on different CPEs was investigated by CV.
Figure 3 presented the CVs of the GC-CPE (curve 1), (GC-NTC)-CPE (curve 2), (GC-CuO)-
CPE (curve 3) and (GC-NTC-CuO)-CPE (curve 4) in 0.5mol L-1 H2SO4 electrolyte solution in
the presence of 10-4 mol L-1of Isoproturon. This electrolyte with a pH about 1, was the optimized
composition given a quasi-rapid electron transfer (well defined peak) with an optimum current
intensity.
As can be seen, all the recorded voltammograms show an oxidation peak around 1.0 V of
variable intensity without reduction peak at the reverse scan (non-reversible electrochemical
system). The current response depends on the composition of the paste. Indeed, the most intense
current intensities were recorded when CuO nanoparticles were incorporated in the CPE,
indicating that adsorption of ISO is favored by CuO. In addition, by comparison of curve 1 and
2, we can observe a significant increase in the oxidation current due to the presence of NTC in
the paste. This enhancement of sensitivity is probably brought out by the increase of the specific
active surface of the electrode and by the paste nanostructuration, which improves the electrical
contact of the powder material and facilitates the charge transfer. This effect of the NTCs was
also observed for CPEs integrating CuO nanoparticles (curve 3 and 4). The best response is
thereby obtained by (CG-NTC-CuO)-CPE with a gain of about 30 in sensitivity in comparison
with classical CP-CPE.
B
D C
A
1µm
1µm
1µm
200 nm
10.1002/elan.201900083
Acc
epte
d M
anus
crip
t
Electroanalysis
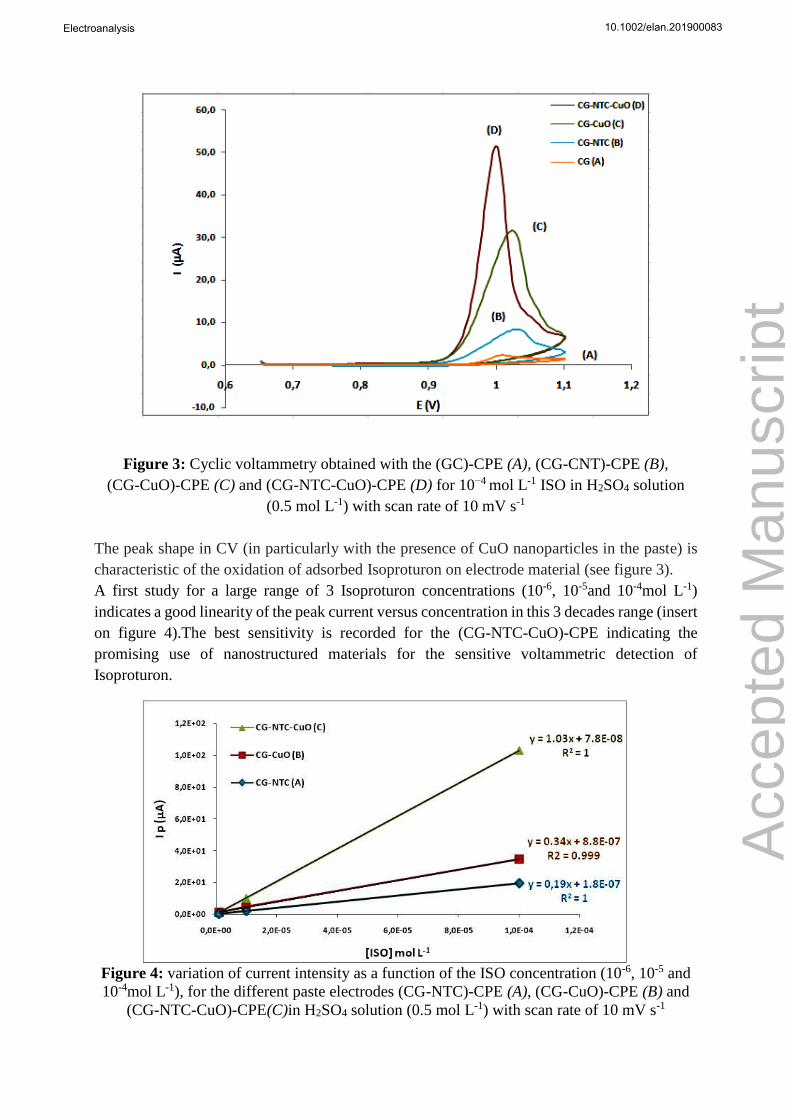
Figure 3: Cyclic voltammetry obtained with the (GC)-CPE (A), (CG-CNT)-CPE (B),
(CG-CuO)-CPE (C) and (CG-NTC-CuO)-CPE (D) for 10−4 mol L-1 ISO in H2SO4 solution
(0.5 mol L-1) with scan rate of 10 mV s-1
The peak shape in CV (in particularly with the presence of CuO nanoparticles in the paste) is
characteristic of the oxidation of adsorbed Isoproturon on electrode material (see figure 3).
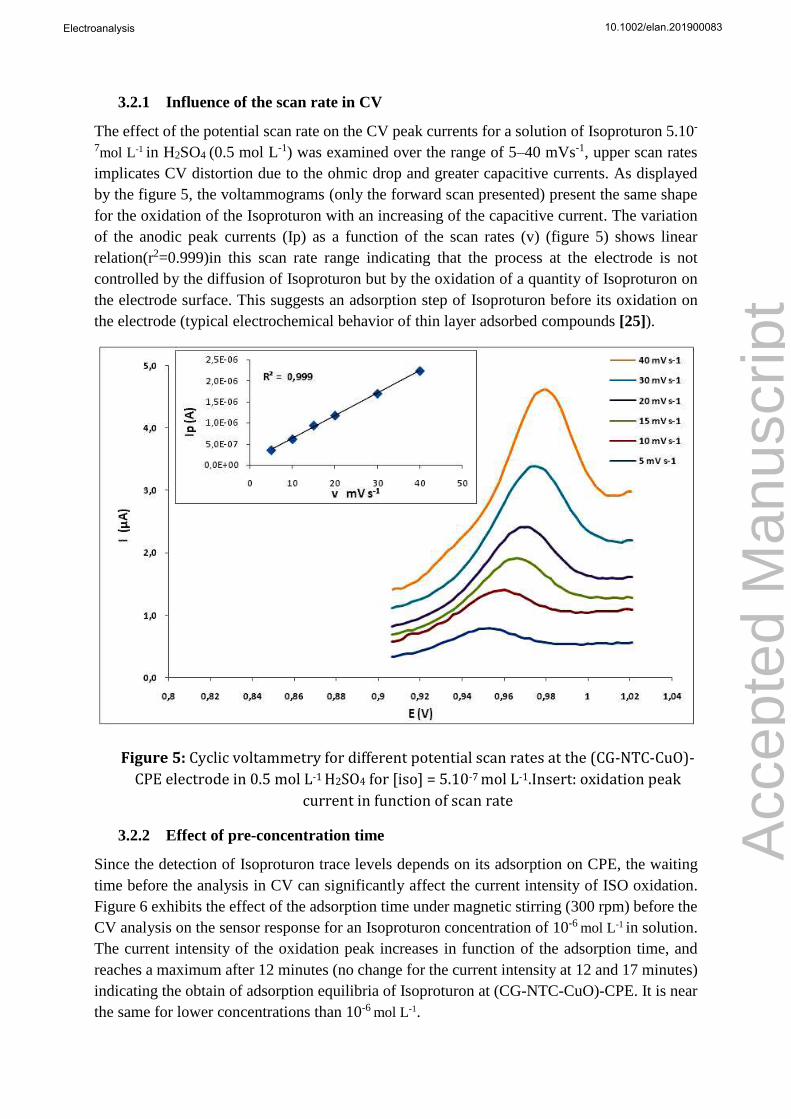
A first study for a large range of 3 Isoproturon concentrations (10-6, 10-5and 10-4mol L-1)
indicates a good linearity of the peak current versus concentration in this 3 decades range (insert
on figure 4).The best sensitivity is recorded for the (CG-NTC-CuO)-CPE indicating the
promising use of nanostructured materials for the sensitive voltammetric detection of
Isoproturon.
Figure 4: variation of current intensity as a function of the ISO concentration (10-6, 10-5 and
10-4mol L-1), for the different paste electrodes (CG-NTC)-CPE (A), (CG-CuO)-CPE (B) and
(CG-NTC-CuO)-CPE(C)in H2SO4 solution (0.5 mol L-1) with scan rate of 10 mV s-1
10.1002/elan.201900083
Acc
epte
d M
anus
crip
t
Electroanalysis
3.2.1 Influence of the scan rate in CV
The effect of the potential scan rate on the CV peak currents for a solution of Isoproturon 5.10-
7mol L-1 in H2SO4 (0.5 mol L-1) was examined over the range of 5–40 mVs-1, upper scan rates
implicates CV distortion due to the ohmic drop and greater capacitive currents. As displayed
by the figure 5, the voltammograms (only the forward scan presented) present the same shape
for the oxidation of the Isoproturon with an increasing of the capacitive current. The variation
of the anodic peak currents (Ip) as a function of the scan rates (v) (figure 5) shows linear
relation(r2=0.999)in this scan rate range indicating that the process at the electrode is not
controlled by the diffusion of Isoproturon but by the oxidation of a quantity of Isoproturon on
the electrode surface. This suggests an adsorption step of Isoproturon before its oxidation on
the electrode (typical electrochemical behavior of thin layer adsorbed compounds [25]).
Figure 5: Cyclic voltammetry for different potential scan rates at the (CG-NTC-CuO)-
CPE electrode in 0.5 mol L-1 H2SO4 for [iso] = 5.10-7 mol L-1.Insert: oxidation peak
current in function of scan rate
3.2.2 Effect of pre-concentration time
Since the detection of Isoproturon trace levels depends on its adsorption on CPE, the waiting
time before the analysis in CV can significantly affect the current intensity of ISO oxidation.
Figure 6 exhibits the effect of the adsorption time under magnetic stirring (300 rpm) before the
CV analysis on the sensor response for an Isoproturon concentration of 10-6 mol L-1 in solution.
The current intensity of the oxidation peak increases in function of the adsorption time, and
reaches a maximum after 12 minutes (no change for the current intensity at 12 and 17 minutes)
indicating the obtain of adsorption equilibria of Isoproturon at (CG-NTC-CuO)-CPE. It is near
the same for lower concentrations than 10-6 mol L-1.
10.1002/elan.201900083
Acc
epte
d M
anus
crip
t
Electroanalysis
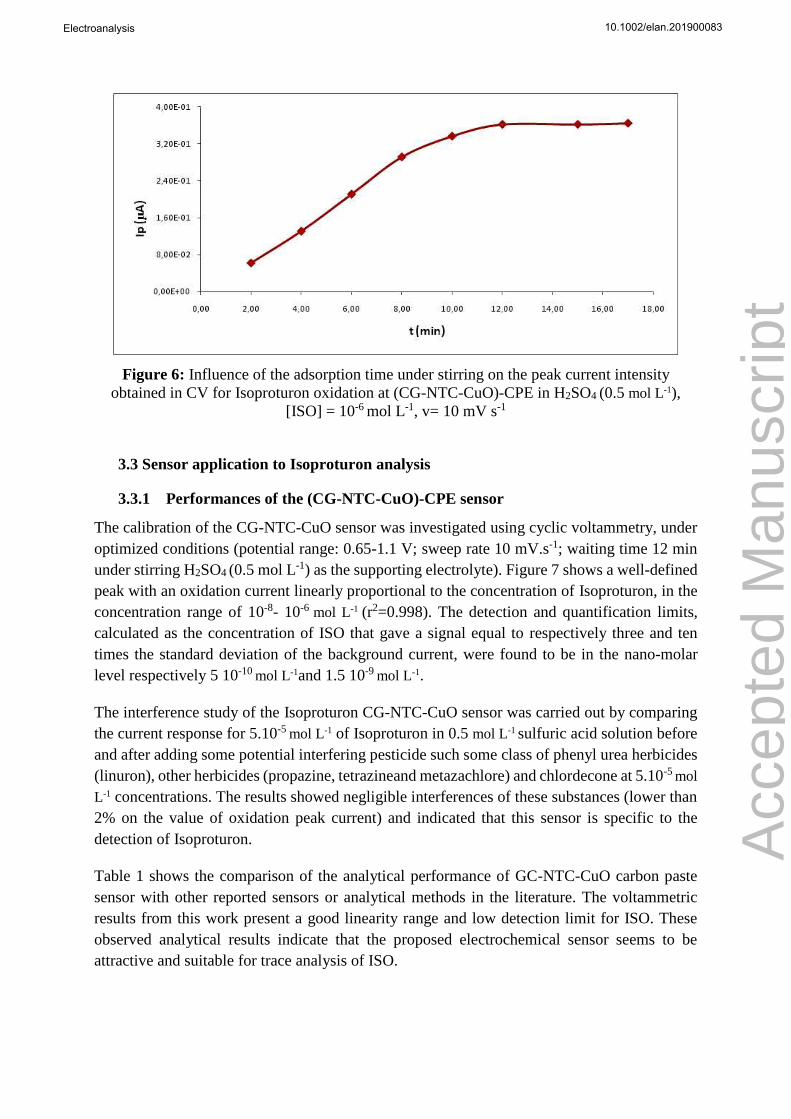
Figure 6: Influence of the adsorption time under stirring on the peak current intensity
obtained in CV for Isoproturon oxidation at (CG-NTC-CuO)-CPE in H2SO4 (0.5 mol L-1),
[ISO] = 10-6 mol L-1, v= 10 mV s-1
3.3 Sensor application to Isoproturon analysis
3.3.1 Performances of the (CG-NTC-CuO)-CPE sensor
The calibration of the CG-NTC-CuO sensor was investigated using cyclic voltammetry, under
optimized conditions (potential range: 0.65-1.1 V; sweep rate 10 mV.s-1; waiting time 12 min
under stirring H2SO4 (0.5 mol L-1) as the supporting electrolyte). Figure 7 shows a well-defined
peak with an oxidation current linearly proportional to the concentration of Isoproturon, in the
concentration range of 10-8- 10-6 mol L-1 (r2=0.998). The detection and quantification limits,
calculated as the concentration of ISO that gave a signal equal to respectively three and ten
times the standard deviation of the background current, were found to be in the nano-molar
level respectively 5 10-10 mol L-1and 1.5 10-9 mol L-1.
The interference study of the Isoproturon CG-NTC-CuO sensor was carried out by comparing
the current response for 5.10-5 mol L-1 of Isoproturon in 0.5 mol L-1 sulfuric acid solution before
and after adding some potential interfering pesticide such some class of phenyl urea herbicides
(linuron), other herbicides (propazine, tetrazineand metazachlore) and chlordecone at 5.10-5 mol
L-1 concentrations. The results showed negligible interferences of these substances (lower than
2% on the value of oxidation peak current) and indicated that this sensor is specific to the
detection of Isoproturon.
Table 1 shows the comparison of the analytical performance of GC-NTC-CuO carbon paste
sensor with other reported sensors or analytical methods in the literature. The voltammetric
results from this work present a good linearity range and low detection limit for ISO. These
observed analytical results indicate that the proposed electrochemical sensor seems to be
attractive and suitable for trace analysis of ISO.
10.1002/elan.201900083
Acc
epte
d M
anus
crip
t
Electroanalysis
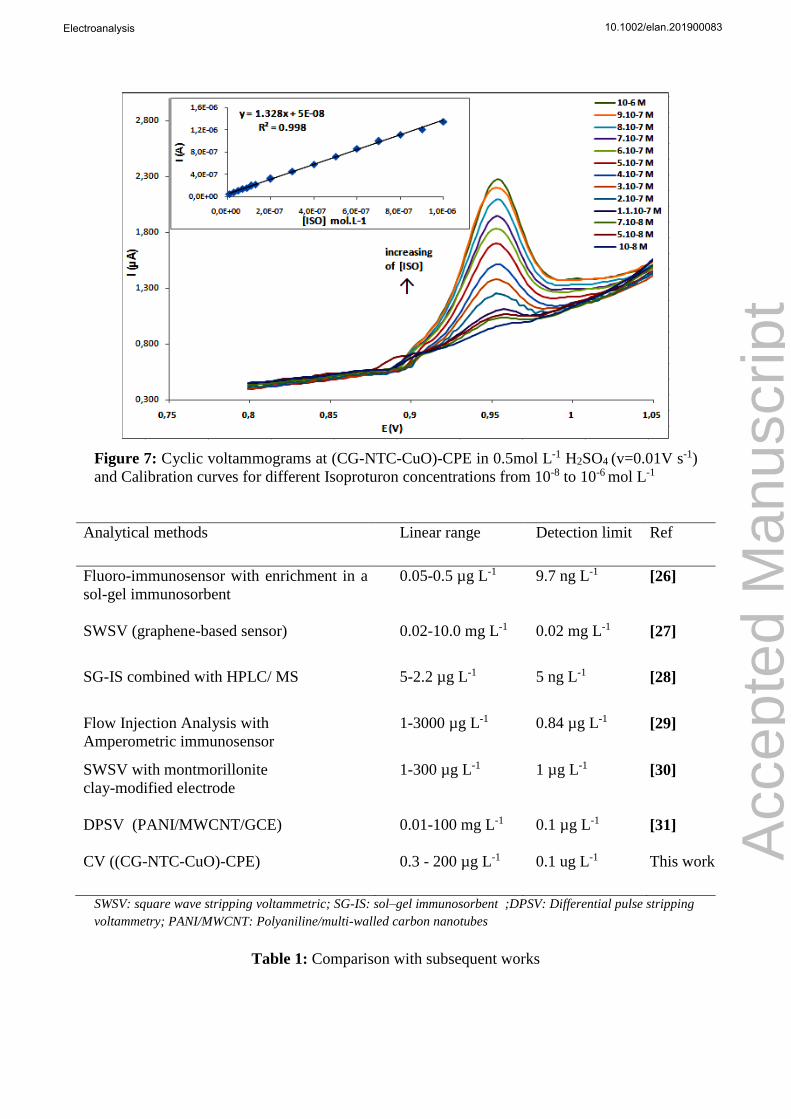
Figure 7: Cyclic voltammograms at (CG-NTC-CuO)-CPE in 0.5mol L-1 H2SO4 (v=0.01V s-1)
and Calibration curves for different Isoproturon concentrations from 10-8 to 10-6 mol L-1
Analytical methods Linear range Detection limit Ref
Fluoro-immunosensor with enrichment in a
sol-gel immunosorbent
0.05-0.5 µg L-1 9.7 ng L-1
[26]
SWSV (graphene-based sensor) 0.02-10.0 mg L-1 0.02 mg L-1
[27]
SG-IS combined with HPLC/ MS
5-2.2 µg L-1 5 ng L-1
[28]
Flow Injection Analysis with
Amperometric immunosensor
1-3000 µg L-1
0.84 µg L-1
[29]
SWSV with montmorillonite
clay-modified electrode
1-300 µg L-1 1 µg L-1 [30]
DPSV (PANI/MWCNT/GCE) 0.01-100 mg L-1 0.1 µg L-1 [31]
CV ((CG-NTC-CuO)-CPE) 0.3 - 200 µg L-1
0.1 ug L-1
This work
SWSV: square wave stripping voltammetric; SG-IS: sol–gel immunosorbent ;DPSV: Differential pulse stripping
voltammetry; PANI/MWCNT: Polyaniline/multi-walled carbon nanotubes
Table 1: Comparison with subsequent works
10.1002/elan.201900083
Acc
epte
d M
anus
crip
t
Electroanalysis
3.3.2 Repeatability and reproducibility study
Repeatability and reproducibility are important criteria for any developed sensor. Therefore,
the repeatability and reproducibility of the designed sensor for determination of Isoproturon
were studied using four concentrations (1, 3, 7, and 9.10-8 mol L-1). This was evaluated by CV
by performing three determinations of peak current intensity with the same standard solutions
of Isoproturon. The results are summarized in Table 2.
The repeatability of the (CG-CuO-NTC)-CPE was evaluated by using the same electrode in the
optimal conditions for CV experiments. It appears that the relative standard deviations (RSD)
did not exceed 3.6%.The reproducibility was estimated by using three modified electrodes
independently prepared by the same procedure. In this case, the RSD of peak current intensities
for ISO oxidation did not exceed 6.3%. These results indicate that the proposed sensor has good
repeatability and reproducibility.
Concentration
of Isoproturon
(×10-8mol L-1)
Repeatability of Ip values
RSD* (%)
Reproducibility of Ip values
RSD* (%)
1 2.1 3.4
3 3.6 5.1
7 3.6 5.7
9 2.0 6.3
* (n= 3)
Table2: Study of repeatability and reproducibility for the proposed CV method with (CG-
NTC-CuO)-CPE in the Isoproturon concentration range of 10-8 – 10-7 mol L-1
3.3.3 Application to real samples
To illustrate the practical application of (CG-CuO-NTC)-CPE, the electrode was applied to
Isoproturon detection in local tap water. As the voltammograms in CV of acidified tap water
(0.1 mol L-1 H2SO4) did not give an observable peak in the potential window corresponding to
ISO oxidation (< 0.1µg L-1), two tap water samples were spiked at 0.2 .and 0.6 µmol L-1.
Voltammetric studies under the optimum experimental conditions were carried out to
determinate ISO in these water samples. The standard addition method was used for the
quantification of ISO in these spiked samples and three replicates were done. The presented
data in Table 3 show excellent recovery rates that are in the 96.4 – 101.7 range with RSD < 4%.
This indicates that the proposed method with (CG-CuO-NTC)-CPE was successfully applied
for determination of Isoproturon in tap water samples as indicated.
10.1002/elan.201900083
Acc
epte
d M
anus
crip
t
Electroanalysis
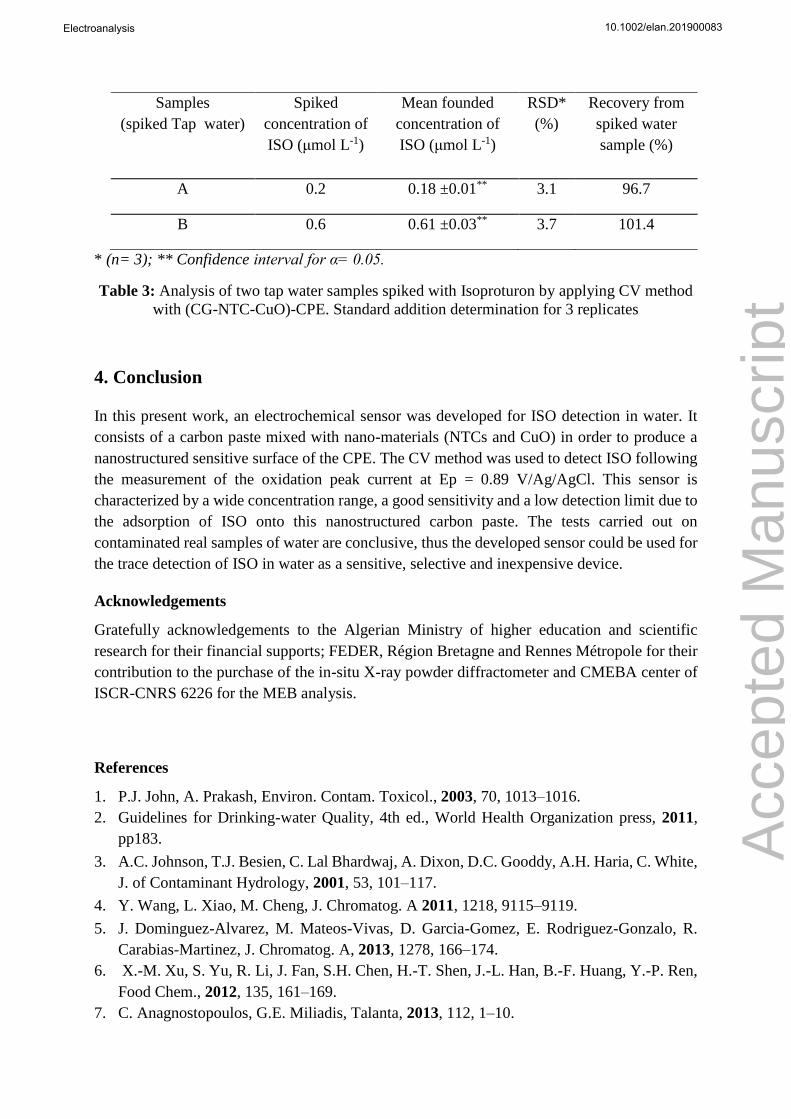
Samples
(spiked Tap water)
Spiked
concentration of
ISO (μmol L-1)
Mean founded
concentration of
ISO (μmol L-1)
RSD*
(%)
Recovery from
spiked water
sample (%)
A 0.2 0.18 ±0.01** 3.1 96.7
B 0.6 0.61 ±0.03** 3.7 101.4
* (n= 3); ** Confidence interval for α= 0.05.
Table 3: Analysis of two tap water samples spiked with Isoproturon by applying CV method
with (CG-NTC-CuO)-CPE. Standard addition determination for 3 replicates
4. Conclusion
In this present work, an electrochemical sensor was developed for ISO detection in water. It
consists of a carbon paste mixed with nano-materials (NTCs and CuO) in order to produce a
nanostructured sensitive surface of the CPE. The CV method was used to detect ISO following
the measurement of the oxidation peak current at Ep = 0.89 V/Ag/AgCl. This sensor is
characterized by a wide concentration range, a good sensitivity and a low detection limit due to
the adsorption of ISO onto this nanostructured carbon paste. The tests carried out on
contaminated real samples of water are conclusive, thus the developed sensor could be used for
the trace detection of ISO in water as a sensitive, selective and inexpensive device.
Acknowledgements
Gratefully acknowledgements to the Algerian Ministry of higher education and scientific
research for their financial supports; FEDER, Région Bretagne and Rennes Métropole for their
contribution to the purchase of the in-situ X-ray powder diffractometer and CMEBA center of
ISCR-CNRS 6226 for the MEB analysis.
References
1. P.J. John, A. Prakash, Environ. Contam. Toxicol., 2003, 70, 1013–1016.
2. Guidelines for Drinking-water Quality, 4th ed., World Health Organization press, 2011,
pp183.
3. A.C. Johnson, T.J. Besien, C. Lal Bhardwaj, A. Dixon, D.C. Gooddy, A.H. Haria, C. White,
J. of Contaminant Hydrology, 2001, 53, 101–117.
4. Y. Wang, L. Xiao, M. Cheng, J. Chromatog. A 2011, 1218, 9115–9119.
5. J. Dominguez-Alvarez, M. Mateos-Vivas, D. Garcia-Gomez, E. Rodriguez-Gonzalo, R.
Carabias-Martinez, J. Chromatog. A, 2013, 1278, 166–174.
6. X.-M. Xu, S. Yu, R. Li, J. Fan, S.H. Chen, H.-T. Shen, J.-L. Han, B.-F. Huang, Y.-P. Ren,
Food Chem., 2012, 135, 161–169.
7. C. Anagnostopoulos, G.E. Miliadis, Talanta, 2013, 112, 1–10.
10.1002/elan.201900083
Acc
epte
d M
anus
crip
t
Electroanalysis
8. M. Godejohann, J.-D. Berset, D. Muff, J. Chromatog. A 2011, 1218, 9202–9209.
9. J. Vichapong, R. Burakham, S. Srijaranai, K. Grudpan, J. Sep. Sci., 2011, 34, 1574–1581.
10. Y. Wen, J. Li, F. Yang, W. Zhang, W. Li, C. Liao, L. Chen, Talanta 2013, 106, 119–126.
11. M. Shi, J. Xu, S. Zhang, B. Liu, J. Kong, Talanta, 2006, 68, 1089–1095.
12. A. Attar, A.Amine, F. Achi, S. Bourouina-Bacha, M. Bourouina, L. Cubillana-Aguilerac, J.
M. Palacios-Santanderc, A. Baraket, A. Errachid, Int. J. Environ. Anal. Chem.2016, 96,
515-529.
13. A. Amine, H. Mohammadi, I. Bourais, G.Palleschi, Biosens. Bioelectron., 2006, 21, 1405-
23·
14. S.J. Shahtaheri, F. Faridbod, M. Khadem, Procedia Technology, 2017, 27 , 96 – 97
15. D.J.E. Costa, J. C.S. Santos, F. A.C.S. Brandão, W.F. Ribeiro, G.R. Salazar-Banda, M. C.U.
Araujo, J. Electroanal. Chem., 2017,789, 100–107.
16. J. Gong, L. Wang, X. Miao, L. Zhang, Electrochem. Commun., 2010, 12, 1658.
17. H. Li, C. Xie, S. Li, K. Xu, Colloids Surf. B/ Biointerfaces, 2012, 89, 175-181.
18. Z.J. Papp, V.J. Guzsvany, S. Kubiak, A Borowski, L.J Bjelica, J. Serbian Chem. Soc., 2010,
75, 681-687.
19. M. Sbaï, H. Essis-Tome, U. Gombert, T. Breton, M. Pontié, Sens. Actuat. B-chem., 2007,
124, 368-375.
20. K.P. Prathish, M.M. Barsan, D. Geng, X. Sun, C.M.A. Brett, Electrochim. Acta., 2013, 114,
533– 542.
21. M. Wang, Z. Li, Sens. Actuat. B-chem., 2008, 133, 607-612.
22. D. Huo, Q. Li, Y. Zhanga, C. Houa, Y. Leib, Sens. Actuat. B chem., 2014, 199, 410–417.
23. M. Nithya, J. Biosens. Bioelectron., 2015, 6, 1-9.
24. M. Ben Ali, F. Barka-Bouaifel, B. Sieber, H. Elhouichet, A. Addad, L. Boussekey, M. Ferid,
R. Boukherroub, Superlattices and Microstructures., 2016, 91, 225-237.
25. P. Manisankar, G. Selvanathan, C. Vedhi, Intern. J. Environ. Anal. Chem., 2005, 85, 409–
422.
26. P. Pulido-Tofino, J.M. Barrero-Moreno, M.C. Perez-Conde, Anal. Chim. Acta., 2006, 562,
122–127.
27. P. Noyrod, O. Chailapakul, W. Wonsawat, S. Chuanuwatanakul, J. Electroanal. Chem.,
2014, 719, 54–59.
28. X. Zhang, D. Martens, M. Petra. K. Amer, A. Kettrup, X. Liang, J. Chromatog. A., 2006,
1102, 84–90.
29. E.H. Damian, F. Baskeyfield, N. Magan Davis, E.I. Tothill, Anal. Chim. Acta., 2011, 699,
223– 231.
30. P. Manisankar, G. Selvanathan, C. Vendhi, Talanta, 2006, 68, 686-692.
31. P. Manisankar, P.L. AbiramaSundari, R. Sasikumar, S.P. Palaniappan, Talanta, 2008, 76,
1022-1028.
10.1002/elan.201900083
Acc
epte
d M
anus
crip
t
Electroanalysis