determinants of consumer behaviour towards branded ...ejsit.org/journal/dec8.pdfdeterminants of...
TRANSCRIPT
SIT Journal of Management
Vol. 2. No. 2. December 2012. Pp. 122-138
0 Krishnan, Pande, & Mule
ISSN: 2278-9111
Determinants of Consumer Behaviour towards Branded & Unbranded Products
Mahalaxmi Krishnan*, V S Pande**
& Mayuresh Mule***
ABSTRACT
Economic liberalization, globalization, developments in ICT, changing demographics, emergence of
women power, and rising middle class have led to more disposable incomes in both urban and rural India.
Spending patterns have changed from being frugal to indulgence. Discretionary incomes are going into
television, two wheelers, automobiles, cell phones, etc. Interestingly, while sale of branded products have
increased significantly, grey market continues to thrive. Unbranded PCs are still found in affluent houses.
Middle class consider the unbranded PC makers as their friendly neighborhood suppliers, who offer
personalized support services. Cell phones are enticing people to the grey market. While people buy
branded bath soaps, they do not mind buying local or unbranded soap for washing utensils. This research
based on field study as well as desktop analysis of the available literature was done with the objective of
ascertaining the determinants for consumer preference for branded and unbranded products. This study
would help in brand strategy and positioning especially in the vast expanding rural areas where there is
pronounced tilt towards local or unbranded products. The challenge before the manufacturers and
marketers is whether Indian consumers purchase products or brands. Their key task is to convert
consumer preference and loyalty towards brands.
Keywords: Brand Equity, Brand Awareness, Brand Positioning, Brand Loyalty, Retail Market,
Consumer Behaviour
*Dr Mahalaxmi Krishnan, Associate Professor, Department of Commerce, K J Somaiya
College of Arts & Commerce, Mumbai , PhD Guide in Management Studies, SNDT University.
e-mail : [email protected]. M: +91(0)989200920.
**Prof V S Pande, Head, Department of Commerce, K J Somaiya College of Arts &
Commerce, Mumbai, e-mail : [email protected]. M: +91(0)989200920.
***Dr Mayuresh Mule, Vice Principal , K J Somaiya College of Arts & Commerce, Mumbai, e-mail : [email protected]. M: +91(0)9892009201.
SIT Journal of Management
Vol. 2. No. 2. December 2012. Pp. 122-138
1 Krishnan, Pande, & Mule
ISSN: 2278-9111
1. Introduction
The rapid evolution of communication and mobile technology has resulted in seamless flow of
information across all consumer segments. This together with the progressive liberalization of
the Indian economy has brought fundamental shifts in Indian consumer behaviour. They are a
lot more discriminatory in their choice of products and services and preferences. Their spending
habits have changed and they do not mind splurging. While they are brand conscious, they
continue to buy non branded products. The challenge for the marketers today is creating brand
awareness, brand building and positioning. Branding helps establish company‟s strategy.
Successful brands provide competitive advantage in terms of brand loyalty and brand extensions.
The vast Indian consumer market covering the rural and urban areas is heterogeneous where both
branded and unbranded products co-exist. Creating Brand equity is a critical success factor in
today‟s competitive market. Successful brands provide competitive advantage in terms of brand
loyalty and brand extensions. This study based on field study and published research and
literature on the subject aims to fathom the trend and consumer preferences to branded and
unbranded products and services.
Entry of foreign brands has intensified the brand war. The young work force is brand conscious
and has no qualms in shifting to newer brands. They are more demanding and choosey on the
basis of extrinsic features and intrinsic values. FMCG market comprising of the large number of
low priced daily use non durable products fall prey to the unpredictable behaviour of the youth
population whose brand loyalty changes with their moods. While some brands like blue lagoon,
apache, etc. failed, many like Cadbury‟s, Maruti, Amul, Lux could withstand competition for
long periods of time due to innovations sustaining customer attention and loyalty.
2. Rationale of the Study
Kotler (2000) says branding is “a major issue in product strategy.” Even after two decades of
economic liberalization and entry of many foreign brands in India , unbranded products continue
to compete with the branded ones. This research study examines the consumer behaviour
SIT Journal of Management
Vol. 2. No. 2. December 2012. Pp. 122-138
2 Krishnan, Pande, & Mule
ISSN: 2278-9111
towards branded products in the midst of the paradigm changes taking place in the Indian
economy.
3. Objective of the study
i) Determinants for customer preferences for branded and unbranded products from
primary data analysis
ii) Strategies and Conclusions based on primary data and secondary published literature
and research studies.
4. Literature review
The American Marketing Association (AMA) defines brand as “a name, term, sign, symbol, or
design, or a combination of them, intended to identify the goods and services of one seller or
group of sellers and to differentiate them from those of competitors.” Kotler (2000) defined
brand as “the name, associated with one or more items in the product line that is used to identify
the source of character of the item(s)”. According to Davis and Dunn (2002) focusing on the
latest and greatest advertising campaign meant focusing on the brand. It was always referred to
as a series of tactics and never like strategy.
According to Cobb-Walgren et al. (1995), high brand equity levels lead to higher consumer
preferences and purchase intentions. Farquhar (1989) concludes that high brand equity enables
successful extensions, resilience against competitors‟ promotional pressures, and creates entry
barriers to competitors. Cunningham (1956) in his study on brand loyalty and store loyalty
attempted to find out whether the consumers who are brand loyal are also store loyal. Shopping
proneness is another characteristic that has been related to brand loyalty. According to Goldman
A. (1976) consumers with relatively lower income do not indulge in extensive shopping as there
means are limited. They also make less use of the shopping available.
Agarwal A. K. (1983) observed that consumers in general were found to be quite loyal to the
brands of frequently purchased items. The store loyalty was also observed to be high albeit
SIT Journal of Management
Vol. 2. No. 2. December 2012. Pp. 122-138
3 Krishnan, Pande, & Mule
ISSN: 2278-9111
lower than brand loyalty. Albert Merunka (2008) looked at 11 dimensions of consumer love for
a brand and brand relationship. Mattilla and Andrew (2008) looked at the influence of emotions
on satisfaction and loyalty. Thomson and Park (2005) developed a scale for consumer
attachments that included affection, passion and connection. It did not however examine other
dimensions and the impact on brand switching. Bravo Fraj Martenez (2007) observed that more
serious and responsible roles make consumers switch over to the brand used by their parents.
The available literature and research reveal that brand preference and loyalty is the interplay of
factors including emotional and psychological ones. The reviews highlight that in a dynamically
changing world, organizations would need to do research on consumer behaviour in a continuous
basis more so at granular level to perceive the small imperceptible changes at the incipient stage.
In India the pitch is further queered because the urban and rural markets are extremely different
and in both the markets people continue to indulge in non branded or local products.
5. Research Methodology
5.1 Coverage of Study
This study examines the consumer behaviour towards branded and unbranded products and
services and retailers‟ perception of the same with the help of a field survey using structured
questionnaire followed by interviews.
5.2 Sampling Design, Sample Size and Data Sources
Data and information were gathered from primary source by means of field survey using
structured questionnaires containing dichotomous and multiple choice questions covering retail
consumers and retailers on random sample basis in Mumbai and Thane and from secondary
published sources. The sample size consisted of 50 consumer respondents on a random sample
basis.
Primary sources included personal interviews for open ended questions. The consumers were
interviewed at their homes and offices and on shop floors. Secondary sources included books,
SIT Journal of Management
Vol. 2. No. 2. December 2012. Pp. 122-138
4 Krishnan, Pande, & Mule
ISSN: 2278-9111
journals, newspapers, websites, and research studies. They are used for literature review and
conceptual reference.
5.3 Data analysis
A critical qualitative analysis of the data and information were made keeping the objectives of
the study in mind. The collected primary data were classified, tabulated and analyzed using
statistical techniques. Analytical tools like percentage, cross tabs, graphs and pie-charts were
used for analysis and interpretation.
6. Findings of the Study
6.1 Primary Data Analysis
6.1.1 Demographics: Demographics of the sample respondents are as follows.
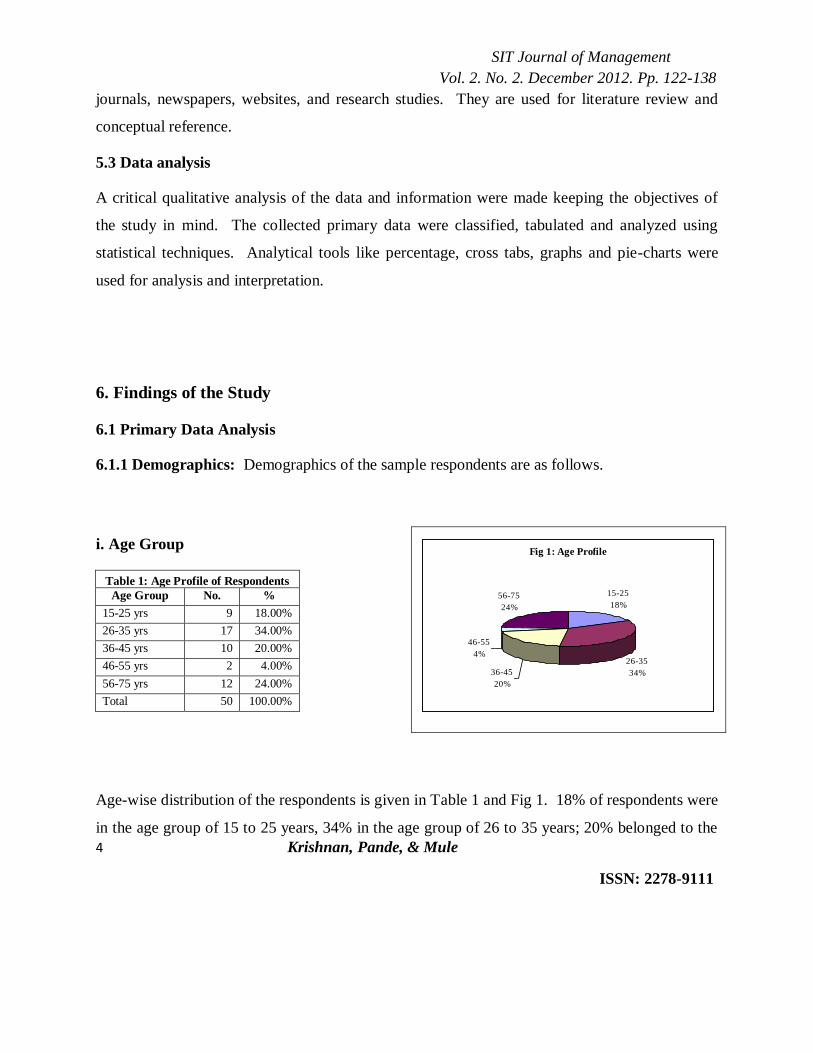
i. Age Group
Table 1: Age Profile of Respondents
Age Group No. %
15-25 yrs 9 18.00%
26-35 yrs 17 34.00%
36-45 yrs 10 20.00%
46-55 yrs 2 4.00%
56-75 yrs 12 24.00%
Total 50 100.00%
Age-wise distribution of the respondents is given in Table 1 and Fig 1. 18% of respondents were
in the age group of 15 to 25 years, 34% in the age group of 26 to 35 years; 20% belonged to the
Fig 1: Age Profile
15-25
18%
26-35
34%36-45
20%
46-55
4%
56-75
24%
SIT Journal of Management
Vol. 2. No. 2. December 2012. Pp. 122-138
5 Krishnan, Pande, & Mule
ISSN: 2278-9111
36 to 45 years age group, 4% belonged to the group 46 or 55 years and the remaining 24%
belonged to the 56 to 75 years age group. The sample design is thus fairly wide-spread across all
age groups.
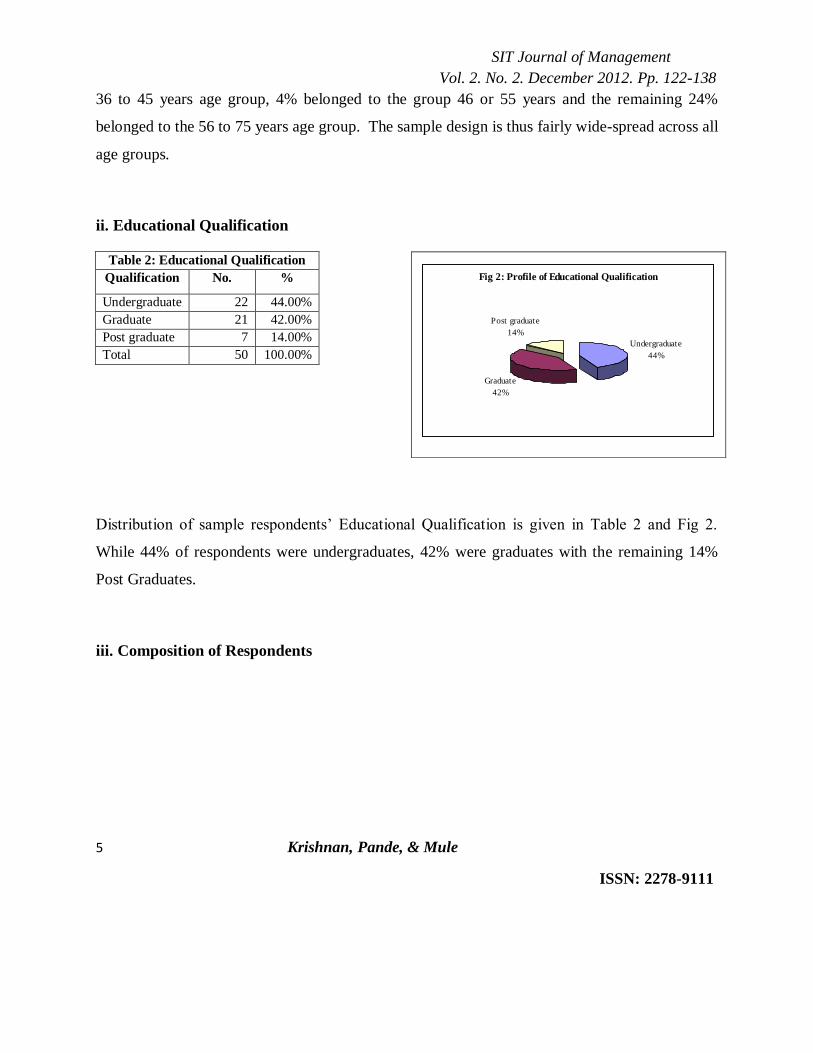
ii. Educational Qualification
Table 2: Educational Qualification
Qualification No. %
Undergraduate 22 44.00%
Graduate 21 42.00%
Post graduate 7 14.00%
Total 50 100.00%
Distribution of sample respondents‟ Educational Qualification is given in Table 2 and Fig 2.
While 44% of respondents were undergraduates, 42% were graduates with the remaining 14%
Post Graduates.
iii. Composition of Respondents
Fig 2: Profile of Educational Qualification
Undergraduate
44%
Graduate
42%
Post graduate
14%
SIT Journal of Management
Vol. 2. No. 2. December 2012. Pp. 122-138
6 Krishnan, Pande, & Mule
ISSN: 2278-9111
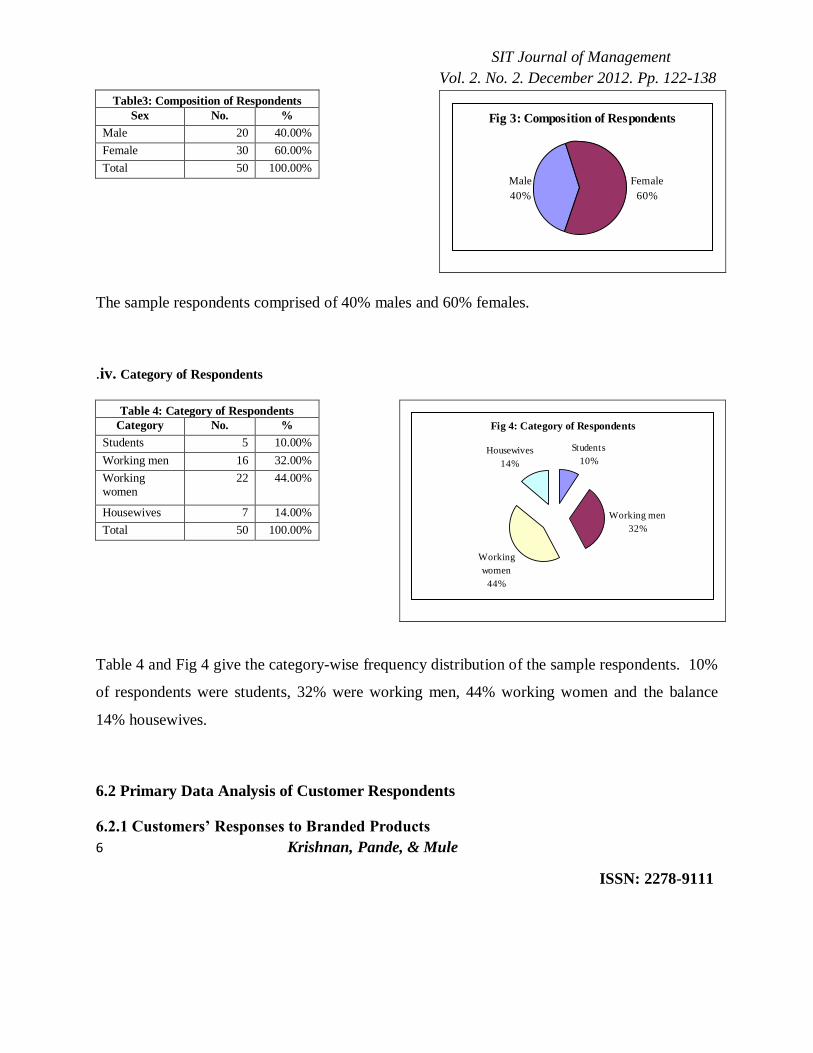
Table3: Composition of Respondents
Sex No. %
Male 20 40.00%
Female 30 60.00%
Total 50 100.00%
The sample respondents comprised of 40% males and 60% females.
.iv. Category of Respondents
Table 4: Category of Respondents
Category No. %
Students 5 10.00%
Working men 16 32.00%
Working women
22 44.00%
Housewives 7 14.00%
Total 50 100.00%
Table 4 and Fig 4 give the category-wise frequency distribution of the sample respondents. 10%
of respondents were students, 32% were working men, 44% working women and the balance
14% housewives.
6.2 Primary Data Analysis of Customer Respondents
6.2.1 Customers’ Responses to Branded Products
Fig 3: Composition of Respondents
Male
40%
Female
60%
Fig 4: Category of Respondents
Students
10%
Working men
32%
Working
women
44%
Housewives
14%
SIT Journal of Management
Vol. 2. No. 2. December 2012. Pp. 122-138
7 Krishnan, Pande, & Mule
ISSN: 2278-9111
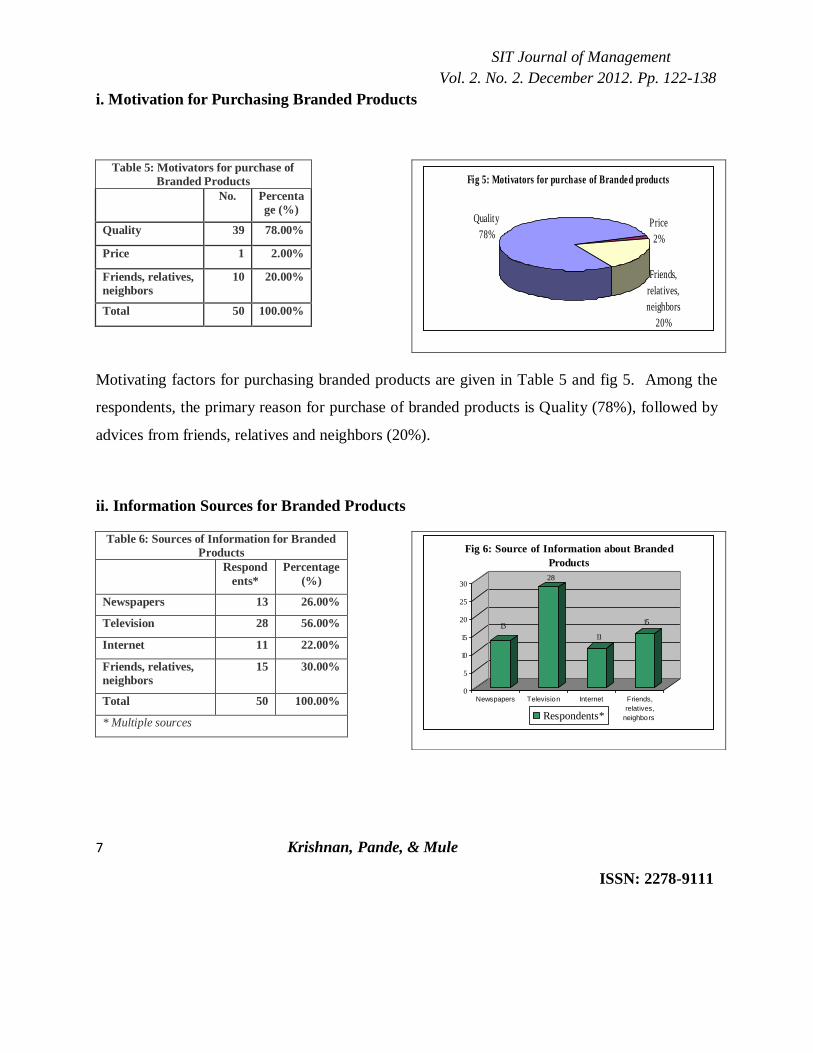
i. Motivation for Purchasing Branded Products
Table 5: Motivators for purchase of
Branded Products
No. Percenta
ge (%)
Quality 39 78.00%
Price 1 2.00%
Friends, relatives,
neighbors
10 20.00%
Total 50 100.00%
Motivating factors for purchasing branded products are given in Table 5 and fig 5. Among the
respondents, the primary reason for purchase of branded products is Quality (78%), followed by
advices from friends, relatives and neighbors (20%).
ii. Information Sources for Branded Products
Table 6: Sources of Information for Branded
Products
Respond
ents*
Percentage
(%)
Newspapers 13 26.00%
Television 28 56.00%
Internet 11 22.00%
Friends, relatives,
neighbors
15 30.00%
Total 50 100.00%
* Multiple sources
Fig 5: Motivators for purchase of Branded products
Quality
78%Price
2%
Friends,
relatives,
neighbors
20%
13
28
11
15
0
5
10
15
20
25
30
Newspapers Television Internet Friends,
relatives,
neighbors
Fig 6: Source of Information about Branded
Products
Respondents*
SIT Journal of Management
Vol. 2. No. 2. December 2012. Pp. 122-138
8 Krishnan, Pande, & Mule
ISSN: 2278-9111
Customers get information about the branded products from multiple sources. While television
(56%) is the major source of information about branded products, the other sources are friends,
relatives and neighbors (30%), newspapers (26%) and internet (22%).
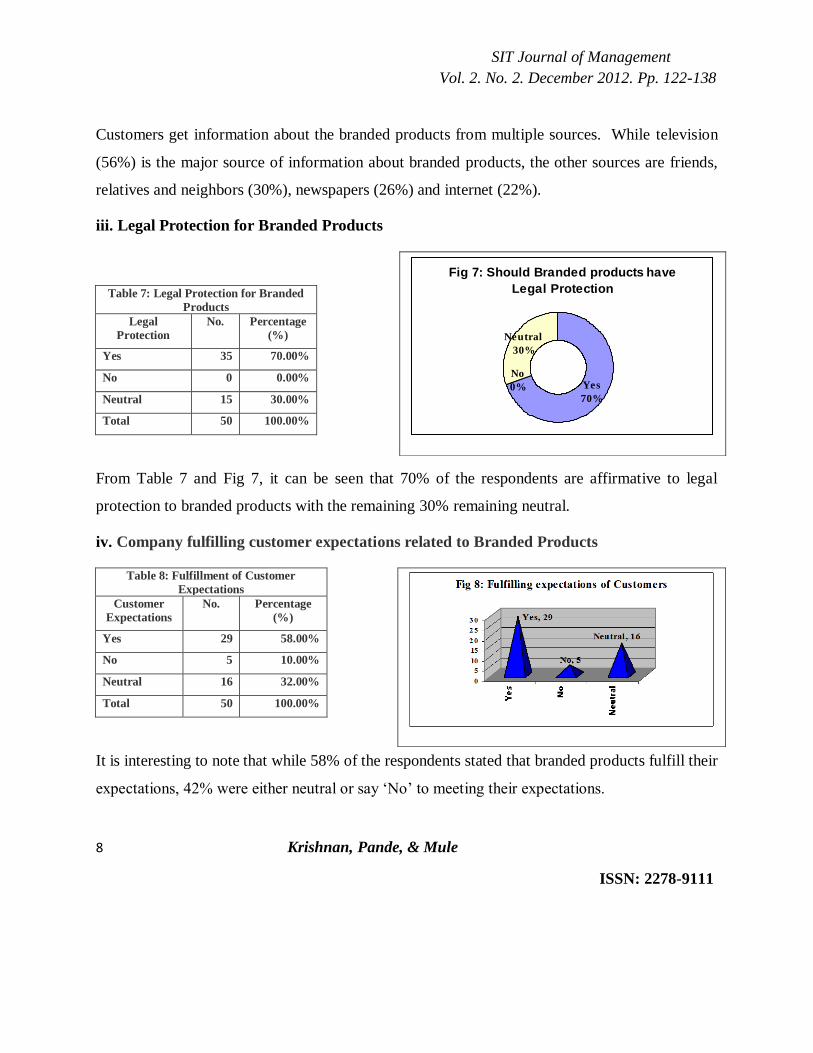
iii. Legal Protection for Branded Products
Table 7: Legal Protection for Branded
Products
Legal
Protection
No. Percentage
(%)
Yes 35 70.00%
No 0 0.00%
Neutral 15 30.00%
Total 50 100.00%
From Table 7 and Fig 7, it can be seen that 70% of the respondents are affirmative to legal
protection to branded products with the remaining 30% remaining neutral.
iv. Company fulfilling customer expectations related to Branded Products
Table 8: Fulfillment of Customer
Expectations
Customer
Expectations
No. Percentage
(%)
Yes 29 58.00%
No 5 10.00%
Neutral 16 32.00%
Total 50 100.00%
It is interesting to note that while 58% of the respondents stated that branded products fulfill their
expectations, 42% were either neutral or say „No‟ to meeting their expectations.
Fig 7: Should Branded products have
Legal Protection
Yes
70%
No
0%
Neutral
30%
SIT Journal of Management
Vol. 2. No. 2. December 2012. Pp. 122-138
9 Krishnan, Pande, & Mule
ISSN: 2278-9111
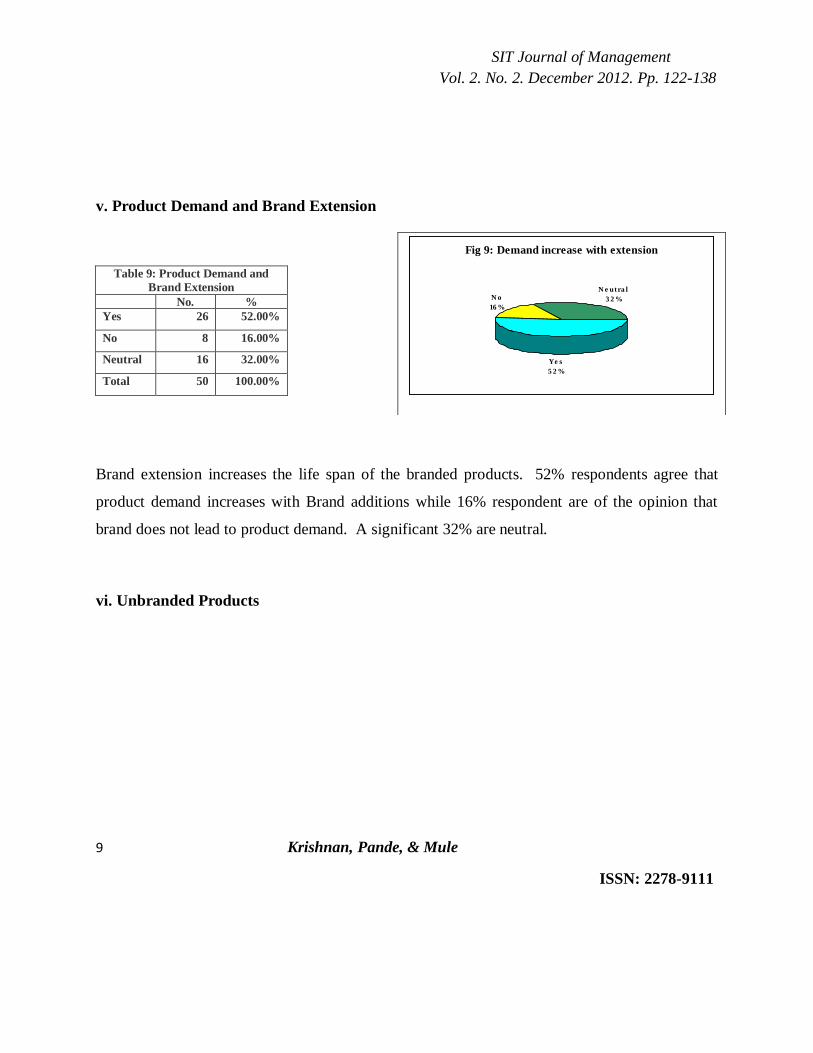
v. Product Demand and Brand Extension
Table 9: Product Demand and
Brand Extension
No. %
Yes 26 52.00%
No 8 16.00%
Neutral 16 32.00%
Total 50 100.00%
Brand extension increases the life span of the branded products. 52% respondents agree that
product demand increases with Brand additions while 16% respondent are of the opinion that
brand does not lead to product demand. A significant 32% are neutral.
vi. Unbranded Products
Fig 9: Demand increase with extension
Ye s
5 2 %
N o
16 %
N e utra l
3 2 %
SIT Journal of Management
Vol. 2. No. 2. December 2012. Pp. 122-138
10 Krishnan, Pande, & Mule
ISSN: 2278-9111
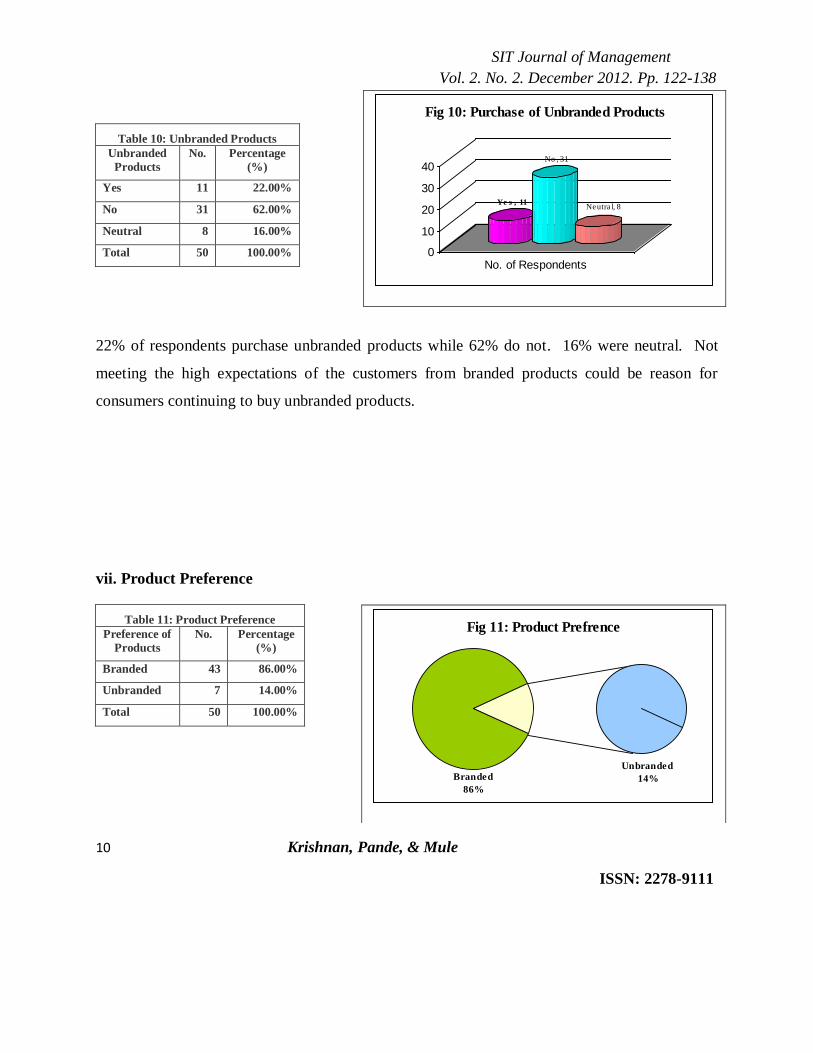
Table 10: Unbranded Products
Unbranded
Products
No. Percentage
(%)
Yes 11 22.00%
No 31 62.00%
Neutral 8 16.00%
Total 50 100.00%
22% of respondents purchase unbranded products while 62% do not. 16% were neutral. Not
meeting the high expectations of the customers from branded products could be reason for
consumers continuing to buy unbranded products.
vii. Product Preference
Table 11: Product Preference
Preference of
Products
No. Percentage
(%)
Branded 43 86.00%
Unbranded 7 14.00%
Total 50 100.00%
Ye s , 11
No , 31
Neutra l, 8
0
10
20
30
40
No. of Respondents
Fig 10: Purchase of Unbranded Products
Fig 11: Product Prefrence
Branded
86%
Unbranded
14%
SIT Journal of Management
Vol. 2. No. 2. December 2012. Pp. 122-138
11 Krishnan, Pande, & Mule
ISSN: 2278-9111
86% of the respondents prefer to buy branded products while 14% prefer unbranded products.
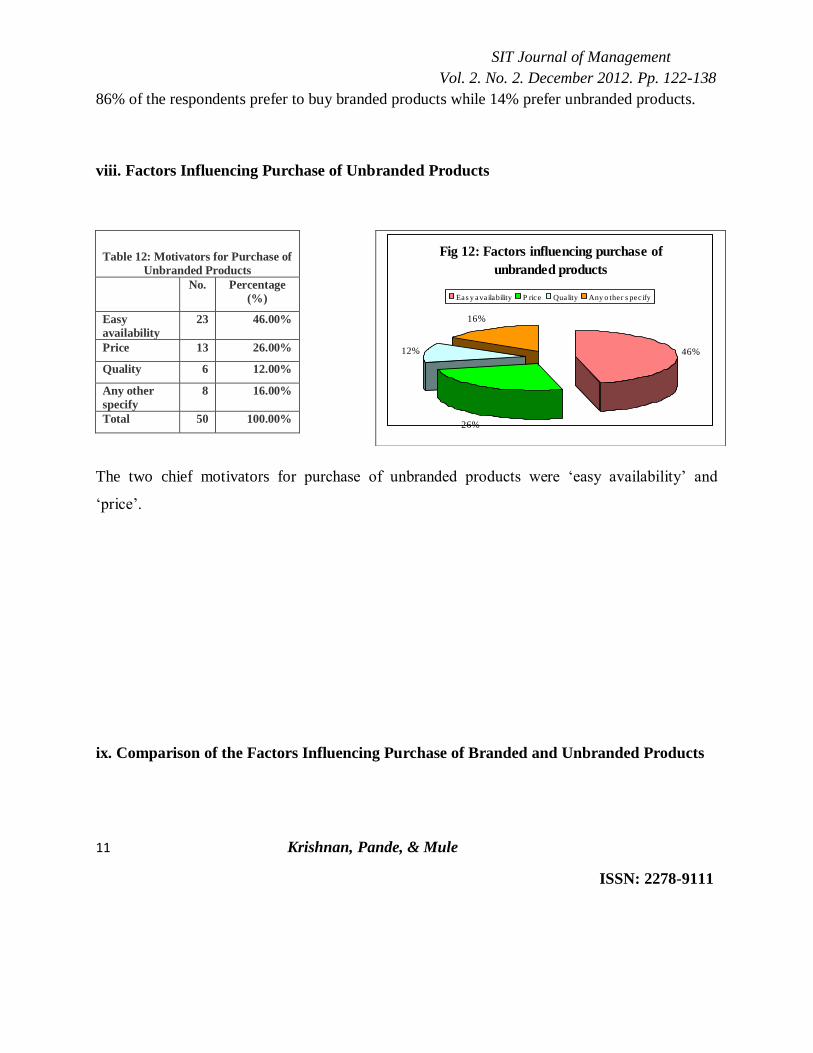
viii. Factors Influencing Purchase of Unbranded Products
Table 12: Motivators for Purchase of
Unbranded Products
No. Percentage
(%)
Easy
availability
23 46.00%
Price 13 26.00%
Quality 6 12.00%
Any other
specify
8 16.00%
Total 50 100.00%
The two chief motivators for purchase of unbranded products were „easy availability‟ and
„price‟.
ix. Comparison of the Factors Influencing Purchase of Branded and Unbranded Products
Fig 12: Factors influencing purchase of
unbranded products
46%
26%
12%
16%
Eas y ava ilability P rice Quality Any o ther s pec ify
SIT Journal of Management
Vol. 2. No. 2. December 2012. Pp. 122-138
12 Krishnan, Pande, & Mule
ISSN: 2278-9111
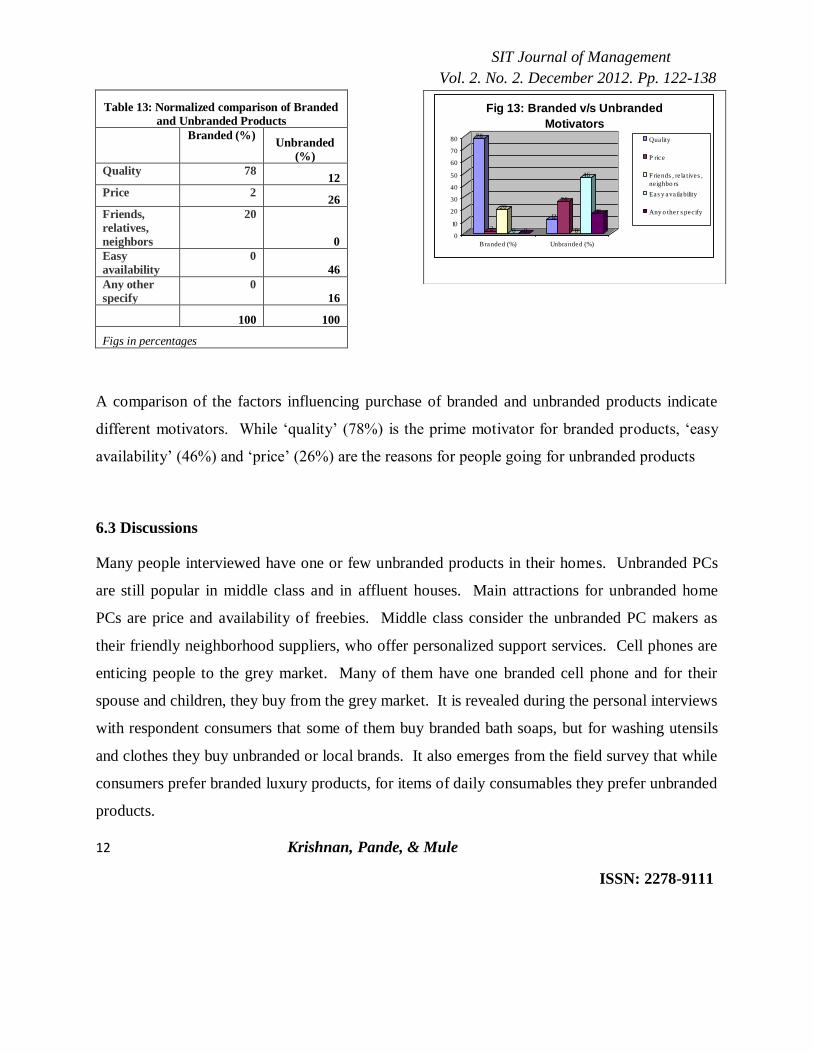
Table 13: Normalized comparison of Branded
and Unbranded Products
Branded (%) Unbranded
(%)
Quality 78 12
Price 2 26
Friends,
relatives,
neighbors
20
0
Easy
availability
0
46
Any other
specify
0
16
100 100
Figs in percentages
A comparison of the factors influencing purchase of branded and unbranded products indicate
different motivators. While „quality‟ (78%) is the prime motivator for branded products, „easy
availability‟ (46%) and „price‟ (26%) are the reasons for people going for unbranded products
6.3 Discussions
Many people interviewed have one or few unbranded products in their homes. Unbranded PCs
are still popular in middle class and in affluent houses. Main attractions for unbranded home
PCs are price and availability of freebies. Middle class consider the unbranded PC makers as
their friendly neighborhood suppliers, who offer personalized support services. Cell phones are
enticing people to the grey market. Many of them have one branded cell phone and for their
spouse and children, they buy from the grey market. It is revealed during the personal interviews
with respondent consumers that some of them buy branded bath soaps, but for washing utensils
and clothes they buy unbranded or local brands. It also emerges from the field survey that while
consumers prefer branded luxury products, for items of daily consumables they prefer unbranded
products.
78
2
20
0 0
12
26
0
46
16
0
10
20
30
40
50
60
70
80
Branded (%) Unbranded (%)
Fig 13: Branded v/s Unbranded
Motivators
Quality
P rice
Friends , re la tives ,
ne ighbo rs
Eas y ava ilability
Any o ther s pec ify
SIT Journal of Management
Vol. 2. No. 2. December 2012. Pp. 122-138
13 Krishnan, Pande, & Mule
ISSN: 2278-9111
Closer examination of the responses of customers to the questionnaire and personal interviews
reveals the following:
„Quality‟ is the prime determinant for purchase of branded products by consumers.
„Ease of availability‟ and „Price‟ are the major motivators for purchasing unbranded
products.
Only 58% of the respondent customers felt that branded products fulfill their expectations;
this could be one of the reasons for unbranded products continuing to be in demand.
A significant 30% of respondent consumers feel legal protection is lacking for branded
products.
A significant segment of consumers (42% of the respondents) feel that branded products do
not fulfill their expectations.
Another interesting revelation from the field study is that brand extension does not lead to
product demand.
Company reputation helps sell branded products.
Most of the retailers in both organized and unorganized segment stock and sell both branded
and unbranded products.
Retailers continue to offer discounts and free offers to sell unbranded products.
Consumers said that unbranded products are priced lower.
Not meeting the high expectations of the customers from branded products appears to be one
reason for consumers continuing to buy unbranded products.
7. Strategies
Brand strategy facilitates marketing efforts. All channels of communication such as
advertisement, public relations, internet and social media become in fructuous without a proper
SIT Journal of Management
Vol. 2. No. 2. December 2012. Pp. 122-138
14 Krishnan, Pande, & Mule
ISSN: 2278-9111
brand strategy. Clear and transparent communication is core to developing a brand strategy. It
should help build relationship with the customers.
There has to be holistic approach to marketing for brand building. It should encompass vision
and mission of the organization, employee participation in brand building, media mix, and
product and process innovations.
Retailers and marketers should explore internet marketing tools such as blogs, social media,
email marketing, webisodes, etc. With advancements in mobile technology and spread of mobile
to rural hinterland, mobile marketing tools such as SMS, MMS, etc., can be used to directly
reaching out to the customers.
The above should complement the other media such as advertisements in newspapers, radio,
television, public relations, event sponsorship, etc. Marketers should mix and match marketing
efforts, create synergies and to maximize their individual and collective efforts so as to underpin
the brand assurance.Brand building requires assessment of competition, consumer preferences,
changes in demographics and brand positioning
Marketers and retailers can use blue ocean strategy for brand building. They should identify or
create products and services for which there is no direct competition. For making the blue ocean
strategy more effective especially among the youths, retailers can use personalization tools such
as social media e.g., Facebook, Twitter, Flicker, You Tube, etc. and webisodes. Careful analysis
of customer reactions and responses and participation can help identify customer expectations
and new marketing opportunities. These can lead to product enhancements and product
innovations further strengthening blue ocean strategy.
Webisodes is another source for generating new marketing opportunities as part of blue ocean
strategy. It can be used for engaging readers, converting them into loyal customers and even as
brand ambassadors.
SIT Journal of Management
Vol. 2. No. 2. December 2012. Pp. 122-138
15 Krishnan, Pande, & Mule
ISSN: 2278-9111
Other marketing tools for catching the eye of the customers and potential customers are email
campaigns, interactive TV programs where customers are directly engaged in conversation and
SMS competition.Brand management and strategy should encompass a proper mix and
integration of the communication channels to enhance brand positioning and facilitate superior
brand equity
8. Conclusions
Indian retail market is a great paradox where branded and unbranded products co-exist. Even
shops in organized sector stock and sell unbranded products. While the Indian consumers are
becoming brand aware and there is discerning shifts towards branded products, the demand for
unbranded products and services are still significant. Indian consumers are still steeply ingrained
in tradition and use traditional products and practices. Retailers, to withstand competition and
sustain their bottom-line, peddle both branded and unbranded products on their shop floors to
increase turnover and customer base. Consumers being price sensitive sometimes do not mind
compromising on quality. This can become more pronounced during times of inflation.
Indian consumers are maturing and retailers find it increasingly difficult to influence their
purchase decisions merely with promotional offers. They would need to innovate. Retaining
customers has become a challenge due to lifestyle changes, needs and values. Young customers
are more demanding and do not mind experimenting and changing to new brands. Retailers
therefore have to adopt a mix of marketing and promotional strategies leveraging available
technology to withstand competition.
9. Limitations of the Study

SIT Journal of Management
Vol. 2. No. 2. December 2012. Pp. 122-138
16 Krishnan, Pande, & Mule
ISSN: 2278-9111
The small sample size and sample design are limitations of this Study. The cost and time
constraints are also limitations of this study. The study is confined to parts of Mumbai and Thane
districts. So the generalization of conclusions of the study may not have universal applicability.
But the findings give empirical inputs for a larger study across different market segments.
10. Significance and Scope for Further Research
The findings and conclusions of the study provide an experiential insight in to consumer
behaviour in an economy that is in the midst of an upswing. Further the changing demography,
socio-economic shifts and upwardly mobile younger generation with shifts in older generation
attitude and thinking and behaviour as well signifies the importance of studies such as this to
throw up the unexplained and unexplored aspects of consumer behaviour. Pan India research
using SPSS and better statistical and sampling techniques would definitely help further
understand the psyche of the Indian consumers who are maturing and becoming increasingly
brand conscious. Consternations in the Indian market and the ripple effect of changes across the
globe and entry of global brands in to India are reasons enough for further scope for detailed
studies into various aspects of behaviour of Indian consumers.
The research of this nature would help in brand strategy and positioning especially in the vast
expanding rural areas where there is pronounced tilt towards local or unbranded products. The
challenge before the manufacturers and marketers is making consumers purchase brands instead
of products. Their key task is to convert consumer preference and loyalty towards brands.
References
Vijaya Kumar G, Shanthini B N, (2011), “A Brand is For Ever”, Marketing Mastermind, May 2011, pp 13-16.
Pradhumn Kumar, (2011) “Role of Online social Networking sites in Branding”, Marketing Mastermid,
May 2011, pp 22-25.
SIT Journal of Management
Vol. 2. No. 2. December 2012. Pp. 122-138
17 Krishnan, Pande, & Mule
ISSN: 2278-9111
Senthil Nathan C, (2010), “Holistic Marketing Approach for Brand building”, Marketing Mastermind,
November 2010, pp 48-51.
Harish B, (2008), “The anatomy of Rebranding”, Marketing Mastermind, September 2008, pp 26-31.
Ghosal S N (2009), “Innovations in Advertising – Creating Added Values in Advertising”, Marketing Mastermind, November, pp 41-44.
Mrudula G P, (2009), “Advocacy Advertising – Generating Sales by Promoting an Opinion”, Marketing
Mastermind, January, pp 63-66.
Roy S, Lall S, (2008), “The New Humour in Advertising”, Marketing Mastermind, September, pp 45-48
Srivastava M K, Kochar B, (2009), “Women in Indian Advertising – From „Lalita‟ to „Lolita‟”,
Marketing Mastermind, July, pp 29-32.
Dadhal C H (2012), “An Empirical Study of the Impact of Demographic and Socio-Economic Factors on Brand Loyalty”, Journal of Management Outlook, Vol.2, No.1, Jan-June 2012, Pp 46-57.
Cunningham R M, (1956), “Brand Loyalty, what, Where and How Much?”, Harvard Business Review, Vol.34, Jan / Feb.
Cunningham S M, (1967), “Perceived Risk and Brand Loyalty in Donald Coased Risk Taking Information Handling in Consumer Behaviour”, Harvard University Press.
Goldman A, (1976), “Do Lower Income Consumers have a more restricted shopping scope?”, Journal of
Marketing, Vol.40, January
Albert, Noel, Merunka, Dwight and Vallette-Florance, Pierre (2008), “When Consumers Love their
Brands: Exploring the Concepts and its Dimensions”, Journal of Business Research, Vol. 61, No.10, pp 1062-1075.
Bigne, J Enrique, Matilda, anna S and Andreu Louisa (2008), “The Impact of Experiential Consumption Cognitions and Emotions on Behavioural Intentions”, Journal of Services marketing, Vol.22, No.4/5, pp
303-315.
Keller K J, (1993), “conceptualizing, Measuring and Managing Consumer-based Brand Equity”, Journal of Marketing, Vol.57, No.1, pp 1-27.
Krishnamurthy, Lakshman and Raj, S P (1991), “An Empirical analysis of the Relationship between Brand Loyalty and Consumer Price Elasticity”, Marketing Science, Vol.10, No.2, pp 172-183.
Lakshman, Nandani (2004), “Wooing Generation Next”, Business Standard, June 12,
http://www.business-standard.com/India/news/wooing-generation-next/152793/.
SIT Journal of Management
Vol. 2. No. 2. December 2012. Pp. 122-138
18 Krishnan, Pande, & Mule
ISSN: 2278-9111
Chaudhari, Arjun & Holbrook, Morris B, (2001), “The Chain Effects from Brand Trust and Brand Affect
to Brand Performance: The Role of Brand Loyalty, Journal of Marketing, Vol.65, No.2, pp 81-93.
Ewing, Michael, T., (2000), “Brand and Retail Loyalty: Past Behaviour and Future Intentions”, Journal of
Product and Brand Management, Vol.9, No.2, pp 120-127.
Huber, Frank, Hermann, Andreas (2001), “achieving Brand and Dealer Loyalty: The case of the
automotive industry”, The International Review of Retail, Distribution and Consumer Research, Vol.11,
No.2, pp 97-122.
Lou, Geok Theng, Lee, Sook Han, (1999), “Consumers‟ Trust in a Brand and the Link to brand Loyalty”,
Journal of Market Focused Management, Vol.4, pp 341-370.
Newman, J.W., Werbel, R.A., (1973), “Multivariate Analysis of Brand Loyalty for major household
appliances”, Journal of Marketing Research, Vol.10, No.4, --404-409.
Reynolds, K., Arnold, M., (2000), “Consumer Loyalty to the salesperson and the store: Examining
relationship customers inan upscale retail context”, Journal of Personal Selling & Sales Management,
Vol.20, No.4, pp.89-97.