detection and estimation of satellite attitude jitter ...cdn.intechweb.org/pdfs/13478.pdf · 13...
TRANSCRIPT
13
Detection and Estimation of Satellite Attitude Jitter Using Remote Sensing Imagery
Akira Iwasaki The University of Tokyo
Japan
1. Introduction
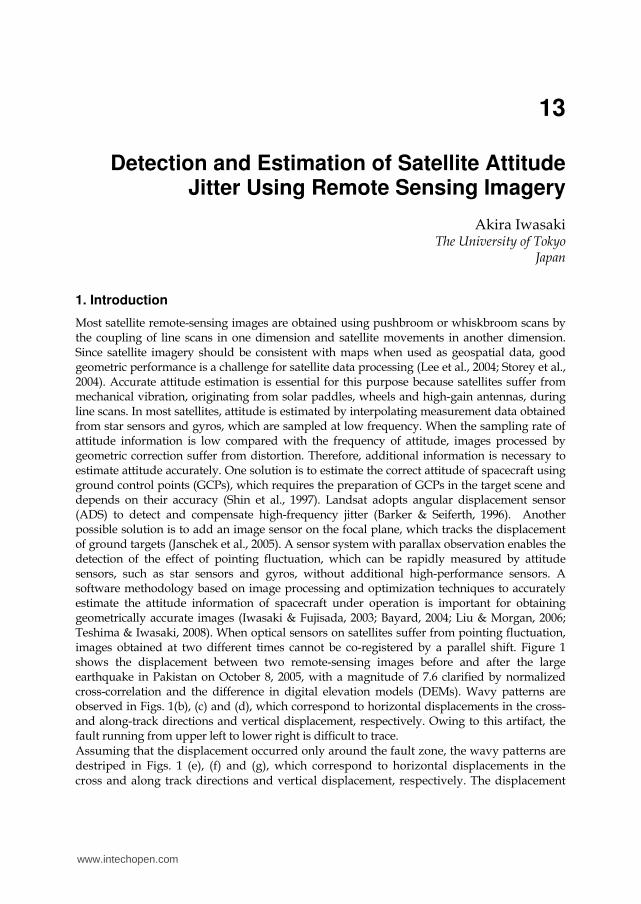
Most satellite remote-sensing images are obtained using pushbroom or whiskbroom scans by the coupling of line scans in one dimension and satellite movements in another dimension. Since satellite imagery should be consistent with maps when used as geospatial data, good geometric performance is a challenge for satellite data processing (Lee et al., 2004; Storey et al., 2004). Accurate attitude estimation is essential for this purpose because satellites suffer from mechanical vibration, originating from solar paddles, wheels and high-gain antennas, during line scans. In most satellites, attitude is estimated by interpolating measurement data obtained from star sensors and gyros, which are sampled at low frequency. When the sampling rate of attitude information is low compared with the frequency of attitude, images processed by geometric correction suffer from distortion. Therefore, additional information is necessary to estimate attitude accurately. One solution is to estimate the correct attitude of spacecraft using ground control points (GCPs), which requires the preparation of GCPs in the target scene and depends on their accuracy (Shin et al., 1997). Landsat adopts angular displacement sensor (ADS) to detect and compensate high-frequency jitter (Barker & Seiferth, 1996). Another possible solution is to add an image sensor on the focal plane, which tracks the displacement of ground targets (Janschek et al., 2005). A sensor system with parallax observation enables the detection of the effect of pointing fluctuation, which can be rapidly measured by attitude sensors, such as star sensors and gyros, without additional high-performance sensors. A software methodology based on image processing and optimization techniques to accurately estimate the attitude information of spacecraft under operation is important for obtaining geometrically accurate images (Iwasaki & Fujisada, 2003; Bayard, 2004; Liu & Morgan, 2006; Teshima & Iwasaki, 2008). When optical sensors on satellites suffer from pointing fluctuation, images obtained at two different times cannot be co-registered by a parallel shift. Figure 1 shows the displacement between two remote-sensing images before and after the large earthquake in Pakistan on October 8, 2005, with a magnitude of 7.6 clarified by normalized cross-correlation and the difference in digital elevation models (DEMs). Wavy patterns are observed in Figs. 1(b), (c) and (d), which correspond to horizontal displacements in the cross- and along-track directions and vertical displacement, respectively. Owing to this artifact, the fault running from upper left to lower right is difficult to trace. Assuming that the displacement occurred only around the fault zone, the wavy patterns are destriped in Figs. 1 (e), (f) and (g), which correspond to horizontal displacements in the cross and along track directions and vertical displacement, respectively. The displacement
www.intechopen.com

Advances in Spacecraft Technologies
258
DEM differenceCrosstrack
Horizontal displacementAlongtrackScene
60 km
(b)(a) (c) (d)
(e) (f) (g)
Fig. 1. Optical sensor image and displacement analysis. (a) Scene of Pakistan, displacements in (b) cross- and (c) along-track directions, (d) difference in DEMs. Displacements after satellite attitude correction in (e) cross- and (f) along-track directions, (g) difference in DEMs.
around the fault zone that runs from upper left to lower right is clearly observed, which was caused by the earthquake (Avouac et al., 2006). The upper-right portion moved toward the lower-left direction relative to the lower-left portion. Using the subpixel measurement technique, although the ground sampling distance (GSD) is 15 m, it was found that the fault offset was 4 m on average and 7 m at maximum. The analysis of ground deformation can be achieved as soon as a post-earthquake image is obtained. Note that since the fault runs in a diagonal direction, the displacement is recovered (Koga & Iwasaki, 2008, 2011). Furthermore, this type of analysis is also useful for investigating glacier flow, debris flow and sand dune migration. However, what should be done when the fault runs in the cross-track direction, that is, the same direction as the attitude jitter? This article introduces a methodology for detecting the sign of pointing jitter using the geometric consistency of line of sight (LOS) vectors. Although our investigation starts from the analysis of large platform satellites, small satellites that do not have good pointing stability are a target of our research, for which satellite mission instruments can help bus instruments to achieve a better geometric performance. The Landsat 7 Science Data Users Handbook states that geometrically corrected products should have multispectral bands registered to 0.17 pixels (1 sigma for 30 m GSD) and that geometrically corrected images from multiple dates should be capable of being registered to an accuracy of 7.3 m (1 sigma) to meet the requirements of Landsat 7 (NASA Goddard Space Flight Center, 1998). Our methodology using a sensor system with parallax observation makes it possible to satisfy these two criteria simultaneously.
2. Sensor configuration
2.1 Layout of sensor with parallax observation Figure 2 shows the concept of the sensor with parallax observation, which observes the specified ground target from slightly different angles, which means that time differences
www.intechopen.com

Detection and Estimation of Satellite Attitude Jitter Using Remote Sensing Imagery
259
exist between the observation time of each line scan. Although the parallax effect due to the terrain error in the along-track direction must be considered, many optical sensor systems on-board satellites adopt this configuration, such as QuickBird, FORMOSAT-2 and so forth (Jacobsen, 2006; Liu, 2006). Since the line sensors are arranged on the focal plane, simple optical systems using band-pass filters are realized without a prism spectrometer, which are suitable for compact optics of recent high-resolution satellite sensors.
Fig. 2. Sensor system with parallax observation.
Owing to the time difference in the observation time of the specified ground target, band-to-band registration is affected by satellite attitude. In this chapter, using the Advanced Spaceborne Thermal Emission and Reflection Radiometer (ASTER) as an example, we discuss the detection and estimation of the attitude fluctuation of satellites utilizing the disadvantage of the sensor configuration to obtain satellite-based images with improved geometric performance.
2.2 ASTER sensor The ASTER sensor is a multispectral imager on-board the Terra (EOS-AM1) spacecraft, which was launched in December 1999 (Neeck et al., 1994; Kudva & Throckmorton, 1996). The Terra spacecraft is in a sun-synchronous orbit at an altitude of 705 km with a local equatorial crossing time of 10:30. The repeat cycle is 16 days and the distance between neighboring orbits is 172 km, i.e., a similar orbit to Landsat 7 except for the local equatorial crossing time. The ASTER sensor is composed of three subsystems: visible and near infrared (VNIR), shortwave infrared (SWIR) and thermal infrared (TIR) radiometers. Table 1 shows the spectral passband of each subsystem. The VNIR subsystem has two telescopes, one at the nadir and the other with backward viewing, to construct a DEM. The VNIR subsystem is free from parallax error because a dichroic filter divides incident light into each VNIR band. Since the ASTER sensor is a complex system consisting of three subsystems with four telescopes, a Level-1 data processing system based on the configuration of the ASTER sensor has been constructed and validated (Fujisada, 1998; Iwasaki & Fujisada, 2005). The SWIR radiometer is a sensor with six narrow bands in the shortwave infrared region (1.6-2.43 μm) for discriminating rock and minerals using the specific absorption signatures.
www.intechopen.com

Advances in Spacecraft Technologies
260
Sub system
Band No.
Spectral range (µm)
Ground Sampling Distance
VNIR
1 2
3N 3B
0.52 - 0.60 0.63 - 0.69 0.76 - 0.86 0.76 - 0.86
15 m
SWIR
4 5 6 7 8 9
1.600 - 1.700 2.145 - 2.185 2.185 - 2.225 2.235 - 2.285 2.295 - 2.365 2.360 - 2.430
30 m
TIR
10 11 12 13 14
8.125 -8.475 8.475 - 8.825 8.925 - 9.275 10.25 -10.95 10.95 - 11.65
90 m
Table 1. ASTER pass band.
The SWIR images are obtained by means of a pushbroom system consisting of 2048 PtSi-CCD linear-array detectors with a pixel size of 16.5 μm that operate at liquid nitrogen temperature, which must be cooled mechanically. Therefore, the array detectors are arranged in parallel on the focal plane, as shown in Fig. 3(a). Since the distance between neighboring bands is 1.33 mm, each line scans the same ground target with a time difference of about 356.238 ms (nominal) from the nominal altitude, as shown in Fig. 3(b). The registration performance between bands deteriorates when pointing fluctuation occurs during the time lag between the observations.
Y-axis
X-axis
Band 6
Band 5
Band 4
Band 9
Band 8
Band 7
Boresight
(a) (b)
Spacecraft
Major Clock1.024 s
Band 6
SWIR
Sampling
Band 5
4.398 ms
356.238 ms
Attitude
Propagation0.512 s
Gyro Rate0.128 s
Fig. 3. ASTER sensor design. (a) Configuration of SWIR sensor and (b) timetable of attitude and image data sampling.
www.intechopen.com

Detection and Estimation of Satellite Attitude Jitter Using Remote Sensing Imagery
261
The Terra spacecraft provides attitude data with a resolution of 1 arcsecond and attitude rate data with a resolution of 0.5 arcseconds/s every 1.024 s, which is the major clock on which spacecraft information is based. Images are corrected geometrically using attitude and navigation data, which are interpolated using third-order polynomials. Therefore, we cannot accommodate the attitude data with high accuracy when fluctuation occurs at a higher frequency. The angular error of 1 arcsecond corresponds to about 3.4 m on the ground for the Terra spacecraft. Since the GSD of the SWIR radiometer is 30 m, the angular error of 1 arcsecond leads to a registration error between bands of 0.1 pixels or less. The sampling interval of each line of the SWIR sensor is 4.398 ms to obtain the GSD of 30 m, and the time resolution is considerably higher than that of the spacecraft attitude data. Using the registration error between bands of the SWIR images, attitude information can be corrected with a higher sampling rate of up to 220 Hz.
3. Detection and correction of satellite attitude jitter
3.1 Formulation of jitter detection by sensor with parallax observation To reduce the registration error between bands and the internal distortion in images, the true attitude information should be estimated from the relative registration error obtained from the analysis of two images obtained with a time difference. Figure 4 shows the sequence of the image acquisition process with a time lag. Using the deviation from the correct attitude of the master data f(t) at time t, the relative registration error g(t) of the slave data with the deviation from the correct attitude with time lag τ, f(t+τ), is expressed as follows.
( ) ( ) ( )g t f t f tτ= + − (1)
The relative registration error is obtained from the analysis of one scene in the range 0≤t≤te s. When the deviation from the correct attitude during the observation time lag, that is, f(t; 0≤t≤τ), is estimated, the satellite attitude data are obtained from the relative registration error using Eq. (1). However, since there are many f(t) that satisfy the above relationship, another constraint should be introduced. Since the attitude is interpolated using third-order polynomials in Level-1 data processing, we can assume that the deviation from the correct attitude is also smooth. On the basis of this idea, the deviation from the correct attitude during the observation time lag should be obtained that minimizes the following evaluation function.
Band 6 Band 5 Difference
Flight
DirectionSudden Attitude Change
Fig. 4. Sequence of image aquisition for small parallax sensor.
www.intechopen.com

Advances in Spacecraft Technologies
262
{ } { }2 2( ( )) ( ) ( ) ( ) ( ) ( )J f t f t f t g t dt f t t f t dtτ α= + − − + + Δ −∫ ∫ (2)
Here, Δt denotes the line sampling time of a line sensor. The first term on the right side corresponds to Eq. (1) and the second term is related to the smoothness using a regularization coefficient α. The Fourier transform of Eq. (1) leads to the following equation.
( )( )( )
exp 1
GF
j
ωω ωτ= − (3)
The denominator on the right side becomes zero when ωτ is an integer, which corresponds to the situation that the frequency is an integer multiple of the reciprocal of the time lag. This means that the satellite attitude jitter with this frequency cannot be identified because the clockwise motion of a line sensor and the anticlockwise motion of another line sensor cannot be distinguished.
3.2 Similarity measures to obtain displacement
Two similarity measures are used for the block matching of two images in this work. Zero-
mean normalized cross-correlation (NCC) is widely used as the criterion of the registration
error between images (Iwasaki & Fujisada, 2003 & 2005; Liu, 2006). The covariance C(m, n)
obtained using Eq. (4) has a maximum value when two images match each other.
1
22 2
{ ( , ) } { ( , } }
( , )
{ ( , ) } { ( , ) }
Ly Lx
j i
Ly LyLx Lx
j i j i
M i j M S i m j n S
C m n
M i j M S i m j n S
− × − − −=⎡ ⎤⎢ ⎥− × − − −⎢ ⎥⎣ ⎦
∑∑∑∑ ∑∑
(4)
Here, M(i, j) and S(i, j), respectively, denote the pixel values of the master and slave images for the pixel coordinates (i, j). Lx and Ly denote the sizes of the correlation window in the cross-track and along-track directions, respectively. M and S denote the average pixel
values within the correlation window in the master and slave images, respectively. The registration error is obtained by the following steps. The integer set with the maximum value of correlation is first selected as the candidate for displacement between two images. Next, the point with the highest correlation is obtained at a subpixel level by parabola fitting to the neighboring correlation values and determining the vertex value. Phase correlation (PC) is also used as a similarity measure (Hoge, 2003; Leprince et al., 2007; Morgan et al., 2010). Consider two N1 X N2 images s(n1, n2) and s’(n1, n2)= s(n1–δ1, n2–δ2) that differ by the displacement (δ1, δ2). The cross-phase spectrum is expressed by Eq. (1) using the shift theorem.
*
1 2 1 2 1 21 2 1 2*
1 21 2 1 2
( , ) ' ( , )( , ) exp 2
( , ) ' ( , )
S SR j
N NS S
ω ω ω ω ω ωω ω π δ δω ω ω ω⎧ ⎫⎛ ⎞⎪ ⎪= = − +⎜ ⎟⎨ ⎬⎜ ⎟⎪ ⎪⎝ ⎠⎩ ⎭
(5)
The phase correlation function r(n1, n2) is defined as the inverse discrete Fourier transform of R(ω1, ω2).
www.intechopen.com

Detection and Estimation of Satellite Attitude Jitter Using Remote Sensing Imagery
263
( ) ( )1 1 2 21 2
1 1 2 2
sin ( ) sin ( )( , )
n nr n n
n n
π δ π δπ δ π δ
+ += + + (6)
The peak position of the phase correlation function corresponds to the misregistration between two images. To reduce the image boundary effect in the frequency domain, a two-dimensional Hanning window is applied to the input image. A low-pass filter is also applied in the frequency domain to eliminate the high-frequency components of each image. The subpixel displacement between the images is obtained by sinc function fitting to the neighboring correlation values (Nagashima et al., 2006). Although the size of the correlation window must be larger than that of NCC, the peak of PC is much steeper than that of NCC, and thus the accuracy of PC surpasses that of NCC and reaches 1/50 pixels (Leprince et al., 2007). Therefore, we use NCC to obtain a flexible-size correlation window and PC for accurate displacement measurement in this chapter.
3.3 Using map-projected data product Figure 5(a) shows the nadir-looking SWIR image of the Level-1B data products analyzed in this study, which was acquired on June 07, 2002, above Tokyo. Level-1B data products are map-projected images, which are projected using radiometric calibration and geometric correction coefficients for resampling that are oriented to the satellite path but not orthorectified. Thus, the line of Level-1B data products in the horizontal direction is almost equal to the scan line. The acquisition duration of one scene is about 9 s, which corresponds to 2100 lines of data. We used band 5 and band 6 images because they are placed at neighboring positions on the focal plane and because their spectral characteristics are sufficiently similar to be suitable for correlation. Furthermore, band 6 represents the SWIR subsystem and the geometric calibration relative to VNIR is performed intensively.
+1.0
+0.5
0.0
-0.5
-1.0
(a) (b)
(e)
(c)
(f)
(d)
(g)+1.0
+0.5
0.0
-0.5
-1.0
+1.0
+0.5
0.0
-0.5
-1.0
(a) (b)
(e)
(c)
(f)
(d)
(g)
Fig. 5. (a) ASTER/SWIR scene on 06/07/2002, Tokyo, Japan. Relative registration error maps of band 5 before correction in the cross-track direction relative to (b) band 6 and (c) band 5 on 06/04/2001 and (d) Landsat 7/ETM+ band 7 on 03/29/2000. Relative registration error maps after correction relative to (e) band 6 and (f) band 5 on 06/04/2001 and (g) Landsat 7/ETM+ band 7 on 03/29/2000.
www.intechopen.com

Advances in Spacecraft Technologies
264
Figure 5(b) shows the registration error map of band 5 relative to band 6 in the cross-track direction. The relative registration error is plotted on the center pixel of the correlation window, the size of which is set to 7 (cross-track) by 7 (along-track), which is used only to evaluate the registration error in this scene. A bright pixel denotes that the band 5 pixel deviates to the right in the image. A black pixel denotes a point at which good correlation is not obtained, such as a pixel representing water. It can be seen that a periodic displacement pattern occurs in the error map. The relative registration error between bands is due to the time dependence of jitter on the line of sight, which is attributable to attitude variation. This means that an absolute registration error of the acquired image relative to the actual geographical position exists. The frequency and amplitude of the jitter are about 1.5 Hz and 0.2-0.3 pixels, which corresponds to 6-9 m on the ground, respectively. This jitter corresponds to the roll fluctuation of the Terra spacecraft. Since the attitude sensors of the Terra spacecraft cannot follow the vibration at this frequency, the relative deviation between bands still remains. Comparisons with the images obtained by ASTER on a different day (Fig. 5(c)) and by Landsat 7/ETM+ (Fig.5 (d)), which are free from pointing jitter, show a similar performance for each image. Since the master images are not disturbed by the pointing fluctuation, the jitter corresponds to the absolute pointing fluctuation of the slave image. Note that the Landsat 7/ETM+ image (2.08 μm - 2.35 μm) on 06/07/2002 is affected by some jitters, which might be related to a malfunction in the scanning mirror (Lee et al., 2004). The time course of the relative deviation between bands in the cross-track direction is calculated for jitter analysis using a window size of 501 (cross-track) by 1 (along-track), and is averaged in the cross-track direction of a path-oriented image, which is an effective and robust method fro detecting the jitter with high time resolution. Areas of water are eliminated owing to their low standard deviation of digital numbers in the window. The relative registration error is averaged in the cross-track direction with a 3σlimits. The
solution of Eq. (2) is obtained by the following method. Considering that the relative registration is obtained with high accuracy, the first term on the right side in Eq. (2) is set to zero and the optimum solution that minimizes the second term is obtained, which expresses the smoothness of the deviation from the true amplitude.
{ }2( , ( : 0)) ( ) ( )J f t t f t t f t dtτ τ α− ≤ ≤ = + Δ −∫ (7)
When the smoothest solution f(t; -τ≤t≤0) that minimizes the evaluation function is obtained, f(t; 0≤t≤9) is calculated using Eq. (2). We used the downhill simplex method to find the f(t; -τ≤t≤0) that minimizes the evaluation function. The relative registration error has not only an alternating current (AC) component but also a direct current (DC) component, which means that the moving average of the relative registration error in the cross-track direction is not zero but has an offset of about 0.008 pixels. This offset originates from the relative error in the LOS vector between bands. Thus, we should subtract the offset from the relative registration error. Otherwise, monotonically increasing behavior is observed. Since τ varies with changes in the spacecraft altitude, a representative value of a scene is determined so as to minimize the relative registration error between the corrected images. The estimated pointing fluctuation that minimizes the evaluation function J is obtained, provided that the time lag τ is 80.9 lines, which is close to the nominal value of 81 lines. The deviation from the correct attitude f(t) is estimated simultaneously using the relative
www.intechopen.com

Detection and Estimation of Satellite Attitude Jitter Using Remote Sensing Imagery
265
registration error of band 5 relative to band 6. Images are rearranged by bilinear interpolation in the cross-track direction on the basis of the corrected attitude data. Figure 5(e) shows the registration error map of band 5 relative to band 6 in the cross-track direction after correction. The primary periodic deviation observed in Fig. 5(b) disappears. The RMS value and the amplitude of the relative registration error between uncorrected images are 0.130 and 0.292 pixels, whereas those between corrected images are 0.024 and 0.074 pixels, respectively. As a result, the average registration error between bands is reduced to less than 0.1 pixels, which is a good band-to-band registration performance and will be effective for discriminating type of rock and minerals using SWIR data. Since band-to-band registration is improved by correcting attitude data consistently, absolute distortion can be also compensated. Figure 5(f) shows the registration error map of the band 6 image taken on 06/07/2002 above Tokyo relative to that on 06/04/2001 after correction. The primary periodic deviation observed in Fig. 5(c) disappears. The RMS value and the amplitude of the average relative registration error before correction are 0.068 and 0.191 pixels, whereas those after correction are 0.027 and 0.078 pixels, respectively, showing that the internal distortion in the scene is reduced. This result shows that the method corrects the absolute distortion. Comparison with Landsat 7/ETM+ images, which are corrected using attitude information with markedly high time and angular resolutions using an ADS with a frequency of up to 250 Hz with an angular resolution of 0.025 arcseconds, shows that the periodic misregistration pattern disappears. A limitation of the present correction method exists in the accuracy of image registration. The relative registration error is average in the correlation window. Furthermore, the peak value of the averaged relative registration error decreases owing to the undulation of the LOS vector and the parallax correction in Level-1B data processing. Thus, the relative registration error is underestimated and jitter cannot be fully corrected.
3.4 Using sensor based data product Although the attitude jitter correction method using the Level-1B data products works well,
the pointing angle from the nadir is limited. An influence of the elevation of the earth’s
surface exists because the earth’s rotation causes a parallax in the cross-track direction.
Furthermore, the time lag between band observations should be estimated. Therefore, these
problems are considered using the sensor-based data products, Level-1A, which are the
original raw images associated with the radiometric calibration and geometric correction
coefficients used for resampling. Thus, the line of Level-1A data products in the horizontal
direction is equal to the scan line.
To obtain tie points between bands 5 and 6 of ASTER by the parallax observation, we
developed software to generate DEMs similar to that in previous studies (Fujisada et al.,
2005; Koga & Iwasaki, 2010). First, bands 5 and 6 of Level-1A images with a radiometric
correction are input, which include supplementary data and ancillary data. Second, the
corresponding points between two images are detected and a disparity value is calculated
using a subpixel image-matching technique. This procedure is repeated over several
multiscale steps with a coarse-to-fine approach, which enables us to reduce the
computational cost. In addition, we select the operation parameters in each step, such as
those in the interpolation method, matching method or filtering model. Since the parallax is
sufficiently small, a phase correlation that obtains the disparity accurately is available. The
warping of band 5 images obtained by image matching is effective for avoiding a pixel-
www.intechopen.com

Advances in Spacecraft Technologies
266
locking effect in the next matching process because the disparity is distributed around zero
pixels.
Third, the three-dimensional position of each pixel is calculated by bundle adjustment using
the LOS vector. The ASTER LOS vector is the vector between the satellite position and
ground pixel's position on the World Geodetic System 1984 (WGS84) ellipsoid obtained by
interpolating the geometric correction table. Note that the ground pixel position is corrected
using the parallax correction of Level-1 data processing that removes the terrain effect using
image matching or coarse DEM data (Iwasaki & Fujisada, 2005), which is restored using the
parallax offset in Level-1A data products. For band 6, the LOS vector 6e
f multiplied by p
extends from the satellite position 6sf
to the point 6x
f, which is expressed by Eq. (8).
6 6 6x pe s= +f f f (8)
Similarly, for band 5, the LOS vector 5ef
multiplied by q extends from the satellite position
5sf
to the point 5xf
, which is expressed by Eq. (9).
5 5 5x qe s= +f f f (9)
Owing to the error in the LOS vectors and satellite attitude jitter, the two vectors are skew
vectors and do not intersect. Minimization of the distance between 6x
f and
5xf
using the least-
squares method leads to the pierce point, giving by the parameters expressed in Eq. (10).
( ) ( )( )( )( ) ( )( )( )
6 6 5 6 5 5 6 5
26 5
5 5 6 6 5 6 5 6
26 5
, , ,
1 ,
, , ,
1 ,
e x x e e e x xp
e e
e x x e e e x xq
e e
− − −= −− − −= −
f f f f f f f f
f f
f f f f f f f f
f f
(10)
The bundle error is the minimum distance between two LOS vectors. Since the sensors scan the same target by bands 5 and 6 line detectors with a time interval, the bundle error between the two views includes the jitter of both scans. Since most of the fluctuation in the bundle error is related to the jitter in the roll component, the rotation angle of the LOS vectors that minimizes the bundle error is obtained. The orbital coordinate system is centered on the satellite and the orientation is determined relative to the spacecraft position. The yaw axis is parallel to the vector between the satellite and the earth’s center, the pitch axis is normal to the flight vector and the yaw axis, and the roll axis is normal to the yaw and pitch axes. The bundle error of any pixel in a Level-1A image is decomposed in the cross-track direction and converted to the attitude error around the roll axis. The measured surface position is obtained in Cartesian coordinates and is converted to the earth-centered reference (ECR), and elevation is obtained as the height on the WGS84 ellipsoid. Finally, the image and the elevation data are projected onto an orthorectified image with path-oriented Universal Transverse Mercator (UTM) coordinates. The time difference between the two bands is not equal to the nominal time lag but differs depending on the elevation, the off-nadir angle and the pointing angle. Considering that the variation due to the elevation is about one line and the deviation from the correct attitude f(t) is sufficiently smooth, this effect is small. Furthermore, since we can iteratively revise the
www.intechopen.com

Detection and Estimation of Satellite Attitude Jitter Using Remote Sensing Imagery
267
deviation from the correct attitude using the newly obtained f(t), this problem is not discussed further. Note that the correct time lag is directly obtained when the tie points of two LOS vectors are calculated.
(a) (b) (c) (d)
Fig. 6. Relative bundle error maps of band 5 relative to band 6 on (a) 06/07/2002 and (b) 06/04/2001. (c) Corrected bundle error map for 06/07/2002. (d) Along-track disparity obtained using bands 5 and 6 images.
Figures 6(a) and (b) show the bundle error between bands 5 and 6 in the roll direction on 06/07/2002 and 06/04/2001, respectively. The former suffers from attitude jitter, whereas the latter is almost free from vibration. The method in the previous section is next improved to make it robust and simple. First, an appropriate value of f(t; 0≤t≤τ) is input and f(t; τ≤t≤ te+τ) is obtained from Eq. (1). Since f(t) at this stage has many discontinuities, it is filtered using median and average filters. Next, f(t; 0≤t≤τ) is obtained using Eq. (1) and the average of f(t) is set to zero. Using the newly obtained f(t; 0≤t≤τ), these steps are repeated several times to obtain a continuous curve that approximates Eq.(1). We obtained improved band-to-band registration compared with the former case, as shown in Fig. 6(c), which shows that most of the jitter is corrected. However, since the DEM that is obtained from the tie points of the two LOS vectors fluctuates owing to the pitch jitter, as shown in Fig. 6(d), the orthorectified products are also affected. Therefore, the correction of the pitch component is also considered at the same time, which is discussed in the next section. Another problem is the smoothing of the response curve because a square correlation window with a relatively large size is required in image matching by PC. Averaging of the measurements and exclusion of the false correlation over areas of water are also necessary in the procedure.
3.5 Detection of pitch component Although correction of the roll component fluctuation is achieved, another task remains, detection of the pitch component. The importance of pitch control is recognized in along-track stereo vision, such as that in ASTER, SPOT-5 and ALOS/PRISM (Takaku & Tadono, 2009). Since the parallax in the along-track direction is added to the band-to-band displacement, the problem is more complicated than the detection of the roll component. Figures 7(a) and (e) show the target scenes used for this study, Tokyo on 06/07/2002 and Mt. Everest on 11/10/2004, respectively. The disparities of bands 7 and 9 relative to band 8 show a periodic pattern, as shown in Figs. 7(b) and (c), respectively. Although the scene is flat, the displacement is larger at the edge in Fig. 7(b) owing to the sphericity of the earth. The disparities of bands 7 and 9 relative to band 8 produce an elevation pattern, as shown in Figs. 7(f) and (g), respectively, where Mt. Everest is located at the upper right of the scene and the river flows from the scene center to the bottom center. Attitude fluctuation is also observed in the figures.
www.intechopen.com

Advances in Spacecraft Technologies
268
(b)(a) (c) (d)
(f) (g) (h)(e)
Fig. 7. (a) ASTER/SWIR scene on 06/07/2002, Tokyo, Japan. Relative registration error maps of (b) band 7 and (c) band 9 relative to band 8. (d) after canceling the elevation effect. (e) ASTER/SWIR scene on 11/10/2004, Mt. Everest. Relative registration error maps of (f) band 7 and (g) band 9 relative to band 8. (h) after canceling the elevation effect.
h
ττ Δτ
H
Δτ
Fig. 8. Schematics of three-line data acquisition.
It is interesting that the DEM is obtained using a small-parallax configuration, which is mentioned as the small baseline stereo vision because the patterns in the two stereo images are similar (Morgan et al., 2010). Furthermore, occlusion due to steep mountains and clouds, which is critical in stereo vision, is mitigated. The base-to-height (B/H) ratio of ASTER/SWIR is (81 lines X 30 m)/705 km ≈ 0.0034, which is much smaller than that of the VNIR stereo system of 0.6 (Fujisada et al., 2005). Therefore, image matching using PC with high accuracy is essential for this purpose. Since the pointing jitter is critical in the stereo system, we must remove the elevation effect to detect the pointing fluctuation. The introduction of a three-line sensor configuration solves this problem, as shown in Fig. 8. With such a configuration, more accurate DEM without pointing jitter is obtained. The displacement of band 7 relative to band 8, g’(t), is written as follows in terms of the effect of the elevation, disparity(h), (Okuda & Iwasaki, 2010) and the change in data
www.intechopen.com

Detection and Estimation of Satellite Attitude Jitter Using Remote Sensing Imagery
269
acquisition time due to the elevation, Δτ, as shown in Fig. 8 (Schowengerdt, 2007). The contribution of Δτ is sufficiently small to be neglected, as was assumed in the analysis in the previous section.
'( ) '( ) '( ) ( )g t f t f t disparity hτ τ= + − Δ − + (11)
The displacement of band 9 relative to band 8, g’’(t), is written as follows.
''( ) '( ) '( ) ( )g t f t f t disparity hτ τ= − + Δ − − (12)
By adding Eqs. (11) and (12), we can obtain an equation free from disparity(h).
'( ) ''( ) '( ) '( ) 2 '( )g t g t f t f t f tτ τ τ τ+ = + − Δ + − + Δ − (13)
Figure. 7(d) and (h) show the results of this operation, indicating that the affect of the
elevation is canceled as shown by Eq. (13). The Fourier transform of Eq. (13) is written as
follows using the shift theorem.
( ) ( )'( ) ''( )'( )
exp exp 2
G GF
j j
ω ωω ω τ τ ω τ τ+= ⎡ ⎤ ⎡ ⎤− Δ + − − Δ −⎣ ⎦ ⎣ ⎦ (14)
The attitude is estimated in a similar way to the estimation of the roll component. The frequency of the pitch component jitter is the same as that of the roll component jitter. After canceling the pitch jitter, we can extract the correct elevation.
4. Conclusion and future works
To realize the good geometric performance of images obtained by earth observation sensors,
accurate estimation of the spacecraft position and attitude is required. As the spatial
resolution of remote-sensing missions is increased, the requirement of attitude stability will
become increasingly severe, reaching to as small as 0.1 arcseconds with a frequency of more
than 10 Hz. Furthermore, to meet users’ data requirements, a high agility enabling
multipoint observations, which cause frequent changes in satellite attitude, is needed. At the
same time, the spatial resolution of small satellites is also increasing, however, their pointing
stability is much lower owing to dynamic disturbances, such as solar pressure, atmospheric
drag and magnetic torque (Wertz & Larson, 1999).
In this chapter, the detection and estimation of satellite jitter using remote-sensing imagery
is described. Instead of requiring the very high pointing stability, mission instruments can
help the satellite bus to deliver information on the pointing jitter. Consistent geometric
restoration using the tie points of LOS vectors of sensors is the key to innovation. As an
example, an image correction methodology using sensors arranged in parallel on the focal
plane, which is necessary to fabricate a compact optical system, is proposed. An observation
time lag arises between bands owing to this configuration. The relative deviation between
several line sensors during the observation time lag is calculated from the image correlation.
The deviation from the correct spacecraft attitude is estimated using the band-to-band
displacement. The attitude data are improved using the estimated deviation from the correct
spacecraft attitude. Then, the image is corrected using the revised satellite attitude
information. This method improves not only the registration accuracy but also the absolute
www.intechopen.com
Advances in Spacecraft Technologies
270
satellite attitude. As a result, the internal distortion in the scene is reduced. At present, this
technique is applicable to observation sensors with a similar parallel configuration on the
focal plane, such as EO-1/ALI, QuickBird and FORMOSAT-2, although their observation
bands exist in the visible wavelength. To increase the validity of the present work, the
following issues must be resolved: the accuracy of tie point analysis, the similarity measures
between multi-modal images and the robustness of correction methods. Implementation
into time delay integration (TDI) sensors is also important.
The present method has been applied to investigate the pointing stability of the Terra
spacecraft, which has five scientific instruments. Although these instruments have a large
rotating mirror and mechanical coolers, analysis over ten years with sub-arcsecond accuracy
has proved that the characteristic frequency of these instruments are not the source of the
dynamic disturbance. What, then, is the source of the dynamic disturbance? It is difficult to
discuss this for the case of the satellites in orbit. The Terra weekly report stated on January 6,
2000, “The first of several planned attitude sensor calibration slews was successfully
performed. Initial data indicates that the spacecraft jitter induced by the high-gain antenna
is significantly reduced by the feedforward capability.”
5. Acknowledgements
This work was inspired by the ASTER science team and was developed by Y. Teshima, M.
Koga, H. Kanno and T. Okuda, students at the University of Tokyo, under the support of
Grants-in-Aid for Scientific Research (B), 17360405 (2005) and 21360414 (2009) from the
Ministry of Education, Culture, Sports, Science and Technology. The ASTER project is
promoted by ERSDAC/METI and NASA. The application to small satellites is investigated
under the support of the Cabinet Office, Government of Japan for funding under the "FIRST"
(Funding Program for World-Leading Innovative R&D on Science and Technology) program.
6. References
Avouac, J. P.; Ayoub, F.; Leprince, S.; Konca, O. & Helmberger, D. V. (2006). The 2005 Mw 7.6 Kashmir Earthquake: Sub-pixel Correlation of ASTER Images and Seismic Waveforms Analysis, Earth Planet. Sci. Lett., Vol. 249 , pp.514-528.
Barker, J. L. & Seiferth, J. C. (1996). Landsat Thematic Mapper Band-to-Band Registration, in IEEE Int. Geoscience and Remote Sensing Symp., Lincoln, Nebraska, 27-31 May.
Bayard, D. S. (2004). State-Space Approach to Computing Spacecraft Pointing Jitter, J. Guidance, Control, Dynamics, Vol. 27, No. 3, pp.426-433.
Fujisada, H. (1998). ASTER Level-1 Data Processing Algorithm, IEEE Trans. Geosci. Remote Sens., Vol. 36, No. 4, pp. 1101-1112.
Fujisada, H.; Bailey, G. B.; Kelly, G. G.; Hara, S. & Abrams, M. J. (2005). ASTER DEM Performance, IEEE Trans. Geosci. Remote Sens., Vol. 43, pp.2707-2714.
Hoge, W. S. (2003). Subspace Identification Extension to the Phase Correlation Method, IEEE Trans. Med. Imag., Vol. 22, pp.277-280.
Iwasaki, A. & Fujisada, H. (2003). Image Correlation Tool for ASTER Geometric Validation, in Proc. SPIE, Agia Pelagia, Crete, Vol. 4881, pp.111-120.
Iwasaki, A. & Fujisada, H. (2005). ASTER Geometric Performance, IEEE Trans. Geosci. Remote Sens., Vol. 43, No. 12, pp.2700-2706.
www.intechopen.com

Detection and Estimation of Satellite Attitude Jitter Using Remote Sensing Imagery
271
Jacobsen, K. (2006). Calibration of Imaging Satellite Sensors. Int. Arch. Photogramm. Remote Sens., Band XXXVI 1/ W41, Ankara.
Janschek, K.; Tchernykh, V. & Dyblenko, S. (2005). Integrated Camera Motion Compensation by Real-Time Image Motion Tracking and Image Deconvolution, in Proc. IEEE/ASME International Conference on Advanced Intelligent Mechatronics, Monterey, California, USA, 24-28 July, pp. 1437-1444.
Koga, M. & Iwasaki, A. (2008). Three-Dimensional Displacement Measurement in Sub-pixel Accuracy for Seismic Phenomena from Optical Satellite Sensor Image, in 26th International Symposium on Space Technology and Science, Hamamatsu, Japan, 1-8 June 1-8, 2008-n-21. (Available online at http://archive.ists.or.jp/upload_pdf/2008-n-21.pdf)
Koga, M. & Iwasaki, A. (2011). Improving the Measurement Accuracy of Three-Dimensional Topography Changes Using Optical Satellite Stereo Image Data, submitted to IEEE Trans. Geosci. Remote Sens.
Kudva, P. & Throckmorton, A. (1996). Attitude Determination Studies for the Earth Observation System AM1 (EOS-AM-1) Mission, J. Guidance, Control, Dynamics, Vol. 19, No. 6, pp.1326-1331.
Lee, D. S.; Storey, J. C.; Choate, M. J. & Hayes, R. W. (2004). Four Years of Landsat 7 On-Orbit Geometric Calibration and Performance, IEEE Trans. Geosci. Remote Sens., Vol. 42, No. 12, pp. 2786-2795.
Leprince, S.; Barbot, S.; Ayoub, F. & Avouac, J. P. (2007). Automatic and Precise Orthorectification, Coregistration, and Subpixel Correlation of Satellite Images, Application to Ground Deformation Measurements, IEEE Trans. Geosci. Remote Sens., Vol. 45, pp.1529-1558.
Liu, C.-C. (2006). “Processing of FORMOSAT-2 Daily Revisit Imagery for Site Surveillance,” IEEE Trans. Geosci. Remote Sens., Vol. 44, No. 11, pp. 3206-3214.
Liu, J. G. & Morgan, G. L. K. (2006). FFT Selective and Adaptive Filtering for Removal of Systematic Noise in ETM+Imageodesy Images, IEEE Trans. Geosci. Remote Sens., Vol. 44, No. 12, pp. 3716-3724.
Morgan, G. L. K.; Liu, J. G. & Yan, H. (2010). Precise Subpixel Disparity Measurement from Very Narrow Baseline Stereo, IEEE Trans. Geosci. Remote Sens., Vol. 48, in press.
Nagashima, S.; Aoki, T.; Higuchi, T. & Kobayashi, K. (2006). A Subpixel Image Matching Technique Using Phase-only Correlation,” in Proc. Int. Symp. Intelligent Signal Processing and Communication Systems, pp. 701-704.
NASA Goddard Space Flight Center (1998). Landsat 7 Science Data Users Handbook, available on http://landsathandbook.gsfc.nasa.gov/handbook.html.
Neeck, S. P.; Venator, T. J. & Bolek, J. T. (1994) Jitter and Stability Calculation for the ASTER Instrument, in Proc. SPIE, Rome, Vol. 2317, pp.70-80.
Okuda, T. & Iwasaki, A. (2010). Estimation of satellite pitch attitude from ASTER image data, in IEEE Int. Geoscience and Remote Sensing Symp., Honolulu, Hawaii, 25-30 July, pp. 1070-1073.
Schowengerdt, R. A. (2007). Remote Sensing: Models and Methods for Image Processing, Academic Press, ISBN: 0123694078, United States.
Shin, D.; Pollard, J. K. & Muller, J.-P. (1997). Accurate Geometric Correction of ATSR Images, IEEE Trans. Geosci. Remote Sens., Vol. 35, No. 4, pp. 997-1006.
www.intechopen.com

Advances in Spacecraft Technologies
272
Storey, J. C.; Choate, M. J. & Meyer, D. J. (2004). A Geometric Performance Assessment of the EO-1 Advanced Land Imager, IEEE Trans. Geosci. Remote Sens., Vol. 42, No. 3, pp. 602-607.
Takaku, J. & Tadono, T. (2009). PRISM on-orbit Geometric Calibration and DSM Performance, IEEE Trans. Geosci. Remote Sens., Vol. 47, No. 12, pp. 4060-4073.
Teshima, Y. & Iwasaki, A. (2008). Correction of Attitude Fluctuation of Terra Spacecraft Using ASTER/SWIR Imagery With Parallax Observation, IEEE Trans. Geosci. Remote Sens., Vol. 46, pp.222-227.
Wertz, J. R. & Larson, W. J. (1999). Space Mission Analysis and Design 3rd edition, Kluwer Academic Pub, ISBN: 9780792359012, United States.
www.intechopen.com

Advances in Spacecraft TechnologiesEdited by Dr Jason Hall
ISBN 978-953-307-551-8Hard cover, 596 pagesPublisher InTechPublished online 14, February, 2011Published in print edition February, 2011
InTech EuropeUniversity Campus STeP Ri Slavka Krautzeka 83/A 51000 Rijeka, Croatia Phone: +385 (51) 770 447 Fax: +385 (51) 686 166www.intechopen.com
InTech ChinaUnit 405, Office Block, Hotel Equatorial Shanghai No.65, Yan An Road (West), Shanghai, 200040, China
Phone: +86-21-62489820 Fax: +86-21-62489821
The development and launch of the first artificial satellite Sputnik more than five decades ago propelled boththe scientific and engineering communities to new heights as they worked together to develop novel solutionsto the challenges of spacecraft system design. This symbiotic relationship has brought significant technologicaladvances that have enabled the design of systems that can withstand the rigors of space while providingvaluable space-based services. With its 26 chapters divided into three sections, this book brings togethercritical contributions from renowned international researchers to provide an outstanding survey of recentadvances in spacecraft technologies. The first section includes nine chapters that focus on innovativehardware technologies while the next section is comprised of seven chapters that center on cutting-edge stateestimation techniques. The final section contains eleven chapters that present a series of novel controlmethods for spacecraft orbit and attitude control.
How to referenceIn order to correctly reference this scholarly work, feel free to copy and paste the following:
Akira Iwasaki (2011). Detection and Estimation Satellite Attitude Jitter Using Remote Sensing Imagery,Advances in Spacecraft Technologies, Dr Jason Hall (Ed.), ISBN: 978-953-307-551-8, InTech, Available from:http://www.intechopen.com/books/advances-in-spacecraft-technologies/detection-and-estimation-satellite-attitude-jitter-using-remote-sensing-imagery

© 2011 The Author(s). Licensee IntechOpen. This chapter is distributedunder the terms of the Creative Commons Attribution-NonCommercial-ShareAlike-3.0 License, which permits use, distribution and reproduction fornon-commercial purposes, provided the original is properly cited andderivative works building on this content are distributed under the samelicense.