detailing a quantitative method for assessing algorithms
TRANSCRIPT
Journal of Universal Computer Science, vol. 14, no. 2 (2008), 266-283 submitted: 15/6/06, accepted: 17/11/07, appeared: 28/1/08 © J.UCS
Detailing a Quantitative Method for Assessing Algorithms to Remove Back-to-Front Interference in Documents
Rafael Dueire Lins (Universidade Federal de Pernambuco, Recife, Brazil
João Marcelo Monte da Silva (Universidade Federal de Pernambuco, Recife, Brazil
Fernando Mário Junqueira Martins (Universidade do Minho, Braga, Portugal
Abstract: Documents written on both sides on translucent paper make visible the ink from one side on the other. This artefact is called “back-to-front interference”, “bleeding” or “show-through”. The direct binarization of documents with such interference yields unreadable documents. The literature presents several algorithms for suitably removing such artefact. This paper presents a quantitative method to assess algorithms to remove back-to-front interference.
Keywords: Document engineering, Back-to-front interference, Show through, Bleeding Categories: H.3.3
1 Introduction
Whenever a document is typed or written on both sides and the opacity of the paper is such as to allow the back printing to be visualized on the front side, yielding different hues of paper and printing whenever compared to documents written on a single side a sheet of the same paper with the same ink. This phenomenon, first addressed in the literature by [Lins, 95], was called “back-to-front interference”. If the document is scanned either in true-color (Figure 1) or gray-scale (Figure 2) the human eye is able to filter out that sort of noise keeping document readability. The direct binarization of such document overlaps the written or printed part of both sides producing an unreadable document for the human reader and drastically degrading the performance of automatic tools such as OCRs. Thus, it is important to find better segmentation techniques to suitably solve that problem.
Binarized images (black and white images) claim less storage space, allow for faster network transmission, and are suitable to be processed by most commercial OCR tools. Image processing environments (such as Jasc Paint Shop Pro™ [Adobe, 07]) offer a great variety of binarization filters. However, the use of such softwares requires a specialized operator and that is not feasible to handle large quantities of documents. Besides that, the palette reduction algorithms provided by standard

Dueire Lins R., da Silva J.M.M., Martins F.M.J.: Detailing a Quantitative Method ... 267
commercial tools whenever applied to documents with back-to-front interference yield unreadable images, even for humans.
Figure 1 provides an example of a document with back-to-front interference and Figure 2 is the gray-scale version of the same document. The binarized version of this document generated by the direct application of the binarization algorithm by using Jasc Paint Shop Pro™ version 8 (Palette component: Grey values, Reduction component: nearest color, Palette weight: non-weighted) is completely unreadable, as one may observe in Figure 3.
Figure 1: Historical Document with back-to-
front interference.
Figure 2: Gray-scale version of Figure 1.
Figure 3: Binarized document of Figure 1.
In a document such as the one presented in Figure 1, one expects to find three color clusters corresponding to the ink in the foreground, the paper background and the trespassed ink (the back-to-front interference). Unfortunately, despite the efforts of several researchers in over a decade of work, no image representation provided such clustering to allow the easy filtering out of the back-to-front interference.
Several papers in the literature addressed the back-to-front interference problem. Some authors use waterflow models [Oha, 05], other researchers have used wavelet filtering [Tan, 02], but the technique of most widespread used is thresholding [Kavallieratou, 05], [Leedham, 02] and [Wong, 01]. The most successful techniques for filtering out back-to-front interference are based on the entropy [Abramson, 63] of the grey-scale document [Mello, 00] and [Mello, 02]. Although recent advances were made in finding efficient algorithms that yield good quality images [Silva, 06], a final solution to the filtering of back-to-front interference is still sought off.
Visual inspection of the filtered images provides a weak quantitative assessment of the performance of the algorithms under comparison. Analyzing the quality of images produced by filtering algorithms is far from being a trivial task. Subjectivity must be avoided by every means. Thus, a quantitative method to measure the quality of algorithms for binarizing documents with back-to-front interference is introduced

Dueire Lins R., da Silva J.M.M., Martins F.M.J.: Detailing a Quantitative Method ... 268
here. The method presented herein generalizes and provides better comparison grounds than the one presented in [Lins-b, 06], detailing further the results presented in reference [Lins, 07].
This article is organized as follow. Section 1 presents this introduction. Section 2 presents eight threshold-based algorithms used to demonstrate the method described in section 3. The results obtained are discussed and analysed in section 4. Finally, section 5 presents the conclusions of the method introduced herein and draws lines for further work.
2 Threshold Techniques
The survey paper by Sankur and Sezgin [Sankur, 04] presents a comprehensive overview and comparison of thresholding algorithms, clustering them according to their nature. That survey does not address the back-to-front interference, however. From the almost forty algorithms presented six schemes have shown suitable to work in such documents: Pun [Pun, 81], Kapur-Sahoo-Wong [Kapur, 85], Johannsen-Bille [Johannsen, 82], Yen-Chang-Chang [Yen, 95], Wu-Songde-Hanquing [Wu, 98], and Otsu [Otsu, 79]. The first five algorithms are based on the entropy of the image, whereas the last one makes discriminator analysis. Those six algorithms were not designed to filter back-to-front interference. Besides those algorithms, two algorithms based on entropy that were created in the scope of the Nabuco Project [FUNDAJ, 07] to filter that interference are presented: the Mello and Lins’s algorithm [Mello, 00][Mello, 02] and the Silva, Lins and Rocha’s algorithm [Silva, 06].
The use of gray-scale images with 256 levels as an intermediate step towards image binarization has shown to be a valuable simplification. Thus, the first processing step is generating grey-scale documents from the true-color ones by using the standard equation to calculate the gray level value of the new pixel:
0.299 0.587 0.114grey r g b= + +
where r, g, and b are the red, green and blue values of the original pixel. In general, entropy-based algorithms take the image histogram and normalize
each of its entries by the total number of pixels in the image, yielding a distribution of probabilities provided by relative frequencies. Thus,
, 0 255ii
np i
N=
t
iit pP
0
where ni is the number of pixels with grey level i (0 to 255), N is the total number of pixels in the image, {p0, p1, …, p255} is the probability distribution of the pixel gray-levels taking into account their relative frequencies, and Pt is the adding of all probabilities up to entry t.
All of the algorithms presented here were implemented in standard C using the dev-C++ v4.9.8.0 program.
(1)
(2)
(3)
Dueire Lins R., da Silva J.M.M., Martins F.M.J.: Detailing a Quantitative Method ... 269
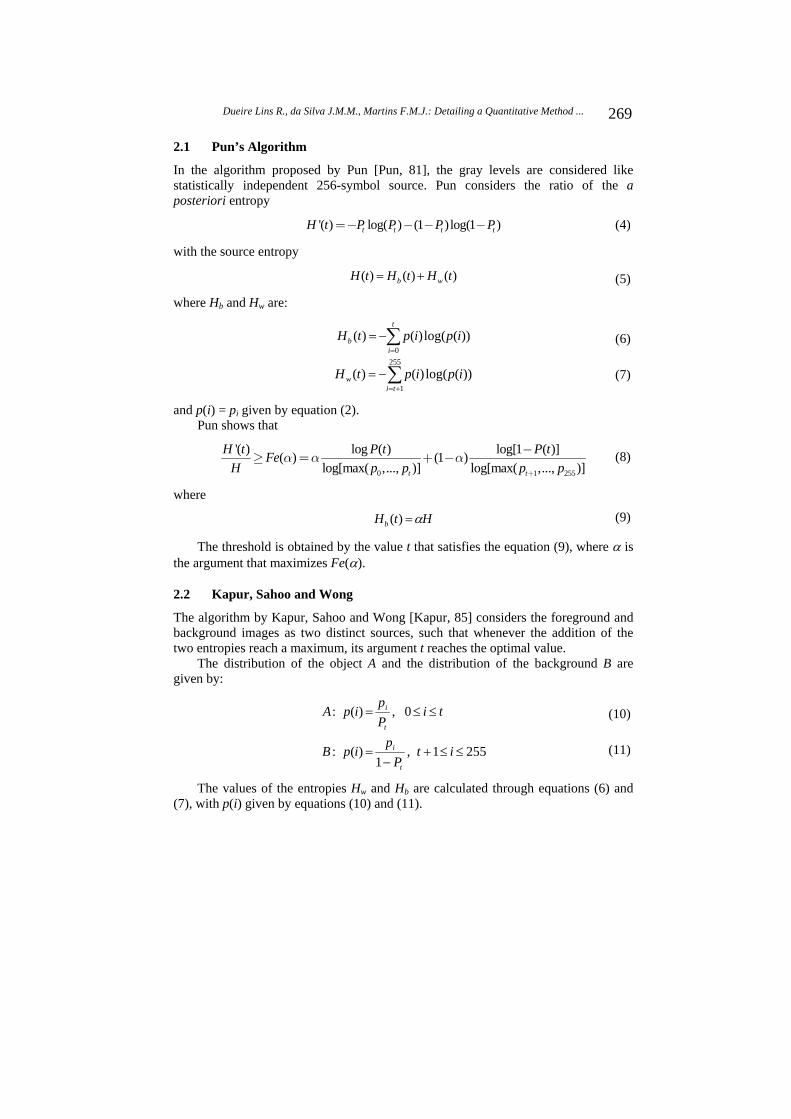
2.1 Pun’s Algorithm
In the algorithm proposed by Pun [Pun, 81], the gray levels are considered like statistically independent 256-symbol source. Pun considers the ratio of the aposteriori entropy
'( ) log( ) (1 )log(1 )t t t tH t P P P P=
with the source entropy
)()()( tHtHtH wb
where Hb and Hw are:
))(log()()(0
ipiptHt
ib
))(log()()(255
1ipiptH
tiw
and p(i) = pi given by equation (2). Pun shows that
0 1 255
'( ) log ( ) log[1 ( )]( ) (1 )log[max( ,..., )] log[max( ,..., )]t t
H t P t P tFeH p p p p+
= +
where
HtHb )(
The threshold is obtained by the value t that satisfies the equation (9), where is the argument that maximizes Fe( ).
2.2 Kapur, Sahoo and Wong
The algorithm by Kapur, Sahoo and Wong [Kapur, 85] considers the foreground and background images as two distinct sources, such that whenever the addition of the two entropies reach a maximum, its argument t reaches the optimal value.
The distribution of the object A and the distribution of the background B are given by:
2551,1
)(:
0,)(:
itP
pipB
tiPp
ipA
t
i
t
i
The values of the entropies Hw and Hb are calculated through equations (6) and (7), with p(i) given by equations (10) and (11).
(4)
(5)
(6)
(7)
(8)
(9)
(10)
(11)
Dueire Lins R., da Silva J.M.M., Martins F.M.J.: Detailing a Quantitative Method ... 270
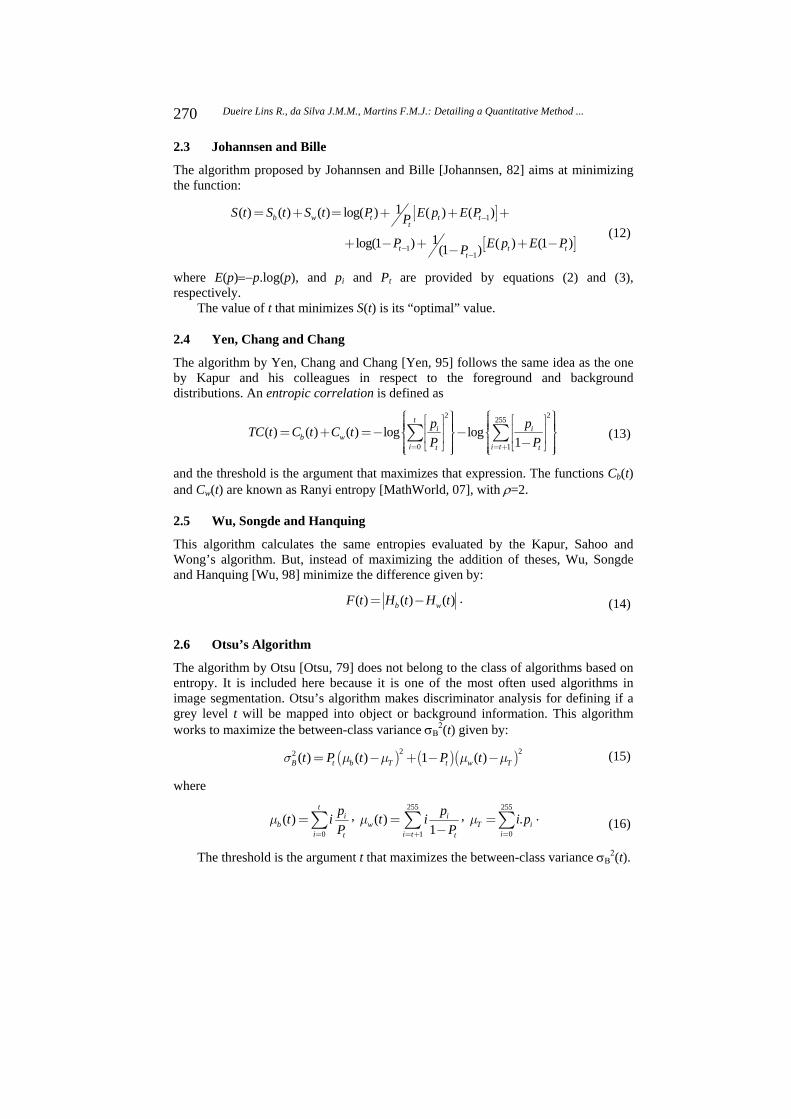
2.3 Johannsen and Bille
The algorithm proposed by Johannsen and Bille [Johannsen, 82] aims at minimizing the function:
[ ]
[ ]
1
11
1( ) ( ) ( ) log( ) ( ) ( )
1log(1 ) ( ) (1 )(1 )
b w t t tt
t t tt
S t S t S t P E p E PP
P E p E PP
= + = + + +
+ + +
where E(p) p.log(p), and pi and Pt are provided by equations (2) and (3), respectively.
The value of t that minimizes S(t) is its “optimal” value.
2.4 Yen, Chang and Chang
The algorithm by Yen, Chang and Chang [Yen, 95] follows the same idea as the one by Kapur and his colleagues in respect to the foreground and background distributions. An entropic correlation is defined as
2 2255
0 1
( ) ( ) ( ) log log1
ti i
b wi i tt t
p pTC t C t C t
P P= = +
= + =
and the threshold is the argument that maximizes that expression. The functions Cb(t) and Cw(t) are known as Ranyi entropy [MathWorld, 07], with =2.
2.5 Wu, Songde and Hanquing
This algorithm calculates the same entropies evaluated by the Kapur, Sahoo and Wong’s algorithm. But, instead of maximizing the addition of theses, Wu, Songde and Hanquing [Wu, 98] minimize the difference given by:
( ) ( ) ( )b wF t H t H t= .
2.6 Otsu’s Algorithm
The algorithm by Otsu [Otsu, 79] does not belong to the class of algorithms based on entropy. It is included here because it is one of the most often used algorithms in image segmentation. Otsu’s algorithm makes discriminator analysis for defining if a grey level t will be mapped into object or background information. This algorithm works to maximize the between-class variance (t) given by:
( ) ( )( )2 22 ( ) ( ) 1 ( )B t b T t w Tt P t P t= +
where
0
( )t
ib
i t
pt i
P=
= , 255
1
( )1
iw
i t t
pt i
P= +
= , 255
0
.T ii
i p=
= .
The threshold is the argument t that maximizes the between-class variance (t).
(12)
(13)
(14)
(15)
(16)
Dueire Lins R., da Silva J.M.M., Martins F.M.J.: Detailing a Quantitative Method ... 271
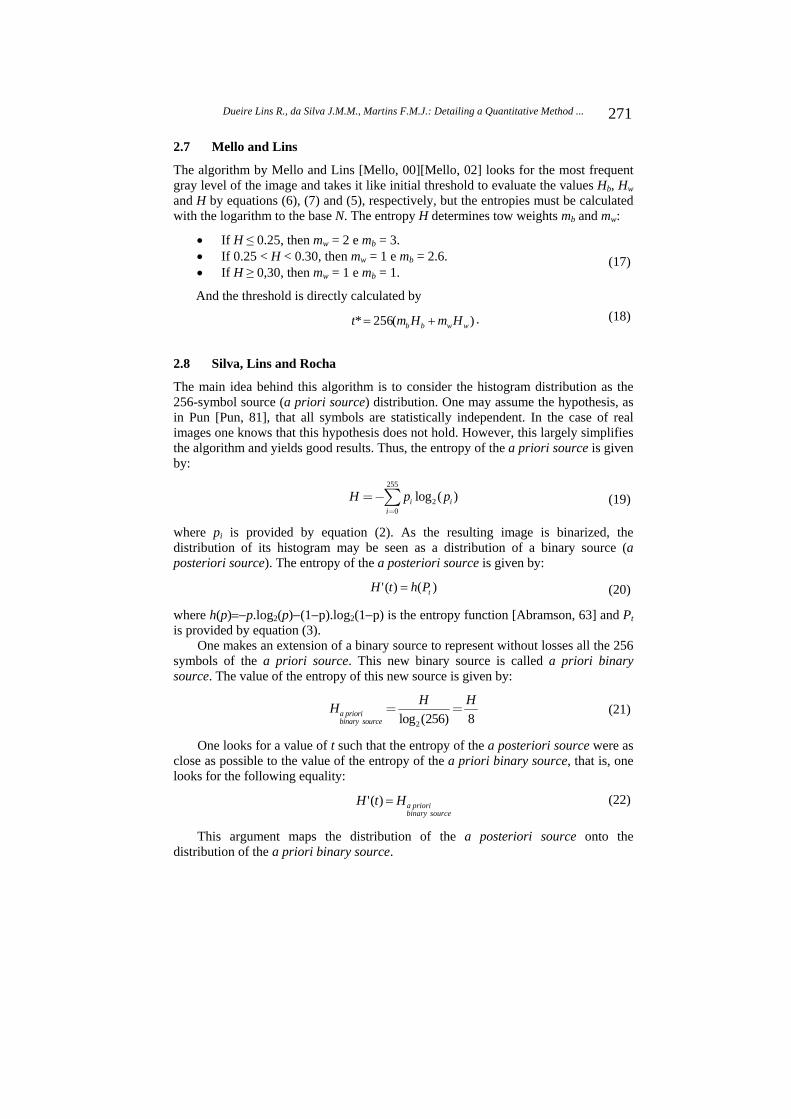
2.7 Mello and Lins
The algorithm by Mello and Lins [Mello, 00][Mello, 02] looks for the most frequent gray level of the image and takes it like initial threshold to evaluate the values Hb, Hw and H by equations (6), (7) and (5), respectively, but the entropies must be calculated with the logarithm to the base N. The entropy H determines tow weights mb and mw:
If H 0.25, then mw = 2 e mb = 3. If 0.25 < H < 0.30, then mw = 1 e mb = 2.6. If H 0,30, then mw = 1 e mb = 1.
And the threshold is directly calculated by
)(256* wwbb HmHmt .
2.8 Silva, Lins and Rocha
The main idea behind this algorithm is to consider the histogram distribution as the 256-symbol source (a priori source) distribution. One may assume the hypothesis, as in Pun [Pun, 81], that all symbols are statistically independent. In the case of real images one knows that this hypothesis does not hold. However, this largely simplifies the algorithm and yields good results. Thus, the entropy of the a priori source is given by:
255
20
log ( )i ii
H p p=
=
where pi is provided by equation (2). As the resulting image is binarized, the distribution of its histogram may be seen as a distribution of a binary source (aposteriori source). The entropy of the a posteriori source is given by:
)()(' tPhtH
where h(p) p.log2(p) (1 p).log2(1 p) is the entropy function [Abramson, 63] and Pt is provided by equation (3).
One makes an extension of a binary source to represent without losses all the 256 symbols of the a priori source. This new binary source is called a priori binary source. The value of the entropy of this new source is given by:
2log (256) 8a prioribinary source
H HH = =
One looks for a value of t such that the entropy of the a posteriori source were as close as possible to the value of the entropy of the a priori binary source, that is, one looks for the following equality:
sourcebinaryprioriaHtH )('
This argument maps the distribution of the a posteriori source onto the distribution of the a priori binary source.
(18)
(17)
(19)
(20)
(21)
(22)
Dueire Lins R., da Silva J.M.M., Martins F.M.J.: Detailing a Quantitative Method ... 272
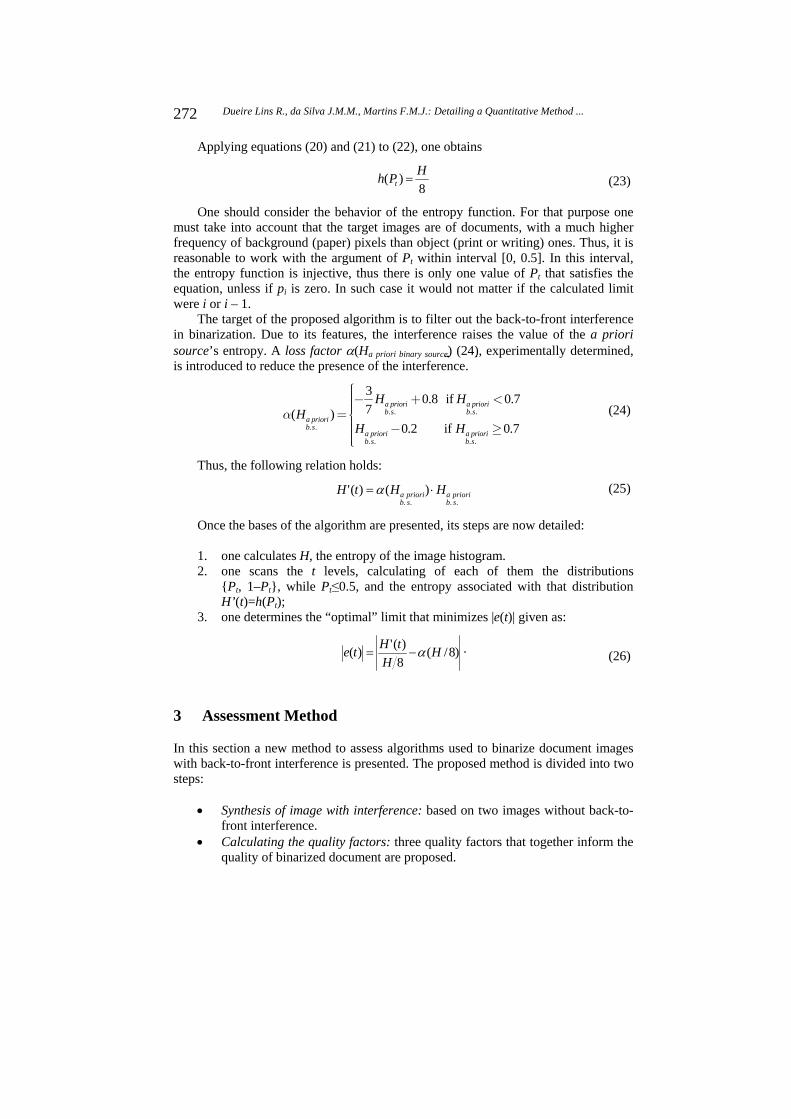
Applying equations (20) and (21) to (22), one obtains
8)( HPh t
One should consider the behavior of the entropy function. For that purpose one must take into account that the target images are of documents, with a much higher frequency of background (paper) pixels than object (print or writing) ones. Thus, it is reasonable to work with the argument of Pt within interval [0, 0.5]. In this interval, the entropy function is injective, thus there is only one value of Pt that satisfies the equation, unless if pi is zero. In such case it would not matter if the calculated limit were i or i – 1.
The target of the proposed algorithm is to filter out the back-to-front interference in binarization. Due to its features, the interference raises the value of the a priori source’s entropy. A loss factor (Ha priori binary source) (24), experimentally determined, is introduced to reduce the presence of the interference.
. . . .
. .
. . . .
3 0.8 if 0.77( )
0.2 if 0.7
a priori a priorib s b s
a priorib s
a priori a priorib s b s
H HH
H H
+ <=
Thus, the following relation holds:
....)()('
sbprioria
sbprioria HHtH
Once the bases of the algorithm are presented, its steps are now detailed: 1. one calculates H, the entropy of the image histogram. 2. one scans the t levels, calculating of each of them the distributions
{Pt, 1–Pt}, while Pt 0.5, and the entropy associated with that distribution H’(t)=h(Pt);
3. one determines the “optimal” limit that minimizes |e(t)| given as:
)8/(8)(')( H
HtHte .
3 Assessment Method
In this section a new method to assess algorithms used to binarize document images with back-to-front interference is presented. The proposed method is divided into two steps:
Synthesis of image with interference: based on two images without back-to-front interference. Calculating the quality factors: three quality factors that together inform the quality of binarized document are proposed.
(23)
(24)
(25)
(26)

Dueire Lins R., da Silva J.M.M., Martins F.M.J.: Detailing a Quantitative Method ... 273
3.1 Synthesis of Images with Interference
This section presents how test images with back-to-front interference are generated. The basic idea is to introduce such interference in a well controlled way, thus one is able to really know which pixels ought to be removed and which should not be removed in the filtered image. The mismatching pixels from the reference and filtered images will be used to calculate three quality factors of the algorithm, allowing a fair comparison between the results obtained. As in [Lins-b, 06], the image generation process is detailed.
Front (S) Back (I)
Figure 4: Documents without back-to-front interference from Nabuco’s bequest.
1) The first step is take two 256-grayscale images without back-to-font interference, such as the ones presented in Figure 4.
S – the image that plays the role of the front of the document (signal image); and I – the image that plays the role of back (back-to-front interfering image).
2) The second step is to synthesize a third image, called Gfade, by overlapping the S image with a faded version of the I image, as follows:
One fades the I image, producing the Ifade image given by
( , ) ,, if 255
( , ) ,255, if 255fade
l i m n fadel l
i m nl
where the i(m,n) and ifade(m,n) are the intensity values in the pixel (m,n) from the I and Ifade images, respectively, and fade is the brightness offset applied. Notice that the maximum value of the sum is 255.
Finally, the overlapping process merges the S and Ifade images, selecting the darker pixel between s(m,n) and ifade(m,n), then,
(27)

Dueire Lins R., da Silva J.M.M., Martins F.M.J.: Detailing a Quantitative Method ... 274
,),(),(if,),(),(),(if,),(
),(nminmsnminminmsnms
nmgfadefade
fadefade
where s(m,n), ifade(m,n) and gfade(m,n) are the intensity values in the pixel (m,n) from the S, Ifade and Gfade images, respectively.
To assess the filtering capability of algorithms fade assumes values from 0 to
255. The effect of fade variation on the final synthesized document generated from the documents presented in Figure 4 with I mirror-reflected is presented in Figure 5.
fade = 0 fade = 30 fade = 50 fade = 70
fade = 100 fade = 130 fade = 150 fade = 170
Figure 5: Pieces of synthesized images for different fade values.
3.2 Calculating The Quality Factors
First one takes as reference the S(manual) image, which is obtained from S by manually searching a threshold that yields a good quality binary image (vide Figure 6). After, one binarizes the Gfade images by the application of the algorithm k, generating the
(k)fadeG images. Than, one calculates the three quality factors for each (k)
fadeG image, in other words, each algorithm will have three quality factor values for each fade value. Before the definitions of the quality factors one needs to define “text area” and “non text area”:
The Text Area is the area formed by text in the reference image, in other words, it is the black pixels in the (manual)S image. The number of pixels in this area is defined as "text area"N . The Non Text Area is the area formed by the part of the reference image that has no text, in other words, it is the white pixels in the (manual)S image.
Now one defines the three quality factors: a) Quality Factor 1: Text Error
The Text Error of the (k)fadeG image is defined as
(28)

Dueire Lins R., da Silva J.M.M., Martins F.M.J.: Detailing a Quantitative Method ... 275
w,"text area"(Text Error),
"text area"fade k
nq
N,
where w,"text area"n is the number of white pixels in the (k)fadeG image that are
presented in the “text area”, defined by reference image.
b) Quality Factor 2: Paper ErrorThe Paper Error of the (k)
fadeG image is defined as
Figure 6: Reference Image S Threshold value chosen by the operator.
Figure 7: Synthesized Image with fade=80.
b,"non text area",paper (Paper Error),
"text area"fade k
nq
N,
where b,"non text area",papern is the number of black pixels in the (k)fadeG image that
are presented in the “non text area”, defined by the reference image, supplied by the paper.
c) Quality Factor 3: Interference Error
The Interference Error of the (k)fadeG image is defined as
b,"non text area",interf. (Interf. Error),
"text area"fade k
nq
N,
where b,"non text area",interf.n is the number of black pixels in the (k)fadeG image that
are presented in the “non text area”, defined by the reference image, supplied by the back-to-front interference.
(29)
(30)
(31)
Dueire Lins R., da Silva J.M.M., Martins F.M.J.: Detailing a Quantitative Method ... 276
The second and third quality factors defined abouve adopted the same normalization factor as the first, because it is of interest to know the amount of “dirt”, brought by the paper and interference, in relation to the size of the “text area”. The three quality factors examined together provide information of the filtered image:
Text Error shows how much text has been erased; Paper Error measures the quantity of “dirt” there is in the image due the paper pixels; and Interference Error states how much of the original interference is presented in the resulting image.
For a synthesized image using the pair of images in Figure 4, a binary image of acceptable quality, provides quality factors values less than 40%, 50% and 10% for the Text Error, Paper Error and Interference Error, respectively. The first limit depends on the width and gradient of the foreground document, the second depends on the distribution of the paper pixels and the third depends on the interference location in the document image.
4 Results and Analysis
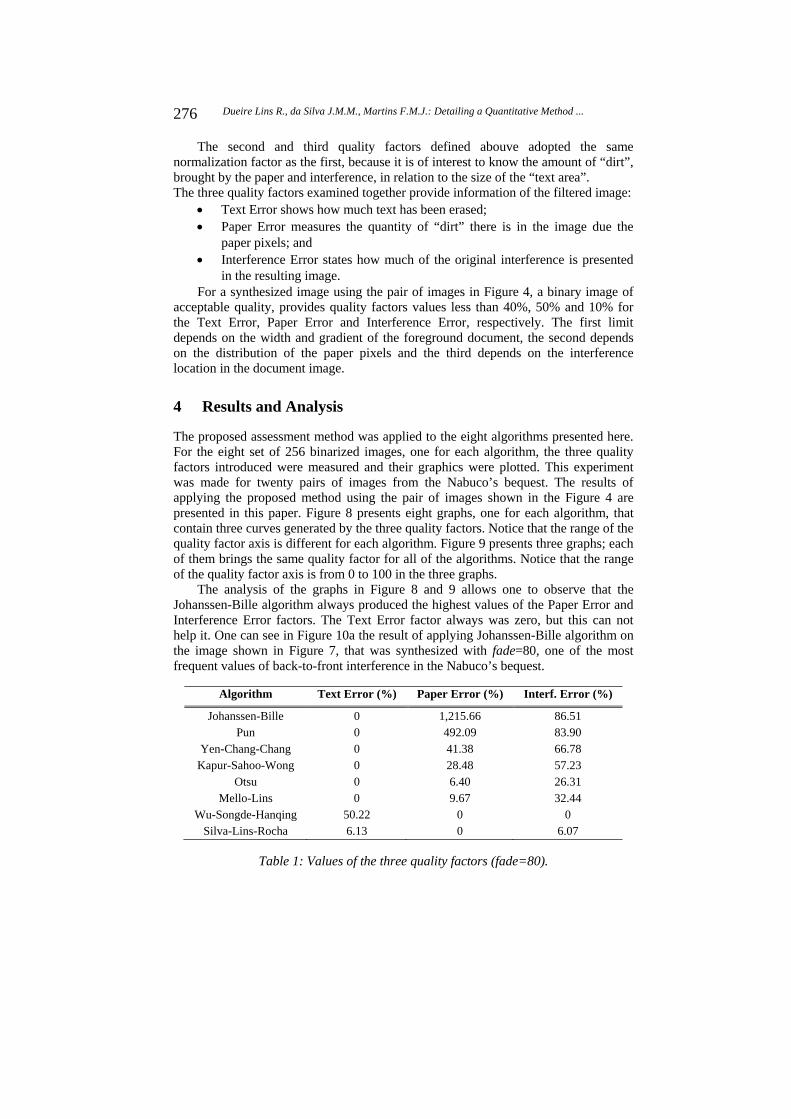
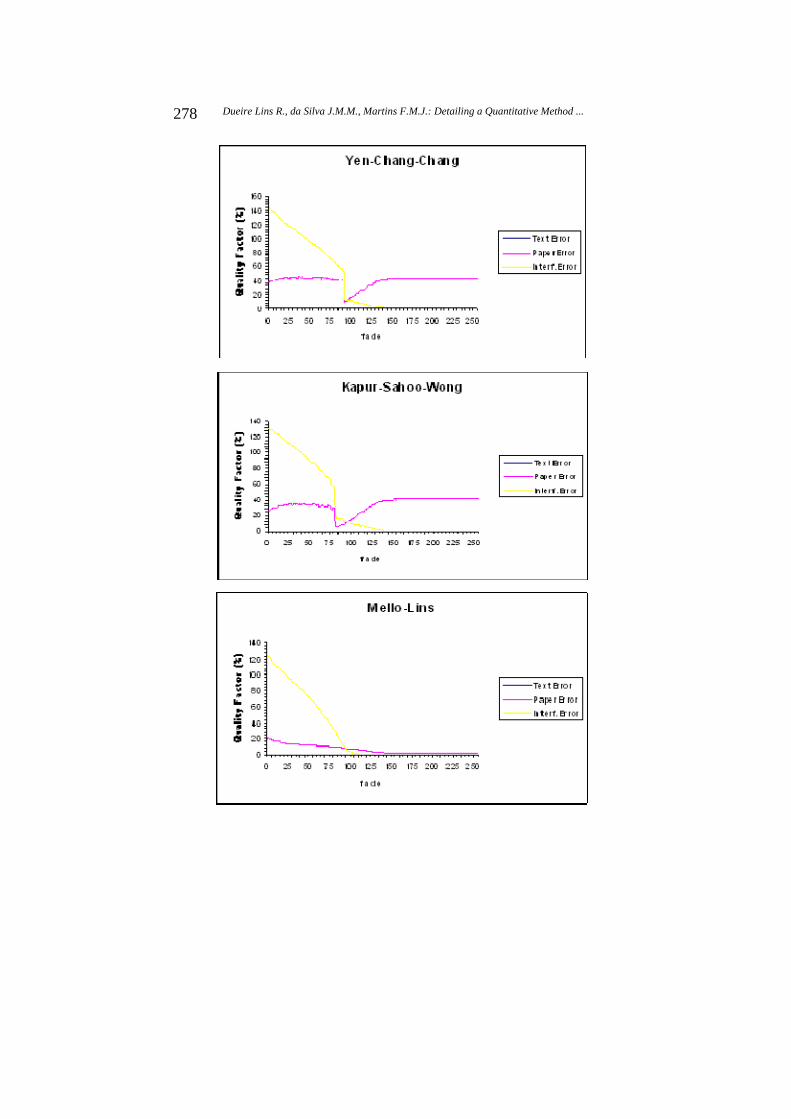
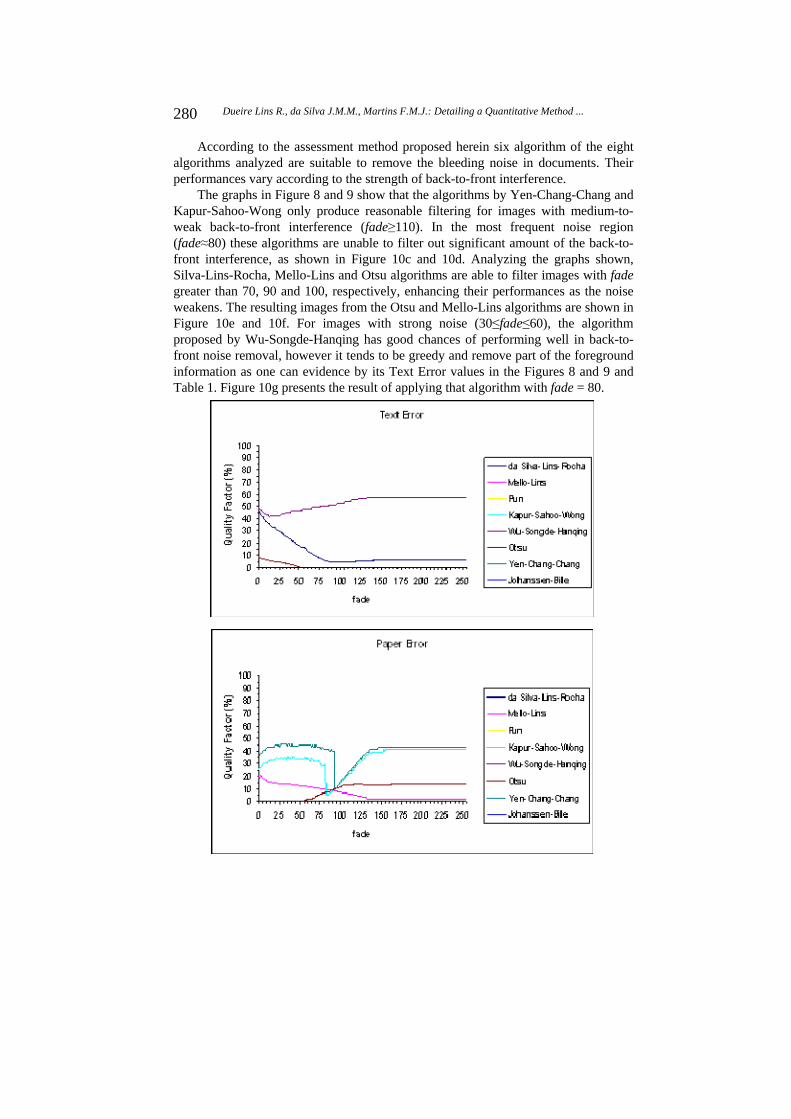
The proposed assessment method was applied to the eight algorithms presented here. For the eight set of 256 binarized images, one for each algorithm, the three quality factors introduced were measured and their graphics were plotted. This experiment was made for twenty pairs of images from the Nabuco’s bequest. The results of applying the proposed method using the pair of images shown in the Figure 4 are presented in this paper. Figure 8 presents eight graphs, one for each algorithm, that contain three curves generated by the three quality factors. Notice that the range of the quality factor axis is different for each algorithm. Figure 9 presents three graphs; each of them brings the same quality factor for all of the algorithms. Notice that the range of the quality factor axis is from 0 to 100 in the three graphs.
The analysis of the graphs in Figure 8 and 9 allows one to observe that the Johanssen-Bille algorithm always produced the highest values of the Paper Error and Interference Error factors. The Text Error factor always was zero, but this can not help it. One can see in Figure 10a the result of applying Johanssen-Bille algorithm on the image shown in Figure 7, that was synthesized with fade=80, one of the most frequent values of back-to-front interference in the Nabuco’s bequest.
Algorithm Text Error (%) Paper Error (%) Interf. Error (%)
Johanssen-Bille 0 1,215.66 86.51 Pun 0 492.09 83.90
Yen-Chang-Chang 0 41.38 66.78 Kapur-Sahoo-Wong 0 28.48 57.23
Otsu 0 6.40 26.31 Mello-Lins 0 9.67 32.44
Wu-Songde-Hanqing 50.22 0 0 Silva-Lins-Rocha 6.13 0 6.07
Table 1: Values of the three quality factors (fade=80).

Dueire Lins R., da Silva J.M.M., Martins F.M.J.: Detailing a Quantitative Method ... 277
Table 1 shows the values of the quality factors for all binarized image (80
(k)fadeG ),
that is the result of applying algorithm k to the 80fadeG image presented in Figure 7.
The performance of Pun´s algorithm, although far superior than Johanssen and Bille´s, as may be observed from the plots in Figures 8 and 9, yields unsatisfactory images (see Figure 10b).
Dueire Lins R., da Silva J.M.M., Martins F.M.J.: Detailing a Quantitative Method ... 278
Dueire Lins R., da Silva J.M.M., Martins F.M.J.: Detailing a Quantitative Method ... 279
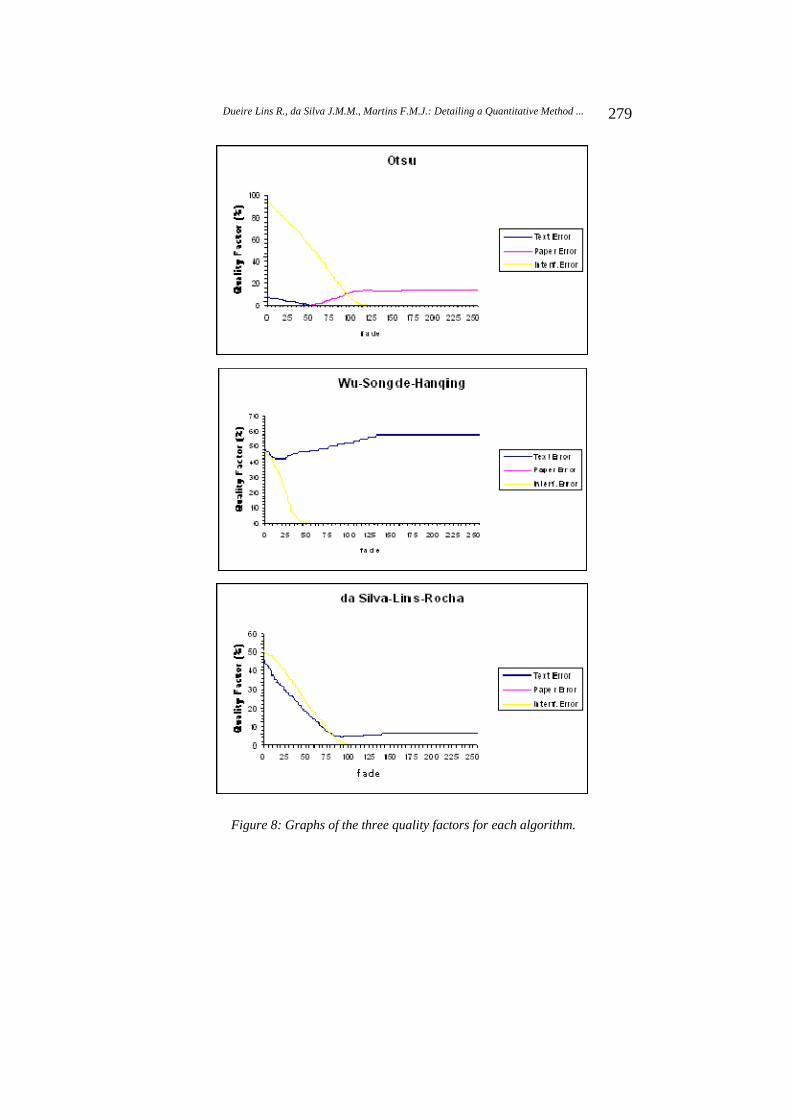
Figure 8: Graphs of the three quality factors for each algorithm.
Dueire Lins R., da Silva J.M.M., Martins F.M.J.: Detailing a Quantitative Method ... 280
According to the assessment method proposed herein six algorithm of the eight algorithms analyzed are suitable to remove the bleeding noise in documents. Their performances vary according to the strength of back-to-front interference.
The graphs in Figure 8 and 9 show that the algorithms by Yen-Chang-Chang and Kapur-Sahoo-Wong only produce reasonable filtering for images with medium-to-weak back-to-front interference (fade 110). In the most frequent noise region (fade 80) these algorithms are unable to filter out significant amount of the back-to-front interference, as shown in Figure 10c and 10d. Analyzing the graphs shown, Silva-Lins-Rocha, Mello-Lins and Otsu algorithms are able to filter images with fade greater than 70, 90 and 100, respectively, enhancing their performances as the noise weakens. The resulting images from the Otsu and Mello-Lins algorithms are shown in Figure 10e and 10f. For images with strong noise (30 fade 60), the algorithm proposed by Wu-Songde-Hanqing has good chances of performing well in back-to-front noise removal, however it tends to be greedy and remove part of the foreground information as one can evidence by its Text Error values in the Figures 8 and 9 and Table 1. Figure 10g presents the result of applying that algorithm with fade = 80.

Dueire Lins R., da Silva J.M.M., Martins F.M.J.: Detailing a Quantitative Method ... 281
Figure 9: Graphs of the three quality factors for all algorithms.
(a) Johansen-Bille (b) Pun (c) Yen-Chang-Chang (d) Kapur-Sahoo-Wong
(e) Otsu (f) Mello-Lins (g) Wu-Songde-Hanqing (h) Silva-Lins-Rocha
Figure 10: Filtered images by the algorithms presented in section 2 (fade=80).

Dueire Lins R., da Silva J.M.M., Martins F.M.J.: Detailing a Quantitative Method ... 282
The steadiest good performance in filtering out the bleeding noise is provided by
Silva-Lins-Rocha algorithm, whose may be seen in Figure 10h. As one can see in Figures 8 and 9, the Interference Error curve of the Silva-Lins-Rocha stands below the curve of Wu-Songde-Hanquing; however, the Text Error curve of the Silva-Lins-Rocha decreases while the curve of Wu-Songde-Hanquing increases.
Although the six suitable algorithms have worked well in the cases of images with very low back-to-front noise (fade>120), it is important to say that in the most of the experiments, Otsu’s algorithm worked better then the others.
5 Conclusions and Lines for Further Work
A quantitative method to assess the quality of binarization algorithms for images with back-to-front interference was introduced. The results obtained with this assessment method are consistent with the obtained by visual inspection of filtered documents.
The quality factors introduced herein are able to inform whether the application of an algorithm yields a readable or unreadable binary document. An important point of the proposed method is that it is able to spot which algorithm is more likely to perform better at filtering out the bleeding noise by analyzing the features of the document. This attribute may allow the automatic choice of the best suitable algorithm to filter a specific document, thus permitting to be incorporated into an automatic document processing environment such as BigBatch [Lins-a, 06].
The assessment method proposed here did not take into account the color of the background as a controlled parameter. Work on progress are widening the scope of this work to model aged background, giving complete control of all document parameters.
Acknowledgements
Research reported herein was partly sponsored by CNPq – Conselho Nacional de Pesquisas e Desenvolvimento Tecnológico, Brazilian Government. The authors are grateful to the Joaquim Nabuco Foundation for granting the permission to use the images from Nabuco´s bequest.
References
[Abramson, 63] N. Abramson, “Information Theory and Coding”, McGraw-Hill Book Co, 1963.
[Adobe, 07] Adobe Systems Inc. http://www.adobe.com.
[FUNDAJ, 07] FUNDAJ – Fundação Joaquim Nabuco: http://www.fundaj.gov.br
[Johannsen, 82] G. Johannsen and J. Bille, “A threshold selection method using information measures”, ICPR’82, pp. 140–143 (1982).
[Kapur, 85] J. N. Kapur, P. K. Sahoo and A. K. C. Wong, “A New Method for Gray-Level Picture Thresholding using the Entropy of the Histogram”, C.Vision, Graph. and Im.Proc., 29(3), 1985.
Dueire Lins R., da Silva J.M.M., Martins F.M.J.: Detailing a Quantitative Method ... 283
[Kavallieratou, 05] E. Kavallieratou and H. Antonopoulou, “Cleaning and Enhancing Historical Document Images”, Intelligent Vision Systems, Springer-Verlag 3708, pp. 681-688, 2005.
[Leedham, 02] G. Leedham, et al., “Separating text and background in degraded document images—a comparison of global thresholding techniques for multi-stage thresholding”, Proceedings of the Eighth International Workshop on Frontiers in Handwritten Recognition, pp. 244–249, 2002.
[Lins, 95] R. D. Lins, et al, “An Environment for Processing Images of Historical Documents”, Microproc. & Microprogramming, pp. 111-121, North-Holland, 1995.
[Lins-a, 06] R.D.Lins, B.T.Ávila, and A.A.Formiga, “BigBatch: An Environment for Processing Monochromatic Documents”, ICIAR2006, LNCS 4142, pp.886-896, Springer Verlag 2006.
[Lins-b, 06] R. D. Lins and J. M. M. da Silva, “Assessing Algorithms to Remove Back-to-Front Interference in Documents”, ITS-2006, Fortaleza, Brazil, IEEE Press 2006.
[Lins, 07] R. D. Lins and J. M. M. da Silva, “A Quantitative Method for Assessing Algorithms to Remove Back-to-Front Interference in Documents”, ACM-SAC 2007, Seoul (Korea), pp.610-616, ACM Press, 2007.
[MathWorld, 07] MathWorld: http://www.mathworld.com.
[Mello, 00] C. A. B. Mello and R. D. Lins, “Image segmentation of historical documents”, Visual 2000, Mexico City, Mexico, 2000.
[Mello, 02] C. A. B. Mello and R. D. Lins, “Generation of images of historical documents by composition”. ACM Document Engineering 2002, McLean, VA, USA.
[Oha, 05] Hyun-Hwa Oha, Kil-Taek Limb, Sung-Il Chienc, “An improved binarization algorithm based on a water flowmodel for document image with inhomogeneous backgrounds”. Pattern Recognition 38 (2005) 2612 – 2625, 2005.
[Otus, 79] N. Otsu, “A threshold selection method from gray level histograms”, IEEE Tran. Syst. Man Cybern., 9, 62–66 (1979).
[Pun, 81] T. Pun, “Entropic Thresholding, A New Approach”, C. Graphics and Image Processing, 16(3), 1981.
[Sankur, 04] B. Sankur and M. Sezgin, “A survey over image thresholding techniques and quantitative performance evaluation”, Journal of Electronic Imaging, 13(1), 146-165 (2004).
[Silva, 06] J.M.M. da Silva, R.D.Lins and V.C.da Rocha Jr. “Binarizing and Filtering Historical Documents with Back-to-Front Interference”, In: ACM Symposium on Applied Computing, 2006, Dijon. Proceedings of SAC 2006. New York : ACM Press, 2006. p. 853-858.
[Tan, 02] C. L. Tan, R. Cao, P. Shen, Restoration of archival documents using a wavelet technique, IEEE Trans.Patt. Analysis and M.Intelligence, 24(10), pp. 1399-1404, 2002.
[Wang, 01] Q. Wang, C. L. Tan, Matching of double-sided document images to remove interference, IEEE CVPR2001, Dec 2001.
[Wu, 98] L. U. Wu, M. A. Songde, and L. U. Hanqing, “An effective entropic thresholding for ultrasonic imaging”, ICPR’98: Intl. Conf. Patt. Recog., pp. 1522–1524 (1998).
[Yen, 95] J. C. Yen, F. J. Chang, and S. Chang. “A new criterion for automatic multilevel thresholding”. IEEE Trans. Image Process. IP-4, 370–378 (1995).