desulfurization of flue gas by the confined zone dispersion process
TRANSCRIPT

r, -
DOE/PC/81009-T33 (DE90005529)
U.S. Department of Energy Dktrihutio" cursory UC.105
Pittsburgh Energy Technology Center Henry Pennline, DOE Project Officer
,
.’
DESULFURIZATION OF FLUE GAS BY THE CONFINED ZONE DISPERSION PROCESS
FINAL REPORT October 1989
Contract No. DE-AC22-85PC81009 5 Bechtel Job No. 17939

Section
2.2.3 Deposits
2.2.4 ESP Performance/UpRrading
2.2.5 Atomizing Air Pressure and Flow Rate
2.2.6 500 HWe Reference Plant
2.2.7 J. H. Campbell Unit 1, Consumers Power Company
3 COACLUSIOAS
2-6
2-7
2-7
2-7
Z-10
3-l
ii

ILLUSTRATIONS
2-1 Calculated vs Actual SO2 Removal for Fixed Exponent Cast
m
l-l
l-2
2-l
2-2
2-3
2-4
2-5
2-6
TABLES
Low Deposition Duration Tests
ESP Tests
Correlation Results
Rtngt of Variables
500 ?lWe Pcftrcnct Plant - Key Boiler Design Data and Flue Gas Characttriatics
500 MWe Reference Plant - Process Design Characteristics
J. Ii. Campbell Unit 1 - Key Boiler Design Data and Flue Gas Characteristics
J. E. Campbell Unit 1 - Process Design Characteristics
2-4
&gg
l-6
1-9
2-3
2-3
2-a
2-8
t-11
Z-11

acfm ADT AST AVC bhp GEM
,,.. CL eonc CPC CZD DOE d/s EMV ESP Eff FGD gpm mv ID
“’ Injection kscfm L LFR ~I.
~. me. @i mm! 02 OH
,0&M PEDA PEAELEC PETC PSIDL PRDA P&ID P&ID SCA SCf tcfm
I so2 so3 ssco T/R U/S VI w WC
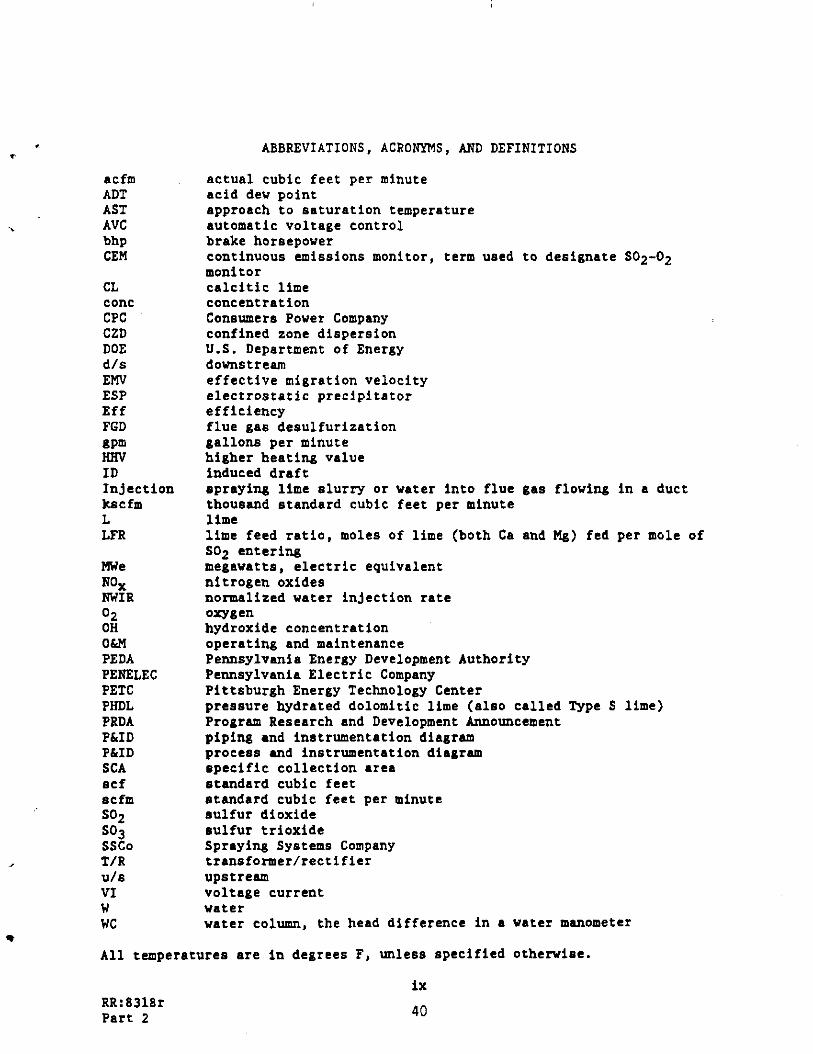
ABBREVIATIONS, ACRONYMS, AND DEFINITIONS
actual cubic feet per minute acid dew point approach to saturation temperature automatic voltage control brake horsepower continuous emissions monitor, term used to designate SOz-02 monitor calcitie lime concentration Consumera Power Company confined zone dispersion U.S. Department of Energy downstream effective migration velocity electroetatic precipitstor efficiency flue gas desulfuriration gallons per minute higher htttiag value induced draft spraying lime slurry or water into flue gas flowing in a duct thousand standard cubic feet per minute lime lime feed ratio, mole8 of lime (both Ca and Mg) fed per mole of SO2 entering megawatts, electric equivalent nitrogen oxides normalittd v&ttr injection rate 0ws-l hydroxide concentration operating and maintenance Pennsylvania Energy Development Authority ,Pennnylvania Electric Company Pittsburgh Energy Technology Cater prtsturt hydrated dolomitic lime (alao called Type S lime) Program Research and Development Announcement piping and instmcntation diagram proceta and instrumentation diagram specific collection area tttndtrd cubic feet standard cubic feet per minute q ulfur dioxide sulfur trioxidc Spraying Syeteme Company trensformer/rtctifitr upcatrtam voltage current vattr water column, the head difference in t vtttr manometer
.
. All temperatures are in degrees F, unless specified othervise.
iv

. “\
Section 1
S-Y .
m
.
This document is the final report for U.S. Department of Energy (DOE) Project DE AC22 85PC81009, Dtsulfurizttion of Flue Gas by the Confined Zone Dispersion Process. Bechtel Rational, Inc. was responsible for cwrying out the project under the direction of the Pittsburgh Energy Technology Center (PETC) of the DOE.
The Confined Zone Dispersion (CZD) process involves injectins a finely ‘. atomised slurry of reactive lime into the ductwork of a coal-fired utility
boiler. The principlt of the confined Zone is to form a wet zone of slurry droplets in the middle of the duct confined in an envelope of hot gas between the wet zone and the duct walls. The lime slurry reacts with part of the sulfur dioxide (SO?) in the gas, and the reaction products dry to form solid particles. An electrostatic precipitator (ESP) dobastrtam from the point of
injection captures the reaction products, along with the fly ash tntrtlned in the flue gas.
The purpose of this project was to prove the CZD process concept by tenting it on a limited scale, and then demonstrating the process on a large scale. The scope of work included projecting the cost of commtrcisl implemtntetion. Specific performance objectives, as defined by DOE for this project, were to remove 50 percent of the SO2 et L total projected cost of &cm than $500 per
ton of SO2 removed.
The test facility for the DOE-supported proof-of-concept tests vat on l scale equivalent to a 7 MW.2 generating plant. These tents were carried out et the
Campbell Station of Consumers Power Company (CPC) in West Olive, Michigan, using flue gas from the station’s Unit 1. Work on the project began in
September 1985, and the proof-of-concept tests took place between
September 1986 and July 1987.
l-l
1

The large-scale demonstration vss made on a scale of 70 MWe in one of the two flue gas trains of the 140 MW Unit 15 at the Seward Station, Seward, Ptnnsylvanis, of Pennsylvania Electric Company (PEBELEC). This testing was inititlly supported by Bechtel, PEBELEC, and the Pennsylvania Energy Development Authority (PEDA). Additional support to extend the testing was provided by DOE and Hew England Power Service. The tests that were sponsored by DOE were authorized in September 1987 and carried out during September and October of 1987.
Part 2 of this report describes the proof-of-concept tests at Campbell Station, and Part 3 describes the large-scale demonstration at Seward Station.
Part 4 describes how data from the two test sites were correlated. and presents conceptual designs for two full-scale retrofit installations. The
. rstionsle and data supporting the conclusions are also given in Part 4.
In this section, the activities and the results of the project sre summarised. Because of the many differences in the scale, scope, conditions, and constraints between the proof-of-concept tests st Campbell Station and the
* large-scale damonstration at Seward Station, these two programs art summarized + separately. Combined data analyses and full-scale cost projections are also
,britfly discussed in Section 2 , and the conclusions and principal findings from both test programs are listed in Section 3.
1.1 PROOF-OF-CONCEPT TESTS
The proof-of-concept tests at Campbell Station (described in Part 2) included
the design, construction, and operation of the test facility as required to ,: carry out the test program. After shakedown of the systam, the
proof-of-concept tests consisted of 4 months of days-only parametric tests and about 2 months of arormd-the-clock operation. The performance of the electrostatic precipitator (ESP) was evaluated during this latter period.
.
RR:8262r Part 1
l-2
2

1.1.1 tit Far-
The test facility vithdrev e slipstream of About 20,000 acfm of flue gas from
Campbell Unit 1 just dovnstream from one of the air heaters. The ges vas conducted to .a straight run of tent duct 130 feet long end 3 feet in diameter
where lime slurry WAS Injected. The gas then entered a pilot-scale ESP. From this ESP, the gas passed through an induced drbft (ID) fan vhich returned it
to the Unit 1 ductwork, vhcre it passed through the full-scale precipitator.
Lime, either pressure hydreted dolomitic or normally hydrated calcitic, VAS
delivered in bulk either dry or AS e freshly slaked aluray. Batches of slurry vere prepared from the dry hydrate by making them up to the concentration
desired in a slurry makeup tank. Slurries were degritted through liquid cyclones end stored for use in either of tvo 5,000-gallon feed tanks.
Slurry VAS injected into the 3 ft dia. test duct through tvo spray nozzles. These vere air atomizers mounted in the center of the duct, pointing dovnatream, and located 40 feet *pert.
On-line measurements included the folloving:
0 Ges velocity, temperature , and pressure upstream of lime injection
0 GAS temperature and pressure et the dovnstream end of the test section
0 The SO2 end oxygen (02) concentrations upstrcem of the spray nozzles and dovnstreem of the ESP. The upstream SO2/02 probe could be moved to A point just ehead of the ESP to measure SO2 remove1 zeroes the ESP
0 Opacity dovnstreem of the ESP
0 Flow of lime slurry end atomiring eir
1.1.2 Shakedown
Startup vork began in mid-September of 1986 and continued to mid-December of
1986. During this period, the ayetem was checked out and q ede operable end the operating team VAP mobilised end trained. The equipment WAS modified end
improved AS operating experience indicated.
RR:g262r l-3 Part 1
Flue gas coming from the host unit usually ranged between 270eF And 310°F and between 1,300 And 1,700 ppm S02; The test facility could not control the temperature or the SO2 concentration of the incoming gAS. Therefore,
dovnstresm temperature in the test duct VAS controlled by varying the rate of
slurry injection into the upstream spray nozzle. The changes in slurry ~’ injection And variation in the entering SO2 concentrbtion Caused the lime Cc fead ratio (LFR), the molar ratio of lime to S02, to vary somewhat during
the course of each test.
Tests during the shaltedovn period identified An ACCeptAble eprby nozzle: Spraying Systems’Compsny’s (SSCo’s) Casterjet nozzle vith their S-50 tip. With air supplied at 90 psig, atomisbtion YAP fine enough And the sprby Angle WAS such thbt deposition on the duct walls could be minimizcd.
‘_ To control deposition, however, it WAS necessary to limit the injection rAtA
through the upstream nozzle to About 1.5 gpm, And through the dovnstrasm nozzle to 1.2 gpm. At these injection rAtei, the entering gbs VAlOCity WAS
limited to About 35 ft/sec when the gas Vbs:COOled to A typicsl operating -~ temperature of 160VF.
w,1.1.3 Parametric
*Four months of parametric tests began in JA~UAIY 1987. These tests normally lasted 3 hours, but several took from 12 to 18 hours.~,; After each test, the duet VAS opened And Any deposits vere noted, And cleaned out. Test conditions vere VAriAd to determine how to achieve 50 percent rasovbl of SO2 And to
control deposition in the duct.
The effects of controllAble VAriAbles were else Axplored. The VAriAbleS And their observed effects Are AS follows.
povnstream TemDerAtUrq. This temperrture YAS Vbrisd from 140.F to 180’F. The lover temperbture incrersed SO2 rAmoval, but also incressed deposition in
the duct. Both of these phenomena are the results of lollger liquid phASe
residence time. A good compromise VAS 16O.F, About A 35-F ApprOACh to
seturetion temperature (AST).
,f
,
RR:8262r Pert 1
l-4
-4
Lime SlurIT COnCAntrAtipn. This value WAS varied from 8 to 22 percent. Deposition in the duct decreased ss slurry concentration inCrAAS*d; lime utilization also decreased but SO2 removal WAS higher because of the higher
LFR.
GAS Velocity. GAS Velocity upstream from injection WAS varied from 20, to 60 ft/sec. No effect on SO2 removal could be observed AS A function of
velocity *lone. To maintain the downstream temperature constent AS gas
Velocity increased, the SlUrry injection rate VAS InCreAsAd prOpOrtiOnAtely. InCreASed Slurry injeCtiOn WAS ACCOmpAnied by cobrser AtomizAtion And deposition on the duct valls , which may have obscured the effect of gas
velocity on SO2 removal.
Type and Source of I&g. Iv0 types of hydrated lime from five sources vere tried. The two limeA thbt performed best vere pressure hydrated dolomitic - lime (PWL) supplied in dry form by the k!ockuell Lime Co. of Plbnitovoc,.
Wisconsin, And A cblcitic lime (CL) vet slaked et the nearby Sims Station in Grand Haven, MlchigAn. The calcitic lime resulted in higher rsmoval And CAUSed less deposition in the duct At the tested conditions.
l&e Feed Rat-. The number of moles of lime injected per mole of
entering SO2 WAS vbri*d from 0.5 to 3.5. Increbsing the LPI3 increbsed SO2 removal but reduced lime utilisation. Utilizetion rurged from 12 to
50 percent for PEDL And from 26 to 60 percent for CL.
LPR And downstream temperature vere the two variables thbt hbd the most effect
on SO2 removal.
. .
The parametric tests showed that 50 percent SO2 rsmovbl with PEDL md A
downstream gas temperbture of 160-F required An LPRof Approximately 2, giving
A lime UtiliZAtiOn Of 25 percent. With the vet slaked cblcitic lims At this tempereture, 50 percent SO2 remove1 required An LFR of approxilutely 1.1, giving A utilization of 45 percent.
RR:8262r Part 1
l-5
5

Preliminsry tests vith gas tubes.shoved moderbte NOx removals. However,
subsequent tests with a chemiluminescent analyzer shoved negligible rcmoval.
By measuring distances dovnstream from the sprsy nozzles where vet solids . stuck to A probe inserted into the gas stream, it YAS possible to estimste approximate dry1n.S times. (These measurements vere approximate because the solids changed from very vet to very dry over A distsnce of severe1 feet.)
, These drying times for the indicbted drop in flue gas temperature vere:
0 From 28O*F-300°F to 200eF 0.7 to 1.2 set
0 From 2OO'F to 16O’F 1.2 to 1.4 set
Host of the SO2 removal occurred before the droplets of lime slurry dried. Measurements of SO2 remove1 ecross the ESP shoved that lesa than 5 percent (Absolute) of the SO2 removal occurred AS the dry solida trsveled to the ESP end vere captured there.
1 1.1.4 Duratian Test@
,,. The purpose of this series of tests VAS to operate the system continuously for ~_: prolonged periods to observe deposition And nozzle wear, end to provide Atsble ‘I,_
operating conditions for the ESP tests. Tbble l-l lists vbrious tests which demonstrated lov deposition with About 50 percent or more SO2 removal At 160OF And s gas velocity of 20 ft/sAc.
Table l-l
LOW DEPOSITION DURATION TESTS
.,;.. -perr.
‘;, 5/7
5/a S/12.13 5/19,20 S/29,30
6/2,3
Lime Slurrv
DUrAtion Ihr)
PKDL, 15% 20
PWL, 19.6% 20
CL, 11.1% 20
CL, 12% 20
CL, 12% 20
CL, 17% 18
SO2 Removal L!?B
50 2.3
47 2.7
42 1.0 46 1.4 50 1.1 61. 1.8
Lime biliZ*tiQD
22
17 42
33
44
34
Deposits 1% fed)
4.4
5.5
4.8
1.1 0.7
0.4
.
RR:S262r Pert 1
l-6
6

,: - At A gas VelOCity Of 20 ft/SeC, slurry injection rates vere *pproxim*tely I
1.2 gpm through the upstream nozzle And 0.8 gpm dovnstrcam. Higher gas ‘i
velocities required higher injection retes And resulted in more wall
deposition for prolonged operation.
1.1.5 BnAlYSiS Of SO2 &l&OVAl DAL@,
The dbtb vere organised into three sepbrbte dbtb sets, And AACh SAt WAS
AnAlyZSd separately using A personal computer-based regression program. Thei;
sets vere: PHDL injected though one nozzle, PEOL injected through tvo nozzles, And freshly slaked CL injected through tvo nozzles.
Both rbtionbl And empiric41 upressions were AxAmined to correlbte the dbtb. The rational upressions do not rllov SO2 remove1 to exceed 100 percent And SO2 removal is zero when LFR equals zero.
For all three dAtA sets, the rbtionrl ucpressions shoved A strong dependence of SO2 removal on both LFR And AST. GAS inlet temperbture WAS also
identified AS M ImpOrtAnt VAriAble. Inlet SO2 coneentrstion WAS identified AS An impOrtAnt VAriAble for the CL dbtb Set, but not for the PRDL dbtb Sets.
However, since inlet SO2 is A fbctor in LFR, elro used in the correlbtion, this result is inconclusive.
PlOtS Of CAlCUlAted versus ACtUAl SO2 raOOVA1 for the tAtiOn COrrAlAtiOnS
shoved A slight bias in thbt CAlCUlAted rcmovbl tended to be high et low ActuAl rAmovA And lov At high ACtUAl removsl. This SUggestS improved correletions could be found.
The empiricbl correlations reflected relrtionships between the independent variables rather than the VAriAblAS’ true contribution to SO2 rt?.mOVAl.
Thus, they vere difficult to interpret And did not utrspolate. The rational correlations Are felt to be better thla the empirical correlbtions for
understanding the process despite the bibs.
Plots of the rstional correlations shoving SO2 remove1 versus LFR shoved that SO2 removal rises fester md higher for freshly slaked CL than for
RR:a262r Part 1
l-7
7

PRDL, And thbt PRDL injected through’tvo nozzles outperformed PRDL injected through one nozzle.
Plots of lime utilization versus lime concentration for PWL And CL show that
lime utilization deCreASeS with increasing lime concentrrtion. Since, by definition, lime utilization times LFR equals SO2 removal, this implies that, et A given LFR, SO2 removal will decrease vith increasing lime concentration (bssuming other Variables are held constmt).
This phenomenon sxplains why SO2 remove1 performance of PRDL was better vhen injected through two nozzles than through A single nozzle with another nozzle for water injection. For A given operating condition, the concentration of lime injected through A single nozzle hAd to be higher thAn thbt injected
,, through two nozzles because the Addition41 water injected through the second nozzle WAS not wed to dilute the lime. This increase in feed solids results in poorer lime utilization end therefore, poorer SO2 rsmovel performance.
Additional lnalysis of the Campbell date could be upected to improve its _ correl*tion. Bowever, it us8 felt thbt A more useful correlbtion could be
‘~‘- obtained by ~nelyzing the combined data set from both the CAmpbell And SAVArd =3 sites AS later described.
.1.1.6 ESP Testq
Two series of ESP tests were carried out: the first in Aovsmber 1986 during *hAkedown of the system, end the second from MAY to July 1987, et the And of
the test program. The test runs for the first series were shorter thAn those
’ for the second series. The objective WAS to determine hov injection of lime into the ductwork Affected ESP performance And vhether injection is likely to increase perticulate emissions. The results vere COntrAdiCtOry.
The first series of tests showed thbt the lover tcmper*ture And higher moisture contsnt of the gas with injection improved collection enough to offset the higher psrticulste loading so that emissions did not increase
significantly. The second, and more extensive, series shoved the opposite:
;‘*
. . .
RR:8262r Part 1
l-8
a

.
1
that lime injection impaired ESP performance and caused emissions to increase. Table l-2 shows typical ESP performance St A gbs velocity upstream from injection of 45 to 50 ft/sec.
Tbble l-2
ESP TESTS
ESP Lime Temperbture hbiOV.1 Emissions,
Iniection . -0
First Series. November 19a4
11/18 No injection 275 94.8 0.050 11/22 PADL, 12% 165 99.0 0.034
Second S=ri+s. H*v to Julv 1987
6/8 No injection 2g4 98.1 0.058 Severe1 CL, 122, Average 160 86.3 0.761 7/27 PHDL, 15% 159 87.5 0.937
The validity of the second series of tests shoving poorer performance Vith lime InjACtiOn iS qU*stiOnAble. It is likely that incompletely dried slurry resulting from poor atomizAtion cAused ucessive eleCtriCA 1eAkSge during these tests. It is felt that further testing must be performed to confirm ESP
performbnce during CZD treAtment of flue gee.
1.2 LARGE-SCALE TESTS
The large-scale test program at the SeVArd Ststion of PERELEC (described in Pert 3) included the design, installation, end operetion of the CZD test
system. The CZD system vss retrofitted onto one of tvo pbrbllel flue gas ducts on the 140 HW Unit 15. After shakedown of the system, the Activity
consisted of 2 months of perametric lime injection tests and 1 month of continuous lime injection tests. ESP performuxe WAS evelusted during this
latter period.
.
RR:8262r Pert 1
l-9
9

1.2.1 Test Facility
The flue ;A. WAS treated in ApprOXimAtely 35 feet Of A straight ductwork section (8 feet wide X 11 feet high) situated betveen tvo sets of turning vbnes. The ductwork section and turning vAnes were 1OCAted betveen tvo eXisting ESPs. At A nominal flue gas velocity of 64 ft/Sec, the duct SeCtiOn had only 0.5 second of residence time. After slurry injection, the dried reaction products And fly Ash vere collected in the second uisting ESP.
PRDL And dry CL were received in Self-tInlOAding trucks And pnemnbtically transferred to A lime silo. The dry lime VAS slurried vith vater in s 2,500-gallon lime sump equipped with An AgitAtor. The slurry YAS pumped from the sump to A vibrating screen to remove fine grit And then stored in either of tVo lO,OOO-gAllOn Agitbted lime feed tanks.
Tvo centrifugal feed pumps, operating in series, pumped lime from the feed tsnks through A pump-around loop that pAsSed ClOSe to A valved manifold which distributed lime to the atomizing nozzles. A separate vblved manifold
distributed atomizing air to the nOrZles.
s.” On-line messurements included the folloving:
0 GAS velocity snd temperbture upstream of lime injection
0 GAS temperature before And After the dovnstreAm ESP .,:
0 so2, AOX, And 02 concentrations upstream of the spray nozzles And dovnstreAm of the ESP And the ID fan
0 Flov of lime slurry And atomising Air
0 Tsmperature prOfiles in the duct Cross Section At seVt!rAl dietAxes dovnatream of the injection point
: 1.2.2 Shakedon Tesfa
The shrkedovn tests began in June of 1987 And continued into August of 1987. During this period, the system VAS checked out And made operable, And the
operating teAm WAS mobilized And trained. Water atomisation tests vere performed to determine the pressure And flow chsracteristics of the atomizing nozzles And the oriAntstion constraints of the mdtiple Atomizcr Array.
RR:g262r Part 1
l-10
10

Prior to the SeVArd testing, several nOZZle Atomisers vere tested et the University of C*lifomi*, DAVIS. to calibrate the nozzles And to determine the effects of air and Vbter rbtes on fineness of atomizbtion. Nozzle performance results vere also AVAilAble from the pilot-scale CZD testing et the Campbell’
Strtion of Consumers Power Company (CPC). These tvo test programs identified the Spraying Systems Company’s (SSCo) Cbsterjet nozzle AS An acceptable Atomiter for the Sevbrd tests.
The nsxt step involved testing the Cblibrbted nOZZleA in the flue gbs duct to determine the best configuration And the minimum ratio of atomiring Air to water required to AVOid vetting the duct And turning vsnes. The testing started with s Single nOZZle And evolved t0 A nine-nOsAle Array.
Becbuse of the short duct And limited residence time, A much higher air-to-water rbtio than expected vbs required to provide the fine btomizbtio~ necessary for rapid eVApOrAtiOn. The air And discharge orifices of the nozzle were enlbrged to provide this higher ratio.
1.2.3 wtion Tests
Tvo months of parametric lime injection tests began in August 1987 and were folloved by A month of continuous lime injection tests in October.
The parametric tests, which normally lasted several hours, investigAted the effects of lime concentrbtion on the Axtent of flue gas desulfurizstion, lime utiliration, And lime InjACtiOn rate. The continuous lime injection tests InVsStigAtAd the long-term effects of lime injection on the:stomizers, duct deposits, And ESP performbnce.
The lime injection tests confirmed that fine btomizbtion snd restricted lime feed rbtes were necessary to dry the Atomised droplets sufficiently to AVOid deposition on the tUming vanes 1OCAtAd About 35 feet downstream of the nozzles. These restricted feed rbtes limited the~muimum SO2 removel. The
following results were obtained.
RR:8262r Pert 1
l-11
11

Duct TemoerAture Profiles. Temperature profiles talren in the duct cro8s
:. section At several distances from the injection point confirmed that A true
confined Zone, A moist interior surrounded by hot gA8, could be obtained.
PHpL Iniection. With PBDL injection, SO2 removal tAnged from 6 to
~. 30 percent, depending on the slurry flow rate And slurry concentration. The
L LPE ranged from 0.11 to 1.34. AOm removal ranged from 8 to 21 percent And
inCreASed with increAsing slurry ConCentrAtiOn. Lime utilization, based on
combined SO2 And IVOx removAl, rAnged from 23 to 90 percent.
mrrv ConcentrAtioD. Sulfur dioxide removal increased And lime utiliration
decreased vith increasing slurry concentration.
~ m. With CL, either freshly Al8ked or A slurry prepared from dry
: hydrate, SO2 removal, AOx rcmov~l, And lime UtilirAtion were significantly
lover thin correAponding vAlue8 for the PBDL. The unupected lower
.,_’ performAnce for the freshly slaked lime may hAVe beea caueed by eroded nozzle
::. tips. Time WAS not AVAilAble to repeat the.rfreehly alrlred CL tests vith
~' l ro8ion resistant tips.
,-; Duct Deoou. It AppeArcd thAt duct d8pOAitS could be prevented by limiting injection rates to the point where the Atomigsd droplet8 dried before they
reAched the first interior duct surface, the turning vmes. However, since
this WAS A mAnuAlly controlled OperAtiOn, it VA8 not.possible to foLLow load
ClOSelY, PArtiCUlArl,' At night. Consequently, there were time8 when the
injection rate was ucessive , resulting in low downstream temperature8 vith
some deposition On the vanes And Surrounding Areas. POOr AtOmiAAtiOn
:E resulting from eroded Atomisers also CAWAd some d8poSitS.
’ 1.2.4 -2-a
The test dAtA for PBDL were Arranged into groups According to veight percent
slurry concentration. A plot Of SO2 rf!mOVAl VCrSU8 gAllOW per minUtA Of
slurry injected WAS made identifying eACh group with A MiqUe symbol. It “AS
found that A straight line could be drAwi from the origin through the dAtA
points for each group.
BB:a262r Part 1
l-12
12

* 3
. .
I
These plots show that the Reward LeAt dAtA exhibit A positive’linear
relationship of SO2 removal versus slurry injection rAte. The plots Also :
shoved that, At A given injection rAte, SO2 removal ,increAses with slurry
concentration.
Lime utilisation dAtA were plotted to determine how lime utilization is
related to lime type And lime ConcentrAtion for SO2 And AOx removal. From
these plots, the SeVArd test data show the folloving relAtion8hips:
0 Both CL And PHDL utilizAtion decrease with increasiag lime concentration for both SO2 And HO, rcmovA1.
0 PHDL utilizAtion is higher Compared vith CL for either SO2 or NO, removal At A given lime concentration.
As noted earlier, the short residence time Available in the test duct At
gewArd limited the lime injection rAte to A point vhere A maximum of only ’
30 percent SO2 rsmoval could be ObtAined. A full-8CAle COAAAArCiAl system with A longer Straight run of duct vould not be limited in this WAY.
FUrthermore, the ductwork.configurAtion At geusrd iS SUitAble for inStALlAtiOn
of A second set of Atomizers upstream of the set used, vhich would
ApproximAtely double the residence time. This would allow more slurry to be
injected And result in higher SO2 rsmoval.
The plot6 described Above were 8xtrApOlAtAd t0 project the Slurry inj8CtiOn
rate And concentration required for 50 percent SO2 removal. By this
utrapolatioa, the injection of About 55 gpm of 7.5 percent PHDL vould remove
50 percent of the SO2 At Seward. .~
This AxtCApOlAtiOU 18 probAbly COnAArVAtiVA. using WO-StA$e injection And
increAsing residence time would pemit more injection points, better gAdsprAy
dispersion, A larger And more uniform confined zone , And A ClOSAt ApprOACh to
SAtUrAtiOn tt?AIperatUre for the treated gAs. These factors should provide
better lime utilizAtion thereby obtAinlag 50 percent SO2 removal At An
injection rate lower thAn 55 gpm.
.
BR:g262r Part 1
l-13
13

Tvo-stage injection is expected to provide much higher NOx removals COmpAred
with that obtained in the single-stage injection tests during the Seward test
progrAm.
. .
, 1.2.5 BSP Tests
PArticulAte removsl efficiency testing of the downstream ESP vith And vithout
lime slurry injection WAS conducted to determine the capability of the ESP to
handle the AdditionAl grain loading when lime VAS lajected into the system.
Aa uisting online opAcity monitor mouated in the stAck “As al80 u8Ad to
indicbte ESP performsnce during the testing.
During the short-term parsmetric tests, the opacity dACrAA88d and remained
lover during lime injection And then IncreAsed when injection vAs stopped.
During the long-term COatinuous injection tests, the opacity decreased At the
8tArt of injection And remained lov initiAlly, but then rose after 5 to
10 hours’ operation to A level exceeding the original opAcity prior to the
AtArt of injection. Off-power rapping vA8 successful in restoring 0pAcity to
Acceptable levels, but was required intermittently.
PArticulAte removal efficiency tests vere performed for fly Ash 8lOaA (a0
injection), during injection of PDDL And duriag CL injection. Daly one slurry
iajActiOa rAt8 per test vAs evAlusted. The Average pArticulAte removal
efficiency vAs slightly higher during the CL iajectioa md slightly lover
during the PEDL injection Compared with fly Ash Alone. The Average emissions
vere the same during CL injection but higher during PEDL injection cornpAred
with fly Ash Alone.
The CZD testing VAS conducted with the ESP in An As-found condition. No
Attempt WAS mAdA to Optimise the mechAnicAl/electricA1 condition prior to
testing. Aaalysia of the ESP operating chArActeristicA during the testlag
suggests thAt the precipitator hAd some dAfiCiAaCieA vith the AUtOmatiC
voltage coatrollerA and rapping systems.
Rka262r Part 1
1-14
14

h
.
The CApAbility Of Off-power rapping t0 reduce Opacity levels Suggests thst A~
well-tuned ESP, with Automatic controls for voltage And rapping, And with
discharge electrode rapping, may be capable of maintaining ACCeptAble opacity
levels during lime injection. As with the tests At Campbell Station, it is
felt that further ESP testing is needed.
I
,
RR:S262r Pat 1
1-15
15

.
L.

Section 2
ANALYSBS AND PEarRcTIOAS
2.1 COMBINRD DATA ANALYSES
Widely different test Conditions'At CAmpbell md Seward made it difficult to
AnAlySe the data on A common bASiS. CornpAred with Campbell, Seward had these
principal differences:
0
0
0
0
0
0
0
0
0
0
Extremely short residence time
Much 1Arger duct EroA8 SsCtiOa
Higher gas velocity And gas flow CAtA
Finer and more uniform Atomiration
Higher tOtA injection rAtAS
Lover inlet SO2 concentrAtioa
Lover SO2 removals
High ApprOACh t0 SAtUrAtiOa tSJApArAtUrS8
CApAbility to estrbllsh A confined zone
Relstively less duct depOsitA
One Approach did successfully CorrelAte the combined data set and Appears to
provide reASOnAble SxtrApOlAtiOaS. This AppCoACh had three mAjOr
ChArACtCriStiCS:
0 The iajection rates and gAs flows for the two Pystems Were normalized to make them directly compargble.
0 Significant messured VAriAble8 were included directly in the correlation formula.
0 A coefficient, K, VAS added to the correlation formulA to eccount for the effect of unmeasured VAriAbles, 8ySteA3 differences, end lime type.
RR:g264r Part 1 ‘l-7’ [T]
The injection rAtes And gas flovs were nor!nAlized by dividing the wAter
portion of the slurry feed rate in gallons per minUt.e (gpm) by the gas flow
rate in thousand standard cubic feet per minute (kscfm). This quantity WAS
Called the normalized VAter injection rate (RWIR). Other measured variables
used ia the correlation formula were: feed solids in weight percent (Wt X),
the Arithmetic Average of the inlet And outlet SO2 concentrations in vet
part8 per million by volume (Avg S02), And ApprOACh to SAturAtion
..: temperature CAST) in ‘F.
The form of the correlation equation chosen WAS:
Percent SO2 removal = K (I?WIR)a(Wt Xlb(Avg S02)C(AST)d
The SO2 removal dAtA were grouped into three data sets: Seward PIiDL,
Campbell PEDL, sad Csmpbell CL. Each dAtA set WAS regressed separately using
A personA computer-based regression program to obtain the vAlues of the
exponents And the coefficient, K, that provided the best fit. Fit was
‘measured by the aqwre of the correlation coe’ffieient, R2, provided by the
~~ regression progrsm. An R2 value of 1 is A perfect fit; 0 is completely
random.
“Using the initial regressions AS A guide, AdditioaAl regressions for each data
set were made using fixed values for the exponents. The objective WAS to find
single values for eAch exponent that, when used to correlclte each set, did not
significantly Affect the data fit. The final result WAS the correlation of
8ACh dAtA set to the equation where the measured VAriAbleS had the 8smA
exponents Aad the only difference WAS the value of the coefficieat, K. The
* vAlue of K. obtained this way, WAS A measure of the difference ia PSrfOrmAaCe
between the test systems. The results Are shown in Table 2-l.
r
RR:6264r Part 1
2-2
18

.
Table 2-l
CORRRLATIOIi RRSULTS
^
,
Data Set e
Seward PIiDL 0.65 Campbell PHDL 0.65 Campbell CL 0.65
B c d E E2
0.45 -0.4 -0.4 27.3 0.877 0.45 -0.4 -0.4 19.1 0.774 0.45 -0.4 -0.4 24.4 0.654
A comparison of calculated versus Actual removal for the Seward and CAmpbell
PWL correlations with the same exponent vslues 18 shova in Figure 2-l.
The range of the variables used in this correlation is shown in TAbls 2-2.
Table 2-2
UlVGE OF VARIABLES
Variable
AWIR, gAl/kACf wt x Avg SO2, ppmv vet AST, l F
2sil!ad
0.06 - 0.15 1.6 - 16 600 - 780 95 - 130
0.2 - 0.36 7.5 - 21 a00 - 1200 25 - 55
The carrelAtion provides reAsonAbly AccurAte prediction8 of S,02 removal when
the VAriAbles are within these rAngee. Eovever, the Accurbcy of
AXtCApOlAtiOnS outside these rAnges is -ova, And they should be performed
with caution.
The difference in performance for the Seward Aad Crmpbell test 8yst8ms CM be
measured by examining the VAlues of K Obtained for the PWL dbtr Beta. The
value of K for the Seward PliDL dAtA .9et is approximately 43 percent higher
thAa that for the Crmpbell PHDL data set. This q bAas that system differences
provided A 43 percent higher performance at Seward compared with Campbell.
This implies that operation of A large-scale system AimilAr to Seward At the
wme test conditions,used At Campbell would produce SO2 rsmovbl results
Approximately 43 percent better than those obtained during the ACtUAl Campbell
tests.
8264r Part 1
2-3
19

E E k r- k r- co 0 co 0 6 II 6 II II II
7 7 Y = Y = iY = iY =
IDAowaa 20s Paloln~lD3
Part 1 2-4
20

.
*
,
Comparing the value of K for the Cbmpbell PWL and CL dbtb sets shows that the
SO2 removal performance for cblcitic lime WAS AbOUt 28 percent higher than
that for PHIL, At the conditions tested. No useful large-SCAle 8yStbm dbtb were collected for CL, And Ye therefore hbVb no evidence that the improved
performance of CL over PKDL will bleo be observed in large-scale
illStbllAtiO,lS. Further testing is needed to confirm if cblcitic lime will
produce significantly better SO2 removal in a full-scale system.
2.2 FULL-SCALE PROJECTIONS
Conceptual designs for two full-scale retrofit installbtions, A generic
500 MWe unit And J. Ii. Cbmpbell Unit 1 of CPC, were prepared. The designs
include A process flow diAgrbm showing flows of material And energy, bad the
sizes, duties, and mbteriAls for the principal items of equipmmt. CbPit,bl
bad OpArAtiag C08t8 were bAtimAtsd from the designs.
2.2.1 a2JgKRygl
Thb level of SO2 remOVA for the full-scale prOjACtiOaS is specified At
50 percent. The correlation developed for the combined Csmpbell Aad Seward
SO2 removA dbtb vbs used to predict lime conceatrAtioas required for
50 percent SO2 rbmovbl. The value of K (27.3) obtbined for the Sevbrd PKDL
dbtA WAS used. This vblue takes into bccotmt the better SO2 rbmovbl
performance of the full-Acrle system produced by the Ability to establish A
true confined zone. The lime type vbb chosen b8 PRLIL becruse this is the only
type for which dAtA were AVAilAble from both test AitAS. A seasitivity
baalysia for lime type CL, using the sbme K factor, bnd the use of baother K
factor were conducted for comparison.
The levels of the independent VAribble in the correlation equbtioa were
determined AS follows.
m. The outlet temperature chosen for the projections is 170-F, the tbmperbture required to keep the turaiag vAae8 deposit-free At SeVArd. At bn
assumed sbturbtioa temperature of 125-F. this providee ba AST of 45-F. With
bn inlet temperature of 280°F, And assuming bn ideal confined Eoae, 71 percent
XX:8264r Part 1
2-5
21 .’

'I of the gas flow would be confined in the center gone of the duct And cooled to
the saturation temperature of 125OF. This gas would be surrounded by An
envelope of inlet flue gbs at 28O”F, smounting to 29 percent of the gas flow.
When these two zones Are completely mixed together downstreAm, they would
produce A blended outlet temperature of 17OOF.
m. fZle VblUe Of this VAribblA WAS CAlCUlbted from b heat balance based on
the flue SAS ChbrbCtbriStiCS. For b given flue gbs, once the Outlet
temperature is specified, NWIR varies directly with the gbe inlet temperature.
Averabe SQ,. The arithmetic average of the inlet end outlet concentrrtions
of SO2 ia the gas WAS CAlCUlAted from A material bblbtICe.
m. The correlation equation was solved for Wt% using the values of the :I
other VAriAbleS AS specified Above.
2.2.2 JTO, Removal
;, At th8 Campbell test site, NOx removA tests were inconclusive. At the
SeVbrd test site, ROx rAmovA rebched 17 percent with one Atbge of
iaj8ctioa. ThiS.AmOUat could improve with the 8dditiOa Of A second 8tAge Of
injection. The 8psCifiAd ROx reduction for the full-scale projections is 50
percent. The DOE guidelines require thAt A peaAlty be 888eSSsd for processes
which do not inherently reduce,NOm 8mi8sioa8 by 8 minimum of 50 percent.
BeCAUSe 50 p8rCsnt Nom CtlSOVAl WAS aOt dAmoaatrAted, this p8aAlty WAS
Assessed md no credit vbs taken for CZD NOx rtmovbl.
‘. 2.2.3 ~mosiU
During the full-8CAh tests, it bpperred that dApO8its could be prevented if
. . the AtOmiAsd droplets dried before they impinged on the interior duct
surfaces. Fine-sprsy nozzles vith erosion resistAnt tipa And SuitAble
instrumentation for the required process control were included in the
projections to provide for adequate droplet dryiag. Ro special mechAnica
dAViCA8 to dislodge or remove deposits were included. If bdditionbl CZD
testing shove A need for meChAniCA devices, the projections should be
modified becordiagly.
RR:g264r Part 1
2-6
22

2.2.4 ESP Performance/Um7rading
The Cbpbbility of an 8xisting ESP to handle the AdditiOabl loading resulting’
from lime injection was not conclusively determined during the CZD testing.
Some tests indicated ESP emissions were no greater during lime injection thbn
without; others indicated emissions increased during lime injection. The
rtbsons for the increased emission8 could not be conclusively identified, 80
it vbs not pO8sible to specify corrective mebsures.
No ESP modificbtion8 to Upgrade performance hbVe been included in the .I<
full-scale projections. However, new ESP conveyor8 bad waste solids storage
silos have been included to handle the increbsed qubntities of vbste solids.
2.2.5
The testing bt both sites shoved that high btomizing Air pressure provided
fine Atomibbtion which improved drying Aad SO2 rbmovbl. A practical limit
of 90 psig vbs established At both sites bad will be U8Ad for the
projections. A minimUm Of 30 SCf AtOmiZing Air per gAllOn Of SlUrIY WAS
required in the SAVArd testing to maintain good temperbture profile8 bad dry
doM8tCtbm turning Vbaes. A design value of 30 scf/gbllon of feed WAS used
for the projections.
2.2.6 500 MWe Reference
‘I’hC reference power plant Specified for this retrofit study is A pulverized
coal-fired plant consisting of two 500 MWe boiler units (i.e., Unit 1 bnd
Unit 2). The plant is Assumed to be located aebr Milv8ukee, Wisconsin. For
the purpose of this evblubtion, only Unit 1 is to be retrofitted for A
50 percent reduction of SO2 using the CZD process.
Tsble 2-3 lists power plant design iaformbtioa provided by the DOE
guidelines. Table 2-4 provides the projected process design chbrbcteristics.
RF!:S264r Pllrt 1
2-7
23

Table 2-3
500 HWe BEFEPENCE PLABT KEY BOILER DESIGN DATA AND FLlJE GAS CHABACTEBISTICS
m
Plant rating, Mu net Estimated remaining life, yr
:.Nct plant heat rate, Btu/kWb .~ Capacity factor, x
Sulfur content of coal, x Average heating value of coal. Btu/lb Gas flov rate, acfm/MW Gas temperature, *F Boiler efficiency, X Average coal bum rate, tph SO2 emission, tph
‘,NO, emission, tph
Table 2-4
Soecificaticw
500 30 10,000 65 4 10,100 4,000 280 88 247 18.77 2.22
,.. 500 Hwt REFmENCE PLABT
PROCESS DESIGR CBAEACTERISTICS
Procese De- Soecifications~
SO2 removal, % Spray dovn temperature, ‘F
.Approach to saturation temperature, .F Aonealized vater injection rate, gal/kscf gas . Inlet SO2 concentration, ppmv, vet basis
*&Outlet SO2 concentration, ppmv. vet basis :Average SO2 concentrstion, ppmv, vet basis
Lime feed ratio, l/2 [moles Ca(OB)2~Hg(OE)21/mole SO2 mcerirq Lime utilization, X Lime purity, X
,, Lime slurry concentration, WtX AtomizirrE air pressure, psig Atomizing air flov, scfm/gpm slurry
50 170 45 0.265 2,700 1,318 2049 1.46 34.3 95.5 24.3 90 30
paw Material end Utilitv Reauira
‘;;, PBDL, 95.5% Ca(OH12+~(0H)2, tph 29.6 Process vater, gpm 354 Electricity, kW 4000
&ocess Effluent8
SO2, tph NOXt wh Fly ashj tph Reaction products (includes unrescted lime), tph Grit, tph, vet Waste vater, gpm 8264r 2-8 Pert 1 24
9.4 1.1 31.6 36.4 1.66 none

A cost estimating methodology developed by the DOE was used. This method:
0 Levelists total retrofit capital requirements using standardised assumptions and economic factors developed by EPRI as well as simplifications determined to be suitable by DOE
0 Levelizes all costs to 1982 baee-year dollars
0 Levelizes capital costs for dissimilar acid rain precursor (i.e., SO2 and AOr) control approaches at different st*ges of technical maturity
0 Calculates the total retrofit cspital requirement and first year operating and maintenance costa, from vhich a tot&l levelized retrofit cost EM be calculated
Information required to generate the est.imatte vas obtained from equipment
vendors, published cost data , and Bechtel inhouse cost files. Capital costs
vtre estimated by s modular factor cost estimating approach. Process
equipment sizing and cost vere developed by Btchtel. Operating costs vere ‘,
calculated based on estimated rea&ent and utility consumption, md the
DOE-specified operating cost criteria.
The total retrofit capital requirsment vas estimated st $4?.01/kW, including
AOn nonremoval penalty. The estimated first year operating snd maintenance
costs are $31.34/kW-yr. The calculated SO2 removal coet is $357/tori SO2.
In terms of 30-year levelized busbar electricity cost, it becomes
14.0 mills/kWh.
Substitution of lime type CL for PBDL using the same correlation factor, K,
has a moderate impact on the 500 NWe conceptual design. Although the same
weight of hydrated lime is uttd for both lime types, the CL design utilizes
unhydrated lime delivered to the plant site. This usage considerably reduces
_ the dry lime storage facilities. Offsetting this is the need for onsite
equipment to hydrate the CL. The CL is also less expensive than the PHDL.
I
From the point vherc the CL is hydrated, the equipment requirements, i.e.,
storage and feed tanks, transfer and feed pumps, atomisation system, air
compressors and instruments and controls, are nearly identical for both CL and
PRDL .
8264r 2-9 Part 1
25
The net effect of the changes reduces the capital and operating coats for the
design. The estimated total retrofit capital requirement reduces to $42.l/kW,
1ncludiPg AOn nonremoval penalty. The estimated first year OM costs reduce
to $25.l/kU/yr. The calculated SO2 removal cost is $292/tori SO2 and the
30-year lcvtlised busbar eltctricity cost becomes 11.3 mills/kWh.
The effect of an increase of 25 percent in the value of the correlation
factor, K, on the 500 HWe conceptual design vas investigated. Additional
full-scale testing of the CZD process vith tvo-stage injection la expected to
provida a better confined zone pattern and ahov an improvement in SO2
ramoval performance vhich will increase the value of K. The smount of the
expected improvement can not be predicted at this time; 25 percent represents
one possibility.
The increase in the value of K produces more than a proportional reduction in
the lime requirements because the lima utilisation also increases. The
reduction in lime requirements substantially reduces the dry lime storage and
-. handling equipment. The lime slurry handling equipment, including the
,,atomitation system is not aignificancly affected.
: A 25 percent incraaae in K for the 500 HWc conceptual design using PEDL
‘&reduces the estimated total retrofit capital requiramanta to $38.5/kW.
,-including AOn nonramoval penalty. The catimated firat year O&M coat8 become
$19.b/kWh-yr. The calculated SO2 ramoval cost is $236/tori SO2 and the
30-year busbar electricity cost becomes 8.9 mills/kWh.
2.2.7 J.
Csmphtll Unit 1 of Conslrmers Paver Compsny is a baae-loaded pulvtriscd
coal-fired boiler, located in West Olive, Michigan. It buma medium-sulfur
coal, and the SO2 emissions are uncontrolled. Fly ash la removed by tvo
electrostatic precipitators in series - lE and 1W. Key boiler design data and
flue gas characteristics are as shovn in Table 2-5.
Process design characteristics for Campbell Unit 1 are presented in Table 2-b.
i
. .
8264r Part 1
2-10
26

Table 2-5
J. Ii. CAMPBELL UNIT 1 KEY BOILER DESIGN DATA ARD FLUE GAS CBARACTERISTICS
~racteristics Unit rating, Mw net Estimated remaining life, yr Ret plant heat rate, Btu/kWh Capacity factor, X Coal as fired
Moisture, X Ash, X Sulfur, X Bigher heating value (BBV), Btu/lb
Flue gas temperature, *F Flue gas flow, acfm @ 300.F Flue gas SO2 concentration, ppmv Particulate emissions control device
SDecifications 260 30 9,520 80
11.3 10.7 2.2 11,178 280-330 863,700 1,617 2-stage ESP
1st cltage 95% 2nd atage 97%
Table 2-6
J. H. CAMPBELL IJEIT 1 PROCESS DESIGN CIi6RACTERISTICS
Process Dednn Param*teEg SeerFfications SO2 removal, X Flue Gas temperature at injection point, l F Spraydown temperature, l F Approach to saturation temperature, ‘F Normalized vater injection rate, Sal/kacf gas Average SO2 concentration. ppmv, Vet basis Lime feed ratio, l/2 [moles Ca(OH)2~Mg(OIi)2]/mole SO2 entering Lime utilization, X Lime purity, X Lime slurry concentration, WtX Atomizing air pressure, psi8 Atomizing air flow, ecfm/gpm
50 300 170 45 0.284 1189 1.32 38 95.5 13.6 90 30
Paw Mater&l and witv Ream
PBDL, 95.5% Ca(OA)2*Hg(OH)2, tph 6.58 Process water, gpm 160 Electricity, kW 1,600
Process EffW
so2, lb/hr Fly ash, tph (ESP 1E) Reaction products (includes unreacted lime), tph (ESP 1W Grit, lb/hr, wet Waste water, gpm
4,620 9.00, . 8.70 740 none
8264r Part 1

The coat estimating methodology used’for this case follows the EPBI Technical Assessment Guide for a Class II level of analysis. Major equipment coats are based upon Bechtel inhouse information, adjusted to current coat index, and vendors’ telephone quotee. Other materials are by ratio to major equipment coats on plant parameters. Construction labors are from labor/material ratios
i’ for similar work, adjusted for site conditions and using expected avera8e labor ratea. The base year for the cost estimate in 1988.
The total estimated retrofit capital requirement is $29.49/kW; the first year operating coat is $18.07/k&yr; the 30-year levelized busbar costs is
6.5 mills/kWh. The calculated SO2 removal cost ie $360.38 per ton of SO2 removed, including both capital charge and O&M costs.
As discussed for the 500 t&/e conceptual deSign, additional full-scale CZD : testing is expected to show an improvement in SO2 removal performance. This
would result in a reduction in the estimated coats for Campbell Unit 1 similar to those preeented for the 500 PB#e caee.
RR:8264r Part 1
2-12
28

Section 3
COlKLuSIOAS
The following conclusions and principle findings can be draun from the results of the CZD testing.
1.
2.
3.
4.
5.
6.
7.
Overall SO2 removals above 50 percent are possible vith either PADL or
CL.
The injection of atomired lime slurry in a lar8e duct can be controlled in a confined zone dispersion which minimizes duct deposition while enhancing SO2 removal performance. Temperature profiles of the duct cro88 section during injection can be used to define the shape of the confined zone. 1,
Injected lime elurry has to dry before contacting any surfaces Inside the duct; othervise, deposits will form. Operation without deposits for SO2 removals above 25 percent appears to require residence times greater thari 0.5 second based on Seward results.
An inadequate residence time created by a short duct can be partially compensated for by increased fineness of atomisation which increases droplet surface area and, therefore, increases evaporation rate.
PHDL was leas erosive to the nozzle discharge orifice than were hydrated or freshly slaked CL.
Hi8h lime utilizations of about 50 percent at 50 percent SO2 re6IOVal are possible, particularly at low SO2 concentrations. Utilization is Inversely related to lime concentration.
The electrostatic precipitator (ESP) contributes less than 5 percent -(absolute) to SO2 removal.
RR:8265r Part 1
3-l
29

.: 8. Intermittent off-power rapping was successful in restoring stack opacity to acceptable levels during continuous lime injection at the full-scale test site. While this practice is not euitable for normal power plant Operation, it 8USgesta that improving the mechanical and electrical condition of an exiting ESP may make it capable of removing the added particulate matter introduced by lime injection.
9. The combined SO2 removal data from the Campbell and Seward test sites were correlated to a single correlation formula that appears to provide reasonable axtrapolations. Additional full-scale CZD testing vith increased residence time and a closer approach to saturation temperature is upected to provide data that will show an improvement in the SO2 removal performance for the correlation.
10. The correlation was used to project desiSn bases for two full-scale
retrofit installations; a generic 500 BWe unit and J. B. Campbell Unit 1 Of CPC. The total projected coats to remove 50 percent of the SO2 were
$357 and $360 per ton of SO2 removed, respectively, for the 500 UWe unit and Campbell Unit 1. These costs are belor the DOE performance objective of $SOO/ton of SO2 removed. Additional CZD testing with tvo-stage injection and a better confined zone pattern is expected to shov improved SO2 removal performance which vi11 aubatantially lover these SO2 removal costa.
11. BOX removals of up to 17 percent were demonstrated during the full-scale Seward testinp. These removals are expected to increase with additional CZD testing using two-stage injection. If a credit were taken for the acid reduction potential of the BOX removal, the SO2 removal cost8 vould ba further reduced.
12. Additional teatinp is required to further sxplore the limits of lime
injection rate and SO2 removal, to clarify performance of CL and PBDL as a function of residence time in a confined zone, and to more thOrOU8hly
assess the effect of lime injection on ESP performance.
RR:8265r 3-2 Part 1
30

,\ .
,
13. Additional ESP testing is expected to be favorable, and the projected
advantages of the CZD process appear real. Therefore, the process should prove to be extremely attractive and economical.
PR:8265r Part 1
.
3-3
31


PART 2
Campbell Station Tests
CONTENTS
Section
1 INTRODUCTION
2 SUMMARY
2.1 Test Facility
2.2 Startup
2.3 Parametric Tests
2.3.1 Downstream Temperature
2.3.2 Lime Slurry Concentration
2.3.3 Gas Velocity
2.3.4 Type and Source of Lime
2.3.5 Lime Feed Ratio
2.4 Duration Tests
2.5 Analysis of SO2 Removal Data
2.6 ESP Tests
3 PROJECT DESCRIPTION
3.1 Implementation
3.1.1 Detailed DeSign and COnStrUCtiOn
3.1.2 Final Program Activities
3.2 Process and Facility Description
3.2.1 Design Considerations
3.2.2 Overview
3.2.3 Lime Storage and Handling
a82
l-l
2-l
2-1
2-2
2-3
2-3
2-3
2-3
2-3
2-4
2-5
2-5
2-7
3-l
3-l
3-3
3-3
3-4
3-4
3-5
3-5
RR:8318r Part 2
1
33

Section
3.2.4 Test Duct
3.2.5 Pilot-Scale ESP
4 SHAKEDOWN
4.1 Modifications to the Facility
4.2 Operating Procedures
4.3 Data Acquisition
4.4 ESP Tests
5 SO2 KENOVAL TESTS
5.1 Parametric Teats
5.1.1 Approach
5.1.2 Results
5.1.3 Discussion of Parametric Tests
5.2 Duration Tests
5.2.1 Approach
5.2.2 Results .:,
6 ANALYSIS OF SO2 REMOVAL DATA
6.1 Approach
6.1.1 Re8ression AnSlySiS Program
6.1.2 Variables Selected
6.2 Analysis
6.2.1 PRDL in One Nozzle
6.2.2 PHDL in TWO Nozzles
6.2.3 CL in Tvo Nozzles
6.3 Discussion
6.4 Additional Analysis
m
3-11
3-14
4-l
4-l
4-2
4-3
4-4
5-l
5-l
5-l
5-5
5-21
5-23
5-23
5-25
6-l
6-l
6-l
6-2
6-3
6-3
6-8
6-16
6-24
6-28
r
RR:8318r Part 2
ii
34

Section b82
7 ESP TESTS 7-l
7.1
7.2
7.3
7.4
ESP Installation 7-l
7.1.1 ESP DSSign Details 7-l
7.1.2 ESP Inlet Conditions 7-4
ESP Test Procedures 7-6
7.2.1 Gas Sampling and Determination of Particulate Concentration 7-6
7.2.2 Operational Procedures 7-7
Test Results 7-8
7.3.1 First Series of Tests 7-9
7.3.2 Second Series of Tests - Without Injection of Lime 7-15
7.3.3 Sacond Series of Tests - With Lime Injection 7-21
7.3.4 ESP Outlet Opacity 7-37
7.3.5 VI Curves 7-39
7.3.6 Resistivity Measurements 7-43
Discussion of ESP Tests 7-46
7.4.1 Resistivity 7-46
7.4.2 Particle Size 7-47
7.4.3 Electrical Leakage 7-50
7.4.4 Uneven Gas Distribution 7-51
RR:8318r Part 2
iii
35

.:
c

ILLUSTRATIONS
zu8x8 3-l
3-2
3-3
3-4
4-1
5-l
6-l
6-2
6-3
6-4
6-5
6-6
6-7
6-8
6-9
6-10
6-11
P&ID of the Test Facility
Layout of the Test Facility
Plan View of Duct Test Section
Spray Nozzle Assembly
Typical Data Sheet for Parametric Tests
Plan View of Duct Test Section
Calculated vs Actual SO2 Removal Using Equation Mll-2a
Prediction of SO2 Removal vs LFR for AST of 35.F and 55-F Using Equation Mll-2a
Calculated vs Actual SO2 Removal Using Equation M3-3
Calculated vs Actual SO2 Ramoval Using Equation DlS-2a
Prediction of SO2 Removal vs LFR for AST of 35.F and 55OF Using Equation DlS-2a
Prediction of SO2 Removal vs LFR for Tin of 270-F, 300°F, and 330’F Using Equation DlS-2a
Calculated vs Actual SO2 Removal Using Equation D3-3
Prediction of SO2 Removal va LFR for AST of 35-F and 5SeF Uslag Equation D3-3
Calculated vs Actual SO2 Removal Usi& Equation ClO-lla
Prediction of SO2 Removal vs LFR for AST of 35.F and 55.F Using Equation ClO-lla
Prediction of SO2 Removal vs LFR for SO2 of 1300 ppm, 1500 ppm, and 1700 ppm Using Equation ClO-lla
l!8.88
3-7
3-9
3-12
3-13
4-5
5-3
6-6
6-7
6-9
6-11
6-12
6-13
6-14
6-15
6-19
6-20
6-21
I
V
36 RR:8318r Part 2

Fiaure
6-12
6-13
6-14
6-15
7-l
7-2
7-3
7-4
7-5
7-6
7-7
7-a
7-9
7-10 2.
7-11
7-12
7-13
7-14
7-15
7-16
Calculated vs Actual SO2 Removal Using Equation C3-3
Prediction of SO2 Removal vs LFR for AST of 35’F and 55-F Using Equation C3-3
Lime Utilisation vs Lime Concentration for Campbell Two-Stage PRDL Injection
Lime Utilization vs Lime Concentration for Campbell Two-Stage CL Injection
Lodge SP5 Series Modular Dry Electrostatic Precipitator
Efficiency vs Gas Velocity, All Two Field Tests
Efficiency Versus SCA
Efficiency Versus Paver Input
Efficiency Versus Gas Velocity
Efficiency Versus SCA, All Maximum Power Tests
Efficiency Versus Power Input
Power Veraus Collection, Tests vith Slurry Injection
Power Versus Collection, Teats with No Injection
Variation of EMV vith Gas Velocity
Effect of Power on Migration Velocity
Mi8ration Velocity History
ESP Outlet Opacity vs Time
‘typical VI Curves (Post Test)
Variation of Operating Current with Voltage
Ash Resistivity Calculation
6-22
6-23
6-25
6-26
7-3
7-17
7-18
7-19
7-22
7-24
7-28
7-29
7-30
7-33
7-34
7-35
7-40
7-42
7-44
7-48
RR:8318r Part 2
.r
Vi
37

TABLES
ml&
2-l
2-2
5-l
5-2
5-3
5-4
5-5
5-6
5-7
5-8
5-9
S-10
6-l
6-2
6-3
7-l
7-2
Low Deposition Duration Tests
ESP Tests
Nozzles Tested
Evaluation of Nozzles
Effect of Lime Concentration
Effect of Dounstream Gas Temperature
Effect of Gas Velocity
Effect of Lime Slurry Injection Rate
Effect of Atomising Air Pressure
Performance of Other Limes
Miscellaneous Tests
Lang Duration Tests - Summary 6f Results
Campbell Single-Stage PADL Injection Data
Campbell Two-Stage PHDL Injection Data
Campbell Tvo-Stage CL Injection Data
ESP Design Details
Concentrations of Particulate Matter in Flue Gas Entering the ESP
pagn
2-5
2-7
5-7 z:
5-8
5-11
5-12
5-14
5-15
5-17
5-17
5-19
5-26
6-4
6-10
6-17
7-2
7-5
7-3 ESP Test Results - First Series of Tests 7-10
7-4 ESP Test Results - Second Series of Tests 7-11
7-5 Effect of Rapping vithout Water 7-20
7-6 Effect of Gas Temperature on ESP Collection Efficiency 7-25
7-7 Replicated ESP Tests 7-26
Vii
RX:8318r Part 2
38

Tsble
7-8 Comparison A - Effect of Rapping
7-9 Comparison B - Effect of Rapping
7-10 Comparison A - Dolomitic vs Calcitic Lime
: 7-11 Comparison B - Dolomitic vs Calcitic Lime
7-12 Effect of Conditioning Time
I 7-13 Eesietirity of Particulate Matter
E8EK
7-31 .T
7-31
7-36 /
7-36
7-38
7-45
:
I
RR:8318r Part 2
viii
39
.
acfm ADT AST AVC bhp CEM
CL cone CPC CZD DOE d/s EMV ESP Eff FGD 8Pm BBV ID Injection kscfm L LFR
MWe NO, RWIR 02 OH O&M PEDA PENELEC PETC PHDL PRDA P&ID P&ID SCA scf scfm so2 SO3 ssco T/R u/s VI W WC
ABBREVIATIONS, ACRONYW, AND DEFINITIONS
actual cubic feet per minute acid dew point approach to saturation temperature automatic voltage control brake horsepower continuous smissions monitor, term used to designate SO2-02 monitor calcitic lime concentration Consumers Power Company confined zone dispersion U.S. Department of Energy downstream effective migration velocity electrostatic precipitator efficiency flue gas desulfurization gallons per minute hiSher heating value induced draft spraying lime slurry or water into flue gas flowing in a duct thousand standard cubic feet per minute lime lime feed ratio, moles of lime (both Ca and Mg) fed per mole of SO2 entering megawatts, electric equivalent nitrogen oxides normalized water injection rate o48en hydroxide concentration operating and maintenance Pennsylvania Energy Development Authority Pennsylvania Electric Company Pittsburgh Energy TeChnOlogy Canter pressure hydrated dolomitic lime (also called Type S lime) Program Research and Development Announcement piping and instrumentation diagram process and instrumentation diagram specific collection area standard cubic feet standard cubic feet per minute sulfur dioxide sulfur trioxide Spraying Systems Company transformer/rectifier upstream voltage current water water column, the head difference in a water manometer
All temperatures are in degree6 F, unless specified othervise.
1X RR:8318r Part 2

. .

Section 1
IBIBODUCTIOB
As pert of a program to develop more cost-effective approaches to the control of acid rain precursors, the Department of Energy (DOE), in 1985, requested proposala for carrying out proof-of-concept tests of aev technology to reduce
emistloaa of SO2 and AOx from existing power plants. The DOE’8 objective
VIM to stimulate development of lower cost proctttte suitable for retrofitting onto older plants. The specific goal vat to remove et least 50 percent of the SO2 at (I total cost of less than $500 per ton.of SO2. The proof&of-concept test facilities were to be oa a scale equivalent to 5 MWt.
Btchttl v&t warded Contract DE-AC22-g5PC81009 by DOE, Pittsburgh Energy
Technology hater to perform proof-of-concept ttatiag. Btchtcl’e concept, celled the Confined Zone Dispereioa (CZD) proctsa, involves injtctiag t flatly atomizcd slurry of reactive lime Into the ductvork betvcea a boiler’s air
heater and its precipitator.
The test facility was located at the J. Ii. Capbell Stttioa of Conmmtrs Power Company ia West Olive, Michigan. Unit 1 at the Campbell Station supplied a slip tvtrtem of flue gas to the facility. Work oa the project btgaa in September 1985, md the proof-of-concept teete took pltcc between September
1986 and July 1987.
,
ER:8315r Part 2
l-1
41


Section 2
SWY
The proof-of-concept (or pilot-scale1 test8 at Campbell Station included the design, construction, end operation of the test facility a8 required to carry
out the test program. After shakedobn of the tytttm, these tests consisted of
4 months of days-only parametric tt8ta and about 2 months of around-the-clock operation. The performance of the electrostatic precipitator (ESP) was evaluated during thie latter period.
2.1 TEST FACILITY
The test facility vithdrtv a tlipstrtem of about 20,000 acfm of flue gas from
Campbell Unit 1 just downstream from one of the air heaters. The gas wes conducted to a straight run of test duct 130 feet long aad 3 feet in diameter where lime slurry was injected. The gas then catered a pilot-scale ESP. From this ESP. the gas passed through en induced-draft (ID) fan vhich returned it to the Unit 1 ductwork, where it passed through the full-scale precipitator.
Lime, either pressure hydrated dolomitic or normally hydrated calcitic, was delivered in bulk tither dry or a.8 e freshly slaked slurry. Batches of slurry
c were prepared from the dry hydrate by making them up to the concentration desired in e slurry makeup tank. Slurries were dtgritttd through liquid
cyclones and stored for use in either of two 5,000-gallon feed teaks.
Slurry we..8 injected into the 3 ft die. teat duct through two spray nozzles. These were air etomizers mounted in the ceattr of the duct, pointing dovnstream, end located 40 feet apart.
On-lint measurements included the following:
0 Gas velocity, temperature, and pressure upstream of lime in$ection
0 Gas temperature and pressure et the downstream end of the test scctioa
BR:g293r Pilrt 2

0
0
0
2.2
The SO2 aad oxygen (02) concentrations upstream of the spray nozzles and downstresmof the ESP. The upstream SO2/02 probe could be moved to a point just shead of the ESP to measure SO2 removal scross the ESP
Opacity douastresm of the ESP
Flows of lime slurry and atomiziag sir
STARTUP
“’ Startup work began in mid-September of 1986 sad continued to mid-December of 1986. During this period, the systsm us8 checked out sad made operable and the operating team vss mobiliztd snd trained. The equipment us8 modified snd improved as operating experience indicated.
Flue gas coming from the host uait usually ranged between 270’F and 310'F snd
..~ between 1,300 sad 1,700 ppm S02. The test facility could not control the temperature or the SO2 concentration of the incoming gas. Therefore, downstream tsmpersture in the test duct was controlled by varying the rate of
slurry injection into the upstresm spray nozzle. The changes in slurry .: injection sad variation in the entering SO2 concentration caused the lime
feed ratio (LFR), the molar ratio of lime to S02, to vary somevhat during the course of each test.
Tests during the shakedown period ideatified ta acceptable tprty nozzle: Spraying Systems Company’s (SSCo’s) Csstcrjtt nozzle with their 5-50 tip. With sir supplied st 90 psig, atomization was fiat enough and the spray angle wss such that deposition on the duct valls could be minimized.
To control deposition, however, it wt.8 ntcttttry to limit the injection rate ;I’
through the upstrtsm nozzle to about 1.5 gpm, sad through the dovnstream
.” nozzle to 1.2 gpm. At these injection rstss, the entering gas velocity was limited to about 35 ft/sec vhtn the gas vss cooled to a typical operating temptrsturt of 160-F.
.
RR:8293r Part 2
2-2
44

2.3 PARMETRIC TESTS
Four months of parametric tests began in January 1987. These tests normally lasted 3 hours, but several took from 12 to 18 hours. After each teat, the duct vss opened sad any deposits were noted, and cleaned out. Test conditions vere varied to determine how to achieve SO percent removal of SO2 snd to control deposition in the duct.
The effects of controllable variables were also explored. The variables and their observed effects are as follow.
2.3.1 Dovnstream Tern-
This temperature vss varied from 140*F to HOOF. The lovar temperature
increased SO2 removal, but also increased deposition in the duct. Both of
these phenomena are the results of longer liquid phase residtace time. A good compromise was 160-F, about a 35-F approach to saturation tsmptraturt (AST)..,.
2.3.2 J&g Slurrv CB
This value vas varied from 8 to 22 percent. Deposition in the duct decreased
as slurry concentration incrtastd; lime utilizstioa also decreased but SO2
removal vas higher because of the higher LFR.
2.3.3 &as Velocity
Gas velocity upstrtsm from injection vas varisd from 20 to 60 ft/stc. No
effect on SO2 removal could be observed as a flmction of velocity alone. To maintain the downstream temperature constant as gas velocity incrtassd, the
slurry injection rate was increased proportionately. Incrtaatd slurry
injection was accompanied by cosrser.stomizatioa and deposition on the duct valls, which may have obscured the effect of gas velocity on SO2 removal.
2.3.4 TyPt and Source of L&g
hro types of hydrated lime from five sources vert tried. The tvo limes that performed best vtre pressure hydrated dolomitic lime (PHDL) supplied in dry form by the Rockwell Lime Co. of Manitowoc. Wisconsin, and a calcitic lime
RR:8293r Part 2
2-3 45

(CL) vet slaked at the nesrby Sims Station in Grand Haven, Michigan. The :. calcitic lime resulted in higher removal snd caused less deposition in the
duct at the tested conditions.
2.3.5 Lhe Feed Rttio CLFRI
The number of moles of lime injected per mole of entering SO2 was varied from 0.5 to 3.5. Increasing the LFB increased SO2 removal but reduced lime utilizatioa. Utilization ranged from 12 to 50 percent for PBBL sad from 26 to
” 60 percent for CL.
LFR and downstream temperature were the tvo variables that had the most effect on SO2 rsmoval.
The parsmetric tests shoved that 50 percent SO2 removal with PBBL sad a dovastrtsm gst ttmptrsturt of 160.F required sa LFB of approximately 2, giving a lime utilization of 25 percent. With the vet slaked calcitic lime at this tsmptraturt, 50 percent SO2 removal required sa LFB of spprorimately 1.1, giving a utilizstion of 45 percent.
Prtlimiaary tests vith gas tubes shoved moderate AOx removals. Hovtver,
2;:. subsequent tests with a chsmilumiatsceat saslyztr shoved aegligiblt rsmoval.
i By measuriag distances dowaetrtsm from the sprsy nozzles where vet solids stuck to a probe inserted into the gas stream, it was”‘possiblt to estimate approximate drying times. (These measurements were approximate because the solids chsaged from very vet to very dry over 6 distsact of several feet.)
These drying times for the indicated drop’ia flue gas temperature vert: ,_
0 From 280-F-300°F to 200-F 0.7 to 1.2 stc
0 From 200-F to 160-F 1.2 to 1.4 stc
Most of the SO2 rsmoval occurred before the droplets of lime slurry dried. Measurements of SO2 removal across the ESP showed that less than 5 percent
(absolute) of the SO2 rsmoval occurred s&the dry solidstravtltd to the ESP and vere captured there.
RR:8293r Part 2
2-4
46

2.4 DURATION TESTS
The purpose of this series of tests vss to operate the system continuously for
prolonged periods to observe deposition and nozzle year, and to provide stable
operating conditions for the ESP tests. Table l-l lists various tests which demonstrated lov deposition with about 50 percent or more SO2 removal at 16O'F and a gas velocity of 20 ft/sec.
Lime Date Slurrv
517 PHDL, 15% 5/a PADL , 19.6% 5/12,13 CL, 11.1% 5/19,20 CL, 12% 5/29,30 CL, 12% 6/2,3 CL, 17%
Table 2-1
LOW DEPOSITIOA DURATIOA TESTS
Duration SO2 Lime Deposits (hrliZi!%WdLEB Utilization l% fed)
20 50 2.3 22 4.4 20 47 2.7 17 5.5 20 42 1.0 42 4.8 20 46 1.4 33 1.1; 20 50 1.1 44 0.7 18 61 1.8 34 0.4
At a gas velocity of 20 ft/stc, slurry iajtction rates vtrt spproximately 1.2 gpm through the upstream nozzle snd 0.8 gpm douaatrtsm. Higher gas velocities required higher iajcction rates sad resulted in more wall deposition for prolonged operation.
2.5 ANALYSIS OF SO2 REMOVAL DATA
The data wart orgsaized into three separate data sets, snd each sat vss
saalyztd ssparattly using a personal computer-bared rsgressioa program. These
sets vtre: PHDL injected though one aozzlt, PBDL injected through two
nozzles, sad freshly slaked CL injected through tvo nozzles.
Both rational sad empirical expressions were examined to corrtlsts the data.
The rational expressions do not 6110~ SO2 removal to txcttd 100 percent and
SO2 removal is zero when LFR equals zero.
RR:g293r 2-5 Part 2 47

For all three data sets, the rational expressions showed a strong dependence .:, of SO2 removal on both LFR and AST. Gas inlet temperature was also .,,,
idtntifitd as sn importsnt variable. .Inltt SO2 concentration was idtntifitd ,. as an important variable for the CL data set, but not for the PEDL data tets.
However, since inlet SO2 is a factor in LFR, also used in the correlation, .i this result is inconclusive,
* Plots of calculated versus actual SO2 removal for the rational corrtlatioas shoved a slight bias in that calculated removal tended to be high at low actual removal and low at high actusl removal. This suggests improved correlations could be found.
The empirical correlatioas reflscttd relationships betveen the independent vsrisblts rather than the variables’ true contribution to SO 2 rsmoval.
._~ Thus, they were difficult to interpret snd did aot extrapolate. The rational corrtlations are felt to be better than the empirical correlations for
understanding the process despite the bias.
Plots of the rational correlttions shoving SO2 rsmoval versus LFR shoved that SO2 removsi rises faster and higher for freshly slahed CL than for PHDL, and that PEDL injected through two nozzles outperformed PEDL injected through one nozzle.
Plots of lime utilization versus lime coacsntratioa for PBDL and CL show that lime utilizatioa decreases vith increasing lime concentration. Since, by dtfinitioa, lime utilization times LFR equals SO2 removal, this implies that, at a given LFR, SG, ysmovsl will decrease vith,incressing lime conctntrstion (sssuming other variables are held constsnt).
This phenomenon sxplains why SO2 removal performance of PHIL vss better when injected through two nozzles than through a single nozzle vith another nozzle
for vattr injection. For a givsn operating condition, the concentration of
lime injected through a single nozzle had to be higher thsn that injtcttd
through two aozzles because the sdditionsl vattr injected through the second nozzle vss not used to dilute the lime. This increase in feed solids results
in poorer lime utilization and therefore, poorer SO2 rtmovsl performance.
RR:8293r 2-6 Part 2 48

<~‘
. .
c
Additional analysis of the Campbell data could be’axptcted to improve its : corralation. However, it was felt that a more useful correlation could be obtained by analyzing the combined data eet from both the Campbell snd Sevard. sites as later described.
2.6 ESP TESTS
Two series of ESP tests were carried out: the first in November 1986 during shakedown of the system, and the second from May to July 1987, at the end of the test program. The test runs for the first ttries were shorter than those for the second series. The objective vss to determine hov injection of lime into the ductwork affected ESP performance and whether injection is likely to increase particulate smissioas. The results vere contradictory.
The first series of tests showed that the lower temperature and higher moisture content of the gas with injection improved collection enough to
offset the higher particulate loading so that emissions did not increase 1.
significantly. The second, snd more extensive, series shoved the opposite: that lime injection impaired ESP performance snd caused emissions to increase. Table l-2 show typical ESP performance at a gas velocity upstream from injection of 45 to 50 ft/aec.
Table 2-2
ESP TESTS
ESP Lime Temperature
tion (.F
First Series. a 1986
U/18 lie injection 275 11/22 PRDL, 12% 165
Second Se&g. MAY to Julv 1987
Removal
94.0 99.0
Emissions, laL/dscf I
0.050 0.034
618 Ro injection 284 98.1 0.058 Several CL, 12X, average 160 06.3 0.761
” 7/27 PHDL, 15% 159 87.5 0.937
RR:8293r Part 2
2-7
49

The validity of the second stries of tssts shoving poorer performance with lime injection is questionable. It is likely that incompletely dried slurry resulting from poor atomization caused excessive electrical leakage during these tests. It is felt that further testing must be performed to confirm ESP performance during CZD treatment of flue gas.
BB:8293r Part 2
2-s
50

. .,
Section 3
PROJECT DBSCRIPIIOA
I
On February 2, 1985, the Pittsburgh Energy Technology Ceater (PETC) of the Department of Energy (DOE) issued a Program Research and Development Announcement, (PRDA) RA-22-85PC81001, soliciting proposals to carry out proof-of-concept tests of novel procsssts for flue gas dtsulfurization (FGD).
These FGD processes were to be capable of removing at least 50 percent of the SO2 from the flue gas of coal-burning utility boilers. They were also to have the potential of being economically retrofitted onto existing boilers,
.snd the by-products vert to be tither useful or at least suitable for disposal as nonhazardous vsstes. The total estimated cost of the SO2 removal vss to be less than $500 per ton of SO2 removed. PETC sptcifitd that the scale of the proof-of-concept tests vss to be approximately equivalent to a 5 MWe paver plant.
On April 1, 1985, Bechtel rssponded to this PRDA with a proposal to design, build, and operate a test facility based on the company’s proprietary Confiasd Zone Dispersion (CZD) process. The facility vss to be located at Consumers Power Company’s (CPC’s) Campbell Station in West Olive, Michigan. Unit 1 at the Campbell Station would supply a slip stream of flue gas to the facility.
CPC agreed to this arrangement in a letter of intent, a copy of vhich Bechtel ,includtd in its proposal. On June 12, 1985, PETC notified Bechtel that the latter’s proposal vas one of those selected for negotiation, snd Contract DE-AC-22-SSPC81009, signsd on September 23, 1985, authorizsd work to begin. A
Work Plan, drafted by Bechttl, was submitted to PETC on Aovembtr 22, 1985.
3.1 IMPLEMENTATION
A formal agreement with CPC vss signed on February 19, 1986. CPC was unable to accept any lisbility for the test facility or any costs that would affect
its rate structure. To preclude any action that required modificstion of
Campbell Station’s tnvironmtntal permits , no process wastewaters could be
RR:8266r Part 2
3-l
51

: discharged by the test facility, and’s11 solid wastes had to be disposed of
off site. In addition, messurss to minimize emissions of dust vert mutually developed by Btchtel end CPC.
CPC’assisttd the project in many ways. It helped apply for environmtntal permits, snd provided general support and assistance throughout the program. Campbell Station provided utilitits, office space, and other services.
_~
Bechtel Rational, Inc. ptrsoanel from Ssn Francisco managed the project sad performed the process design, shakedovn, testing, and reporting. Detailed design, most of the procurement, and management of construction was done by
,~ Bechttl Eastern Power Company, from its office in Ann Arbor, Hichigan. Subcontractors from western Michigan performed the construction.
During a scheduled outage of Unit 1 late in Novcmbtr 1985, penetrations vere made in the unit’s ductwork. Hsnually operated shutoff dsmpers were welded onto the penetrations, snd the damper openings were staled with cover plates md insulated. With these dampers in place, another outage was not needed to connsct the test duct.
~*’ Most of the process design YSS complsttd by Decambtr 1985. This included “a specifying the sizes, duties snd gtntrtl layout of major itsms of equipment;
major instnzmenta and controls: aad mattrials of construction for the process equipment.
Procurement of long-lead items such as the electrostatic prtcipitstor (ESP). the ID fan, snd the on-lint monitor for SO2 and O2 began in Novtmbtr
.; 1985. With the sxecution of a subcontract for installing the process equipment (which included piping, viring, and insulation) in July 1986,
’ procursmtnt for building the facility was completed. Bovever, procurement of supplies continued throughout the test program. The facility was dismantled
and the site vss restored in August 1989.
3.1.1 Qetsiltd Desien and Construction
Detailed design begsn in Dtcsmbtr 1985 and vss tsstntially finished by
June 1986. This work included preparation of bid specificatioas for
RR:8266r 3-2 Part 2 52

i-
.*
subcontractors, a number of working drawings for equipment snd structures, a i process and instrumentation diagram (P&ID), wiring diagrams, and detailed layouts. Specifications for restoring the site were also prepared.
Three principal subcontracts vere awarded for the construction work:
0 Footings, foundations, and concrete work
0 Design, provision of materials, and erection of the process building
0 Erection and installation of process equipment, piping, and wiring
A Bschtel superintendent supervissd the construction, but subcontractors performed the work. The construction superintendent vas responsible for
quality control snd verified that the subcontractors completed their vork satisfactorily. Work at the site began in May 1986, and the construction ‘~ superintendent turned the facility over to the operating team on October 8, .~ 1986.
3.1.2 Activitita
The shakedown work began in mid-September 1986, and the test program vss completed on July 28, 1987. Shakedown and test program activities art
described in Sections 4, 5, 6, and 7.
On completion of the test program, the facility vss sscurtd snd mothballed, with all the tools and supplies stored in the process building until disposition instructions for the equipment were rtctived from the DOE. Dismantling and site restoration were completed in August 19g9.
While the project was active, Bechttl submitted technical progress reports to PETC each month. These reports describe each month’s activity. During the
test program, they also included a brief description snd an analysis of each month’s results and a detailed tabulation of the operating and test data. The reader is referred to these monthly technical reports for the raw test data.
RR:8266r Part 2
3-3
53

3.2 PROCESS AND FACILITY DESCRIPTION
3.2.1 Desinn Considerations
The test facility vss designed to be simple and versatile. Flexible hosts were connected to pumps to allov the suction and discharge points to be changed as required. An example of this flexibility is seen in the lime handling and supply system where tither lime slurry pump could tske suction from any of the lime slurry feed tsnks snd discharge to the grit tsnk. the
.: vsstevster amp, or the pump-around loop.
The test duct vss located about 12 feet above grade to avoid sxisting structures close to Unit 1, to 6110~ a straight rM of test duct in sxcess of 100 feet, and to minimire the length of the connections. The diameter of the test duct vss chosen to be 3 feet. At a gas flow of 50 ft/sec, the test scale vould be tquivslsnt to tbout 7 HWe, somewhat larger than required by the PEDA. The larger duct size lessened the problems of deposits inside the duct and permitted workers to go inside for inspection and cleaning.
‘~ Since the facility vould have to operate ia.‘viattr, all lime slurry ~. preparation sad hsndling equipment and the principal iastrumtnts and controls
vtrt suclostd in a heated building.
- Operation of the test facility could aot interfere with the operation of the Campbell plant since the Last facility simply vithdrev a slipstream of flue _, gas from the plant’s ductvork and returned it. Isolation dsmpers virh operating platforms snd access ladders vert required where the test duct connected to the ductwork of Unit 1.
i- No sever connection vss permitted to carry off vasttvater from the test
facility. All vssttvsttr vas used tither to make up slurry or to moisten the vsste solids discharged to the dumpster in order to control airborne dust.
Waste solids had to be disposed of off site. The ESP discharged the solids
into a covered dumpster, snd a contractor hauled thsm to a Class 2 disposal site as required.
RB:S266r Part 2
3-4
54

.
.
3.2.2 Overview
As noted, the test facility was designed to (1) vithdrav e slipstream of flue gas from ductvork of Unit 1 and then (2) inject a finely atomized spray of lime slurry into the flue gas es it flowed through a straight run of 3 ft dia.
test duct. After leaving the test duct, the ges discharged into a pilot-scale ESP and then returned to the upstream side of the second-stage ESP in Unit 1.
Figure 3-l is a piping and Instrumentation diagram (P&ID) of the test facility; Figure 3-2 shows the layout of the facility. The duct of the test
facility tied into the ductvork of Campbell Unit 1 just upstream from the first-stage ESP. The test duct entered the pilot plant building and continued as a straight run of pipe for a distance of approximately 130 feet, before curving upvard end entering the pilot-scale ESP. Induced draft fen V-l vithdrev the flue ges from the Unit 1 ductwork, pulled it through the test duct end the pilot-scale ESP, and then discharged It back into the Unit 1 s, ductvork upstream from the plant’s second-stege ESP. Manually operated
dampers vere Installed at the start and end of the test duct vhere it connected to Unit 1 to shut off the flov of flue gas vhen the test duct vas not In oper*tion. The entire test duct ~a.8 Insulated vith Z-inch-thick calcium silfcate to minimize heat loss.
3.2.3 w Storage and l&&?&g
Self-unloading bulk trailers of about ZO-ton capecity delivered pressure hydrated dolomitic lime (PHDL) to the test facility as a fine powder. The trailers discharged the dolomitic lime pneumatically Into storage silo T-5. During unloading, vent gas displaced from the silo passed’through filter F-2,
vhich removed particulates. The filtered vent gas ws then discharged to the atmosphere. Rotary vane feeder U-Z’and eductor M-40 recycled PHDL from the vent filter back to the storage silo.
Rotary vane feeder M-l (under the silo) fed PHDL to inclined acrev conveyor SC-Z, vhich discharged the lime Intd S,OOO-gallon rrlurry makeup tank T-l. ~‘~ Mixer MX-1 was provided In T-l to agitate lime and water to make up a slurry of the desired concentration. During the letter part of the test program,
RR:8266r Part 2

calcitic lime vas brought to the facility in slurry form by tank truck and
delivered directly to T-l. This slurry was adjusted to the desired concentration for test runs.
Slurry transfer pump P-l transferred the slurry from T-l to slurry cyclones CDC-lA and CDC-18, where fine grit vas removed. Degritted lime flowed out the top of the cyclones Into lime slurry feed tanks T-4A and T-4B. The cyclone underflov containing the grit in concentrated slurry discharged Into grit sump
T-2, and then flowed by gravity to grit tank T-3.
The cyclone underflov in the grit tank vas washed to recover lime and to reduce the quantity of vaste solids. Water vas added to the grit tank to dilute the grit concentrate, and agitator MT-Z, mounted on the tank, kept the slurry In suspension. Grit pump P-2 then pumped the grit slurry through cyclone CDC-2, also momted on the grit tank. The dilute slurry of lime in the overflov vent to T-1, and the v&shed grit in the underflow fell back Into T-3.
After the grit had been wsahed, pump P-2 transferred the grit tank contents to a settling box. A flexible hose vas connected to the discharge of P-2 to permit this transfer.
After the grit had settled out In the settling box, the supernatant vas decanted Into a vastevater sump located In the pilot plant building. Sludge vas removed manually from the settling box and taken to the dmpster nsar the pilot-scale ESP.
As necessary, sump pump P-4 transferred water from the wastewater sump to the dumpster to control the dust generated by the discharge of solide to the dumpster from the electrostatic precipitator (ESP) hoppers. This vater,vas
then hauled away vith the solids in the dwspster for offsite disposal. Water
from the sump vas also pumped as needed to tank T-l for use In msking up fresh
lime slurry or to tank T-3 to vash the grit.
. .
,
.
RR:0266r Part 2
3-6 56

/
5 I: I ,
in +
?/ ;: ;I


r-- - -,~
i pmceding Page Blank \ ..___ -_--- - /J

Two progressive cavity pumps, P-3A and P-38, one operating and one spare. circulated the lime slurry from either slurry feed tank through ZO-mesh strainer F-l in II pump-around loop that passed close to the tvo points where slurry vas injected Into the test duct. Pressure controller PIC-101 regulated pump speed to maintain the loop pressure needed to supply the slurry to each Injection point. Orifice FO-1 throttled the excess slurry before it discharged back into the feed tank.
3.2.4 Test Duct
The 3 ft dia. test duct that tied into the ductvork of Campbell Unit 1 just upstream from its first-stage ESP ran south and then turned vest into the pilot plant building. It then mn straight, passing through the building and continuing for over 130 feet, in all, until It turned to enter the pilot-scale ESP. To l nsure a uniform gas flow through the test section, there VA* about 30 feet of duct upstream from the first slurry injection point Md about 100 feet downstream from the eecond injection point Figure 3-3 shows a portion of the test duct.
Flow sensor FE-100 and flow controller FIC-100, located In the duct upstream from the lime Injection, maintained the selected gas flow conaturt by regulating the Inlet vanes of ID fan V-l.
Tvo slurry spray nozzles, using compressed air from the plant a* the driving fluid, vere used to atomize the slurry urd Inject it into the test duct. Figure 3-4 is * diagram of one of the *pray nozzles used during the test.
To achieve the desired pressure at the nozzle , slurry to each spray nozzle vas
throttled through pressure control valve PV-102 or PV-103. Magnetic~flov meter FI-107 and sonic flow meter F-108 measured the slurry flov to the upstream md downstream nozzles, respectively. The preesure of the compressed
air supplied to the nozzles vas regulatsd by pressure control v*lves PCV-104 and PCV-105.
An urtractive on-line analyzer furnished by Lear-Siegler measured the O2 and SO2 concentrations of the gas in the test duct. Sample probes vere located
BR:g266r 3-11 Part 2
( 61
1 Preceding Page Blank ( I
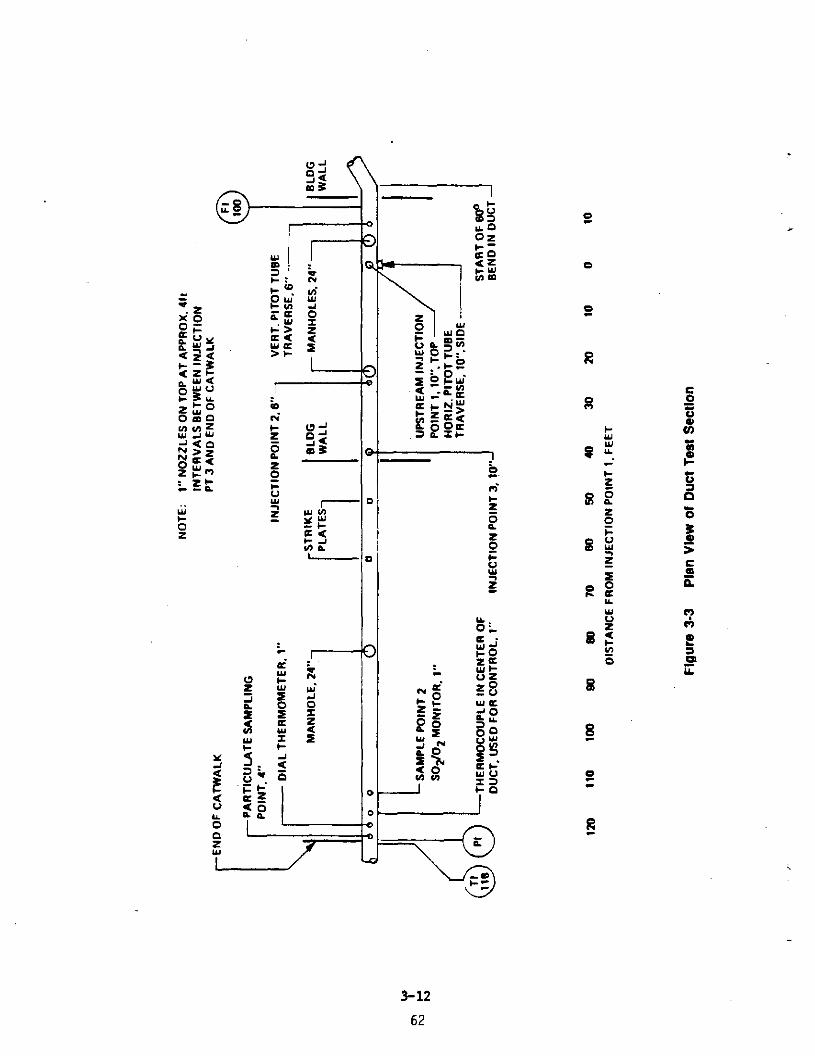
\- -
)
0
)
c- -
,
)
0,
0
0
R
3-12
62

.
u
--- -
3-13
63

upstream from the first lime injection point and dovnstream from the pilot-scale ESP. The analyrer svitched betveen the upstre(Lm and the downstream sample point every 5 minutes. A third sample,point located at the entrance of the ESP was used occasionally to measure SO2 removal across the ESP.
The concentrations of SO2 and O2 were displayed at a control panel located Inside the pilot plant building. Parameters such as gas flov rate, slurry flov rate, and slurry feed pressure vere regulated from this control panel.
Three 24 in. dia. manholes, as shovn in Figure 3-3, vere installed In the straight run of test duct. These mtioles provided access to the nozzles and made it possible to inspect the duct and remove deposits from the duct.
3.2.5 pm
The pilot-scale ESP vas located directly domstream from the test section of the duct. .- All~test loop gas passed through ,this ESP. The ESP had tvo fields in series and tvo hoppers. At 21,000 acfm, the specific collection area (SCA)
; vas 165 ft’/l,OOO acfm. The average velocity past the plates vas close to 3 ft/sec, end the plate spacing vas 12 inches.
I’ Lodge-Cottrell division of Dresser Industries, Inc. supplied the unit. Section 7 describes the ESP more fully.
RR:8266r Part 2
3-14
64

section 4
SNAKEDOWN
The objective of the shakedovn work was to ensure that the test program could be carried out In the completed test facility. This involved the folloving tasks:
0 Checking out the individual items of equipment and the Instrumentation
0 Discovering unforeseen problems
0 Modifying the facility to resolve problems and improve the operation
0 Calibrating the Instruments and controls
0 Learning how to operate the system and developing procedures to obtain the data desired
0 MobIlisIng personnel and training the project team
A successful test program required a smoothly functioning facility and a project team vlth the needed skills and training.
As noted, equipment checkout began in the later part of September 1986. On October 8, construction vork vas officially completed; shakedovn continued through December 22, vhen vork vas suspended for the holidays.
.,’
4.1 MODIFICATIONS TO TliE FACILITY
The shakedovn vork Indicated the need for a rnsnber of modifications:
0 To operate the duct shutoff dampers every day, platforms, and access ladders vere needed.
0 The position of the dumpster that received vaste solids from the electrostatic precipitator (ESP) had to be changed. A vay of moving the dumpster to distribute the load ves also required.
0 One length of the mixing paddles In the vaste solids screv conveyor had to be replaced by a screv flight to keep the conveyor from plugging.
R’1:8311r Part 2
4-l
65

0
0
0
0
0
4.2
The rotary valve under the upstream ESP hopper v*s slowed dovn by installing a larger hriven sprocket. This reduced the load on the motor.
A turning vane v*s installed In the 30’ bend in the duct just upstream from the first injection point. This distributed the gas flov more evenly over the cross section of the duct.
The tvo manhole openings in the duct ahead of the Injection points vere faired over by making saddle-shaped inserts that conformed to the Inside surface of the duct.
The downstream slurry injection point v*s moved from a point 25 feet dovnstream from the upstream point to a point 40 feet dovnstream from the upstream point. Tbls reduced deposits at high upstream Injection rates.
In-line screens vere installed ahead of the lime slurry cyclones to prevent large particles from clogging the fine openings in the cyclones.
OPERATING PROCEDURES
Operating procedures vere developed that enabled the system to run at near-constant conditions for reasonable periods of time. This *ctivIty constituted a large part of the shakedovn effort. Deposition of solids In the duct limited the length of the test periods; the lnItl*l vork focused on mitIgatlng this problem.
To explore f*ctors responsible for deposition and to determine acceptable operating conditions, the system v*s operated for 3 to 4 hours each day. Then, the system v*s shut down and Inspected, conditions Inside the duct vere observed, and the subsequent course of action v*s decided upon. The primary parameters that vere varied Included: types of spray nozzles, Injection r*tes of v*ter and slurry, and g*s flov. As this vork progressed, the S02/02 monitor vas put In service, *nd vays of increasing SO2 removal vere explored.
The folloving procedures and conditions, vhich avoided excessive deposition
and achieved SO2 removals approaching 50 percent, vere selected:
0 Spraklng Systems Casterjet nozzles with a S-50 tip vere used, with air end liquId.orIfices 0.191 in. dia. and 0.163 in. dia., respectively.
RR:g311r Part 2
4-2
66

. - 0 The nozzle was carefully adjusted to point parallel to the
duct ccnterline. This adjustment v*s extremely critical. It v*s best done by getting Inside the duct and observing the pattern of vater sprayed from the nozzle and then pointing the nozzle to vet the duct valls evenly.
0 The flov of slurry or water to the nozzles vas limited to 1.2 gpm through the dovnstream nozzle and about 1.5 gpm through the upstream nozzle to minimize duct deposits.
0 For SO2 removals close to 50 percent, the dovaatream or spraydovn temperature had to be about 160eF, and the lime feed ratio (LFR) about 2.0 moles of hydroxide (OH) per mole of SO2 entering. With the lImit*tion on liquid Injection rates, this meant that gas flov could not exceed about 30 ftlsec and that slurry had to be Injected through both nozzles In series. Single-stage slurry Injection *t SO2 removals close to 50 percent caused major wall depositions.
0 Since the downstream nozzle had a greater tendency to deposit solids on the duct valls, flov to It vas kept constant and flov to the upstream nozzle was varied to keep the dovnstream temperature constant.
0 The buildup of solids was progressive: deposits on the duct valls increased the amount of impingement of spray droplets, thereby accelerating deposition. For this reason. the system v** shut dovn every day and the duct Inspected and cleaned.
4.3 DATA ACQUISITION
The routine operating Information included the data obtained from measurements needed to control the *ystcm and to asses* Its performance. Information on the aalytical ad calibration procedures used can be found in the appendices. The folloving data vere normally recorded by the operator at lo- to 30-minute intervals.
0 Time
0 Gas temperature into the duct, In the downstream end of the duct (upstream from the ESP), and dovnstream from the ESP (upstream from the Induced-draft [ID] fan)
0 Gas flov Into the duct
0 Gas opacity dovnstream from the ID fan
0 Atomlzing air to each nozzle - pressure and flov
RR:g3llr Pert 2
4-3
67

0
0
0
,I_ 0
0
0
Liquid or slurry to each nozzle - pressure and flov
Lime slurry pump-*round loop - pressure, upstream and dovnstream from the screen
Sulfur dioxide concentration in the ges, upstream from the Injection and dovnstream from the ID fan (slso in the dovnstream end of the duct In later tests). Gas v*s sampled altemrtely *t these tvo points on a lo-minute cycle.
Oxygen concentration In the duct *t the same locations ad frequency as SO2 concentration
Voltage and current of e*ch ESP field
Slurry feed tank level, at approximately l- to Z-hour Intervals. The slurry flov meters vere not reliable enough to measure Injection rates for performance calculations, so timed differences in tank levels vere used lnntesd.
Besides the above entries, l *ch dats sheet Indlc*ted the date of the test, objectives or special conditions, nozzle identiflc*tion and location, lime
tne, slurry concentration and allcallnity, and any other significant remarks, occurrences, or observ*tIons.
These data *lloved LFR, SO2 removal, and lime utilIzatIon to be calculated for **ch set of observations. Figure 4-l Is an example of a data sheet.
!. ;
4.4 ESP TESTS
During the shakedovn period, the performance of the ESP vas tested for 5 days, from November 18 to 22, to verify that the ESP vas operating s*tisf*ctorlly. These tests consisted of simultaneously determining the concentration of particulate matter In the g*s upstream and dom8tre.m from the ESP vhlle the system operated at constant conditions. Tests vere carried out vith and
. without Injection of lime.
Without Injection, the particul*te removal efficiency of the RSP v*s approximately 95 percent. As expected, Injection of lime slurry and the resulting lower temper*ture Improved the performance of the ESP enough to
offset the increased loading of solids and maintain the emlesions *bout the same ss they vere vith no Injection. Therefore, the ESP operation, with and
KR:S311r Part 2
4-4
68

i;
?-‘ If-L /r:t7
/I : 33 /I : 3 L. /I -‘40 IL :o 3
IL: 10 /2:/g
ta:31
/L:*P
1:03
I : IP
I: 33
I :‘(k?
I: 03
2:i.S
2’.3)
Part 2
/r90 920
I
/6JO
s.80 /6/O 930 /c 70 P4b /6YO
940 rode 92.6 /A39 cl30 ILao Q/D IL 10 419
lb- 880
9 IC”
6dEP -0 frp 0.52 I =9 OM
OL ESP YJ,dJ kv. 494
Tb.6 “I
5 9 ~ S8/,0 6.. 9 S/6 L
6.0 L~/X 7. 3 %/69 5.9 Lf’?Z
Plgure 4-1. ~gpical mta Sheet for Parametric Tests
4-5
69
Y==-=j h I +-I cg 94’ :
)
IS7
/.r4
157
157
IS7
IS?.
157
157
fS?
fS6

without lime injection, wee judged to be satisfactory. Section 7 presents the
results of these tests in more detail.
The waste products collected by the ESP were a mixture of fine coal ash,
reaction products consisting of sulfates and sulfitea of calcilrm and
,,:_ makmesium, and mreacted lime. The waste was a fine, dry, free-floving
powder. Ao problems were encountered in discharging the material from the ESP 3~, ;, hwpe=s.
RR:g311r Part 2
4-6
70

Section 5
so2 RmovAL TESTS
Numerous tests to remove sulfur dioxide from flue gas using the Confined gone
Dispersion (CZD) process were conducted from JUVJ~~ through July of 1987.
These teats were performed to evaluate epecific parameters and duration
espects observed during the CZD procese. The results of these tests .sre
described In this section.
5.1 PARANRTRIC TESTS
The goal of the parametric test8 was to determine hov certain operating
variables affect the performance of the CZD process and to optimise the
performance. The parametric tests were carried out from January 1987 through
April of 1987.
5.1.1 &REQg&
The way in vhich
studied. and the
the performance was evaluated, the independent ,varIables
test procedures followed ere deecribed below.
Measures of Performance. Three measures of performance were determined:
o Draooition of Solids in the Duct. The objective was to be able to operate the system for prolonged periods without interference from accumulations of solids in the duct. Since deposition must be minimal for a successful commercial process, this measure received the highest priority.
o &l.fur Dioxide Remowl. The objective was 50 percent removal of S02.
o vUrilization. The objective we8 high utilizetion of the lime, but this was given a lover priority at the present stage of development than the other tvo measures.
‘Jest Proceduri. The parametric tests normally lasted for 3 hours, with
conditions kept as constant as possible during that time. However, because
RR:S279r Part 2
5-l
71

the temperature of the incoming gas and the concentrations of SO2 and O2
in the gas could not be controlled, test conditions often varied to some
extent.
The operating procedure Involved maintaining gas flow through the systam all
night to keep the electrastatic precipitator (ESP) vsrm. The ESP vas kept
Warm so that it could be energised without drawing excessive current. During
the night, gas flow vss turned dovn and paver to the ESP was turned off. In
the morning, the gas flow was increased to the maximum for about 10 minutes to
blow out the fly ash that had settled out In the duct overnight. This
procedure would remove the fly ash but not the test deposits. The
induced-draft (ID) fan was then shut off, the shutoff dampers connecting the
system to the large ducts on Unit 1 vere closed, and the three manholes in the
straight run of duct were opened. After the duct had been purged and cooled
vith a ventilating fan, the inside of the duct vs.8 Inspected to determine the
extent of the deposits from the preceding test and the cause of those
deposits. The deposits vere then cleaned out. The quantity of deposits from
the upstream and dovnstream nozzles vss measured by counting the number of
5-gallon buckets of solids that vere removed. A bucket contained 30 to
40 pounds of dry solids.
While the gas flow ves off, the vindovs on the opacity monitor vere cleaned
and the instrument vas zeroed.
When the duct vss clean, the manholes were bolted closed, the shutoff dampers
vere opened, and the ID fan vas started. Gas flow vss maintained at a high
level to keep fly ash from settling out in the duct and to varm up the
system. After about 30 minutes, the ESP vas energized.
.,. The SO2 and O2 monitor vas usually calibrated at this time. Then, vhen
the system vae ready, the gas flov vss adjusted to the desired rate and
injection of lime slurry began.
Tvo nozzles were nearly always used for injection, vith either veter or lime
slurry injected upstream through Point 1 (see Figure 5-l), and lime slurry
‘..
i
RR:0279r 5-2 Part 2

- I
I E G
E
G
I
c
c
t
0
D--
J -0 h
‘-c, cct
x, -
4 f L. G ,. 2 6 f 5 c E z e 5 .- Y
5-3
73

through the dovnstream nozzle. Until January 15, Point 2, 25 feet dovnetream
from Point 1, was used for the downstream nozzle; subsequently, Point 3, 40
feet downstream from Point 1, was alvays used.
During a test, the incoming gas flow was kept constant, as was the flow of
slurry through the dovnstre(Lm spray nozzle. The dovnstream temperature,
~,. measured about 120 feet downstream from Point 1, was kept at the desired level
,: by manual regulation of the flow of water or slurry to the upstream nozzle.
The downstream temperature was measured with a thermocouple having a shield
l/8 inch in diameter. The junction was located at the center of the duct.
Although the temperature over the duct cross section at this point was
reasonably uniform, air leaks from nozzles on the top often caused lower
temperatures *t the top. For this reason, TI 118, which penetrated only
6 inches into the duct, was not normally used for control.
Data from the Instruments were recorded *t lo- to 30-minute intervals during a
test.
_ Flow meters FC 107 and FC 108, which measured liquid flow to the spray nozzles
G were used for control, but the average slurry flow rate was determined by
“2.. measuring the feed tank level and noting the time periodicslly. Figure’4-1
? shoved a typical entry.
After lime was injected for 3 hours (usually), the test was terminated by
shutting off the slurry to the nozzles, turning dovn the gas flow. and
deencrgizing the ESP. The system was then left in this condition overnight.
Appendix F shows how SO2 removal, lime feed ratio (LFR), md lime
1. ‘utIlIzation were calculated from data taken during a test. In most cases,
these measures of performance were calculsted for the data taken at each time
of observation and then averaged for the 3-hour test.
Since the S02/02 monitor switched from one to the other of the two sample
points every 5 minutes, a set of readings usually took about 10 minutes to
record. Changes In incoming gas temperature and in SO2 and O2
concentrations during this lo-minute interval caused some scatter in the data.
RR:8279r ~ 5-4 Parr 2

.
Parameters Studied. The parameters or independent variables studied to
improve performance were the following:
0
0
0
0
0
0
0
5.1.2
flozzle Tvoes and w. To mlnimize deposItion, it was essential that the slurry be atomised into the finest droplets possible. To avoid impingement of these droplets on the valla of the small-diameter duct, the spray angle had to be narrow.
Slurrv Concentratiog. Concentrations from 8 to 22 percent were tested. The IO-mesh slurry screen tended to clog with lime at the higher concentration.
Gas Outlet Tern-. A close spprobch to the sdisbatic s*turatIon temperature, which “as about 125-F (see Appendix F), was necessary for high SO2 removal and high lime utilization as it Is In spray dry FGD systems. Gas outlet temperbture was 160.F In most of the tests and ranged from 150-F to 180-F In the others.
Gas Velnriry. The gas velocity in the ductwork is normally 50 to 60 fthec in power plants at full load, and falls off as load decreases. The gas outlet temperature in most power plants decreases with load as Well. GbS velocities from 20 to 60 ft/see were studied In this series of tests.
-. To keep the tsmpcrbturc downstream constant, the injection r*te was varied with chenges in gas flow md with incoming gas temperature. Increasing the slurry flow to s,nozzle decreased the ratio of sir to slurry and thus eburcd the spray droplets to increbne in aIze. Con*equently, the slurry injection rate affected the droplet size and therefore drying rate and deposition.
-. With a given spray nozzle assembly, higher sir pressures resulted in higher sir flows and finer atomization. In most tests, the sir pressure was kept as high bs possible (90 psig); but in some tests, lover pressures were employed in order to observe their effect.
&,#gr Limrs. Pressure hydrbted dolomitic lime was ueed in most of the pclremetric tests, but samples of several other limes were tasted as well.
Bssults
Test data have been arranged to compare results that show the effect of each
parameter that was varied. The wry each of the parameters cited above was ’
varied is described below. Also described are the effects of prrameter jl,
RR:8279r 5-5 Part 2 75

variation on solids deposition and SO2 removal. Correlations relating
parameter levels to SO2 removal are presented in Section 6, in this part,
and in Section 6 of Part 3.
Fvaluation of Noa . Fifteen different combinations of spray nozzles and
nozzle seeemblIes were tested. Table 5-l lists the nozzle combInstIons;
-Table 5-2 sunmarizes the results of testing them. The most important
criterion of performance in evaluating nozzles was the amount of solids that
they deposited in the duct. To minimise deposition in this small-diameter
duct, very fine stomIz*tion and a narrow spray angle vere required.
Only three of the nozzle combinatIone definitely succeeded in depositing less
than 60 pounds of solids in the duct during a 3-hour test with slurry injected
at the rate of about 1.2 gpm. These combinations, identified as Types 3A, 4,
and 5 in Table 5-1, were all the Spraying Systems Casterjet model with a 5-50
tip. The size of the hir orifice VA* the only difference between them.
Nozzle Type 9 shoved promise, but the fine passages clogged up on the second
trial and, as a result, the nozzle was considered unsuitable. Aozzle Type.10
also shoved promise in!the test on FebNbry 9, but In a second test on
February 23 under the pame conditions. except for b higher sir pressure,
considerably more solii% were deposited. Only when a higher slurry
concentrationives used on March 31 was the Initial result reproduced.
AdditIonal detsile on the performance of these nozzles are contained In
Appendix D, “Duct Inspections,” of the Monthly Technical Progress Reports.
From Table 5-2 it can be seen that deposition is decreased by:
0 Bigher downstream gas temperature. Compare tests on January 20, January 29, and January 30
0 Higher concentrations of lime slurry. Comp*re tests on Februmy 14 and February 16 with tho*e on February 9, February 23, and March 31
0 Lover rates of slurry Injection. Compare teats on January 19, January 20, January 27, and January 28; compare the test on January 29 with that on January 31, and the one on FebNSIy 14 with that on February 16
RR:8279r Part 2
5-6
76

Table 5-l
NOZZLES TESTED
+
. -. DEE 1
2
3
3A
4
5
6
7
8
9 Turbot& 6-orifice nozzle
10 Turbot& single orifice nozzle
11 SSCo 0.232/0.191 with S-60 tip
12 Best Systems Sonimist nozzle, 1100-l
13 SSCo 0.23210.163 with 15200 tip
14 Parker Asnnifin two-fluid nozzle
Spraying Systems Co. 0.150/0.144 in. dia. orifice
(SSCo) CJ nozzle with *ir/liquid orIfIces and a tip with a sharp 0.30 in. dia. circular
Same, but orifices O.lSVO.163 and 0.375 orifice tip
Same, but orifices 0.232/0.163 and 0.375 orifice tip
Same, but 5-50 tip
Same, but orifices 0.185/0.163, 5-50 tip
Same, but orifices 0.191/0.163, 5-50 tip
Same, but orifices 0.185/0.163, 5-30 x 60 tip
Same, orifices 0.191/0.163, 5-30 x 60 tip
Delavan 31325 nozzle, SL-5 tip (air and liquid orifices are fixed In this. nozzle)
.,
RR:8279r Part 2
5-7
77

.
,
<
:
.
5
e
c
3
Y
.
!
R
:
:
”
c
x
-8
E
a
n
4
R
. n
5
5’” x%5:$ :!dJg .,& i,ni:i,i!; L,i,-
17’ :,+o,,
;i3:ziJyrzz ., a:0 r -I.!-1;
o!D,q:.o;1D:(D’*, iiwin,vrln~ti “‘q;ij .#c;c,-: -,-,w, ; j j j j ) j j : j j ~ j
.
0 (Des
! g,g;g;E.e’% 8’8 % r:r’C:CiC a ‘8.8 - -
ILs,R~R~*~X~*$ain
I 1:: 7:“‘” -!N:N X& “=;;,e 0
5-8
78
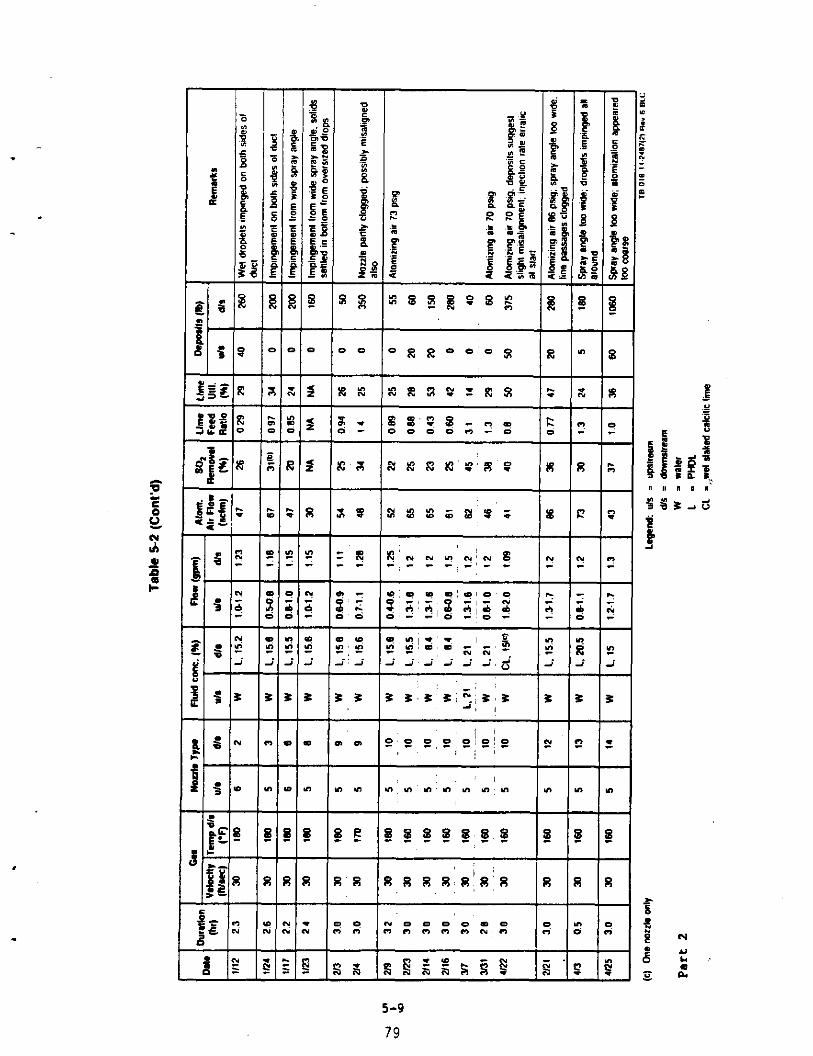
-
yl R %
vl x -
; -
1 -
1 -
5 -
” J -
c -
” -
-
8 - -
- -
, ,
;
e
Y
!
F
:
E i
e Y c Y i -
i
L z
‘) 0
- - Y R i -
x -
0 -
In -
i -
c -
-
n
L I, I
E 3 x 3.L~x;+% 1 I I I (- rn I”;P,P,+B~o
j I I
ul ul Y) WY YI’ul “3 n,m
! e h -
$ -
-
L
-
t -
-
51 I, I. El’8 s R FI X!FL!*iR
~ R
I I I I I
-
-
-
5-9
79

Additional data shoving the effects of these three variables are presented
later In this section.
Effect of Lime Slurrv Concentration. Test results shoving the effect of
varyin lime slurry concentration are presented in Table 5-3. Because all the
conditions except slurry concentration vere the *(Lme in each pair or group of
-’ tests, the LFR in each group increased in proportion to the slurry
concentration. The increase In LFR caused SO2 removal to rise and lime
utIlIz*tion to fall with Increased slurry concentration. The chwe in LPR
and its effect on removal and utIlizatIon masked any influence that
concentration may have on SO2 removal or the rapidity with which a droplet
of slurry captured SO2 in the gas.
Slurry concentration does affect deposition in the duct as noted above. Per >- Table 5-3, in every comparison’but the first, the deposits were less at the
higher concentrations and sIgnifIcantly less in *everrl of the comparisons.
Effect of Dovnstream Gas TemDersture. The downstream gas temperature or, more
correctly, the approach to s*turation, is one of the most important factors In
spray dry FGD processes. Noet of these tests were run at gas outlet
(_~ temperatures between 150’F and 180-F. Si&zc the sdisbstIc saturation
temperature was bboUt 125-F (see Appendix F), the *pprosch to saturation thus
raged from 25.F to 55-F.
Table 5-4 shove that In every comparable group of tests a lover outlet
temperature caused greater SO2 removal and higher lime utilization.
Although this effect was enhanced in some cs8cs by a higher LFR at lover
temperature. in five of the nine comparisons In Table 5-4, LFR is essentially
constant; removal and utIlization are considerably higher at the lover
temperatures.
Deposition in the duct is also much greater bt lover gas outlet temperstures.
as would be expected from the slower drying bt a closer approach to
saturation. In Table 5-4, this effect is shovn most clearly by the weight of
deposits from the dovnstream spray nozzle.
.
RR:8279r --‘- 5-10 Part 2 80

I I
-I- i 2 f
“ia N!N N,N o,l?r 4% .,ii i - - c ,-,- L,v ~
~ ~ ,:ul 0 0 *I”-3 aOn’* #,‘I.? ,:ul 0 0 *I”-3 aOn’* #,‘I.?
:z ~ :z ~
j’ j’
fy-$ fy-$ I I YI n,lll YI n,lll an:* m!n;n n Y) an:* m!n;n n Y)
I I % S’S 8!8 s 8,P P 8 % S’S 8!8 s 8,P P 8 - -,- - - -me,- - - - -,- - - -me,- - -
J&-i-J& 5-11
a1

-
-
ti! I i . -
: D I
-
Lx
-
I.3 * ‘0 .
-
: iR : I
?I” .mc
- ,‘. .(W : . i/$
i
i;% i : j i - T
:~3 3 I
- /
r’n I
i /
I Ie.7 Y
i
!!S i -
I,8 s i
I .o s ’ I-
7
ig -
-
g ? a ?z a i: g > ii g 6 L $ ?: -
: s -
‘D;s - p, c
I 3;: - 2;”
I-
:,: - 9:‘ “i Y i I - - .I a C’!Z i - 7
O;” - *:u
T P’ E -, - -
ilis
e;- -
6 f -
-
I.8
-
S:”
-
-
.e m v, i
T
k: 1
-
N’N -i - -
$y
L ID: q E’S jlj
Sis
Ii j
n ) n I -
8.; n -
9,s -
lil:FI -
2;s
5,: -
-
8 =
- 3 q
-
z P
-
” - * n
-
; s
-
2; 0 -
-
z;r
2 d 0
-
5, ii .i i
-
i: ij
i’ i
“! y:
n; n
-
8’ % - -
-
3: R
-
?’ 0 1;t-z
-
c s -
.
,B j %
,‘; I/ ,I
w,Ic 2 R,iiR i
; ;,Fi
“lNlh ;; -1 -
-: i:yii 2; 2 -
I !, CiLI3
i
/ “;f*
, ! :
n’njvr
$4x
i’R.S 5-12
a2

. -’
. -
Effect of Gas Velocity. Gas velocity, like lime concentration, was not a
truly independent variable in this system, and its effect is therefore
difficult to discern. An increase in gas velocity brings more SO2 into the
system, and unless this is matched by increasing the slurry injection rate,
the LFR decreases. Thus, a change in gas velocity cause8 either LFR or slurry
injection or both to change. Table 5-5 compares tests at different gas
velocities.
In three of the comparative $roups in Table 5-5, the LFR 18 nearly constant
(January 6 end January 6, February 20 and February 19, February 6 end
February ll), but the results are contradictory. The SO2 removal is about
the mane in the firat case, higher at lover velocity in the second cage, end
‘lover et the lover velocity in the third case. It does not appear that Sas
velocity by itself has a strong influence on SO2 removal.
With regard to deposition, there were more deposits et the higher Se8
velocities in some caaee, but these can be explained by higher Blurry
injection ratea in these cases. The slurry injection rate is discueaed
further below.
Effect of Limeection 84x8 . Beceuse it affects the LFR, slurry
injection rate ia not a truly independent variable. Also. increasing the
injection rate through a given nozzle increases the alze of the sprey droplets
considerably. In these nozzles, the atomizing air flov is constant et low to moderate slurry injection rates, end then air flow falls off e8 slurry flow
increases further. Thus, the ratio of air to liquid decreases-eherply with
slurry flow, and thie cause8 poorer etomization and lergtr droplets.
The effect of lar$er droplets on SO2 capture is not expected to be greet, as
the decreased liquid-SW interfacial wee offsets the longer drying time. The;
chaqes in SO2 removal shown in Table 5-6 can be reaeonebly explained by
chmee in LFR or by experimental uncertainty. Hovever, incrtaeed injection ~
rates do significantly increase deposition in this smell duct, aa discovered
during the shakedown. With the type 5 rpray nozzles using air et 90 psig, .
deposition in this duct increased Srtatly ea injection rates were raised pest
RR:8279r 5-13 Pert 2
a3

..i,
! R
-
, c
i F
? =
i ;
j g
; ;r
! -
: - 5
1 ; i i
3
.
10
x
z
z
: =
I c
I ::
; g
B : it
! - c
; - c
I c :
i j
3
w
R
x
2
s
F
.
i
0
.
:
3
Y
Y
a
5
:
2
I Y
F! 5 i i:
! F e e
i ~ x
T- I ~
> 5 0
iii .,, WI>
Au,
+$
:g
.” 5
k! .-
iii
I i; - 820
- /c
!;Z - ” N ii z
~3
;-
I- T :o -
,s :- -
0
7 ‘10 N
3;s 2,g.p: n ” * ” n 4-t-j fS326
“,” ‘p Z’Z -iv
s
;j;; 91n i : L RIR i j i I :,3 I 3
I+ a/n O/n
,~ n Ij-
:a
,I
- I
,y ‘~ N
c D
2
I i

. -
‘43 ?,C ,, r 0 % R
-$-1 !O ‘000 0
Y
P
m c
:
c
;
3
”
Y
2
F
:
5
/ !
! I
I I
. ,
I
; I
1 ( .
~ ; i -
2
I
i
5
:
i
t
c
P
:
i
.
: :
f
3
Y
Y
5
F
:
!
I v
’ 2
! D
! - c
I s
! = 0
! c: I 2
n
i d
: 6 i
m
YI
~ 51
~ ::
~ s
-7-l : R x : 4 a 1
:, 5 >.D
i;x - :! $y G, - - -
- >:(D !’ $ i j
-Y- :~ z
-
-
:!: i d -
-
?’ 0 -
n n -
a:x - -
;I x
L’ e ‘in -
-
I n ,~m e!Jm 1 : : -
! ba ! z x X’S .,v v,-,w -
1!X xLx:x !
jr
, :, :’ 2 ;t:x
. I P 3 a - ! fj - I E 8
5-15
05

4
,* .
1.2 gpm~ to 1.5 gpm. Table 5-6 shows’this clearly when tests on the following dates are compared: January 30 and February 2, January 29 and January 31, February 14 and February 16, and March 26 and March 27. On March 24, the injection rates of 2.1 to 2.3 gpm through the upstream nozzle caused heavy deposition.
Effect of Atomisinn Air Pressure. Since increased air flow improves atomization in a two-fluid spray nozzle, the mauimum air pressure available in this system, 90 peig, was used in nearly all of these tests. One group of comparative tests at different pressures was run, and the results of these tests are shown in Table 5-7. The air pressure was varied to the downstream nozzle and was kept constant at 90 psig to the upstream nozzle. Unfortunately, the incoming gas temperatures were quite different in these three teats so that upstream injection rates and therefore LFR values were also different. The different SO2 removals reported in Table 5-7 probably reflect the different LFF! values rather than any effect of the air pressure.
.’
Deposition from the downstream nozzle showedsome increase as atomising air pressure decreased from 90 to 70 psig. Deposits from the upstream nozzle were greater at the high upstream injection rate8 used.
Performance of Other w. As noted, all the parametric test results discussed so far in this section used the pressure hydrated dolomitic lime (PHDL) supplied by the Rockwell Lime Co. However, four samples of lime from other sources uere tested, (1s shoun in Table 5-8. The first group of tests indicated in Table 5-S used the same PHDL from Rockwell Lime Co. a8 noted above, and these data are included for comparison. The other four samples were a wet slaked calcitic lime as used at the nearby Sims Station, another sample of PHDL from U.S. Gypsum, and two other samples of hydrated calcitie lime that were obtained in dry form and individually slurried; one from U.S. Gypsum, the other from a local .source.
Of these other lime samples, only the wet slaked calcitic lime appeared to
perform better than the Rockwell PHDL. Rot only were the SO2 removal and
lime utilization percentages higher, but the tendency to deposit solids in the .
RR:S279r -. 5-16 Part 2
86

“1” ” - -,-
n:n N qp
-ix
G!i;~ij j j j
5 .a e
t s
r
5-17
87

duct appeared to be significantly leas. For these reasons, the wet slaked calcitic lime was subsequently used in most of the duration tests that are
described in Section 5.2.’
Miscellaneous Tg&g. A number of miscellaueoua tests were conducted to obtain preliminary information on various factors that seemed to have some
- possibility of significance. Rone of these experiments showed any important or significant effect, however. Table 5-9 gives these results, and each experiment is discussed briefly below.
Effect of Freshlv Made Lime Slur=. On February 13, the performance of freshly made slurry was compared with the performance of a batch that was
,about 10 days old. The test was started in the usual manner using the older . . slurry from the large feed tank. The feed pump suction was then shifted to a “- barrel containing freshly made lime slurry having the same concentration as
the older batch. Table 5-9 shows that no significant change in removal or utilization was observed.
Efrect. After the barrel had been ‘. refilled once or twice for the test described above, a gallon of 4 percent
-Y-e acetic acid (vinegar) was added to the slurry in the barrel to test the effectiveness of an organic acid in promoting SO2 removal. As can be seen in Table 5-9, no significant change in removal or utilisation was observed from the acetic acid.
Effect of Addins Caustic to Lime Slum. Two trials in which caustic was added to a small batch of lime slurry during a test failed to show any significant effect on SO2 removal beyond that expected from the increase in
.” LFR reaultiug from the added alkali. Table 5-9 shove the results.
The absence of any observable improvement in removal from the caustic suggests that dissolution of lime is not e rate determining step in the capture of
SO2 under the conditions of this test.
.., RR:g279r Part 2
S-18
88

1 i
I
1
-9 ) 3 -1 I ; -1 : : E
I (!
II III D 5
Y R I I0 -I
I I I 1,x
k z i-4 a,#
“” - - M$
it 5;; i i
J
5 i i
1
; i
a
1c, LX a
2 ,2
:2 2 15 N :r r
I
ii? : ! - f
L 1%
&p Pa -/- Z,Zl;i &ii
I C!P;Z
ni-~*
+j n Il)jvI n n *:./an
!
% .s ~X,X p -- VT
.
5-19
89

Effect of’Addinn Flv Ash to Lime Slum. On April 13, * slurry of waste solids and lime was injected. The *lk*linity of the slurry that was used to calculate LFR was determined by titration.
-~ On April 24, fly *ah (without reaction products) w*s s?.urried with lime and ‘: digested overnight at 160OF. The objective was to discover whether the ‘> products of a reaction between lime and fly *ah were more reactive than lime
alone.
Aeither of these experiments showed any large effect on SO2 capture, and the high solids concentration in the slurry did not appear to decrease deposition in the duct.
meet of Duct DeDOSitS on SQ2a. Ihe test data do not *ppe*r to indicate that deposition in the duct had * significant effect on SO2
.’ removal. A linear regression analysis was made of the remov*l versus time ,;? data for several test6 vhere the deposition v*s heavy md for two tests with
; no deposition (see Appendix 8.6 for details). In most of the cases, removal ; incre*sed *bout 2 percentage points after a Z-hour period. !l’his effect of
x Ydeposition is not entirely consistent, hovever. Remov*l decreased with time :;:in two of the test* with heavy deposits, but it increclsed more than 2 ? percentage points in tvo other tests with heavy deposits. --
Since the average removal from each test was used in analysing the data. these
.: small increases in removal will not rffect the over*11 conclusions, even though they do contribute to the scatter of the data.
.:.s
‘.... ect of CZD Process on Aitronen Oxide Removal. Although removal of nitrogen oxides (NO=) w8 outside the *cope of this project, some easily-carried-out analyses were made (see Appendix B.7). A “oniffer” gas sampling device supplied by Gas Tech was used: it la described in detail in Appendix D.7. The “sniffer” drew * fixed quantity of gas through * small glass sampling tube packed with solid adsorbent that changed color on contact vith ROx.
RR:82791 Part 2
S-20
90

In tests carried out during November 6, 1986, and January 29, 1907, it was suggested that injection of PHDL slurry might be removin8 a significant percentage of the NOX from the flue gas.
To verify these indications of Nom removal, several analyses were performed : vith a Thermoelectron chemiluminescent analyzer on February 10, 1987 (see Appendix G). The analyses showed no indication of any si8nificant removal of
NOx under various conditions of temperature and injection of PEDL elurry into the gas.
These findings deserve further study, particularly in consideration of the substantial NOx removal measured during the Seward station testing (see Part 3).
5.1.3
A goal of this project was to demonstrate 50 percent rsmoval of SO2 from 1 flue gas under operating conditions that could be sustained for long periods ,. of time without building up excessive deposits in the duct. These conditions ware intended to simulate those in a full-scale utility plant ss closely as possfble. Although 50 percent SO2 removal was achieved, prevention of
sxcessive deposition in this small duct required that slurry injection rates % be limited. This condition also required limiting gas velocities to levels below those found in full-scale plants.
ion of Swlection Rate. With injection through two nozzles in series, flow.must be less than 1.2 gpm through the dounstresm nozzle, and somewhat more than 1.2 gpm but less than about 1.5 gpm through the upstream
nozzle. This limitation on slurry injection rates also limited gss flow through the system if the LFR was to be high enough to remove 50 percent of the SO2 at incoming concentrations of 1,400 to 1,600 ppm.
The tests on March 10 and March 11 showed this performance. A 21 percent slurry was injected at about 1.5 gpm through the upstresm nozzle and 1.2 gpm
dounstream with an incoming gas velocity of 30 ft/sec. Sulfur dioxide removal was close to 50 percent, LFR was about 2.9, and lime utilization vas
RR:8279r Part 2
5-21
91

18 percent. After over 13 hours of~operation, 60 pounds of solids was ~. deposited downstream from each nozzle. To lower the amount of deposition in the system, lower injection rates and thus lower gas flows would be required.
The gas velocity at 30 ftlsec in the above test is considerably less than the 50 to 60 ft/eec in most utility ducts. It should be emphasised, however,~ that the short distance between the atomiser and the duct wall in this small
.’ diameter (3 feet) test duct is the primary cause of this limitation on the gas flow. In a full-scale duct, spray nozrles could be mounted further from the duct walls and spray angles could be wider without causing wet droplets to impinge on the walls.
m Utilization. Two limiting cases &overn the rate”~t which a droplet of
Blurry captures SO2 from the gas. The first and fastest case is when ’ diffusion through the gas film at the gas liquid interface limits the rate.
The second and slowest case is when dissolution of lime is controlling the rate (References 5-l and 5-Z).
..~ ..c.v
When the gas film controls the rate, the more rapid dissolutton of lime keeps “- the pA in the aqueous phase high enough that the liquid film on the droplet
G:.‘.“‘-surfrce is alkaline and SO2 resets as soon as it diffuses through the gas -y film. With the liquid phase alkaline, the magnesium hydroxide in dolomitic
lime, which is less soluble than calcium hydroxide, will not dissolve and will .t. therefore not react.
In the other extreme, when dissolution of lime is limiting, the SO2 must, - dissolve in the liquid ph8e.e and reach the film surrounding the lime particles ’ before it CM react. In this case, with free SO2 dissolved in the aqueous
phase, the pA is low and the magnesium hydroxide can dissolve and react. -~ Also, a larger percentage of the lime will react. giving improved utilization.
High removal of SO2 from flue gas from medium- to high-sulfur coals requires lime slurry concentrations of 12 to 15 percent or higher. The high lime slurry concentrations tend to keep the liquid phase alkaline which suppresses
the dissoultion of magnesium hydroxide. Thus, in these cases, high
RR:S279r Part 2
5-22
92

utilizations of dolomitic lime, even of the reactive PHDL, may be herder to :’ achieve then with reactive CL. This may be why the wet slaked CL performed better then the PHDL.
5.2 DURATION TESTS
The goal of the duration tests we8 to operate the system continuously and demonstrate sustained 50 percent SO2 removal. Operating continuously rlso provided the opportunity to identify any problems, such as wear of the nozzles. that might not be observed during shorter testa.
For the duration teas, the facility was operated 24 hr/day, beginning on usy 7. Operatione continued with es few interruptions 58 possible rmtil June 15, when a forced outage on Unit 1 terminated the activity. Testing was + resumed on July 22 until the program we.8 completed on July 28.
It was intended that the system operate continuously from Hey 7 until Mey i9 wbcn the electrostatic precipitator (HP) test8 began. After May 19, the system was to be operated to provide conditions desired for the ESP tent8 that were to be made each day. This involved deily shutdowne for duct cleaning (see below).
The performhnce of the CZD procese during this period of around-the-clock activity is discussed below. Sulfur dioxide removal, lime utilization. deposition of solids in the duct, end the behavior of criticai items of
equipment were again the measures of performance. Section 7 describes the ESP teats that were cerried out et the same time.
The paremetric tests had shown that deposits would collect in the duct unless the slurry injection rate through the downstream spray nozzle we8 kept below
c 1.2 gpm. To have the LFR high enough to echieve 50 percent remove1 of SO2 with this low injection rate, gee flow through the duct had to be limited. Therefore, to,ellow continuous operation with 50 percent SO2 removal. the
, following baseline conditions were established:
RR:8279r 5-23 Part 2
93

0 Incoming gas velocity - 20 ft/sec
0 Downstream temperature - 160’F
0 Slurry injected through two nozzles in series, with flow through the downstream nozzle limited to 0.S gpm ,’
; ~~’ Since the wet slaked calcitic lime had performed somewhat better thrn the ,,_ PXDL, it was used for all the test5 where lime was injected from Hay 12 I..
through July 25.
As noted, the intention we5 to operate the system 55 continuously 5s possible from May 5 to May 19, when the ESP tests began. At first, the duct was to be opened and inspected each day until the absence of deposits showed that the system could run for longer periods without stopping. Although the system did
.~Z run for 15 to 20 hours at 5 time without deposition, 5 number of uusxpected
equipment problems made it advisable to stop each day long enough to inspect the duct and clecm it out when necessary. These problems included frequent
~, sticking of 5 lime slurry control valve, failure of sonic slurry flow meter .I.~ FI-108 to read rccurately at low flows, wear in the stomizer nozzles, and buildup of scale in the piping and nozzles. The last two problems were caused by the longer periods of operation. By the time 511 these probl5m5 had been diagnosed and corrected, it wee time to begin the ESP tests.
f
The ESP tests normally began in the afternoon when the,system was started with the gas flow at 20 ft/sec and brought to the desired temperature by injecting the lime slurry. These conditions were maintained overnight. In the morning, the gas flow and injection rate were increased to the rate for the test, and
’ psrticulate sampling began. Particulate sampling usu5lly required about -‘; 4 hours for two tests. Then the system was shut down; the duct was opened, _ .~-
inspected, 5nd cleaned; and the next test was ready to start. This schedule limited operating periods to about 20 hours, with gas flow at 20 ft/sec for about 16 hours and at 5 higher velocity for 4 hours.
The higher slurry injection rates needed to maintain the desired tunperature at gas flows of 40 to 50 ft/sec caused deposits to build up rapidly in the duct. These deposit5 had to be cleaned out after each episode.
RR:S279r Part 2
5-24
94

Besides v5rying the gas velocity, tests were made at several downstream temperatures and at different concentrations of lime. Aa noted, most of these duration taste used the wet slaked calcitie lime 55 5 12 percent slurry. Table S-10 srmnnaritea these test conditions end the results.
In 5 nmber of teste nothing was injected; in others only water we5 injected. The primary purpose of operating at these conditions was to compare the particulste ramoval in the ESP with the removal when lime was injected. But these conditions also provided M opportunity to better chsrscterize the system 55 to heat loss, air in-leakage, and performance of the sampling systems on the S02/02 monitor. These tests are dascribed in Appendix 8.
When the system was restarted on July 22 after having remained idle for the preceding month, 5 number of problems were encountered, including clogged filters and leeking solenoid valves in the sampling systems for the S02/02 monitor. In addition, the O2 snalyzer responded sluggiehly and often seemed to read too low. Since these problems were not completely resolved during the 6 days of operation, the SO2 and O2 concentrations observed during this period are less reliable than in prior testa.
5.2.2 &@&&
Table S-10 gives the duration test conditions end summarizes the results of
the duration tests. These results supplement the information acquired from the earlier parametric tests , and several items are discussed below.
The apparent SO2 removal when nothing we5 injected provides s,good check on the S02/02 monitor and its sampling system. The negligible removals shown in the test8 on May 31. June 1; June 7, June 8; and June 13, June 14 are evidence that the monitoring system was working well. The 3 percent SO2
removal shown on July 26 indicates that the concentration measurements were less eccurste at that time.
,
.
BR:8279r Part 2
5-25
95

*’ 2;
cr:
3 ? es-4
1x
m
a, id
n
i
n >
h 2
5:
::
9 9 0. ? ? 1 C.-N w--
*1 9 : ,;o; :a dd 6; 9
P 2
i i
;: a ; n n : :
32:: x --- -
,n n .
1, 2, ;d dd
2 :
Li d
n n =i >
* : 2
110 D 000 0
2 r;, co ”
” :: a ; m- - - 3; >
a DI .: i
z
ti
n 2 n 2
::
2
? “,
“, a >
-n . . zz 2;
2 ti
n > n :
%
s
3 &
P I “, 3i
,

2 xxx 0:x 2 3 “m- em- - -
RX S:RX xxx xx ::
5-27
97

0 t 39 *a -- ;:
?? +?? 43 -?.A -*i “<
, , “3 91: 3rd “--
? ? ? 1 1 4 ? mn -cI -0.3
%, % 00 - -
n .* e; nn?. 3 - -
c
s
5 z
z .rv n -g -
:: - n’ 5 i > 35 2

,
-4*-4?.4n_l ----..- ..” 33 -
jj-j-gjj :gj
nnnnnn nnn . . . . . . . . . 3”“~“” “0”
nn”Yrnn n-n . . . . . . . . . ------ __-
: z z 0, : 2 22 2
5-29
99

The 1 to 2 percent SO2 removal shovn vith vater,only injected on June 1, ‘- June 2; June 14, June 15; and July 22, July 23 is probably due to SO2 capture by bicarbonate in the vater. Residual alkaline material on the inner surface of the duct, and the ESP may have captured some SO2 at these low temperatures also.
‘.. The heavy deposition in the duct on May 12 and on May 13 through Hay 15. compared vith that on May 19 and Play 20, is due in part to the longer period of operation on May 13 through May 15. Reduced atomising air flow v&s another factor. Airy flow to both nozzles vas lover during the first tvo tests than it vas on Play 19 and May 20 and also lover than it had been in earlier tests. The reduced flov vas a result of lime scale that accumulated in the air passages of the spray nozzles. This accumulation reduced the air flov from
48 scfm down to 41 scfm in each nozzle. Washing the nozzles out vith vinegar on May 16 restored the air flov and that contributed to keeping the duct clean on May i9 and May 20.
Comparison of the data from May 19 to May 20 and May 29 to Hay 30 vith those of May 20 to May 21 and May 21 to MAY 22 shove hov higher rates of injection increased deposition.
Increasing the lime concentration decreased deposition, as found earlier. The test on May S should be compsred vith the ones on May 11 and May 12.
Aoszle vear, vhich had not been detected up to this point, nov began to appear with the longer periods of operation. On May 16, it vas observed that the target bolts on both nozzles vere obviously eroded. Slurry entered these nozzles through m orifice vhose uis is perpsndicular to the nozzle center line. The elurry stream impinged onto the flat end of the target bolt and the spray mixed vith the air that jetted in along the nozzle centerline (see Figure 3-3). When the target bolts vere replaced vith bolts having hardened surfaces, no further vear vas obse&ed.
RR:S279r Part 2
S-30
100

Besides the target bolts, the inside edges of the nozzle tip, vhich had been sharp, were found to be rounded. The vorst vorn tip v*s repl*ced vith a new : one.
Ao vear v** detected on the slurry orifice in the nozzles.
-The fact that the slurry cyclone* removed nearly all of the plus 100 mesh grit from *ll the limes used in these teats is very likely the main re**on erosion In the nozzles v*s not found to be more severe.
‘
RR:0279r Part 2
5-31 101
REFERmCES
5-l * Partridge, G. P., Davis, W. T., Crence, 8. H., and Reed, G. D., “Mathematical Model for SO2 Removal in A Spr*y Dry Absorber,” Combustion Flue GAS SO, and IQ, Control Svmvosim, American Institute of Chemical Engineers Rational Meeting, Eouston, Texas, March 29 - April 2, 1987.
..,.’ 54. Kinzey, U. md Barriott, P., “Effects of Droplet Size and Residual Water > . . on SO2 Pemoval in A Spr*y Dryer,” School of Engineers, Olin Ball,
Cornell University, Ithaca, RY (1987).
:I
RB:8279r Part 2
,
5-32
102.

i
Section 6
ARALYSIS OF SO2 REMOVAL DAYA
As pointed out in Section 5, it VAS not possible to isolate most of the variables in this process to determine their effects separately. Therefore
regreenion analysis was used to better find out hov the various paremeters affect the removal of S02. This section describes the regreseion analysis: the program, the variebles selected, and the reeults for both pressure hydreted dolomitic lime (PRTIL) and freshly slaked calcitic lime (CL).
6.1 APPROACH
For the purpose of the regression analysis, data from the parametric tests
were combined with those from the duration tests. For the most pert, the test
data using PADL vere from the parametric tests, vhile those for CL came from the duration tests. Appendix A tells hov the data vere organized for this purpose.
Am described in the teat procedure, the inlet gas iimperature end the inlet SO2 concentration could not be controlled, and they often varied significantly during the 3 hours or longer that A test lasted. boreover, the measured concentrations of SO2 end oxygen vere sometimes subject to Borne uncertainty depending on the state of the gas sampling system. These random variations obscured the effecta of less influential vrriebles such as incoming gas temperature end gas flov rete. For these reasons, regression analysis VAS used to provide A more detailed end more reliable analysis of the date then VAS possible by comparing results of different teste.
6.1.1 -ion A&Qxgis Proerpgl
The linear regression program that vae employed is pert of the Lotus l-2-3, Belesse 2 softvare package. his regression program computes the best velues of coefficients end the constant for an equation that upreeses the value of A
RR:g316r Pert 2
6-l
103

dependent variable AS A series of tks made up of selected independent variables:
Y = a0 + AIXl + A2X2 + A3X3 . . .
Bere Y is the dependent variable or some function of it. The ~‘8 are coefficleuts calculated by the program. The X’s are independent variables or functions of these variables that *re calculated from the data. The best values of the coefficients (A,, A 1, etc.) are such that the sum of the squared differences betveen the observed and calculated values of Y for each data point is minimlzed. (A data point is A complete net of one Y and the corresponding X’P.)
The program vas ~lso set up to calculate the folloving:
0 Square of correlation coefficient, R2, AB A mea&sure of hov vell the d*ta “fits” (1 is A perfect fit; 0 is completely random)
0 Significance of E2 compared to a previous value
0 The value of Y corresponding to the average values of l *ch X
)’ 1 0 The standard error of: each coefficient, the atand*rd X, and the Y estimate
6.1.2 Variables Selecteq
The fraction of SO2 removed, RMVL, is the principal dependent variable uamined . Seven Independent variables were selected for analysis:
” 0 Lime feed retio, LFB
’ :: 0 Outlet gas tamper*ture, Tout
0 Lime slurry concentration, OR, lb eq OH/gallon
0 Incoming gas temperature, Tin
0 SO2 concentration of Incoming gas, SO2, diy ppmv
0 Gas flov rate, GAS, X of FI 100 scale reading (54% corresponds to 30 ft/sec)
0 Lime slurry feed rate, PR, total g*llons/ain to both nozzles
ER:8316r Part 2
6-2 104

. Actually these variables vere not truly independent AS LFR is proportional to the ratio of four others: (FR)(OB)/(GAS)(S~~). Also FR VAS often varied with Tin to keep Tout constant during the course of A test.
Other variable factors not included in the analysis are:
0 Residence time
0 Lime slurry concentration in veight percent
0 Nozzle type
0 Atomized droplet size
0 Atomizlng air presclure and flow. The pressure v*s kept coastsnt At 90 psig, and the flow depended on the nozzle and/or nozzle orifice
The d*t* vere organited into three separate d*t* nets and e*ch *et VAS *n*lyzed *ep*r*tely. These act* vere: PHDL injected through one nozzle, PHDL injected through tvo nozzles, and freshly slaked CL injected through two nozzles.
Both rAtIona and empiric*1 expreerions vere examined to correl*te the d*t*. The r*tion*l exprc*sions have the folloviag ch*r*eteristics:
0 SO2 remor* can not exceed 100 percent
0 SO2 remov*l la sero vhen LPR la zero
6.2 ANALYSIS
6.2.1 EADL One Roa
The data *et for PEDL slurry Injected through one nozzle is shown in Table 6-l. The data on s*ch line *re average values for the run ending *t the RUN END TIFE shown. The PEDL VA* Injected through the dovnstrehm nozzle, and v*ter v** Injected through the upstream nozzle to control the outlet gas tempersture.
The r*tlon*l expression th*t provided the best fit (X2 L 0.783) for these data is:
RR:8316r 6-3

Table 61 CAMPBELL SINGLE-STAGE PHDL INJECTION DATA
LIKE WATER RUN FEED INJ '- LIME INLET OUTLET INLET GAS
RUN END so2 LIME RnTE RATE CONC TEMP TEMP SO2 FLOW DATE TIME RMVL UTIL Lm (gym) (mm (lewgal) (F) (F) (ppmv (8) ----- _____ ___-- ----- ----- w---- ----- --------- ----- ----- ----- ----
01/06 16:OO 23.4% 31.12 0.753 1.04 0.80 0.0437 310 193 1559 01/09 16:23 20.72 31.85 0.651 1.26 1.50 0.0437 296 190 1647 01/14 14:05 24.22 27.1% 0.896 1.22 0.80 0.0437 301 190 1526 01/H 16:50 21.78 25.71 0.844 1.12 1.00 0.0437 306 190 1499 01/16 16:10 18.4# 29.4% 0.646 1.15 1.40 0.0435 293 174 1520 01/29 14:oo 38.92 29.58 1.319 2.09 0.70 0.0431 331 175 1755 01/29~ 14:57 23.92 28.9? 0.925 1.17 0.78 0.0431 290 166 1570 01/30 14:1a 31.21 38.6% 0.809 1.17 1.20 0.0431 294 155 1600 01/31 14:03 37.29. ,33.92 1.099 1.57 1.22 0.0431 325 166 1596 02/02 15:24 40.4% 37.98 1.066 1.52 0.80 0.0431 289 155 1584 02/05 12:45 20.52 21.4% 0.962 1.09 1.00 0.0450 207 166 1515 02/07. 14:45 26.32 29.92 0.916 2.01 1.20 0.0450 299 180 1524 02/10 12:04 24.9% 25.7% 0.966 1.26 0.80 0.0450 290 180 1513 02/10 12:34 15.12 17.52 0.965 1.17 0.80 0.0450 290 217 1567 02/27 14:oo 42.3% 43.8% 0.967 1.27 1.42 0.0433 302 150 1464 03/02 17:35 30.52 22.82 1.341 1.29 1.23 0.0593 300 160 1472 03/04‘ 15:40 47.12 35.52 1.326 1.20 1.30 0.0593 290 150 1384 04/06 14:3s 27.9% 24.72 1.132 1.09 0.90 0.0590 276 160 1440 oo/oe 15:55 25.01 27.98 0.898 1.29 0.88 0.0416 280 160 1540 04/09 15:10 42.98 49.98 0.960 '1.20 1.38 0.0416 281 140 1501 04/12: 14:15 21.92 40.4% 0.541 1.27 1.10 0.0217 302 160 1303 04/16 11:45 26.4* 30.02 0.879 1.20 1.50 0.0440 310 160 1550 04/16: 12:15 34.72 37.98 0.916 1.35 1.42 0.0440 311 160 1567 04/16_ 12:50 30.61 35.28 0.970 1.20 1.55 0.0440 313 160 1567 04/23 13:10 30.95 35.1% 0.880 1.08 1.40 0.0435 313 160 1374 04/23". 14~40 34.92 33.4% 1.046 1.17 1.50 0.0464 316 160 1339 04/23:,.. 15:40 32.92 34.02 0.964 1.17 1.53 0.0464 317 160 1361 % :.
MINIMU? = 15.1% 17.52 0.541 1.04 0.70 0.0217 276 140 1303 MAXIMDM = 47.12 49.98 1.341. 2.09 1.55 0.0593 331 217 1755 AVERAGE - 29.48 31.72 0.935 1.29 1.15 0.0447 300 167 1512
(a) PliDL injected downstream, water injected upstream. (b) Data are average values for the run ending at the RUN END TIME shown. (c) SO2 concentration is on a dry basis.
50 j 67 54 54 71 54 54 54 54 54 54 90 54 54 54 53 54 54 54 54 54 54 54 54 54 54 54
50 90 56
‘I
Part 2 6-4
106

where A _ (1 - e.9 (Tin) l q. Hll-2a
(Tout - 125)“‘J
Here LFE is not wed directly but ia expressed a8 1 - e-Lm which reflect8 its effect more realistically then a simple linear relationship (we Appendix F-8). Aleo, the outlet gas temperature term has been modified to (Tout - 125)“‘5. (Tout - 125) approximates the approach to eaturation temperature (AST) which is a principal variable in spray dry FGD systems.
(AST is eometimes substituted for [Tout - 1251 in thie eection.) The exponent 0.5 vae used to reduce the variable’s influence in the equation at its higher values, and vae determined empirically. The equation number, eq. Nil-2a, identifies the caee variation number for reference.
A plot of calculated vereue actual SO2 removal ie ahovn in Figure 6-1. This plot gives a vieual indication of the scatter in the data end how vell the equation fits. The straight line is the locus of points having identical calculated and measured values. It is m the beet line through the points ehovn. TMs plot shove a elight bias in that the calculated removal ie high at low actual removal, and low at high actual removal.
Predictions of SO2 removal vereua LFB ?t.ASTs of 35.F and 55.F for this equation arc shovn in Figure 6-2.
When an SO2 term is added to the numerator of cq. Ml-2a, U2 decreases to 0.758 indicating a poorer fit of the data. Changing (Tout - 125) OS5 to (Tout - 125)“’ decreaeee P2 to 0.679, indicating a significmtly poorer fit.
The empirical exprcesion that provided the best fit (a2 = 0.827) for these data is:
RMVL = 0.167 + 0.0619 (1 - l -LFB) - 0.0516 (Tout - 12S)Os5 + 2.98(0H) + O.O00947(Tin) - 3.66 I 10-s(S02) - O.O0237(GAS) + O.l47(Fp)
l q. ns-3
RR:8316r Part 2
6-5
107

0 “W z’ -
I’
Part 2
iofiowatl 205 P~3DlnJiD3
6-6
108

9 N
(9
In ,’
* ,’
c‘!
9
09 0
cn d
s 0
N 6
9 0
Part 2
ID-~OU 20s pwtnv3
6-7
109

This ca.8e use8 all eaven of the independent variables. The plot of calculated versus actual SO2 removal is shown in Figure 6-3. This plot show less bias than the plot for the rational expression.
6.2.2 m in lb0 Ao!u&
The data Bet for PHDL injected through two nozzles is ehoun in Table 6-i.
The rational expression that provided the beat fit (P2 = 0.723) for these data is:
- = , _ e-o.os74s
eq. D15-2a
A plot of calculated vermm actual SO2 removal 16 shown in Figure 6-4. This plot shows a similar biae ae the plot for PEtDL injected through one nozzle.
Adding an SO2 term to the numerator decreased R2 to 0;714; adding an SO2 term to the~denominator decreaeed P2 to 0.624. Substituting (Tout - 125joe5 for (Tout - 125) decreased R2 to 0.650.
Predictions of SO2 removal verem LFR at ASTa of 35°F and 55'F for this equation are shown in Figure 6-5. Figure 6-6 shows predictions of SO2 removal at a fixed AST of 35-F with inlet temperature aa a parameter.
The eupirical expression that provided the best fit (a2 = 0.848) for these data is:
RHVL I -0.236 + 0.1625 (1 - e-LFR) - 0.1093 (Tout - lZSIO.5 + 3.28(OE) + O.O0268(Tin) t 1.59 f 10-4(S02) - 5.05 x10⁻⁴(GAs) + O.O188(FR) eq. D3-3
. .
The plot of calculated versus actual SO2 ramoval is shoun in Figure 6-7. Little bias is shown in this plot. Figure 6-8 shova predictions of SO2
removal veraus LPR at ASTs of 35.F and 55-F for this equation.
BR:8316r Part 2
6-8
110
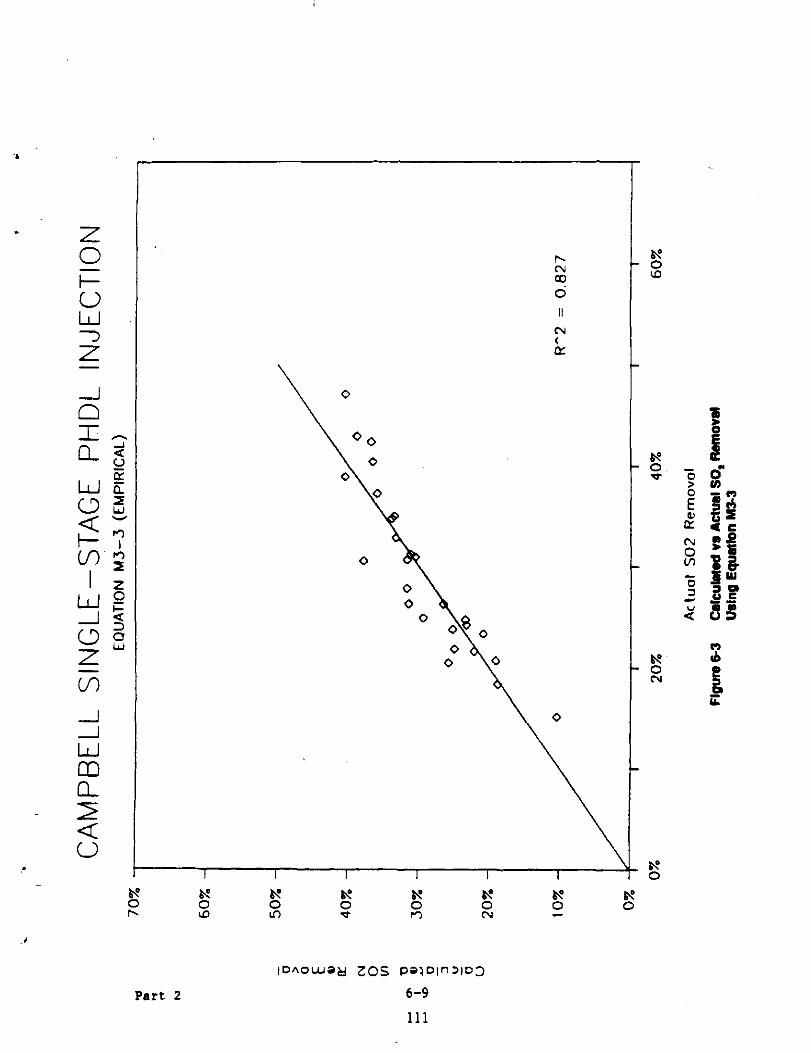
w m
,’
Part 2
ID~OWO&l 20s Pa~oln~lo3
6-9
111

Table 6-Z CAMPBELL TWO-STAGE PHDL INJECTION DATA
LI13E RUN 'FEED LIME INLET OUTLET INLET GAS I
RUN END so2 LIME RATE CONC TEMP TEMP so2 FLQW DATE TIME RENL UTIL LFR (mm) (h/gal) (F) (F) (ppmv) (0:
--m-m ----- ----- ----- ----- ----- ------_-- ----- ----- ------ ----
02/05 14 : 45 35.4% 21.2% 02/05 15:45 46.5% 20.3% 02/05 1s:20 49.5% 26.2% 02/06 13:00 43.5% 25.4% 02/D6 15: 34 47.3% 23.6% 02/10 13: 04 27.3% 16.9% 02/10 13:34 43.0% 25.7% 02/10 14:32 47.4% 25.2% 02/11 13:21 52.2% 31.3% 02/12 14:1a 39.9% 45.4% 02/u 14:15 29.5% 36.4% 02/19 16:lO 42.2% 23.1% 02/20 15:35 49.5% 29.4% 02/25 15:40 46.5% 25.2% 02/26 12:30 45.5% 23.0% 03/D3 14:10 46.1% 17.8% 03/07 12:45 45.0% 14.7% 03/07 13:45 48.1% 15.3% 03/10 16:45 50.1% 18.0% D3/21 13:10 61.8% 17.4% 03/23 15:oo 59.6% 18.6% 03/24 14:40 51.5% 18.8% D3/28 14:10 47.7% 15.8% D4/Dl 15:20 35.0% 13.7% 04/1D 16:15 39.3% 22.3% 04/14 17:55 38.0% 37.8% 04/15 16:lO 42.5% 21.1% OS/O7 23:30 41.3% 22.3% OS/O8 06:DO 51.5% 27.3% D5/08 22:30 46.9% 17.4% OS/O9 oa:oo 45.5% 17.2% 05/10 00:10 46.8% 18.3% 05/10 07:4D 60.1% 19.1% D5/10 12:15 50.0% 18.3% D5/10 17:45 43.51 19.7% D5/11 DO:55 64.0% 24.3% OS/l2 13:05 40.6% 29.1% 07/27 00:20 17.0% 12.2% 07/27 02:SD 25.8% 22.3% 07/27 D6:20 47.0% 29.2% 07/27 D9:55 56.4% 27.1% 07/27 12:OD 55.5% 27.7%
1.675 2.295 2.158 1.717 2.001 1.615 1.674 1.883 1.671 0.879 0.812 1.825 1.688 1.852 1.987 2.586 3.067 3.151 2.789 3.544 3.246 3.073 3.025 2.203 1.761 1.006 2.018 1.851 1.888 2.700 2.661 2.568 3.194 2.739 2.214 2.637 1.395 1.402 1.159 1.612 2.084 2.006
2.23 0.0450 290 165 1540 2.54 0.0450 291 156 1502 1.89 0.0450 294 155 1478 2.59 0.0450 302 163 1673 2.51 0.0450 306 160 1680 2.13 0.0450 290 180 1527 2.40 0.0450 290 160 1473 2.04 0.0477 290 160 1497 4.06 0.0450 280 156 1583 4.39 0.0220 303 157 1622 2.18 0.0226 286 160 1566 2.48 0.0433 300 160 1497 1.18 0.0433 303 160 1569 2.55 0.0433 298 160 1537 2.55 0.0433 295 160 1434 2.38 0.0593 287 160 1406 2.82 0.0593 298 160 1403 2.54 0.0593 302 160 1331 2.55 0.0593 298 162 1403 3.17 0.0614 324 160 1414 3.02 0.0614 315 160 1471 3.04 0.0614 315 160 1566 2.97 0.0580 297 160 1467 0.88 0.0580 267 160 1331 3.22 0.0416 293 160 1468 2.60 0.0226 307 160 1503 1.72 0.0440 311 160 1447 1.59 0.0436 301 160 1358 1.63 0.0436 327 160 1365 1.67 0.0574 309 160 1387 1.59 0.0574 291 160 1327 1.52 0.0574 298 160 1360 1.95 0.0574 331 160 1363 1.69 0.0574 315 170 1360 1.37 0.0574 292 170 1374 1.63 0.0574 290 150 1366 1.50 0.0330 301 160 1371 1.23 0.0432 280 180 1455 1.11 0.0432 288 180 1560 1.61 0.0432 284 160 1626 2.96 0.0432 300 160 1543 4.60 0.0432 304 160 1528
54 .a 54 48 54 48 54 54 48 90 90 54 54 26 54 54 54
:: 54 54 54 54 54
:; 54 36 36 36 36 36 36 36 36 36 36 36 36 36 36 54 88
MINIMUM - 17.0% 12.2% 0.812 0.88 0.0220 267 150 1327 24 rmxIMuH = 64.0% 45.4% 3.544 4.60 0.0614 331 180 1680 90 AVERAGE = 45.4% 22.9% 2.126 2.29 0.0478 299 162 1470 49
(a) PHDL injection only; no water injection. (b) Data are average values for the run ending at the RUN END TIME shown. (c) SO2 concentration is on a dry hmts.
Part 2 b-10
112

0
\ 0
i
Part 2
lonowatl 20s Poaoln>lD3
6-U
113

F.
Z: 0 i= i> W
f -
J, D
W,. 2
Part 2
ID--~I 20s wawn~103 6-12
114

i
Part 2
IDAOW~~ 20s pawnaD
6-13
115

Part 2
!D+.OWOH 20s Pwoln’lD3
6-14
116

.
IDAUW~~ zos paawn
Part 2 6-15
117

6.2.3 CL in Two AozEles
The date set for CL injected through tvo nozzles is shown in Table 6-3.
,,. The rational expression that provided the best fit (R2 = 0.644) for these data is:
- = , _ o.7.91. IO.9
whcrc c = (L~)(Tin)(S~~
(Tout - 125)”
eq. ClO-lla
Here LFR is used directly, inlet SO2 concentration is included in the ~:? -~numerator..and-thesquare root of the AS1 is used in the denominator.
A plot of calculated versus actual SO2 removal is shown in Figure 6-9. This plot also shows a bias in that calculated SO2 ryoval is high.at lov actual removal, and lov at high actual removal.
, Deleting S02.in the numerator decreases R2 to 0.522; moving it to the denominator decreasea If2 to 0.268. Substituting (Tout - 125) for (Tout -
-y 125)Oe5 dtcreaeta P2 to 0.613.
Predictions of SO2 removal versa8 LFR at ASTe of 35-P. and 55.F for this equation are shovn in Figure 6-10. Predictions of SO2 removal versus LFR at a fixed AST of 35-F with inlet SO2 concentration as a parameter are shown in Figure 6-11.
i The empirical expression that provided the best fit (P!’ = 0.722) for the CL data net is:
RlWL - -0.645 + 0.387 (1 - emLpB) - 0.0834 (Tout - 125) + 5.51(OA) + O.O0264(Tin) + O.O00274(SO2) - O.O0214(GAS) + O.OSgSU’R) l q. C3-3
The plot of calculated versus actual SO2 removal is shovn in Figure 6-12. Figure 6-13 shows predictions of SO2 removal versus LPR at ASTs of 35.F and 55.F for this equation.
.
-.
.
RR:g316r Part 2
6-16
118

I
Tablr b3 CAMPBELL TWO-STAGE CL INJECllON DATA
LIME RUN FEED LIME INLET OUTLET INLET GAS
RUN END so2 LIME RATE CONC TEMP TEMP so2 FLOW DATE TIME RMVL UTIL LFR (gpm) (teq/gal) (F) (F) (ppmv) (0)
---me --mm- ----- --m-w ----- ----- --------- ----- -e--- ------ -e-e
04/18 12:46 42.78 45.88 0.920 2.64 0.0192 310 160 1420 04/21 15:10 67.08 32.78 2.046 3.00 0.0358 319 162 1350 OS/13 10:10 42.78 41.78 1.036 1.49 0.0271 290 160 1412 05/13 12:40 43.78 36.88 1.188 1.59 0.0271 304 160 1402 OS/13 23:45 51.18 38.58 1.326 1.76 0.0276 310 160 1415 OS/14 13:15 52.48 41.98 1.253 1.55 0.0276 301 160 1320 05/15 10:45 53.38 41.68 1.282 1.65 0.0276 305 160 1373 05/16 09:40 46.28 42.58 1.087 1.50 0.0276 289 160 1381 OS/l7 07:45 35.68 31.08 1.149 1.45 0.0276 295 170 1346 05/lB 0a:oo 47.98 42.48 1.138 2.18 0.0311 282 160 1359 OS/l0 16: 45 41.58 38.68 1.077 1.43 0.0281 288 160 1440 OS/l6 23:45 36.08 33.78 1.077 1.35 0.0281 280 160 1367 OS/19 10:30 44.88 39.98 1.123 1.45 0.0281 275 150 1404 OS/20 01:30 42.18 33.08 1.276 1.50 0.0286, 299 160 1299 OS/20 10:30 46.48 32.08 1.449 1.66 0.0266 301 160 1266 OS/20 13:48 48.58 39.78 1.225 1.51 0.0286 296 160 1370 0.5/ 2 1 05:10 40.48 40.58 1.195 1.56 0.0286 301 160 1461 OS/21 08:10 48.08 38.48 1.248 1.68 0.0286 294 160 1470 05/21 12:oo 60.98 43.98 1.390 3.60 0.0286 308 160 1419 05/22 02:35 60.58 44.08 1.380 2.78 0.0275 311 160 1429 05/22 07:35 56.98 43.98 1.295 2.58 0.0275 302 160 1412 OS/22 12:30. 58.68 43.18 1.359 4.44 0.0275 302 160 1422 05/23 07:40 48.32 40.38 1.200 1.60 0.0275 298 160 1417 05/23 11:25 63.38 44.78 1.415 2.84 0.0275 322 160 1427 OS/24 12:04 35.78 30.28 1.182 1.52 0.0292 295 160 1362 OS/25 03:55 34.82 26.58 1.334 1.56 0.0287 288 160 1303 OS/25 oa:so 32.88 26.48 1.155 1.36 0.02B7 282 160 1306 OS/26 02:20 42.08 42.58 0.988 1.49 0.0286 207 160 1564 05/26 07:20 36.58 43.78 0.837 0.90 0.0286 270 160 1617 05/26 09:10 40.88 43.78 0.932 1.30 0.0206 274 160 1540 05/26 11:05 46.88 44.48 1.057 3.65 0.0286 280 160 1560 OS/26 12:40 50.78 46.38 1.094 3.65 0.0286 285 160 1507 OS/26 22:45 44.48 43.88 1.016 1.51 0.0272 294 160 1562 05/27 07:15 61.08 52.08 1.173 1.80 0.0272 303 150 1611 OS/27 12:30 59.38 49.68 1.197 4.42 0.0272 306 150 1587 05/27 22:55 38.58 33.68 1.147 1.61 0.0281 310 170 1523 05/2B 06:55 39.08 36.88 1.060 1.53 0.0281 309 170 1566 05/2B 10:10 42.68 37.58 1.297 3.78 0.0281 299 170 1605 OS/28 11:20 44.18 41.18 1.071 3.70 0.0281 305 170 1565 OS/28 12:55 60.88 47.18 1.291 4.70 0.0281 307 150 1517 OS/29 12:05 46.88 36.68 1.278 4.37 0.0271 301 160 1480 OS/29 21:25 50.68 42.48 1.191 1.79 0.0279 313 160 1619 05/30 07:25 48.08 43.28 1.130 1.65 0.0279 303 160 1572 06/02 19:45 63.98 31.88 2.013 1.85 0.0424 300 160 1505 06/02 23:45 64.98 35.18 1.851 1.75 0.0424 299 160 1550 06/03 04:45 60.48 32.68 1.855 1.60 0.0424 209 160 1491 06/03 06:15 54.28 34.78 1.537 1.50 0.0424 281 160 1540 06/03 07:15 60.68 36.28 1.674 1.65 0.0424 295 160 1555
54 54 36 36 36 36 36 36 36 54 36 36 36 36 36 36 36 36 72 54 54 a8 36 54 36 36 36 36 29 36 88 88 36 36 88 36 36 79 08
:“s 36 36 36 36 36 36 36
Part 2 6-17
119

Tabh b3 (Corrl’d)
LIME 'RUN ~'. FEED LIME INLET OUTLET INLET GAS
RUN END so2 LIME RATE CONC TEMP TEMP so2 FL& DATE TIME RMVL VTIL LFR (mm) (#eq/gal) (F) (F) (wnv) (8)
----- ----- -e--m ----- ----- ----- --------- ----- ..---- ----mm -me- 06/03 10:30 70.48 37.18 06/03 11:45 64.08 35.68 06/05 23:30 64.98 49.58 06/06 07:30 62.38 52.58 06/10 22:oo 67.98 38.08 06/11 06:OO 66.78 42.18 06/11 07:30 62.58 39.38 06/12 01:45 54.58 48.98 06/12 ot3:oo 50.08 55.88 06/12 10:05 52.78 47.78 06/12 12:30 52.38 45.98 06/12 21:50 58.08 55.02 06/13 01:50 58.08 52.08 06/13 05:35 60.68 55.98
.06/13 07:05 64.38. *,52.48 06/13 09:oo 54.28 45.28 06/13 12:30 56.88 45.88 07/24 07:35 51.08 46.58 07/24 09:oo 52.78 41.98 07/24 lo:oo 49.38 42.18 07/24 12:15 59.08 43.48 07/24 13:45 63.88 48.18 07/24 14:25 65.68 59.68
1.096 1.811 1.315 1.186 1.793 1.585 1.596 1.116 0.896 1.106 1.140 1.055 1.099 1.088 1.227 1.199 1.242 1.097 1.257 1.170 1.361 1.328 1.101
2.77 0.0399 296 160 1500 54 . 2.77 0.0399 297 160 1570 54 1.73 0.0326 302 160 1658 36 1.63 0.0326 297 160 1624 36 1.80 0.0418 298 160 1623 36 1.67 0.0418 294 160 1646 36 1.60 0.0418 208 160 1553 36 1.66 0.0274 294 160 1579 36 1.36 0.0274 282 160 1601 36 3.90 0.0274 288 160 1520 SS 4.57 0.0274 292 160 1520 100 1.70 0.0264 302 160 1542 36 1.70 0.0264 301 160 1481 36 2.60 0.0264 297 160 1525 54 2.87 0.0264 303 160 1493 54 4.25 0.0264 300 160 1483 88 4.75 0.0264 312 160 1600 SE 1.69 0.0280 304 160 165.9 36 4.23 0.0280 298 160 1480 SS 3.91 0.0280 208 160 1470 80 4.46 0.0280 307 160 1443 80 4.54 0.0280 310 160 1507 90 2.40 0.0260 311 164 1615 54
MINIMVM - 32.88 26.58 0.837 0.98 0.0192 274 150 1266 29 MmmmM = 70.48 59.68 2.046 4.75 0.0424 322 170 1658 100' AVERAGE = 52.28 41.98 1.270 -2.37 0.0299 297 160 1488 51
(a) CL injection only: no water injection. (b) Data are average values for the run ending at the RUN END TIME shown. (c) SO2 concentration is on a dry basis. (d) CL is freshly slaked.
Part 2 6-18
120
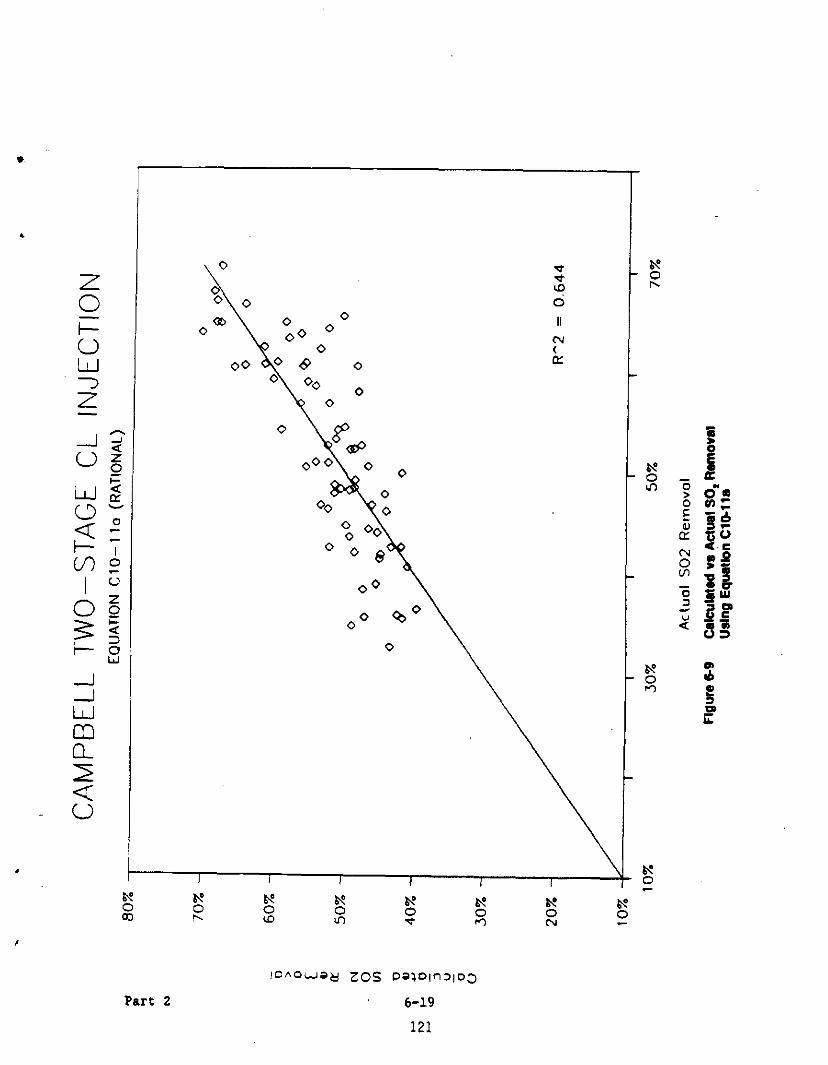
,
I
0
\ 0 0 0
0
Part 2
ro~oiua~ zos Po3oln~lc~
6-19
121

‘9 ‘9 0 0
s s 0 0
2 2 3 3 cy. cy.
5 5 5 5 0 0
9 9 I I I I I I I IO
f # # $ Jg 8 8 g
Part 2
~AOWO~ 20s paqolnqo3
6-20
122
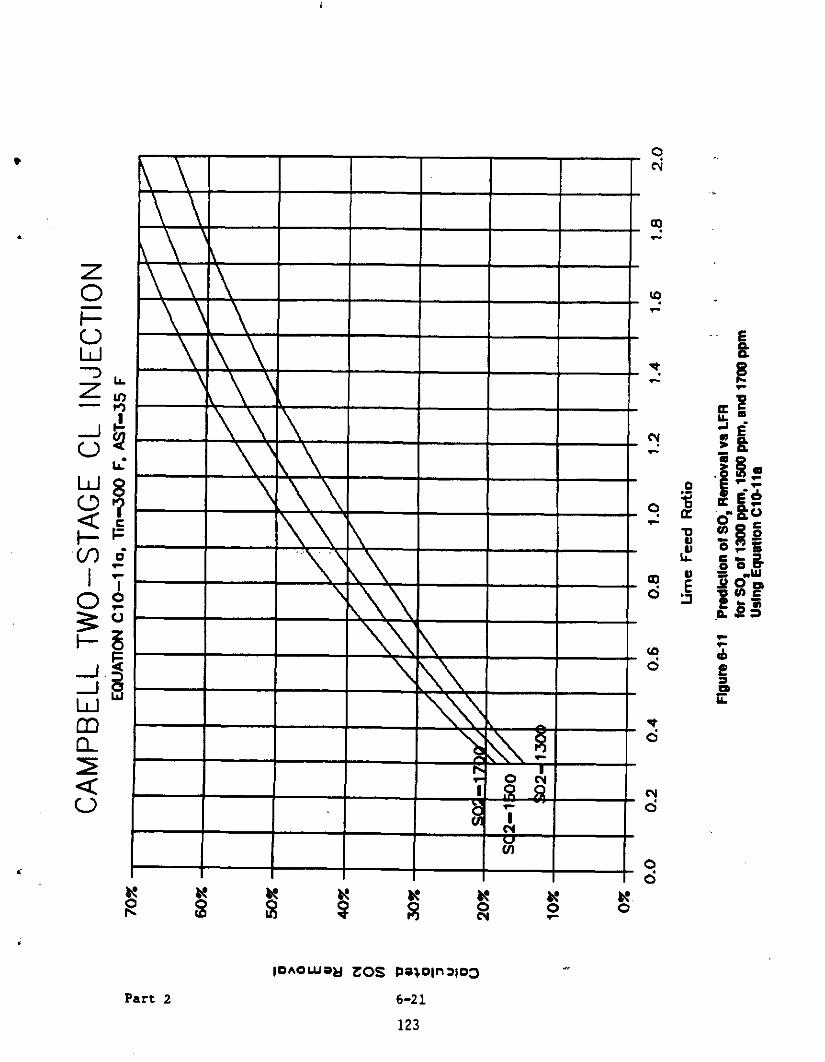
. 9 N
\\
\ \ ‘\ Q ,:
\\\ (D 4
Part 2
IDAQWW 20s PowlnalD3
6-21
123

.
$~ “’ _ ,: L. W
2~
$
w ;.E
2.5
t;;3
1 i ..:g OF +zJ I-W
:
i
i
%-- 0“
,, .
k 0
Q
z \
0 : “8 0 0800 \ a
0 O” 00
0 0
0 O%, 0
0 00 O 0
O0 0 0 0 0 0 - 0%
0
,.,.li 0
8
do 1 0 00
0 0
.
\
Part 2
; ,_ lDhOWa&l 20s PalDln~lD3
6-22
124

10~owa~ 20s po3oln3le3
Part 2 6-23
125

6.3 DISCUSSION
lko important independent variables in spray dry FGD systems are LFR and outlet temperature, or more correctly MT, vhich is approximated by (Tout - 125) in theee experiments. Figures 6-2, 6-5, and 6-10 show SO2 remove1 e8 e function of LFR for two values of AST for the rational expressions that gave the beet fit for the three data sets. A strong dependence of SO2 removal on both LFR and AST is seen in theee figures.
Figure 6-5, for PIiTlL injected in both nozzles, ehovs the strongest dependence of SO2 removal on AST because the AST term has e power of one in the expression for this data versue a power of one-half for the expreeeions for the other two dete sets.
~, Figures 6-14 and 6-15 are plots of lime utilization versus lime concentration for two-stage injection of PBDL end CL, respectively. These plots show that lime utilization decreases vith increasing lime concentration. Since, by
definition, lime utilization times LFR equals SO2 removal, this implies that, at e given LFX, SO2 removal will decrease vith increasing lime
.~ . concentration (assuming other variables are held constant).
This phenomenon explains vhy the SO2 removal performance of PHDL wee better .vhen injected through tvo nozzles then through e single nozzle with another
’ nozzle for water injection ee shown by comparing Figure 6-2 and 6-5. For e liven operating condition, the concentration of lime injected throu$h l single nozzle had to be higher then that injected through two nozzles bsceuee the additional water injected through the second nozzle wee not used to dilute the
,,,.:, lime - This lnereaae in feed solids results in poorer lime utilizetion end, therefore, poorer SO2 removal perfonnence.
A comparison of Figure 6-10 with Figures 6-2 and 6-5 shows thet SO2 removal riecs faster end higher for CL then for PEDL. For the Cempbell test conditions, freehly slaked CL shoved superior SO2 removal pcrformence compared with PHDL.
,
XR:8316r Pert 2
6-24
126

x
X
X
X
5!lxJb:
f
X
I xx
Part 2
uowwm =u!i
6-25
127
X X
-- 8 6
R 0

I I I I I I I I I I I I I I I I I I
8 6
Part 2
uo!w=q!m l q-l
6-26
128

3
.
The regression analysis *l*o identified the gas inlet temperature as *n important variable ** shovn in Figure 6-6.
Increasing Tin in this *y*tem has several effects that l ll tend to increase SO2 removal:
0 A higher Tin vould allow u*e of * more dilute slurry to reach * given LFR. This would provide better lime utiliz*ticn and better SO2 removal performance.
0 In the tests where lime slurry v** injected through two nozzles, the outlet temperature v*s controlled by v*rying the flov of slurry to the upetresm nozzle. Thus, when Tin rose, more slurry vas injected, *nd this incre**ed SO2 removal.
0 An incrccree in Tin increased the *di*b*tie **tur*tion temperature *nd therefore decreased the rppro*ch to eaturation since Tout v*s kept constant. A lover *ppro*ch slowed drying and thus incre**ed SO2 remov*l.
‘0 The m**s flow of incoming gas v** kept coruatmt during * test. The gas flow indic*tor, FI 100, measured the m*s* flow and v** independent of temper*ture. Therefore, when Tin rose, the grs denclity decreased end its velocity incre**ed. The increased velocity g*ve better mixing of sprey droplet* with the g*s, but this effect probably had only * very small influence on SO2 remov*l.
The *hove consideration* suggest that the observed effect of Tin on SO2
removal may be peculiar to this particular system rsther th+ being * general phenomenon.
The regression analysis for the rational expressions identified inlet SO2 concentration ** an important variable for the CL d&ta *et but not for the
PHDL date *et*. As explained earlier, LFR is not truly an independent variable since it is * function of SO?. Since both SO2 end a function of SO2 sre trested *s v*ri*ble*, this m*lysis csnnot determine the true effect
of SO2 inlet concentr*tion on SO2 removal.
.,
The empiric*1 correlations reflect rel*tionships between the independent variables and are difficult to interpret. They also do not extrapolate.
XR:S316r Part 2
6-27
129

All of the plots of calculated ~ereus actual SO2 removal for the rational c
expressions ehov II slight bias in that the calculated removal tends to be high at low actual removal end low et high actual removal.
The rations1 correlations are felt to be better than the empirical correlations for understanding the procees despite the bias end the lover correlation coefficients.
6.4 ADDITIOlOAC AlWaYSIS
Additional enalysea of the Campbell data could be expected to provide improved correlstions. Bovever, at the time the analysis presented here vae being
performed, additional dete vere being obtained at the full-eize CZD test program et Seward station. A decision v&e ‘made to focus additional effort on enalyzing the combined data Bet from both sites.
The reeder is referred to Part 4, Section 1 vhere a correlation of the combined date from both the Campbell and Seward tent ritee ir, described. The correletion ia used to provide preliminary derrign information for the
I full-scale projections presented in Section 2 of Part 4.
BB:8316r Part 2
6-28
130 ,

Section 7
ESP TESTS
A principal objective of this project wee to essess the effect of the reaction products and any unreected lime on the performance of electrostatic precipitators (ESPs). Certain feetors were noted from previous experience with spray dry flue ges deaulfurization (FGD) aysteme operating upstream from
ESPs. When lime slurry ves sprayed into the ductvork. the lover temperature end higher moisture of the gas were expected to more or less offset the effect of the higher loading of solids on ESP performance (References 7-1 and 7-2). If a CZD system also exhibited the eeme tendency, particulate emissions would not be changed much by retrofitting the system, and exteneivt q odificetion of the ESP would not be needed.
As noted, the ESP wee pert. of the test fecility. The ESP we8 energized during all the lime injection tests. ESP ptrformenct wee measured in two series of tests. fhe first series ~~18 performed in November 1986, shortly After
starting up the fecility. The eecond eerie8 of tests we8 carried out from Hay through July 1987, at the end of the program.
In situ q e&surements of the rtsistivity of the particulate metttr were also made toward the end of this second series of tests.
7.1 ESP INSTALLATION
7.1.1 UP Dtsirn Detg&
Lodge-Cottrell division of Dresser Industries, Inc. eupplied the ESP for the
Campbell test facility. This ESP wes one of that company’s standard units of the SPS series of modular easemblies. The precipitator had two collector
fields in series, each with its own trensformer/rtctifier (T/R) and bus
section. Each field had 12 collector pletes spaced on 12-inch ctnters. Each collecting plate, positioned perallel to the gas flow, ves divided into five
RR:82gOr : Pert 2
7-1 131

segments. This design allowed for 20 percent of each colJecting field to be rapped at one time. The emitting electrodes were of rigid frame design. Specific details are listed in Table 7-l.
T.ble 7-l
ESP DESIGN DETAILS
i ”
.
Number of chambers Number of fields Number of T/R6 Number of hoppers Number of g&s p.ss.ges GAS p.ss.ge spacing Effective trt.tment length Plate dimensions Tot.1 collector .re. Tot.1 effective emitting
electrode length Cross section are* for g*. flow T/R e&p&city, c.ch
1 2
2
2
12
12 in. 15 ft (7.5 ft in l .ch field) 9.75 ft high by 7.5 ft long 3,510 ft2
'2;670 ft
117 ft2 60 kVdc .t 80 mAdc
Figure 7-l is A cut6w.y isometric dr.ving of the unit.
GAS from the 130-foot-long test etction trawled through A 3 ft dia. duct snd
turned upward through A 180. bend to enter the ESP, &e ohown in Figures 3-2 and 3-3. Figure 7-l shows the inlet g&s eplitttr vanes in the inlet
‘.i transition piece th&t distributed the g&s flow over the ESP cross section.
As an example of the size of the ESP rtl&tive to the mize of the test duct, if
gas at 300-F comes into the test duct at 50 ft/stc and slurry is injected to cool it to 160-F, the velocity is reduced to about 45 ft/sec. The everage velocity through the ESP is then 2.5 ft/sec, the time in contact with the collector plates 5.8 eec, and the specific collection Ares (SCA) *bout
RR:8280r P*rt 2
7-2
132

,
7-3 133

190 ft'/l.OOO acfm. Although the SCA value is representstivt of many existing ESPs in pouer plants burning medium- to high-sulfur coal, the velocity of the gas flowing past the plates is relatively low (4 to 6 ft/sec being more typic&l), and the cont&ct time relatively high.
7.1.2 ESP
Flue gas for the test f.cility WAS vithdrwn from the side of the ductvork of
Campbell Unit 1, just downstream from M air heater, .a8 described in Section 3. The gas in Unit 1 flovtd dourward through the .ir he.ter, then turned about 135’ and flowed diagonally upvard past the point where the test facility took its gas. Since A scoop did not extend into the large duct, gas vithdr.vn for the test f.cility did not ntcess.rily c.rry the same
concentration of fly ash thst went to the full-scale ESP. Iiovtver, since the purpose of theat tests v&s to comp.re ESP performance with and without injection of lime slurry into the gas, the fact that the fly ash concentration in the gas may h.ve been somewhat different from,th.t in the Unit 1 ductvork was not considered important.
It is noted that Unit 1, reted &t 260 NW, V&S b&se-loaded, .nd its output seldom fell bclov 180 MU, 70 percent of capacity. Therefore, while changing loads may h.vt caused some variations in the composition and p&rticulatt loading of gas entering the test facility, these vsriations should not have been great. Vari.tions in the ash content of the coal utd in the percentage of excess combustion air could also have caused the fly esh concentration in the gas to vary.
Particulate concentr.tions were me.sured .t the pilot ESP inlet during the tests conducted from M&y to July 1987. Table 7-2 lists these concentrations
in order of increasing gas velocity. With no injection, the inlet .sh conctntr.tion YAP usually lover at A higher gas flov rate through the pilot
precipit.tor. These results may be A coincidence bee&use A higher take-off
velocity from the plant ducting would be ucpected to force a higher ptrcsnt.ge of the ash to make the turn into the take-off duct. The average value of 3.35
gr/dscf is somevhat lower than the estimated concentration of 3.9 gr/dsef.~
RR:S2SOr Part 2
7-4
134

3,
., ‘.
Table 7-2
CONCENTRATIONS OF PARTICUIATE NATTER IN FLUE GAS ENTERING THE ESP
Inlet Gas part. concln.
m.(a) into ESP
Vf::i:::l(b) mdrc fl
NO Inlection
23 2
::
ai :i
:i
:'B 2:
:: 2:
:% Estimated concentration of fly ash
if:! in 9.1, 3.9 9rldscf
2.91
:.A: 2:10 2.74
Avg. E!
lniect on 0 at* 0 1” i fW rn
4.24 3.98 2.35 2.26 2.03
w Avg. .
wtion of 10 to 12 Percent CAlc trc L e Slu ry i' in r
,(c) 2(c) :i
4.10 Estimated concentration of 4.88 particulrtes (fly ash, rarction
:i 2:; products. unrrrctrd lime) in gas. 3.9 + 3.2 . 7.1 gr/drcf (see
:i E Appendir F)
2 6:13 5.30
J 1: 1: 6” i
12
i: 16
::
2 49
E 55 47
5.41
:2 5167
i% 5:16 5.69 5.43 5.75
50 60
5.40 5.67 4.96
Avg. H
(a) Tests conducted during May to July 1987. (b) Gas velocity in test duct. upstream of my injection. (c) These tests were parfonned 8t ,n ESP inlet temperature of 146.F. All other
lime injection tests were prrfonned at 160-F.
RR:8281r Part 2
7-5
135

The estimate assumed 10.6 percent aeh in the coal &nd 40 percent excess air. .: It also assumed that 80 percent of the coal ash appeared AS fly ash (see ‘~ Appendix F).
With injection of water, the inlet fly ash concentrations also tend to be .-. lover *t the higher gas velocities. In these c**es, come of the fly *ah WAS
vetted by the injected v*ter and deposited in the test duct before the point - where the concentrations were measured.
When lime slurry v&s injected, the measured concentrations of particulate matter *t the ESP inlet, ~8 listed in Table 7-2, shoved no trend vith gas velocity urd vere all below the estimated value of 7.1 gr/decf. Dtposition of eolids in the duct is probably the principal reason for the lov concentrations.
7.2 ESP TEST PROCEDURES
The method used to determine the concentr&tion of particulate q *tter in the :.
flue gas WAS the same for both series of tests, but the operational procedures were differen;. These procedures are summarized in the following sections.
Y : 7.2.1 Gas SW and Dettrmin*tion of Particulste Conctntratipn z,-*,
The gas VA* sampled &t the inlet and outlet of the ESP &t the 8-e time. The inlet eemples vere taken at the downstream end of the straight duct test section. The ESP outlet samples vere taken just upstream of the induced-draft (ID) fan, vhere the gee flowed dovnv*rd through A ZO-foot run of straight duct.
Ieokinetic samples of gas were withdrawa *t each of six tr*verse pointe-across the croes section of the duct. (The traverse direction for the outlet samples v&s in the same plane es the bend in the duct; about 20 feet upstream.)
Sampling for A given test normally required 60 to 90 minutes.
The sampling procedure, determinstion of particulate concentrations, and calculation of ESP efficiency (the percentage of p*rticul*tt matter in the flue gas at the ESP inlet th&t is removed by the ESP) followed EPA Method 17. Appendix D gives specific details.
RR:82SOr Part 2
7-6 136
c. - 7.2.2 Qperational Procedures
First Series. For the first series of tests, from November 18 to 22, 1986, the system WAS kept v&rm overnight by passing A low flow of flue gas through it, with no injection. At about 0800 hours, gas flow v&s increased and injection of lime began. GAS sampling WAS started AS soon AS possible, after
the desired gas temperature WAS reached end conditions stabilized.
When the first test WAS completed, conditions were adjusted to those desired for the second test (if A second test v&s to be made). The second test usually began about 2 hours later , after thermal equilibrium of the ESP h&d been attained.
After the teats were finished, the system v&s shut dovn, and the duct (but not the ESP) WAS opened, inspected, and cleaned. At the end of the day, A low flow of gas WAS again tstablished to keep the systtm warm and dry overnight.
As noted, these tests took place early in the progrem, &bout 1 month After the shektdovn eterttd.
sScrics. The second series of ESP tests beg&n on May 19, 1987, and
ended on July 22. There van A S-week Interruption from Jlme 14 to July 23 because of a forced outage on Unit 1.
.c
For these tests, the desired test conditions were maintained during the night preceding the test by optmting with injection of lime or water, or with no injection to keep the flue gas temptmturt at the ESP inlet constant at the level desired for the next day’s tests. However, the gas flow v&e kept low during the night (20 ft/atc normally) to ~llov A low lnjeetion rate end avoid deposition of excessive unounto~of solids in the duct. At about 0800 hours, the grs flow van increesed to the rate used in the test and the injection rete
WAS mistd to maintein the ESP inlet tcmptreture constant. During lime slurry injection, the injection mtt WAS sufficient to meet the SO2 removal
objective of at least 50 percent.
RR:8280r Part 2
7-7
137

After approximately 1 hour, whenit was ascertained that stable T/R conditions ‘had been reached, VI (voltage-current) curves were taken with both T/R units
on automatic voltage control (AVC). The AVC units were then net manually at
the maximum sustainable level. The maximum sustainable level wea either just below the level at which excessive arcing occurred, or just belov the maximum voltage or current for each T/R unit, 60 kV or 80 r&A, rcspcctivcly.
Following thie,,the particulate concentration at the ESP inlet and outlet were measured simultaneously to determine the ESP efficiency. During this ESP efficiency test, electrical readings were taken from the front panels of the controllers approximately every 10 to 15 minutes. At the conclusion of the efficiency test, a second set of VI curves was taken as described.
If the efficiency teat was to be replicated, the same operating conditions were held steady until preparations were complete to begin the second test (usually around 1 hour). If a change in operating conditions vaa called for
.:,. (i.e., additional moisture or change in velocity, etc.9 a suitable amount of time was allowed between teats for stebilization of the ~yatem. VI Curves were then run @gain and the test procedure repeated.
i’ Between one and three teata were carried out each day depending on prevailing <
conditions. Generally, the plant was ahut dovn at around 1400 hours each day
to facilitate entry to the test duct for cleaning out the accumulated fly ash and lime deposits.
The ESP vae opened for inepection and cleaning several timca during thie series of teeta. Cleaning consisted of rapping the plates and discharge
Y electrodes manually. and brushing and bloving off deposits where they could be : : reached from the walkway between the tvo sections. A veehdown wee not
: attempted. ,,.
.~ 7.3 TEST UlWLTS
‘Tables 7-3 and 7-4 summsrize results of all the ESP te8t8 carried out et the Campbell test facility. The tests are listed in chronological order vith results from the first series of tests in November 1986 given in Table 7-3 and
.i
BR:8280r Part 2
7-6
138

those from the second series, May to July 1987, given in Table 7-4. The
tables show the effective migration velocity (EMV) of the particulate matter
in the electric field. EMV is e useful parameter in evaluating the performtice of ESPs in collecting different kinds of’psrticulste mdter. The EMV values were calculated using the Deutsch equation, vhich is universally used to predict precipitator performance.
The Deutsch equation is:
I-EFF=1 8
where D = [(z) (E~)(0.02381)(d4k
EFF = wuectioo efficicIlcy. %/loo
SCA = specific cdlection area, ft2/lCKQ acfm EMV= particulate effective migration velocity, a&c k = a factor lo a&m for incrpasing dticulry in collecting additional parkulate as
required collection efficiency increases (Ir usually approximves to 0.5 to 1.0)
For Tebles 7-3 end 7-4, the value of k was taken es 0.5.
The following paSee describe the test results in three sepsrete sections: the first series of tests, the second series of tests with fly esh clone without lime injection (but with injection of water in many tests), end the second series of tests with lime injection.
7.3.1 wt Series of Tests
The tests in Aovember 1986 were cerried out soon after the fecility became operational. The primary purposes were to verify that the ESP vss opereting satisfactorfly end to see if injection of lime elurry upstream of the ESP caused significantly greater emissions. Nine tests vere msde over e 5-day period. Of these tests, tvo were made with no injection, end one vith injection of water only. The remaining six were made with InJection of
slurries of pressure hydreted dolomitic lime (PWL) containing 15 percent
solids. One test, however, used 20 percent PEDL. All ESP efficiency test8 were at test duct &es velocities upstream of eny InjeCtiOn of 45 to 50 ft/sec.
RR:8280r Part 2
7-9
139

; L.>; $2” 253 “3
0 n-, . . : z t?R ;
A
.I.’
140
.
3 2;;: b’-
s:“, ;, 2 22 --- - - -- I
-F4*n 0-0 --- r_- : 0 “8 222 Z8Z z z . . . . . . > . .-s”Tn “TL-,.T n $Z
7-11
141

2 sj
‘E 2 8; Y;-
7-12
142
. .

,
7-13
143


i _ and at ESP inlet temperatures from 275’F down to 16S°F, producing ESP
velocities of 2.2 to 2.7 ft/sec.
i - Table 7-3 shovs that particulate concentrations in the gas leaving the ESP
were not affected much by injecting the lime slurry. Injection of slurry
improved the removal efficiency, compared with no injection, enough to offeet the higher inlet loading.
The one test vith only water injected to cool the gas to 184’F gave the lovest
emissions of all and a ramoval efficiency comparable to that with lime
injection.
The above results were as expected from the experience of other installations
with ESPs cleaning flue gas from spray dry FGD systems.
7.3.2 Second Series of Tests - Without Inlection of I.,&
In the second series of tests, 20 teats were carried out without injection of
lime to provide a basis for evaluating ESP performance vhen lime was
injected. Eleven of these tests were with fly ash only - without any
injection. In the other nine teats, water was injected to bring the gas
temperature down to 160.F. For the tests vith no injection, the gas
temperature ranged from 260-F to 300-F.
Effect of Gas Velocitv and SC&. For the tests with no injection, collection
efficiency ranged from 99.75 percent at a gaa velocity through the ESP of
2.10 ft/sec (238 SCA) to 96.32 percent at 3.41 ft/sec (147 SCA). With
injection of vater, the efficiency was higher: 99.94 percent at 1.79 ftlaec (279 SCA) to 99.47 percent at 2.62 ft/sec (191 SCA). Figure 7-2 shows how the
efficiency fell off with gas velocity, and although the points are scattered,
injection of water (fly ash plus moisture points) clearly increased
efficiency. At a given mass flow of /as, part of the improvement in
efficiency from injection of water is that the gas’ is cooled and the lover
volume and lover velocity through the ESP gives more time for collection of particles. Aowever, Figure 7-2 shows that even at the same velocity,
collection from the cooler moist gas vaa higher. This improved performance
RR:8280r 7-15

vith vater injection may be partially the result of agglomeration of fine
particulate into more easily coll&ted larger particulate.
For the data in Figure 7-2. both ESP fields vere energised to maximum power.
Single-field-only tests with the outlet field de-energised gave an efficiency
of 94.06 percent at 2.03 ft/aee vith no injection in test 24. With water
injection, two single-field tests (tests 27 and 41) gave efficiencies of
‘~ 99.82 percent and 98.83 percent at gas velocities of 1.85 and 2.99.ft/aec,
respectively. Again, moisture injection increased the efficiency.
Figure 7-3 show that the collection efficiency both with and without water
injection improved vith the precipitator’s SCA. This vould be axpected from
the decrease in efficiency with gas velocity since hire SCA varies inversely
with gas velocity. The data plotted in Figure 7-3 are from tests at maximum
? paver; they include tests with both one and tvo fields energised.
‘. Effect of Temoerature. Ao attempt vaa made to evaluate the effect of
1 temperature (other than the gross difference&ith and without vater injection).
:- on either of the set6 of tests without lime injection. For "fly ash + ;’ ~. moisture,” the tamperature vas held at a nominal 160-F.
?A.. _I’~ Under “fly ash only” conditions, the temperature ranged from 26O’F to 300*F,
.~ depending on prevailing boiler conditions. However, as other variables vere
..- changing over this tamperature range (i.e., inlet dust loading, boiler
operational conditions, precipitator gas velocity, etc.), it vas not feasible
to attempt any correlation vith temperature.
The improved efficiency with water injection compared to no injection la due I-, to the lover tamperature, the higher moisture content of the gaa, and, to the
; agglomeration of the fine particulate.
,.- ,. Effect of Power Innut. Fly ash collection efficiency increased by increasing
~.. the paver input, as Figure 7-4 shovs. The most paver vas absorbed in tvo of
the tests vith water injection (fly ash + moisture). These data include teats
vhere power input vas deliberately reduced.
t
RR:8280r 7-16 Part 2 146

;-;q...; I.... I-~&-l ._. I-.1-C-. .+.:,I-c-4.: ..,--1.,-L..,
I - I _ _ , ( : ,
[-“:,l..: ::.~:I :,.::.: I_ ;:::I-“‘: ‘. 5 ‘j,::,/ ~.~:q:‘:~:::’ ;
Flgure 7-2 Efflclency VI Gas VeloctIy, All Two Field Tests
Part 2 7-17
147

!_, L ‘+q
)9;
r . . . L-,.4.&-.L-,.I-LL -,...., .A
Part 2
Figure 7.3 Efficiency VISUS SCA
7-18
148

, .: ._.i -
/..l.JJ.-I..-l...L.l. 1 1 ! J--IL-l--l-Cl-;.
‘L-L, 1 1 ~~-LJ-I-L-.i-J.A,--,I
Figure 7-4 Efficiency Versus Power Input
Part 2 7-19
149

Figure 7-4 Also show that the tests with water injection gave significantly I
higher removal At A given level of power. Typical performance vithout
injection in other ESPs collecting fly Ash is similar to the folloving results
with water injection (Reference 7-3): $
0 100 W/1,000 Acfm, ApprOXi,AAtAl,' 96 percent re!AOPal
0 200 W/1,000 Acfm, ApproximAtely 99.5 percent removal
0 300 W/1,000 scfm, Approximstely 99.6 percent removal
0 400 W/1.000 acfm, ApproximAtely 99.8 percent removA
The fact that thAAA tests without injection gave lower-than-expected
COlleCtion efficiencies At given power inputs is probably due to the design or
OpArAtiOnAl ChArACteristiCA Of this AyAtAm. The poorer performance should not
Affect the comparisons of performance with And vithout injection, the primary
purpose of theAe tAAtA.
VfACt Of RADD~. During the fly-Ash-based testA. An AttAJApt WAS made t0
l vAluAte the effect of rapping on performance. This involved two tests on
~’ June 8, 1987, both vithout injection of vat&. TeAt 37 VAA run AA A “base
.~ leVe1” teAt And ttst 38 WAS run under similar conditions but with collector
rApping net to “continuous* (12 rrps per hour). Table 7-5 AhOW the results. -’
TAble 7-5
EFFECT OF RAPPIAG WITEOUT WATER
GAS Inlet Outlet Collection Power GAS Test Velocity Loading EmiASiOU EffiCiAUCy
~50 Isr/dscf) - (W
37 3.17 2.899 0.049 98.31 13.13 290 286 38 3.23 2.100 0.040 98.10 12.98 305 290
~ As CM be seen, there YAA no AppreciAble observed effect from the increase in
:. rAPPing * t
RR:8280r Part 2
7-20
150

2
7.3.3 s 5 d
It is evident from Table 7-4 that in the tests from May 19 to July 28, ESP
performance WAS considerably poorer when lime VA9 injected than when it WAS
not. A considerable effort was made to find An explAnAtion since these
findings were so contrary to previous findings And to the results of the first
series of tests At the stArt of the progrAm in Aovcmber 1986.
In this subsection, the results of the tests with lime injection Are
presented, followed by A discussion of what may hAVe CAused the
lower-than-Axpected efficiency.
Of the 39 tests with lime injection, 31 were with calcitic lime injection. In
“four tests, A slurry of CAlcitic lime And recycled wAste solids WAS injected.
Two teAt8 used dolomitic lime, And two A mixture of calcitic And dolomitic
limes. Table 7-4 lists the reagents injected And their concenrrations.
Effect of GAS Veloeitv And SCA - With Lime IniectioI&. Figure 7-5 shows ~11 of
the tests with lime injection thAt used the m~xim~ possible input of power.
With calcitic lime injected, the COllACtiOn efficiency (percentAge) fell from
the low 90~ to the mid-80s AA BAA velocity intreAAed from 1.75 to About
2.8 ft/sec through the ESP. Rote in Figure 7-2 that with no injection,
efficiency decreased ~1~0, but from about 99 percent to AbOUt 98 percent AS
gas velocity roAe from 2 to About 3.2 ft/Aec.
In Figure 7-5, the efficiencies for collecting the Aolida from dolomitic lime
injection were AomewhAt higher, And thoAe from calcitic lime plus rAcycled
Aolids were somewhat lover, than the resulta vlth calcitic lime. (The two
tests with mixed lime. tests 63 And 64 in Table 7-3, were ConAidered As
dolomitic lime.)
The three tests vith CAlCitiC lime At lov Velocity, At About 1.2 ft/seC in
refigure 7-5, show considerably higher removal efficiencies, COmpArAble to those
with no injection.
i
RR:8280r Part 2
7-21
151
~ t~l’-i~~~! i-i ; IT-I I I f ( / ii’t I ; ( I / I I I ; :
70.
.I’
bO.O* .., ,J k,i .~~f..~~-,~~:~~‘. jI-1 .; y. ,; .~ [,I i.,,i, ; ’ j .i .- I... SO’ . ..c z:..-7: ; 1 .i ::I . . . .I .:._ ;. : .J ..,, i ..;& y.: i
i .i 77.: i ,.i ,:j ,i : .; , i
, z-z-1 I : ‘, ‘:‘:’ :... 1 i.,;j : i,.: 1 ,! ~,,/, I:. ;I ~,,: _,/ i : i +-
‘<..I .I 1. “r_ : ;. j.., : ~, -: ! .),.. ,Y!.’ i .: j ‘, ., i .~! ._i ‘,,r. j ,. ,‘:.:. f : :
, .1 1~~ j .f,: j.. j ,-i ,cluw w MI--:?6 -a. I ! 4 ., .I I ,
’ I j , ) . i : ,,
0 I’ I :~ :,I : ! ~.. .I 2 ”
, I _.I I
9 1 3 c
‘.
. Fipute 7-5 Efficiency Versus GAS Vdocity
Part 2 7-22
152

Figure 7-6 is A plot of collection efficiency versus SCA for Injection vith
the three slurries: CAlCitiC lime, CAlCitiC lime plus reCyClAd solids, And
dolomitic lime (including the mixed dolomitic And calcitic limes). This plot
includes test dAtA vith only the first field energised for the lover values
of SCA.
Figure 7-6 shows that collection falls off rapidly AA SCA decreases. This
rapid fAllOff of perfOrmAnCA AS SCA deCreASeA (Velocity inCrAAAAA) could be
due to several factors. Included in these factors would be nonuniform gas
velocity distribution causing reentrainment of Ash from the collection plates
or hoppers, and csrryover of wet material into the precipitAtor when injecting
slurry. A lack of sufficient drying time could CAuse electrical trACking And
deteriorlted precipitator performance. ThiA iA diAcuAscd in AUbAAqUent
sections of this report.
Figure 7-6 ~1~0 indICAteS deteriorAted performance At ~11 valocities vhen
injACting SlUrry, AS compared with OpArAtiOn with no slurry injection (see
Figure 7-3). .,.:-,
Effect of GAS m. HOSt Of the tAAtA vith lime injection were Carried
out with the gAA temperAture downstream of injection close to 160.F. Bowever, .i
several testA were BAde At About J70.F and 150-F. TAble 7-6 ShOWA four groups
of these dAtA with the COmpArAblA tCSt8 in order of increAsing twperAture.
The first group, At the higher gas velocity And vith both fields energised,
clearly Shows performance improving AA tsmperAture goes up. The second group,
teats 20 And 18, Ahows just the opponite. The 1ASt two groups, tests 1 And 3
And tests 2 and 4, At lov velocity, Show A slight deerelse in perfOrBAnCe At
the higher temperature.
To decide whether this COntrAdiction is due to random AcAtter in the dAtA or
t0 A rAA1 effect, repliCAted ESP teat8 were tAbUlAted in TAble 7-7. The first
group in Table 7-7 is for conditions that correspond to the first group in
Table 7-6: injection of 12 percent calcitic lime into grs flowing in the duct
at 50 ft/sec. At 160*F, the Average removal In these Seven replicated tests
WAS 86.3 percent. However, the standard dAViAtiOn Among the seven tests is
RR:8280r Part 2
7-23
153
‘LI...l-.,~:Ll,~ .l,~~-Lr,C.,l,h.L,l;.,i A -.:; ‘1 A - .-- -r I I I 1 I ‘-t-. - I, ! I /, ”
/ / 1 / c 4 .G. .I 1 :
_ /, ! ; 1,:: :, i,, F~::
‘; 9>0,:5/!
,.:‘:::$yJ. /. :’ ~” ;: ‘, .’ : i p 1.i ~1
-:;; ;j;:‘. ‘,.,.:_~.._1._!:.,I ~:;_ ‘,, ‘~, ., ..,I~ :,_~ ._‘I ,,.., ;, ‘:.:.
( , ;~rT ~q;r:‘-,:~ ‘y 1’ .:i .‘I .’ ‘. ‘I
c . ‘- -... I A.... I.-I .,.,: t ..:...I L-1 I I : ,!L.,I i, .I 1
,I !li/./(l
::::. ,,,. ~, :;._ I : I. I.
flgun 7-6 Efficiency Venus SCA. All Maximum Power Tests
7-24
154
Part 2

Table 7-6
EFFKT OF GAS TEMPERATURE ON ESP COLLECTION EFFICIENCY
GAS GAS Particulate Concentration Collection TeAt Temp. No. of Velocity fnr/dscfJ Efficiency EMV LcEL~(ft/sec) lnlrr 00
17 159 2 2.74 5.618 0.797 85 -81 10.6 21 161 2 2.85 5.687 0.627 88.97 14.0 19 170 2 2.82 4.512 . 0.412 90.87 15.4
20- 151 1 2.85 5.921 1.642 72.27 9.5 18 171 1 2.99 5.331 1.747 67.23 7.6
1 148 2 1.28 4.098 0.024 99.41 34.1 3 161 2 1.20 4.360 0.038 99.13 27.4
2 148 1 1.24 4.881 0.059 98.79 49.0 4 159 1 1.23 4.050 0.066 98.37 42.4
2.12 percent. If random error8 cause the deviations, 95 percent of AimilAr
‘tests vould be expected to AhOV removals within 2.5 Atrndard deViAtiOnA of the ._
average. Therefore, random variations would cause meAAured~rsmovAlA to vary
bAtVAAn 81.0 And 91.6 percent in 95 percent of AimilAr tests. Thus, the ruye
of removals AhOM in tests 17, 21, And 19 in TAblA 7-6 could very vell be due
to random vAriAtions In the meAsurcments. ‘-
The SAme COnClUSiOn Appliee to the three other pAirA of dAtA in TAble 7-6
shoving COllACtiOn efficiency At different tABpArAtUtAA. Therefore, any
effect of gas temperAture on collection efficiency is too AmAll to be l VidAnt
from the dAtA in TAble 7-6. The tAmperAture range VAA too limited to show Any
decisive effect over the range of precision of the dAtA.
Effect of-I&e ConcentrAtipg. Four tests were carried out At A higher
(17 verAus 12 percent) concentration of ealcitic lime slurry to evaluate the
effect on ESP performance. Tests 28 and 29 were run at 30 ft/rrec (SCA = 2801,
_md tests 44 And 45 were run at 50 ft/sec (SCA = 180).
RR:8280r Part 2
7-25
155

Table 7-7
REPLICATED ESP TESTS
Outlet GM BemOVe Particulate
Test Temp. Efficiency Concentration li& LLET IX) (Rr/dRCf 1
Injection 10 to 12% calcitic lime slurry; rL&.tlal inlet Pa9 vclocitv. 50 ft/eec
7 160 84.6 0.842 8 160 86.8 0.687
12 160 87.5 0.711 21 160 00.97 0.627 46 160 82.69 0.984 50 160 88.0 0.652 54 160 UAZi pgzh
Avg./cad. dev. 86.3112.12 0.76UO.128
A0 injection; Dominal inlet pee velocitv. 50 ft/sec
36 284 98.13 0.058 _ 37 286 98.31 0.049‘=+ 38 290 98.00 0.040 51 304 96.5 0.101 52 289 97.14 0.086 59 278 9Lz4
Avg./std. dev. 97.6410.69 0.064/0.024
Ho injection; nominal ~8s velocitv. 30 ft/sec
23 282 25 280 58 261 60 278
Avg./std. dev.
99.68 0.0127 99.75 0.0111 99.25 0.028 m 99.54/O-22 0.0162/0.0066
election of water or&
42 160 99.47 0.010 43 160 99.60 0.0073 53 160 99.88 0.0024
Avg./std. dev. 99.68/0.21 0.0066/0.0039
Voltane and Current 1st Fld 2nd Fld
IkV/mA)
53144 54/59 60/63 55168 58/60 54/72 59/75 54/76 57/69 54/70 57/52 52/73 57/67 51171
46/69 45/7S 46/67 45/76 47/72 46/77 42/61 43163 44177 44178 41/66 43/66
47/77 45173 46/77 47/75 43/60 44/66 43/60 43/64
54/75 s/75 57/73
54174 s/75 53/73
RR:8280r Part 2
7-26
156

The results for tests 28 and 29 were almost the eeme a8 those from test 9 vith
~12 percent slurry and comparable conditions. Likewise, test 44 with 84.73
percent removal compares closely to the average removal of 86.31 percent from.
the Seven similar tests vith 12 percent slurry (see Table 7-7). Test 45 gave
a lover removal, 80.61 percent, but unstable injection conditions make this
result questionable. Thus, changing the lime concentration from 12 to
17 percent .eeams to have had little effect on the ESP.
Effect of Power Inuut with Lime Inlecth. Figure 7-7 #how how collection
afficiency increased with power input vhen lime was injected. Rote that the
teats at low gas velocity through the ESP (approximately 1.2 ft/sec) are again
plotted separately, since their removal efficiencies were PO much greater than
the other te8ts with lime injection.
The test results shown in Figure 7-7 are for calcitic lime. Test8 include one
field only, those at reduced power , and thoee with different rapping
conditions. The four tests vith recycled solids mixed vith the lime gevc
removals eimilar to thoae vith caleitic lime alone.
In general, the maximum power levels were hi.&er and the increases in
efficiency with power levels were lover with lime injection than they were 1
with fly ash alone (compare Figure 7-7 with Figure 7-4). In addition, at e
specific power input the range of removal efficiencies was much lower for lime
injection than without.
Figures 7-8 and 7-9 also show how collection increased vith power whether lime
was injected or not. They aleo point out that l fficimciee of ESPs collecting
fly ash in coal-fired power plants (Reference 7-3) are typically higher than
those that were observed in these tests with fly ash alone or when lime was
injected.
Effect of Raw-. Four teat8 were made to evaluate the effect of rapping
when calcitic lime (CL) was injected. All,four tests were carried out at a
gas flow of 50 ft/sec, approximately 20,000 acfm at the ESP inlet
(corresponding to a precipitator gas velocity of 2.7 to 3.0 ft/sec and SCA of
173 to 1771, a temperature of 160-F, and with maximum pbver input.
RR:8280r 7-27 Part 2
157

. !’ ” :~i I.. I : ‘, ~:, , : ,-k
, : ’ .: I $+fYi. i ;.I. I. ’ %.b Y:‘:‘. ,i.;Fi I .‘.I,.:: ’ ,‘:‘:::‘.l:‘.i
:~ in L; lj ii i i .: ~,i ~I .i j 1 : I~~;~,: I.. .: ._.I ,y :~. ,I . ..!. ..I ._.+ 1 ._~,. J ..:: ,,I .J :~ !. L-1. :,I,.:, :i.‘:] ..,, L/~,: i j.‘;i .,,j,:, i : :..j ..> _..,
!. i.:: I .‘l~~~! .: ‘j .: ~~, +L:‘. ~..:: ,’ : ,’ : ..I ..: :/ j ‘j I-+~* ,A-
:‘..I,. .1’:::( ,:i. 1~ ‘:-I‘-:: .i ~: ! : i _::_ G W&Mm wch 1 :‘~
‘: ( .:,+.: , ::I ,, ;~-(..,I( i A..! .: ? : , ,, ( ,’ I I 1 ,. I .__! : I .! .I ;.,.I / .: I I ! -, .: I :
pD Irz, .-O&B II) m CaD “L m i$p i
l .
Part 2
Flgue 7-7 Efficiency Vatsus Power Input
7-28
158

100
se
72
?O
6&
66 0 200 400 MO MO -;,
:;. WATTS RR 1 .ow AGCY
Figure 78 Power Versus Collection, lefts with Slurry Injection
. .
Part 2 7-29
159

100
01
\ 0
TYPIChL b 99
OlMCR PLwm
0 99
0
97 0
0
--
95
200 240 280 320 360 400 440
uAllS PER 1 DOD ACFY
400
Figure 7.9 Power Versus Collection, TOSU with No Injection
Part 2
l .
7-30
160
.
The tests Indicated that rapping frequency did not affect performance.
.
i
Test 21 on May 29, 1987, was used es a bese test under normal conditions as
stated above, while test 22 wee carried Out vith no rapping of the collector
plates. Table 7-8 show the results.
Table 7-8
COMPARISON A - EFFECT OF RAPPING
Inlet Outlet Collection Test Loading RmIaeI0n Efficiency L Lilr&a- (Xl
Test 21 5.687 0.627 68.97 Normal rapping Test 22 5.428 0.652 07.99 No rapping
On June 13, 1987, three tests were carried out, test 48 with continuous
collector rapping, end teats 49 and 50 with no rapping. Table 7-9 shows the
results.
Table 7-9
COMPARISON B - EFFECT OF RAPPING
Inlet Outlet Collection Test Loeding Emission Efficiency L f&.tLma(nr/dacf)(X)
Test 40 4.850 0.723 85.09 Continuous rapping Test 49 5.711 0.779 86.36 No rapping Test 50 5.402 0.652 07.93 No rapping
Although there Is Dome variation in inlet loading and emissions during these
three tests, the performance is essentially the w&me. However, It might be
noted that boiler load gradually climbed during the test periods end that rsv
gas temperatures to the system rose from en Initial 290.F to 330-F. It Is
also noted that the Inlet filter sample hsd a distinct “fly ash” coloration
following tests 49 and 50, whereas following test 48. It had e predominately
vhite “lime” coloration.
. .
RR:8280r Part 2
7-31
161

particle Miaration Velocity. Figure 7-10 Is 8 plot of effective migration
velocity (EMV, calculated using the Deutsch equation with k = 0.5) 88 a
function of gas velocity for all the tests made et full power. Injection of
water alone gave the highest migration oelocItIe8, 70 to 150 cm/see. Fly ash
only with no Injection ~8s next highest, from about 40 to 80 cm/see, while
most of the points for calcitic lime Injection were much lover, between 5 and
15 cm/see. l’he five points for lime Injection falling between 25 and
50 cm/aec are the tests at 20 ft/ecc (1.2 ft/sec through the ESP), that gave
collection efficiencies very much higher than the rest of the lime Injection
tests. The three EMV values between 20 and 25 cm/set with lime Injection were
from tests with dolomitic lime and with mixed lime.
From Figure 7-10, EUV seem8 to fall off somevhar 8s the gas velocity
Increases. Actually, according to the assumption of the Deutsch equation, EHV
should remain constent 88 gas velocity chenges.
Figure 7-11, showing EMV 88 8 function of ESP paver Input, gives 8n excellent
correlation for the tests without Injection (the empiricslly fitted curve
labeled DRY). FNV v8lues Increase with Increasing power Input, 8s they
should. For the tests with c8lcItic lime Injection, vhich Includes all the
points with RMV values belov 20 cm/see, the RMV rises much less then expected
*s power input Increases. This fsct suggests that the pover YSS not Used
effectively, end that there may have been leakage ecross Insulators, possibly
/ ceU8ed by localized moisture in the dry solids.
Figure 7-12 shows the effect of long-term operation on performance 8s judged
by migration velocity. InItIally, performance decreased with operating time.
This msy have been s “conditioning effect” on the precipitator. It has been
Bechtel’s experience that most precipitators deterIor8te for 8 few days from 8
new condition. Eventually, 8 steady-state condition is reached. During the
Campbell testing, deterioration continued. It is suspected th8t power
trscking or shorting somewhere In the precipitator ~88 Increasing with time.
A break in the degradation occurred 8fter test 22 where 8 period of operation
vith no injection slid 8 period of water spray operation occurred. liowever,
the performance decline again continued from tests 28 through 35.
RR:gZgOr 7-32 P6rt 2

150
140
130
120
110
90
e g 80 >’ 3
70
60
50
40
0
x
x
I
a I
x
0
x
x
I
a I
x
0
0
0
0
l
l
l
0
0
l l
.
l l
l
l No injection 0 Water only injected
X Lime injection
GAS VELOCITY. fthec
Figure 7-10 Vsrinion of EMV with Gm Vdocity
Pert 2 7-33
163

150 T
140
150 +
120
80 ’ 70 ,
/&=‘W + / -
60
50
40
SO
20
10
- 1
0 2Ao 400 d0 BOO
0 LWRRY Pmum. 1Am4&ow lLIY
+ 0 DRY
Figure 7-11 Effect of Power on Migration Velocity
Pert 2 7-34
164
i
. .

,
lE9Tsum4INEolm 6o 0 46
1 0
40
e
j =.
i Jo D
26 -
20 -
lb -
lo-
o Q#
0 D
0
z 0
a 0 0
e-
no 0 0 o”
0
0
OU 0
0
6 ! ,O a n I I I I I 1 0 m 4Q m
lEpT luYlER
PIgun 7-12 Mlgmtlon Voloclty Hl8lory
Part 2 7-35 165

“he period of ash-only end water-only operation of tests 3.6 to 43 changed the ‘. performance trend. Tests 46 through 64 generally produced A trend of
Improving performance.
blection of Dolomitic Lime. Two test* (61 and 62) were msde vith A
,,’ 15 percent slurry of dolomitic lime Injected. (Two other tests, tests 63 end
..;.~ 64, used II mixture of dolomitic and calcitic limes. These will not be
~considered here because lime slurry WAS Injected only through the downstream
nozzle, and water WAS Injected upstream.)
Test 61 et 30 ft/sec removed 96.79 percent of the particulate metter.
Comparisons with other similar test* using calcitic lime, sll et 30 ft/eec and
lbO’F, sre shown In Table 7-10.
Table 7-10
COMPARISON A - DOLOMITIC VS CALCITIC LIME
Dust Concentration : Test (nr/dscf)
5-L ud&L as.w
h ,,L. 61 10.590 0.340 96.79 20.8 Dolomitic lime, 15%
9 5.989 0.436 92.80 12.7 Calcitic lime, 12% 28 7.674 0.619 91.93 11.4 C*lcItIf lime, 17% 29 6.810 0.437 93.58 13.5 :: C*lcItIc lime, 17%
: The other test (see Table 7-11) with dolomitic lime, test 62, et 50 ft/sec CM
be compared vith the average of the calcitic lime tests at 50 ft/sec end 160.F.
Teble 7-11
COMPARISON B - DOLOHITIC VS CALCITIC LIME
Dust Concentration . Test (nr/dscf) Efficiency
-Ia Lrda QU‘U-
62 7.519 0.937 07.53 12.3 Dolomitic lime, 15% AV. Of 7 tests 5.559 0.761 86.31 11.6 Calcitic lime, 12%
i
4.
RR:8280r 7-36 Pert 2 166

“, -
.
While the two comparisons show improved removal with dolomitic lime, the
result is inconclusive. Improvement vau very slight in one ca.ee and only two .;
tests were made with the PADL.
In the earlier tests with dolomitic lime, in Aovembcr 1986, the ESP
performance ~a8 better than in teat8 61 and 62. Collection efficiency in the
earlier tests ranged from 97.1 to 99.0 compared vith 87.5 and 96.8 in these
two later tests. Therefore, whatever adverse conditions contributed to the
poor ESP performance with the ealcitic lime aleo operated to cause poorer
performance with these two dolomitic lime tests.
. Tests 56 and 57 were run to see whether
conditioning the ESP by keeping the conditiona of the teat (except for gas
velocity) constant far 10 to 15 hours precediry the teat was a factor in
cauain~ the lov removals with lime injection. To eliminete the lime
conditioning effect, vater only va8 injected into the BSP to hold the San at
160-P OVernight. Teat 56 was carried out with only water injected.
Aext, just before starting teat 57, which folloved right after test 56,
injection of 10 percent calcitic lime slurry began, with all the other
conditions kept the same. The result8 are tabulated in Table 7-12, alolrg with ~::
three comparable calcitic lime teat.8 that had a lo- to 15-hour lime
conditioning time, for comparison.
Although test 57 showed somewhat better performance than tests 9, 28, and 29,
the significant result is that removal in test 57 bus so much,lass than in
teat 56. Injection of the lime slurry caused the BSP performance to fall off
almoet immediately, ehOwin8 that conditioning with lime injection wan not
responsible for the reduced ESP performance.
7.3.4 Esp Outlet Ormcity
An opacity meter wa.e installed in the duct dowmtreun from the ESP and the ID
fan. This meter had a range from 0 to 25 percent, with a light path of 3 feet
acros8 the duct diameter. Before each test, the Slurs was cleaned at the .t
RR:8280r Part 2
7-37
167

Test AL
56
Temp. Llfl
158
Paver ENV VS (watts/
fcm/sec)(ft/eec)lOOO acfm]
11,450 73.1
57 11,550 158
Dust Concentration
(ar/dscf) Eff. m Outlet IX‘1
2.349 0.003 99.87
4.504 0.205 95.54 16.0
1.63 609
1.64 635
9 12,700 160 5.989 0.436 92.72 12.7 1.81 580
28 12,440 159 7.674 0.619 91.93 1.77 650
29 12,350 158 6.810 0.437 93.58
11.4
13.5 1.76 649
Table 7-12
EFFECT OF COADITIONING TIME
Condition
Fly ash and water
Fly ash end calcitic lime, 10%
Fly ash and caleitic lime, 12%
Fly ash end calcitic lime, 17%
Fly ash and calcitic lime, 17%
..,
RR:8280r Pert 2
i
7-38
168

. light source, and the photo cell and the zero and span were adjusted. The
glass stayed relatively clear and the zero and span showed little drift.
Hovever, because the zero adjustment would not make the instrument read zero,
the indicator was “zeroed” at 5 percent. .
Figure 7-13 shows how the indicsted opacity varied vith time in five tests
vhere the gas flow us8 increased at about 0800. In every csse, the opacity
reading was fairly steady while the gas flov us8 low (20 ft/eec, sxcept for
the test on June 13, where it was 30 ft/sec prior to 0700). When gss velocity
increased to 50 ft/sec, the opacity increased sharply, and then in three of
the five tests it came back doun s little. Occssionally, brief “spikes” were
seen, some of vhich are shown in Figure 7-13.
Although the Absolute value of the opacity is not siSnificsnt, because of the
uncertain sero value, at low gas velocity, actual opacity readings ranged from
6 to 9 percent. When gas velocity increased, so did opacity, and it increased
more when lime was injected then when it was not.
Other data shov that the opacity either held fairly steady or decreased slowly
over lon$ periods at low gas flow. Aowever, there wss some tendency for
opacity to climb slowly at the high 8~8 flows. Since it uss not feasible to
operate at high gas flow for more than 4 or 5 hours, the opacity us8 not
followed beyond that period. However, the data in Table 7-4 do not show that
the outlet particulste concentration usa consistently higher in succeeding
teats on the same day.
7.3.5 VI Curves
Voltsge-current (VI) curve8 were taken for l sch ESP test, both iomredistely
before and after each test run. Data for the VI curves were taken by running
up each AVC manually, outlet field first, in increments of approximately
10 kV, and taking voltage and current readings at each point. This continued .
until sparking took place. the primary current limit of 15 amps being reached,
or until either the maximum voltage (60 kV) or plats current (80 mA) was
reached on the AVC panel. t
RR:8280r Part 2
7-39
169

16
15
..
14
13
12
,.,~ 11
Gas velociry ra~scd 20 ftlrec to 50 fllrec 30 wrec 10 50 fl/rcc _
10 \
i
9
8
. ...1. 12
11
10
9
--+ 8 Gu vclociw raised 20 Wsec to 50 frllec ,
\ I
\ I
#-Q-c++/ I I I I
0300 4 5 6 7 owe 9 10 11 lzoo lmo
TIME
Flours 7.13 ESP O&let Opacity VI TtmO
;I h Gas vtloc,t~ raised from 50 lti, o 60 trlrcc
i I
Al /I II
II
I J
CALCITIC LIME INJECTION
x - 12%. June 12 + = 1746. June 11 l =ll%.Junc13
,,’ .,“,T
. * No injection. Julum 9
0 = w,,,, my. ,vnr 10
4,
,I
.
,.
Part 2 7-40
170

VI curves were then obtained by plotting secondary current (mA) against
secondary voltage (kV).
Figure 7-14 is a set of typical VI curves for the second series of tests,
taken under comparable conditions, showing the relative electrical
characteristics for each injection condition tested. The curves with
injection of water and those vith calcitic lime slurry injected are very
similar, althou8h they rise much more steeply with no injsction.
Table 7-2 show that in the first series of tests during November 1986 when
PHDL ~6s injected through both nozzles, over 50 kV was needed to get plate
current.9 approaching 70 mA. This is similar to the VI data for calcitic lime
injection shown in Figure 7-14. However, ESP efficiency exceeded 98 percent
in three of the four two-nozzle tests in Aovember 1986, vhile the collection
efficiency was much lover in the later ssriea of tests.
For most tests, the VI curve for the second field (TRC-2) wss somewhat steeper
(i.e., more current at a given voltage) th& it WI for the first field. This
phenomenon is exhibited by most precipitators.
Complete sets of electrical readings were tsksn approximately every 10 to
15 minutes during the test psriods. Tables 7-3 md 7-4 shov averages compiled
from the readings for each test.
The AVC units were run in “manual” setting for all tests in the second
series. The “control” point for each test condition ~68 selected by first
running the “pretest” VI curve; then settinS the AVCs to a level just below
that at which sny instability was evident. The other limiting factor vss the i
size of the transformer/rectifier sets themeelves, which, as noted, placed
limits on the voltage and current.
RR:8280r Part 2
7-41
171

c --F
-s
-f
CI
. . * sss fEcs 4 l *+
,.
,.f,~
c 2 + ..;,
t.
I , I * , I , 0 c 8 i? 0 s s 51 R 2 Q
Part 2 7-42
172

I , ,.*
r
FigWe 7-15 correlates the plate current vith applied VOltage for the tests -L
with lime injection. The points in Figure 7-15 are for the first field,
TRC-1, and only data from tests at maximum power vere plotted. Aote that in
most of the tests with dolomitic lime, it appears that less voltage vss
required to generate the plate current. The vide variation in the points
su$Sests variable buildup of solids on the vires or plates, or significant
current leakage.
7.3.6 Pssistivitv Hessurwg&@
In sn effort to find a reason for the big difference in ESP performance vith
and vithout lime injection, the resistivity of the particulate matter vs.8
measured. Southsrn Research Institute made the measurements using an in situ
technique it has developed. This technique has been used extensively on
typical flue gases sad it provided reproducible results. liovever. its
application on flue SAS dovnstresm from in-duct injection is relatively nev
snd the results are subject to confirmation.
Table 7-13 tabulstes the values of measured resistivity. The results,
summarized in order of incrsasing resistivity. sre:
0 Fly ash slons, no injection, 270-F 1.1 - 2.7 E9 ohm-cm
0 Injection of celcitic lime, 160.F 3.4 - 4.3 El0 ohm-cm
0 Injection of vster, 160.F 3.6 - 4.8 El0 ohm-cm
0 Injection of dolomitic lime, 160.F 4.5 - 4.8 El1 ohm-cm
The lowsr resistivity for fly ash alone without injection is resaonsble, but
for the three other ca8es the resistivity values bear no relstionship to the
ESP performance.
The variations of resistivity vith tempsrsture are also snomslous: vith
. dolomitic lime, resistivity is lover at lover temperature (as expected), but
with vster only, it is higher at lover temperature (not as expected).
RR:828Or Part 2
7-43
173

75
7t
l
I c‘,.
z
3
*
w
60
46
I-
i-
l-
,-
40
TRC-1 0
0 0 0
b
0 0 0
a
0
l aD
0 0
0, & 0
0
l
0
0
0
0
0
0
0 0
0
0 Calcitic lima. May. July 1087 0 Dolomitic lime. November 1986
I
45
I I I
w w a I
VDLTACE. kV
Flgun? 7.15 Varhtlon of Operating Cunont wtth Voftwe
Part 2 7-44
174

,
.
.
b
QYIYIV) N-JVNN . . . . --cr.
dN*lb I I I I
wmr.c NNNN . . . . I-r--r-
7-45
175

The measured values of fly ash resistivity (1.1 to 2.7 E9 ohm-cm) without , injection of water are typical when coal of 2 to 2.5 percent sulfur is burned, and they agree with resistivity calculated from the ash composition (Reference 7-4). Rowever, the high resistivity of the fly ash with water
. injection is difficult to explain. It was postulated that alkali in the
; injected water could react with the sulfur trioxide (SO5) in the flue gas. ;, This could increase ash resistivity. Hovever, reaction of all SO3 vith
alkali in the water seems unlikely. Measurament shoved an acid dew point (ADT) of 250-F for the flue gas - equivalent to 2 ppm of SO3. Even if the water injected contained 100 ppm of bicarbonate alkalinity, it would be insufficient to neutralire all this SO5 to bisulfate.
7.4 DISCUSSION OF ESP TESTS
Why the ESP performance deteriorated in these tests when lime was injected is the major question to be answered. Other corollary questions are:
0 Why did the ESP collect solids from lime injection so efficiently in the early teats, Aovember 1986?
;,T., 0 Is the low ESP efficiency vith lime injection in the second
series of tests a general effect or was it caused by some circumstance peculiar to these tests?
Unfortunately, the data do not provide conclusive ansuers.
. ,: ,: The following discussion considers several possible causes of the poorer
performance vith lime. Some of these poaeibilities can be eliminated, while others are more likely and lead to tentative answers to the questions.
7.4.1 &Ristivity
i The higher resistivity of the particulate matter, when either the dolomitic or .:, the calcitic lime was injected into the duct, compared to that of fly ash
alone (with no injection) could explain why lime injection degraded the performance of the ESP. As shown in Table 7-13, reaistivity vith calcitic lime was about 4 El0 ohm-cm, and with dolomitic lime it was ten times higher, about 4.6 El1 ohm-cm. When there vas,no injection, the value was less than
one-tenth these values, 1.6 to 2.6 E9 ohm-cm. Eovever, vhen only water was
.
RR:g2gOr 7-46

injected, the resistivity was just as high as with calcitic lime, 3.6 to 4.8 El0 ohm-cm, and the best removal was achieved. Therefore, it is hard to : see how the high resistivity from either type of lime can be the cause of the ’ poor collection efficiency.
Figure 7-16 shows ash resistivity calculated by the veil-accepted method (Reference 7-4) developed for the EPA. The resistivity is highly sensitive to flue gas temperature and flue gas SO3 content. Calculations indicate that resistivity is not very sensitive to flue gas moisture and ash calcium content over the ranges used for these tests.
The meaoured ash resistivity at a probe temperature of 231-F to 247’F was
1.09 - 2.65 E9. Figure 7-16 indicates that this corresponds to e ges SO3 content of about 3 to 7 ppm.
Since calculations indicate that neither injection of vater or lime would raise resistivity to the levels measured, it is postulated that the water and lime injection altered the availability of the SO3 for rcsistivity reduction. The measured resistivities correspond to an extrapolation of the curve representing a gas content of sero SO3 to the temperatures vhere
resistivity vas measured.
AS discussed above, the effect of water on reduction of SO3 and increase of resistivity is not likely to be as significant’as measured. Novevcr, the effect of the lime on increasing rcsistivity by reaction with SO3 is more probable. This possibility requirea further investigation.
7.4.2 l&&&k&s
As.shown in the photomicrographs in Appendix C, the fly esh wee coarser than either the dolomitic or the calcitic lime, unless poaaibly agglomeration raised the effective particle size of the lime. Therefore, if a big proportion of the unreacted lime and reaction products was dispersed when it dried, the concentration of very fine particles (i.e., less than 1 micron) entering the ESP was much higher when lime was injected.
RR:8280r Part 2

II I I, II I II I llltttl I I I
v . . . ” s-r. z ,o ,D - o,.. . II f$*. c1 a.. . ” r” c ‘t
ua “w ‘Amw SIS3bl ia: . Part 2 7-40
178

Thia.poaaibility is supported by the observation that the particulate mstter collected on the filter of the inlet sampling probe during ESP teats was vhite snd appeared to be mostly lime and reaction products. Solids that deposited in the duct, on the other hand, were dark and appeared to contain s higher percentage of fly ash.
Furthermore, when lime us.6 injected, the solids collected on the filter of the
inlet asmpling probe were loose snd free flowing. By contrsat, the asmplea of fly ash, either with or without water injection, formed a coherent cake on the filter. Thus, the fly *ah alone appeared to have a greater tendency to agglomerate than the solids from lime injection did.
The abovc;observations suggest that with lime injection-the particulate matter’
is finer and more dispersed and, thus, is intrinsicslly harder to collect. A lower agglomeration tendency would also increase reentrainment in the precipitstor. If this caused the poor ESP performance, then the high collection efficiencies with lime injection observed in the teats in November 1986 may have been due to the clesnlincss of the nev ESP. The performance of many newly installed ESPs degrades for a period of a few days to s few veeks
before resching steady state. Eovevar, improved ESP performance was observed by othera with aprsy dry FGD ayatema operating upstream of ESPa. This observed improvement srguea against s conclusion that lime injection necessarily impairs ESP performance.
The benefit of the CZD system on precipitator performance vi11 depend on the fly ash and flue gas properties. For relatively lov-aulfur coals, higher reaistivity *ah will be produced which hinders precipitstor performance. Injection of vater and lime vi11 increase the collection efficiency of the : precipit*tor. This la due to the lover flue gas temperature reducing ssh resiativity and alloving more electrical power input vithout detrimental
sparking.
For s high-aulfur coal spplicstion, the ash reaiativity is already sufficiently low to sllov optimum precipitator performance. Reduction of the
flue gas temperature does not improve precipitator performance. Aovever, the poaaibility of the injected vater and lime interfering vith the reaiativity RR:8280r 7-49 Part 2 179

reducing action of the S03, se discussed above, ruggests that lover flue gas temperatures may compensate for loat S03, raduce~aah reaistivity, and improve precipitator performance.
l
7.4.3 Electrical Leekane
Another possible explanation for the lover removals vith lime injection is ’ : that incompletely dried solids collected on insulatora or built up on the
“free or plates snd Allowed power to leak svay. Figure 7-11 shows that migration velocity increased aignificsntly with power input in teats with no injection, while with lime injection, migration velocity vs.8 much lover and increased very little with power. Also, although collection efficiency in Figure 7-8 increases with power vhen lime la injected, the pointa are quite acsttared, suggesting the influence of some random effect like buildup snd laaksge. By contrast, the points for collection efficiency without injection
: ‘~ in Figure 7-9 lie close to a smooth curve vith little scstter. (Aote that the ~’ scales in Figure 7-9 are expanded compared vith.those in Figure 7-8 vhich
makes the points in Figure 7-9 appesr more scattered than they are.)
:- Water alone injected into flue gas can be expected to evaporate more rapidly ~_ thsn the vater in lime slurry. This condition vi11 occur beesuse the drying % rate decreasea with slurry droplets once the free moisture on the outside of
the particles evaporates. In addition, vith water injaction, the loading of
in solids to the ESP vaa lover snd the solids were eosraer than with lime
injection. Furthermore, the solids vere not likely to be completely vetted with water-only injection, so that drying vsa more likely to be complete before the psrticulstea reached the ESP.
On one occsaion lste in the teat progrsm, the ESP vss anergizad vhile the manhole at the inlet vss open and air was pulled through the ESP. Sparking
: could be heard in the vicinity of one of the inauletora suspending the
-_ emitting electrodes in the first field. An ettempt vsa made to clean these
<, insulators with an sir lance, but they vere not aceeaaible enough to clesn tham thoroughly. The above observation supports the possibility that
electrical leakage at lesat contributed to the poor ESP performance with lime injection. i
RR:8280r 7-50 Part 2 180
The solids discharged from the ESP hoppere always sppeerad dry and free-flowing, thus tending to refute the argument that incompletely dried ’ solids caused aparking and power leaka when lime use injected. When the hoppers were emptied, there were few stoppages, snd these were always easy to
break loose. Furthermore, the collector plates and discharge electrodes did not accumulate deposits that were more than about l/E-inch thick. These deposits were loose snd l saily brushed off; there vsa no evidence that vet solids had been collected.
The improved ESP performance when lime vsa injected at very low gas velocities can be axplsined by the longer time svsilsble for drying and finer atomizetion. Consequently, faster drying use achieved st the lover injection rates.
Similarly, the higher dovnatrem gas temperatures used in the Aovember 1986 teats (180.F and higher in four of six teats) may hsve dried the solida more
thoroughly.
Also. the test with maximum power and gsa flowing st 50 ft/aec (teat 18 on Hay 28) thst gsva the highest efficiency with lima injactlon st this gas flow
use at 170.F compared with 160.F for the other teats. 3~
Ihua, the evidence is strong, though not conclusive, that incompletely dried solids caused excessive l lectricsl lasksge when lime use injected to bring the gas temperature down to 160-F in the second aaries of teats. If this is the reason why lime injection caused the ESP performance to fall off, it esn be corrected by better protection of the inaulatora and by improved stomizstion of the slurry.
7.4.4 Unevenl
. When the teat program was nesrly over, it was found that the flow of solids in the test duct could be observed viauslly through the 4-inch sampling nozzle on the top of the duct 80 feet from point 3, where the downstream aprsy nozzles were located (see Figure 7-3). The entrained particulate matter was dilute b enough to allow the bottom of the duct to be seen with A spotlight directed
RR:8280r Part 2

through A glass plate on the nozzle. This shoved A concentrated atresm of solids in the bottom 1 to 2 inches of the duct moving slang more slowly than the gas. Obviously, moat~of the particles in this stream on the bottom of the duct were too coarse to atsy suspended in the main stream of the gas, snd these may have been incompletely dried.
About 30 feet beyond the asmpling port, the duct turned upvsrd 180* snd connected to the ESP. Diverging vanes in the transition place at the l ntrsnce to the ESP slowed the gas dovn and distributed it over the erosa section of
the ESP. An array of verticsl 4-inch pipes serving se bsfflaa just ahead of the collector plstea also helped to distribute the gss flow evenly. However, it may be that the U-bend just shesd of the ESP concentrated A jet of solids snd high-velocity gas, part of which use deflected upvsrd by the top diverging vsnaa and found its wsy through the bsfflaa with enough momentum to impinge on the inaulstora in the first field. This poaaibility ia conaiatent with the psrticulsrly poor ESP performance in teats 34, 35, snd 47 which had the highest gas flow in the duct, 60 ft/aec.
From the evidence svsilsble, it sppasra that electrical lcsksga is a likely cause of,the poor ESP performsnee observed with lime injection. Sagregstion of the largest, slowest drying particles, combined with an ESP inlet geometry that directed them to the vicinity of the insulators supporting the emitting electrodes, may have bean a significant factor in csuaing the leskage.
Another poaaibility is that locslizad high velocity areas in the pracipitator csuaed reentrsinment of collected psrticulata either from the collection plates or hoppers. There WAS no ahspe model tasting of the precipitator snd ducting. There were no field teats of velocity uniformity at the precipitator inlet snd outlet. Raentrsinment is suspected because performance improved much more st reduced velocities than would be predicted by the Deutach aqustion with a k factor equal to 0.5. This phanomenon was observed both with snd without lime Injection. In Addition, if the lime formed A fluffy
nonsgglomerating msterisl, it would be,aubject to reantrsinment due to locsliaed high valocitiea.
c
RR:8280r Part 2
7-52
182

:, .-
.~,, -
REFERENCES
7-1. Robsrds, R. F;, Deguzmn, J. S., Runyen. R. A., Flora, Ii. B., “Spray .~ Dryer/ESP Testing for Utility Retrofit Applicationa on High-Sulfur Coal,” ELllEBy Demonatrstions and Tew, TVA, (1986) (3).
7-2. Chen, Y., et al, “Electrostatic Precipitatora in Dry FGD Applications,” SccondIntcrnat ions1 Conference on ElectroatafiLEredpitsti~, Kyoto, Jspsn, Novamber 1984.
7-3. Grsvaa, A. G., et al, “The Effect of Corona Power on Eleetroatatic Precipitstor Performance,” m Joint Power Generation Conference, Denver, October 1982.
7-4. Bickelhaupt, R., we for Predictins Flv Aah Reaia~, EPA - 600/7-79-204, 1979.
RR:8280r Part 2
\
7-53
183


i b
‘,
‘,
PART 3
Seward Station Testa
CONTENTS
Section
1 IRTRODUCTION
1.1 Background
1.2 Objectives
2 SUMMARY
2.1 Teat Facility
2.2 Shskedovn Taste
2.3 Lime Injection Teats
2.3.1 Duct Temperature Profiles
2.3.2 PRDL Injection
2.3.3 Slurry Concentrstion
2.3.4 Calcitic Lime
2.3.5 Duct Deposits
2.4 Anslyaia of SO2/NO, Data
2.5 ESP Tests
3 FACILITY MD PROCESS DESCRIPTIONS
3.1 Boat Unit
3.2 Process Description
3.3 Section of Teat Duet
4 DRYING AED SO2/RO, REMOVAL
4.1 Nozzle Atomiaetion Teats
l-l
l-l
l-2
2-1
2-1
2-2
2-3
2-3
2-3
2-3
2-4
2-4
2-4
2-5
3-1
3-l
3-1
3-6
4-l
4-l
1 ;;;;4yd :-.y,
I 1 Preceding Page Blank ~
185

5
4.2
4.3
ESP
5.1
5.2
6 AMLYSIS OF SO2fA0, REMOVAL DATA
6.1 SO2 Removal
4.1.1 Wind Tunnel Testing
4.1.2 Parametric Water Injection Tests
4.1.3 Parametric PRDL Injection Teats
4.1.4 Continuous Lime Slurry Injection
Deposits
SO2 snd NO, Removal
PERFORRARCE
Stack Opacity
5.1.1 Parametric Lime Injection Teats
5.1.2 Continuous Lime Injection Tests
ESP Teats
5.2.1 Particulate Removal Efficiency Measurements
5.2.2 ESP Operations .~.
5.2.3 Evslustion of the Effect of Lime Slurry Injection on ESP Performance by D. L. Strein
6.2 Lime Utilization
6.3 Projections for 50 Percent SO2 Removal
BEe
4-1
4-2
4-3
4-6
4-7
4-8
5-l
5-1
5-1
5-3
5-3
5-3
5-6
5-9
6-l
6-1
6-1
6-4
AR:8440d Part 3
ii
186

ILLUSTRATIONS
w lzLsu8
3-l
3-2
4-l
4-2
I
‘.
5-l
5-2
6-l
6-2
6-3
6-4
CZD-FGD Damonstrstion Unit
Arrangement of Atomizera and Teat Nozzles
Duct Cross Section Isotherms Wster Injection Teat Bo. 1 - 9/14/87
Duct Cross Section Isotherms Lime Injection Teat No. 1 - 9/15/87
Recording of the Stack Opacity - E/14/87
Recording of the Stack Opacity - lo/23187
Correlation of X SO2 Removal with Slurry Injection Rate for Dolomitic Hydrate
Correlation of Lime Utilizetion with Lime Concentrstion for Cslcitic Hydrate and Freshly Slaked Lime (12/4/87)
Correlation of Lime Utilizstion with Lime Concentrstion for Dolomitic Hydrate (12/4/87)
Aversge Teat Data with 7.5% Lime Slurry Concentrstion snd Extrapolation to 50% SO2 Removal
TABLES
El!&2
3-3
3-7
4-4
4-5
5-2
5-4
6-3
6-5
6-6
6-7
ztks
4-l Seward Lime Slurry Injection Dats 4-9
5-l Particulate Bmisaiona (PE) 5-5
5-2 Electroatstic Precipitstor Teat Dsts With snd Without Lime 5-7 Slurry Injection
6-l Seward Dolomitic Lime Dsts Grouped by Slurry Concentration 6-2
AR:8440d Part 3
iii
187

4

ABBREVIATIONS, ACRONYMS, AND DEFIlITIOBS
acfm ADT AST AVC bhp CEM
CL cone CPC CZD DOE d/s EMV ESP Eff FGD am miv
ID Injection kscfm L LFR
80, RWIR 02 OH OiN PEDA PENBLEC PETC PEDL PRDA P&ID P&ID SCA SCf scfm
* SO2 SO3 ssco T/R
L U/S VI n WC
actual cubic feet per minute acid dew point approach to saturation temperature automatic voltage control brake horstpover continuous emissions monitor, term used to designate SO2-02 monitor cslcitic lime conctntrstion Consmers Paver Comptny confined zone dispersion U.S. Depertment of Energy dovnstrtam effective migration velocity electrostatic precipitator tfficimcy flue gas desulfurization gallons per minute higher heating value induced draft apreying lime slurry or water into flue gas flowing in e duct thousend standard cubic feet per minute lime lime feed ratio, moles of lime (both Ca end Mg) fed per mole of SO2 entering megawatts, electric tquivelent nitrogen oxides normallztd water injection rete orysen hydroxide concentretion opereting end maintenance Pennsylvenie Energy Development Authority Pennsylvania Electric Company Pittsburgh Energy Technology Center pressure hydrated dolomitic lime (else cslled Type S lime) Program Research and Development Announcement piping md instrumentation diagram process and instrumentetion diagram specific collection erea standard cubic feet atmdard cubic feet per minute sulfur dioxide culfur trloxide Spreying Systems Company transformer/rectifier upstream voltegt current wsttr water columu, the head difference in a vater manometer
v All temperatures are in degrees F, unless specified othtnist.
V
AR:g440d Part 3 188

.i.

section 1
IBTRODUC!IIOB
1.1 BACKGBOLIRD
Pennsylvania Electric Co. (PERSLEC) auppliee about 40 percent of the electricity consumed in vestern Pennsylvania. Aearly ell of it ia generated
by burning local coal. Proposed acid rain abatement regulations stimulated PENRLEC into evaluating various methods available for compliance vith the proposed regulations.
Bechtel’a Confined Zone Dispersion (CZD) process for flue &as desulfurisation (FGD) was one method selected for evaluation by PERRLEC. The CZD process
involves injecting a finely atomised elurry of hydrated lime into a straight run of duct between a boiler’s air heater and its precipitator. Small-scale experiments had shown that an air atomizer can make fine sprays that will dry rapidly enough to avoid deposits on duct walls. A highly reactive lime was used that captured a significant proportion of the SO2 during this short drying period. The CZD process is proprietary , covered by U.S. Patent No. 4,623,523.
A cooperative test program to study the effecta of the CZD process retrofitted onto one of two parallel flue gas ducts on the 140 HWe Unit 15 boiler at Sevard Station was entered into by PENRLEC, Bechtel, and the Pennsylvania Energy DeVelOQment Authority (PEDA) in November 1986. Proof-of-concept testing at * pilot-scale level of 5 MUe, Supported by the U.S. Department of
Energy (DOE), was under way having entered a 3-month shakedown phase in October 1986. Rnovledge gained in this pilot-scale teatinF, would be utilized in the Seward teatin&. Additional support to extend the SeVArd testing was provided by the DOE and New England Power Service in the stammer of 1987.
RR:83021 Part 3
l-l
189

1.2 OBJECTIVES
The objectives of the Seward Station test program were to:
0
0
; 0
0
0
0
,, .,
Establish the level of SO2 removal effectiveness of the CZD technology under full-scale operating conditions
Measure the impact, if any, of the CZD system on plant operation, such as corrosion in the duct, erosion, fouling, and particulate emissions from the stack
Hake a 4-week continuous run matchins variations in boiler load, flue gas velocity, inlet temperature and inlet SO2 concentration to maintain an adequate outlet flue gas temperature, and SO2 removal vithout affecting the normal power plant operation
Measure the particulate removal efficiency of the electrostatic precipitator (ESP) with and vithout lime slurry injection to determine the Capability of the ESP to handle the additional grain loading when lime is injected into the system
Test the effect of both pressure hydrated dolomitic lime (PADL) and calcitic lime (CL) on SO2 removal, lime utilisation, and ESP performance
Determine if the DOE proof-of-concept goals of 50 percent SO2 removal and a levelized removal cost less than $500/tori of SO2 are obtainable
A S-month test profpm that began in June 1987 consisted of 2 months of shakedown testing, 2 months of parasetric testing with lime slurry, and 1 month of teatin during continuous operation at 24 hours/day, 7 daysheck.
The tests were predominately conducted vith PRDL, but a limited number Of
tests with hydrated and freshly slaked CL were also run.
RR:8302r Part 3
l-2
190

section 2
SUMARY
b -
The large-scale test program at tha Seward Station of tha Pennsylvania Electric Company (PERSLEC) included the deeign, installation, and operation of
the Confined Zone DiSQerSion (CZD) teat system. The CZD system was retrofitted onto one of tvo parallel flue gas ducts on the 140 FIW Unit 15. After shakedown of the system, the activity consisted of 2 months of parametric lime injection tests and 1 month of continuous lime injection tests. Electrostatic precipitator (ESP) performance was evaluated during this latter QSriod.
2.1 TRST FACILITY
The flus gas was treated in approximately 35 feet of a straight ductvork section (8 feet wide x 11 feet high) situated between two sets of turning vanes. The ductwork section and turning vanaa were located between tvo existine ESPs. At a nominal flue gas velocity of 64 ftlaec, the duct section had only 0.5 second of residence time. After slurry injection, the dried reaction products and fly ash were collected in the second existing ESP.
Pressure hydrated dolomitic lima (PHDL) and dry ealcitic lime (CL) were received in self-unloading trucks and pneumatically transferred to a lime
silo. The dry lime was slurried with water in a 2,500-gallon lime sump SpUiQQed with an agitator. The slurry was QVSQSd from the smp to a vibrating screen to remove fine grit and then stored in either of tvo lO,OOO-gallon agitated lime feed tanks.
Tvo centrifugal feed pumps. operating in series, pumped lime from the feed
tanks through a pump-around loop that QSSSCd close to a valved manifold vbicb
* distributed lime to the atomizing nozzles. A separate valved manifold distributed atomizing air to the nozzles.
RR:8294r Part 3
2-l
191

On-line measurements included the following:
0 Gas velocity and temperature upstream of.lime injection
0 Gas temperature before and after the dovnstream ESP
0 so2, NO,, and 02 concentrations upstream of the spray nozzles and dovnstream of the ESP and the ID fan
_~ “- 0 Flow of lime slurry snd atomizing air _,~_
_ -., 0 Temperature profiles in the duct cross section at several distances downstream of the injection point
2.2 SBAESDOWR TESTS
The shakedovn teats began in June of 1987 and continued into August of 1987. 1 During this period, the ayatem vas checked out and made operable, and the
operating team vas mobilized and trained. Water atomization tests vere ~.:.. performed to determine the pressure and flow characteristics of the atomizing
nozzles and the orientation constraints of the multiple etomizer array.
Prior to the Seward testing, several nor.zle,a,t,omizers were teeted at the .I University of California, Davis, to calibrate the nozzles and to determine the effects of air and vater rates on fineness of atomisation. Rossle performance
resulte vere also available from the pilot-scale CZD tenting at the Campbell Station of Consumers Power Company (CPC). These tvo teat programs identified the Spraying System9 Company’s (SSCo) Casterjet nozzle es an l cceQtable atomiser for the Seward teats.
i_ The next step involved testing the calibrated nozzles in the flue gas duct to determine the best configuration and the minimum ratio of atomizing air to
- water required to avoid vetting the duct and turning vanes. The testing started with a single nozzle and evolved to a nine-nozzle array.
:~ Because of the short duct and limited residence time, a much higher air-to-water ratio than expected vas required to provide the fine atomization necessary for rapid eVSQOratiOn. The air and discharge orifices of the nozzle
vere enlarged to provide this higher ratio.
6
RR:8294r Part 3
2-2
192

4 2.3 LIME INJECTION TESTS
Tvo months of parametric lime injection teats began in August 1987 and were followed by a month of continuous lime injection teats in October.
. The parametric tents, which normally lasted several hours, investigated tha
effects of lime concentration on the extent of flue gas desulfurization, lime utilization, and lime injection rate. The continuous lime injection tests investigated the long-term effects of lime injection on the etomizers, duct dSQoSitS, md ESP performance.
The lime injection test8 confirmed that fine atomiration and restricted lima feed rates were necessary to dry the atomized droplets sufficiently to avoid deposition on the turning vanes located about 35 feet downstream of the
nozzles. These restricted feed rates limited the maximum SO2 removal. The following results were obtained.
2.3.1
Temperature profiles takeri in the duct cross section at several distances from the injection point confirmed that a true confined zone, a moist interior surrounded by hot gas, could be obtained.
2.3.2 PADL.
With PHDL injection, SO2 removal ranged from 6 to 30 percant, depending on the slurry flow rate and slurry concentration. The LPR tansed from 0.11 to 1.34. NOx removal ranged from 8 to 21 percent snd increased with increasing slurry concentration. Lime utilization, baaed on combined SO2 and AOx removal, ranged from 23 to 90 percent.
2.3.3 ,$&u!t ConcanlxaUn
Sulfur dioxide removal increased and lime utilisation decreased with
. increasing slurry concentration.
RR:8294r Part 3
2-3
193

2.3.4 Calcitic Lime
With CL, either freshly slaked or a slurry QrSQSred from dry hydrate, SO2 removal, NOn removal, and lime utilization were significantly lover than corresponding values for the PWL. The rmurpected lover performance for the freshly slaked lime may have been caused by eroded nozzle tips. Time was not available to repeat the freshly slaked CL tests with erosion resistant tips.
,, 2.3.5 Duct Denosits
It appeared that duct deposits could be prevented by limiting injection rates to the point where the atomised droplets dried before they reached the first interior duct surface, the turning vanes. However, since this was a manually controlled operation, it was not possible to follow load closely, particularly at night. Consequently, there were times vhen the itijection rate was excessive, resulting in low dovnstream temperatures with some deposition on
the vanes and surrounding areas. Poor atomization resulting from eroded
atomirers also caused some deQOSit8.
L’
2.4 ANALYSIS OF S02/NOo, DATA .r_;,
The test data for PRDL were arrenged into groups according to veight percent slurry concentration.
..: A plot of SO2 removal versus gallons per minute of
slurry injected was made identifying each group with a Unique symbol. It was formd that a straight line could be dravn from the origin through the data
points for each group.
These plots show that the Seward test data azhibit a positive linear relationship of SO2 removal versus slurry injection rate. The plots also
shoved that, at a given injection rate, SO2 removal increases with slurry concentration.
‘, Lime utilization data were plotted to determine how lime utilization la
‘. related to lime type and lime concentration for SO2 and ROm removal. From
these plots, the Seward teat data show the following relationships:
0 Both CL and PRDL utilization decrease with increasing lime concentration for both SO2 and NO, removal.
,
RR:0294r Part 3
2-4
194

. A
.
0 PBDL utilization is higher compared with CL for either SO2 or NO, removal at a given lime concentration.
As noted earlier, the short residence time available in the test duct at Seward limited the lime injection rate to a point where a maximum of only 30 percent SO2 removal could be obtained. A full-scale commercial system with a longer straight run of duct would not be limited in this way. Pnrthermore, the ductwork configuration at Seward is suitable for installation of a second set of atomizers upstream of the set used, which would approximately double the residence time. This would allow more elurry to be injected and result in higher SO2 removal.
The plots dascribad above Vera extraQolated to project the slurry injection rate and concentration required for 50 percent SO2 removal. By this extrapolation, the injection of about 55 gpm of 7.5 percent PWL would remove 50 percent of the SO2 at Seward.
This extrapolation is probably conservative. Using two-stage injection and increasing residence time would permit more injection points, better gas/spray dispersion, a larger and more uniform confined zone, and a closer approach to saturation temperature for the treated gas. These factors should provide
better lime utilisation thereby obtaining 50 percent SO2 removal at an &
injection rate lower than 55 gpm.
Tvo-stage injection is expected to provide much higher AOx ramovals compared with that obtained in the single-stage injection tests during the Seward test program.
2.5 ESP TESTS
Particulate removal efficiency testing of the downstream ESP with and without lime slurry injection was conducted to determine the capability of the ESP to handle the additional grain loading vhen lime was injected into the system. An uiating online opacity monitor mounted in the stack was also used to
indicate ESP performance during the testing.
itR:8294r Part 3
2-5
195

During the short-term parametric tests, the opacity decreased and remained lover during lime injection and then increased when injection van Stopped.
During the long-term continuous injection tests, the opacity decreased at the start of injection and remained low initially, but then rose after 5 to 10 hours’ operation to a level exceeding the original opacity prior to the start of injection. Off-power rapping was successful in restoring opacity to
AcCeptAble levels, but was required intermittently.
Particulate removal efficiency tests were performed for fly ash alone (no injection), during injection of PHDL and during CL injection. Only one slurry injection rate per test was evaluated. The average particulate removal efficiency van slightly higher during the CL injection and slightly lower during the PHDL injection COmQSrSd with fly ash alone. The average amissions were the same during CL injection buthigher during PEDL injection comparad
-. i with fly ash alone.
The CZD testing was conducted with tha ESP in an as-found condition. Ao attempt was made to optimise the mechanical/e~cetrica1 condition prior to testing. Analysis of the ESP operating eharscteristics during the testing suggests that the precipitator had some deficiencies with the automatic voltage controllers and rapping systems.
The capability of off-power rapping to reduce opacity levels suggests that a
well-tuned ESP, with automatic controls for voltage and rapping, and with discharge electrode rapping, may be capable of maintaining acceptable opacity levels during lime injection. As with the tests at Campbell Station, it is felt that further ESP testing is needed.
.
1
h
BB:a294r Part 3
2-6
196

i -
Section 3
FACILITT ARD PROCESS DESCRIPTIORS
‘.
3.1 HOST URIT
The large-scale tests were carried out at the Seward Station of PERRLRC. The Confined Zone Dispersion (CZD) system was retrofitted onto one of two parallel flue gas ducts on the 140 MW Unit 15. During the test period, the unit ,burned 1.2 percent sulfur coal. Load typically varied from 135 to 145 MW, gas inlet tempefature typically varied from 280 to 3OO’F, inlet SO2 concentration varied from 730 to a70 ppmv, and gas flow rate was about 230,000 ecfm.
The flue gas van treated in approximately 35 feet length of an 8 feet wide x 11 feet high section of straight ductwork between two sets of turning vanes. The ductwork section and turning vanes were located between two existing ESPs. At a nominal flue gas velocity of 64 ft/eec, the duct section has only about a half second residence time. After slurry iqjection the dried reaction products and fly ash were collected inthe second existing ESP.
3.2 PROCESS DESCRIPTION
Figure 3-l is the process and instrumentation diagram of the CZD demonstration unit. It shows:
0 The arrangement of the CZD system equipment, interconnecting piping, and instrumentation
0 Flue gas flow, corresponding usages of dolomitic lime, water, compressed eir, and quantities of desulfurization prOdUCtS generated by the system
0 Stream flows
0 Equipment sizes, capacities, and units of motor breke horsepower (bhp)
Pressure hydrated dolomitic lime (PHDL) was predominantly used for the tests.
It was delivered by self-unloading trucks into the lime silo. This silo was
equipped with a vent filter, air slides, an air blower, a slide valve, a
RR:S303r 2art 3
3-l
197

rotary air lock valve, and a screw c,onveyor connecting it to the lima sump. The PHDL was slurried with water in the lime sump, which vas equipped vith an agitator and two sump QU~QS (one working, one standby). The lime silo and the lime sump were instrumented for either automatic or manual operation. They
-;
. were the existing components of the paver station, which, in addition to supplying lime slurry for treating the station’s wastewater, were used for
preparing lime slurry for the operation of the CZD system. During the demonstration program, the lime silo and sump vere operated manually.
i ,+
The CZD system was designed to operate using 20 vtX lime slurry. The lime sump was designed for batchvise operation. It had a net operating capacity of about 2,500 gallons. A batch of 2,430 gallons of slurry was sufficient for 3 hours of CZD aystem operation at its full design capacity. The procedure was to prepare 2,430-gallon batches of the lime slurry in the lime sump. From the
: lime sump, the lime slurry was pUmped to the dcgritting equipment in the CZD equipment enclosure under the deaulfurization duct 400 feet away. A new lime slurry transfer pump was provided for this purpose. This QUmp van connected
‘to operate in series with either of the two existing sump pumps. During the ~~ CZD program, one of the sump pumps served as the first-stage transfer pump,
and the other supplied lime to the station’s water treatment plant.
~~ Tvo forms of caltitic lime (CL) were also used during the test program: dry hydrate and a freshly slaked slurry of CL, The hydrate was delivered to the lime silo and prOCeSSed in an identical manner to the PHDL. The slurry was pumped from self-unloading trucks to the degritting screens with the subsequent processing steps the same aa for the other two limes.
Freshly alurried lime contains abrasive grit that la unreactive towards SO2 and can plug the atomising nozzles. This grit was removed from the slurry by the degritting equipment.
The degritting equipment consisted of a vibrating screen to separate grit from the lime slurry, two agitated grit slurry tanks, and one grit Slurry QWp.
T
RR:8303r Part 3 .’
198
3-2

I-
I ‘.E. ; .’ :,,.,: - ,.~‘: ,,..:
i (
,,;‘)
s,,.:,,cT,,,li ” ,‘/I, iL’.’ i :’ Z.! ‘*$;, ,., ,,, I!? ,’ I
I,!~ \;:i_ ,.:,:!, .F,’ ._i
ii,/ “‘I , 3
IL/
/I .’ I
/I :’ !! ,j,l ” i: y .: I !
~‘1 1, I;; :I3 !I’
k; :; i -.i ; - ,;E -
:, ‘,‘. ~ :,,,, :I _!,i !?j,, ‘1 ~;h


‘*
ii’,
The degritted lime drained from the vibrating screen to one of two lime slurry
feed/storage tanks. The grit separated from the lime slurry dropped from the vibrating screen into the trough that surrounded the screen and was sluiced from it into the grit washing tank. In the tank, the grit was washed with water for the recovery of lime entrained by it from the lime slurry. The entrained lime was recovered by reslurrying grit with water and filtering the grit slurry through the degritting screen. The degritting screen operated in a cyclic fashion: first, it van used to remove the grit from the lime slurry; then, it was used to recover the lime entrained by the grit.
The reslurried grit was pumped to the degritting screen with the grit pump, and the filtered-off grit was then collected in the washed grit tank (the second of the tvo grit tanks). The filtrate containing the recovered lime was drained from the screen into the lime feed tank. The recovery of lime from grit resulted in diluting the degritted lime slurry in the lime feed tanks
from 20 to 13 percent.
For supplying the lime slurry to the atomizing nozzles, the CZD aystem had two agitated lime feed tanks, two lime feed pumps operating in series, and a lime slurry loop main interconnecting the feed pumps to the atomizing nozzles.
The lime slurry feed tanks operated batchvise. One was used for pumping the lime slurry to the atomizing nozzles while the other received freshly degritted and recovered lime. Each feed tank had sufficient capacity to hold enough lime slurry for a 6-hour operation of the plant. The batchvise operation of these tanks permitted accurate meaeurement of the actual lime usage (by measuring the concentration and volume of the lime slurry used during any period of plant operation). The loop main provided for feeding the lime slurry to the atomizing nozzles enabled the plant operators to vary the actual lime feed rate without the dangar of QlUgghg the feed piping with sedimenting solids. The lime slurry feed loop main was connected to the atomising nozzles by a short header.
The lime slurry atomization system had nine air-atomising nozzles mounted in the flue gas duct. The atomizing air, lime slurry, and water vere distributed
RR:g303r Part 3
3-5
201
I I ~ Preceding Page Blank ,

to the atomizing nozzles via separate valve manifolds connected to.the atomizing nozzles by hoses.
The atomiring air end liquid hceders were equipped with rotemeter-type flow indicators. All header8 had prersure gauges end manual valves for controlling their flows. The inlet end outlet SO2 and O2 enalyzer/recorder end flue gas temperature recorders were provided to help the operators determine the proper flows of lime end water-.to the atomizing nozzles.
3.3 SECTION OF TEST DUCT
Figure 3-2 is a plan view of the test duct section. It show the location of the atomizing nozzle ports, the tempereture probe ports, the turning wanes upstream end downstream of the atomizers, md the downstream ESP.
RR:8303r Part 3
3-6
202

9 \, L / ‘y-/b-
v ’ 3 ~~..- c,- $3 Part 3
3-7 203


section 4
DRYIlK MD S02/I10x -AL.
With the Confined Zone Dispersion (CZD) process, even more than with other lime spray dry PGD eystems, drying must teke piece repidly before wet droplets CM impect on the duct eurfeces end build up deposits. At the eeme time, the spray droplets must remein wet long enough for the lime to reect end eepture sufficient SO 2’ The reection with SO2 is fast ee long es the lime particles are wet.
The short residence time in the Sewefd teat duct eccentueted the demend for
rapid drying end reaction. Therefore, the test program emphesized fine etomizetion, intimate flue @adapray dispersion, and l tteinment of e confined
zone - factors vhich promoted both drying and SO2 reaovel.
4.1 AOZZLE ATOMLZATION TESTS
4.1.1 Yind TV
Initielly, severe1 Spreying Systems Ceeterjet tvo-fluid nozzle etomizere were tested in e wind tunnel at the University of Celifornie, Devie, where the effects of eir and water ratea on the finenees of etomitetion were meesured. Nozzles vith etmderd 25,150 end 25,200 tips produced co.sraer droplets then did nozzlee with epeciel tips. The epccial tip8 were q pecified for the Severd CZD ayetem.
Wind tunnel tenting of the etomizere with the epeciel tipe showed thrt et e constant eir flow rete, the eurfece eree of the etomized droplet6 is conetent md independent of the water rate over the conditions tested. This implies that e reduction in liquid feed rete et e conetent air flow rate would result in finer droplete vith e reduced l veporetion/drying time.
Wind tunnel testing of etomizers ves rlso conducted with lime elurry. In
general, the tests shoved that:
0 Droplet size varied inversely with eir pressure
KR:8304r Pert 3 i ---7
\ Preceding Page Blank \
4-l 205

0 Droplet size varied inversely with air flow rate
0 Droplet size varied directly vith liquid rate
0 Droplet size was finer for pressure hydrated dolomitic lime (PDDL) slurries than for water at comparable operating conditions. This phenomenon is attributed to the lover surface tension of the slurry.
The atomizers selected for CZD tasting were calibrated at U.C. Davis to determine their pressure/flow characteristics.
4.1.2 Parametric Water Infection Tests
The next step in the program involved testing the calibrated atomizers in the flue gas duct to determine their best configuration and the minimum ratio of atomizing air to water required to avoid vetting the duct and turning vanes. The dimensions of the plw~e resulting from injection were determined by manually taking multipoint tsmperature traverses of the duct cross section at several distances dovnatream of the injection point.
__
..~ Initially, a single atomizer, attached to a lance which contained the air and -’ liquid feed pipes, was installed through a nozzle port on top of the ductvark
to position it in the center of the duct cross section. lhe first fev tests with this atomiser shoved that the downstream turning vanes were being vetted
/ at very lov liquid flow rates because.of incomplete evaporation in the short residence time. These tests established that a much higher air-to-vater ratio than expected was required. TWs correction was accomplished by enlarging the
,. air,inlet orifice and discharge tip of the atomizer. This change improved the evaporation rate and allowed a higher liquid feed rate.
~ Subsequent tasting with additional atomizera led to the final array of nine - single atomizers arranged in one vertical plane of the duct cross section. ,’ These atomizers were arranged three to a lance and instrlled through three
nozzle ports on top of the ductwork.
:..
RR:8304r Part 3
4-2
206

Isotherm plots of the duct croaa section at three distances downstream of the atomizera during water injection are shown in Figure 4-1. During the teat the
total water flow rate was 17.2 Bprn. These isotherms define the shape of the confined zone plume of atomizad vater in the duct. Note that at all three duct cross sections, the duct surfaces are at or above ZOOoF and therefore are bound to be dry.
The vater injection tests also shoved that:
0 At least 30 scf of atomizing air are .required per gallon of water to provide fine enough droplets for complete evaporation in the l/2 second residence time.
0 The plume of atomized water droplets in the flue Las tends to gravitate towards the bottom of the duct if the droplets are not fine enough.
4.1.3 mtric PBpc Inlection W
PWL injection ta&ta were conducted using the nine-atomizer array. Compared with the results of the water injection teats, slurry injection resulted in higher injection~~rates, lower atomizing air-to-liquid~ratioa, and lover uit 8.8 temperatures. Duct cross section isotherms measured during injection of
21 gpm of 7.8 percent PEDL slurry are ahown in Figure 4-2.
The downstream temperature required to dry the atomized slurries v&a investigated by insertirrg pipa probes containiry multiple thermocouplea through teat ports located on top of the duct. l’ypically, the probaa remained in the duct for 30 minutes while the plume temperature along the probe length was mearurad. (Rote that the temperature measured wee usually lower than the true gas temperature because undried particles contactiraI the thermocouple would lover ita temperature below the aas temperature by evaporative
cooling.) When the probes were removed they were inspected to determine the
extent and nature of any dapoaits. The following temparatura/deposit ralationehipa were observed:
0 Very vet deposits formed below 140V
0 Damp deposits formed between 140 to 155.F ,’
RR:8304r Part 3
4-3
207

r-; Note: See Figure 2-2 of Pan 3 for location of plams
A AIBCD, EFG, and HIJ ,.. -- _., ,..
-.._. -
Flgun 4-l Duct Cfoaa 9octbn Isothofma Waler InjectIon Tmt No. 1 9ll4l9T .~ ~.
..::.. L--
Part 3 I:ilir<
208

.i :~:l~‘::‘:-j.--.~I--j:-..i- --- -- - -‘.: I --I
Flgun 4-2 Duel Cfou SectInn Isolhrnns Llmr InjectIon Tosl No. 1 9n5m
_-. --.- -_
\‘, ,:.:.<.,erl I< ‘I..
Part 3 4-5

0 Dry deposits formed betveen 155 to 17O’F
0 Ao deposits formed ebove.170°F
From theec ob.eerPations it wee concluded that the buildup on the turning venes could be prevented by limiting the injection rete of slurry to en amount that
.- would keep the temperature in front of the turning vane.9 et or ebove 170-F.
Limiting the injection rete in thin menner else limited SO2 removal.
. .^
The perametric lime inJection tests aleo shoved that the etomizere must be arranged to:
0 Avoid impingement of one spray on enother
0 Provide minimum cleereneee of 2 feet from the ceiling end 2-l/2 feet from wells
4.1.4 se Slurrv Iniect’iq4
The system wee operated continuously to determine the long-term effects of lime injection on system perforreuce: During this period, the q yetem control philosophy wee to keep the See temperature above 170.F at the vertical plene in front of the turning venes dounetreem of the injection point. This Uempereture we determined by menuelly taking en l&point temperature traverse. The temperature et eny point in the treveree wee regulated by manually adjusting the lime slurry rrte to one or more of the nine injection atomizers.
This procedure wee usually edequete for control during the deytime,vhcn the boiler load we fairly conetent. However, during periods of sudden boiler loed changes, particularly et night, this menual control technique wee not sufficiently responsive. This situation resulted in momentary excessive
injection rete8, low profile temperatures, end consequently, some deposits on the surrounding ereee.
Celcitic lime (CL), both freshly eleked end ee e elurry prepared from dry hydrate, wee tested during the continuous run. Significant end rapid erosion of the nozzle diecharge tips we8 experienced with both CL types.
BB:8304r Part 3
4-6
210

‘1,
i
4.2 DEPOSITS
Although the test system operating philosophy vss to avoid deposit formation, come did occur. Ae mentioned earlier. deposit8 formed s8 s result of erosion of the stomizer tips snd from the insbillty to closely follow plsnt load. Most of the deposits were frisble and eseily dislodged with s light blow. Others, sppsrently formed from vet droplet8 or incompletely stomized sprsys, were very hard and difficult to breakup or to dislodge.
Several unit outages provided the opportunity to enter urd inspect the deposits inside the system. While the extent of the deposits vsried, and they
were never severe enough to Interfere with the plant operation, the deposit pattern hsd the following typical chsrscteri8tic8:
0 Floor deposit6 in sn sres just dovnstresm of the stomizers ,to the downetresm turning venee
0 Slight deposit8 on the duct ~118
0 Deposits on the conceve (impsct) sides of the dovnstream turning vsaes snd spsllsd off deposits on the floor under the vsnes
.,., 0 Aegligible deposits on the convex (nonimpact) sides of the
turning vane8 snd the top of the duct
0 Some deposit6 on the perforated baffle at the inlet to the l lectroststic preclpitetor (ESP)
0 Deposits on the ESP dischsrge virss
While deposlta did form in the test system during the test progrem, the fsctora re8pOnSible for their formetion sre known snd countermessure8 CM be
tsken to l liminste or minimite them. There messures include:
0 Improved configuration of the stomizers to eliminste droplet impsction on sdjscent oprsye
0 Use of nozzles vith erosion resistant tip8 to reduce nozzle wear and eliminste nonuniferm eprsy patterns
0 More sophlsticsted inetrrrmentstion to provide better process control and load-following cspsbility
0 If necessary, instsllstion of mechanical devices to dislodge snd remove depOSitI
RR:830Ar Part 3
4-7
211

4.3 SO2 AND RO, BEMOVAL ,b
As noted previously, the need for slurry to dry before contacting the turning vsnea only 35 feet dovnstresm of the nozzle8 limited the slurry injection rate. This situstion resulted in limited SO2 remove1 below the DOE goal of . 50 percent snd, also, limitsd AOx removal. Considering the injection rates :T
that were possible, the SO2 and AOx removals were impre8sive and also provided high lime utilizstlon. Lime utilizstion 18 defined a8 the percent of
lime fed that reacts. (See Appendix J for a discussion on the cslculstion of
lime utilirstion). The following typical reeults were obtained:
0 With PEDL injection, SO2 removal ranged from 6 to 30 percent depending on the slurry flov rate snd concentrstion. AO, removal rsnged from 8 to 21 percent snd increseed vlth incresslngz slurry concentration. Lime utilizstion, based on combined SO2 snd 110, removal, ranged from 23 to 90 percent.
0 With freshly slaked CL, snd for the condition8 tested, SO2 removal raged from 10 to 22 percent, AO, removal ranged from 8 to 18 percent, and lime utillzstion, baaed on combined SO2 snd ROo, removal, ranged from 23 to 33 percent. Two particular factors may have been reSpOn8lble for these results.
- The teets with the freshly elsked CL were conducted with eeverely worn nozzle tips; new ripe ware not svsilsble at the time, snd the teat schedule did not permit repeat tasting with new tips. The unexpected lower performance obtained EM be explained in part by deteriorsted stomizstion reeulting from eroded nozzle tips.
- The short reeidence time in the spray zone may have sleo reduced the performsnce of the CL.
0 With a slurry prepared from dry hydrated CL, and for the condition8 tested,~ SO2 removal rsnged from 7 to 12 percent, li0, removal ranged from 7 to 12 percent, and lime utilitstlon, based on combined SO2 snd l70, removal, rsuged from 29 to 44 percent. Some of these result8 may have been influenced by testing with worn nozzle tips.
For all three limes tested, both SO2 snd Abx removal increased with increasing lime concentration, vhile lime utilitstion decreased vith incressing lime concentration.
Table 4-l is a sunmwy of SO2 snd !iO= rcmovsl snd lime utilizstion results obtained during the testing.
RR:g304r Part 3
4-8
212

section 5
ESP PERFORMAXE
The Confined Zone Dispersion (CZD) injection point was located in a ductwork section between two electrostatic precipitators (ESPe). The ESP upstream of
the injection point had a psrticulste removal efficiency of 75 percent. The downstresm, or test ESP, was a plate snd weighted wire design manufactured by the Buell Rmiseion Control Division of Envirotech Corporation. (Refer to Appendix L for the test ESP chsrsctcristics.)
The performance of the ESP we8 monitored by sn online opacity monitor in the
stack. Although this stack also exhausted the gas from the other duet of Unit 15, the opacity monitor reading8 were felt to be a good indicstion of the
perfomencc of the test ESP. Specific mes8uremtnts of the psrticulstc removal efficiency of the test MP, with snd without lime injection, were also taken to determine its csp8bility to hsndle the sdditionsl grain loading during lime injection.
In addition to the di8cu8sion below, informstion pertsining to the ESP performance is included in the following appendices:
Appendix L: Chsrsctcri8tica of Seward ESP
Appendix H: Report on Psrticulst8 Emission8 by Clesn Air Engineering, Inc.
Appendix Ii: Review of Seward ESP Performance Data by W. P. Lsnc, Bechtel
Appendix 0: Seward 115 Prseipitstor Performsnee Evslustion by D. L. Streln, PEAELBC
5.1 STACK OPACITY
5.1.1 Par-trfc
During the short-term parsmetric lime injection teats, the opsclry decreased, remained lover during injection, snd than inerss8ed when injection stopped. Figure 5-1, the August 14, 1987, recording of the stack opacity, shows this effect.
RR:8305r Part 3
5-l
215
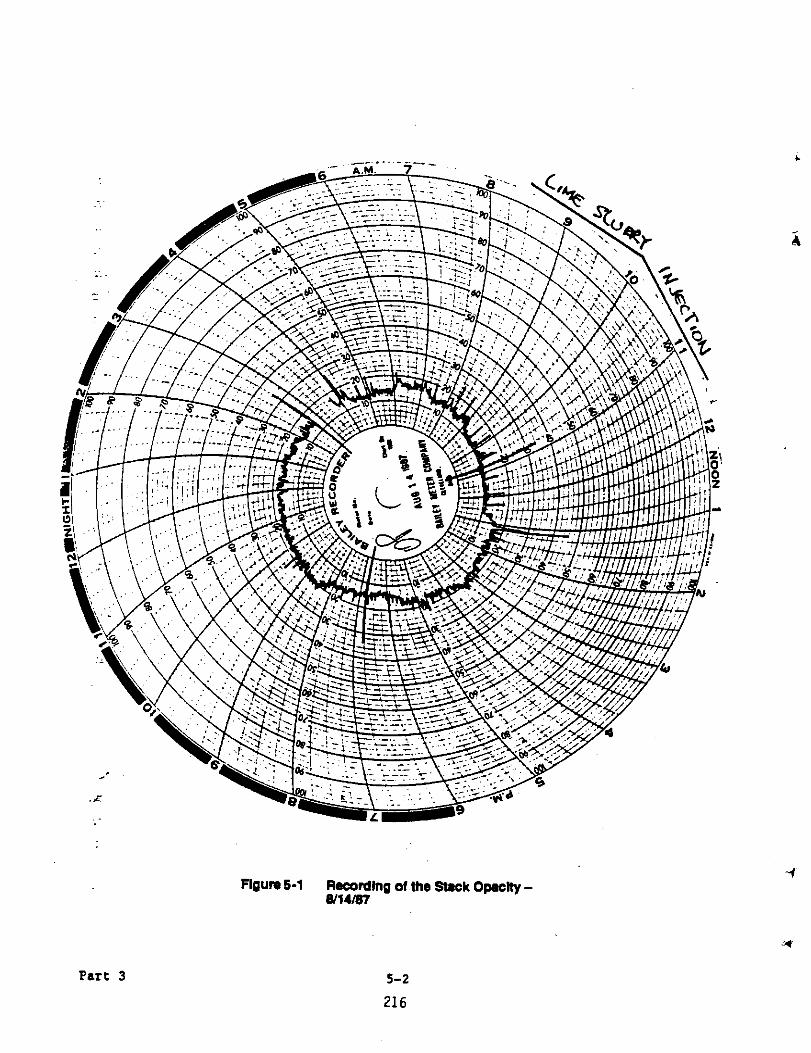
Part 3
Flgun 5-1 ROCOrdlng otthe SWck Opactty - 8/14/m
5-2
216

5.1.2 Continuous Lime Iniection Tests
During the long-term, continuous lime injection ttete, the opacity decreased at the start of injection and remained low. However, after 5 to 10 hours of
operstion, the opacity roee to a lcvcl exceeding the original one (baseline
level) prior to the start of injection. The opacity was restored to the baseline lcvcl by using off-power rapping. Off-power rapping refers to sequentislly dcenergizing each of the tour ESP fields for a few minutes (while three fields remain energized, the fourth field is rapped while It Is dcenergized). During the off-power rapping period, there were ucursions in the stack opacity. Off-power rapping has to be repeated epproximstely every 8 hours during continuous injection.
FigWe 5-2, the October 23, 1987, recording of the stack opacity, shove the reduction in opacity level after off-power rapping at spproxlmstcly 3 sm, 9 am, and 6 pm.
5.2 ESP TEST8
5.2.1 Particulate Removal Efficiencv u
Clean Air Engineering, Inc., Palatine, IL was contracted to determine the psrticulste removal l fficitncy of the test ESP. Mcssuremcnts were made during PHDL injection (10/15/8?), during CL injection (10/23/8?), and for fly ash alone. i.e., no injection (U/10/8?). :Three sets of 8imultsneous psrticulste concentration meesurements were teken at the inlet snd outlet at the ESP on each day. The slurry injection rate was similsr during each measurement.
The results are summsrized in Table 5-l. From the table, it csn be seen thst the average particulate removsl efficiency was slightly higher during CL injection (98.043) and slightly lower during PKDL injection (95.48%) compared with fly S8h alone (96.56%). The sverege emissions were spproximstcly the esme during the CL injection (0.0685 lb/HBtu), but higher during PHDL Injection (0.1214 lb/MStu) compsred with the fly ash alone (0.0707 lb/HBtu).
The inlet loading during CL injection wee 80 percent higher than with no injeetlon. The cspsbility of the ESP to maintain emission lcvela during CL injection to that with no injection is very encouraging. This supports the
RR:8305r Part 3
5-3
217

,..’
ngun 52 @o~g of thy Stack Oplclty -
Part 3 5-4
218

Table 5-l
PARTICULATE EMISSIONS (PE)
PE Without PE With Lime Slurry Emi8slons Lime Slurry and with snd with Injection Type S Lime Hydrated Lime 00 (10/23/B?)
INLET ------ rate of Three Tests - - - _ - - _
us Conditions
Temperature, ‘F Moisture, X vol. 02, X dry vol. co2 I X dry vol.
wtrlr Flow Rate
244 191 194 5.2 7.3 7.2 9.6 9.3 8.5 9.7 10.3 10.7
scfm dscfm
hctJcul*te Cone,
Grelns/dscf
OUTLET &es Conditions
Temperature, l F Holsturc, X vol.
iEn X dry vol.
2, X dry vol.
Volumetric Flow Rate
290,133 197,833
0.7845
262 4.0
10.2 -9.3
249,533 309,133 176,700 218,433
1.1034 1.4056
225 226 7.1 .6.9 9.3 9.2
10.5 10.3
ecfm 319,033 324,233 317,300 dscfm 221,200 225,466 218,733
Grsins/dscfm Lb/hr Lb/M&u*
PARTICDLATE REMOVAL EFFICIENCY X
0.0275 52.13 '0.0707
0.0499 0.0273 96.37 50.87
0.1214 0.0685
*As calculated with en FD factor of 9.277 9.440 9.864
RR:8305r Pert 3
5-5
219

possibility that lime injection, vhile increasing the ESP inlet loading, may not increase emissions. The r**son for this is that the reduced flue gas temperature reduces the particulate resistivity and promotes collection. This phenomenon is especially true at pl*nts such as Sevard that bum lov-sulfur coal.
The PADL data indicated higher emissions vith * higher inlet loading.
5.2.2 RSP 0oeration.q
T*ble 5-2 is * summary of ESP test data with and vithout lime injection including the average power to each ESP field. The use of these data in analyzing the ESP performance is discussed belov.
&s Temuerature Effects. The decrease of flue gas temperature with lime slurry injection allowed increased pover input to the precipitator by the automatic voltage control system. The average pover with no lime injection v*s *bout 92,000 kW. This amount v*s increased by 25 percent to 114,000 kW vith lime injection.
With m assumed rverage gas rate of 300,000 acfm, the pover consumption in terms of v*tts per 1000 acfm vas about 306 vith no injection and 380 with injection. The 25 percent increase in power input would be utpected to improve collection efficiency.
Field Inuut Power Variation. The data in Table 5-2 show considerable variation of power input from field to field. Generally, the pover consumption is expected to increase from field to field through the pr*cipit*tor. This is due to less particulate in the s*s stream *s it reaches
successive fields. The dats indic*te lov paver input to the second and the fourth field during elurry injection, compared with the pover input to the other tvo fields.
The variation of power input in this unexpected way is symptomatic of other
problems vith the precipitator.
RR:8305r Part 3
5-6
220
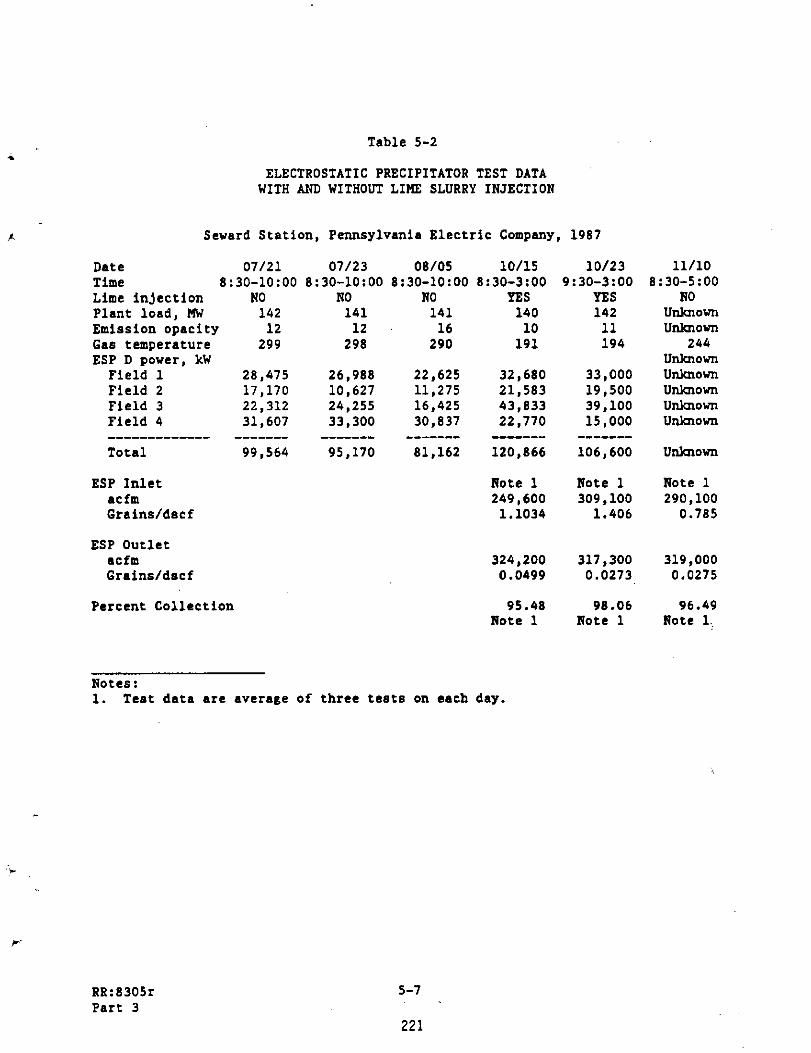
.
f.
Table 5-2
ELECTROSTATIC PRECIPITATOR TEST DATA WITH AND WITHOUT LIME SLURRY INJECTION
Sevard Station, Pennsylvania Electric Company, 1987
Lime injection
Date
Plant load, MW Emission opscity GAS temperature ESP D power, kW
Time
Field 1 Field 2 Field 3 Field 4
NO
07/21
NO
07/23
NO
08105
YES 142
10115
141
8:30-10:00
141
8:30-10:00
140 12
8:30-10:00
12
8:30-3:00
16 10 299 298 290 191
28,475 26,988 22,625 17,170 10,627 11,275 22,312 24,255 16,425 31,607 33,300 30,837
--- ---- ------- ------- 99,564 95,170 81,162
32,680 21,583 43,833 22,770
lo/23 9:30-3:oo
YES 142
11 194
ll/lO 8:30-5:00
NO UdU-lOVIl
UllkllOVn 244
Ul-hOVIl un3novn unhovn unknovn unhovn
------------- Total 120,866
33,000 19,500 39,100 15,000
------- 106,600 unknovn
ESP Inlet Note 1 Note 1 Note 1 ACfD 249,600 309.100 290,100 Grains/dscf 1.1034 1.406 0.785
ESP Outlet ACfrn Grains/dscf
324,200 317,300 319,000 0.0499 0.0273 0.0275
Percent Collection 95.48 98.06 96.49 Note 1 Note 1 Note 1:.
Notes: 1. Test data are average of three tests on each day.
,
RR:83051 Part 3
5-7
221

These problems include poorly performirig automatic voltage controllers, .c
inadequate rapping, and, possibly; collection plate rappers to discharge electrode alignment problems. It is suggested that with modific*tions, this
‘precipitator could perform better. Installation of modem *utom*tic volt*ge . controllers and better rapping systems at other plants have reduced emissions A,,
--- by over 50 percent in many c**es.
ESP Collection EffFciencv Variatipn. The average collection efficiency during ” lime injection of 95.48 percent on October 15th is consider*bly different from
the 98.06 percent’obtained or~ October 23rd. There is no obvious explanation for this variation. However, it is expected that nonuniform rapper and voltage controller operation may have played a part.
It is also of interest that, of the 2 day* vith slurry injection, the day with .- the lovest pover input had the higheat collection efficiency. In fact, the
pover input on the high collection day v*smlover in three of the four fields. ~. ~- This is not compatible vith precipitator technology.
.” in* System Comments. This prccipftator utilires oibr*tbro to clean the
discharge electrodes and electrom*gnetic impact rappers to clean the e.O collection plates. Vibr*tors have performed vell *t many plants but have also
~‘been insdequate at many others. The condition of the collection plate rappers ” is not known and deserves some Attention. Rappers deterior*tc with time. ’ This includes deterioration of the co~ils, linings, pover suppliers, and
controllers. It is possible that the rappers for the *econd field *re not rapping AS h*rd AS the other rappers or that the rapper shaft to support beam
connections *re loose.
-’ It is notevorthy that with slurry idectiou the pover input increased to e*ch .‘.T field’ except the fourth. The plant utilized off-pover r*pping to clean the I” collection pl*tes *t times during the injection period. this practice did not
occur during the Actual emission testing and YAS not utilized for the’fourth field.
-4
RR:8305r Part 3
5-8
222

Off-paver rapping refers to shutting off the trensformer power supply to a e field vhile it is being rapped. The lack of corona current flov reduces the
amount of electrical charge holding the ash to the collection plate, thus making rapping more effective in removing the ash.
The plea is considering the installation of A nev repping control system. This vi11 probably improve performance.
Maate Produe-, The veste products collected by the test ESP vere A mixture of fine coal ash, reaction products consisting of sulfetes and sulfites of
calcium end magnesium, end unreacted lime. The mate VAS A fine, dry, free-floving powder. No problems were encountered in difacharging the materiel
from the ESP hoppers.
5.2.3 m f the effect of Limm ESP m br
e
Mr. D. L. Strein of PEAELEC, the ESP Specialist, anelyzing the electrostatic precipitator behwior during the lime slurry injection test, made the following observerlone (see Appendix 0 for the complete report):
II . . . Upon initial injection of the lime slurry, the steck opacity decreased end the precipitator current deneity increased. Ihis is likely il.. caused by flyash agglomerrtion and e possible decrease in ash resistivity due to the presence of moisture end A decrease in g~s temperature. As
time vent on, the opacity and precipitator povcr would deteriorate to the point where the opacity VAS near the 20% regulatory limit. Power-off
rapping VAS then necessary to bring the stack opacity beck dovn to where it vas initially before the lime slurry injection van started. The ceuse of the precipitator performance deterioration is likely due to the plate
and vire build-up which accumulated over A long period of time. When the lime slurry system ves shut down, the opacity vould initially increase to -values well Above 20X. After A short period of time it vould then recover to A value under 20%. I suspect this phenomenon VAS caused by the
precipitator shedding its accumulated layer of the ash/lime combination.
RR:8305r Pert 3
5-9
223

It is quite normal for a precipitator to experience a transient condition upon a eudden change in flue gas composition. I suspect in this ease the shedding VAS due to A sudden increase in gas temperature vhen the slurry system vas shut down.
c
“It is impossible to predict vhethcr or not improvemente in the lime slurry injection system could be made vhich would eliminate A capacity
m problem on a long term basis. However, the main concern at this point appears to be deposition of the lime in the precipitator inlet duct, the precipitator;inlet perforated plate, and the internal collecting plates and emitting wires. The deposition problem could very vell be caused by insufficient drying time. If this deposition problem can be resolved, I believe the opacity problemcan be reduced. Iiovever, if further experimentation vith this system indicates the deposition problem has been resolved and an opacity problem is still created, there are no quick and l *sy solutions. Prob*bly the only solution that would deal with this type of problem is A larger precipitator.”
'RR:8305r P*rt 3
S-10
224

Section 6
AIIALYSIS OF so2/mg RImovAL RATA
6.1 so2 RmovAL
The test results presented in Section 4 indicated th*t lime slurry concentr*tion had m effect on SO2 remov*l. To further investigate this effect, the test d*t* for PRDL presented in T*ble 4-l vcre rcarrmged into four groups according to veight percent olurry concentration. The four concentration groups Are:
0 Very low (1.6 to 3.7 percent) 0 LOV (4.7 to 6.5 percent) 0 Medium (7.0 to 7.8 percent) 0 High (8.3 to 13 percent)
The groupings are shown in T*ble 6-l.
A plot of percent SO2 remov*l versus g*llons per minute of slurry injected VAS made identifyipg l *ch group vith A unique symbol. A line VAS then drsuu from the origin through the data points for e*ch group.
The plot is shown in Figure 6-l.
Figure 6-l ahovs that the Seward test data exhibit A positive liae*r relationship of SO2 rsmoval versus slurry injection rnte. The data also show that, *t A given injection rate,
eoncent~btion. SO2 remowl incre*ses with slurry
6.2 LIHR UTILIWTION
The utiliz*tion data in T*ble 4-l were plotted to determine how lime utiliz*tion is related to lime type md lime conccntr*tion for SO2 ad NOx removAl. Lime utiliz*tion is defined AS the percent of lime fed that reacts
(see Appendix J).
ER:8301r Part 3
6-l
225

Table 6-l
8112 8/13 816
9/17 8/20
,9/18 9/21
< . . 9123 ',9/15
8/14 " .'10/15
.r Slurry concentration rnngc: 7.0% - 7.8%
10/15 ~ .10/15
10112 ,I 10/13
' 9124 '.% 9/15 ~' 10113
0600-0700 1400-1500 2nd shift 2nd shift
.' 10/13
Test I 1700 3rd ehift
12.1 13.8 16.8 19.7 15.4 18.6 15.3 17.3 18.5 20.0 15.2 17.6 18.7 21;l 14.5 16.6
7.1 7.3 7.4 7.5 7.1 7.8 7.8 7.8
8/17 '8118
' 8119 .e
Note
Test II
0000-0300
SEWARd DOLOMITIC LIKE DATA GROUPED BY SLURRY CONCENT6ULTION
SO2 ,Slurry Slurry Remov*l Feed Rate Concentration
LX) cwt Xl
Slurry concentration r-e: 1.65% to 3.74%
6.32 22:s 1.65 12.4 30.0 3.13
7.7 19.0 3.74
Slurry concentration range: 4.7% to 6.5%
12.0 17.5 4.7 17.2 30.0 4.9 12.0 18.5 5.0 13.0 17.5 5.8 16.8 22.2 5.9 12.4 18.4 6.0 20.1 27.5 6.1
8.9 14.1 6.5
Slurry concmtr*tion range: 8.3% - 13.0%
23.4 35.0 a.3 29.4 33.0 12.4 22.2 27.5 13.0
RR:8301r Part 3
.C. 6-2
226

I 1.
L *
.
b’
.a7
Z C b 8 IO’ I, 14 lb I8 2.0 za 24 Zb ad 30 52. 3b 36
SLuRl2y ItJTELTlOrJ RATE &?“I Part 3 6-3 227

.L Figure 6-2 is a composite plot shoving the effect of calcitic lime utiliz*tion
_ versus lime slurry concentration;;for SO2 removal, NOx removal, and ‘combined S02/NOx removal. Figure 6-3.1s A simil*r plot for PBDL. The lines in Figures 6-2 and 6-3 are empirically fitted to the data.
From these plots, the Seward test data shov the following relationships:
.z 0 Both CL and PBDL utilization decrease with increasing lime 7.: concentration for both SO2 and NO, removal.
0 PBDL utiliz~tion is higher compared with CL for either NO, or SO2 removsl at A given lime concentration.
6.3 PROJECTIONS FOR 50 PERCENT SO2 REMOVAL
As noted earlier, the short residence time available in the test duct at Sevard limited the lime injection r*te to a point where a maximum of only
_ .,I 30 percent SO2 removal could be obtained. A full-scale commerci*l system ~: with r~ longer straight run of duct would not be limited in this way.
T Furthermore, the ductwork configuration at Seward la suitable for installation . ~ of a second aet.of atomiters upstream.of the met used, which would .-~ .,_ .~i ..~ approximately double the residence time. This would ~llov more slurry to be
II ., .., injected and result in higher SO2 removal.
,z~ z
.y The relationship shovn in Figure 6-l cm be used to project the slurry .:, injection rate and concentration required for 50 percent SO2 removal. The :, relationship for medium lime concentration (7.0 to 7.8 percent) has been
reproduced and extrapolated in Figure 6-4. By this extrapolation, the injection of about 55 gpm of 7.5 percent PHDL would remove 50 percent of the
SO2 at Seward.
.;’ ,~.
.;i,. This extrapolation is probably conservative. The testing et Sevard had A ‘,~ .-. relatively omsll confined zone which allowed A large fraction of the gas to ,.,. bypass the CZD treatment. Using two-stage injection and increasing residence
time would permit more injection points, better gas/spray dispersion, A larger urd more uniform confined zone. and a closer approach to saturation
: temperature for the treated gas. These factors ehould provide better lime
utilizstion thereby obtaining 50’percent SO2 removal at an injection rate lover than 55 gpm.
RB:8301r ~;a P*rt 3
6-4
228

k -p: ,,/,I, i ,, I I /(I’,, 1 i I ? 0”s ’ ;,:j:?/ ,) I ;
/ I 1, ‘1 Ii,. / ,,,, I I I ,,#~,I:, / .,I, ,,, l.vz?
,, ; I”,:, ,I’ ,il! I,!i!I,k; I I!1,,4 :I,:::; Ii I 1’ ,,, ,,,.
~I~,,,I’!III//, I I I I ,, :#,, I ,. ,, I, /.,/~SI ,,I,,,
/ I i,, ” , , I I I,, I I / I N
II I I’, ‘,,
I I I/, I i:.,. IHI , I I I I I i I l,I I,! I I ,I,‘:,i::/ ‘-t:
J 11 IL/!,1 i 1 ‘i 1: ,‘I 1 1 , , ( , ) l:!iI */.:;:I’ /;,i, , ,
Part 3 0-2 LLY

0 0: ., r. d n’ 4 - c-c . . ..^

CI 4, 4,
J 41
: E 0 t SC
e a’ ?a
4 u ae
L: ?j
(, lfl 0 tc
~-.. $ ;
14
Ii
H 11. W
? ‘
+
a
CLD rEstiuC hT PrrJci.CC SEu*fW Sr*riOd -- ,.,
j-.y:
Y
,/- *” /
/ bJ / +;. cl‘
IJ .i;
/ ’ 40*+9 #i.
/ ’ ,&;y?. ‘$ E’)
/ /
,&y y’. 1;” .,x
/ 4 ( ;L p”- / <if:‘\6 ‘A.
’ “C...’ *. , _ ($ &4+
/ /
.!4- $; f! ‘f., 32 ’
/ /
J& .if ,.~ +t..
/ .’ ’ y. $i .(Ig,Q.‘y\(‘.
/
Fl~un 6-d Avemgm Te8t Data with 7.6% Lime I Sluy Cone. and Extnpobtlon
,.:’ to sok SO, Romovsl
2 4 6
Part 3
4 IY ,l I* I& ,I 0 1, Y a& u JG )a a& Y J?U 41 46 ba 4c SC 5. A n B ‘.r
G rn 08 aia~irf9 LiWE rcv.emy
6-7
231

Two-stage lime injection is expected to provide much higher ROx removals
compared with that obtained in the single-stage injection tests during the
Seward test program.
At any given SO2 removal, the injection rate could also be lowered by increasing lime feed solids. However, utilization would be reduced. For
economic reasons, it is better to operate et conditions that produce the higheat utilization which implies operating at the lowest feed solids possible.
ltR:8301r Part 3
6-6
232
PART 4
Combined Analyses and Projections
CONTENTS
1 COMBINED DATA ANALYSES
1.1 Correlation Approach
1.2 SO2 Removal Predictions
2 FULL-SCALE PROJECTIONS
2.1 Use of Test Results in Projections
2.1.1 NO, Removal
2.1.2 Deposits
2.1.3 ESP Performance/Upgrading
2.1.4 Atomizing Air Pressure end Flow Rate
2.2 Case 1: Generic 500 MWe Reference Plant
2.2.1 Power Plant Design Information
2.2.2 Conceptual CZD Process Design Criteria
2.2.3 Process Description
2.2.4 Major Equipment
2.2.5 Economics end Cost Estimates
2.2.6 Sensitivity Analysis
2.3 Case 2: Campbell Unit 1, Consumers Power Company
2.3.1 Conceptual CZD Process Design Criteria
2.3.2 Process Description
2.3.3 Major Equipment
m
l-l
l-l
l-12
2-l
2-l
2-2
2-3
2-3
2-3
2-4
2-4
Z-10
2-12
2-14
2-21
2-28
2-37
2-36
Z-40
2-43
AR:6441d Part 4
1
233

Section
2.3.4 Economics and Coat Estimate8
2.3.5 Sensitivity Analysis
m
2-47
Z-50
h
AR:S441d Part 4
ii
234

ILLUSTRATIONS
l-l
l-2
2-l
2-2
2-3
2-4
2-5
2-6
2-7
2-8
Calculated vs Actual SO2 Removal for Full Regression Case
Calculated vs Actual SO2 Removal for Fixed Exponent Cane
Retrofit Factors for Reference Site
Reference Plant Cross Section
Reference Plant Site Plot Plan
500 MW Conceptual Design - Case 1 CZD Process Flow Diagram
Retrofit Equipment Location Plan
Campbell Station Unit 1
260 Mw Conceptual Design - Case 2 CZD Process Flow Diagram
260 MW Conceptual Design - Case 2 Major Equipment Layout
l-9
l-11
2-8
2-9
2-13
2-15
z-17
2-39
2-41
2-44
AR:g441d Part 4
iii
235


. . ,.,
TABLES
l-l
l-2
l-3
l-4
l-5
l-6
2-l
2-2
2-3
2-4
2-5
2-6
2-7
2-0
2-9
Z-10
2-11
2-12
2-13
2-14
Seward Averaged Run Data - Dolomitic Lime vith No Water Injection
Campbell Averaged Run Data - Dolomitic Lime with No Water Injection
Campbell Averaged Run Data - Calcitic Lime with No Hater Injection
Full Regression Values
Fixed Exponent Regression Values
R-e of Variables
case 1 - Key Boiler Design Data and Flue GAS Characteristics
Case 1 - Representative East-Central Coal: Illinois Ao. 6 Bituminous
Case 1 - Overall Retrofit Factors
Case 1 - Process Design Characteristics
Case 1 - Bajor Equipment Items
Case 1 - Operating Cost Criteria
Case 1 - Key Economic Parameters
Case 1 - Total Retrofit Capital Requirement Estimate Summary
Case 1 - Estimated First Year Operrting Cost
Case 1 - Estimated~ Cost of SO2 Removal
Case 2 - Key Boiler Design Data and Flue Gas Characteristics
Case 2 - Process Design Characteristics
Case 2 - Major Equipment Items
Case 2 - Economic Parameters and Assumed Unit Costs
.
V AR: 84416 Part 4
r-- 236 ( Preceding Page Blank /
lae
l-4
l-5
1-6
l-8
l-10
l-10
2-4
2-5
2-7
2-12
2-18
2-22
2-23
2-25
2-26
2-29
2-37
Z-40
2-45
2-40

Trble b&E
2-15 Case 2 - CZD Process Betiofit - Projected.Capital Requirements 2-51
2-16 Came 2 - CtD Process Retrofit - Projected First Year Operating 2-52 cost
2-17 Case 2 - CZD Process Retrofit - 30-Year Levelized Buebar Cost 2-53
2-18 Case 2 - Estimated Cost of SO2 Removal 2-53
-;:
AR:8441d Part 4
vi
237

. acfm ADT AST AVC
1 bhp CEM
CL COllC CPC CZD DOE d/s EMV ESP Eff FGD gPm miv ID Injection kscfm L LFR
MWe HOo, AWIK 02 OtI O&M PEDA PENELEC PETC PWL PRDA P&ID P&ID SCA SCf scfm SO2 SO3 ssco T/R
,r U/S VI n WC
ABBREVIATIONS, ACRONYM, AND DEFINITIONS
actual cubic feet per minute acid dew point approach to saturation temperature automatic voltage control brake horsepower continuous emlesions monitor, term used to designate SO2-02 monitor calcitic lime concentration Consumers Power Company confined zone dispersion U.S. Department of Energy downstream effective migration velocity electrostatic precipitator l fficfency flue gas desulfurization gallons per minute higher heating value induced draft spraying lime slurry or vater into flue ges floving in a duct thousand standard cubic feet per minute lime lime feed ratio, moles of lime (both Ca and Ng) fed per mole of SO2 entering megawatts, electric equivalent nitrogen oxides normalitcd vater injection rate oxmen hydroxide concentration operating end maintenance Pennsylvania Energy Development Authority Pennsylvania Electric Company Pittsburgh Energy Technology Center pressure hydrated dolomitic lime (also celled Type S lime) Program Research and Development Announcement piping and inrtrumcntation diagram process end inetrumentetion diagram specific collection srea standard cubic feet standard cubic feet per minute aulfur dioxide sulfur trioxide Spraying Systems Company trensfoxmer/rectifier upstream voltage current water water column, the head difference in a water manometer
I All temperatures are in degrees F, unless specified otheniee.
vii U:g441d Part 4


Section 1
COlfDIlggD DATA AMLYSES
As discussed in Parts 2 and 3, the data sets obtained from the Campbell site and the Seward site uere separstely correlated using several approaches. These spproaches provided good correlations for the data from either site. However, the videly different test conditions st Campbell end Seward made it difficult to analyze the data on a common basis. Compared with Campbell, Sevard had these principal differences:
0 Extremely short residence time
0 Much larger duct cross section
0 Bigher gas velocity and gas flow rate
0 Finer and more uniform atomisation
0 Higher tots1 injection rates
0 Lower inlet~SO2 concentration
0 Lover SO2 removals
0 High approach to saturation temperatures
0 Capability to establish a confined zone
0 Uinimsl duct deposits
An attempt uas made to use the rational and empirical correlation approaches described in Part 2 to correlate the combined SO2 removal data set from both sites, but no useful correlations were obtsincd. A new spproach uas developed, suggested by the correlation for the Scuard dsta of SO2 removal versus lime slurry injection rste shovn in Part 3, Figure 6-l. This approsch, described below, successfully corrclsted the combined date set and appears to provide rersonable utrapolstions for the full-scale projections.
1.1 CORRELATION APPROACH
Figure 6-l of Part 3 show thst the percentage of SO2 removal increases with an increase in either slurry injection rate or lime concentration. This is
RR:g30Dr l-l Part 4
239

,~ expected because either action increases the amount of lime available in the system to react vith S02. ,?
Furthermore, the increase in percentage SO2 removal is shovn to be
proportional to the increase in slurry feed rate. At Sevard, the flow rate, _ temperature, end SO2 concentration of the untreated gas vere quite stsble.
and the short residence time limited the injection rate. As a result, the
2. temperature end SO2 concentration of the treated gas vere held to reletively narrov ranges, and the SO2 removals were held to A smsll range of lov to moderate values.. Under these condition.8 of relatively constant flue gas properties end low SO2 removals, A proportional relarionship betveen percentage SO2 removal end injection rete is reasonable. For a broader range of operating conditions, A direct relationship would also be expected, but it would not be expected to be proportional.
Percentage SO2 removal does not increase proportionally with lime concentration. Although there is scatter in the data, Figure 6-l of Part 3 shows that, at II given injection rate , an increase in lime concentration
” yields a lesser increase in SO2 removal. This effect is also supported by the decrease in lime utilizstion with increasing lime concedtration for both
,, the Campbell and Seward data AS ahovn, respectively, in Figures 6-14 and 6-15 of Part 2, end Figures 6-2 end 6-3 of Part 3.
i It was also known from the analyale of the Campbell data, end from reports on spray dry flue gas desulfurization (FGD), that there is a strong inverse relationship between percentage SO2 removal and AST.
: Furthermore, logical enalysis indicstes that percentage SO2 removsl is .72G inversely related to SO2 concentration. ll~is can be shown by examining a
hypothetical situation “here s CZD process is operating at conetant conditions end there is a sudden increase in the inlet SO2 concentration while everything else remains constant. The percentage SO2 removal can be expected to drop somewhat. If the’sbsolute SO2 removal vas unaffected by SO2 concentration then, the percentage SO2 removal would be reduced in
,-proportion to the change in SO2 Concentration. Bovever, because a higher SO2 concentration provides A higher driving force for SO2 diesolution end
RR:g300r Part 4
l-2
240
,I.
‘I
n

reaction, the percentage SO2 removal may be reduced less than in proportion to the SO2 concentration change.
To directly compare the dAtA from the full-sc*le test site And the pilot-scale t&St Site, it WAS necessary to nOrEdIliZe the Shrry injACtiOn rAtC8. Purther- more, because the slurry COnCentrAtiOns At the tV0 test Sites were typiCAlly different, it was felt that A normAliz*tion based on v*ter injection would be more representative than slurry injection. Therefore, the injection r*te v~s normAlized by dividing the water portion of the slurry feed r*te in gallons per minute (gpm) by the gas flow r*te in thousand cubic feet per minute (kscfm). The quantity WAS called the normalized v*ter injection rate (DWIR).
This snalysis suggested a correlation l qu*tion of the following form:
Fraction SO2 removal = K (AWIR)* (Wt Xlb (Avg S02)’ (ASTjd
where:
K =~~e..coefficient to Account for the effect of unmeasured VAriablcs, system differences, snd lime type
AWIR - noim*lited voter injection r*te, g*l/kecf
wt x = feed solids, vt X Avg SO2 = AverAge SO2 concentrrtion, ppmv, vet basis AST = approwh to s*tur*tion temper*ture, V
The snalysis slso suggested that exponents A And b would be positive while sxponents E md d would be neg*tive. Average SO2 concentration (the Arithmetic AverAge of the inlet And outlet SO2 concentr*tions in ppmv on a Y. vet basis) vss used instead of inlet SO2 concentr*tion because it provided the better correlation.
The SO2 removA dAt4 were grouped into three datA sets: Seward pressure hydrated dolomitic lime (PEDL), Clmpbell PEDL injected through two nozzles, and Campbell calcitic lime (CL), shovn respectively in TAbles l-l, l-2, And l-3. The dAtA for Campbell PRDL injected through one nozzle were not used
RR:g300r Part 4
l-3
241

TAble 1-l SEWARDAVERAGEDRUNDATA
DOLOMTK: UYE WITH NO WATER INJECTION
LIllE UlIL lOTAL OulLEl IKASUKD FOR LINE LINE INlET TEIIP, F SAS so2 coNc FLLE 64s YAlf R
Run SO? so2 nnn FEE0 RAlE CONC TEIIP :(TIN-15 IkEI OlJlLEl FLOY RATE INJ RATE DATE NOTE Rnvt x LFR 004 rt2 dcg F -2:FEEDl PPW ret PPBV ret loo0 SCFN Spfr pp~
-_-_- __------ ------ -----em- m------m --mm--mm --_____- -----mm __--_--- _--___-- -_-----_ ------__- ------- --_----. 00/06 7.7I 39.40 0.195 08/12 6.31 56.30 0.112 m/13 12.3 45.70 0.272 OS/l4 20.11 43.20 0.466 00/l? 25.41 27.50 0.851 OWI 29.41 22.M 1.m m/19 22.21 19.00 1.168 08/20 17.21 40.50 0.425 09/H TEST I 15.2X 40.90 0.372 09/15 TEST 11 12.41 42.10 0.295 09/I? 12.02 SOJO 0.240 u9/te 12.01 57.00 0.211 w/21 lS.OZ 41.10 0.316 09125 16.81 39.80 0.421 09124 18X 35.60 0.520 IO/12 2nd SW7 IS.11 a.60 0.392 IO/13 1700 18.7: 42.6Q 0.4S9 IO/IS 3rd SW1 14.51 40.60 0.557 lo/IS 2nd SHFT IS.32 43.50 0.353 lo/is mm-urn 8.9s 35.40 0.251 IO/15 0600-0700 12.11 47s 0.255 lO/lS 1400-1Sw 16.W 44.70 0.376
NININtM : IIAXIMM : AVERARE :
6.3l 19.00 0.112 29.41 57.00 1.336 15.51 4o.Se 0.437
19.00 3.74 286 22.50 1.65 279 SO.00 3.13 me 27.50 6.06 279 3s.m 0.28 298 33.m 12.40 295 27.50 IS.00 299 3o.m 4.90 293 17.60 7.75 181 LB.15 6.W 290 17.M 4.71 294 18.50 s.m 200 17.50 S.80 288 22.20 5.87 286 20.00 7.70 288 18.60 7.40 288 21.10 7.80 294 16.60 7.80 292 17.28 7.50 294 14.10 6.50 281 lS.# 7.10 263 i9.m 7.30 292
13.85 1.65 279 n.m 13.00 299 2i.m 6.70 289
233 a02 219 727 213 74s 209 7es 213 740 214 7x0 229 734 218 746 211 783 238 768 244 735 229 749 238 766 x27 753 2ss 734 236 783 2sI 811 244 614 244 705 238 835 240 04s 258 a70
688 218.5 I.018 JR.6 619 207.8 l.ooB 22.3 602 211.1 1.015 29.5 S?l 213.1 1.031 26.6 519 218.5 l.lu4 53.5 470 209.9 I.069 50.9 527 215.5 1.073 25.7 564 217.6 1.025 29.2 (30 no.0 I.041 16.9 642 226.0 1.031 17.8 s97 215.0 1.024 17.1 614 211.0 1.02s 18.0 605 214.0 l.UDl 17.0 576 212.1 1.030 21.5 570 212.7 1.040 19.2 625 210.0 1.039 17.9 634 214.0 1.041 28.3 668 210.0 1.041 IS.9 636 220.0 1.039 16.6 695 205.4 I.054 13.6 681. 216,s 1.037 13.3 603 210.1 l.RlE 19.0
209 727 470 2os.4 l.ma 244 870 69s 226.0 1.073 230 774 610 213.9 1.035
15.J s1.s 20.9
Part 4 l-4
242

2.22 2.n 1.7, 2.0) 2-J, 1-m 2.n 1.17 1.1, a.22 1.0) 23 ,.)I 2,s 2.n 2.14 23s 2.2l 2.8 2.Y 2.7, 2.n 2.0 c.n 2.” 2,s l.Y 136 I.10 ,.I) 1.41 1.n 1.16 132 *.2* 1.47 1.41 L.11 1.11 s.u 1.1, 4.24
0.n 4.24 2.18
In2 ,827 9% 110 1IU
1)u ml 1111 ,119 ml ,119 ,I)( Ins !wi ,*n sns Irn ,411 syo 12,‘ IN II ,241 m ne cm ml SN Irn LY I(Y ml 10, MY
,sn Lrn
79s z n2 m (Lo 2 444 ,I, au ‘71 ‘I4 us a4 yt u2 9, 2m tn 414 w (01 cn ,S, m 604 ‘12 07 m : us s2 6s) I ul m
ii II, Y( I 2
WOS 144s ss.41 2,.n I.L7S 02,DS I,:,, 0.n 2o.n 2.29, m,o, II:20 49.SI 2‘.2s *.m 02/M ,,:oo ts.3, n.41 1.711 Q2,ol I,:,4 fi7.n IS.‘1 2.m Q2,,0 IS:U 27.x ,c.n 1.61, n/,0 IS:Y 4s.n a.n I.67‘ 02,lD 14:,2 17,II 2s.n 1.w D,,, is:21 12.2s s,.n 1.01 n,,t I4:ll n.n &I, o.m G7,,1 ,,:I, n.rr Y.4, 0.112 @2/l, ,,:I0 r2.n 21.12 ,.m Omo I,:,, 19.11 1).4* I.U n,2s Iwo 46.u 25.2s I.ls2 v.J,n II:,0 4s.ss 2s.m 1.987 os,os *a:,0 &IS ,,.n 2.Y DJ,Ol ,2:11 cm, I,.” s.w OS/o> sm, 6B.U ,s.n s.*u OS,,0 we* *.,I ,,.m 2.m WI, ,*:12 ‘Ms II.,, S.Y, 01121 ,r:m I9.‘2 I#.‘1 S.24‘ 01121 Mm ,7.,2 18.” 1.07, OS,24 ,a:,0 47.7s IS.” s.mr
ov27 m:20 r7.m s2.n I.(0 o/2, mu n.n 22-n 1.1n or,27 or:20 4t.m 29.2, 1.412 w/*1 ol:II YOU 21.1, l.Id WI7 r,:m ,,.I! 27.72 2.m
“IIIM : ,,.ol ,*.n 0.212 Yllmn : r.0, ,s.ts 1.w mua : 4%” 22.n 2.126
IYD
,tn 1‘1, ,685 ,127 ,411 14,~ Ins I&2, Is4 101 ,569 ,w MY
I,?4 Is64 ,171 ,W IW I‘24
“I n1 ‘0 “I 79s 92, MD a* m 02 9s M u( ),I ‘I‘ 657 II,
z 04 w a2 m 7‘9 797 IIT m Y, UI OS9 us 644 01‘ ‘II m 4SI no ,111 Ias4 S‘S ml ‘,I
4SI IOY IN
Part 4 3-5
243

TKbk l-s OAMPBELL AVERAQED RUN DATA
CALCmC LIME Wm4 NO WATER INJECTION 25-N,-I
w/n WI OS,** WI, os,,* WM CWS OW‘ WI7 Wit ES,,, WI1 WI2 m/a m/a 1*/a W27 n/21 01121 am
ii ii;:: n/a n/n iii:: m/a s/i% wa SIX m/2, n/27 OS,27 s/a iti o/a z”, e/m Ulrn Yim Y/OS */OS WE*
4r.n u.n a.72 Y.rs I~.,, 4t.n 41.6, 42.22 Sl.27 42.u a.u u.n a.92 s.7.n s2.n n.n u.s* a.u U.R 4c.n 4s.n ,,.I, *.n 44.7, m.2, a.ss a.u ,I.sl 4*.7l u.n u.4, &II u.II 22.0s 0.U 11.u %.I1 s7.a 01.1, 0.7, Y.&s 0.u 4s.a 11.” U.II n.u Y.72 =.a
*Se II9 as su II0 a, sm m
ii n n m
E 2% 0, 274 I 111 01 II m a
nm m a,
27, 29
iii u u II, m m 3) a7 as SIS as m m al
iii
I(0
:: I(0
:: MO 110 770 I(0 su IU Is4 su
I: I(0 I(0 I(0
I: SY SY
:: 710
1: ,(o 1u
t: *a IY IP In In *a sn 19 I(0 IU IU IU IU 148 IU I60
,410 Ix4 1u2 m id,, sm ws 111 SW US9 IW IY7 au ,279 SW ssm SW Mn ,419 ,a 1w ,,a MS7 1‘2, 182 slpl ,I I!44 1‘17 ss40 IY SW au 1‘11 a67 ss2, 1% Iam IW 1st7 IU S‘S, an 111) *SW rn, Isa
,L2 P 714 nl U‘ u2 w 667 N
ii N ‘7s ‘I, u2 YI L), 400 I?7 III ,a &a W Ins ,a .I n, n, 77s 7s Y7 7u sa Y7 “I Y mo ID ‘7, N II‘ as 479 sa uo
I.64 7.” s.2, 2.2, s.2, 1.2, 2.2, ,.I, 1.2, ,.u 5.2s s.2, 1.2, 2.2, ,.,I 2.a 2.22 US a.4, ,.Y 7.”
s2.n r.n I.” 1.11 ,.,I 1.2, 1.22 4.a r.n
r2.a l2.m ,.a s.2, u.n s.2, 2.0
II.22 ,,.a l2.n n.n L.IS ,.a ,I, 2.2, 2.2, ,.I, s.2,
o.m o.sn 0.m @.a, *.*,I c.279 o.)o 0.m #.a, D.W ws, I.as ,.a, C.26, 0.292 #.WS 0.N a.11 ,.a4 I.2u ,.*a ta,
..a, ,.a2 1.111 I.244 Mu ma un 0.m I.Iy cm 1x4 ,.I* 1.11) c.m 1.) ,.m Mu a.m 1.1)) 0.m 1.m 8.3, *.m Ix! cm
sm ,119 SK7 1S1, sm ,a, m ,m Ix) ,277 ,111 111) ,R ,227 ,m Lrn U7S la2 uss uu ,117 ,m sm ISI, ,111 M Ial m Isa 1u ,(Y SU‘ SY ,114 ,m 1u1 ,472 tn 10, ua ,a, ,112 Ius as* us7 101 Iuo I462
m Y 07 tn 09 Y Y I) 719 Y m 7,s m ‘” us ‘I‘ YI zi 7a iit nd us 6: MO 429 07 01 m
z Y m
si ?a ms ,u 9,‘ 9Ll ,I7 n7 N “4 m I(0 “1 01
iii m N 97, au ISY M7s ,670 a14 IY w (I m 110s ,*a sm “9 m ,m ,119 92s “I
7:: ,I7
Part 4 l-6
244

Toblo l-3 (Cont’d)
CA/OS ID:,0 70.4s J7.1, I.89‘ MID1 ,,:I, U.82 nn 1.811 wo, 2s:so u.n o.,, 1.111 Cd06 07:so &,.*I s2.5, ,.lBd YllD mm 67.n strn 1.791 WI, wm &A” 42.11 ,.!a WI 07:JO 67, I2 n.n 1.1% W12 Ol:U KS2 an 1.11‘ w2 mm sn.07 I,.” P.W w12 mm s7.n 47.7, ,.,o( WI2 mu *.a es.* ,.I40 W12 2I;Io Y.02 ss.8, ,.DSS U/IS D,:ID s&Es s2.n ,.m u/1* n:n la‘* rr.n l.D( Wl, 07:m cr.n ,,.I, 1.277 WI, ~):m 9.2, 4s.n I.,R W/IS 17:so %.I2 o.n 1.742 07m DI:,, I,,01 4‘.II 1.097 07174 mm 12.n ,,.n ,.w 07,Z ,o:m 4c.n 0.n 1.173 07124 12:1, 5c.n ,s.u ,.Y, 07174 ,,:,I U.” u.,, ,.*a 07174 ,a:23 0-u n.tr 1.101
“,“,M : s2.n 1L.n 0.w
2% 297 m 297 298 2% aa 294 262 n 292 m ,201 297 SOS x4 II7 so, m n m7 no 111
274 m 217
,500 m Ma 1‘74 I‘2J MU Ins ,,n 764, Is20 *,a Is41 14,1 Isa ,491 IUS Mm I‘Y ,410 IOD 14,s ,247 ,111
,264 I&u 141
23 1.55 ,.‘I 1.12 7.0 1.5s 1.17 I.% 7.a J.0 4.10 I.U ,.a ,.u 2.71 4.01 *.I8 I.9 1.” 1.64 4.19 4.27 2.u
tn 4.Y 2.22
7.” 7.” 2.2s s.n l.7, s.2, 5.2, 1.2, 1.21
,2.n se.22 1.2, MS 7.” 7.” 12.n ,2.n 1.21 I2.72 I,.72 12.71 I,.” I.”
1.11 18.22 I.40
0.115 0.m d.sm P.27, P.SI‘ o.ns o.a, 0.89 e.24, o.a7 0.2% 9.w 0.17 0.11, 024, O.Sl4 o.n, 0.324 0.111 cm o.sa usl 0.297
mu d.lu 0.M
MM 10, In9 ,227 822‘ ,547 IW IU1 Ms ,029 II23 NW II)? Iul MC4 ml Ial ,%a In, la2 Is% 14,‘ 711,
,,A Irn *SW
s42 40 UI m 111 us
iii u2 US ‘72 tm 4R 4,s ud
::: w II, cm 1Y 117 n
sa m 262
u uo a10 Imn w WY w
,079 IOU lptl ,010 ,n 942 w 179 I7 ,041 la2 “I 99, (D7 ,I7 9s
ms 1111 9m
Part 4 l-7
245

because they had shown poorer performance as discussed in Part 2. Each data 8et ~a8 regressed teparnttly using a personal computer-bated regression program to obtain the veluts of the exponents and the coefficient, K, that provided the best fit. Fit vat measured by the square of the correlation cotfficient, R2 , provided by the regretsion program. An R* value of 1 it
a perfect fit; 0 is completely random.
Using the initial regressions a8 a guide, additional regression8 for each data set were made using fixed values for the exponenta. The objective va8 to find single values for each exponent that, when used to correlate each ttt, did not
significantly affect the data fit. The final result was the correlation of
each data ivet to the equation where the measured variables had the ttame exponents and the only difference wtt the value of the coefficient, K. The
value of K, obtained this vty, was a mca~ure of the difference in performance between the test raystems.
The fully regressed correlation (vhtrt the exponents were determined by the regression program) for the separate data Bets gave the values shown in Table l-4 for the exponents, k, and R2.
Table l-4
FOLL REGRRSSION VALUES
Data Set a b c d K u*
Stwwd PRDL 0.707 0.620 -0.208 +0.144 0.49 0.906 Campbell PRDL 0.806 0.278 -0.580 -0.675 346 0.830 Campbell CL 1.196 0.639 -0.210 -0.306 5.7 0.713
Thttt results shov a good fit for the Stvard PRDL data, and somewhat poorer
fits for the Campbell data. The values for the exponents and the coefficient are 80 widely different for the different data acts that a comparison of these values is not useful.
T
A comparieon of calculated vtrcws actual SO2 removal for the Seward and Campbell PRDL fully regressed correlations is shown In Figure l-l.
.
RR:g300r Part 4
1-S 246

X
,i;;
(Do 8 8
X dd X
X n ,I
,N 8 .N u
Xti ;I
loholuati 20s Pa7olnao3
Part 4 l-9 247

By examining the eensltlvlty of the .flt to exponent values. fixed values of _. the exponents that had the least effect on the flt vere selected. A final 1
regression using the fixed values for the exponents (Table l-5) produced the
follovlng results:
Table 1-S
FIXED EXPOAERT RRGBESSIOA VALUES
Data Set a b c d K R2
Seward PEDL 0.65 0.45 -0.4 -0.4 27.3 0.077 Campbell PEDL 0.65 0.45 -0.4 -0.4 19.1 0.774 Campbell CL 0.65 0.45 -0.4 -0.4 24.4 0.654
Here, the exponent values ere the seme for each data set and the fit of each set, ,as measured by B 2, is only slightly voree than it was for the fully regressed results above.
A comparison of calculated versus actual removal for this Seward and Campbell PEDL correletloae with the same exponent valuco is shovn in Figure l-2. Rote that this plot is very similar to the one in Figure l-l.
Table l-6 ehovs the range of the verlables used in the correlation.
Varlableg
mm, gal/ksci ntx Avg SO2, ppmv, vet AST, *F so2 removal, x
Table 1-6
RANGE OF VARIABLES
CamDbell
0.06 - 0.15 0.2 - 0.36 1.6 - 16 7.5 - 21 600 - 780 800 - 1200 95 - 130 25 - 55 6- 29 17 - 70
.
RR:MOOr Part 4
l-10
248

t
. 1
Y
Part 4
1ofiowatl zos PJJDlnJlo3
l-11 249

1.2 SO2 EEFIOVAL PBEDICTI,OI'lS t
The correlation provides reasonably accurate prediction@ of SO2 removal when the variables ere within these ranges. The accuracy of extrepolatlone outside theee ranges 1s unknown and should be done with caution. For the generic 500 MWe ce@e, vhere only the SO2 concentration is slgnlflcaatly outside this range, the correlation should be suitable for prelfmlnary dealgn values.
k.
The difference in performance for the Sewerd md Campbell test ayrtems CM be
measured by examining the values of R obtained for the PEDL data sets. The’ value of K for the Seward PHDL data set is approximately 43 percent higher then that for the Campbell PHDL data set. This meaae that system differences provided a 43 percent higher performance at Seward compared vith Campbell. This implies that operation of e large-ecale system almller to Seward et the
._ ~:~ eamc teat conditions used at Campbell would produce SO2 removal results ..Y: approximately 43 percent better than those obtained during the actual Campbell
teste.
Comparlag the value of K for the Campbell PFIDL end CL data mete ahows that the SO2 removal .performencc for celcltlc lime was about 28 percent higher than
that for PEDL, et the conditions tested. .,i Ao useful leree-wale system date
: vas collected for CL, end we therefore have Rio evidence that the improved performance of CL over PHDL will aleo be observed in leree-acrle inetallatione. Further testi- is needed to confirm if calcltlc lime vi11 produce elgnlflcmtly better SO2 removal in e full-scale system.
For the full-scale projections , the’correlatlon should be used with the value
,a of K obtained for the Seward PHDL data. This takes into eccouat the better
- .- i . SO2 removal performmce of the full-ecale system produced by the ability to : :; eetablleh a true confined zone. The lime type should be PEDL becauae this is
the only type for which data are evallable from both test sites.
RR:8300r Part 4
1-12
250

Section 2
FLaL-SCALR PRoJEcrIoRs
Conceptual designs for two full-scale retrofit inetallatlons, a generic 500 MWe unit and J. ii. Campbell Unit 1 of the Consumers Paver Company are presented in this section. The 500 MUe unit is referenced in PBDA RA-22-85PCglOOl (Reference 2-l).
2.1 USE OF TEST P.ESDLTS IN PROJECTIONS
The initial proof-of-concept testing of the Confined Zone Dispersion (CZD) process was conducted et Campbell Station on e pilot-scale level. The results of the Campbell testing were to be used in making the two full-scale projectionsstated above. Department of Energy (DOE) support was provided for
further testing at Sevard Station on e full-scale level to obtain supplemental, and, it was hoped, more realistic data for the projections.
The extent end nature of the test deta obtained at both sites were limited by
physics1 constraints of the test gysttms. At Campbell, the smell size of the test duct promoted deposition and limited gas flow and slurry injection rates. At Seward, the short residence time limited injection retes and SO2
removal. (For~eddltlonal details, see epproprlate report sections in Parts 2 and 3, respectively, for Campbell and Seward Stations).
Despite the llmltetlons, information obtained et the teat oltes le useful in providing preliminary design information for the full-scele projections. This design information concerns SO2 removal, gas outlet temperature, lime type, lime concentretlon, NOx removal, deposition, end ESP performence/upgredlng. The full-scale projections should be reviewed and modified es additional CZD test data become available.
The correletlon developed in Pert 4, Section 1, for the combined Campbell end
Sevard SO2 removal data will be used to predict lime concentrations for the
RR:g306r Part 4
2-l
251

full-scale projections. The value of K (27.3) obtained for the Seward ? : pressure hydrated dolomltlc lime (PHDL) data will be used. This value takes :.- into 6ccount the better SO2 removal performance of the full-scale system :: produced by the ability to establish A true confined zone. The lime type to i ; be used is PHDL because this is the only type for vhlch data are available T from both test eltas. Senslvlty anslyses for calcltic lime (CL), using the :’ woe K factor, and for the use of another K factor will also be conducted for
comparison.
The level of SO2 removal for the full-scale projections la specified *t 50 percent. The levels of the independent variables in the correlation equation will be determined AS follow:
0
II;:
0
0
0
. 2.1.1
AST - The outlet temperature chosen for the projections is 170-F, the temperature required to keep the turning vanes dcpoalt-free at Seward. At 6n assumed saturation temper*ture of 12S°F, this provides an AST of 45.F. For an ideal confined zone *t 125*F, this would 6110~ an envelope of inlet flue 86s *t 2gO’F of approximately 29 percent of the inlet g*s flov.
RWIR - The v*lue of this varlabie will be calculated from A heat balance based on the flue gas ch*r*cterlstlcs. For A given flue gas, once the outlet temperlture is apecifled, RWIR vrries directly with the g*s inlet temper6ture.
Avg SO2 - The *ver*ge concentr*tlon of SO2 in the g*s will be calcul6ted from A m*terlal b6ltiec.
WtX - The correl*tlon equation will be solved for WtX using the v~lucs of the other variables AS specified Above.
@Qx RemowL ‘-* A! the Campbell teat site, AOx removal tests were inconclusive. At the 1 Scvard test site, ROx remov61 reached 17 percent and this could improve with
*ddltlonal testing. The epeclfled NOx reduction for the full-scale
projections is 50 percent. The DOE guidelines require that A pcnllty be
assessed for processes which do not inherently reduce AOx emissions by A minimum of 50 percent. Bec*uee 50 percent ROx removal WAS not demonstr*ted,
this penalty will be assessed and no credit will be tAken for CZD AOx removal.
RR:g306r Pat 4
2-2
252

2.1.2 DeDOSitS
During the full-scale tests, it appeared that deposits could be prevented if the atomlzed droplets dried before they impinged on the interior duct surfaces. Fine-spray nozzles with erosion resistant tips and sult*ble instrumentation for the required process control will be included in the projections to provide for *dequ*te droplet drying. No special mechanical devices to dislodge or remove deposits will be included. If additional CZD testing shovs A need for mechanical devices, the projectlons should be modified 6ccordlngly.
2.1.3 UP Perfo m
The capability of *n existing electrostatic precipitator (ESP) to handle the *ddltlon*l loading resulting from lime injection WAS not conclusively determined during the CZD testing. Some tests lndlc*ted ESP emissions were no greater dur,lng lime injection than vlthout; others indicated emissions increased duilng lime injection. The re6sons for the increased emissions could not be conclusively identified, so it is not possible to specify, corrective measures.
Ao ESP modifications to upgrade performance have been included in the full-scale projections. Aovever, nev ESP conveyors and vaste solids storage silos have been included to handle the increased quantities of v*ste solids.
2.1.4 Atomiziap. Air Prrssure and Flow Rat?
The testing at both sites ehoved that high atomising air pressure provided fine rtomlzatlon which increased the evspor*tlon rate and improved drying. This, in turn, ~110~s A higher slurry feed mte and a closer *ppro*ch to saturation which should increase SO2 removal. A pr*ctlc*l limit of 90 palg WAS established *t both *ltes *nd vi11 be used for the projections. A minimum of 30 scf 6tomlzlng *lr per gallon of slurry ~68 required in the Seward
testing to m*lntaln good temperature profiles and dry downstream turning v*nes. A design v*lue of 30 scf/g*llon of feed vi11 be used for the projections.
RR:8306r Part 4
2-3
253

2.2 CASE 1: GENERIC 500 RWe REFERENCE PLANT ‘9.
The reference power plant specified for this retrofit study is A pulverlzed co61-fired plant consisting of two 500 HWc boiler units (i.e.; Unit 1 and Unit 2). The pl*nt is assumed to be located ne*r Milwaukee, Wisconsin. For
the purpose of this evaluation, only Unit 1 is to be retrofitted for A 50 percent reduction of SO2 using the CZD process.
2.2.1 paver Plant Deslnn Inform*tlon
Tables 2-l and 2-2 list additional power plant design information provided by the DOE guidelines (Reference 2-l).
Table 2-1
CASE 1 KEY BOILER DESIGN DATA ARD FLUE GAS CHARACTRRISTICS
Gb*r*ctexWJsa
Plant rating, MU net 500 Estimated rem*lnlng life, yr 30 Net plant he*t r*te, Btu/kWh 10,000 C*pacity fActor, X 65 Sulfur content of coal, X 4
(Det*lled speclflc*tlon of Illinois No. 6 bituminous coal is given in Table 2-2)
Average heating value of coal, Btu/lb Gas flow rate, l cfm/MW GAS temperature, OF Boiler efficiency, X Average coal bum rate, tph SO2 emission, tph NOo, emission, tph
10,100 4,000 280 88 247 18.77 2.22
RR:8306r P6rt 4
2-4
254

Table 2-2
CASE 1 REPRESENTATIVE EAST-CENTITW COAL: ILLINOIS NO. 6 BITUMINOUS*
Proximate Ana&& Moisture Vol*tile q *tter Fixed carbon Ash
Average tUt%l 12.0 33.0 39.0
m rwtm 10 to 14 31 to 35 37 to 41 13 to 19
Gross heating value, Btu/lb 10,100 9,800 to 10,400 Grlnd*blllty, hard&rove 56.0 Total sulfur, Ut% 4.0 3.4 to 4.6
Ultinate Moisture Carbon Hydrogen Nitrogen Chlorine Sulfur Oxwn Ash
Sllliur Pyrltlc Org*nic Sulf*te
Ash bion. . F Initl*l deformation Softening (H=W) Aemlspheric*l (H=l/lW) Fluid
Slllc*, s102 Ferric oxide, Fe203 Alumina, Al203 Titanic oxide, TlO2 Calcium oxide, GAO H*gnesl*, MgO Sulfur trloxlde, SO3 Potassium oxide, K20 Sodium oxide, Ii.20 Phosphorous pentoxide, P2O5 Undetermined
Total
12.0 10 to 14 57.5
3.7 0.9 0.1 4.0
iii 100.0
13 to 19
2.0
2,030 2,250 2,300
2,150 2,450
Avcraae 45.0 20.0 18.0
1.0 7.0 1.0 3.5 1.9 0.6 0.4 to 1.5
*Reference 2-2 BR:8306r Part 4
2-5
255

particulate Removal and D~SDOSA~. To meet environment61 air emission standards, the plant is equipped with ESPs, which remove flue 86s particulate* to ASPS (New Source Performante Standards) limits. A pneumatic conveying system transports fly ash from each ESP to ash bins. Dry fly ash is then transported to a lined landfill loc*ted 10 miles away.
Seismic Zone and Soil. The plant site is located in Seismic Zone 1 on good soil having bearing capacity of 4 ksf (1,000 pounds per square foot) or more.
Pverall Retrofit Factors. For the purpose of this evaluation, only three retrofit ch*r*cterlz*tlons, AS shovn in Table 2-3, *re to be considered. Each ch*r6cterlzatlon takes into Account f*ctors such AS site *ccesslblllty and congestion, underground obstructions, soil conditions, and the location of the flue gas cleanup system on the power plant site. On the basis of these individual f*ctors, u1 overall retrofit factor for l *ch DOE l st6bllshed retrofit zone WAS computed AS shovn in Table 2-3 and Figure 2-l.
Duct Work &r&&&j. The layout of duct work from the plant rlr prehe*ter outlet to the chimney, including the ESP manifold and ID fsns, is shovn in Figure 2-2. Ducts *re sized for A gae velocity of 3,600 fpm. A *tr*lght run of approximately 100 feet of duct appears to be avclllable for the injection of lime slurry. Therefore, no msjor modifications to the existing duct work will be necessary. The reference pl*nt’s stack design is 716 feet in height and consists of A concrete chimney with an acid brick liner. It is assumed that no modifications to the chimney will be required.
-. A plan view of the ESP manifold and duct to
chimney is shown in Figure 2-1. Figure 2-2, an. elevation view, depicts the height restriction of work space and.accesslblllty *round in the proxlmlty of the boiler and stack. Figure 2-3 shows A plan view of the reference plant site plot plan. Figures 2-l and 2-3 also show overall retrofit factors AS they 6pply to the plant site. .
PR:g306r Part 4
2-6
256

c
2-7 257

2-8
258
F .

,
\-
.
31
2-9 259
. h I I :S! ii: ; 1,. 69

~. so2 and NO Emission Control Reauirements. The base c*se utility boiler , z.
~. (l.c., Unit 1) to be retrofitted is uncontrolled with regard to acid rain 1 precursors (i.e., SO2 and AOx) emission. Total emissions of SO2 and : AOx from the uncontrolled boiler before the retrofit *re lg.77 and 2.22 tons : per hour, respectively. Retrofit of any control process to the boiler is 1. required to reduce 50 percent of the SO2 and AOx emlsalo~s AS a minimum. : For those control processes which do not inherently reduce AOx emission to
the required 50 percent minimum. A $4.80/kW (in 1982 base year dollars) tot61 retrofit capital requirement and $1.14/kW-yr first-year operating cost will be assessed by DOE to account for NOx removal to A 50 percent control minimum by combustion modlflc6tlon technology.
2.2.2 Conceotual CZD Process Design Crlterls
The deSi8n criteria for the CZD process to be retrofitted to Unit 1 of the reference plant are described AS follows:
:
:.’ 1. The CZD process is designed for 50 percent SO2 removal. Although some AOx remov*l WAS detected in the tests, the results were inconsistent. Because NOx of 50 percent were not’demonstratcd during t&tlng, no credit for AOx reduction will be taken in this study and pen*ltles st*ted Above for not having 50 percent AOx reduction will be *ssessed.
2. As stated in Section 2.1, PBUL is chosen AS th*‘reAgent becsuse of its better performance during full-scale testing compared with CL.
3. On the b*sls of the test results *t PERELEC, it appears possible to confine the reectlon zone in A large duct *t temper6tures *ppro*chlng the saturation temperclture for good SO2 removal and intermix with the hot 86s in the Outer zone to achieve high overall gas OUtlCt te.mperAtUre. For this 6ppllcatlon, the gas outlet temper*ture after mixing is set 6t 170.F.
.
RR:S306r Part 4
~’ 2-10 260

4. Once the gas outlet temperature is~established, the quantity of water that can be evaporated in the system is determined by heat balance. The average concentration of SO2 in the ges is calculated by a material balance. The lime feed slurry concentration is calculated by the correlation equation described in Section 2.1. The lime utilizetion and LFB CM also be calculated (although they ere not needed for any process calculetions, they are useful performance indices).
5. From Figure 2-2, e straight duct section of over 100 feet, ehead of the ESP, appears to be eveileble for the lime injection. At a design gas velocity of 60 fps, this vi11 give a contect time of approximately 1.6 seconds, which should be eufficient for the reection and drying to take place.
6. The reaction products from this process, nonhezerdoua waste solids of calcium end magnesium sulfite/sulfete end unrcected lime, will be collected with the fly ash in the existing ESP and disposed of together. The existing ash conveyor and silo capacity may be sufficient but would require more frequent emptying. To be conservative, e larger ash conveyor and one additional ailo ia provided for handling end storage of the waste solids/fly ash mix.
7. Powdered PHDL will be delivered in open-bottom railcars. Lime storage
silos are designed for 30 days’ eupply.
The process design.parameters , rav material end utility requirements, end process effluents are summerized in the Table 2-4.
BR:8306r Part 4
2-11 261
Table 2-4
CASE 1 PROCESS DESIGN CBAUCTSBISTSCS
Process Design Parameters
SO2 removel, X Spray dovn tempereture, OF Approach to eeturetion temperature, l F Normelizer ueter injection rate, gel./hscf gas Avere,ge SO2 concentration, ppmv, vet besis Lime feed retio, l/2 [moles Ce(OH)2~@I&(OE)2]/mole SO2 enterlag Lime utilizetion, X Lime purity, X Lime slurry eoncmtretion, Wt% AtomiziPg air pressure, psig Atomiring air flow. ecfm/gpm slurry
45 0.265 2049 1.46 34.3 95.5 24.3 90 30
PBDL, 95.5% Ce(OB)2W.(OB)2, tph 29.6 Procees water, 8pm 354 Electricity, kW 4000
SO2, Wh ~9.4 NOo,, tph 1.1 Fly l ah, tph 31.6
’ Peection products, tph 36.4 Grit, tph, vet 1.66 We8tevater. gpm none
2.2.3 process Des-
Figure 2-4 is a procees flow diegrem,showing the major equipment end overell materiel beleneea.
:’
The PBDL ia delivered by reilcers end is discharged into e belov-grade hopper in e closed unloading station equipped with e beghouse. Blovers transfer the lime from the unloading station to storege silos. The lime is then conveyed
pneumeticelly to the dry bin loceted’ebove the slurry melteup tenh. Lime is grevimetricelly fed from the day bin to the slurry meheup tenh nntil the
desired concentretion is obtained. ~Then it is pmpcd to e vibretin8 screen for degrittina. The degritted lime slurry fells into the storage tenh vhile
RR:8306r 2-12

_. --
-2,
L g : L.
l
f 2 i
*
I.!
8 $r
; i’!j i ijil 1 flfi 4 8014
i
!
f.’ % 0 5 i e a 0 64 f f
1 :: : 2-13
263

the vet grit fall into e dumpster for disposal with the reaction VAste ! solids. The degritted lime slurry is transferred to the feed tank from vhich it is pumped through e etrainer to the spray station. The lime slurry feed is . controlled by pressure And flow controllers through e recycle loop. b
The degritted lime slurry is Atomized vith compressed Air At 90 psig and is sprayed into the eenter core of the duct through ~80 nozzles, 5 gpm lime slurry and 150 scfm Air to each nozzle. Sulfur dioxide (SO2) in the flue eaa uritinS the Air preheater reacts vith the lime (CA(OE),.Plg(OE)2) in the spray droplets to form mostly cAlcium/mAgnesium rulfite (CAS05.HgSO5.820). The reAction products And the unreacted lime dry AA the VAter evAporAteA. The tAICperAtUre At the Center core Of the duct iS ClOAe t0 the AdiAbAtiC Aaturrtion temperature of the flue BAA vhilc the eurrounding BAA remains hot. AA the BAA t.rAVAlA tOVArd the ESP, it intemixea t0 rAACh A WmperAtUre Of
ApproximAtely 170-F.
The dry reAction productr, the tInreaCted lime, and the fly Ash (80 percent of
the cool Ash) are collected tOgAther in the uisting ESP. From the ESP hoppers, these VA8te AOlidA ArA conveyed t0 the UiAtir@ AAb silos. ThASe VASte aolids Are then trrnaported to A lined lmdfill 1OCAted 10 milea AWAY.
2.2.4 khlor B
A gencrA1 lAyout of the mAjOr l qUipmAnt in AhOVn in Figure 2-5. The lime silos Are lOCAred ACroAA the roAd from the AAh bins. The lime slurry preparation equipment, including the mrlrcup tank, degritting acreens, And Blurry atorlge tankA, iA 1ocAted nAXt to thA lime silos. The Air compressors Are ~180 1ocAtAd in this AreA to tAkA advantage of the low retrofit fActor. The degritted lime slurry feed tAnk iA 1OCAtAd close to the ESPs in order to set A AhOrt run of,Alurry line to the injAction nozzles. A AhOrt slurry line minimiZea pOtAntiA1 OperAtine problems, AUCh AS lime freezing And line
Plugging* A deecription of the major equipmeut ia given in Table 2-5. .
-.
Bk8306r Part 4
2-14
264

. . .


:: --F” --- ,\\\\\\\\\~\\\\\,\\\\\\\\\\\\\\\\\\\\\\\\\\\\~i\~\~~~‘. ,\\\\; . . .
- ,__7 1 Preceding Page Blank
2-17
267

TAble 2-5
CASE 1 MAJOR EQUIPMEBT ITEMS
t
Item
Bailspur Service: Length:
Provide Access for lime delivery 1000 ft
Lime DnlOAding station Service: '~ Lime tInlOAding from rAilCAr Includes: 1-tvo railcar covered AreA
Z-6000 acfm bAghOuSe, 2400 ft2 cloth each. 20 hp tOtA
Lime Storage Silos Dimensions: 70' die. x 100' straight side
60' conical bottom QApACitF: 5,330 tOnS eACh
Total 30 days' Supply Material: Steel-reinforced concrete Accessories: Baghouse, 700 ft2 each cloth area
Reagent Pneumatic Conveyor System
Type: PWWr,AtiC Service: PHDL Flov rAte: 8,000 ACfm Trsnsfer line: 14" dia. X 300' L Blower motor rating: 600 hp
Lime Feed DAY Bins ' Dimensions: 28' dia. X 40' straight side
60' conical bottom CApACit,': 440 tons each Material: CArbOn Steel Accessories: ROtArF vAlve discharge, vibrators
Lime GrAVimetriC Feeder8 Dimensions: 36" W x 10' L Solids rate: 30,000 lb/hr Service: PRDL
.,v Motor rating: 20 hp
DuAntitY
1
I
4 op.
2 OP., 1 spare blower
2 op.
2 op., 2 spare
Lime Slurry Storage Turks 3 (1 makeup
Dimensions: 40' dia. x 40' high tank,2 Service: 24.3 WtX slurry degritted lime CApACitF: ~300.000 gal. each slurry tanks)
MAteriAl: Carbon steel, closed top, four baffles Accessories: AgitAtOr vith 90-hp motor ‘3.
RR:S306r 2-18 Part 4
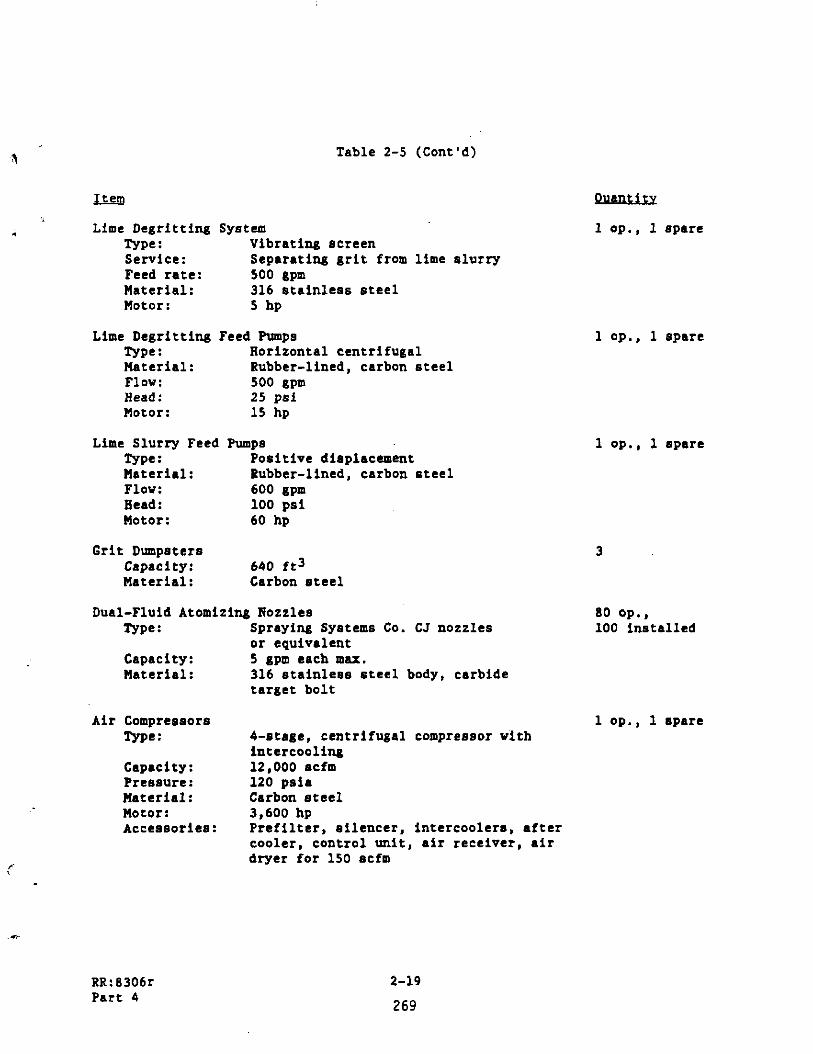
Table 2-5 (Cont'd)
Lime Degritting System Type: Vibrating Acreen Service: SepArAting grit from lime slurry Feed rate: 500 gpm Material: 316 Atainless steel Motor: 5 hp
Lime Degritting Feed Pumps Type: Aorizontal centrifugal MAtAriAl: Rubber-lined, CArbOn steel Flov: 500 gpm HeAd: 25 psi Motor: 15 hp
Lime Slurry Feed Pumpa me : POAitiVA diAplACAmAnt HAtAriAl: Rubber-lined, CArbOn steel Flov: 600 gpm HAAd: 100 psi Motor: 60 hp
Grit Dumpeters CApACity: HAttXiAl:
640 ft3 CArbOn ateel
Dual-Fluid Atomiting Aozzles Type: SprAying SyAtemS CO. CJ nOzzlAs
or equivalent CApACit,': 5 gpm AACh max. MAtAriAl: 316 stainless Ateel body, carbide
tArget bolt
. 1 OP., 1 spArA
1 op., 1 spare
1 op., 1 spare
3
80 op., 100 instAlled
Air Compressors 1 op., 1 ApAre Type: 4-AtAge, centrifugA1 compreesor vith
intArcooling CApACity: 12,000 ACfm Pressure: 120 pSiA Platerial: CArbon Ateel Motor: 3,600 hp AcceAsoriAA: Prefilter, AilencAr. intcrcoolers, After
cooler, control unit, Air receiver, Air dryer for 150 Acfm
RR:g306r Part 4
2-19
269

Table 2-5 (Cont’d)
DrAinAgA Sump CApACity: 5,000 gallon Material: Concrete Accessories: Agitator vith 3-hp motor;
tvo sump pumps, 100 gpm each
Waste Pneumatic Conveyor system Type: Pneumatic Service: !dABtC solids Flov rAte: 3000 cfm Transfer line: 8" dia. x 400' L Blover motor rating:
Waste Solids Silo Dimensions: CApACity: Material: Accessories:
250 hp
28’ dia. X 50' StrAight side 800 tons CArbOn steel BAghouse, Airlock, conveyor
SJuantitY
1
1
1
RR:8306r Part 4
,2-20
270

2.2.5 Economics And Cost Estimates
F A cost estimating methodology developed by DOE stimAtinA Methodology. follovs. This method:
Levelizes total retrofit CApitAl requirements using standardized Assumptions And economic fActor developed by EPRI (Pefs. 2-1, 2-3, And 2-5) AS vcll AS simplificAtionA determined to be suitsble by DOE
LCVAliZC.3 all COAtA t0 1982 bAEA-yAAr dOllArE
Levelises capital costs for diAsimilAr Acid rAin precursor (i.e., BO2 And AOx) Control ApprOACheS At different stages of teChniCA maturity
CAlCUlAtW3 the total retrofit CApitAl requirement And first-year operating And mAintenAnce (O&M) costs, from vhich A tOtA lcvelized retrofit COSt CM be CAlCUlAted
InfOImAtion required to generate the estimates VAA obtained from equipment vendors, published CoAt dAtA, end Bechtel inhouse cost files. GApitAl COStS vere estimated by the mOdUlAr fACtOr Cost AstimAtiIU ApprOACh developed by Guthrie (Eeference 2-7). Process equipment sizing and cost verc developed by
Bechtel. OperAting costs VArA cAlculAted bAsed on et3timAted tAAgAIIt And utility~consumption, And the DOE-specified OperAting COAt criteria in
TAble 2-6.
m. Key economic pArAmetera Are specified by DOE (Reference 2-l) And given in TAble 2-7.
mior Process &g~&gr&~l Esr&f&g~. There Are five major process AreAA required for the conceptual 500 HWe CZD process retrofit:
10 Beagent feed system 20 so2 removal systAm 30 Flue gAs SyStAJA 60 WASte hendling system 70 CAnerAl PUppOrt AreA
RR:8306r Part 4
2-21
271
Table 2-6
CASE 1 OPERATING COST CRITERIA
pixcd Ooerr&ina Cost
,OperAting lAbOr (2 men/shift) AdminiStrAtiOn And support labor Maintenance factor
VAriAblA PuerAtinn Cost !m.L
Process vAtcr 1,000 $A1 Paver kwh PmL(b) t Dry solid8 diSpOSA1
(lined) t Fly Ash diApOSA1
(unlined) t
la&L
hnhour S&r Percent
0.60 0.045
65.00
6.17
4.67
t
$18.30/hr (Dec. 1982) 30% of O&M lAbOr 4% Of PrOCASS CApitAl
Level. m
2.31 2.44 2.31
2.31
2.31
30-Year Levelized
cost. $/unit
1.39 0.110
150.15
14.25
10.79
(A) The cost of freight is included. (b) The price for the PRDL used in this study is not cited in Reference 2-1.
The 1982 delivered price is $65/t.
?
c.
RR:8306r Part 4
2-22
272

\ Table 2-7
CASE 1 KEY ECONOMIC PABAMETERS
d Base year for cost levelization
Engineering and home office fees(b)
Project contingency(c)
Process contingency (depending on commercial status of equipment or system)(d)
Royalty allowance
Preproduction costs
Capital fixed charge rate (FIX) for 30 years of plant life and assumed coats of capital at 12.5%
Salvage value of process equipment at the end of the 30-year term
Levclization fac’tbr for 3byear term ,...,~ assuming 8.5% inflation
Sales tax (Wisconsin)
(a) Cost data in other year can be calculated by:
1982(')
10%
22.5%
5 to 20%
0.5% of process capital
2% of total plant investment
15.3%
Zero
2.31
5%
(Cost Data in 1982 Base Year) x
Cost Index for That Year 314.0
(b) Additional engineering and home office fee to account for site access and underground obstruction factors 8re included in the overall retrofit factors specified in Table 2-3.
(c) This represents an aver&ge project contingency factor based on EPRI’s ‘. Class II Preliminary Design/Estimate Project Contingency range (Ref. 2-2).
(d) Selected by Bechtel: 20 percent for the SO2 removal system; 5 percent for all other systsms
RR:g306r Pert 4
2-2’3
273

Area 10 includes facilities for receiving, unloading, transporting, preparing, storing, and feeding lime. Dry PHDL is chosen to be the reagent used, and it is slurried on site.
Area 20 includes equipment required for SO2 removal, such as the dcgritted lime slurry feed tank, air compressors, lime slurry injection system, control instruments, and S02/02 monitors.
In area 30, no modifications or new equipment are provided to upgrade precipitator performance. This area is included because additional CZD testing may show e need to upgrade the precipitator.
Area 60 includes a conveyor end a storage silo to increase handling end storage capacity for the additional waste solids (reaction products) generated, although the existing conveyors and ash silos may be adequate.
Area 70 includes makeup vater pumps, drainage sump, and fire protection and
safety equipment.
Capital co6ts of these &teas include the initial investment costs necessary to design, procure, install, and commission each process equipment item or Byatem. Capital costs consist of the direct and indirect costs incurred before the operation of the total control aystem cosuscnccs (Reference 2-6). Detailed process area capital estimates are given as Worksheet 1. (All vorkaheets referenced appear et the end of this subsection.) For these estimates, the modular factor cost estimating approach developed by Guthric (Reference 2-7) was folloved.
x9 -Retroiit E l au stimatc Su. Table 2-g is a summary of the total retrofit capital requirement estimates.
Pirst Year Ooeratine Costs. The estimated first year operating costs are given in Table 2-9.
f’
i-2
RR:g306r Part 4
2-24
274

Table 2-8
CASE 1 TOTAL RETROFIT CAPITAL P.EQlJIREMENT ESTINATE SUMMARY
(A) 0) CC) CD) (E) (F) (G) un
(1) (J) W CL)
m WI
Ircm
Total process area capit (from Worksheet 2) Total plant scope Adjustment capital (from Worksheet 3) Tot41 process capital, (A) + (B) General facilities, 10% of (C) Project contingency, 22.5% of (C) Engineering and home office fees, 10% of (C) (b)
Total plant retrofit cost, (C) t (D) t (E) t (F) Allovrnce for fund4 during construction
2 years = 0.018 of (G) Tot41 plot retrofit investment, (G) + (Ii) Roy4lty *llow4nce, 0.5% of (C) .,
Preproduction costs, 2% of (I) Inventory cspital (60 day of r4v material 4nd
consumables) Total &pit41 retrofit requirement, (I) + (J) t (K) t (L) AOx removal perulty 48se88ment Cc)
TOTAL
$&d*)
23.85 0.80
24.65 2.46 5.55 2.46
35.12
0.63 35.75
0.12 0.71 5.63
42.21
ggP 47.01,
(4) $/kW o cost cost (500,000 kW - Process Pover) = (500,000 kU - 4,000 kW)
(b) Addition41 engineering 4nd home office fees to 4ccount for underground obstruction factor 4re included in the over411 retrofit f4ctor c4lculstion.
(c) Specified by DOE guidelines.
RR:8306r Part 4
2-25
275

?4ble 2-9
CASE 1 ESTII’IATED FIRST YEAR OPEBATIIiG COST
.~. PART I
Fixed Ooeratinn 4nd Haintenance Costs
(A) Opersting labor (8) Maintenance 14bor(b)
Process Area Hainten4nee Capital cost(c) Fsctodd)
- Process Area 10 (A) x ( 0.04 ) - Process 4re4 20 (s.oa) x ( 0.04 1 - Process area 60 ( 1.20 1 x ( 0.04 1 - Process 4rea 70 (0.15) x ( 0.04 1 - Plant scope adjustment(‘)
(A) x (0.z) (C) Haintenance materi41, 150% of (B) (D) Administr4tive md support 14bor e 30% of (A + B)
Subtot Part I - Fixed Cost
x 0.4 x 0.4 x 0.4 x 0.4
tLkY5x 0.64
0.23 0.13 0.02 0.0
0.16 0.81 0.35
(AGK)
(4) OperAtinS labor cost, $/kW-yr -
L&4 man l&s/vk) ($uO/hrl (2080 (500,000 kW - 4,000 kW)
(b) Haintenance Labor = (40%) X (Process Capital Cost by Process Area) X ;cT (H4intenance Factor).
(c) Process capit costs Are to be taken from Worksheet 2 for each respective process 4rc4.
(d) Maintenanc@ factors for c4ch process 4re4 are taken from Table 2-6.
(e) Plant Scope Adjustment = (Total Plant Scope Adjustment Capital Cost from Worksheet 3) X (Maintenance F4ctor of 0.2)
BR:8306r Part 4
2-26
276

Table 2-9 (Cont’d)
PART II
i . Variable Ooeratinn Costs(*)
(A) Reagents md chemicals (lime 8 $65/t) (B) Process water @ $0.60/1000 gal (C) Power e $o.O45/kWh (D) Waete disposal(b)
Subtotal Part II - Variable Operating Costs NO, removal penalty assessment (specified by DOE)
Total Generalized First Year Operating Costs (Subtotal P4rt I urd Subtotal Pert II)
(4) _.
0)
Variable Operating Costs, $/kW-yr =
(3 Cost Der Hour) x LG!fdUuhr/vr) x (CausJtv Factor1 (500,000 kW - Process Paver)
f/kW-vr
22.11 0.15
2.48
3.12
zk 31.34
Use 4 c4pacity f4ctor of = 0.78 for power cost 4nd 4 c4p4city factor of 0.65 for 411 other variable operating coats.
Waste dispo441 costs 4re c4lcul4ted 44 follows: Total fly eeh (16% coal ash, 80% overhead) Tot41 re4ction products (including excees lime)
Tot.1
Diepoe4l Charges (from Table 2-6) W4ete solids, lined lurdfill, 8 $6.17/t Fly ash, unlined landfill, 0 $4.67/t
31.6 tph U tph 68.0 tph
First year disposal cost = Total v4ste 4olids leas credit for fly 46h = (68.0)(6.17) - (31.6)(4.67) = $271.99/hr = $3.12/kW-yr
This c4lculation assumes the plant we.8 disposing of fly esh at $4.67/t before the retrofit. A credit is taken for this because 4fter the retrofit the fly aoh is disposed of vith the eolid w4ste at the higher rate of $6.17/t.
RR:8306r Part 4
2-27
277

&ummarv of Cost Estimates. A swnmary'~~f the coat estimates is given in Table Z-10. This table indicates the total retrofit capital requirement of $47.Ol/kW, including ROx nonremoval penalty. The estimated first year operations and maintenance costs are $31.34/kW-yr. The calculated SO2 removal coot is $357/tori S02. In terms of 30-year levelized busbar electricity comt, it becomes 14.0 mills/kWh.
2.2.6 mitlvitv Analvsis
This section contains an assesement of the impclct of using type CL lime,, and that of a 25 percent greater value of the correlation factor, K, on the 500 plwe projection.
Dee of Rr~e CL Lime. The CZD system design, performance, and cost6 will be influenced by the type of lime that is selected a8 re&gent for a given retrofit. Although no useful large-scale system data were collected for CL, its performance uaa superior to PHDL in the pilot-scale teats, and further testing is expected to more clearly define ite SO2 removal performance capability. For this analysis, its performance will be assumed equal to that of PRDL by using the 8ame value of correlation factor, K.
Use of the same correlation factor means that the weight conslrmption for the two lime types is the 8ame on a hydrAted basis becauee the correlation is besed on veight percent of hydrated lime. Use of the came might eoneumption
implies that the CL utilization will be slightly higher end its LPR will be slightly lover than those for PHDL because these factors ere determined on a
molar basis, and CL has a higher molecular weight than PRDL (74.1 verwe 66.2).
A major impact on the conceptual design brought about by the substitution of : CL for PADL is the reduction in the storage volume required for the dry lime. This reduction is brought about by tvo faetore:
0 The CL will be delivered to the plant mite in the unhydrated or quicklime form. Since the water of hydration does not have to be stored, the veight of lime to be stored is reduced by approximately 18 percent.
‘:
i
RR:8306r Part 4
2-28
278

Table Z-10
CASE 1 ESTIMATED COST OF SO2 RRMOVAL
(in 1982 dollars)
gulc!
Total capital requirement
First year operating coBt
Fixed Variable RO, penalty
Total
Total cost per ton of SO2
30-year levelized busbar coet @ 65% capacity factor
Levelized s/kw $Lk!kYE t/ton2 mills/kWh
47.01 66.65(a) 1.3
2.34 27.06 &L.u 31.34 m(b)
357.08
0.9 11.3
0.5
14.0
(a) - mm-r) (9.4 tph iO2 removed) x yS760 hr/yr) x (0.65)
$66.65/tori SO2
0) 11?1.34/kW vr) x (496&?0 kW) (9.4 tph SO2 removed); (8,760 hr/yr) x (0.65)
v $290.43/tori SO2
RR:8306r Pert 4
2-29
279

.+.
2-30
280

.
2-31
281

“\
2-32
282

I.4 c
..l N
N
2-33
283

* se i2Y . . * 22
2-34
284

( C
2-35
285

0 The CL quicklime is more dense than the PRDL (55 lb/fta versus 30 lb/ft3). This reduces the required storage capacity by an additional 45 percent.
The impact of the reduced storage volume for the CL is partially offset by the
requirement for onsite equipment (slekers) to hydrate it.
The CL is also leas expensive then the PRDL - $60/tori for the CL quicklime VerBus $65/tori for the PHDL. This cost difference is magnified by the fact that the veight of the quicklime required is approximately 80 percent of the veight of PKDL.
From the point in the process vhere the quicklime ie hydrated, the equipment requirements - storage and feed tanks, degritting equipment, transfer and feed
P-Pa I atomization system, air compressors, and instrumentation and controls - are nearly identical for both CL and PHDL.
The net effect of changes reduces the.cepital and opcr6ting coats for the design for CL compared vith the design for PRDL. The estimated total retrofit
capital requirement reduces to $42.13/kW, including AOx nonremoval penalty. The l estimated first year O&M costs reduce to $25.07/kW-yr. The calculeted SO2 removal cost is $292/tori SO2 and the 30-year lcvelized busbar electricity cost becomes 11.30 mills/kWh.
yse of a 25 Percent Greater K Value. Additional full-ecale tenting la expected to show an improvement in SO2 removal performance vhich vi11 increase the value of the correlation factor. R. The emount of the expected improvement cannot be predicted at this time. A 25 percent improvement is used to illustrate hov an improvement vi11 affect the conceptual design.
The increase in the value of K produces more than a proportionate reduction in the lime requirements because the lime utilization also Increases. The reduction in lime requirements proportionately reduces the requirementa for dry lime storage and handling equipment. The lime slurry handling equipment,
including the atomization system, is not significantly affected because the
size of these items is dictated by the evaporation requirements vhich do not chAnge . gR:8306r 2-36 Part 4
286
i.

A 25 percent increase in K for the 500 MWe conceptual design using PHDL reduces the estimated total retrofit capital requirements to S30.46/kW, including NOn nonremoval penalty. The estimated first-year O&M cost8 become $19.57/kW-yr. The caleul*ted SO2 removal cost is $236/tori S02, and the 30-year busbar electricity cost becomes 8.9 mills/kWh.
2.3 CASE 2: CAMPBELL UNIT 1, CONSUMERS POWER CONPAEY
Campbell Unit 1 of Consumers Paver Company is * base-loaded pulvcrized coal- fired boiler, located in West Olive, Michigan. It burns medium eulfur coal, and the SO2 emissions *re uncontrolled. Fly ash is removed by tvo electrostatic precipitators in series - 1E end 1W. The collected fly ash is currently sold. Other key boiler design data *nd flue gas characteristics *re *s follows:
T*ble 2-11
CASE 2 KEY BOILER DESIGN DATA ARD FLUS GAS CBARACTERISTICS
Unit r*ting. MW net Estim*ted remaining life, yr Net plant he*t rate, Btu/kWh Cspacity f*ctor, X Coal *s fired
Moilrture, % Ash, X Sulfur, X
High he*ting v*lue (RRV), Btu/lb Flue g*s temperature. ‘F
Flue ges flov, acfm @ 300'F Flue g*s SO2 concentr*tion, ppmv, vet basis Perticulate emissions control device
260 30 9,520 80
11.3 10.7 2.2 11,178 280-330 863,700 1.617 Z-stage ESP 1st st*ge 95% 2nd Bra&e 97%
RR:S306r Pert 4
2-37
287

2.3.1 Conceotual CZD Process D~9&zn Criterig
The design criteria for the CZD process to be retrofitted to Campbell Unit 1 hre deecribed 66 follovs:
1. Campbell Unit 1 has tvo precipitators (east and vest) arranged in Acries end connected by tvo ducts , each 12 ft S in. by 12 ft S in. The straight sections of these duct6 are approximately 69 feet long. The lime injection points vi11 be located *t the e*st ESP exit end of the straight duct6 *a ahovn in Figure 2-6. This vi11 give 6 gha-reactant contact time of approximately 1.5 seconds *t a calculated g66 velocity of 44 fpa.
2. The rc*etion product6 from this process, nonhazardous solids of calcium and magnesium 6ulfite/6ulfate, end unreacted PRDL, vi11 be collected together vith the fly ash in the vest ESP and conveyed to the ash silo. (Note: Most of the fly ash (95 percent) is collected In the east ESP.) A nev conveyor system end additional atorsge capacity *re provided to handle the increased quantity. (Note: The fly *ah collected in the vest ESP ten no longer be sold unless A nev applic*tiod’kn be found for the mix.:jTIt
16 666umed that the fly *oh/re*ction product6 mix vi11 be disposed of together in 6 lined landfill located offsite at A coat of $6.50/tan.
3. The flue gas temperhture l t the lime slurry injection point is t&en 66 300-F. This vaa the hverage flus’gae temperature’ht the first injection point during the Campbell CZD tests.
4. It is hsaumed th*t no modific*tion6 to the uiating chimney will be
_, required.
;;:i
.,; 5. The CZD proccas is designed to remove 50 percent of the uncontrolled SO2 emi66ion6 using PBDL 66 the reagent. PRDL vi11 be supplied 6s A dry povder snd mixed with vater on site to form * slurry.
6. The lime storage silo is nised for 30 days’ oupply of lime.
7. An overall retrofit factor of 1.07 is used.
ii RR:S306r ’ Part 4
2-38
208


8. It is eeeumed thet HOx reduction ie not required for this project. Ho credit will be taken for the potential lVOx reduction capability of the CZD process.
The process deeipn parameters, rev meterial end utility requirements, and procces effluents ere swrized in Table Z-12.
Table 2-12
CASE 2 PROCESS DESIGN CEAUCTEPISTICS
SO2 removal, X c Plue See teoiperature et injection point, V
Spreydovn tempereturc. l F Approach to setur*tion tempereture, l F
,lormalized water injection ratt, gal/kacf 8.s Average SO2 concentration, ppmv, vet beeie
.Limc feed ratio, l/2 [moles Ce(OE)2~lQ(OE)2]/mole SO2 eaterinS Lime ntilizetion, X Lime purity, X Lime slurry concentration, WtX
.:Atomizing l ir pressure, peig Atooitiw air flov, l cfm/apm
,?~
50 300 170 45 0.284 1189 1.32
ii.5 13.6 90 30
PHDL. 95.5X C~(OH)~‘I’~S(OH)~, tph 6.50 Process veter, gpm 160 Electricity, kW 1,600
SOZI 1bIhr 4,620 Fly aah, tph (ESP U) 9.00 Reaction productr, tph (ESP 1W) 8.70 Grit, lb/hr. wet 740 Weetevater, Spm *one
2.3.2 prprras DeecrU
Figure 2-7 ia e procees flow diagrem shoving the major equipment and overell materiel baleacee.
RR:8306r Part 4
2-40
290

,
;I - I iw
! _’
4 &
. :G h.L T, $” .I =I P* I - -. ,mm, .-> ..-.. I .I >” ,_ ,- ,” _.,_ .;>~.“&-**‘“*:” :;;t!r.xY,: :21’;‘:~~:.z?II- ‘:?:r,?z ‘i-x:‘:
c .
;
I
i:
;,


)
% *,
PHDL is delivered by railcars and is discharged into a below grade hopper in a closed unloading station equipped with a baghouse. From the unloading station the lime is pnc\rmatically conveyed to the storage silo, and from the silo to the day bin. The lime is gravimetrically fed from the day bin to the slurry makeup tank where it is mixed with process water to the desired concentration. The slurry from the makeup tank is pumped to a vibrating screen for degritting. The degritted lime elurry falls into the storage tank while the wet grit falls into a dumpster for disposal vith the reaction waste solids. From the storage tank the degritted lime slurry is pumped through a strainer to the points of injection. The lime slurry feed is controlled by pressure and flow controllers through a recycle loop.
The degrittcd lime slurry is atomixed vith compressed air at 90 psig and is injected Into the center core of the ducts through 36 spray nozzles, 18 installed at each duct. Sulfur dioxide (S.02) in the flue 8as exiting the east aide precipitators reacts with the lime (Ca(OH)2*Mg(OR)2) in the spray
droplets to form mostly calcium/magnesium sulfite (CaSO3*HgSO3*H20). The reaction products and the unreacted lime get dry as the water evaporates. The tamperature at the center core of the ducts ia clone to the adiabatic saturation temperature of the flue gas vhile the surrounding gas remains hot. As the gas travels toward the vest aide precipitators, it intermixes to reach a temperature of approximately 170-F.
The dry reaction products, the unreacted lime , and the fly ash are collected together in the vest aide precipitators. From the precipitator hoppers these vaste~solids are conveyed to the ash silos. These waste solids are then transported to a lined landfill located off the site.
2.3.3 Baior Em
A general layout of the major equipment is shown in Fi@Ire 2-8. The vaste
_‘-- (. solids silo vi11 be located next to the existing ,accond-stage precipitators. . The rest of the equipment vi11 be located south of the existing clearvell
tanks. A description of major equipment is given in Table 2-13.
-j &zrgF&a I L- ~---A
RR:8306r Part 4
2-43
293

m 1st sl*GE tL@xRoST*TIt
I I I IW SLUPIY LII(E SLlnRY +??EP*FsTION AIR COMPRESSORS
RAILSPUR
LIME
%%Ef
Al I - m
I I++++ .--c-m
UIOE ,- ,- -NyID I-
BECHTEL NATIONAL, INC.
260 HW CONCEPTUAL DESIGN

-\ I
Table 2-13
CASE 2 I’UJOR EQUIPMRBT ITEMS
3 *, L&8!
Railspur 1 Service: Provide access for lime delivery Length: 600 ft
Lime Receiving System 1 lot Service: PBDL receiving and unloading area Includes : 1 - railcar covered area
1 - 3,000 acfm baghouse, 1200 ft2 cloth, 7.5 hp
Lime Storage Silos 2 Dimensions: 50’ dia. x 88’ straight side, 60a conical bottom Capacity: 30 days’ supply, 4,740 tons Ifaterial: Steel-reinforced concrete Accessories: Baghouse, 360 ft2 cloth area, each
Reagent Pneumatic Conveyor System rYr=: Pneumatic Service: PWL Flow rate: 3,000 acfm Transfer line: 10” dia. x ZOO*“L Blover motor rating: 200 hp
Lime Feed Day Bin Dimensions: 20’ dia. m 36’ rtraight aide, 60. conical bottom Capacity: 24 hours’ rupply, 158 ton8 Material: Carbon steel Accessories: Rotary valve, bin vibrators, baghounc,
230 ft2 cloth area
Lime Gravimetrie Feeders Dimensions: 24” W x 10’ L Solids rate: 15,000 lb/hr Service: PHDL Motor rating: 7.5 hp
Lime Slurry Storage Tanks Dimenaionr: 24,-O” dia. x 40’ high Capacity: 122,000 gal. each Service: 13.6% slurry Material: Carbon steel, closed top, four baffles Acceaeoriea: Agitator with 40 hp motor
1 spare blower
1 op.9 1 *pare
2 (1 makeup tank and 1 feed tank)
RR:8306r Part 4
2-45
295

Table 2-13 (Cont’d) ,-
J&a!!
., Lime Degritting System Feed Pumps Type: Horizontal centrifugal Material: Dubber-lined, carbon steel Flov: 200 gpm Head: 25 psi Motor: 5 hp
Lime Degritting Syetem Type: Vibrating acreen Service: Separating grit from lime slurry Fetd rate: 200 gpm Plattrial: 316 stainless steel Motor: 2 hp
Lime Slurry Feed Pumps Type: Positive dieplacemtnt
:..- Natarial: Dubber-lined, carbon steel Flov: 250 gpm
I Head : 100 psig Motor: 25hp
Grit D-peters Capacity: 270 ft3 etch Platerial: Carbon attel
: Dual-Fluid Atomizins Aoszlea . .I WPa:
Capacity: Material:
Air Compreseore Type: Capacity: Pressure: Platcrial:
. . . Motor: _- Accaasorice:
i’ -’ Drainage Sump
Capacity: Mtterial: Acceasorits:
Quantity
1 op., 1 spare n
1 OP., 1 spare
1 OP.. 1 epare
2
36 installed Spraying Systems Co. CJ nozzltt,
or equivaltnt 5 gpm each max. 316 stainless ateel
4-stage centrifugal 5,400 ecfm 120 paia - .
body, ctrbidt target bolt
comprtssor vith inttrcooling 1 OP., 1 spare
Carbon atcal 1,500 hp Prefilter, siltncer, aftercooler, control unit, air receiver, and air dryer for 150 scfm
3,000 gal. Concrete
1
Agitator vith 2 hp motor; tvo sump pumps, 50 gpm each
Waste Solids Silo ‘. 1 Dimensione: 25’ dia. x 46’ straight side, 60* conical bottom Capacity: 630 tone (72 hours’ production) Material: Carbon eteel Acceeaorits: Baghouat, airlock, convtyor
RR: 8306r 2-46 Part 4
296

-‘J
J, l
L .
2.3.4 Economics and Cost Estimates
&stimatina Methodology. The cost estimating methodology used for this case follows the EPRI Technical Assessment Guide for a Class II level of analysis. For this method, the folloving design information is required and provided:
0 Gtneral site conditions, geographic location, and plant layout
0 Process flov diagram vith material balances
0 Major equipmtnt specifications
0 Preliminary instrumentation and line sizing
Major equipment costs are based upon Bechtel inhouse information, adjusted to current cost index, and vendors’ telephone quotes. Othtr materials are by ratio to major equipment costs on plant parameters. Construction labors are
from labor/material ratios for similar vork, adjusted for site conditions and using expected average labor rates. Other economic parameters and assumed unit costs are givtn in Table 2-14. All costs art sxprtssed in 1988 dollars.
Sfoue of Work. Design, furnish materials, fabricate, deliver, and trtct duct injection flue gas desulfurization (FGD) system, compltte vith all necessary auxiliary and accessory equipment in accordance vith the accompanying process flov diagram, major equipment list, and layout. Specifically, the ittms
provided include:
Duct injection FGD system complete vith instruments, controls, and accessories, including continuous SO2 monitors
Complett SO2 removal reagent unloading, atoragt, . preparation, and handling system
Complete acctss facilities to the rtagent storagt and preparation system, and the injection system including valkvays, platforms, and stairs
Thermal insulation and lagging for all required equipment and piping
All process tanks and required agitation
RR:8306r Part 4
2-47
297
Table 2-14
CASE 2 ECOI?OHIC PARAMETERS AND ASSUKED UNIT COSTS
Base year for cost estimarts
Engineering
Home office, ovtrhcad, fees
Project contingency
Process contingency Lime injecrion system Balance of equipment
Allovance for funds.during construction
Royalty allovsr~cc
Y Preproduction costs
Inventory capital
Ctpital fixed chargt rate (FCE)
~ Levelization factor,for 30-year term
.: Sales tax (Michigan)
Salvage value of process equipment
NO, removal penalty asstssment
PRDL, delivered
Process vater I ,.L
Pover . Wastt solids disp.+?zal
Operating labor, 2 mtn/shift ~~’
1988
10% of process capital
10% of process capital
20% of process capital
20% 5%
2% of plant cost
0.5% of process eapical
2% of total plant investment
30 days’ raw materials and consumables
15.3%
2.31
4%
Rone
Hone
$65/tori
$0.60/1,000 gal
$O.O45/kWh
$6.50/tori
$27.OO/hr/msn
Maintenance, total (labor 40%. materials 60%) 4% of process capital
Administraeion and support labor 30% of Operations and Maintenance labor
RR:8306r Part 4
2-48
298

0 All pumps, piping, supports, valves, and accessories
0 All hoists, lift beams, monorails, and erants
0 Complete electrical poker and control system, including:
Svitchgear, transformers, load centers, and motor control ctnttrs
Paver distribution/control panels for all equipment
- Electric drives
- Electrical conduit, viring, cables, pull boxes, and fittings for complete system within interface limits
Control systems, instrumentation, and control panels for all equipment
0 Support steel for all materials furnished, including platforms, stairs, and handrails
0 Painting of sxpostd steel surfaces
Tha folloving are special exclusions:
0 A solids rtcyclt systtm (not used vith this design)
0 Ao spscial tool8 required for either operation or mainttnance
0 A gas distribution modeling test of the CZD equipment
0 Gtneral facilities pro rata costs
0 Owners engineering and home office costs
The folloving items require vork to bt ptrformed by othtrs:
0 All tarthvork, site improvements, severs, and drains
0 All ntctssary roads and paving
0 Single electric povtr supply of 13.8 kV
0 Ground conntctions from ground pads on columns to ovner’s grounding systam
0 Waste disposal site construction (vaste disposal cost including transportation, placement, and capital ChargtS)
0 Precipitator 1-W upgrading
RR:8306r 2-49 Part 4 299

s m imat a. A breakdown of the capital cost estimate is shown
in Table 2-15. The projected first year operating cost is detailed in Table 2-16. The estimated 30-year levclized busbar l iectricity cost is given in Table 2-17. A summary of the cost estimates is given in Table 2-18. The detailed process area capital estimates are given in Worksheet 1 which follows Table 2-18.
As shown in Table 2-18, the total retrofit capital requirement is $29.49/kW; the first year operating cost is $18.07/kW-yr; the 30-year ltvtlised busbar coat is 6.5 mills/kWh. The calculated SO2 ,rsmoval cost is $360.38 per ton of SO2 ramoved, including both capital charge and O&M costs.
2.3.5 &nsirivitv Analvs~
‘- A cost sensitivity analysis vas not conducted for the Cmpbell Unit 1 conceptual design. Eovever, as discussed for the 500 MWe conceptual design. additional full-scale testing is axpected to shov sn improvamant in SO2 removal performance. This improvsmtnt would rtsult in a rtduction in the
estimated costs for Campbell Unit 1 similar to those presented for the 500 HWe case.
RR:8306r Part 4
2-50
300

Table 2-15
CASE 2 CZD PROCESS RETROFIT
PROJECTED CAPITAL REQUIR%MRRTS (Base Year - 1988)
Total process capital Engineering, 10% Home office overhtad, fees, 10% Project contingency, 20%
Total plant cost
Allovance for funds during construction AA9 -Q.a
Total plant investment 7,144 27.63
Royalty allovance Prtproduction costs Invtntoty capital
25 143
Total capital requirement 7,624 29.49
19 .3scb1 1.93 1.93
27.09
(a) Summation of the major process area capital estimates in Worksheet 1
(b) - - $19.36/kW 260,000 kW - 1,600 kW
RR:8306r Part 4
2-51
301
Table 2-16
CASE 2 CZD PXOCESS RETROFIT
PROJECTED FIRST TEAR OPERATIAG COST
Operating lebor Maintenance labor Haintcnencc materiels Adminietration end support lebor
Total fixed O&M coat
Lime 2,997,OOO Process weter 40,400 Electricity 504,600 WAEte disposal 414.5op
Total VAriAblA Ohlrl cost 3,956,500
Tote1 projected firet year opcreting coat 4,672,500 : 18.07
b/w $/kW-yr
378,400 1.46 80,000 0.31
120,100 0.46
137.5OQ QLU 716,000 2.76
11.60 0.16 1.95
BR:8306r Pert 4
2-52 302
3 Table 2-17
CASE 2 CZD PROCESS RETROFIT
30-YEAR LEVELIZED BUSBAE COST
Total capital
Fixed O&M
Variable O&H
Total levelized busbar cost
Levelized m
0.6
0.9
s&Q
6.5
Table 2-18
CASE 2 ESTIMATED COST OF SO2 BEMOVAL
(in 1988 dollars)
Item S/kW,S/lrW-vrS/ron2 l!!iuma
Total capital requirement 29.49 71.95 0.6
First year operating cost Fixed Variable Total
2.76 0.9 5.0
18.07 aLA -
Total coat per ton of SO2 360.38
30-year levelized buabar coat e 80% capacity factor
6.5
BR:8306r Part 4
2-53
303

2-54
304

,I!
2-55
305

2-56
306

5 2 1
z x x- p’“’ - 2” EL e .
ii z
,“Y -
IT; ‘!I
E z$!- z ‘XL -
!I z:-
N Q r r
k E ,’ ;
= 01
I
c -
I.4 -
N N
.n Y)
N
2-57
307

-_
REFEBEACES
2-1
2-2
2-3
2-4
2-5
2-6
2-7
Acid Bain Precursor Control Technology Initietive in the Department of Bnergy'e Flue 6ee Cleanup Program, PBDA PA-22-85PC81001, Februecy 2, 1985.
~cbnlcel &gaceement Guide, EPPI Report P-2410-SR, Uey 1982, p, 2-10.
December 1983, p. 2-4. , EPPI Report CS-3342, Volume 2,
Supplement Ao. 8 for Computetion of Air Pollutent Bmireion Factors, Third Bdition, KISBPA Beport AP.42, p. 1.1-3.
btrofit FGD Cost Ea ima -t t im Guidelfn ~8, EPBI Report CS-3696, October 1984.
ere - yolaoe 1, DOB Report on Contract DE-ACZl-8lMC16361, Hey 1982.
Guthrie, K. II., proceee -ion Eve&m&~ and CppEEpl s Craftmen’ Book Company, 1974.
RR:8306r Pert 4
2-58
308