advances in oli simulation: examples – wet flue gas...
TRANSCRIPT
Think Simulation! Harnessing the power of the OLI Engine
OLI Simulation Conference 2010
Advances in OLI Simulation: Examples – Wet Flue Gas Desulfurization and Amine Gas Sweetening
James Berthold – OLI Systems, Inc
November 2010
Marriott Hotel - Whippany, New Jersey
Outline
• What’s new since we last met (in 2007)?
• Multiple models in ESP
Selective Redox
• Enhanced Mass-Transfer kinetics in ESP Columns
Billet and Schultes
• Examples
• Wet Flue Gas Desulfurization
Multiple Models
Selective Redox
• Amine Gas Sweetening
Enhanced Mass-Transfer Kinetics
Example 1: Wet Flue Gas Desulfurization
• Forced Air Oxidation: Limestone Method
• Most Commonly used WFGD used in the world
• Heavily used in the United States
• Most completely studied air purification process in the world
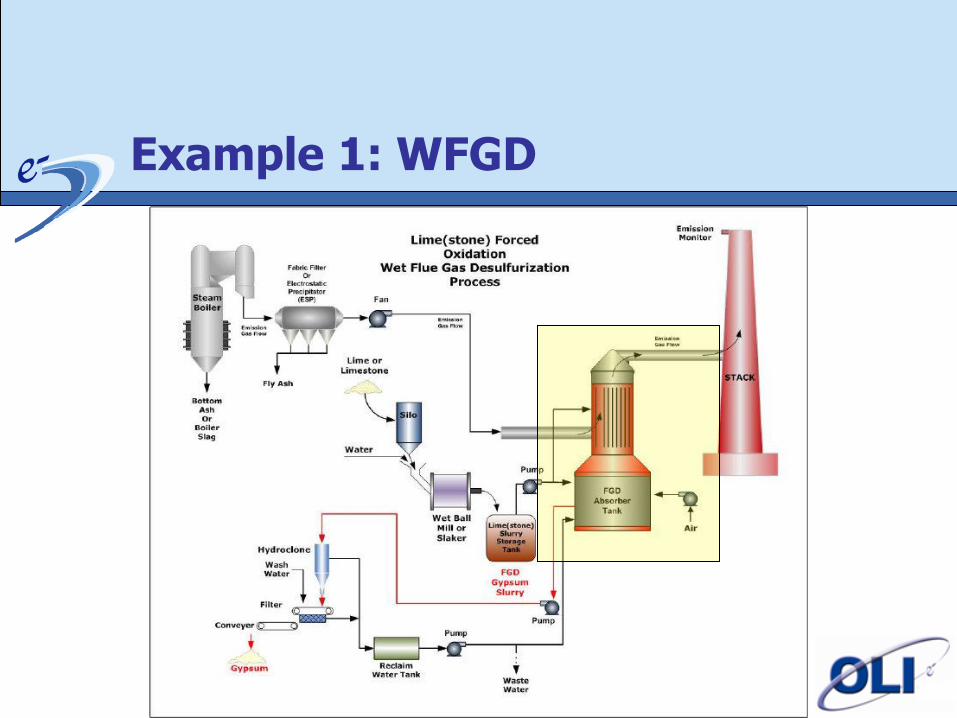
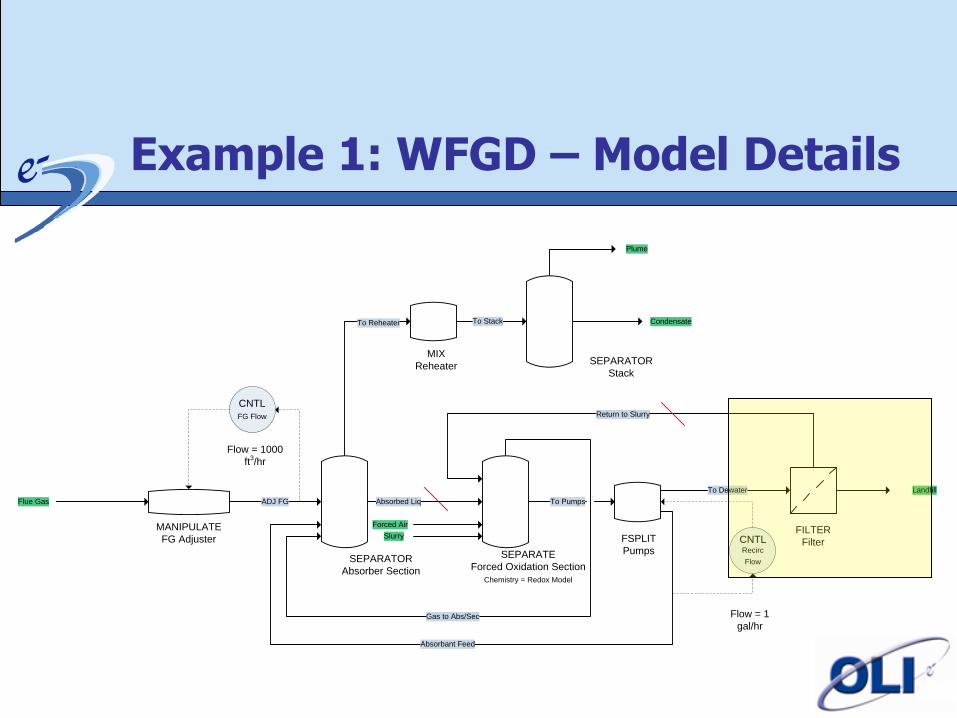
Example 1: WFGD
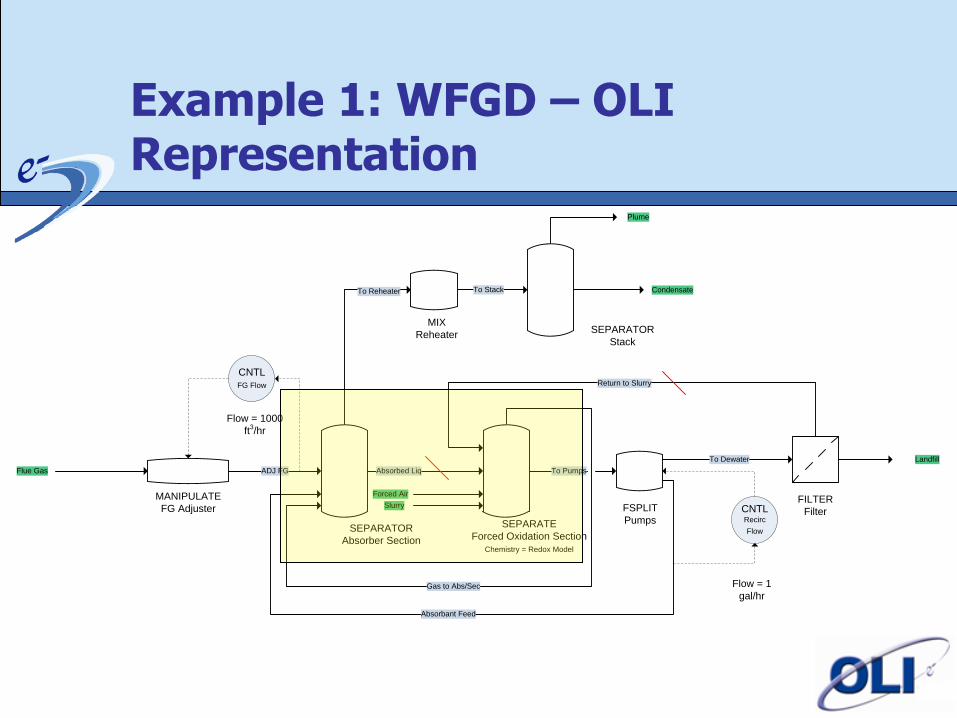
Example 1: WFGD – OLI Representation
MANIPULATE
FG Adjuster
Flue Gas ADJ FG
CNTL
FG Flow
Flow = 1000
ft3/hr
SEPARATOR
Absorber Section
Gas to Abs/Sec
To Reheater
Absorbed Liq
MIX
Reheater
To Stack
SEPARATOR
Stack
Plume
Condensate
SEPARATE
Forced Oxidation Section
Chemistry = Redox Model
Forced Air
Return to Slurry
To Pumps
FSPLIT
Pumps
To Dewater
CNTL
Recirc
Flow
Absorbant Feed
Flow = 1
gal/hr
FILTER
Filter
Landfill
Slurry
Example 1: WFGD – Model Development
• The WFGD unit is broken down into two sections
• Absorber Section
Flue Gas is absorbed by a falling spay of slurry
• Oxidation Section
Forced air oxidizes sulfite to sulfate
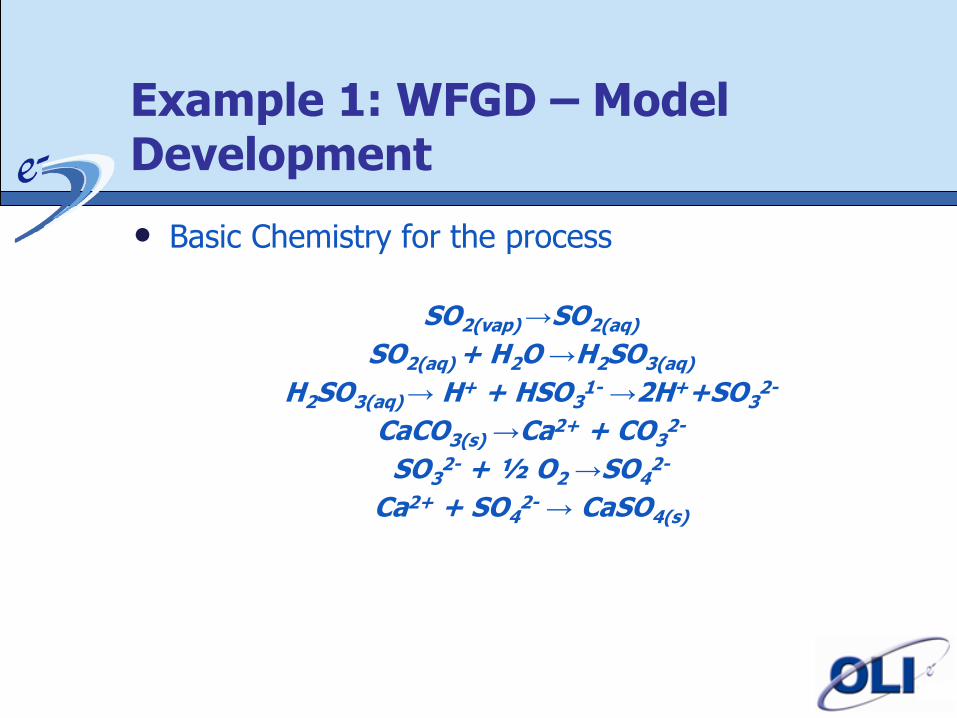
Example 1: WFGD – Model Development
• Basic Chemistry for the process
SO2(vap) →SO2(aq)
SO2(aq) + H2O →H2SO3(aq)
H2SO3(aq) → H+ + HSO31- →2H++SO3
2-
CaCO3(s) →Ca2+ + CO32-
SO32- + ½ O2 →SO4
2-
Ca2+ + SO42- → CaSO4(s)
Example 1: WFGD – Model Development
• Issues with the model!
• Oxidation from S(+4) to S(+6) should occur only in the forced oxidation section
• Nitrogen redox needs to have the thermodynamic pathway to N2 eliminated
• No oxidation should occur elsewhere in the model
• Requires two OLI Chemistry Models
• No REDOX for all units except the oxidation section
• Selective Redox for the oxidation section
Example 1: WFGD – Model Development
• Model 1 – No REDOX
• Absorber Section and all other units except Oxidation section
Example 1: WFGD – Model Development
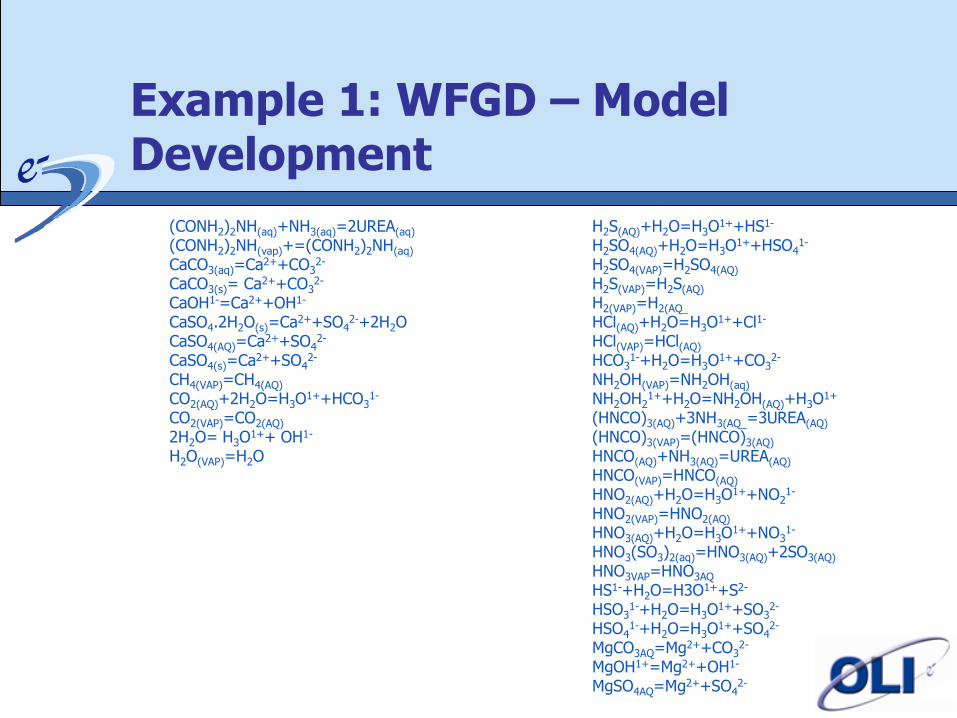
(CONH2)2NH(aq)+NH3(aq)=2UREA(aq) (CONH2)2NH(vap)+=(CONH2)2NH(aq) CaCO3(aq)=Ca2++CO3
2- CaCO3(s)= Ca2++CO3
2- CaOH1-=Ca2++OH1- CaSO4.2H2O(s)=Ca2++SO4
2-+2H2O CaSO4(AQ)=Ca2++SO4
2- CaSO4(s)=Ca2++SO4
2- CH4(VAP)=CH4(AQ) CO2(AQ)+2H2O=H3O
1++HCO31-
CO2(VAP)=CO2(AQ) 2H2O= H3O
1++ OH1- H2O(VAP)=H2O
H2S(AQ)+H2O=H3O1++HS1-
H2SO4(AQ)+H2O=H3O1++HSO4
1- H2SO4(VAP)=H2SO4(AQ) H2S(VAP)=H2S(AQ) H2(VAP)=H2(AQ_ HCl(AQ)+H2O=H3O
1++Cl1- HCl(VAP)=HCl(AQ) HCO3
1-+H2O=H3O1++CO3
2- NH2OH(VAP)=NH2OH(aq) NH2OH2
1++H2O=NH2OH(AQ)+H3O1+
(HNCO)3(AQ)+3NH3(AQ_=3UREA(AQ) (HNCO)3(VAP)=(HNCO)3(AQ) HNCO(AQ)+NH3(AQ)=UREA(AQ) HNCO(VAP)=HNCO(AQ) HNO2(AQ)+H2O=H3O
1++NO21-
HNO2(VAP)=HNO2(AQ) HNO3(AQ)+H2O=H3O
1++NO31-
HNO3(SO3)2(aq)=HNO3(AQ)+2SO3(AQ) HNO3VAP=HNO3AQ HS1-+H2O=H3O1++S2- HSO3
1-+H2O=H3O1++SO3
2- HSO4
1-+H2O=H3O1++SO4
2- MgCO3AQ=Mg2++CO3
2- MgOH1+=Mg2++OH1- MgSO4AQ=Mg2++SO4
2-
Example 1: WFGD – Model Development
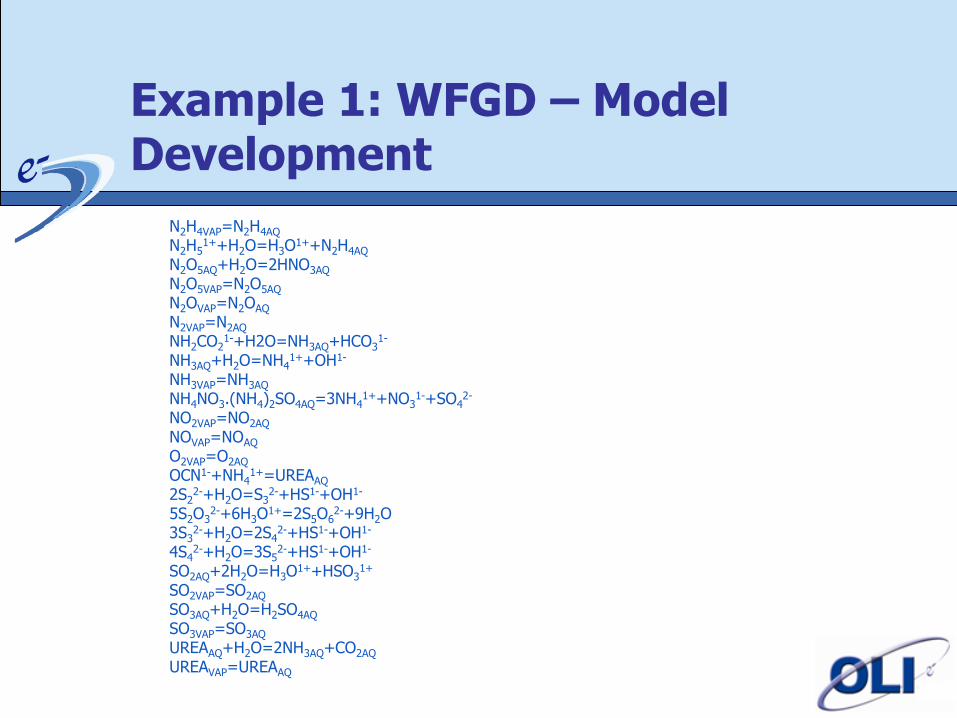
N2H4VAP=N2H4AQ N2H5
1++H2O=H3O1++N2H4AQ
N2O5AQ+H2O=2HNO3AQ N2O5VAP=N2O5AQ N2OVAP=N2OAQ N2VAP=N2AQ NH2CO2
1-+H2O=NH3AQ+HCO31-
NH3AQ+H2O=NH41++OH1-
NH3VAP=NH3AQ NH4NO3.(NH4)2SO4AQ=3NH4
1++NO31-+SO4
2- NO2VAP=NO2AQ NOVAP=NOAQ
O2VAP=O2AQ
OCN1-+NH41+=UREAAQ
2S22-+H2O=S3
2-+HS1-+OH1- 5S2O3
2-+6H3O1+=2S5O6
2-+9H2O 3S3
2-+H2O=2S42-+HS1-+OH1-
4S42-+H2O=3S5
2-+HS1-+OH1- SO2AQ+2H2O=H3O
1++HSO31+
SO2VAP=SO2AQ SO3AQ+H2O=H2SO4AQ SO3VAP=SO3AQ
UREAAQ+H2O=2NH3AQ+CO2AQ UREAVAP=UREAAQ
Example 1: WFGD – Model Development
• Model 2 – Selective REDOX
• For Oxidation Section Only
• Contains all the species of Model 1
• Does not have the pathway to N(0)
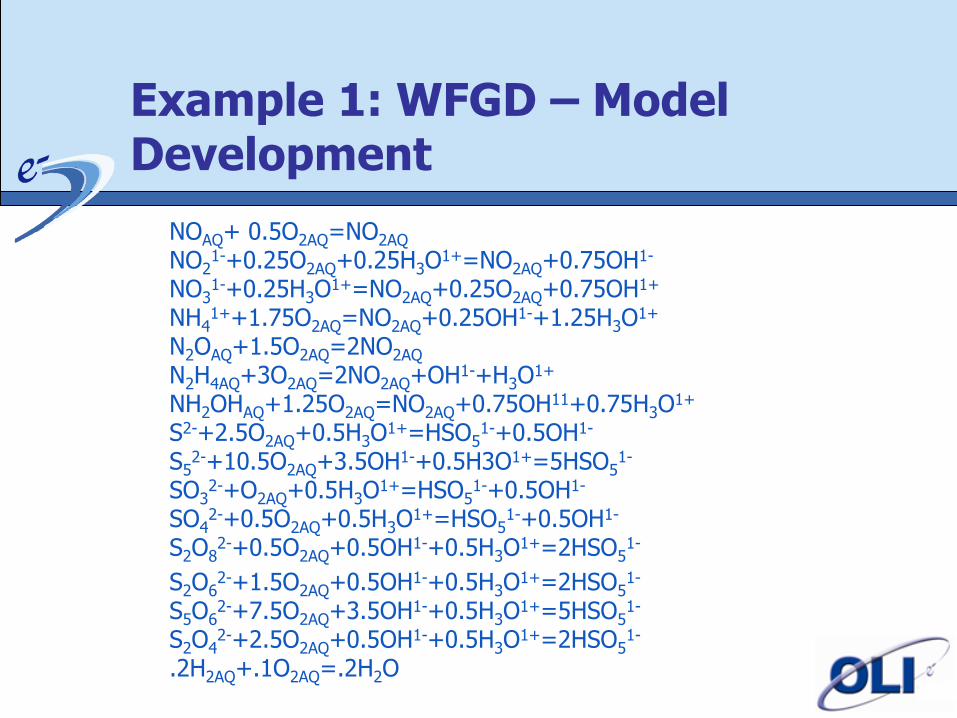
Example 1: WFGD – Model Development
NOAQ+ 0.5O2AQ=NO2AQ NO2
1-+0.25O2AQ+0.25H3O1+=NO2AQ+0.75OH1-
NO31-+0.25H3O
1+=NO2AQ+0.25O2AQ+0.75OH1+ NH4
1++1.75O2AQ=NO2AQ+0.25OH1-+1.25H3O1+
N2OAQ+1.5O2AQ=2NO2AQ N2H4AQ+3O2AQ=2NO2AQ+OH1-+H3O
1+ NH2OHAQ+1.25O2AQ=NO2AQ+0.75OH11+0.75H3O
1+ S2-+2.5O2AQ+0.5H3O
1+=HSO51-+0.5OH1-
S52-+10.5O2AQ+3.5OH1-+0.5H3O1+=5HSO5
1- SO3
2-+O2AQ+0.5H3O1+=HSO5
1-+0.5OH1- SO4
2-+0.5O2AQ+0.5H3O1+=HSO5
1-+0.5OH1- S2O8
2-+0.5O2AQ+0.5OH1-+0.5H3O1+=2HSO5
1-
S2O62-+1.5O2AQ+0.5OH1-+0.5H3O
1+=2HSO51-
S5O62-+7.5O2AQ+3.5OH1-+0.5H3O
1+=5HSO51-
S2O42-+2.5O2AQ+0.5OH1-+0.5H3O
1+=2HSO51-
.2H2AQ+.1O2AQ=.2H2O
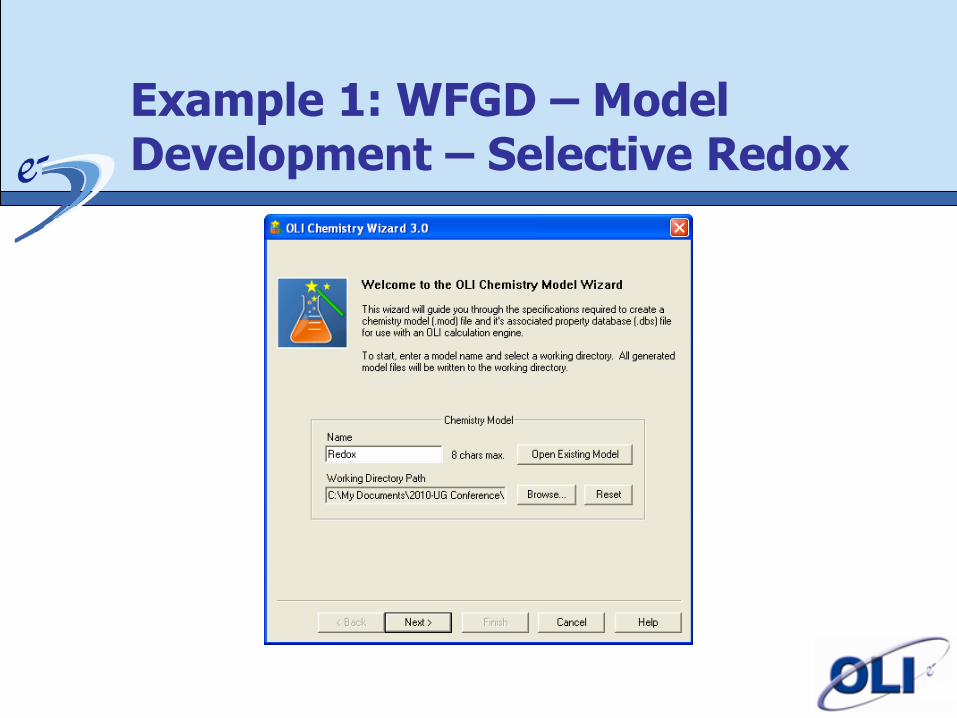
Example 1: WFGD – Model Development – Selective Redox
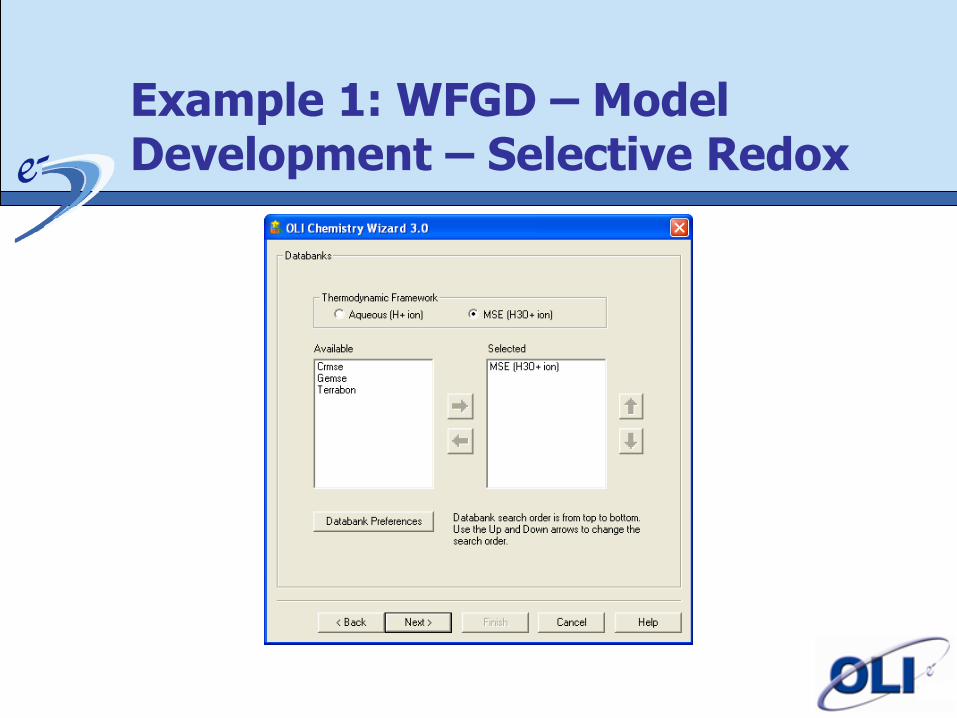
Example 1: WFGD – Model Development – Selective Redox
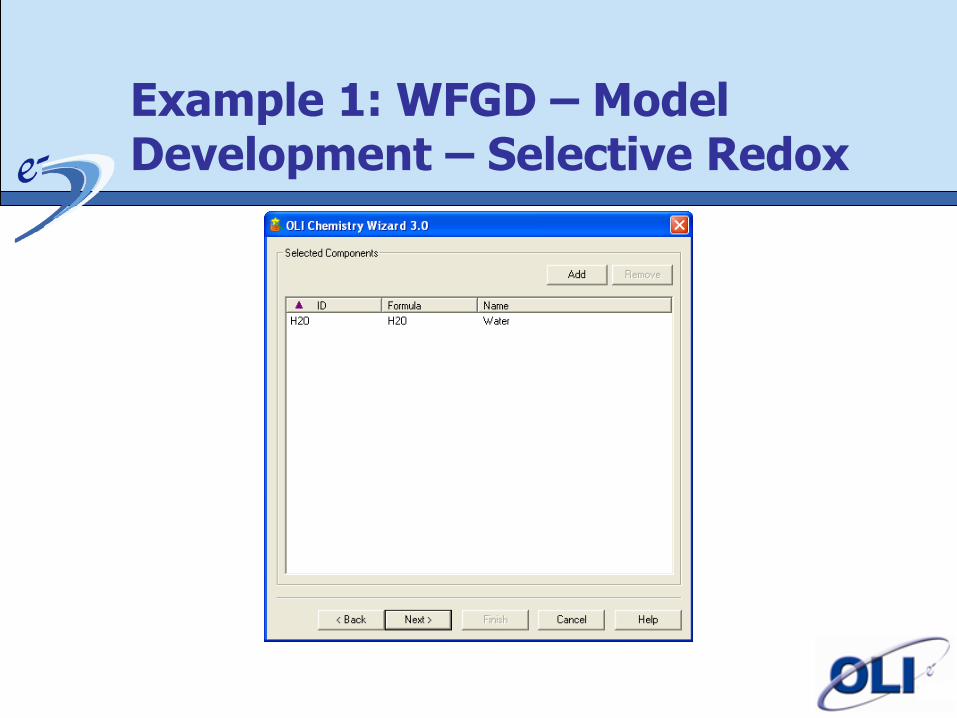
Example 1: WFGD – Model Development – Selective Redox
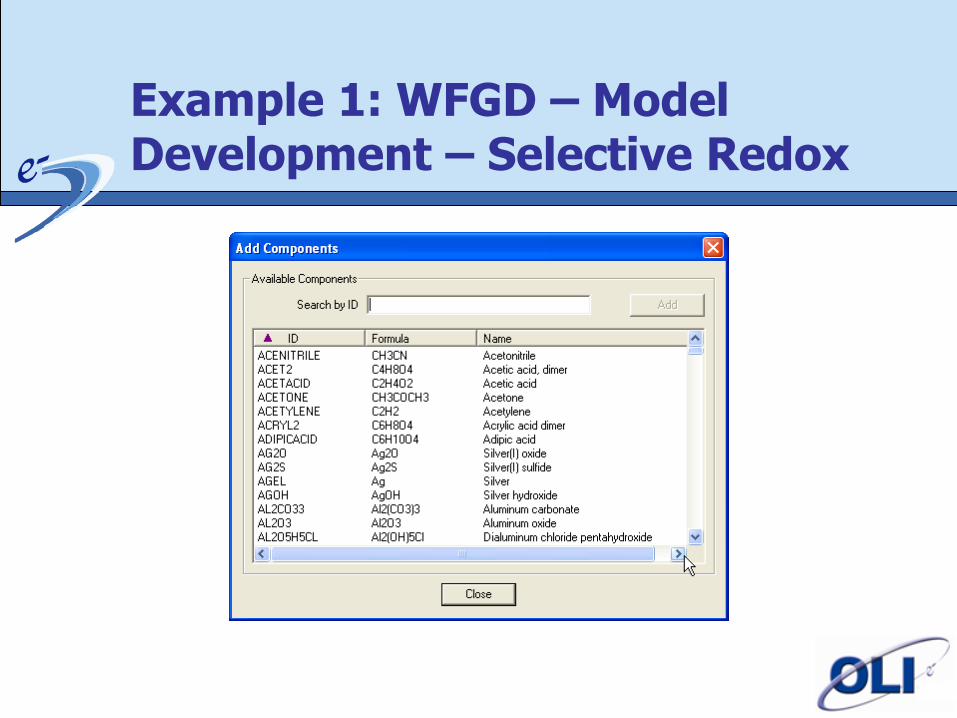
Example 1: WFGD – Model Development – Selective Redox
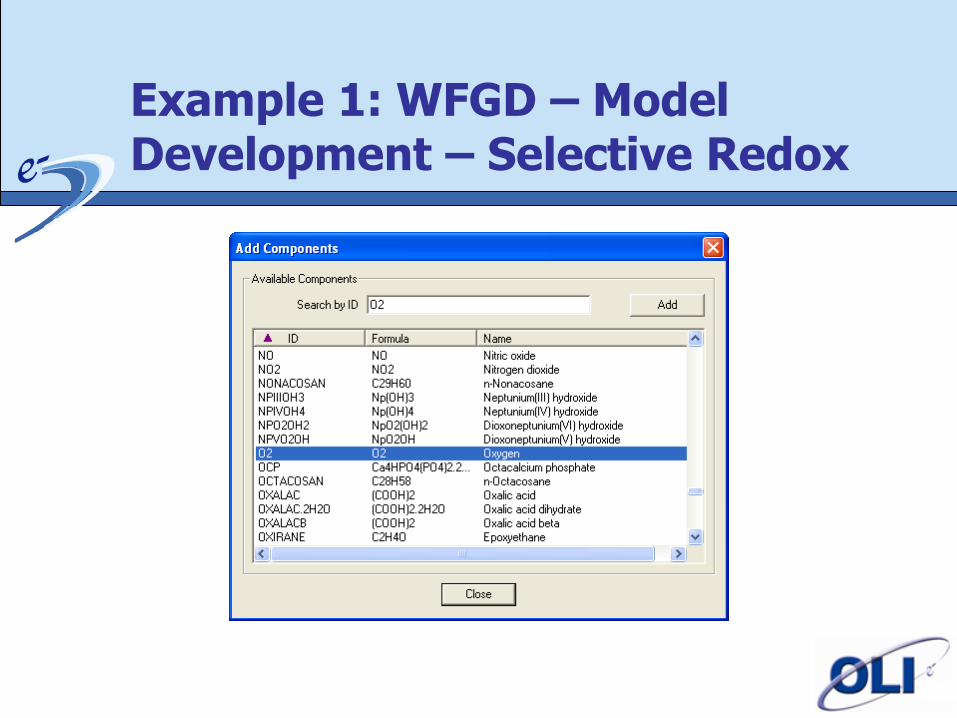
Example 1: WFGD – Model Development – Selective Redox
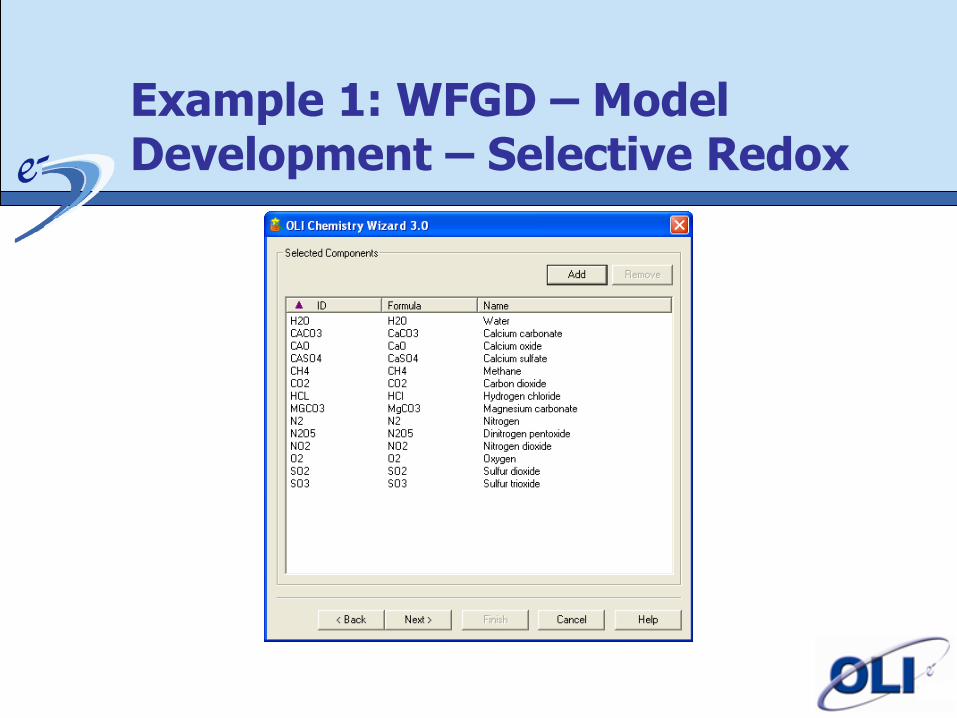
Example 1: WFGD – Model Development – Selective Redox
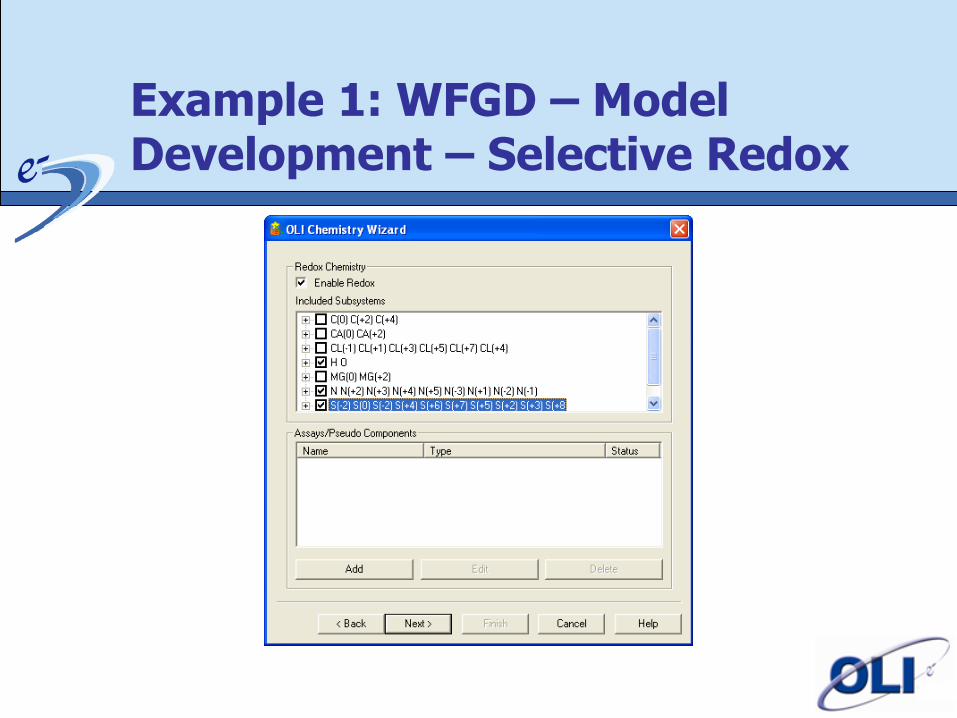
Example 1: WFGD – Model Development – Selective Redox
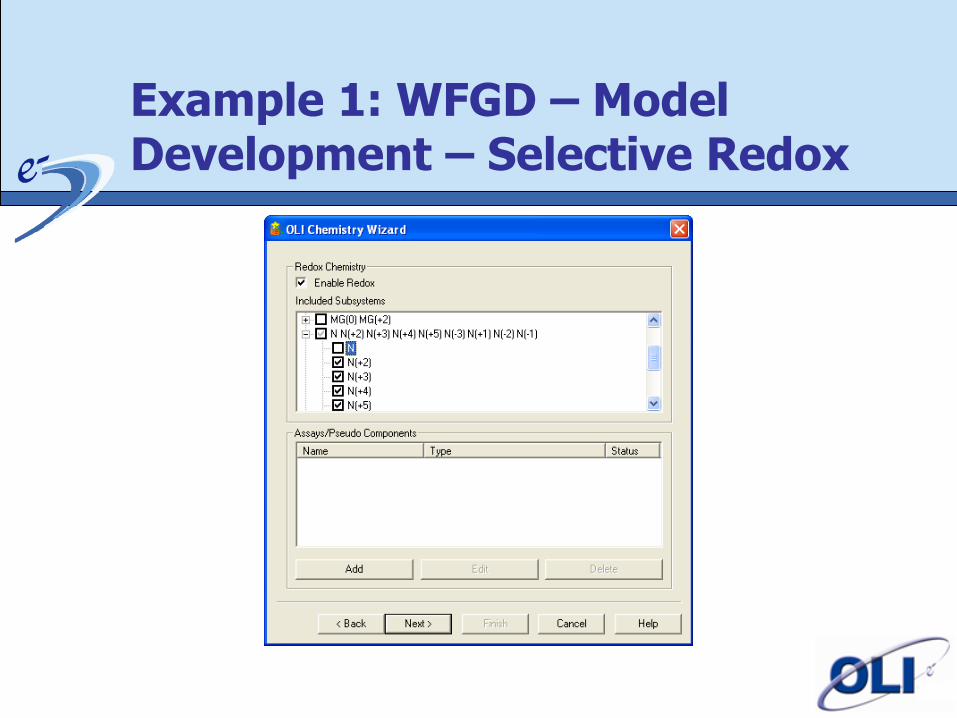
Example 1: WFGD – Model Development – Selective Redox
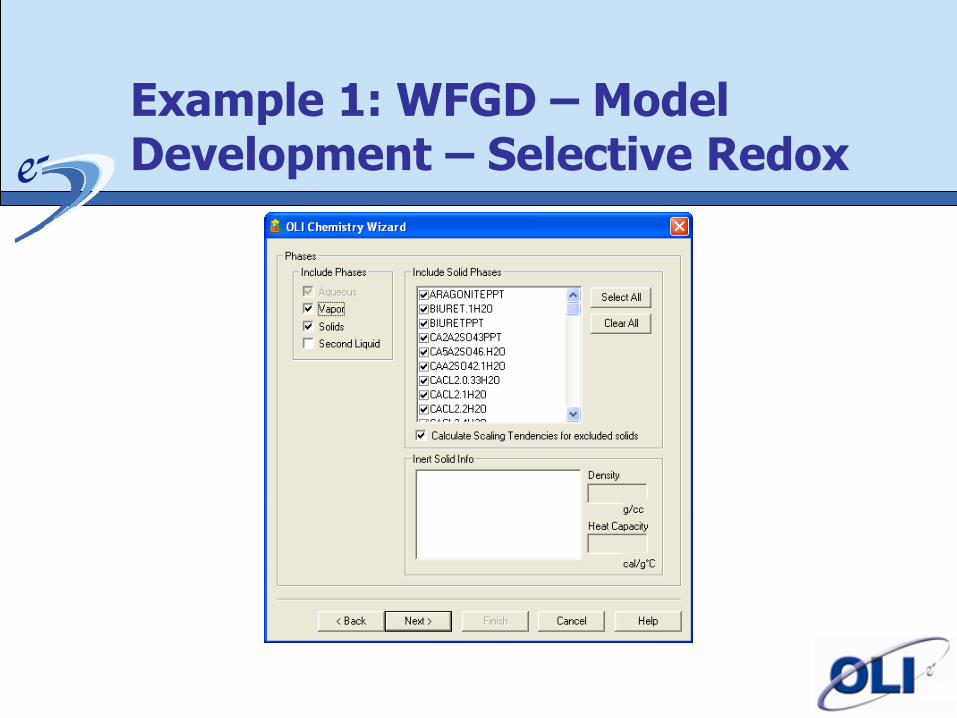
Example 1: WFGD – Model Development – Selective Redox
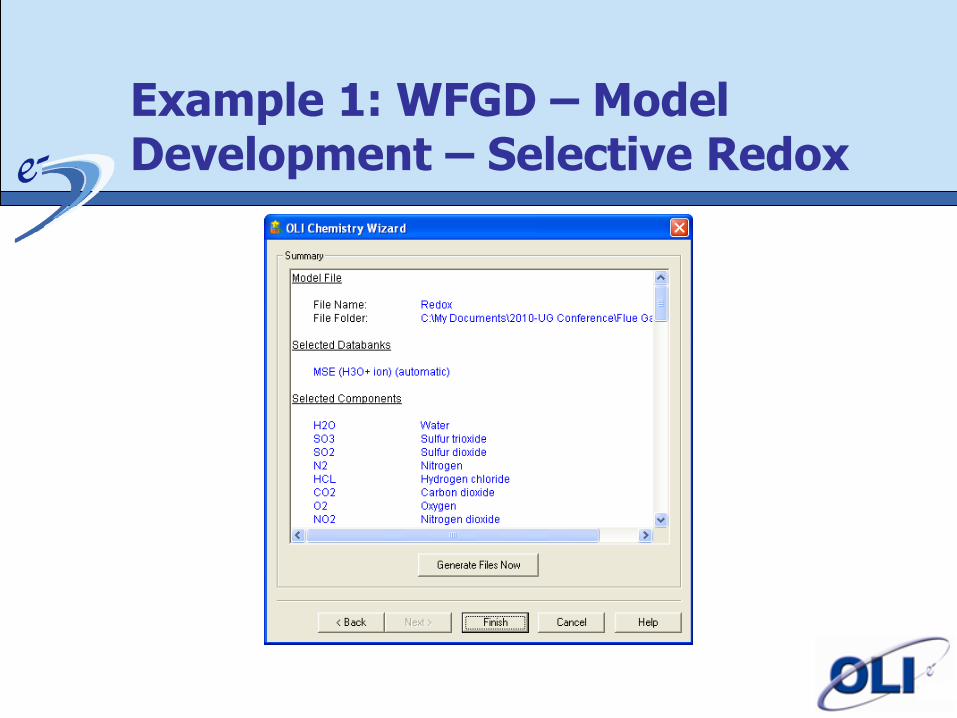
Example 1: WFGD – Model Development – Selective Redox
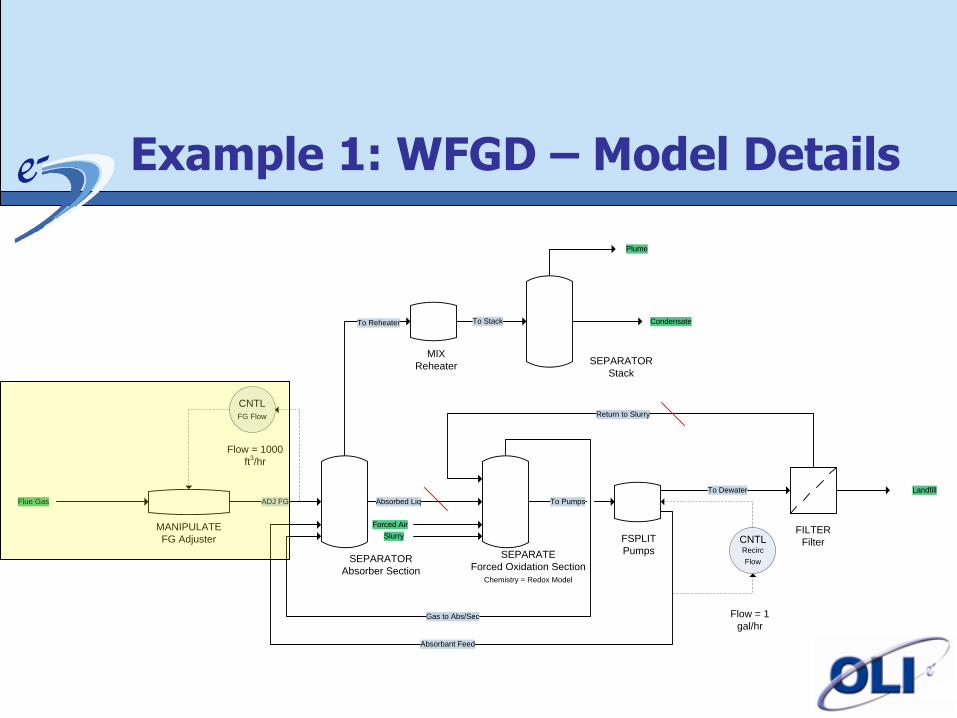
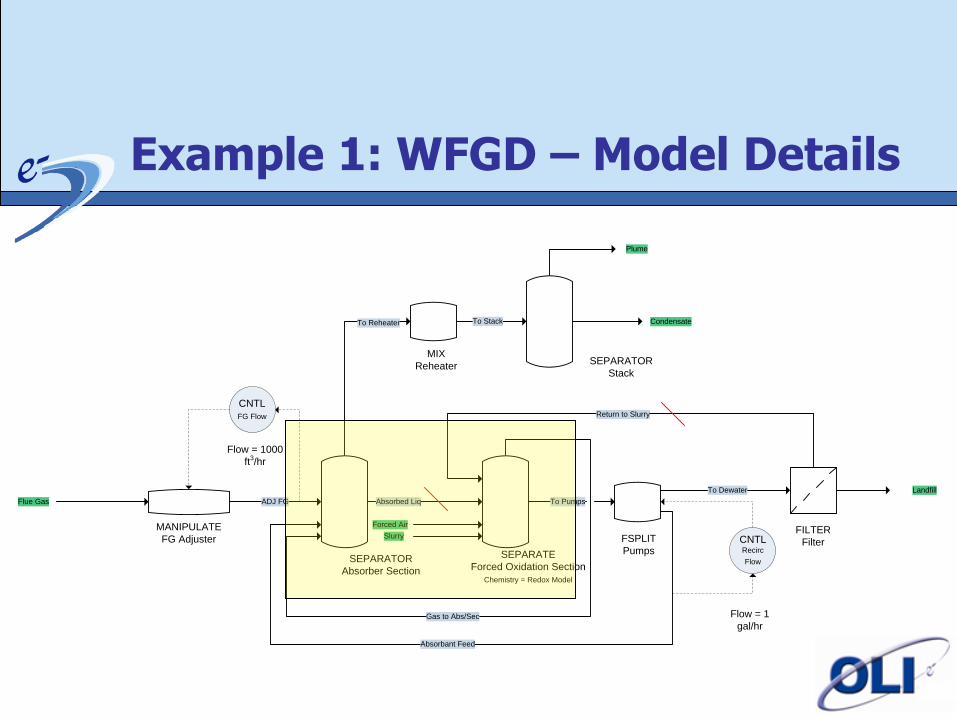
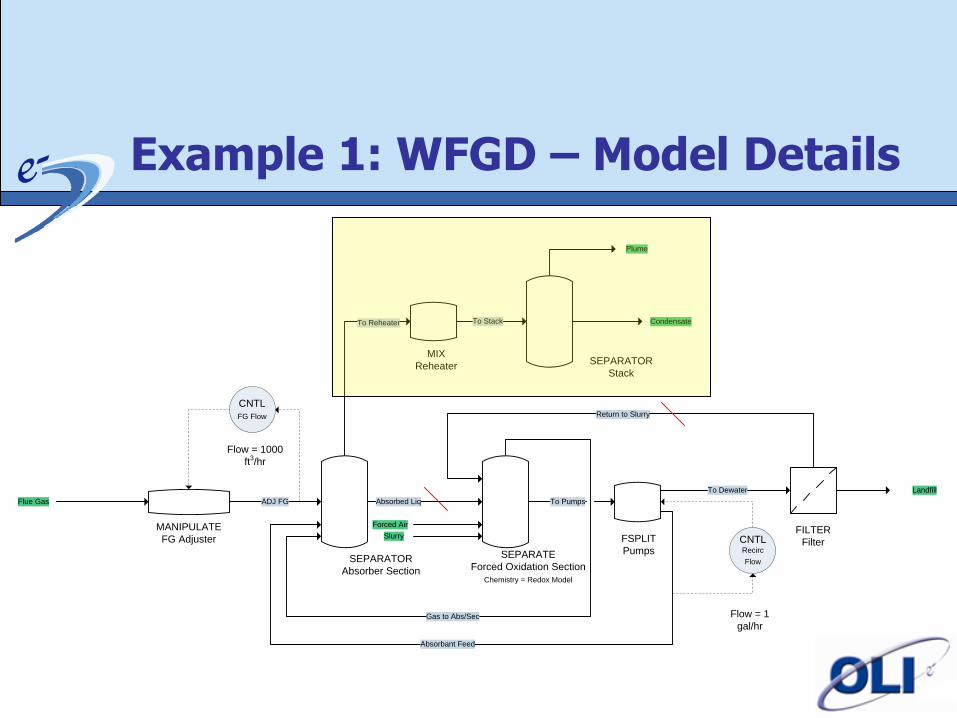
Example 1: WFGD – Model Details
MANIPULATE
FG Adjuster
Flue Gas ADJ FG
CNTL
FG Flow
Flow = 1000
ft3/hr
SEPARATOR
Absorber Section
Gas to Abs/Sec
To Reheater
Absorbed Liq
MIX
Reheater
To Stack
SEPARATOR
Stack
Plume
Condensate
SEPARATE
Forced Oxidation Section
Chemistry = Redox Model
Forced Air
Return to Slurry
To Pumps
FSPLIT
Pumps
To Dewater
CNTL
Recirc
Flow
Absorbant Feed
Flow = 1
gal/hr
FILTER
Filter
Landfill
Slurry
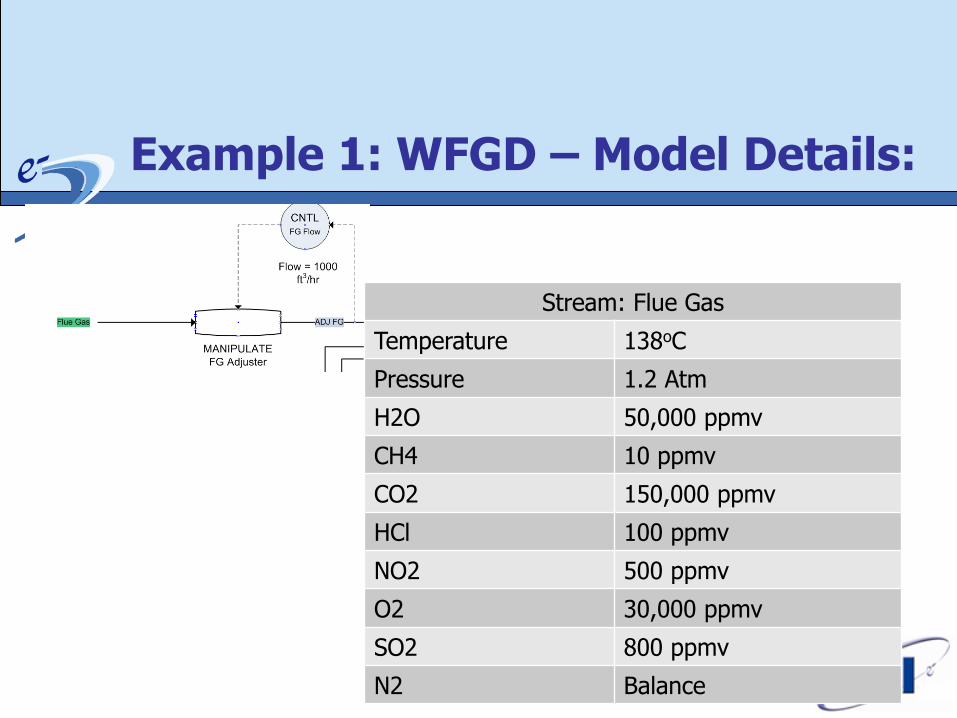
Example 1: WFGD – Model Details:
Stream: Flue Gas
Temperature 138oC
Pressure 1.2 Atm
H2O 50,000 ppmv
CH4 10 ppmv
CO2 150,000 ppmv
HCl 100 ppmv
NO2 500 ppmv
O2 30,000 ppmv
SO2 800 ppmv
N2 Balance
Example 1: WFGD – Model Details
MANIPULATE
FG Adjuster
Flue Gas ADJ FG
CNTL
FG Flow
Flow = 1000
ft3/hr
SEPARATOR
Absorber Section
Gas to Abs/Sec
To Reheater
Absorbed Liq
MIX
Reheater
To Stack
SEPARATOR
Stack
Plume
Condensate
SEPARATE
Forced Oxidation Section
Chemistry = Redox Model
Forced Air
Return to Slurry
To Pumps
FSPLIT
Pumps
To Dewater
CNTL
Recirc
Flow
Absorbant Feed
Flow = 1
gal/hr
FILTER
Filter
Landfill
Slurry
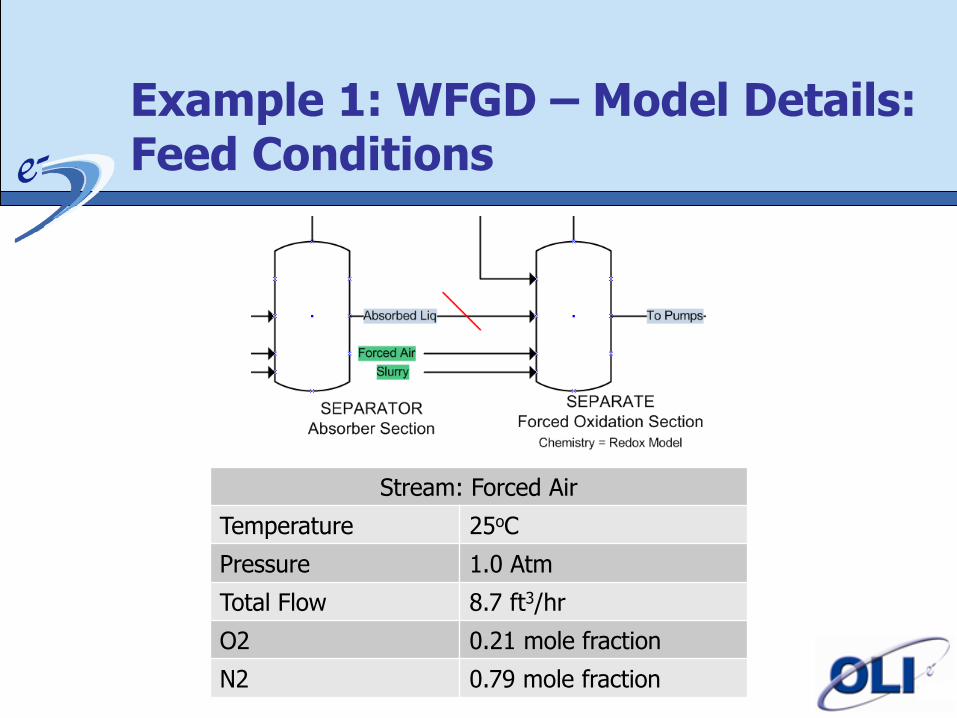
Example 1: WFGD – Model Details: Feed Conditions
Stream: Forced Air
Temperature 25oC
Pressure 1.0 Atm
Total Flow 8.7 ft3/hr
O2 0.21 mole fraction
N2 0.79 mole fraction
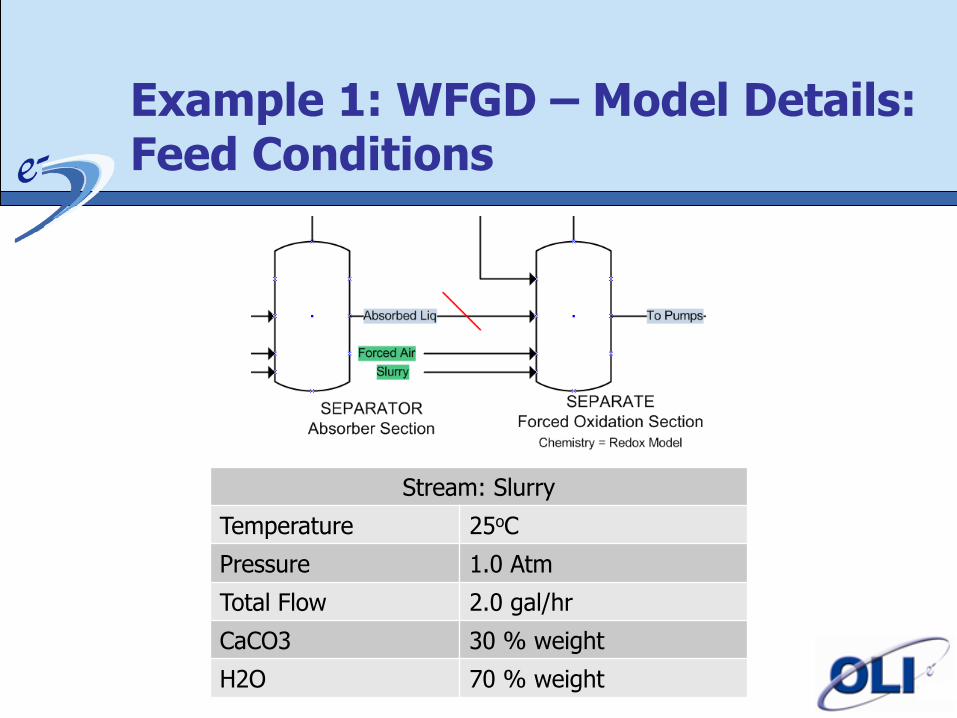
Example 1: WFGD – Model Details: Feed Conditions
Stream: Slurry
Temperature 25oC
Pressure 1.0 Atm
Total Flow 2.0 gal/hr
CaCO3 30 % weight
H2O 70 % weight
Example 1: WFGD – Model Details
MANIPULATE
FG Adjuster
Flue Gas ADJ FG
CNTL
FG Flow
Flow = 1000
ft3/hr
SEPARATOR
Absorber Section
Gas to Abs/Sec
To Reheater
Absorbed Liq
MIX
Reheater
To Stack
SEPARATOR
Stack
Plume
Condensate
SEPARATE
Forced Oxidation Section
Chemistry = Redox Model
Forced Air
Return to Slurry
To Pumps
FSPLIT
Pumps
To Dewater
CNTL
Recirc
Flow
Absorbant Feed
Flow = 1
gal/hr
FILTER
Filter
Landfill
Slurry
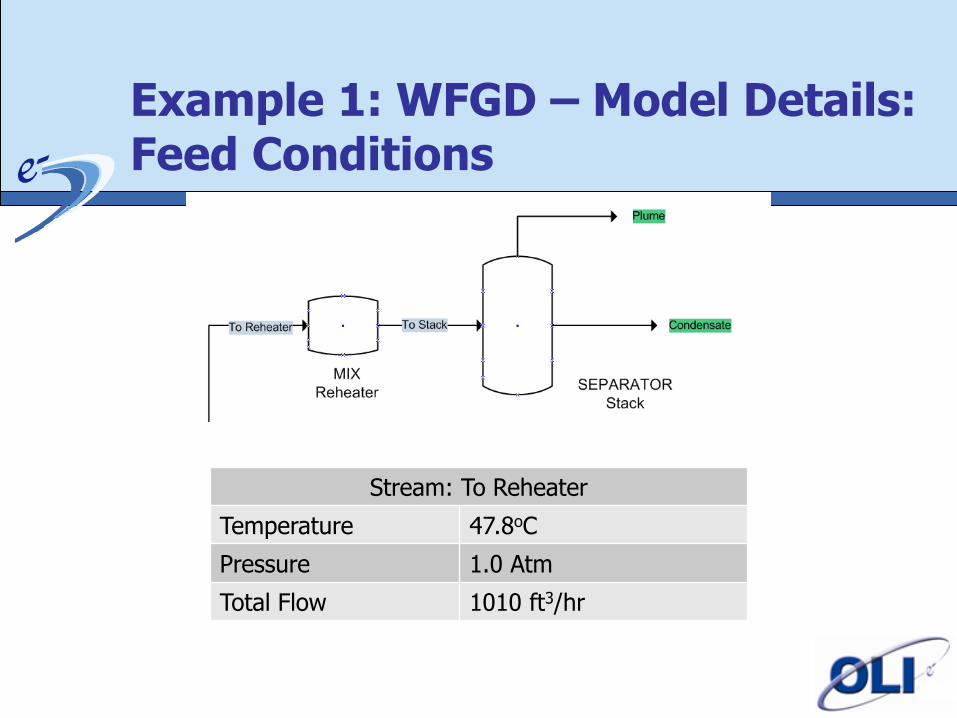
Example 1: WFGD – Model Details: Feed Conditions
Stream: To Reheater
Temperature 47.8oC
Pressure 1.0 Atm
Total Flow 1010 ft3/hr
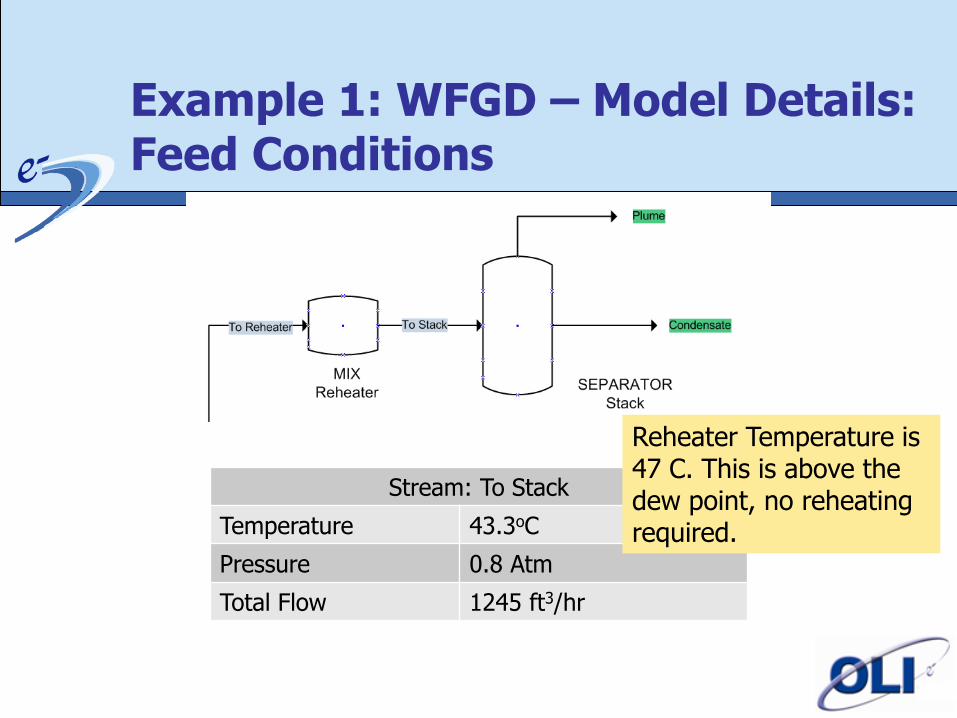
Example 1: WFGD – Model Details: Feed Conditions
Stream: To Stack
Temperature 43.3oC
Pressure 0.8 Atm
Total Flow 1245 ft3/hr
Reheater Temperature is 47 C. This is above the dew point, no reheating required.
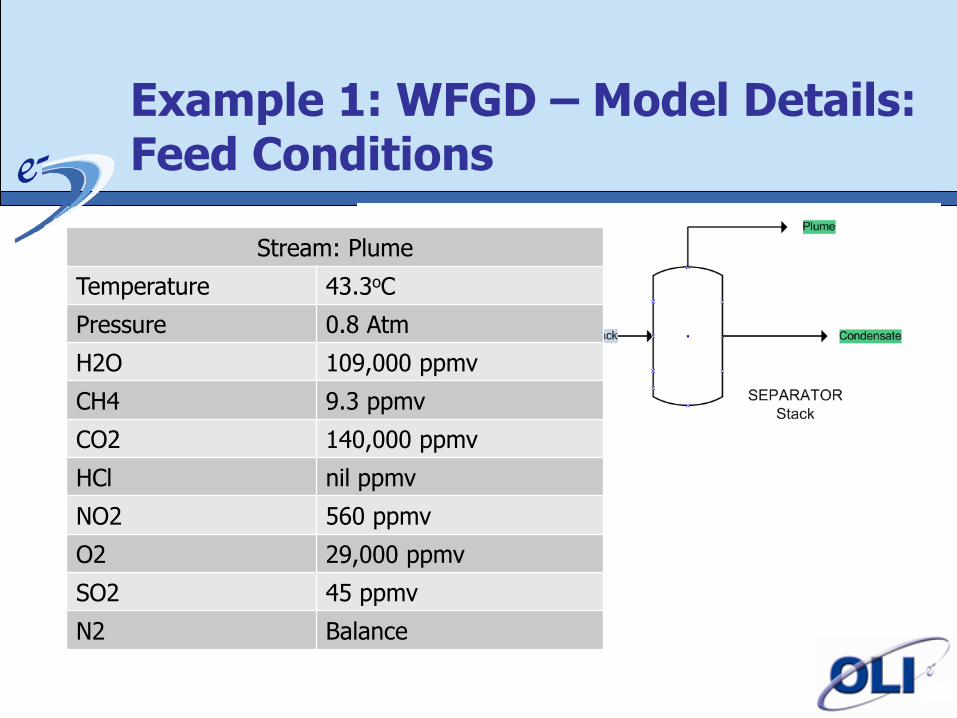
Example 1: WFGD – Model Details: Feed Conditions
Stream: Plume
Temperature 43.3oC
Pressure 0.8 Atm
H2O 109,000 ppmv
CH4 9.3 ppmv
CO2 140,000 ppmv
HCl nil ppmv
NO2 560 ppmv
O2 29,000 ppmv
SO2 45 ppmv
N2 Balance
Example 1: WFGD – Model Details
MANIPULATE
FG Adjuster
Flue Gas ADJ FG
CNTL
FG Flow
Flow = 1000
ft3/hr
SEPARATOR
Absorber Section
Gas to Abs/Sec
To Reheater
Absorbed Liq
MIX
Reheater
To Stack
SEPARATOR
Stack
Plume
Condensate
SEPARATE
Forced Oxidation Section
Chemistry = Redox Model
Forced Air
Return to Slurry
To Pumps
FSPLIT
Pumps
To Dewater
CNTL
Recirc
Flow
Absorbant Feed
Flow = 1
gal/hr
FILTER
Filter
Landfill
Slurry
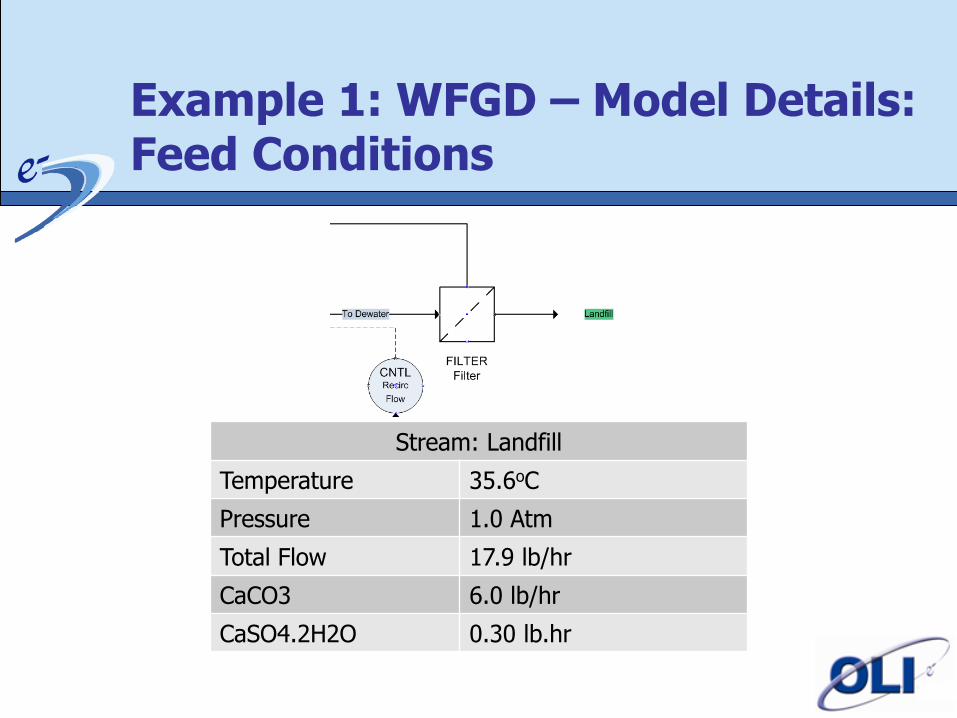
Example 1: WFGD – Model Details: Feed Conditions
Stream: Landfill
Temperature 35.6oC
Pressure 1.0 Atm
Total Flow 17.9 lb/hr
CaCO3 6.0 lb/hr
CaSO4.2H2O 0.30 lb.hr
Example 1: Conclusions & Future work
• It would seem that Flue Gas Desulfurization can be modeled.
• A third model should be added to limit the amount of calcium carbonate that is formed.
Example 2: Gas Sweetening
• This example will illustrate several things:
• Alkanolamine gas-sweetening using new parameters in MSE
• Mass-Transfer using OLI’s enhanced capabilities
Example 2: Gas Sweetening
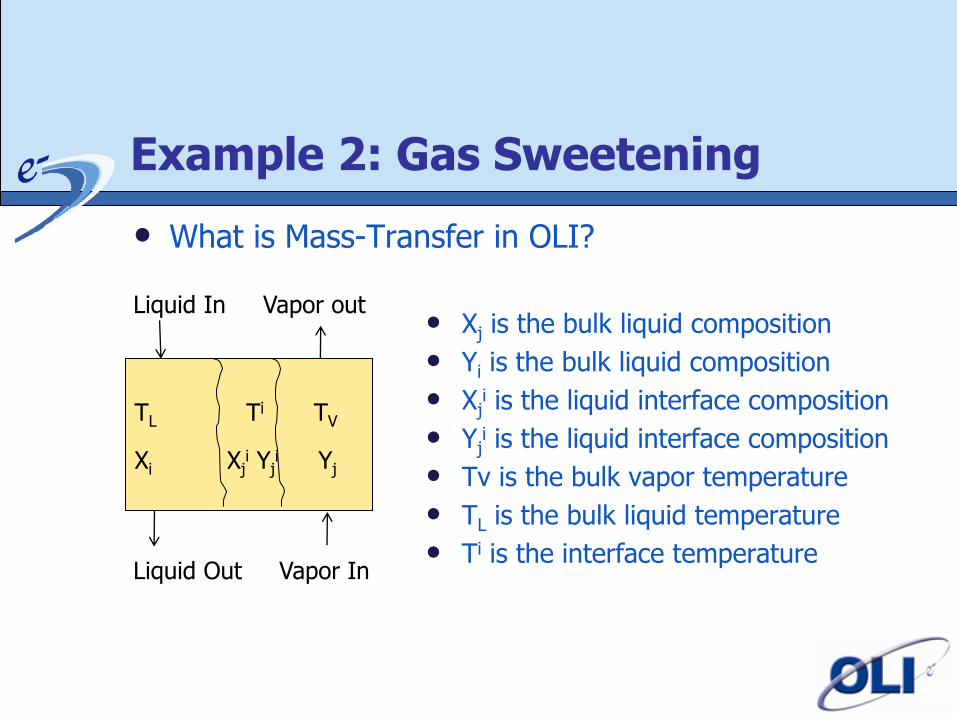
• What is Mass-Transfer in OLI?
Liquid In Vapor out
Liquid Out Vapor In
TL Ti TV
Xi Xji Yj
i Yj
• Xj is the bulk liquid composition
• Yi is the bulk liquid composition
• Xji is the liquid interface composition
• Yji is the liquid interface composition
• Tv is the bulk vapor temperature
• TL is the bulk liquid temperature
• Ti is the interface temperature
Example 2: Gas Sweetening
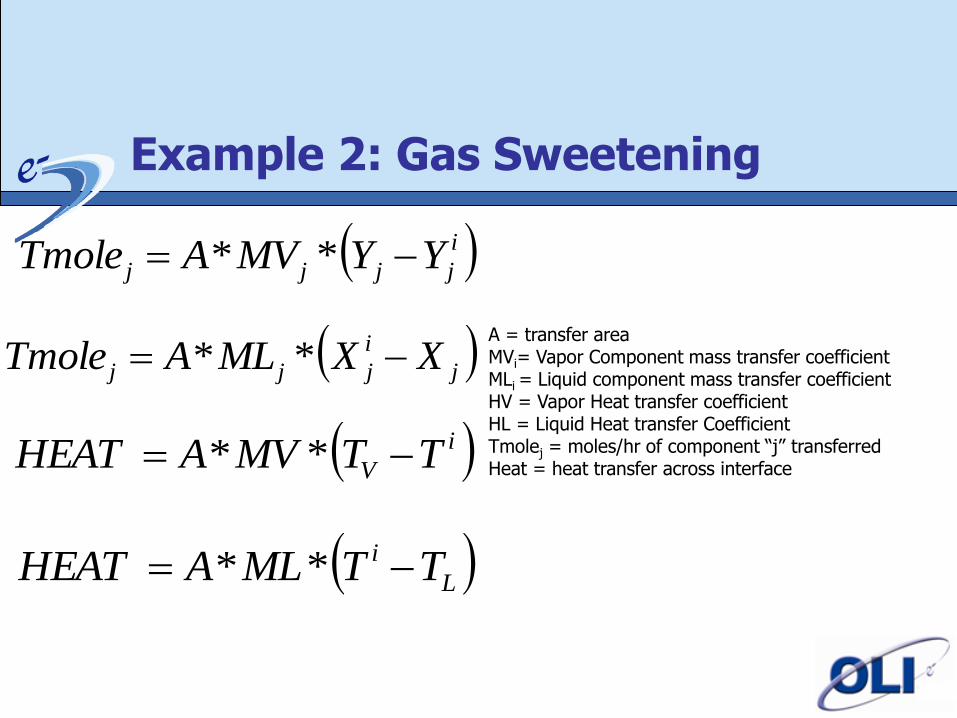
ijjjj YYMVATmole **
ji
jjj XXMLATmole **
iV TTMVAHEAT **
L
i TTMLAHEAT **
A = transfer area MVi= Vapor Component mass transfer coefficient MLi = Liquid component mass transfer coefficient HV = Vapor Heat transfer coefficient HL = Liquid Heat transfer Coefficient Tmolej = moles/hr of component “j” transferred Heat = heat transfer across interface
Example 2: Gas Sweetening
• Existing Modeling capabilities
• Liquid Mass Transfer Coefficients
• Vapor Mass Transfer Coefficients
• Liquid heat transfer coefficients
• Vapor heat transfer coefficients
• Transfer Area
• Component mass transfer coefficients
Example 2: Gas Sweetening
• Enhanced Modeling capabilities
• Several Column Types
Packed Column
Sieve Tray
Bubble Cap
Valve Tray
Example 2: Gas Sweetening
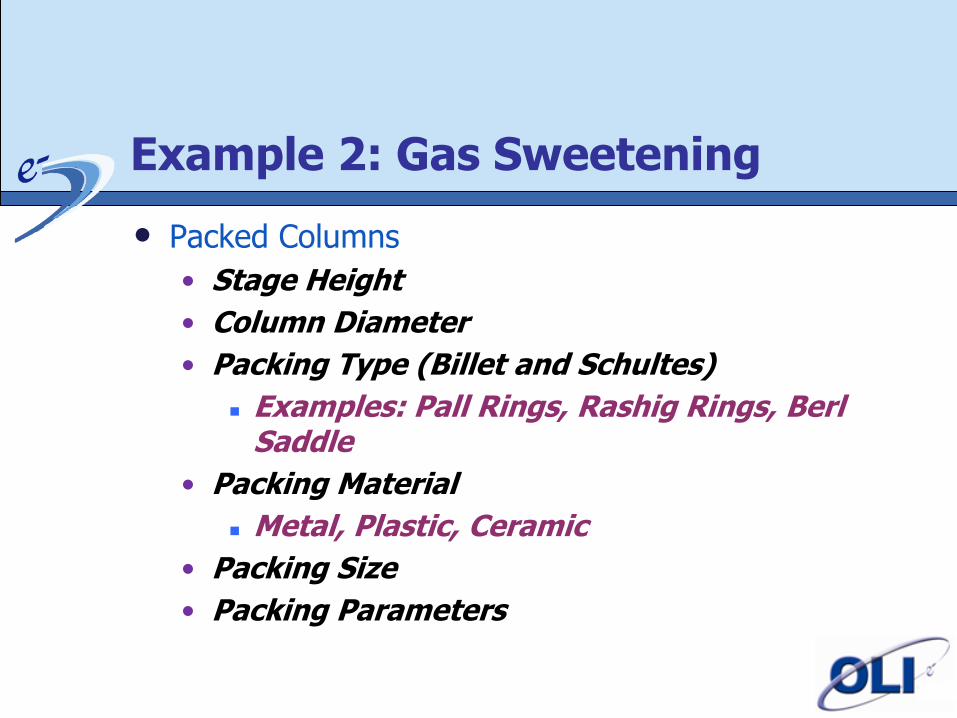
• Packed Columns
• Stage Height
• Column Diameter
• Packing Type (Billet and Schultes)
Examples: Pall Rings, Rashig Rings, Berl Saddle
• Packing Material
Metal, Plastic, Ceramic
• Packing Size
• Packing Parameters
Example 2: Gas Sweetening
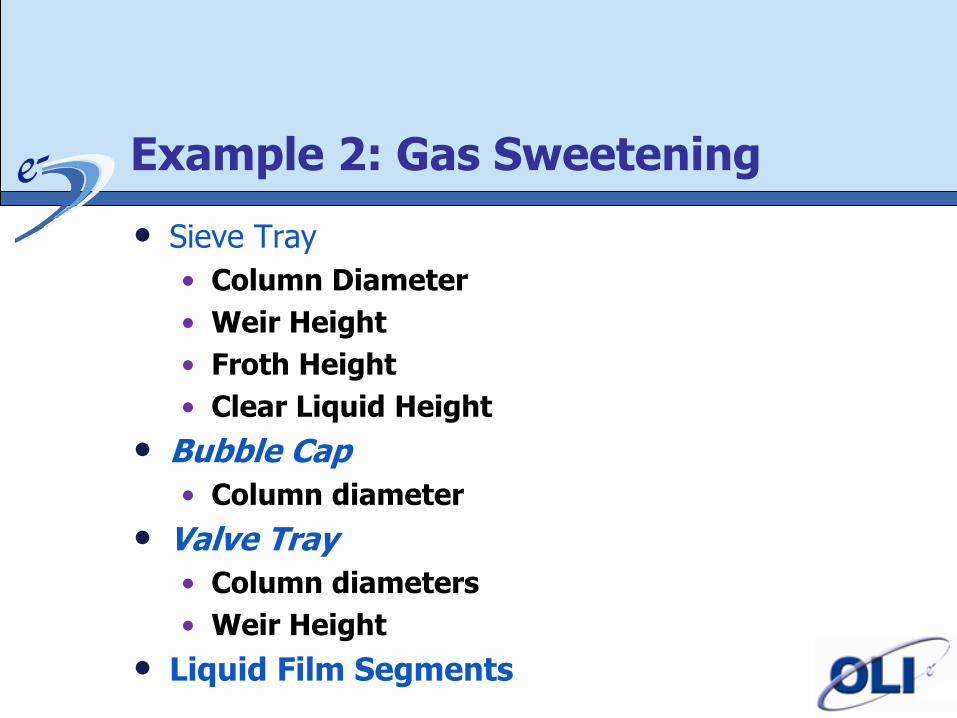
• Sieve Tray
• Column Diameter
• Weir Height
• Froth Height
• Clear Liquid Height
• Bubble Cap
• Column diameter
• Valve Tray
• Column diameters
• Weir Height
• Liquid Film Segments
Example 2: Gas Sweetening
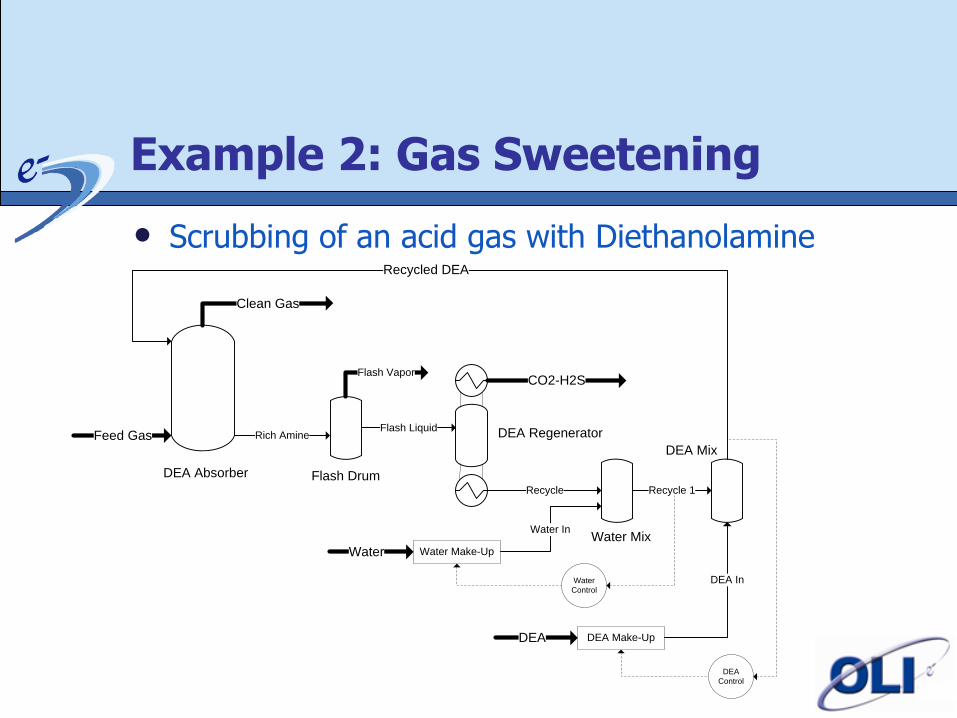
• Scrubbing of an acid gas with Diethanolamine
DEA Absorber
Feed Gas Rich Amine
Flash Drum
Clean Gas
Flash Vapor
Flash Liquid DEA Regenerator
Recycle
CO2-H2S
Water MixWater Make-UpWater
Water In
Recycle 1
DEA Mix
DEA Make-UpDEA
DEA InWater
Control
DEA
Control
Recycled DEA
Example 2: Gas Sweetening
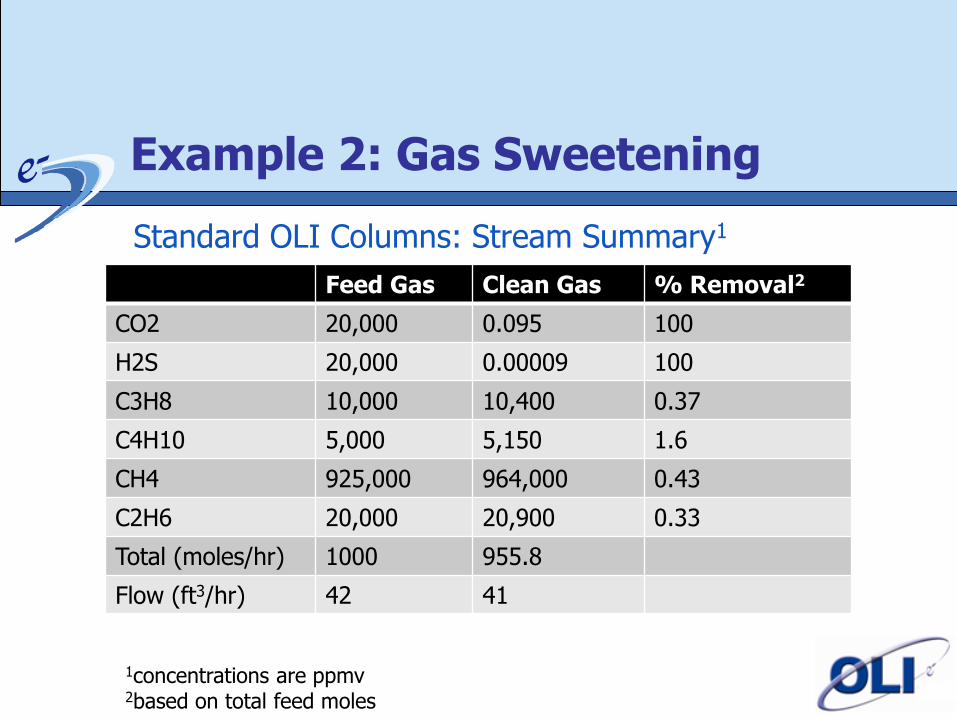
Standard OLI Columns: Stream Summary1
Feed Gas Clean Gas % Removal2
CO2 20,000 0.095 100
H2S 20,000 0.00009 100
C3H8 10,000 10,400 0.37
C4H10 5,000 5,150 1.6
CH4 925,000 964,000 0.43
C2H6 20,000 20,900 0.33
Total (moles/hr) 1000 955.8
Flow (ft3/hr) 42 41
1concentrations are ppmv 2based on total feed moles
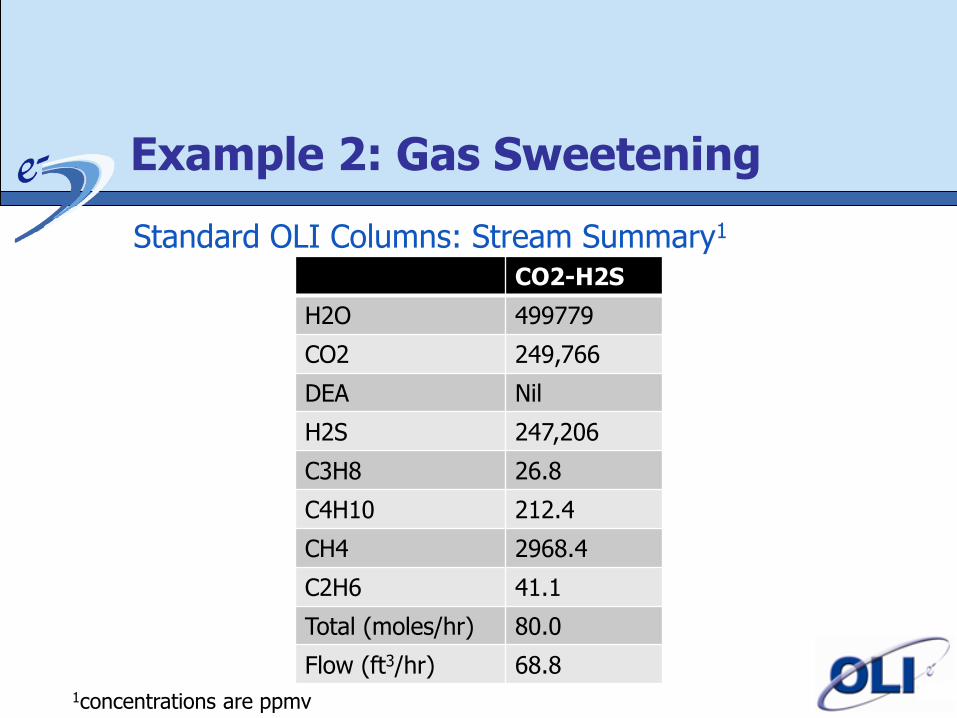
Example 2: Gas Sweetening
Standard OLI Columns: Stream Summary1
CO2-H2S
H2O 499779
CO2 249,766
DEA Nil
H2S 247,206
C3H8 26.8
C4H10 212.4
CH4 2968.4
C2H6 41.1
Total (moles/hr) 80.0
Flow (ft3/hr) 68.8 1concentrations are ppmv
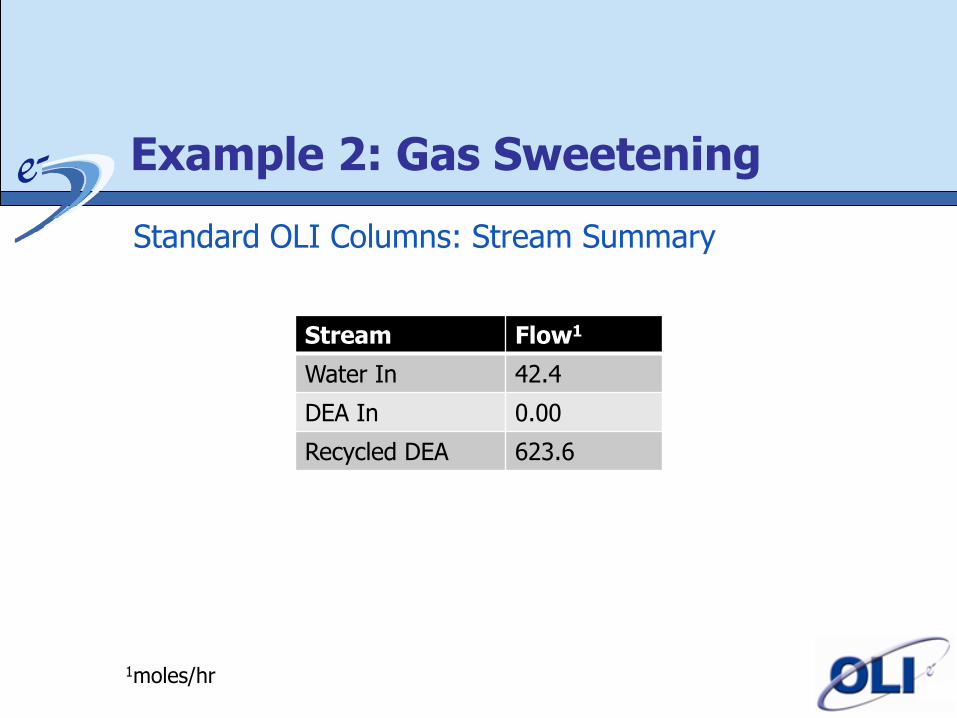
Example 2: Gas Sweetening
Standard OLI Columns: Stream Summary
Stream Flow1
Water In 42.4
DEA In 0.00
Recycled DEA 623.6
1moles/hr
Example 2: Gas Sweetening
• Mass-Transfer Columns
• DEA Absorber and DEA Regenerator Columns are set to the same type
Packed Column
Pall Rings, 50 mm
Stage Height = 1 mm
Column Diameter to be calculated
Liquid Film segments = 1
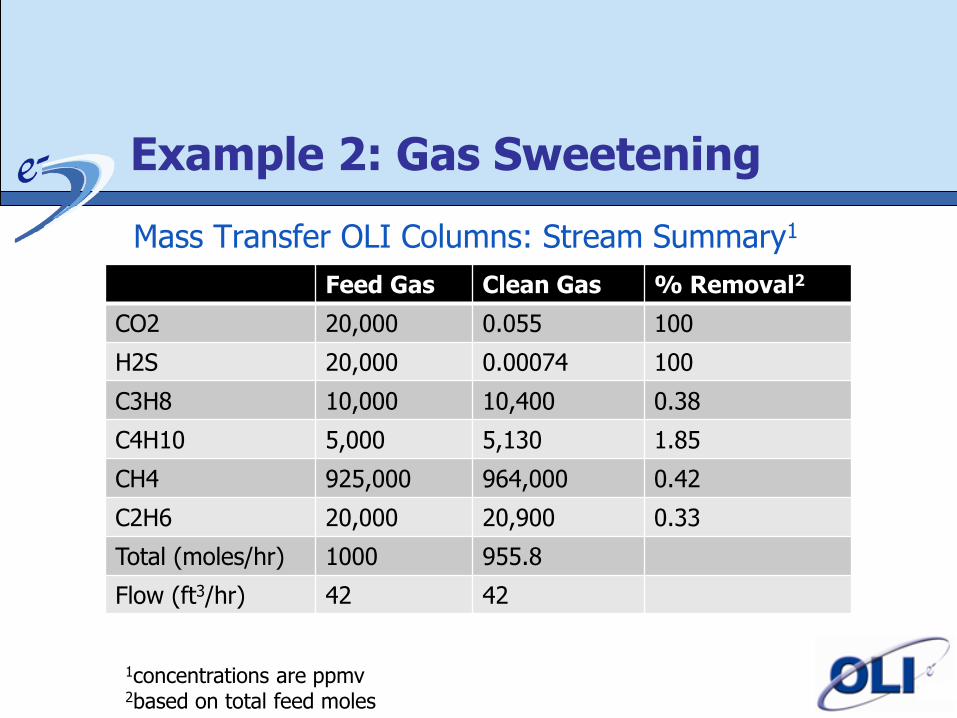
Example 2: Gas Sweetening
Mass Transfer OLI Columns: Stream Summary1
Feed Gas Clean Gas % Removal2
CO2 20,000 0.055 100
H2S 20,000 0.00074 100
C3H8 10,000 10,400 0.38
C4H10 5,000 5,130 1.85
CH4 925,000 964,000 0.42
C2H6 20,000 20,900 0.33
Total (moles/hr) 1000 955.8
Flow (ft3/hr) 42 42
1concentrations are ppmv 2based on total feed moles
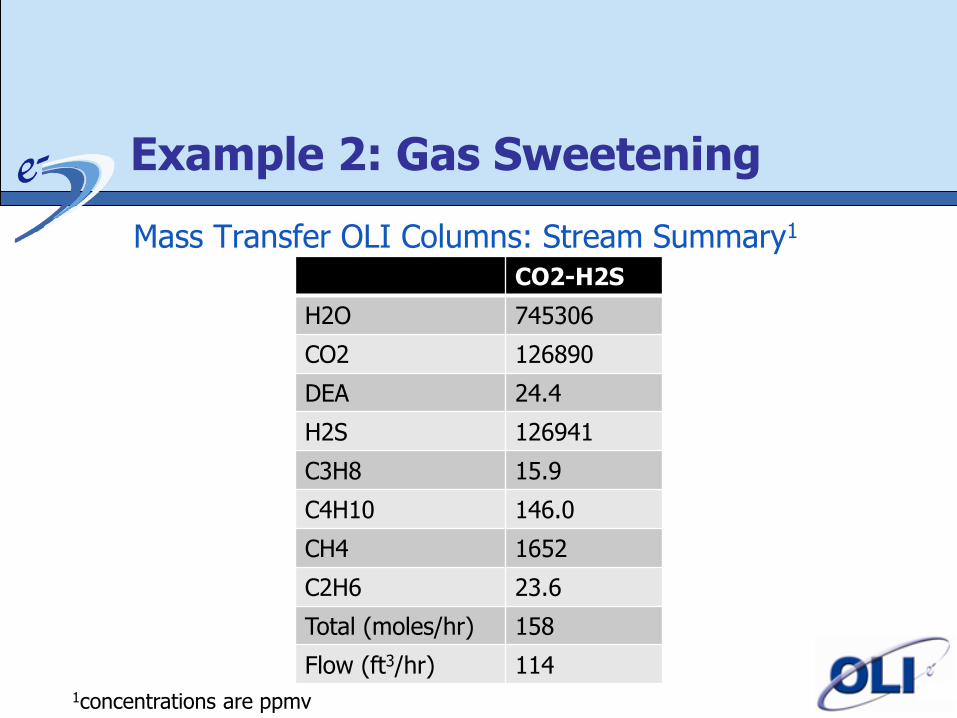
Example 2: Gas Sweetening
Mass Transfer OLI Columns: Stream Summary1
CO2-H2S
H2O 745306
CO2 126890
DEA 24.4
H2S 126941
C3H8 15.9
C4H10 146.0
CH4 1652
C2H6 23.6
Total (moles/hr) 158
Flow (ft3/hr) 114 1concentrations are ppmv
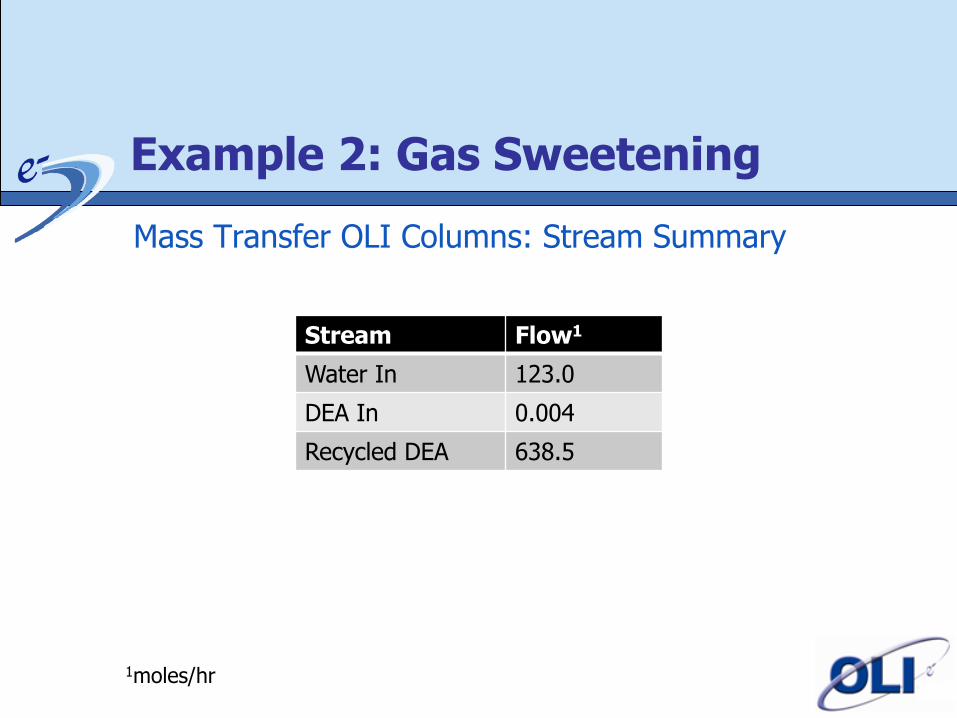
Example 2: Gas Sweetening
Mass Transfer OLI Columns: Stream Summary
Stream Flow1
Water In 123.0
DEA In 0.004
Recycled DEA 638.5
1moles/hr
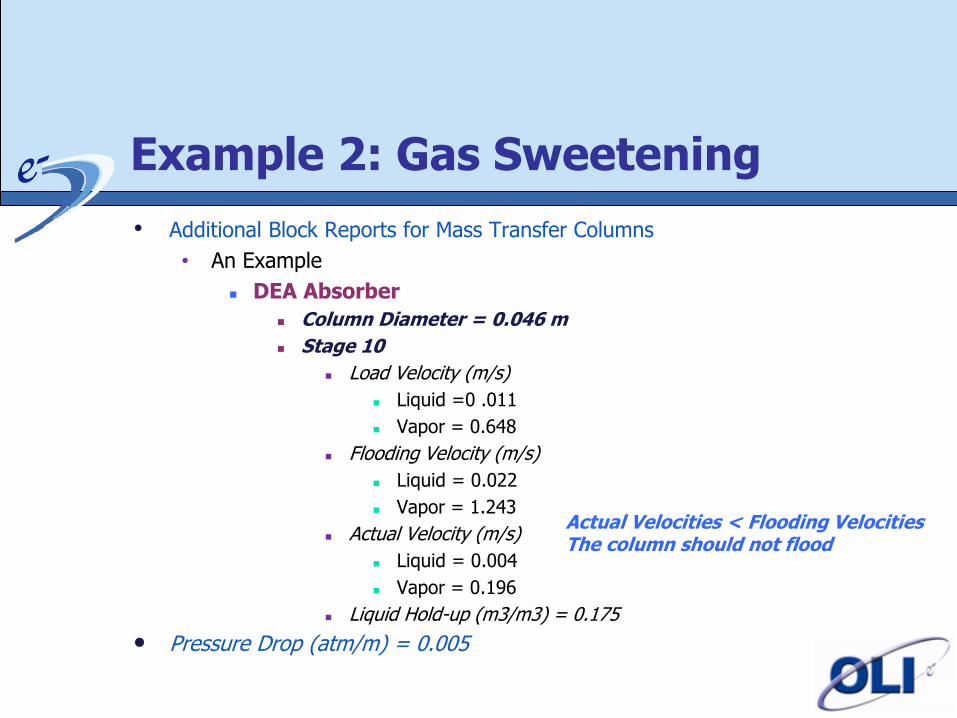
Example 2: Gas Sweetening
• Additional Block Reports for Mass Transfer Columns
• An Example
DEA Absorber
Column Diameter = 0.046 m
Stage 10
Load Velocity (m/s)
Liquid =0 .011
Vapor = 0.648
Flooding Velocity (m/s)
Liquid = 0.022
Vapor = 1.243
Actual Velocity (m/s)
Liquid = 0.004
Vapor = 0.196
Liquid Hold-up (m3/m3) = 0.175
• Pressure Drop (atm/m) = 0.005
Actual Velocities < Flooding Velocities The column should not flood
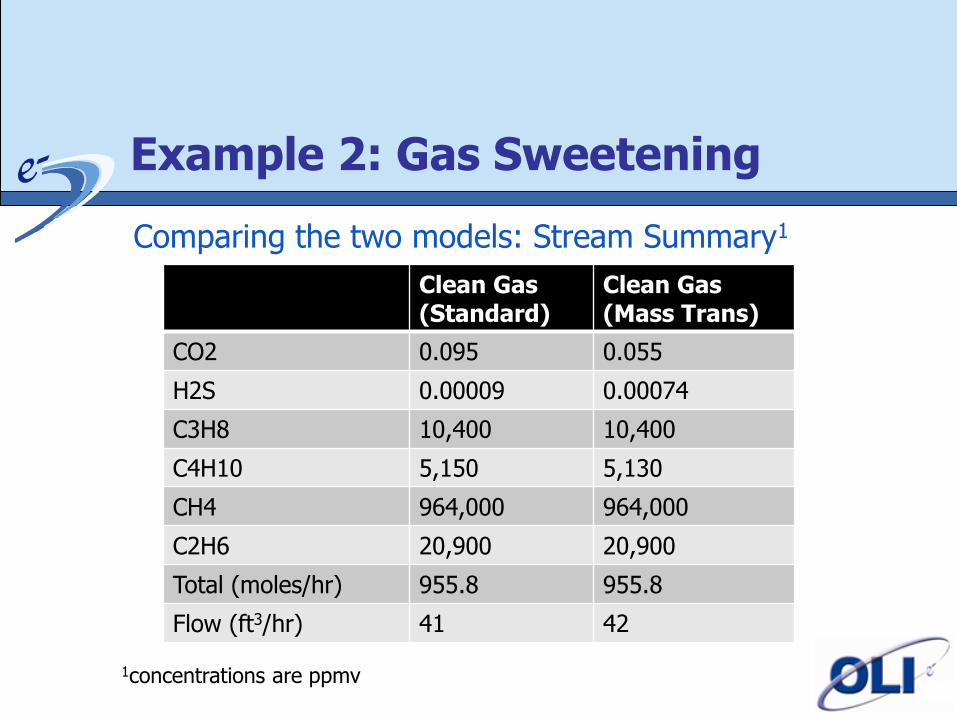
Example 2: Gas Sweetening
Comparing the two models: Stream Summary1
Clean Gas (Standard)
Clean Gas (Mass Trans)
CO2 0.095 0.055
H2S 0.00009 0.00074
C3H8 10,400 10,400
C4H10 5,150 5,130
CH4 964,000 964,000
C2H6 20,900 20,900
Total (moles/hr) 955.8 955.8
Flow (ft3/hr) 41 42
1concentrations are ppmv
Example 2: Gas Sweetening
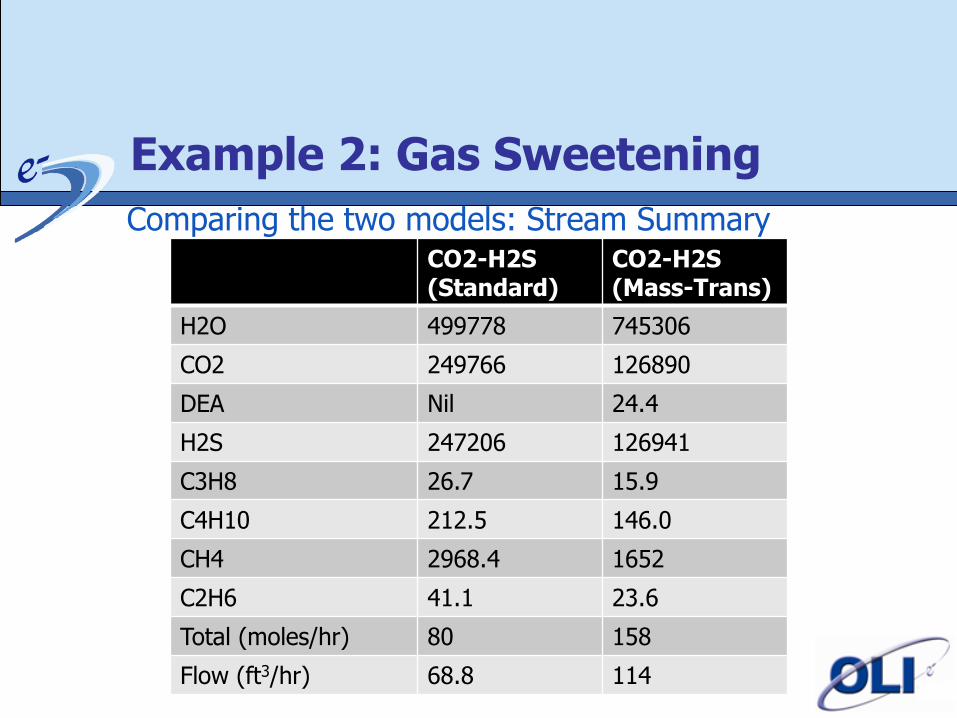
Comparing the two models: Stream Summary
CO2-H2S (Standard)
CO2-H2S (Mass-Trans)
H2O 499778 745306
CO2 249766 126890
DEA Nil 24.4
H2S 247206 126941
C3H8 26.7 15.9
C4H10 212.5 146.0
CH4 2968.4 1652
C2H6 41.1 23.6
Total (moles/hr) 80 158
Flow (ft3/hr) 68.8 114
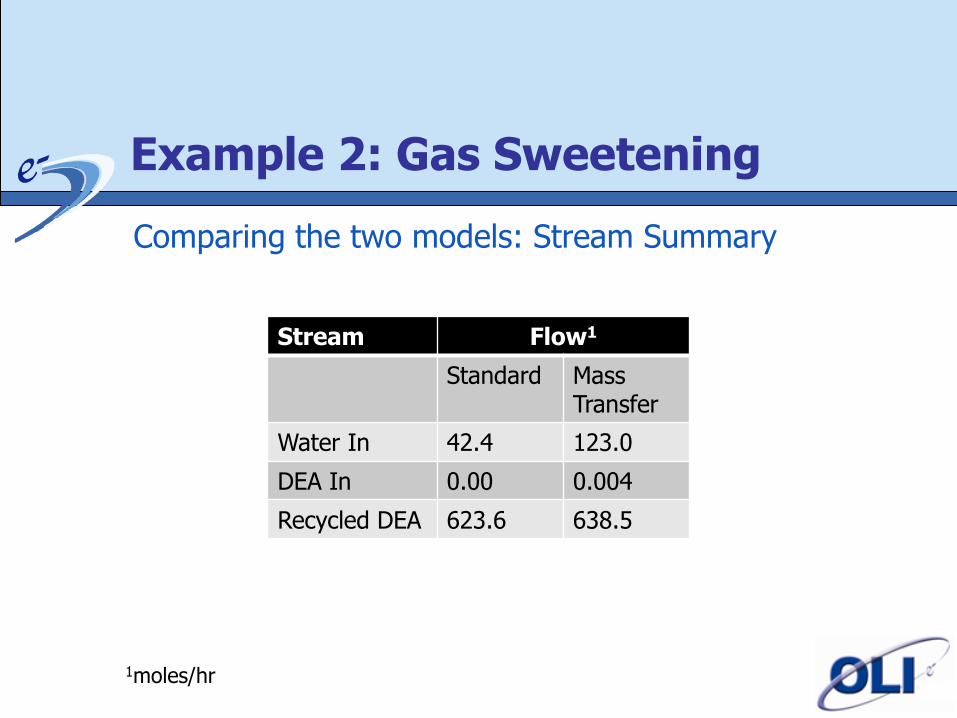
Example 2: Gas Sweetening
Comparing the two models: Stream Summary
Stream Flow1
Standard Mass Transfer
Water In 42.4 123.0
DEA In 0.00 0.004
Recycled DEA 623.6 638.5
1moles/hr
Example 2: Gas Sweetening
• Conclusions
• OLI now has more formal mass-transfer capabilities
• The Packed Column has essentially the same performance as the standard column but used more reagent as expected.
Conclusions
• The ability of multiple models in ESP allows for different phenomena to be modeled in the same flow sheet.
• Potentially allows for simulating reaction kinetics without actually having kinetic data.
• Mass-transfer simulations can now approximate actual design specifications. More development in this area is underway.