designing youth employment policies in egypt · pdf filecontribute to building a foundation...
TRANSCRIPT

DESIGNING YOUTH EMPLOYMENT POLICIES IN EGYPT
Akira Murata
GLOBAL ECONOMY & DEVELOPMENT
WORKING PAPER 68 | JANUARY 2014
Global Economyand Developmentat BROOKINGS
Global Economyand Developmentat BROOKINGS

Akira Murata is a research fellow at the Japan
International Cooperation Agency Research Institute
(JICA-RI) in Tokyo, Japan.
Acknowledgements:
I would like to thank Hafez Ghanem, Homi Kharas, Marc Schiffbauer and Rubén Lamdany for their valuable advice
and comments on an earlier draft. I also extend my sincerest appreciation to Akihiko Koenuma, Kei Sakamoto and
Misaki Kimura for their invaluable assistance and to Michael D. Rettig and Karim Foda for editing the final version
of this paper. I would also like to thank El-Zanaty & Associates and the Demographic Institute for their excellent
work in conducting surveys in Egypt and Indonesia, respectively. The views expressed in this paper and any errors
are those of the author and do not represent the official position of the Japan International Cooperation Agency.

Abstract:
This paper aims to find effective policy options that can support the development of more attractive jobs in Egypt’s
private sector and lead to job creation and inclusive growth. Egypt is facing a marked “youth bulge” and therefore
has a high rate of youth unemployment, particularly among the highly educated. The paper uses a discrete choice
experiment (DCE) to elicit job preferences among youth, and analyzes survey data collected from engineering
students at 10 universities in six cities in Egypt during the period of July through October 2013. For a comparative
analysis, the survey was also conducted at eight universities in five cities in Indonesia, which is one of the nations
in Asia with a Muslim-majority population that faces the same demographic issue. The findings of this research will
contribute to building a foundation for designing youth employment policies in Egypt. The most obvious findings to
emerge from this study are that: the public-private sector wage differentials must be narrowed; better benefits must
accompany private sector employment (particularly support for continuing education, upgrading qualifications, and
health insurance); and good IT infrastructure matters. Taken together, these steps could significantly contribute to
an increase in the rates of a private sector employment among young Egyptian job seekers, even in the case of
continued high public sector wages.

CONTENTS
Introduction . . . . . . . . . . . . . . . . . . . . . . . . . . . . . . . . . . . . . . . . . . . . . . . . . . . . . . . . . . . . . . . . . . . . . . . . . . .1
Dynamic Demographic Transition and Slow Economic Transformation in Egypt . . . . . . . . . . . . . . . . 2
Youth Unemployment Situations in Egypt . . . . . . . . . . . . . . . . . . . . . . . . . . . . . . . . . . . . . . . . . . . . . . . . . 6
Structurally distorted Job Preferences for Public Sector Employment . . . . . . . . . . . . . . . . . . . . . . 13
Data . . . . . . . . . . . . . . . . . . . . . . . . . . . . . . . . . . . . . . . . . . . . . . . . . . . . . . . . . . . . . . . . . . . . . . . . . . . . . . . . 16
Factors influencing students’ job preferences . . . . . . . . . . . . . . . . . . . . . . . . . . . . . . . . . . . . . . . . . . . . 24
Willingness to Pay (Or Receive Lower Wages) . . . . . . . . . . . . . . . . . . . . . . . . . . . . . . . . . . . . . . . . . . . . 26
Policy Options to Change Students’ Job Preferences . . . . . . . . . . . . . . . . . . . . . . . . . . . . . . . . . . . . . . 29
Narrowing Sector Wage Gaps . . . . . . . . . . . . . . . . . . . . . . . . . . . . . . . . . . . . . . . . . . . . . . . . . . . . . . . 29
Offering Better Social Benefits and IT Infrastructure . . . . . . . . . . . . . . . . . . . . . . . . . . . . . . . . . . 29
Conclusion . . . . . . . . . . . . . . . . . . . . . . . . . . . . . . . . . . . . . . . . . . . . . . . . . . . . . . . . . . . . . . . . . . . . . . . . . . . 31
Appendix: Methodology . . . . . . . . . . . . . . . . . . . . . . . . . . . . . . . . . . . . . . . . . . . . . . . . . . . . . . . . . . . . . . . 32
References . . . . . . . . . . . . . . . . . . . . . . . . . . . . . . . . . . . . . . . . . . . . . . . . . . . . . . . . . . . . . . . . . . . . . . . . . . 37
Endnotes . . . . . . . . . . . . . . . . . . . . . . . . . . . . . . . . . . . . . . . . . . . . . . . . . . . . . . . . . . . . . . . . . . . . . . . . . . . .40
LIST OF FIGURES
Figure 1: Population Estimates and Projections in Egypt, 1950-2050 (millions) . . . . . . . . . . . . . . . . 2
Figure 2: Population Estimates and Projections in Egypt, 1950-2050 (% of total) . . . . . . . . . . . . . . 3
Figure 3: Demographic Transition of Egypt and Indonesia, 1950-2050 . . . . . . . . . . . . . . . . . . . . . . . . 4
Figure 4: Economic Transformation in Egypt and Indonesia, 1980-2012 . . . . . . . . . . . . . . . . . . . . . . . 5
Figure 5: Youth and Adult Unemployment in Egypt, 2007 . . . . . . . . . . . . . . . . . . . . . . . . . . . . . . . . . . . 6
Figure 6: Unemployment Rates in Egypt by Educational Attainment and Gender, Age 15-29 . . . . . 8
Figure 7: Average Wage Gaps between Public and Private Sectors, 1999-2011 (Egyptian pounds per week) . . . . . . . . . . . . . . . . . . . . . . . . . . . . . . . . . . . . . . . . . . . . . . . . . . . . . . . . . . . . . 8
Figure 8 . Major Overall Reasons for Rejection of Job Applications in Egypt, 2012 . . . . . . . . . . . . . . 9
Figure 9: Estimated Cumulative Probability of Having Obtained a First Job in Egypt by Gender (%) . . . . . . . . . . . . . . . . . . . . . . . . . . . . . . . . . . . . . . . . . . . . . . . . . . . . . . . . . . . . . . . . . . . 11

LIST OF TABLES
Table 1: Most Important Factor in Hiring Egyptian Workers, 2007 (%) . . . . . . . . . . . . . . . . . . . . . . . 10
Table 2: Sample Size of the Student Survey in Egypt and Indonesia . . . . . . . . . . . . . . . . . . . . . . . . . 16
Table 3: Egypt and Indonesia: Students’ Preferences for Work Location, 2013 . . . . . . . . . . . . . . . . 21
Table 4: Egypt and Indonesia: Determinants of employment sectors (marginal effects) . . . . . . . . 23
Table 5: Egypt and Indonesia: Marginal Effect and Standard Error Estimates of a Job Choice . . . 25
Table A1: Variable definition used for Table 4 . . . . . . . . . . . . . . . . . . . . . . . . . . . . . . . . . . . . . . . . . . . . . 34
Table A2: Attribute Types and Levels Used in the Analysis for Egyptian Students . . . . . . . . . . . . . 35
Table A3: Attribute Types and Levels Used in the Analysis for Indonesian Students . . . . . . . . . . . 36
Figure 10: Youth Perceptions on Unfairness in Local Labor Market Conditions by Country and Gender (%) . . . . . . . . . . . . . . . . . . . . . . . . . . . . . . . . . . . . . . . . . . . . . . . . . . . . . . . . . . . . . . . . . . 12
Figure 11: Youth Preference of Employment Sector by Country, 2009 (% of survey respondents) . . . . . . . . . . . . . . . . . . . . . . . . . . . . . . . . . . . . . . . . . . . . . . . . . . . . . . . . . . . . . . . . 14
Figure 12: Wages and Compensation of Public Employees in Egypt, Tunisia, and Indonesia, 1990-2011 (% of total government expenses) . . . . . . . . . . . . . . . . . . . . . . . . . . . . . . . . . . . . 15
Figure 13: Important Attributes Influencing Job Choice Among Engineering Students in Egypt by Gender, 2013 (number of students) . . . . . . . . . . . . . . . . . . . . . . . . . . . . . . . . . . . . . 18
Figure 14: Important Attributes Influencing Job Choice among Engineering Students in Indonesia by Gender, 2013 (number of students) . . . . . . . . . . . . . . . . . . . . . . . . . . . . . . . . . 19
Figure 15: Egypt and Indonesia: Most Important Attributes Influencing Job Choice among Engineering Students by Type of University, 2013 (%) . . . . . . . . . . . . . . . . . . . . . . . . . . . . 20
Figure 16: Egypt and Indonesia: Students’ Preference on Employment Sector by Gender and Type of University, 2013 . . . . . . . . . . . . . . . . . . . . . . . . . . . . . . . . . . . . . . . . . . . . . . . . . . . . . . . 22
Figure 17: Egypt and Indonesia: WTP Estimates and 95% Confidence Intervals for Job Attributes including Sectors . . . . . . . . . . . . . . . . . . . . . . . . . . . . . . . . . . . . . . . . . . . . . . . . . . . 27
Figure 18: Egypt and Indonesia: WTP Estimates and 95% Confidence Intervals for Job Attributes including Work Locations . . . . . . . . . . . . . . . . . . . . . . . . . . . . . . . . . . . . . . . . . . . 28
Figure 19: Egypt: Probabilities of Taking a Job in the Public and Private Sectors by Wage Gap (with all else equal), 2013 . . . . . . . . . . . . . . . . . . . . . . . . . . . . . . . . . . . . . . . . . . . . . . . . . . . . . 30
Figure 20: Egypt: Probabilities of Taking a Job in the Private Sector if one of the Attributes of a Private Sector Job Improves (with all else equal), 2013 . . . . . . . . . . . . . . . . . . . . . . . 30

DESIGNING YOUTH EMPLOYMENT POLICIES IN EGYPT 1
DESIGNING YOUTH EMPLOYMENT POLICIES IN EGYPT
Akira Murata
INTRODUCTION
The design of youth employment policies has become
a central issue in the effort to promote urgently-
needed inclusive growth in Egypt. Developing better
economic opportunities for Egypt’s youth will help
maintain the foundation of a country currently in the
midst of a demographic transition. Namely, that de-
mographic transition is a marked “youth bulge,”1 and
thus a country facing high unemployment among its
youth and particularly among the highly educated.
This paper focuses on job preferences among the edu-
cated youth in Egypt. The educated Egyptian youth
are said to be more likely to apply for or wait for public
sector jobs. Indeed, this seems to be the same in other
Arab economies like Tunisia.2 The past government-
supported practice of expanding youth employment
in the public sector is no longer sustainable. More and
better economic opportunities for the youth popula-
tion need to be generated in the private sector by
encouraging youth entrepreneurship and the develop-
ment of micro and small enterprises (MSEs).3 Inclusive
growth could be achieved by shifting youth job pref-
erence toward a future growing and dynamic private
sector and away from the bloated public sector.
This paper uses a survey conducted in Egypt that ex-
amined factors influencing job choices and looked for
possible policy options that could improve structurally
distorted job preferences among Egyptian youth. In a
comparative analysis, the survey was also conducted
in Indonesia, which is one of the nations in Asia with
a Muslim-majority population and also faces a “youth
bulge.”

2 GLOBAL ECONOMY AND DEVELOPMENT PROGRAM
DYNAMIC DEMOGRAPHIC TRANSITION AND SLOW ECONOMIC TRANSFORMATION IN EGYPT
A large percentage of Egypt’s population is made up
of its youth; in fact, over half of the country’s popu-
lation is under 25. According to the United Nations
(UN) Population Division, the population in Egypt has
nearly quadrupled from 1950 to the present, rising
from 21.5 million inhabitants to stand currently at
over 81.1 million. It is projected to grow by more than
50 percent over the next four decades (see Figure1).
Most alarmingly, the 24 million Egyptians who are
between the ages of 15 and 29 are referred to in the
demographic security field as those of “fighting age”
(LaGraffe, 2012).
Figure 1: Population Estimates and Projections in Egypt, 1950-2050 (millions)
Source: World Population Prospects: The 2012 Revision
Egypt is currently at a stage in its demographic tran-
sition that is marked with a “youth bulge.” The UN
Population Division estimates and projections of the
age structure in Egypt show that the proportion of
people aged 15 to 24 peaked at 21 percent of the total
population in 2005, and has been expected to decline
after that (see Figure 2). The proportion of children
under 15 has already declined significantly from 40
percent in 1990 to 31.5 percent in 2010. These declines
are now reflected in the largest ever group of youths
making its way into the labor market, both in abso-
lute and relative terms (Assaad and Barsoum, 2007).
The Egypt Labor Market Panel Survey indicates that
the number of new entrants into the workforce has
more than doubled, from about 400,000 per year in
the late 1970s to about 850,000 per year in the early
2000s (Assaad 2007).
0
20
40
60
80
100
120
140
1950 1955 1960 1965 1970 1975 1980 1985 1990 1995 2000 2005 2010 2015 2020 2025 2030 2035 2040 2045 2050
0-14 15-24 25-64 65+

DESIGNING YOUTH EMPLOYMENT POLICIES IN EGYPT 3
In a country with a youth bulge, the country’s depen-
dency ratio declines as the number of working-age
people outpaces the number of economically depen-
dent people (typically the very young and elderly). The
population dynamics from 1950 to 2010 have changed
the age structure of Egypt enormously. The popula-
tion pyramids graphically illustrate the large youth
cohort of people aged 15 to 24 (see Figure 3). If the
increase in the number of working-age youth can con-
tribute to productive activities in their societies, the
youth bulge will become a demographic dividend or
bonus. However, if a large group of youth cannot find
good jobs and obtain a satisfactory income, then the
youth bulge will become a demographic time bomb as
the economically frustrated youth become a potential
source of social and political unrest (World Bank, 2011).
Asian economies have been able to turn the youth
bulge into a demographic dividend. Taking Indonesia
as an example, the demographic transition of this
country is illustrated in Figure 3. Egypt and Indonesia
show a similar demographic transition over the de-
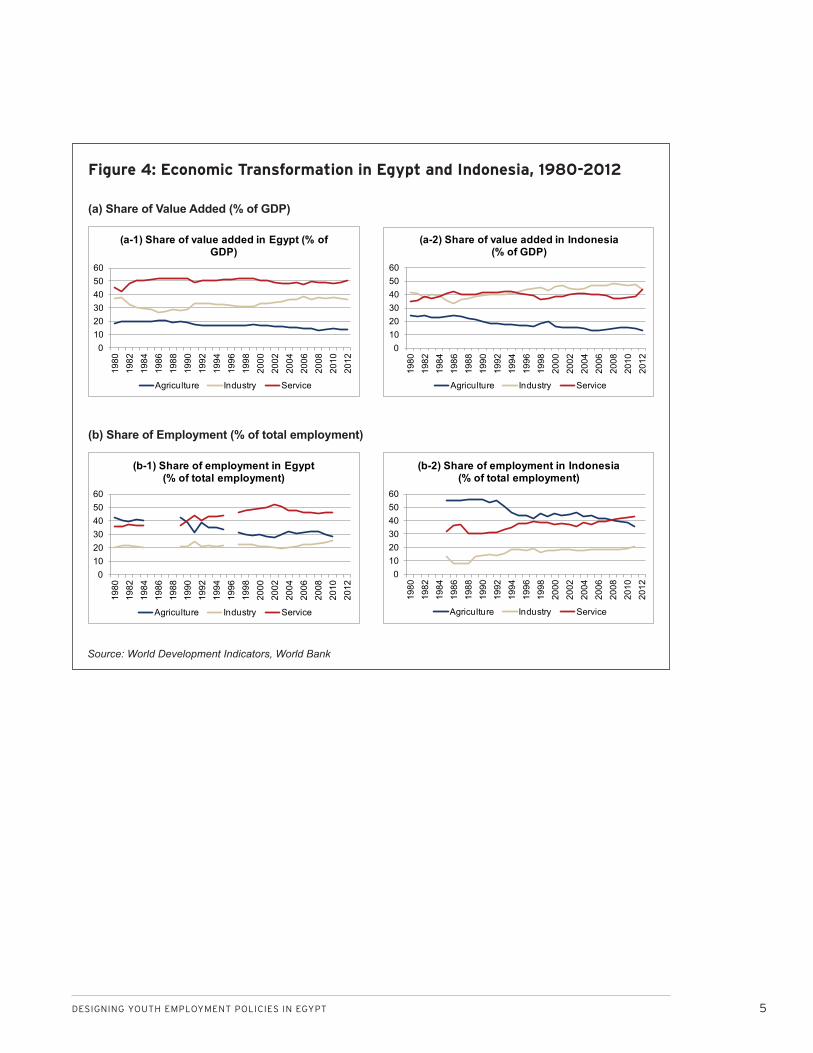
cades. In terms of the share of value added to the
economy, these countries have been moving from
economies with a high percentage of agricultural
activity toward ones with an increasingly large
share of manufacturing industries (see Figure 4 (a-1)
and Figure 4 (a-2)). When it comes to employment,
Indonesia has been moving from having a high share
of employment opportunities in agriculture toward
having an increasing share of employment opportuni-
ties in both the manufacturing and service sector. This
has occurred through a dynamic change in Indonesia’s
Figure 2: Population Estimates and Projections in Egypt, 1950-2050 (% of total)
Source: World Population Prospects: The 2012 Revision
0
10
20
30
40
50
60
70
80
90
100
1950 1955 1960 1965 1970 1975 1980 1985 1990 1995 2000 2005 2010 2015 2020 2025 2030 2035 2040 2045 2050
0-14 15-24 25-64 65+

4 GLOBAL ECONOMY AND DEVELOPMENT PROGRAM
economic structure. In terms of total manufactur-
ing output in Indonesia, the share of manufacturing
that is high-tech increased from 11.15 percent in 1970
to 31.21 percent in 2007. The portion of manufactur-
ing jobs in Indonesia also rose from 10.12 percent to
18.68 percent during the same period (see ADB, 2013).
However, this structure has largely stagnated in the
case of Egypt (see Figure 4 (b-1) and Figure 4 (b-2)).
Indeed, in Egypt, dynamic demographic transition and
a slow economic transformation have fostered unem-
ployment. The youth unemployment situations, which
can be a key measure of a country’s success in turning
the youth bulge into a demographic dividend, will be
examined in the next section.
Figure 3: Demographic Transition of Egypt and Indonesia, 1950-2050
Source: United Nations, Department of Economic and Social Affairs, Population Division (2011). World Population Prospects: The 2010 Revision
EGYPT
INDONESIA
1950, Population 21,478,000
1950, Population 74,581,000
2010, Population 81,120,000
2010, Population 239,872,000
2050, Population 123,454,000
2050, Population 293,457,000
DESIGNING YOUTH EMPLOYMENT POLICIES IN EGYPT 5
Figure 4: Economic Transformation in Egypt and Indonesia, 1980-2012
Source: World Development Indicators, World Bank
0102030405060
1980
1982
1984
1986
1988
1990
1992
1994
1996
1998
2000
2002
2004
2006
2008
2010
2012
(a-1) Share of value added in Egypt (% of GDP)
Agriculture Industry Service
0102030405060
1980
1982
1984
1986
1988
1990
1992
1994
1996
1998
2000
2002
2004
2006
2008
2010
2012
(a-2) Share of value added in Indonesia (% of GDP)
Agriculture Industry Service
0102030405060
1980
1982
1984
1986
1988
1990
1992
1994
1996
1998
2000
2002
2004
2006
2008
2010
2012
(b-1) Share of employment in Egypt (% of total employment)
Agriculture Industry Service
0102030405060
1980
1982
1984
1986
1988
1990
1992
1994
1996
1998
2000
2002
2004
2006
2008
2010
2012
(b-2) Share of employment in Indonesia (% of total employment)
Agriculture Industry Service
(b) Share of Employment (% of total employment)
(a) Share of Value Added (% of GDP)
6 GLOBAL ECONOMY AND DEVELOPMENT PROGRAM
YOUTH UNEMPLOYMENT SITUATIONS IN EGYPT
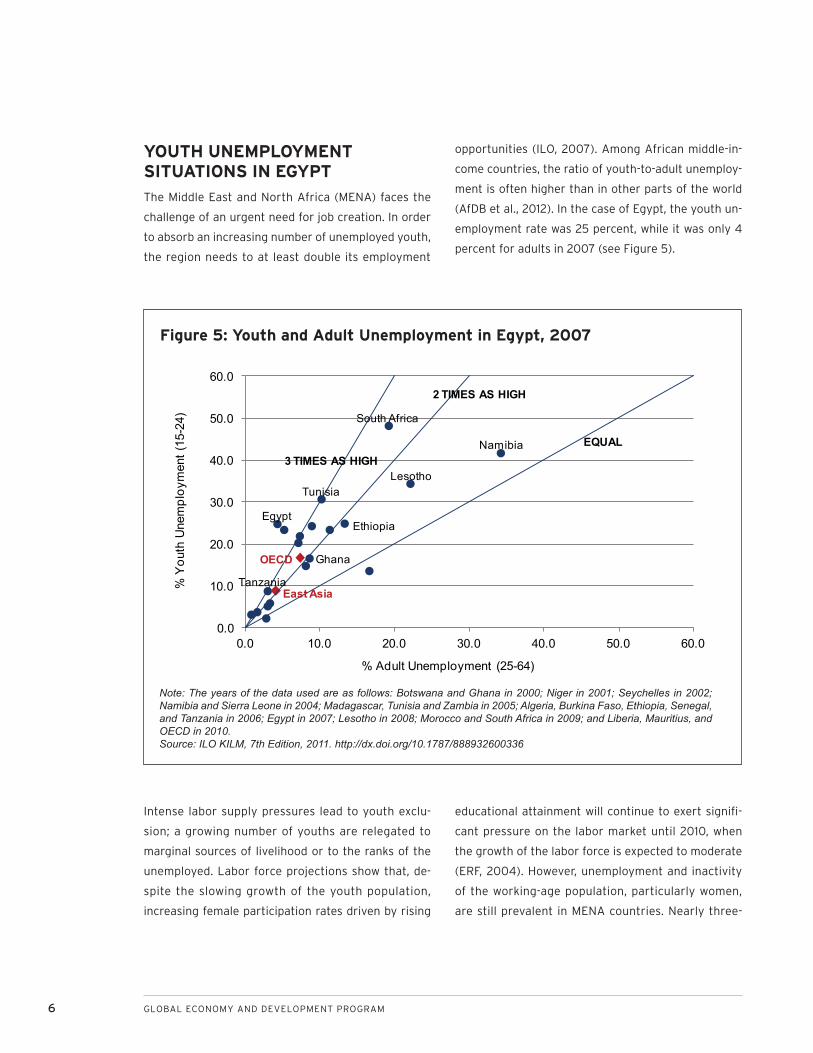
The Middle East and North Africa (MENA) faces the
challenge of an urgent need for job creation. In order
to absorb an increasing number of unemployed youth,
the region needs to at least double its employment
opportunities (ILO, 2007). Among African middle-in-
come countries, the ratio of youth-to-adult unemploy-
ment is often higher than in other parts of the world
(AfDB et al., 2012). In the case of Egypt, the youth un-
employment rate was 25 percent, while it was only 4
percent for adults in 2007 (see Figure 5).
Intense labor supply pressures lead to youth exclu-
sion; a growing number of youths are relegated to
marginal sources of livelihood or to the ranks of the
unemployed. Labor force projections show that, de-
spite the slowing growth of the youth population,
increasing female participation rates driven by rising
educational attainment will continue to exert signifi-
cant pressure on the labor market until 2010, when
the growth of the labor force is expected to moderate
(ERF, 2004). However, unemployment and inactivity
of the working-age population, particularly women,
are still prevalent in MENA countries. Nearly three-
Figure 5: Youth and Adult Unemployment in Egypt, 2007
Note: The years of the data used are as follows: Botswana and Ghana in 2000; Niger in 2001; Seychelles in 2002; Namibia and Sierra Leone in 2004; Madagascar, Tunisia and Zambia in 2005; Algeria, Burkina Faso, Ethiopia, Senegal, and Tanzania in 2006; Egypt in 2007; Lesotho in 2008; Morocco and South Africa in 2009; and Liberia, Mauritius, and OECD in 2010. Source: ILO KILM, 7th Edition, 2011. http://dx.doi.org/10.1787/888932600336
2 TIMES AS HIGH
3 TIMES AS HIGHEQUAL
0.0
10.0
20.0
30.0
40.0
50.0
60.0
0.0 10.0 20.0 30.0 40.0 50.0 60.0
% Y
outh
Une
mpl
oym
ent (
15-2
4)
% Adult Unemployment (25-64)
South Africa
Namibia
Tunisia
OECD
East Asia
Lesotho
EthiopiaEgypt
Ghana
Tanzania

DESIGNING YOUTH EMPLOYMENT POLICIES IN EGYPT 7
quarters of working-age women do not participate
in the labor force and constitute 80 to 90 percent of
MENA’s inactive population (World Bank, 2013). The
youth population continues to be the most disadvan-
taged group in terms of higher rates of unemploy-
ment, lower earnings, and limited job security and
stability, with the majority of new entrants into the
employment market finding jobs within the informal
economy (Assaad and Barsoum, 2007).
The unemployment rate is high among the youth
population, especially the highly educated in Egypt.
This is not a new problem. As early on as the British
mandate, concerns about unemployment among the
educated were central to the political debate, which
was concerned with civil unrest (Williamson, 1987). As
of 2010, the Egyptian unemployment rate was report-
edly 9.7 percent. While overall unemployment rates
were not particularly alarming, there was a concentra-
tion of unemployment among college-educated youth.
Based on the Egypt Labor Force Survey 2010, the
youth unemployment rate was estimated to be around
40 percent for those with tertiary education, which is
much higher than the rate for those with lower educa-
tional attainments (World Bank, 2013). Close to 87 per-
cent of the unemployed in Egypt are between the ages
of 15 and 29, with unemployment among Egyptian col-
lege graduates being ten times higher than those who
did not go to college (LaGraffe, 2012).
With regard to unemployment rates by educational
attainment and gender, Assaad and Barsoum (2007)
revealed that university graduates are the only edu-
cational group whose unemployment rates increased
between 1998 and 2006, regardless of their gender
(see Figure 6). Because, for many of this group, the
pay rate in the private sector was still below their
reservation wage,4 they simply stopped seeking em-
ployment and were counted among the unemployed.
Recently, wage gaps between public and private sec-
tors in Egypt have been increasing due to the greater
rise of public salaries. In 2011, the average public
wages in Egypt were 80 percent more than those in
the private sector (see Figure 7).
With regard to the unemployment rate for female
technical secondary graduates, the decline results
from increased discouragement and therefore in-
creased inactivity. Assaad (2007) argues that the
dramatic contraction in government hiring from 1998
to 2006 led to fewer applications for government jobs
from this group of young women.
Shortcomings are revealed in both the capacity of
the Egyptian economy to create sufficient demand
for young labor, and in the capacity of the Egyptian
education and training system to produce labor mar-
ket entrants that meet the requirements of employers
(ILO, 2007). Despite a growing supply of employees
with secondary and tertiary diplomas, employers still
face a shortage of staff with the skills and education
they require (Akhtar, 2010). Assaad and Roudi-Fahimi
(2007) note that the slowness of the educational
systems in the region—including Egypt—to respond
to increasingly market-oriented and open economies
has resulted in significant mismatches between the
skills demanded in the job market and those available
to new entrants. Most young people in school plan to
specialize in the commerce and business administra-
tion field (30 percent), the education field (12 percent)
and the engineering field (11 percent). This is despite
the fact that the occupational clusters associated with
these fields appear already overcrowded and with
limited opportunities for employment (ILO, 2007).
However, the demand for low-skilled work remains
high. Seventy-one percent of Egyptian job vacancies,
identified in the employer’s survey conducted by ILO,
were for manual occupations, while 22 percent of the

8 GLOBAL ECONOMY AND DEVELOPMENT PROGRAM
Figure 6: Unemployment Rates in Egypt by Educational Attainment and Gender, Age 15-29
Figure 7: Average Wage Gaps between Public and Private Sectors, 1999-2011 (Egyptian pounds per week)
Source: Assaad and Barsoum (2007)
Note: The average wage gaps between public and private sectors were computed as follows:
Public-Private Wage Gaps =
Source: Central Agency for Public Mobilization and Statistics (CAPMAS)
1001Wage PrivateWage Public
×
−
0
10
20
30
40
50
60
70
80
90
0
100
200
300
400
500
600
700
1999 2000 2001 2002 2003 2004 2005 2006 2007 2008 2009 2010 2011
Public Wage Private Wage Public-Private Wage Gaps
05
10152025303540455055606570
Illite
rate
Rea
ds &
Writ
es
Ele
men
tary
Sch
ool
Mid
dle
Sch
ool
Tech
nica
l Hig
h S
choo
l
Pos
t-Sec
ond,
Inst
itute
Gen
eral
Hig
h S
choo
l
Uni
vers
ity &
Abo
ve
Male
05
10152025303540455055606570
Illite
rate
Rea
ds &
Writ
es
Ele
men
tary
Sch
ool
Mid
dle
Sch
ool
Tech
nica
l Hig
h S
choo
l
Pos
t-Sec
ond,
Inst
itute
Gen
eral
Hig
h S
choo
l
Uni
vers
ity &
Abo
ve
Female
0510152025303540455055606570
1998 2006Educational Attainment
Perc
ent
DESIGNING YOUTH EMPLOYMENT POLICIES IN EGYPT 9
vacancies were for professional positions. The food
processing industry expects strong growth in demand
for labor in the near future, while other industries
show no specific prospect for an increase in employ-
ment (JICA, 2012). The labor demand and supply mis-
match combined with the rapidly growing number of
new entrants to the labor market leads to a protracted
transition from school to work for Egyptian youth.
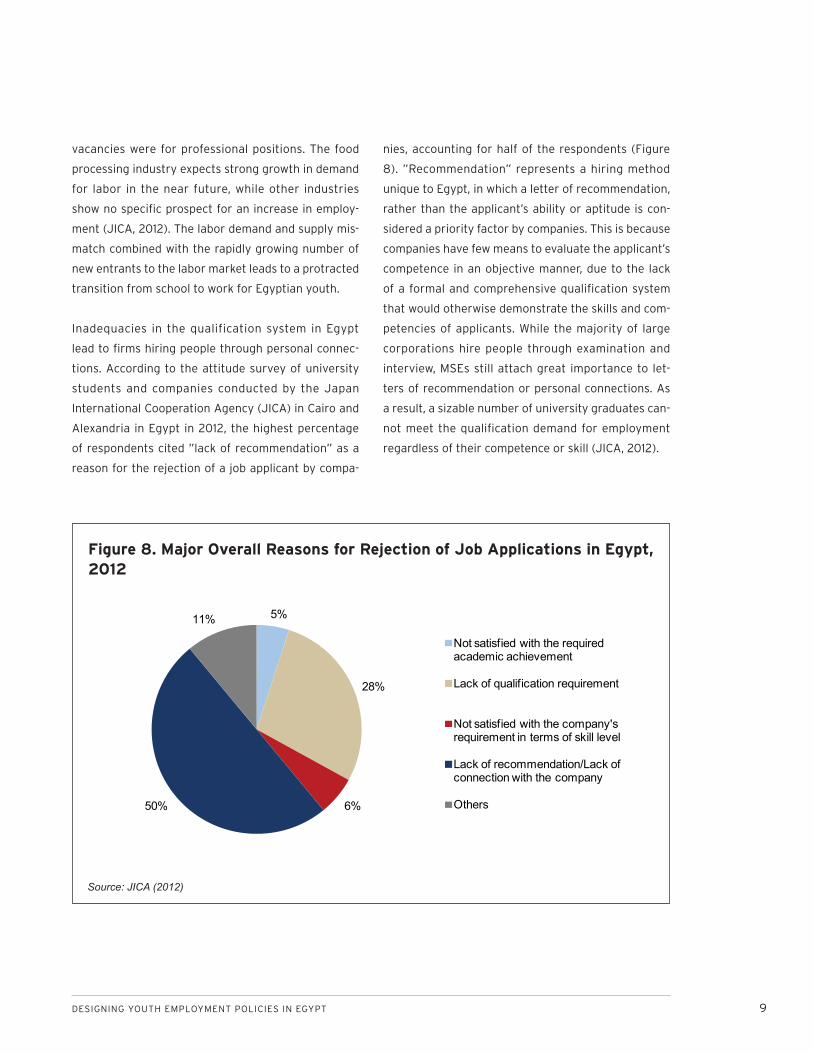
Inadequacies in the qualification system in Egypt
lead to firms hiring people through personal connec-
tions. According to the attitude survey of university
students and companies conducted by the Japan
International Cooperation Agency (JICA) in Cairo and
Alexandria in Egypt in 2012, the highest percentage
of respondents cited ”lack of recommendation” as a
reason for the rejection of a job applicant by compa-
nies, accounting for half of the respondents (Figure
8). ”Recommendation” represents a hiring method
unique to Egypt, in which a letter of recommendation,
rather than the applicant’s ability or aptitude is con-
sidered a priority factor by companies. This is because
companies have few means to evaluate the applicant’s
competence in an objective manner, due to the lack
of a formal and comprehensive qualification system
that would otherwise demonstrate the skills and com-
petencies of applicants. While the majority of large
corporations hire people through examination and
interview, MSEs still attach great importance to let-
ters of recommendation or personal connections. As
a result, a sizable number of university graduates can-
not meet the qualification demand for employment
regardless of their competence or skill (JICA, 2012).
Figure 8. Major Overall Reasons for Rejection of Job Applications in Egypt, 2012
Source: JICA (2012)
5%
28%
6%50%
11%
Not satisfied with the required academic achievement
Lack of qualification requirement
Not satisfied with the company's requirement in terms of skill level
Lack of recommendation/Lack of connection with the company
Others

10 GLOBAL ECONOMY AND DEVELOPMENT PROGRAM
Young job seekers need work experience but have
fewer opportunities to acquire it. The ability to cite
work experience is then the most important charac-
teristic in a successful application for a vacancy for
manual/production workers and for professional/
managerial employees (see Table 1). Egyptian em-
ployers face difficulties recruiting qualified workers,
as the training system often fails to produce people
with the skills that are required to perform the jobs.
Enterprises are staffed by under-qualified workers,
who often lack practical experience. But at the same
time, formal training after employment is almost en-
tirely lacking, and vocational training opportunities
for jobless and unskilled Egyptians are also limited.
According to the employer survey conducted by the
International Labor Office (ILO) in Geneva, only 14
percent of employers reported that their employees
received training during the previous year, of which
88 percent was on-the-job training. Of these employ-
ers, 50 percent reported the training was acquired
on equipment at the job site, 62 percent reported the
training was provided by an enterprise’s staff and 98
percent indicated the training fees were provided by
the enterprise.
School-to-work transition is more difficult for edu-
cated youth who pursue highly skilled occupations,
while it is easier for their lesser educated counter-
parts who engage in low-skilled work, such as that
in the agricultural sector. The ILO employer survey
confirmed that the selection process by employers
is more discerning for highly skilled jobs, which helps
to explain the more difficult transition of youth who
choose to stay in school longer. Unfortunately, the
lingering lower demand for higher-skilled workers co-
incides with a situation in which more and more young
people are staying in school and aspiring to go on to
higher education. A recent ILO study in Egypt that
examined school-to-work transition found that young
Egyptian people, particularly women, face serious dif-
ficulties and challenges in finding a career job after
leaving school. The study shows that only 17 percent
of respondents (those between the ages of 15 and 29)
had completed the transition from school to a career
job, which is defined as a regular job that the worker
has no immediate plans to change. One-quarter were
still in transition—that is, either unemployed or not
yet in a career job—and the rest had not begun their
transition because they were still in school or not
planning to seek work (ILO, 2007).
Table 1: Most Important Factor in Hiring Egyptian Workers, 2007 (%)
Factors Professional Positions Mannual PositionsSex 23.5 68.1
Age 26.0 74.0
Education 52.5 19.1
Marital status 5.4 7.8
Previous training 5.4 23.5
Experience 74.0 85.8
Other 13.7 27.9
Number of observations 347 347
Source: International Labor Organization (2007)

DESIGNING YOUTH EMPLOYMENT POLICIES IN EGYPT 11
There are significant gender differences in school-
to-work transition. A 2007 ILO survey shows that 30
percent of male respondents had completed their
transition to a career job and 35 percent were still in
transition. In the case of females, only 4 percent had
completed their transition, 18 percent were still in
transition and the majority—78 percent—were still in-
active. Moreover, according to the Central Agency for
Public Mobilization and Statistics (CAPMAS) in Egypt,
while female school enrollment through secondary
school exceeds 40 percent, a study on school-to-work
transition shows that only 4 percent of females make
the transition from school to career jobs as opposed
to 30 percent of males in the same age group (ILO,
2007). An analysis of the 2006 Egypt Labor Market
Panel Survey (ELMPS) also highlights the gendered
nature of school-to-work transition. Figure 9 shows
the estimated cumulative probability of an individual
having obtained a first job, by year, if leaving school
in the years 1998 and 2006. Put simply, Figure 9 illus-
trates the duration between the end of schooling and
the time individuals obtain their first job in number
of years. For example, in 2006, 50 percent of male
graduates had found their first job within two years
of leaving school, down from three years in 1998. 75
percent found jobs within five years of leaving school
in 2006, whereas in 1998 it would have taken nearly
eight years for that number to find jobs. The female
rates of transition from school to work are much lower
and do not exceed 25 percent even after 15 years.
There is no perceptible improvement for women in the
transition time from 1998 to 2006 (See Amer, 2006;
Assaad, 2006). As for a current local labor market
perception, most of the Egyptian youth, regardless
of gender, expressed a greater feeling of unfairness
in the conditions of the labor market for fresh gradu-
Figure 9: Estimated Cumulative Probability of Having Obtained a First Job in Egypt by Gender (%)
Source: Amer, 2006
1.00
0.75
0.50
0.25
0.00
0
Years
2 4 6 8 10 12
Males 1988 Males 2006 Females 1988 Females 2006
12 GLOBAL ECONOMY AND DEVELOPMENT PROGRAM
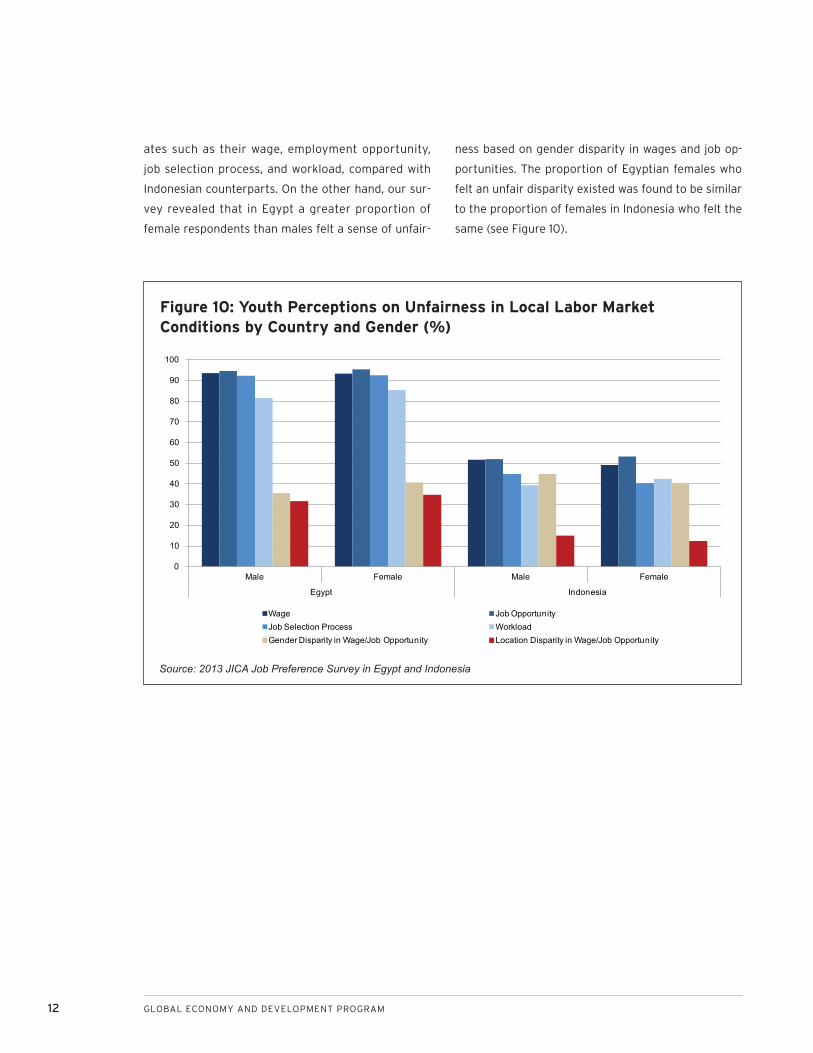
ates such as their wage, employment opportunity,
job selection process, and workload, compared with
Indonesian counterparts. On the other hand, our sur-
vey revealed that in Egypt a greater proportion of
female respondents than males felt a sense of unfair-
ness based on gender disparity in wages and job op-
portunities. The proportion of Egyptian females who
felt an unfair disparity existed was found to be similar
to the proportion of females in Indonesia who felt the
same (see Figure 10).
Figure 10: Youth Perceptions on Unfairness in Local Labor Market Conditions by Country and Gender (%)
Source: 2013 JICA Job Preference Survey in Egypt and Indonesia
0
10
20
30
40
50
60
70
80
90
100
Male Female Male Female
Egypt Indonesia
Wage Job OpportunityJob Selection Process WorkloadGender Disparity in Wage/Job Opportunity Location Disparity in Wage/Job Opportunity

DESIGNING YOUTH EMPLOYMENT POLICIES IN EGYPT 13
STRUCTURALLY DISTORTED JOB PREFERENCES FOR PUBLIC SECTOR EMPLOYMENT
Despite being increasingly better educated, young
Egyptian graduates had structurally distorted job
preferences for public sector employment and waited
in anticipation of such jobs rather than joining the
private sector (Amin et al., 2012: 5-6). Assaad (2006)
argues that the long-standing Egyptian government
policy of guaranteeing government employment to
upper secondary and university graduates had given
households distorted signals about the labor market
(Assaad and Barsoum, 2007). Because Egypt did not
formally abolish the guarantee scheme, which had
guaranteed government jobs for university graduates
since the 1950s, young graduates, especially women,
continued to aspire to public sector employment (ILO,
2007).
In North Africa in general, many young people want
a government job. The Silatech Index5 shows that
among seven North African countries, Egypt and
Tunisia have the largest proportions of youth who
prefer government employment to private sector jobs
or self-employment (see Figure 11). Indeed, as of 2009
in Egypt, 53 percent of young people would like a gov-
ernment job, because of their strong assumption that
they will earn equal pay and benefits regardless of the
sector. Employment with private business seemed to
be less attractive to young people. This mismatch be-
tween young people’s expectations and the reality of
the job market has undoubtedly led to much frustra-
tion. This also causes higher youth unemployment as
young people hold out for the expected public sector
job instead of searching for other work in the private
sector.
The growth of public sector employment is already
very limited in North African countries. Instead of al-
lowing a continuing focus on the public sector, efforts
must be made to help young people develop realistic
expectations and to create a strong private sector
that is capable of offering attractive jobs (AfDB et al.,
2012). With regard to public employment, there are a
limited number of jobs. However, the private sector
will eventually generate more job opportunities for
educated youth who still lack skills and experience.
Focusing on job creation at MSEs and poverty al-
leviation, the Egyptian Social Fund for Development
(SFD)—established in 1991 by Presidential decree
No.189—has developed into a leading institution mo-
bilizing national and international resources to invest
in social development (JICA, 2011). Further generation
of employment opportunities in the private sector will
commence when economies become more competi-
tive and start to attract greater foreign direct invest-
ment.
However, just creating more private sector employ-
ment opportunities cannot be a sustainable response
to this employment gap, unless job preference among
youth is gradually shifted away from the bloated pub-
lic sector and toward private sector employment.
In addition, there is an urgent need for improvement
in the high-cost structure of public employment. The
percentage shares of wages and compensation6 of
public employees in Egypt and Tunisia have been
much higher than those in Indonesia. The share in
Indonesia used to be at a similar level as that in Egypt
more than two decades ago (Figure 12).

14 GLOBAL ECONOMY AND DEVELOPMENT PROGRAM
Figure 11: Youth Preference of Employment Sector by Country, 2009 (% of survey respondents)
Source: Silatech (2009), based on Gallup World Poll data. http://dx.doi.org/10.1787/888932600925
26%
32%
36%
44%
45%
46%
53%
20%
15%
32%
17%
33%
15%
10%
41%
46%
20%
23%
16%
35%
18%
4%
3%
6%
4%
5%
2%
1%
0% 20% 40% 60% 80% 100%
Morocco Youth
Algeria Youth
Sudan Youth
Mauritania Youth
Djibouti Youth
Tunisia Youth
Egypt Youth
Government Private business Self-employment Nonprofit organization

DESIGNING YOUTH EMPLOYMENT POLICIES IN EGYPT 15
Figure 12: Wages and Compensation of Public Employees in Egypt, Tunisia, and Indonesia, 1990-2011 (% of total government expenses)
Note: Compensation of employees consists of all payments in cash, as well as in kind (such as food and housing), to employees in return for services rendered, and government contributions to social insurance schemes such as social security and pensions that provide benefits to employees.Source: World Development Indicators, World Bank
0
5
10
15
20
25
30
35
40
45
1990
1991
1992
1993
1994
1995
1996
1997
1998
1999
2000
2001
2002
2003
2004
2005
2006
2007
2008
2009
2010
2011
%
Year
Indonesia Egypt, Arab Rep. Tunisia

16 GLOBAL ECONOMY AND DEVELOPMENT PROGRAM
DATA
In order to examine factors that influence job choice
and look for possible policy options that can improve
structurally distorted job preferences among youth
in Egypt, the survey responses associated with this
paper were collected from engineering students at
10 universities in six cities of Egypt7 during the period
of July through October 2013. The total number of
student respondents is 1,259, consisting of 891 males
and 368 females, who were randomly selected from
the lists of the student ID numbers. The surveyed uni-
versities in Egypt are of different types—five public
universities, as well as five private universities includ-
ing two private higher technological institutes and one
international university—because we assume that the
quality of education and curriculum differs among the
institution types and this could in turn influence the
students’ job choices. Similarly, in the Indonesian sur-
vey, respondents were randomly chosen among engi-
neering students at eight universities, both public and
private, in five cities. There were 1,216 total survey
respondents, consisting of 711 males and 505 females.
The actual numbers of student respondents from
each type of university in both Egypt and Indonesia
are summarized in Table 2.
The 2013 JICA Job Preference survey is composed
of the student questionnaire and the university ques-
tionnaire. The student questionnaire asks the respon-
dent about a wide variety of questions such as job
preference, student characteristics, family character-
istics, lifestyle, motivation for work, and perceptions
of the local labor market, politics and risk attitude.
The university questionnaire covers information re-
quired on the number of students and academic staff,
and on university curricula or courses as well as the
services they provide for their students.
Almost all respondents show a willingness to work
after graduation regardless of their gender, except for
those who pursue further education and those who
are to about to get married. However, it was revealed
that most students in both countries are ignorant or
have an unduly pessimistic view in terms of the total
unemployment rate. The unemployment rates for the
total labor force and for young people were perceived
by the survey respondents to be much higher than the
actual rates.
Table 2: Sample Size of the Student Survey in Egypt and Indonesia
Egypt Indonesia
Types of University/Institute Both Sexes Male Female Both
Sexes Male Female
Public University 625 411 214 607 314 293
Private University 634 480 154 609 397 212
(including Higher Technological Institute) (259) (199) (60) (N.A.) (N.A.) (N.A.)
(including International University) (120) (90) (30) (N.A.) (N.A.) (N.A.)
Total 1,259 891 368 1,216 711 505
Source: 2013 JICA Job Preference Survey in Egypt and Indonesia

DESIGNING YOUTH EMPLOYMENT POLICIES IN EGYPT 17
In terms of job preference, Figures 13 and 14 show
the first, second, and third most important attributes
influencing job choice among engineering students
in Egypt and in Indonesia, respectively. It is obvious
that “wage” is one of the most important attributes.
Besides “wage,” “education opportunities/possibility
of upgrading qualifications or skills” as well as “work
location” were found to be regarded as subsequently
important factors. Interestingly, only Egyptian female
respondents put equal importance on these three job
attributes (i.e., wage, education opportunities, and
work location).
Regardless of types of universities in both countries,
“wage” was found to be as important as job attributes.
Despite their similarity, the differing importance of
some attributes was revealed to depend on students’
school types (i.e., public versus private). Students in
private schools tend to place more importance on
wage compared to those in public schools, regardless
of their country. When it comes to a country compari-
son, a larger share of Indonesian students answered
“wage” as being the most important in contrast to
their Egyptian counterparts, which shows the greater
importance Egyptians place on other attributes such
as access to further education, promotion possibili-
ties, and professional environment. Moreover, con-
trary to other students, those in the Indonesian public
university placed greater priority on “recognition
from supervisor or boss” and “infrastructure,” mea-
sured by internet or mobile phone connections and
electricity supply, whereas relatively less priority was
placed on “education opportunities/possibility of up-
grading qualifications” (see Figure 15).
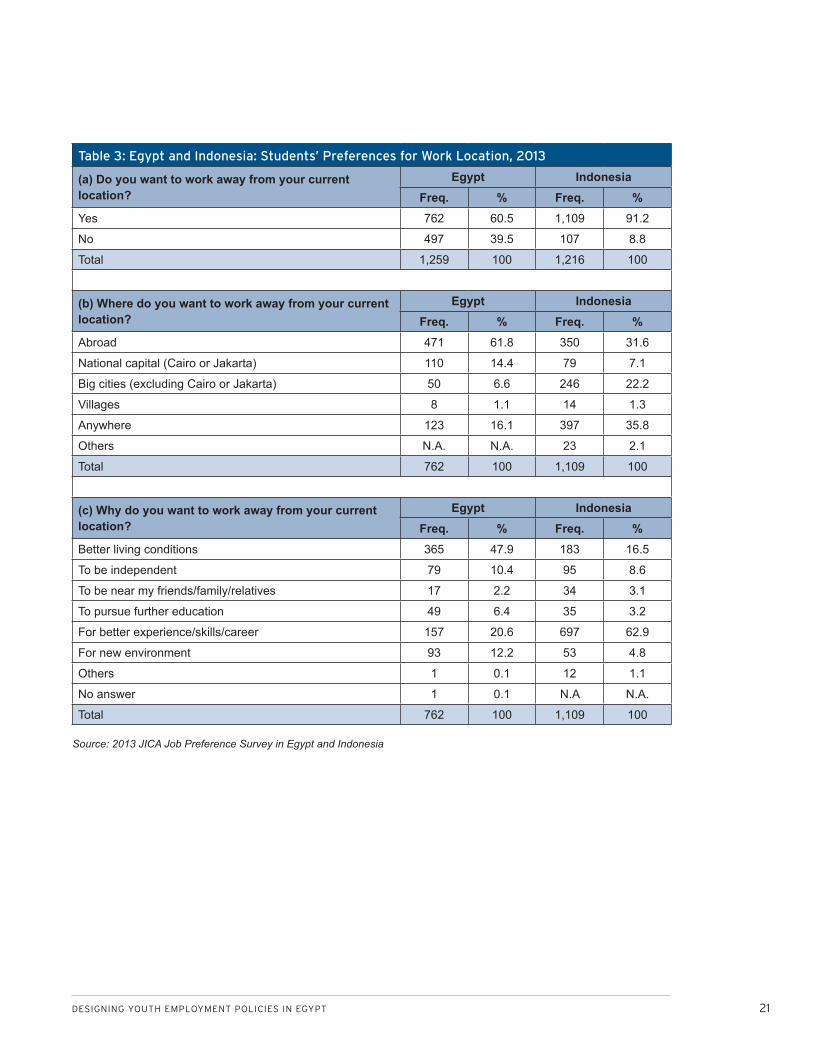
With regard to work locations, more than 60 percent
of Egyptian students preferred to work away from
their current location and this showed strong over-
seas employment aspiration, mainly due to the better
living conditions abroad, particularly higher salaries.
On the other hand, when it comes to their Indonesian
counterparts, 90 percent of these had a willingness
to move from their current location in order to pur-
sue better experience, skills, and career, but their
ideal destinations are diverse and eclectic, ranging
from domestic cities to foreign countries and even
“anywhere” (see Table 3). This can be explained by
Indonesian students feeling ill at ease working over-
seas, particularly due to language barriers as common
destinations for Indonesian emigrants are Japan, the
United States, Singapore, Germany and the United
Kingdom. Contrary to their Indonesian counterparts,
Egyptian students show a preference for working in
the Arabic-speaking countries of the Middle East such
as Saudi Arabia, the United Arab Emirates and Kuwait.
The survey found that university students in both
countries do not really consider employment sector
as the most important factor when they decide upon
a job. As mentioned above, for job options, they put
the highest priority on “wage.” However, in reality,
students have a general preference on the sectors
they most favor for future employment that can be
derived from the combination of other job attributes
like wage levels, availability of social benefits, and
job security. Contrary to our expectations, the survey
found that Egyptian engineering students currently
have a strong preference for working in the private
sector as compared to their Indonesian counterparts
(see Figure 16). This preference is stronger among
male students. On the other hand, female respon-
dents still show an interest in public sector jobs. Public
university students tend to prefer working in the
public sector, while those at private universities opt
for self-employment, household enterprise, or entre-
preneurship. However, each university has a different
curriculum and set of courses, and therefore caution
must be applied when we discuss features of students’
job preferences based on types of university. In addi-
tion, the location also could influence the preference.

18 GLOBAL ECONOMY AND DEVELOPMENT PROGRAM
Figure 13: Important Attributes Influencing Job Choice Among Engineering Students in Egypt by Gender, 2013 (number of students)
Source: 2013 JICA Student Survey
0
50
100
150
200
250
300
350
400
450
Wage Work location Housing benefit
Workload Sector Education Urbanity Infrastructure Health insurance
(a) Both Sexes in Egypt
1st 2nd 3rd
0
50
100
150
200
250
300
350
400
Wage Work location Housing benefit
Workload Sector Education Urbanity Infrastructure Health insurance
(b) Male in Egypt
1st 2nd 3rd
0
20
40
60
80
100
120
Wage Work location Housing benefit
Workload Sector Education Urbanity Infrastructure Health insurance
(c) Female in Egypt
1st 2nd 3rd

DESIGNING YOUTH EMPLOYMENT POLICIES IN EGYPT 19
Figure 14: Important Attributes Influencing Job Choice among Engineering Students in Indonesia by Gender, 2013 (number of students)
Source: 2013 JICA Student Survey
0
100
200
300
400
500
600
Wage Work location Housing benefit
Workload Sector Education Urbanity Infrastructure Health insurance
(a) Both Sexes in Indonesia
1st 2nd 3rd
0
50
100
150
200
250
300
350
Wage Work location Housing benefit
Workload Sector Education Urbanity Infrastructure Health insurance
(b) Male in Indonesia
1st 2nd 3rd
0
50
100
150
200
250
Wage Work location Housing benefit
Workload Sector Education Urbanity Infrastructure Health insurance
(c) Female in Indonesia
1st 2nd 3rd

20 GLOBAL ECONOMY AND DEVELOPMENT PROGRAM
Fig
ure
15
: E
gy
pt
an
d I
ndon
esia
: M
ost
Import
ant
Att
ribu
tes
Infl
uen
cin
g J
ob C
hoic
e am
on
g
En
gin
eeri
ng S
tuden
ts b
y T
ype
of U
niv
ersi
ty, 2
013
(%
)
Sou
rce:
201
3 JI
CA
Stu
dent
Sur
vey
05101520253035404550
Wage
Work location
Housing benefit
Access to further education
Promotion
Extra income
Proximity
Professional environment
Workload
Sector
Recognition
Education
Reputation
Urbanity
Infrastructure
Health insurance
(%)
Pub
lic U
nive
rsity
in E
gypt
Priv
ate
Uni
vers
ity in
Egy
ptP
ublic
Uni
vers
ity in
Indo
nesi
aP
rivat
e U
nive
rsity
in In
done
sia
DESIGNING YOUTH EMPLOYMENT POLICIES IN EGYPT 21
Table 3: Egypt and Indonesia: Students’ Preferences for Work Location, 2013
(a) Do you want to work away from your current location?
Egypt IndonesiaFreq. % Freq. %
Yes 762 60.5 1,109 91.2
No 497 39.5 107 8.8
Total 1,259 100 1,216 100
(b) Where do you want to work away from your current location?
Egypt IndonesiaFreq. % Freq. %
Abroad 471 61.8 350 31.6
National capital (Cairo or Jakarta) 110 14.4 79 7.1
Big cities (excluding Cairo or Jakarta) 50 6.6 246 22.2
Villages 8 1.1 14 1.3
Anywhere 123 16.1 397 35.8
Others N.A. N.A. 23 2.1
Total 762 100 1,109 100
(c) Why do you want to work away from your current location?
Egypt IndonesiaFreq. % Freq. %
Better living conditions 365 47.9 183 16.5
To be independent 79 10.4 95 8.6
To be near my friends/family/relatives 17 2.2 34 3.1
To pursue further education 49 6.4 35 3.2
For better experience/skills/career 157 20.6 697 62.9
For new environment 93 12.2 53 4.8
Others 1 0.1 12 1.1
No answer 1 0.1 N.A N.A.
Total 762 100 1,109 100
Source: 2013 JICA Job Preference Survey in Egypt and Indonesia

22 GLOBAL ECONOMY AND DEVELOPMENT PROGRAM
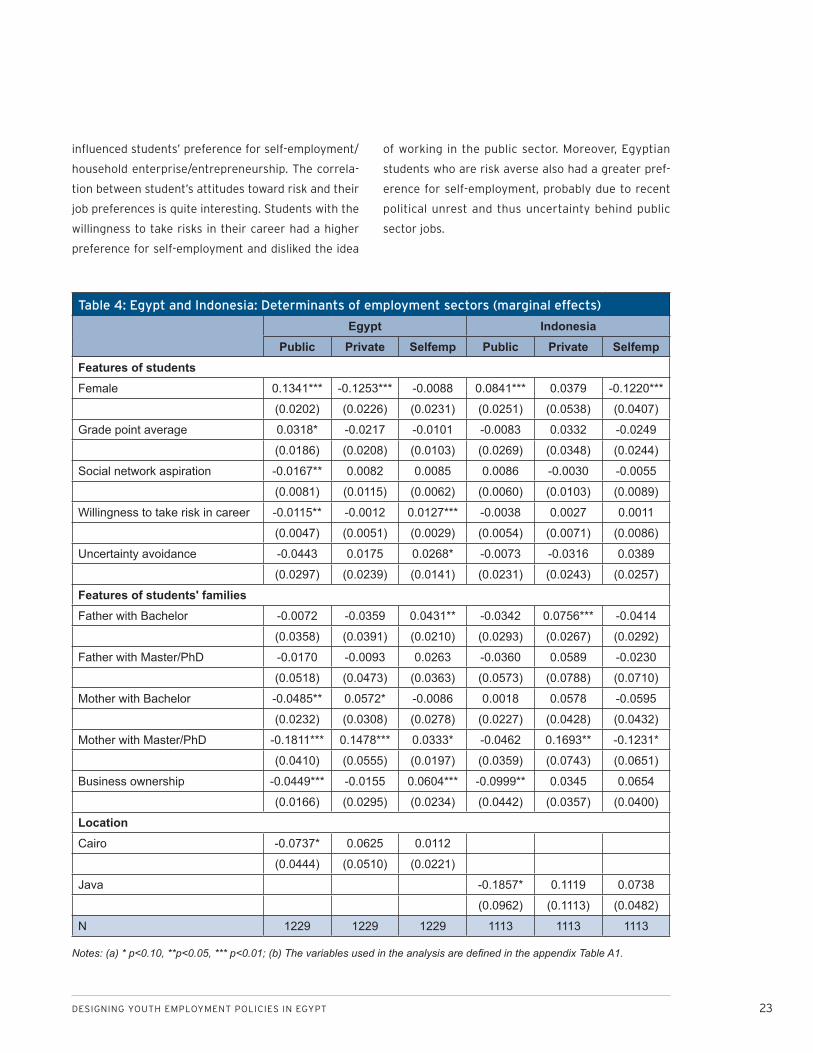
In order to examine the determinants of a student’s
choice of employment sector, this paper uses a mul-
tinomial logit regression that takes into consideration
features of students (i.e., gender, grade point average,
social network aspiration, willingness to take career
risks and intolerance of uncertainty and ambiguity),
features of their families (i.e., parents’ educational
attainment and business ownership) and location
(i.e., living within Greater Cairo or not for the survey
in Egypt, and living within Java or not for the survey
in Indonesia). Table 4 shows the marginal effect esti-
mation results. The findings of this regression model
revealed that female respondents in both countries
prefer getting a job in the public sector, while Egyptian
men prefer the private sector and Indonesian men
are more likely to seek self-employment, household
enterprise, or entrepreneurship. Location near the
main labor market (Greater Cairo in Egypt, or Java
in Indonesia) was found to decrease the probability
of students preferring a job in the public sector. This
can be explained by the fact that there is greater vari-
ety among employment opportunities in these areas.
With regard to parents’ educational attainment, it was
found that if a student’s mother completed a mas-
ter’s or doctoral degree, that student is significantly
more likely to prefer a job in the private sector in both
Egypt and Indonesia. Business ownership by any fam-
ily members or relatives significantly and positively
Figure 16: Egypt and Indonesia: Students’ Preference on Employment Sector by Gender and Type of University, 2013
Source: 2013 JICA Job Preference Survey in Egypt and Indonesia
0%
10%
20%
30%
40%
50%
60%
70%
80%
90%
100%
Total Male Female Public university
Private university
Total Male Female Public university
Private university
By gender By types of university By gender By types of university
Egypt Indonesia
Public agencies Private enterprises Self-employed/HH Enterprise/ Entrepreneur NGOs Others
Egypt Indonesia
DESIGNING YOUTH EMPLOYMENT POLICIES IN EGYPT 23
influenced students’ preference for self-employment/
household enterprise/entrepreneurship. The correla-
tion between student’s attitudes toward risk and their
job preferences is quite interesting. Students with the
willingness to take risks in their career had a higher
preference for self-employment and disliked the idea
of working in the public sector. Moreover, Egyptian
students who are risk averse also had a greater pref-
erence for self-employment, probably due to recent
political unrest and thus uncertainty behind public
sector jobs.
Table 4: Egypt and Indonesia: Determinants of employment sectors (marginal effects)
Egypt IndonesiaPublic Private Selfemp Public Private Selfemp
Features of studentsFemale 0.1341*** -0.1253*** -0.0088 0.0841*** 0.0379 -0.1220***
(0.0202) (0.0226) (0.0231) (0.0251) (0.0538) (0.0407)
Grade point average 0.0318* -0.0217 -0.0101 -0.0083 0.0332 -0.0249
(0.0186) (0.0208) (0.0103) (0.0269) (0.0348) (0.0244)
Social network aspiration -0.0167** 0.0082 0.0085 0.0086 -0.0030 -0.0055
(0.0081) (0.0115) (0.0062) (0.0060) (0.0103) (0.0089)
Willingness to take risk in career -0.0115** -0.0012 0.0127*** -0.0038 0.0027 0.0011
(0.0047) (0.0051) (0.0029) (0.0054) (0.0071) (0.0086)
Uncertainty avoidance -0.0443 0.0175 0.0268* -0.0073 -0.0316 0.0389
(0.0297) (0.0239) (0.0141) (0.0231) (0.0243) (0.0257)
Features of students' familiesFather with Bachelor -0.0072 -0.0359 0.0431** -0.0342 0.0756*** -0.0414
(0.0358) (0.0391) (0.0210) (0.0293) (0.0267) (0.0292)
Father with Master/PhD -0.0170 -0.0093 0.0263 -0.0360 0.0589 -0.0230
(0.0518) (0.0473) (0.0363) (0.0573) (0.0788) (0.0710)
Mother with Bachelor -0.0485** 0.0572* -0.0086 0.0018 0.0578 -0.0595
(0.0232) (0.0308) (0.0278) (0.0227) (0.0428) (0.0432)
Mother with Master/PhD -0.1811*** 0.1478*** 0.0333* -0.0462 0.1693** -0.1231*
(0.0410) (0.0555) (0.0197) (0.0359) (0.0743) (0.0651)
Business ownership -0.0449*** -0.0155 0.0604*** -0.0999** 0.0345 0.0654
(0.0166) (0.0295) (0.0234) (0.0442) (0.0357) (0.0400)
LocationCairo -0.0737* 0.0625 0.0112
(0.0444) (0.0510) (0.0221)
Java -0.1857* 0.1119 0.0738
(0.0962) (0.1113) (0.0482)
N 1229 1229 1229 1113 1113 1113
Notes: (a) * p<0.10, **p<0.05, *** p<0.01; (b) The variables used in the analysis are defined in the appendix Table A1.

24 GLOBAL ECONOMY AND DEVELOPMENT PROGRAM
FACTORS INFLUENCING STUDENTS’ JOB PREFERENCES
Table 5 shows the estimation results of regression
models, explaining the extent to which each factor in-
fluences the occupational choice among engineering
students in Egypt and Indonesia. The findings of these
models show that most job attributes considered are
significant, and therefore have an impact on the prob-
ability of choosing an alternative.
As expected, “wage” was found to significantly influ-
ence students’ job choices. The effect of the wage
level is more pronounced for Egyptian respondents
than their Indonesian counterparts. Among those in
Egypt, females identify wages as a greater priority
than males, but in Indonesia there were no clear gen-
der differences in the impact of wage on job prefer-
ences. Offering “education opportunities/possibility
of upgrading qualifications” probably attracts job
seekers but its impact gets smaller if they take into
account overseas employment as an option. On the
other hand, having the opportunities of “good IT in-
frastructure” and “support for health care benefits”
becomes more important for Egyptian respondents
given that overseas employment is considered as oc-
cupation choices. Obviously, “housing support” from
employers is preferred for overseas employment op-
portunities, but for youth seeking jobs domestically
it seems preferable to stay with parents, siblings and
relatives, and therefore, they show no interest in this
support. With all other things being equal, “house-
hold enterprise or self-employment” was preferred
to “wage employment at public and private sectors”
among students in both countries. In general, men
were found to have the greater motivation to work in
this sector. This preference might be explained as one
of the features of engineering students, as they tend
be ambitious at an early stage in their career and ex-
pect to become an entrepreneur in the near future. In
terms of job preferences between public and private
sectors, “wage employment at private enterprise”
was significantly preferred to employment in the pub-
lic sector among Egyptian men, while other students
showed a modest preference for working in the public
sector (though our findings show no significant differ-
ence). Uniquely to Egyptian men, the estimation result
revealed that workload does not matter when choos-
ing a job. This means that young males in Egypt are
desperately anxious and desire any job, and therefore
opting for a light workload does not seem to be an at-
tractive option.

DESIGNING YOUTH EMPLOYMENT POLICIES IN EGYPT 25
Tab
le 5
: Eg
yp
t an
d I
nd
on
esia
: Mar
gin
al E
ffe
ct a
nd
Sta
nd
ard
Err
or
Est
imat
es o
f a
Jo
b C
ho
ice
De
pe
nd
en
t V
aria
ble
= C
ho
ice
(w
het
he
r se
lect
a jo
b c
ho
ice
or
no
t)
Egyp
tIn
done
sia
Tota
lM
ale
Fem
ale
Tota
lM
ale
Fem
ale
Job
attr
ibut
es(1
)(2
)(3
)(4
)(5
)(6
)(7
)(8
)(9
)(1
0)(1
1)(1
2)M
onth
ly w
age
leve
lW
age
0.09
28**
*0.
1111
***
0.08
99**
*0.
0962
***
0.09
85**
*0.
1311
***
0.06
86**
*0.
0633
***
0.06
82**
*0.
0631
***
0.06
80**
*0.
0632
***
(0.0
020)
(0.0
026)
(0.0
024)
(0.0
032)
(0.0
039)
(0.0
066)
(0
.001
5)(0
.001
7)(0
.002
0)(0
.002
1)(0
.002
3)(0
.002
8)
Non
-wag
e at
trib
utes
Edu
c0.
0648
***
0.02
68**
*0.
0625
***
0.02
01**
*0.
0693
***
0.04
86**
*0.
0612
***
0.02
52**
*0.
0609
***
0.02
40**
*0.
0602
***
0.02
65**
*
(0.0
033)
(0.0
029)
(0.0
038)
(0.0
027)
(0.0
067)
(0.0
084)
(0
.002
9)(0
.001
8)(0
.003
9)(0
.002
5)(0
.004
2)(0
.002
7)
Wor
kloa
d0.
0044
*0.
0072
***
0.00
110.
0018
0.01
44**
*0.
0301
***
0.01
85**
*0.
0253
***
0.01
70**
*0.
0248
***
0.02
02**
*0.
0257
***
(0.0
025)
(0.0
028)
(0.0
027)
(0.0
026)
(0.0
054)
(0.0
080)
(0
.002
4)(0
.002
0)(0
.003
4)(0
.002
6)(0
.003
4)(0
.002
9)
Hou
se-0
.015
1***
0.04
44**
*-0
.012
8***
0.03
84**
*-0
.021
3***
0.05
22**
*-0
.028
2***
0.02
64**
*-0
.028
5***
0.02
67**
*-0
.027
5***
0.02
58**
*
(0.0
026)
(0.0
033)
(0.0
028)
(0.0
033)
(0.0
057)
(0.0
084)
(0
.002
7)(0
.001
9)(0
.003
8)(0
.002
6)(0
.003
8)(0
.002
9)
Infra
0.05
49**
*0.
0745
***
0.04
80**
*0.
0620
***
0.07
42**
*0.
0997
***
0.07
67**
*0.
0767
***
0.07
76**
*0.
0723
***
0.07
43**
*0.
0817
***
(0.0
029)
(0.0
037)
(0.0
031)
(0.0
038)
(0.0
066)
(0.0
083)
(0
.003
1)(0
.003
4)(0
.004
2)(0
.004
2)(0
.004
7)(0
.005
8)
Hea
lth0.
0545
***
0.06
10**
*0.
0507
***
0.05
23**
*0.
0643
***
0.07
39**
*0.
0753
***
0.06
54**
*0.
0754
***
0.06
72**
*0.
0737
***
0.06
28**
*
(0.0
029)
(0.0
033)
(0.0
032)
(0.0
034)
(0.0
061)
(0.0
079)
(0
.003
1)(0
.002
8)(0
.004
1)(0
.003
7)(0
.004
7)(0
.004
3)
Sect
or (B
ase
cate
gory
: Pub
lic)
Priv
ate
0.00
89**
0.01
39**
*-0
.007
1
-0.0
047
-0.0
063
-0.0
022
(0.0
040)
(0.0
044)
(0.0
088)
(0
.003
9)(0
.005
5)(0
.005
3)
Sel
fem
p0.
0261
***
0.02
77**
*0.
0202
*
0.04
24**
*0.
0486
***
0.03
44**
*
(0.0
048)
(0.0
053)
(0.0
103)
(0
.004
7)(0
.006
6)(0
.006
3)
Loca
tion
(Bas
e ca
tego
ry: I
ncai
ro/In
java
)O
utca
iro-0
.038
7***
-0.0
301*
**-0
.060
0***
(0.0
039)
(0.0
037)
(0.0
105)
Ove
rsea
s-0
.067
0***
-0.0
521*
**-0
.105
3***
-0.0
522*
**-0
.054
3***
-0.0
495*
**
(0.0
052)
(0.0
050)
(0.0
132)
(0
.004
7)(0
.006
4)(0
.006
9)
Out
java
-0.0
354*
**-0
.032
0***
-0.0
398*
**
(0.0
034)
(0.0
045)
(0.0
053)
Con
st-0
.026
4***
-0.0
258*
**-0
.020
2***
0.00
06-0
.044
4***
-0.1
349*
**-0
.028
3***
0.01
36**
*-0
.019
3***
0.02
32**
*-0
.038
8***
0.00
14
(0.0
046)
(0.0
047)
(0.0
050)
(0.0
039)
(0.0
103)
(0.0
154)
(0
.004
4)(0
.003
3)(0
.005
9)(0
.004
5)(0
.006
3)(0
.004
9)
N30
,216
30
,216
21
,384
21
,384
8,
832
8,83
2 28
,944
28
,944
17
,016
17
,016
11
,928
11
,928
Not
es: (
a) *
p<0
.10,
**p
<0.0
5, *
** p
<0.0
1; (b
) The
var
iabl
es u
sed
in th
e an
alys
is a
re d
efine
d in
the
appe
ndix
Tab
les
A2
and
A3.

26 GLOBAL ECONOMY AND DEVELOPMENT PROGRAM
WILLINGNESS TO PAY (OR RECEIVE LOWER WAGES)
Figures 17 and 18 show the extent to which young re-
spondents are willing to pay (WTP) or receive lower
wages in exchange for receiving a better attribute
of a job, based on the estimation results shown in
Table 5. Figure 17 considers a set of job choices with
the combinations of job attributes including sectors
of employment, whereas Figure 18 instead takes into
account work locations. Our findings revealed that
with educational support during a contract, a good IT
infrastructure, and support for medical insurance, the
respondents in both countries are willing to give up
a part of their wage for a job. The WTP estimates for
these job attributes (measured in U.S. dollars) were
found to be less important among Egyptian students
than Indonesian counterparts, which results partly
from the differences in the monthly wage levels be-
tween Egypt and Indonesia. If a work location was
extended overseas, offering support for a decent
dwelling also becomes an attractive option for them,
while they then gave lower priority to educational
support (though it is still positive and significant).
In this study, comparing men with women showed that
there was a gender difference in the importance of job
attributes, as measured by the WTP estimates. The
findings from Figure 17 reveal that compared to their
male counterparts, Egyptian female students attach
a higher value to a light workload, good IT infrastruc-
ture, and support for health insurance, but they put
less value on private sector employment. In terms of
gender differences between Indonesian students, it
was found that male respondents give greater weight
to household enterprise or self-employment than
female respondents. There is no gender difference
in the WTP estimates for other job attributes used
in the analysis between Indonesian male and female
respondents. Moreover, Figure 18 also showed that in
addition to light workload and good IT infrastructure,
educational support was valued more among Egyptian
female students. On the other hand, Egyptian female
students are less likely to value overseas employment.
In terms of the WTP estimates, Figure 18 also revealed
that Indonesian male and female respondents had
the similar results. But Indonesian females placed
greater value on good IT infrastructure once overseas
employment was taken into account as one of the job
attributes.

DESIGNING YOUTH EMPLOYMENT POLICIES IN EGYPT 27
Figure 17: Egypt and Indonesia: WTP Estimates and 95% Confidence Intervals for Job Attributes including Sectors
Notes: (a) The average exchange rates in the second quarter of 2013 were 6.938 Egyptian Pounds per U.S. dollar and 10664 Indonesia Rupiah per U.S. dollar (see IMF, 2013); (b) The variables used in the analysis are defined in the ap-pendix Tables A2 and A3.
(a) Engineering students in Egypt (in U.S. dollars)
(b) Engineering students in Indonesia (in U.S. dollars)
-200
-150
-100
-50
0
50
100
150
educ
wor
k
hous
e
infra
heal
th
priv
ate
selfe
mp
educ
wor
k
hous
e
infra
heal
th
priv
ate
selfe
mp
educ
wor
k
hous
e
infra
heal
th
priv
ate
selfe
mp
Total Male Female
-400
-300
-200
-100
0
100
200
300
400
500
educ
wor
k
hous
e
infra
heal
th
priv
ate
selfe
mp
educ
wor
k
hous
e
infra
heal
th
priv
ate
selfe
mp
educ
wor
k
hous
e
infra
heal
th
priv
ate
selfe
mp
Total Male Female

28 GLOBAL ECONOMY AND DEVELOPMENT PROGRAM
Figure 18: Egypt and Indonesia: WTP Estimates and 95% Confidence Intervals for Job Attributes including Work Locations
Notes: (a) The average exchange rates in the second quarter of 2013 were 6.938 Egyptian Pounds per U.S. dollar and 10664 Indonesia Rupiah per U.S. dollar (see IMF, 2013); (b) The variables used in the analysis are defined in the ap-pendix Tables A2 and A3.
(a) Engineering students in Egypt (in U.S. dollars)
(b) Engineering students in Indonesia (in U.S. dollars)
-200
-150
-100
-50
0
50
100
150
educ
wor
k
hous
e
infra
heal
th
outc
airo
over
seas
educ
wor
k
hous
e
infra
heal
th
outc
airo
over
seas
educ
wor
k
hous
e
infra
heal
th
outc
airo
over
seas
Total Male Female
-400
-300
-200
-100
0
100
200
300
400
500
educ
wor
k
hous
e
infra
heal
th
outja
va
over
seas
educ
wor
k
hous
e
infra
heal
th
outja
va
over
seas
educ
wor
k
hous
e
infra
heal
th
outja
va
over
seas
Total Male Female

DESIGNING YOUTH EMPLOYMENT POLICIES IN EGYPT 29
POLICY OPTIONS TO CHANGE STUDENTS’ JOB PREFERENCES
In order to improve the potentially biased labor sup-
ply situation in Egypt—which has resulted mainly
from the prolonged, structurally distorted job prefer-
ences between public and private sectors (particularly
among youth)—the impact of possible policy options
will be examined under two hypothetical scenarios:
narrowing sector wage gaps and offering better condi-
tions of job attributes.
Narrowing Sector Wage Gaps
Figure 19 shows the varying probabilities of taking a
job in the public and private sectors in Egypt under
the different scenarios of sector wage differences. If
the public sector monthly wage is 90 percent higher
(i.e., 1900 Egyptian pounds or the equivalent of $274)
than in the private sector (i.e., 1000 Egyptian pounds
or the equivalent of $144), the probability of taking
the public sector job is around 0.67 (or 67 percent)
among both males and females, which is more than
double the probability of taking a private sector job.
However, if the wage gap falls to only 300 Egyptian
pounds (or the equivalent of $43), the gaps in the
probabilities of taking the jobs between public and
private sectors narrow to 0.064 (or 6.4 percentage
points) for males and 0.15 (or 15 percentage points) for
females, meaning that its policy impact can be greater
among males. The findings of this study also denote
that a 30 percent increase in private sector wages
raises the probability of Egyptian males taking such
a job by 0.14 (or 14 percentage points) and raises the
probability of Egyptian females taking such a job by
0.12 (or 12 percentage points). Thus, in the context of
the future development of the private sector in Egypt,
narrowing the wage gaps between public and private
sectors really matters. These findings may help us to
understand the reason policymakers need to observe
local wage settings.
Offering Better Social Benefits and IT Infrastructure
An improvement in non-wage job attributes can also
make private sector jobs more attractive than those
in the public sector. As an example, here we imag-
ine that an Egyptian student has the opportunity of
taking a public sector job with a monthly wage of
1600 Egyptian pounds (the equivalent of $231). The
probability of taking such a job is 0.54 (or 54 per-
cent) among males and 0.50 (or 50 percent) among
females in our survey in Egypt. With the wage level
of 1000 Egyptian pounds and all other things being
equal, their probability of taking a job in the private
sector was, on average, 0.334 (or 33.4 percent) for
males and 0.285 (or 28.5 percent) for females. Even
if a private enterprise offers a light workload, the
probability of it being chosen over a public sector job
increased by 0.06 (or 6 percentage points) among
females, but little for males. Still, the students prefer
public sector employment. However, offering better
social benefits and IT infrastructure significantly con-
tributes to an increase in job uptake rates. Our find-
ings revealed that these offers could raise the uptake
rate of a private sector job the most among males
with educational support by 0.326 (or 32.6 percent-
age points), and its rate among females with good
IT infrastructure by 0.30 (or 30 percentage points).
Health insurance support also significantly increases
its uptake by around 0.26 (or 26 percentage points),
regardless of gender (see Figure 20).

30 GLOBAL ECONOMY AND DEVELOPMENT PROGRAM
Figure 19: Egypt: Probabilities of Taking a Job in the Public and Private Sectors by Wage Gap (with all else equal), 2013
Figure 20: Egypt: Probabilities of Taking a Job in the Private Sector if one of the Attributes of a Private Sector Job Improves (with all else equal), 2013
Note: The abbreviation L.E. stands for livre égyptienne (French for Egyptian pound).
Note: The abbreviation L.E. stands for livre égyptienne (French for Egyptian pound).
0
0.1
0.2
0.3
0.4
0.5
0.6
0.7
0.8
0.9
1
Public (L.E.1900) Private (L.E.1000)
Public (L.E.1600) Private (L.E.1300)
Public (L.E.1300) Private (L.E.1600)
Public (L.E.1000) Private (L.E.1900)
Male Wage in Public Sector Male Wage in Private SectorFemale Wage in Public Sector Female Wage in Private Sector
0
0.1
0.2
0.3
0.4
0.5
0.6
0.7
0.8
0.9
1
Baseline With light workload With good IT infrastructure
With medical insurance With support for education
Male Wage in Private Sector (with L.E. 1000) Female Wage in Private Sector (with L.E. 1000)
0.543 if Male Wage in Public Sector is L.E. 1600
0.50 if Female Wage in Public Sector is L.E. 1600

DESIGNING YOUTH EMPLOYMENT POLICIES IN EGYPT 31
CONCLUSION
This paper attempted to examine the factors that
influence job choice among youth in Egypt. It sought
effective policy options to support the development
of more attractive private sector employment oppor-
tunities in Egypt: this, as stated in the introduction,
is in the context of high youth unemployment rates,
particularly among the highly educated, driven by a
demographic youth bulge. The most obvious findings
to emerge from this study are that: the public-private
sector wage differentials must be narrowed; better
benefits must accompany private sector employ-
ment (particularly support for continuing education,
upgrading qualifications, and health insurance); and
good IT infrastructure matters. Taken together, these
steps could significantly contribute to an increase
in the rates of a private sector employment among
young Egyptian job seekers, even in the case of con-
tinued high public sector wages. However, these find-
ings are still limited among engineering students.
Further investigation and experimentation into youth
in general is strongly recommended.

32 GLOBAL ECONOMY AND DEVELOPMENT PROGRAM
APPENDIX: METHODOLOGY
In order to elicit job preferences among youth, a
discrete choice experiment (DCE) was used for this
research. It allowed researchers to uncover how
youth value selected attributes of employment by
asking them to state their choice over different hy-
pothetical alternatives. Although DCEs have been
most frequently applied in health-economics research
in high-income countries, there are several recent
research projects using DCEs to elicit the employ-
ment preferences of highly-skilled workers, especially
health workers in several developing countries (see
Hanson and Jack, 2007 for Ethiopia; Kolstad, 2011 and
Hole and Kolstad, 2011 for Tanzania; Kruk et al., 2010
for Ghana; Rockers et al., 2012 for Uganda; Pagaiya et
al., 2011 for Thailand; Rao, 2012 for India; and Blaauw
et al., 2010 for Kenya, South Africa, and Thailand).
DCE has its theoretical foundation in random utility
theory and relies on the assumptions of economic ra-
tionality and utility maximization (Hall et al. 2004). In
stating a job preference, each job seeker is assumed
to choose the alternative that yields his or her high-
est individual benefit, known as utility. Moreover, the
utility yielded by an alternative is assumed to depend
on the utilities associated with its composing attri-
butes and attribute levels (Lancaster, 1966). In sum,
the utility of an individual is assumed to be a function
of its attributes and the basis of the logit model is the
concept of this utility maximization (Mangham et al.,
2009). If decision maker n faces a choice among J
alternative jobs, the personal utility of a job alterna-
tive, , can be expressed as follows:
where wageα and xβ are, respectively, the coef-
ficients for the wage and sets of other attributes of
the employment x such as employment sector, lo-
cation, workload, wage, non-monetary benefits, and
education and education opportunities/possibilities of
upgrading qualifications. The estimated coefficients
can only give information about the direction and sig-
nificance of the effect of changing the levels of one
attribute with other things being equal.
Within the context of employment issues, inclusion
of a wage factor allows us to estimate the monetary
value of attributes of a job—that is, how much wage
a respondent would be willing to give up to have an
improvement in other aspects of the job. This can be
estimated as the ratio of the value of the coefficient
of interest to the negative of the cost attribute, that is,
wage in this analysis.
In order to derive some policy options affecting the
shift of job preference among youth in Egypt, the
estimation results were used to calculate willingness
to pay (WTP) and policy impact measures. The WTP
measures were calculated on the basis of the regres-
sion results. In this context, the WTP to get a higher
level of a particular job attribute was measured as
the willingness to sacrifice wages in order to achieve
a higher level of the attribute. As the wage variable is
continuous, the WTP for attribute x is given by the
following equation:
where xβ is the coefficient of attribute x from the
regression. This WTP measure was calculated for all
wage levels.
wage
x
wageUxUxWTP
αβ
−=∂∂∂∂
−=)(
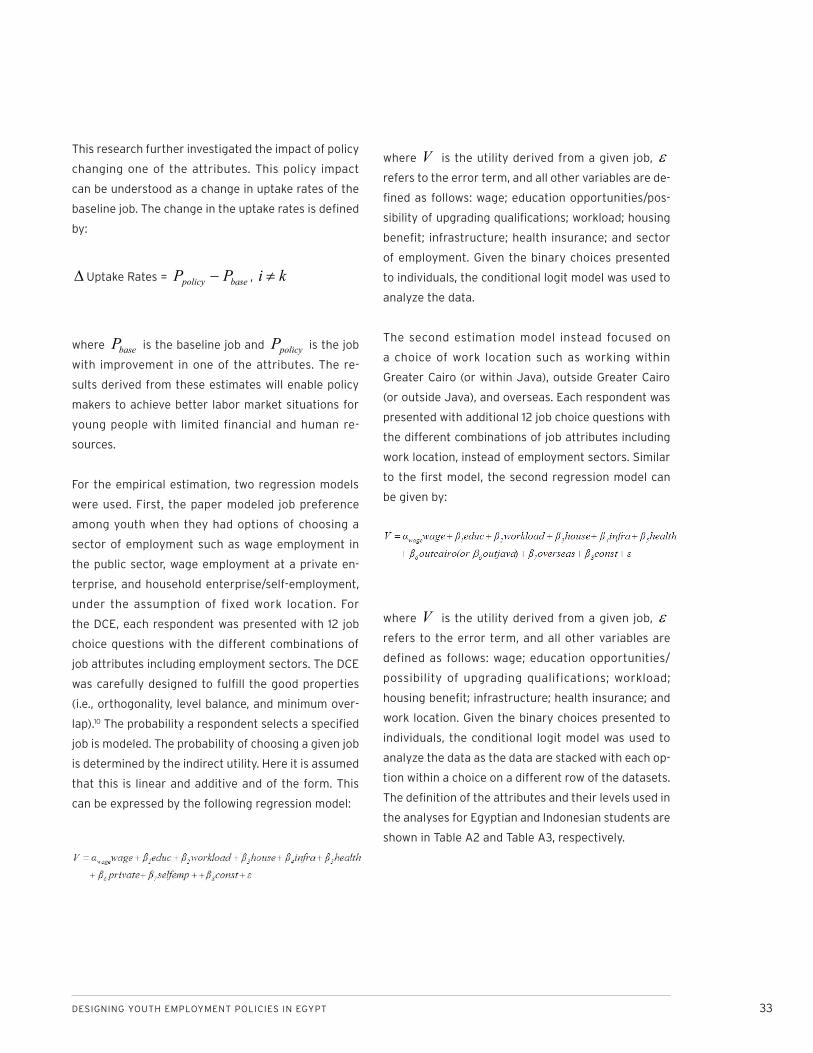
DESIGNING YOUTH EMPLOYMENT POLICIES IN EGYPT 33
This research further investigated the impact of policy
changing one of the attributes. This policy impact
can be understood as a change in uptake rates of the
baseline job. The change in the uptake rates is defined
by:
∆ Uptake Rates = basepolicy PP − , ki ≠
where baseP is the baseline job and policyP is the job
with improvement in one of the attributes. The re-
sults derived from these estimates will enable policy
makers to achieve better labor market situations for
young people with limited financial and human re-
sources.
For the empirical estimation, two regression models
were used. First, the paper modeled job preference
among youth when they had options of choosing a
sector of employment such as wage employment in
the public sector, wage employment at a private en-
terprise, and household enterprise/self-employment,
under the assumption of fixed work location. For
the DCE, each respondent was presented with 12 job
choice questions with the different combinations of
job attributes including employment sectors. The DCE
was carefully designed to fulfill the good properties
(i.e., orthogonality, level balance, and minimum over-
lap).10 The probability a respondent selects a specified
job is modeled. The probability of choosing a given job
is determined by the indirect utility. Here it is assumed
that this is linear and additive and of the form. This
can be expressed by the following regression model:
where V is the utility derived from a given job, ε
refers to the error term, and all other variables are de-
fined as follows: wage; education opportunities/pos-
sibility of upgrading qualifications; workload; housing
benefit; infrastructure; health insurance; and sector
of employment. Given the binary choices presented
to individuals, the conditional logit model was used to
analyze the data.
The second estimation model instead focused on
a choice of work location such as working within
Greater Cairo (or within Java), outside Greater Cairo
(or outside Java), and overseas. Each respondent was
presented with additional 12 job choice questions with
the different combinations of job attributes including
work location, instead of employment sectors. Similar
to the first model, the second regression model can
be given by:
where V is the utility derived from a given job, ε
refers to the error term, and all other variables are
defined as follows: wage; education opportunities/
possibility of upgrading qualifications; workload;
housing benefit; infrastructure; health insurance; and
work location. Given the binary choices presented to
individuals, the conditional logit model was used to
analyze the data as the data are stacked with each op-
tion within a choice on a different row of the datasets.
The definition of the attributes and their levels used in
the analyses for Egyptian and Indonesian students are
shown in Table A2 and Table A3, respectively.

34 GLOBAL ECONOMY AND DEVELOPMENT PROGRAM
Table A1: Variable definition used for Table 4
DescriptionEmployment sectors
Public=1 if a student wants to work the most at public agencies (e.g. government/state-owned company);=0 otherwise.
Private =1 if a student wants to work the most at private enterprises;=0 otherwise.
Selfemp=1 if a student wants to work the most for self-employed/household enterprise/entrepreneurship;=0 otherwise.
Features of studentsFemale =1 if a student is female;=0 if male.
Grade point averageA categorical variable of grade point average (GPA), ranging from 1 to 5 (=1 if GPA is less than 1.0, =2 if between 1.0 and 1.9, =3 if between 2.0 and 2.9, =4 if between 3.0 and 3.4, and =5 if between 3.5 and 4.0).
Social network aspiration
Numbers of friends in the main SNS account (e.g. Facebook and twitter etc.) as a proxy variable of social network aspiration, ranging from 1 to 8 (=1 if the number of friends is less than 10 people, =2 if between 10 and 50, =3 if between 51 and 100, =4 if between 101 and 200, =5 if between 201 and 500, =6 if between 501 and 1000, =7 if between 1001 and 2000, and =8 if more than 2000).
Willingness to take risk in careerStudents' attitude to risk in career, ranging from 0 (if not at all willing to take risks) to 10 (if very willing to take risks).
Uncertainty avoidance=1 if a student does not generally prefer uncertainty;=0 if he/she prefers an option under uncertainty.
Features of students' familiesFather with Bachelor =1 if a student's father completed the Bachelor degree;=0 otherwise.
Father with Master/PhD =1 if a student's father completed the Master/PhD degree;=0 otherwise.
Mother with Bachelor =1 if a student's mother completed the Bachelor degree;=0 otherwise.
Mother with Master/PhD =1 if a student's mother completed the Master/PhD degree;=0 otherwise.
Business ownership =1 if a student's parents/relatives own business;=0 otherwise.
Location
Cairo=1 if the surveyed universities are located within Greater Cairo;=0 otherwise.
Java =1 if the surveyed universities are located within Java;=0 otherwise.

DESIGNING YOUTH EMPLOYMENT POLICIES IN EGYPT 35
Table A2: Attribute Types and Levels Used in the Analysis for Egyptian Students
(1) Attribute types and levels for first regression model (including sector of employment)
Variable labels educ workload house infra health wage sector
Attribute types
Education opportunities/
posssibility of upgrading qualifications
Workload requirements
Housing benefit
IT infrastructure
Medical insurance
Monthly wage level
Sector of employment
Level 1 (=0)
No support for any education opportunities is
provided.
Barely enough time to complete
duties. Three hours of extra work per day.
No housing benefit is provided.
Unreliable Internet/Mobile
connection, electricity
No medical insurance support is provided.
L.E. 1000
Wage employment at public sector
agency
Level 2 (=1)
Support for education
opportunities/possibility of upgrading
qualifications is offered during
contract.
Nearly enough time to complete duties. One hour of extra work per day.
Support for decent dwelling
is provided.
Good Internet/Mobile
connection, electricity
Support for medical insurance covering
employees and their
dependents is provided.
L.E. 1300
Wage employment
at private enterprise
Level 3 (=2) L.E. 1600Household
enterprise/Self employment
Level 4 (=3) L.E. 1900
(2) Attribute types and levels for second regression model (including work location)
Variable labels educ workload house infra health wage location
Attribute types
Education opportunities/
posssibility of upgrading qualifications
Workload requirements
Housing benefit
IT infrastructure
Medical insurance
Monthly wage level
Work location
Level 1 (=0)
No support for any education opportunities is
provided.
Barely enough time to complete
duties. Three hours of extra work per day.
No housing benefit is provided.
Unreliable Internet/Mobile
connection, electricity
No medical insurance support is provided.
L.E. 1000Within Greater Cairo in Egypt
Level 2 (=1)
Support for education
opportunities/possibility of upgrading
qualifications is offered during
contract.
Nearly enough time to complete duties. One hour of extra work per day.
Support for decent dwelling
is provided.
Good Internet/Mobile
connection, electricity
Support for medical insurance covering
employees and their
dependents is provided.
L.E. 1300Outside
Greater Cairo in Egypt
Level 3 (=2) L.E. 1600 Overseas
Level 4 (=3) L.E. 1900

36 GLOBAL ECONOMY AND DEVELOPMENT PROGRAM
Table A3: Attribute Types and Levels Used in the Analysis for Indonesian Students
(1) Attribute Types and Levels for First Regression Model (including sector of employment)
Variable labels educ workload house infra health wage sector
Attribute types
Education opportunities/
posssibility of upgrading qualifications
Workload requirements
Housing benefit
IT infrastructure
Medical insurance
Monthly wage level
Sector of employment
Level 1 (=0)
No support for any education opportunities is
provided.
Barely enough time to complete
duties. Three hours of extra work per day.
No housing benefit is provided.
Unreliable Internet/Mobile
connection, electricity
No medical insurance support is provided.
Rp. 3,500,000
Wage employment at public sector
agency
Level 2 (=1)
Support for education
opportunities/possibility of upgrading
qualifications is offered during
contract.
Nearly enough time to complete duties. One hour of extra work per day.
Support for decent dwelling
is provided.
Good Internet/Mobile
connection, electricity
Support for medical insurance covering
employees and their
dependents is provided.
Rp. 5,000,000
Wage employment
at private enterprise
Level 3 (=2) Rp. 6,500,000Household
enterprise/Self employment
Level 4 (=3) Rp. 8,000,000
(2) Attribute Types and Levels for Second Regression Model (including work location)
Variable labels educ workload house infra health wage location
Attribute types
Education opportunities/
posssibility of upgrading qualifications
Workload requirements
Housing benefit
IT infrastructure
Medical insurance
Monthly wage level
Work location
Level 1 (=0)
No support for any education opportunities is
provided.
Barely enough time to complete
duties. Three hours of extra work per day.
No housing benefit is provided.
Unreliable Internet/Mobile
connection, electricity
No medical insurance support is provided.
Rp. 3,500,000Within Jave in
Indonesia
Level 2 (=1)
Support for education
opportunities/possibility of upgrading
qualifications is offered during
contract.
Nearly enough time to complete duties. One hour of extra work per day.
Support for decent dwelling
is provided.
Good Internet/Mobile
connection, electricity
Support for medical insurance covering
employees and their
dependents is provided.
Rp. 5,000,000Outside Java in
Indonesia
Level 3 (=2) Rp. 6,500,000 Overseas
Level 4 (=3) Rp. 8,000,000

DESIGNING YOUTH EMPLOYMENT POLICIES IN EGYPT 37
REFERENCES
Asian Development Bank (2013). “Key Indicators for
Asia and the Pacific 2013,” Mandaluyong City,
Philippines:.
AfDB, OECD, UNDP, and UNECA (2012). “Promoting
Youth Employment,” in African Economic Outlook
2012: Promoting Youth Employment, OECD
Publishing. Available at: http://dx.doi.org/10.1787/
aeo-2012-en
Akhtar, S. (2010). “Quality of Education: The Gateway
to Employability,” MENA Knowledge and Learning
Quick Notes Series, March, No. 22.
Amer, M. (2006). “The Egyptian Youth Labor
Market School-to-Work Transition 1998-2006,”
Presented at Egypt Labor Market Panel Survey
2006: ERF Dissemination Conference, October
30, Cairo, Egypt.
Amin, M., Assaad, R., al-Baharna, N., Dervis, K., Desai,
R.M., Dhillon, N.S., Galal, A., Ghanem, H., Graham,
C., and Kaufmann, D. (2012). After the Spring:
Economic Transitions in the Arab World, Oxford
University Press, New York.
Assaad, R. (2006). “Employment and Unemployment
Dynamics,” Presented at Egypt Labor Market
Pane l Survey 2006: ERF D isseminat ion
Conference, October 30, Cairo, Egypt.
Assaad, R. (2007). “Unemployment and Youth
Insertion in the Labor Market in Egypt,”
Presented at the ECES Conference. November 21-
22, 2006, Cairo, Egypt.
Assaad, R. and Barsoum, G. (2007). “Youth Exclusion
in Egypt: In Search of Second Chances,” The
Middle East Youth Initiative Working Paper No. 2,
September, Wolfensohn Center for Development
& Dubai School of Government.
Assaad, R. and Roudi-Fahimi, F. (2007). “Youth in
the Middle East and North Africa: Demographic
Opportunity or Challenge?” Population Reference
Bureau, Washington, DC.
B l a a u w , D . , D r a s m u s , E . , P a g a i y a , N . ,
Tangcharoensathein V., Mullei K., Mudhune S.,
Goodman C., English M., and Lagarde M. (2010).
“Policy Interventions that Attract Nurses to
Rural Areas: A Multicountry Discrete Choice
Experiment,” Bulletin of the World Health
Organization.
Boughzala, M. (2013). “Youth Employment and
Economic Transition in Tunisia,” Global Economy
& Development Working Paper No. 57, , The
Brookings Institution.
Christofides, N.J., Muirhead, D., Jewkes, R.K., Penn-
Kekana, L., Conco, D.N. (2006). “Women’s
Experiences of and Preferences for Services
After Rape in South Africa: Interview Study,”
British Medical Journal, Vol. 332, pp. 209–13.
DeShazo, J.R., Fermo, G. (2002). “Designing Choice
Sets for Stated Preference Methods: The Effects
of Complexity on Choice Consistency,” Journal of
Environmental Economics and Management, Vol.
44, pp. 123–43.
Economic Research Forum for Arab Countries, Iran
and Turkey (2004). “Egypt Country Profile: The
Road Ahead for Egypt,” Print Right Adv.: Cairo
Fuller, G.E. (2003). “The Youth Factor: The New
Demographics of the Middle East and the
Implications for U.S. Policy,” The Brookings
Project on U.S. Policy Towards the Islamic World
38 GLOBAL ECONOMY AND DEVELOPMENT PROGRAM
Analysis Paper No. 3, June, The Saban Center for
Middle East Policy, The Brookings Institution.
Ghanem, H. (2013). “The Role of Micro and Small
Enterprises in Egypt’s Economic Transition,”
Global Economy & Development Working Paper
No. 55, January, The Brookings Institution.
Hall J., Viney R., Haas M., Louviere JJ. (2004). “Using
Stated Preference Discrete Choice Modelling
to Evaluate Health Care Programs,” Journal of
Business Research, Vol. 57, pp. 1026–32.
Hensher, D.A., Rose, J.M., Greene, W.H. (2005). Applied
Choice Analysis: A Primer, Cambridge University
Press: Cambridge.
Hanson, K. and Jack, W.G. (2007). “Health Worker
Preferences for Job Attributes in Ethiopia:
Results From a Discrete Choice Experiment,”
iHEA 2007 6th World Congress: Explorations
in Health Economics Paper. Available at SSRN:
http://ssrn.com/abstract5994212
Hole, A.R. and Kolstad, J.R. (2011). “Mixed Logit
Estimation of Willingness to Pay Distributions:
A Comparison of Models in Preference and WTP
Space Using Data From a Health-Related Choice
Experiment,” Empirical Economics, Vol.42, Issue
2, pp.445-469.
International Labor Organization (2007). “School-
to-Work Transition: Evidence From Egypt
Employment Pol icy Papers,” El Zanaty &
Associates. Geneva.
International Monetary Fund (2013). International
Financial Statistics (Edition: December 2013).
Japan International Cooperation Agency (2011).
“Survey on Assisting the Development of
Egyptian Financial Markets for Micro, Small
and Medium Enterprises: General Survey on
Bottlenecks for MSME’s Access to Finance.”
Tokyo.
Japan International Cooperation Agency (2012).
“Data Collection Survey on Human Resource
Development in the Industry Sector in the Middle
East Region.” Tokyo.
Kolstad, J.R. (2011). “How to Make Rural Jobs More
Attractive to Health Workers. Findings From a
Discrete Choice Experiment in Tanzania,” Health
Economics, Vol. 20, pp. 196-211.
Kruk, M.E., Johnson, J.C., Gyakobo, M., Agyei-Baffour,
P., Asabir, K., Kotha, S.R., Kwansah, J., Nakua, E.,
Snow, R.C., and Dzodzomenyo, M. (2010). “Rural
Practice Preferences Among Medical Students in
Ghana: A Discrete Choice Experiment,” Bulletin
of the World Health Organization, Vol. 88, pp.
333-341.
LaGraffe, D. (2012). “The Youth Bulge in Egypt: An
Intersection of Demographics, Security, and the
Arab Spring,” Journal of Strategic Security, Vol. 5,
Issue 2, pp.65-80, DOI: 10.5038/1944-0472.5.2.4
Lancaster, K. (1966). “A New Approach to Consumer
Theory,” The Journal of Political Economy, Vol.
74, pp. 132-57.
Mangham, L.J., Hanson, K., and McPake, B. (2009).
“How To Do (or Not To Do)...Designing a Discrete
Choice Experiment for Application in a Low-
Income country,” Health Policy and Planning, Vol.
24, pp. 151-158.
Pagaiya, N., Sriratana, S., Tangchareonsathien, V.,
Noree, T., Lagarde, M., and Blaauw, D. (2011).
“Health Workers` Preferences and Policy

DESIGNING YOUTH EMPLOYMENT POLICIES IN EGYPT 39
Interventions to Improve Retention in Rural Areas
in Thailand,” International Health Policy Program,
Ministry of Public Health, Thailand.
Rao, K.D. (2012). “How to Attract Health Workers to
Rural Areas? Findings from a Discrete Choice
Experiment in India,” BMC Proceedings, 6(Suppl
5):O1.
Rockers, P.C., Jaskiewicz, W., Wurts, L., Kruk, M.E.,
Mgomella, G.S., Ntalazi, F., and Tulenko, K.
(2012). “Preferences for Working in Rural Clinics
Among Trainee Health Professionals in Uganda:
A Discrete Choice Experiment,” BMC Health
Services Research Vol. 12, p.212.
Silatech (2009). “The Silatech Index: Voices of Young
Arabs,” Silatech and The Gallup Organization.
Williamson, B. (1987). Education and Social Change in
Egypt, Macmillan Press: London.
World Bank (2011). World Development Report 2011:
Conflict, Security, and Development. Washington,
DC.
World Bank (2013). Jobs for Shared Prosperity: Time
for Action in the Middle East and North Africa.
Washington, DC.
World Bank. World Development Indicators database.
World Health Organization (2012). How to conduct a
discrete choice experiment for health workforce
recruitment and retention in remote and rural ar-
eas: a user guide with case studies. Geneva.
United Nations (2012). World Population Prospects:
The 2012 Revision, United Nations, Department of
Economic and Social Affairs, Population Division.
United Nations (2010). World Population Prospects:
The 2010 Revision, United Nations, Department of
Economic and Social Affairs, Population Division.

ENDNOTES1. A youth bulge is a period in which “the age group
of youth is far more numerous than for all other
age groups combined” (Fuller, 2003: 2).
2. See Boughzala (2013).
3. See Ghanem (2013).
4. The reservation wage is defined as the minimum
wage rate at which a worker would accept a job.
5. This is Gallup’s first comprehensive poll of youth
in the Arab economies in 2009.
6. Compensation of employees consists of all pay-
ments in cash, as well as in kind (such as food and
housing), to employees in return for services ren-
dered, and government contributions to social in-
surance schemes such as social security and pen-
sions that provide benefits to employees.
7. Together with El-Zanaty & Associates, the JICA-RI
conducted the survey at 10 universities in Egypt.
Their locations are as follows: Cairo University
(Giza); El-Shorouk Academy (Cairo); Faculty of
Engineering in Ain Shams University (Cairo); Fac-
ulty of Engineering in Mansoura University (Man-
soura); Faculty of Engineering in Matareya Helwan
University (Cairo); Higher Institute for Engineer-
ing and Technology in New Damietta (Damietta);
Higher Technology Institute in 10th of Ramadan
City (6th of October); Minia University (Minya);
Modern University (Cairo); and British University
in Egypt (Cairo).
8. Together with the Demographic Institute, Faculty
of Economics at University of Indonesia (LD-FEUI),
eight universities were surveyed in Indonesia. The
locations are as follows: University North Sumatra
(Medan); Medan Institute of Technology (Medan);
University of Indonesia (Jakarta); Bandung Insti-
tute of Technology (Bandung); Parahyangan Uni-
versity (Bandung); Ahmad Dahlan University (Yo-
gyakarta); Hassanudin University (Makassar); and
Atmajaya University (Makassar).
9. The average exchange rate in the second quarter
of 2013 was 6.938 Egyptian Pounds per U.S. dollar
(see IMF, 2013).
10. For more details, see WHO (2012).

The views expressed in this working paper do not necessarily reflect the official position of Brookings, its board or the advisory council members .
© 2014 The Brookings Institution
ISSN: 1939-9383

1775 Massachusetts Avenue, NW Washington, DC 20036 202-797-6000 www.brookings.edu/global