design of an early crude oil production facility team 13...
TRANSCRIPT

Design of an Early Crude Oil Production Facility
Item Type text; Electronic Thesis
Authors Everly, Kyle; Kujawski, Jarrod; McGuckin, Megan; Peterson,Derek
Publisher The University of Arizona.
Rights Copyright © is held by the author. Digital access to this materialis made possible by the University Libraries, University of Arizona.Further transmission, reproduction or presentation (such aspublic display or performance) of protected items is prohibitedexcept with permission of the author.
Download date 02/07/2018 00:30:21
Link to Item http://hdl.handle.net/10150/625093

Design of an Early Crude Oil Production Facility
Team 13 Kyle Everly
Jarrod Kujawski Megan McGuckin
Derek Peterson
Approved 28APR2017
by:______________
______________
______________
______________
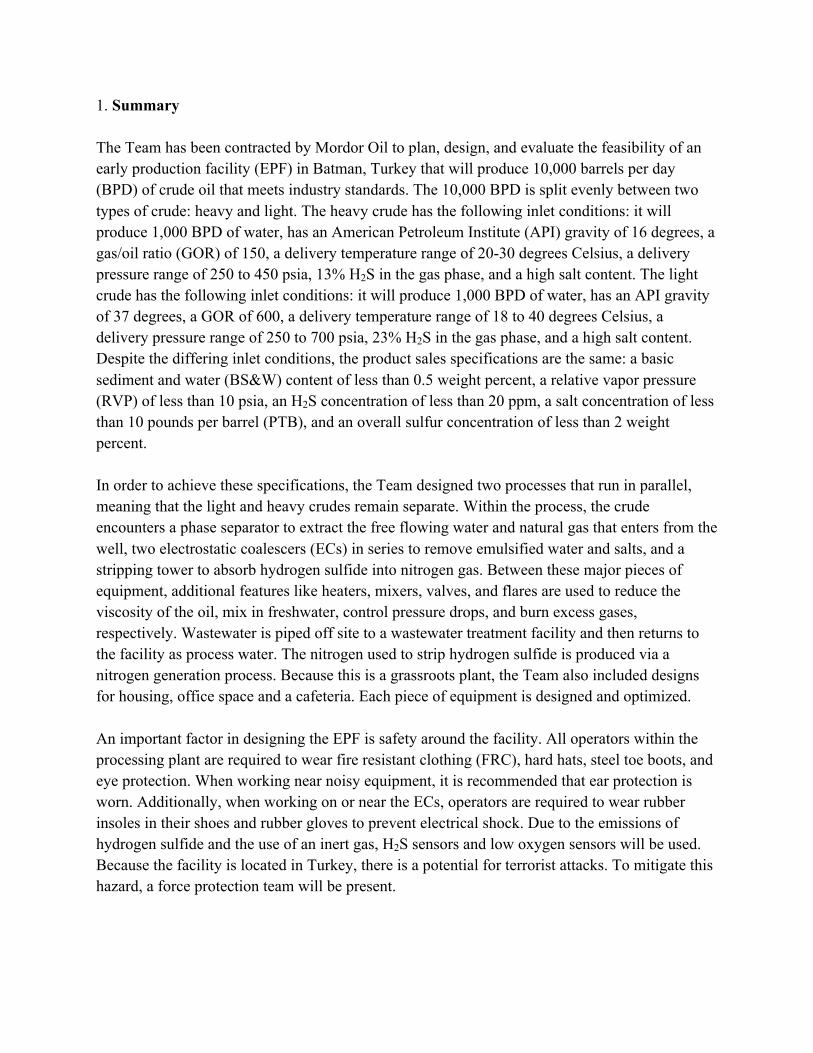
1. Summary The Team has been contracted by Mordor Oil to plan, design, and evaluate the feasibility of an early production facility (EPF) in Batman, Turkey that will produce 10,000 barrels per day (BPD) of crude oil that meets industry standards. The 10,000 BPD is split evenly between two types of crude: heavy and light. The heavy crude has the following inlet conditions: it will produce 1,000 BPD of water, has an American Petroleum Institute (API) gravity of 16 degrees, a gas/oil ratio (GOR) of 150, a delivery temperature range of 20-30 degrees Celsius, a delivery pressure range of 250 to 450 psia, 13% H2S in the gas phase, and a high salt content. The light crude has the following inlet conditions: it will produce 1,000 BPD of water, has an API gravity of 37 degrees, a GOR of 600, a delivery temperature range of 18 to 40 degrees Celsius, a delivery pressure range of 250 to 700 psia, 23% H2S in the gas phase, and a high salt content. Despite the differing inlet conditions, the product sales specifications are the same: a basic sediment and water (BS&W) content of less than 0.5 weight percent, a relative vapor pressure (RVP) of less than 10 psia, an H2S concentration of less than 20 ppm, a salt concentration of less than 10 pounds per barrel (PTB), and an overall sulfur concentration of less than 2 weight percent. In order to achieve these specifications, the Team designed two processes that run in parallel, meaning that the light and heavy crudes remain separate. Within the process, the crude encounters a phase separator to extract the free flowing water and natural gas that enters from the well, two electrostatic coalescers (ECs) in series to remove emulsified water and salts, and a stripping tower to absorb hydrogen sulfide into nitrogen gas. Between these major pieces of equipment, additional features like heaters, mixers, valves, and flares are used to reduce the viscosity of the oil, mix in freshwater, control pressure drops, and burn excess gases, respectively. Wastewater is piped off site to a wastewater treatment facility and then returns to the facility as process water. The nitrogen used to strip hydrogen sulfide is produced via a nitrogen generation process. Because this is a grassroots plant, the Team also included designs for housing, office space and a cafeteria. Each piece of equipment is designed and optimized. An important factor in designing the EPF is safety around the facility. All operators within the processing plant are required to wear fire resistant clothing (FRC), hard hats, steel toe boots, and eye protection. When working near noisy equipment, it is recommended that ear protection is worn. Additionally, when working on or near the ECs, operators are required to wear rubber insoles in their shoes and rubber gloves to prevent electrical shock. Due to the emissions of hydrogen sulfide and the use of an inert gas, H2S sensors and low oxygen sensors will be used. Because the facility is located in Turkey, there is a potential for terrorist attacks. To mitigate this hazard, a force protection team will be present.

Through simulations and research, the environmental impact of the proposed facility can be evaluated. Over the ten-year life span of this facility, it will only remove 0.002% of the world’s reserve of oil. In order to prevent brine water and oil spills, berms will be implemented throughout the facility. Because hydrogen sulfide is being removed from the crude, it is sent to the flare, where the light crude sends 618 ppb and the heavy sends 431 ppb. By burning it, there is a possibility of producing acid rain; with further research, it might be possible to incorporate a sulfur regeneration process to prevent acidification and possibly increase profits by selling the elemental sulfur. The equipment consumes a fair amount of fuel, producing carbon dioxide; however, after analyzing the carbon footprint, it turns out that the facility proposed is relatively environmentally friendly (see Section 8 for more details). For the plant, the largest capital expenditures are from drilling and completing each well, as well as running a flow line to the EPF, totaling to $65 million. Other expenditures derive from off-site plant support buildings as well as housing and a cafeteria for operators. Having 21 operators, contributing $8 million a year, drives annual costs. All electricity, as it is being generated by combusting a portion of the product stream, amounts to $1 million lost as product and is subtracted from overall sales. Within 10 years, the plant is able to pay back all capital expenses and make $143 million, with Mordor Oil and the government of Turkey splitting the profits 50/50. This is assuming a discount rate of 10% with the plant having an investor’s rate of return of 40.27%, which is highly desirable. Uncertainty and error are introduced throughout this report in several areas. First, the calculations for the ECs were completed using several assumptions and a combination of Aspen Hysys simulations and hand calculations; rectifying the differences between simulation and theory introduced error into the stream and equipment tables. Another source for error in the calculations is the assumption to use U.S. wages for the economic analysis; by using these numbers, the final cost is higher than it might be if the Team had used Turkish wages. By using Aspen Hysys to simulate the overall process, some uncertainty is introduced because Aspen uses ideal systems in its modeling. Overall, the Team has deemed the EPF feasible in all aspects.
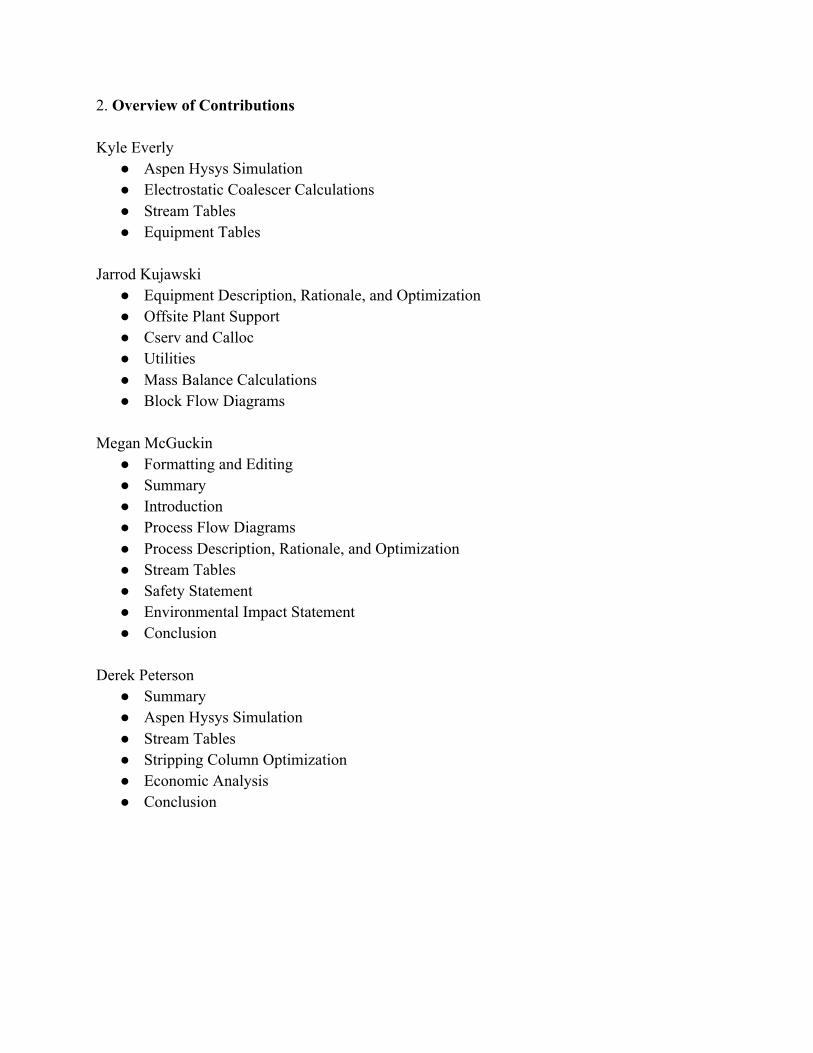
2. Overview of Contributions Kyle Everly ● Aspen Hysys Simulation ● Electrostatic Coalescer Calculations ● Stream Tables ● Equipment Tables
Jarrod Kujawski ● Equipment Description, Rationale, and Optimization ● Offsite Plant Support ● Cserv and Calloc ● Utilities ● Mass Balance Calculations ● Block Flow Diagrams
Megan McGuckin ● Formatting and Editing ● Summary ● Introduction ● Process Flow Diagrams ● Process Description, Rationale, and Optimization ● Stream Tables ● Safety Statement ● Environmental Impact Statement ● Conclusion
Derek Peterson ● Summary ● Aspen Hysys Simulation ● Stream Tables ● Stripping Column Optimization ● Economic Analysis ● Conclusion

3. Table of Contents
Section pg
Summary i-ii
Team Member Contributions iii
Introduction 1-3
Process Description, Rationale, and Optimization 3-10
Equipment Description, Rationale, and Optimization 11-13
Safety 13-14
Environmental Impact 14-16
Economic Analysis 16-20
Conclusions and Recommendations 20-22
References 23-25
Appendices 26-28

1
4. Introduction
The overall goal of this project is to design an early crude oil production facility in Batman, Turkey that produces a product within specifications. This early production facility (EPF) will have the ability of processing 5,000 barrels per day (BPD) of heavy crude oil and 5,000 BPD of light crude oil, coming to a total of 10,000 BPD. Each crude type has its respective well with differing inlet conditions. The heavy crude will produce 1,000 BPD of water, has an American Petroleum Institute (API) gravity of 16 degrees, a gas/oil ratio (GOR) of 150, a delivery temperature range of 20-30 degrees Celsius, a delivery pressure range of 250 to 450 psia, 13% H2S in the gas phase, and a high salt content. The light crude will produce 1,000 BPD of water, has an API gravity of 37 degrees, a GOR of 600, a delivery temperature range of 18 to 40 degrees Celsius, a delivery pressure range of 250 to 700 psia, 23% H2S in the gas phase, and a high salt content. Despite the differing inlet conditions, the product sales specifications are the same: a basic sediment and water (BS&W) content of less than 0.5 weight percent, a relative vapor pressure (RVP) of less than 10 psia, an H2S concentration of less than 20 ppm, a salt concentration of less than 10 pounds per barrel (PTB), and an overall sulfur concentration of less than 2 weight percent. Because crude oil is typically sold based on its API Gravity, the Team will use the U.S. prices for crude oil based on API. In Figure 4.1, the overall forecast for crude oil prices is shown. As can be seen, the overall price is still growing from where it was in early 2016. This is promising for profitability for this project.
Figure 4.1: Crude Oil Price Forecast (“Crude Oil: Forecast”)
As stated previously, the API gravity for the heavy crude oil that will be processed in this EPF is 16 degrees. The pricing information for crude with this API gravity is shown in Figure 4.2. The

2
U.S. purchasing price for crude with an API of 20 degrees or less is not currently as high as it was in the past ten years; however, the price is not nearly as low as it was twenty years ago. This indicates that the purchasing price for this crude is still relatively lucrative.
Figure 4.2: Crude Oil Purchase Price for Crude with an API of 20 Degrees or Less
(“U.S. Domestic Crude Oil First Purchase Prices with API Gravity 20.0 degrees or less”)
The API gravity for the light crude oil that will be processed is 37 degrees. The purchasing price history is shown in Figure 4.3. This figure looks nearly identical to Figure 4.2, with slight differences in 2011 and late 2013. This indicates that the future pricing of these two crude types will likely be similar. These prices, though not as high as they have been, will likely produce a profit for the proposed EPF.
Figure 4.3: Crude Oil Purchase Price for Crude with an API Between 35.1 and 40 Degrees (“U.S. Domestic Crude Oil First Purchase Prices with API Gravity 35.1 to 40.0 degrees”)
Throughout the design process several assumptions are made. The first, and possibly the most prominent, is that all sulfur in both feeds will be considered as H2S in the gas phase. This means that the Team will not be using catalysts to remove the H2S, but rather scrubbing the crude with nitrogen gas. Additionally, it will be assumed that the wells are free flowing, meaning that there is no requirement to include pumps to bring the crude oil from the wells to the facility. Although

3
the facility is in Turkey, and it is unknown what their environmental standards entail, this plant will operate under the assumptions of the environmental restrictions in place by the United State EPA. The modeling of this process is done using Aspen Hysys, specifically using the Peng Robinson model for two main reasons: it is the most commonly used model for oil and gas and it is the most advanced model in Hysys (“Overview and Best Practices for Optimum Simulations” and “Property Methods and Calculations”). Additionally, for the modeling done in Aspen Hysys, it was assumed that the pumps have an efficiency of 75% because when learning about pumps in CHEE 442, we saw that pumps generally operate around this efficiency. Next, the electrostatic coalescers were assumed to have an efficiency of 0.5%, meaning that 0.5% of the flow exiting the unit is water (Meidanshahi et al.). Lastly, it was assumed that of the 1,000 BPD free flowing water that comes in with each crude from the wells, 25% stays in the oil as emulsified water (see Appendix A and B). 5. Process Description, Rationale, and Optimization 5.1 Block Flow Diagram
Figure 5.1: Box Flow Diagram for Early Crude Production Facility Heavy Crude
Figure 5.2: Box Flow Diagram for Early Crude Production Facility Light Crude
5.2 Process Flow Diagrams

4
Figure 5.3: Light Crude PFD

5
Figure 5.4: Heavy Crude PFD

6
5.3 Equipment Tables
Table 5.1: Equipment Table

7
5.4 Stream Tables
Table 5.2a: First Half of Stream Tables

8
Table 5.2b: Second Half of Stream Tables
5.5 Utility Tables
Name Rate Rate Unit
Electricity 5173415 kJ/hr
Fuel Oil 327.7 kg/hr
Nitrogen 0.25 m^3/hr
Process Water 1844.4 kg/hr
Table 5.3: Utility Table
5.6 Written Description of Process This process begins with both the light and heavy crude oil free flowing from the wells in Batman, Turkey. Each crude type has their respective well with differing inlet conditions, which

9
are described in detail in the introduction (Section 4). These specifications will be met with the following process design. The light and heavy crudes will proceed through the process in parallel, such that they are not mixed. Addressing the PFDs shown in Figures 5.3 and 5.4, the crude (stream 1) enters a valve to control the flow into the phase separator (V-101). Here, the natural gas and free flowing water are separated from the oil that is to be processed. The natural gas (stream 3) is sent to a collection drum (D-101 A/B) so that as it cools, any light hydrocarbons that were in the vapor phase and condense are collected. The vapors that do not condense are sent to the flare (stream 24). The free flowing water (stream 2) is piped off site to a wastewater treatment plant and eventually returns as processed water to be used in stream 13 to dilute the crude before the second electrostatic coalescer (EC). The separated crude moves into the heat exchanger network (HEN) (stream 4), where the heat is transferred from the refined crude exiting the process (stream 5) to the incoming crude (stream 4). An additional heater (H-101) is used to ensure the oil reaches a high enough temperature so that the viscosity is reduced. From there, it moves through an inline mixer (M-101, stream 8), allowing recycled water from the second EC to dilute the salt concentration suspended in the oil. This mixture moves to the first electrostatic coalescer (EC-101, stream 9), which removes the first round of salt and emulsified water via electric fields. This stream is mixed with processed water (stream 13), again diluting the salt concentration prior to entering the second EC (EC-102). The waste brine solution is collected (stream 10) and processed in the same manner as the free flowing water. Due to the natural pressure drop across the process, natural gas and light hydrocarbons that vaporize are sent to the flare (streams 11 and 16). As the temperature drops through this line, some of the light hydrocarbons will condense; these are collected in a barrel (D-101 A/B) just before the flare. The crude then moves into a stripping tower (T-101) where it is contacted with nitrogen (stream 19) to remove H2S at atmospheric pressure, where this pressure is achieved via the valve between streams 17 and 18. The dirty gas stream is sent to the collection barrel and flare (stream 21), and the purified crude is pumped (P-101 A/B) back into the heat exchanger network. While the crude is not quite at room temperature after the HEN, the Team assumes that the crude will cool in the storage tanks (TK-101 A/B) prior to being loaded onto the trucks for transportation or delivery. 5.7 Rationale for Process Choice Throughout the design process for this plant, several choices were made with regards to the order of equipment. The first piece of equipment that the crude encounters is the phase separator. This is done for a few reasons: the first is that, the Team knows that sending mixed phase streams to heat exchangers is not ideal, so removing the gases prior to the heat exchanger is necessary. Also, there is some free flowing water that comes in with the crude, which should be removed prior to the heat exchanger to reduce the amount of heat required to reach the target process temperature.

10
The next major equipment that the crude encounters is the HEN. The Team decided to optimize the heat flowing through the system by capturing the heat that needs to be removed from the outlet stream and using it to warm the inlet stream. In case this does not reach a high enough temperature, a heater comes after the HEN. As stated before, the hot outlet stream is used to heat the inlet stream, thus reducing the temperature of the outlet. This stream is then cooled to room temperature while being stored in the tanks. The goal is to optimize the energy exchange throughout the process. The crude encounters an inline mixer next, which was chosen as opposed to a tank with a motorized mixing blade to decrease the number of moving parts and energy requirements. After that, the crude encounters two electrostatic coalescers in series. In order to remove the emulsified water and salt well, both of the ECs require a temperature of about 93°C—thus explaining why the HEN comes before the ECs (Meidanshahi et al.). Two ECs with a recycle stream were used in this process due to the amount of water needed to dilute the oil to meet the product specifications: this arrangement of equipment allows the lowest amount of water to be used (see Appendix B for calculations supporting this statement). Additionally, the use of a recycle stream decreases the amount of water being processed in the wastewater treatment plant off site. The last major piece of equipment in the process is the stripping tower. This is last for one major reason: H2S is more soluble in N2 at lower pressures (Ladd et al.). Because the crude enters the facility at a high pressure (between 250 and 450 psia for the heavy and between 250 and 700 psia for the light crude), the Team can strategically use pressure drops across the equipment to avoid the use of pumps, thus reducing energy requirements and pieces of equipment that could potentially break. By having the stripping tower towards the end of the process, it is naturally at a low pressure, increasing the efficiency of the unit. Due to the pressure drop across the entire process, pumps are required to move the crude after the stripping tower. The crude leaving the stripping tower is pumped into the HEN as the heating fluid; from there, the crude is stored for cooling before being trucked to consumers. Offsite plant support creates a self-sufficient facility in regards to utilities. The electrical demand is supplied by allocating some of the processed oil into an electrical generator, requiring no outside fuel source. Using a pressure swing adsorption generator, which takes the nitrogen from the abundant air at no raw material cost, will allow the Team to produce nitrogen. Process water will be taken from the primary wastewater treatment, requiring no outside source for process water.

11
6. Equipment Descriptions, Rationale, and Optimization The entire system will be designed to meet ANSI 300 specification, which has a hydrostatic test pressure of 5033 kPa at 149 degrees Celsius; this is well above any extreme conditions of the facility ("ANSI B16.5 - Steel Pipe Flanges - Maximum Pressure and Temperature Ratings - Group 1.2"). Typically, carbon steel is considered to have a poor rating in chemical compatibility with sour crude oil (Habonim - Engineering Information - Corrosion Data). However, applying a novolac epoxy coating allows service of carbon steel in sour crude environment up to 160 degrees Celsius ("Tankguard Plus"). Equipment optimization will be found in Appendix D for equipment shown in the Light and Heavy PFDs (Figures 5.3 and 5.4). The only other equipment piece that should noted would be for the production of nitrogen. Off site support will utilize a pressure swing adsorption system to separate the nitrogen from air for use in the stripping column with optimization done through manufacture for desired specifications ("Nitrogen Generators How It Works - Compressed Gas Technologies"). ● Horizontal Three Phase Separator (V-101,201)
○ Description - Free Water Knockout - Coated Carbon Steel ○ Function – Separate well feed into gas stream, free water stream, and crude oil
stream ○ Type: Free Water Knockout type using gravity separation with additional gas
separation ○ MOC – Coated Carbon Steel to be able to handle the high pressure of 2514 and
3275 kPa and compatibility with sour crude oil ○ Optimization - See Figure D-1 in Appendix D ○ Rationale – Freewater knockout design uses gravity to perform the separation so
electrical demand is zero. The process can be controlled via level control system using control air and thus no electrical components inside the process area increasing the safety of the process. Disadvantage is that the equipment has a limit on flow capabilities due to the required residence time inside the separator.
● Crude Oil Heat Exchanger (E-101,201) ○ Description - Shell and Tube - Coated Carbon Steel ○ Function – Changes the temperature of the crude oil for further processing and
energy recovery ○ Type: Shell and Tube double pass ○ MOC – Coated Carbon Steel to be able to handle the high pressure of 2479 and
3240 kPa and compatibility with sour crude oil ○ Optimization - See Figure D-2 in Appendix D and utilization of HEN in Aspen ○ Rationale – Due to the high viscosity of the crude oil using a shell and tube heat
exchanger is preferential over a plate and frame due to the less treacherous path present. The high pressure removes the use of plate and frame due to the thin wall

12
design. Shell and Tube also exhibits low amount of pressure drop so no additional pumping required for movement of product (Heat Exchanger Type Selection).
● Crude Oil Heater (H-101,201) ○ Description - Inline Heater - Coated Carbon Steel ○ Function – Heat the crude oil to decrease viscosity and allow greater separation in
the Electrostatic Coalescer ○ Type: Indirect Line Heater ○ MOC – Coated Carbon Steel to be able to handle the high pressure of 2439 and
3200 kPa and compatibility with sour crude oil ○ Optimization - See Figure D-3 in Appendix D ○ Rationale – Indirect line heater uses a heating medium of glycol/water mixture to
separate the heat source from the process fluid. Thus, with crude oil being flammable this reduces the hazards associated with heating the process stream (Inline Heaters).
● Crude Oil/Process Water Mixer (M-101,102,201,202) ○ Description - Static Mixer- Coated Carbon Steel ○ Function – Mix crude oil and process water for the electrostatic coalescer process ○ MOC – Coated Carbon Steel to be able to handle the high pressure of 2399 and
3160 kPa and compatibility with sour crude oil ○ Rationale – Static mixer requires no moving parts or electrical components
reducing both hazards and maintenance (Static mixer - Efficient mixing with no moving parts!).
● Demulsifier (EC-101,102,201,202) ○ Description – Electrostatic Coalescer MOC: Coated Carbon Steel ○ Type: 2 stage Electrostatic Coalescing ○ Function – Removal of emulsified water and salt ○ Rationale – Electrostatic Coalescers are widely used in the oil industry due to
high separation efficiency and variable parameter design. They also require less energy compared to other demulsification processes, nor does it require any chemical reactions to occur (ELECTROSTATIC SEPARATION).
○ Optimization - See Figure D-4 in Appendix D ○ MOC: Coated Carbon Steel to be able to handle the high pressure of 2399 and
3160 kPa and compatibility with sour crude oil ● Stripping Column (T-101,201)
○ Description – Stripping Column, Tray. MOC: Coated Carbon Steel ○ Function – Removal of hydrogen sulfide from the crude oil via nitrogen stripping ○ Type – Plate columns with countercurrent flow of nitrogen and crude oil ○ Rationale – Use of an available product of nitrogen and no chemical reactions
necessary for removal of hydrogen sulfide. The plate column offers better

13
separation predictions then a packed column would for variable liquid load (Costello, R.C.).
○ Optimization - See Figure D-5 in Appendix D ○ MOC - Coated Carbon Steel to be able to handle the high pressure of 2399 and
3160 kPa and compatibility with sour crude oil ● Crude Oil Pumps (P-101,201)
○ Description – Centrifugal Pump MOC: Carbon Steel ○ Function – To move the crude oil from the stripping column to the heat exchanger
and finally to storage ○ Rationale – Centrifugal pump design allows for deadhead to occur thus protecting
the rest of the process from over pressurization ○ Optimization - See Figure D-6 in Appendix D ○ MOC: Due to the low pressure and crude oil now being sweet carbon steel is
appropriate (Habonim - Engineering Information - Corrosion Data.) ● Storage Drum (D-101,201)
○ Description – Condensate Storage Drum MOC: Coated Carbon Steel ○ Function – Recover condensed hydrocarbons and provide low point for any
materials introduced into the flare system ○ Rationale – Need to allow any condensed material in the flare system to be
removed so a drum is installed at the low point and the recovered hydrocarbons can be sold.
○ MOC: Due to presence of hydrogen sulfide in the flare system Coated Carbon Steel
● Storage Tanks (TK-101,201) ○ Description – Floating Roof Tank MOC: Carbon Steel ○ Rationale – Tank is at atmospheric pressure and will have installed covered fin
fans to further cooling of crude oil to ambient temperature before shipping. Capacity of 2 days of production per tank in case of shipping problems occurring.
○ MOC - The primary material of construction is carbon steel due to compatibility with sweet crude oil (Habonim - Engineering Information - Corrosion Data.)
7. Safety Throughout an oil refinery, there are many tasks and equipment that require special personal protective equipment (PPE). For example, welding requires a special mask and gloves and maintenance being done on a stripping tower requires fall protection. While these specific tasks do require special equipment, throughout the proposed facility, there is one major PPE that must be worn at all times when in the plant: fire resistant clothing (FRC) (Sedlak). In addition to this, workers are required to wear the more common PPE like hard hats, steel toe boots, and eye protection. Also, near noisy equipment, such as pumps, it is recommended that workers wear the

14
provided hearing protection. Lastly, when working on or near the electrostatic coalescers, workers are required to wear rubber gloves and rubber insoles in their shoes to prevent electric shock. The proposed process requires the storage and use of chemicals. First, nitrogen will be produced and used onsite, making low oxygen alarms throughout the facility necessary. Additionally, H2S is removed from the crude in the gas phase, so H2S alarms are needed. Storage of the final product should be in tanks that are electrically isolated to help prevent fires. Because lightning is a source for fire in the storage tanks, shunts and bypass conductors should be installed to reduce that likelihood (Lanzoni). In order to assess the hazards associated with the larger pieces of equipment, a hazard and operability study (HAZOP) is completed on each major piece of equipment. First, the pair of ECs is analyzed. Depending on the process parameter, the possible consequences that are typically seen include arcing or emulsions not being effectively removed. The action required to mediate these hazards includes flow alarms and emergency electrical shutdown. Next, deviations in the process parameters of the stripping tower have typical consequences like reducing the effectiveness of the stripping column and possible downtime for the entire plant. Actions to prevent these issues from becoming hazards include temperature gauges, flow meters, and pressure relief valves. For variations in process parameters leading to the heat exchanger, consequences include too much heat in the streams, leading to vaporization of light hydrocarbons, or too little heat, making the ECs ineffective. To prevent serious problems with the system, the Team recommends the use of temperature gauges, flow meters, and regular maintenance. Lastly, the three phase separator results in ineffective time for separations or insufficient flow to following pieces of equipment when inlet conditions are altered. These issues can be prevented with the use of control valves, emergency shutdown procedures, flow meters and regular maintenance. For more information on any of these HAZOPs, please see the attached documentation in Appendix I. An additional safety consideration is the possibility of terrorism due to the facility’s location in Turkey. Depending on political climates, an American company in Turkey could be a potential target. In order to mitigate this hazard, a force protection team will be present year round. 8. Environmental Impact In order to analyze the environmental impact for the EPF in Batman, Turkey, a life cycle analysis was completed on the processes shown in the PFDs (Figures 5.3 and 5.4). The first major environmental concern encountered is the depletion of resources via the two wells, ENDOR4 and ENDOR2. By its nature, the removal of crude oil from the earth to refine and sell is depleting the natural resources available. According to OPEC there are 1.5 𝑥 10!"barrels of crude oil available

15
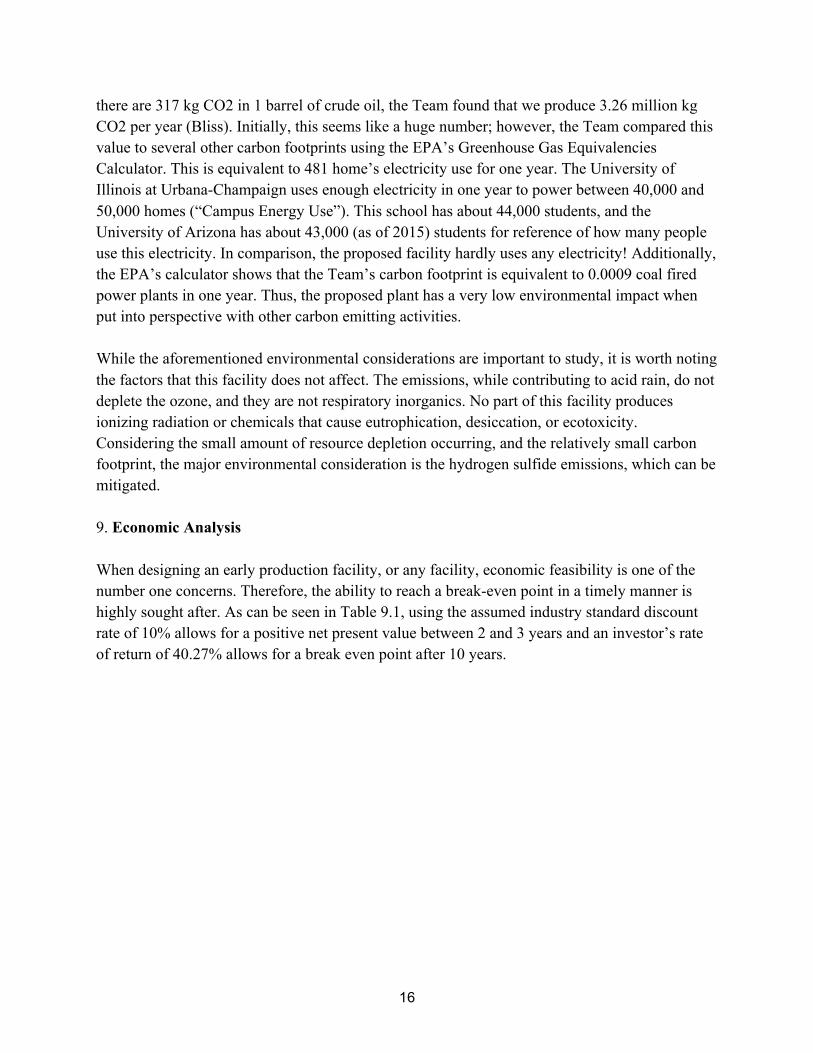
in the world (“OPEC Share of World Crude Oil Reserves”). Assuming no downtime and no fluctuations in production, the proposed EPF will produce 36.5 million barrels of crude over the ten-year design life. This is a minuscule 0.002% of the world reserve, showing that while the Team will be reducing the available amount of natural resources, the impact is slight (see Appendix G-1 for calculations). The next environmental issue that could be encountered is the possibility of spills. For this refinery, there are two major spills that could negatively impact the surrounding ecosystems: brine water and crude oil. Brine water, if released into the environment, can be detrimental to vegetation and soil health (Konkel). In the proposed process, salt water is produced in two main places: the multiphase separator and the electrostatic coalescer; each of these pieces of equipment, as well as the loading station for transportation of the water are locations where spills can occur. Similarly, crude oil can be spilled from anywhere in the plant. When this occurs, the oil prevents the vegetation from being able to absorb water (“Land”). It is for this reason that berms will be utilized to prevent spills of brine water and oil from reaching the environment. As the crude is refined to meet sales specifications, one of the major environmental concerns is the removal of hydrogen sulfide. According to the Team’s calculations (see Appendix G-2), the light crude portion of the process produces 1279 kg/h and the heavy crude produces 576.3 kg/h H2S leaving the stripping tower. These streams are fed directly to the flare with a total flow rate of 1335 m3/h for the heavy crude and 2069 m3/h for the light crude. It is known that burning H2S produces SO2, a contributor to acid rain. According to Turkish legislature, companies are required to obtain and annually renew a permit that allows emissions (“Environmental Law and Practice in Turkey: Overview” and “Official Statistics Portal”). Due to the Team’s inability to read Turkish, and the lack of specific information, the United States EPA regulations on SO2 emissions were used to evaluate this facility’s emissions. According to the U.S. EPA’s Clean Air Act, the secondary standard for SO2 production is 500 ppb over three hours (Clean Air Act: United States Environmental Protection Agency). Assuming that all of the H2S produced in this process is converted to SO2 in the flare process, this greatly exceeds the U.S. standards because the light crude produces 618.3 ppb and the heavy crude produces 431.7 ppb (see Appendix E-2 for calculations). For this reason, this aspect of the proposed process is the largest area for improvement. While the Team was unable to find any information that the Turkish government would have issues with the facility producing this much SO2, we know this is an unacceptable amount of pollution. With more time for research, the Team recommends looking into the possibility of purifying the H2S released to produce elemental sulfur to sell. By doing this, the facility reduces the amount of acidification it contributes to, and a possible profit can be made. Another important environmental consideration is the carbon footprint of the proposed facility. According to the utilities table (see Table 5.3), this site uses 1.3 million kg of oil per year to run the pumps, ECs, onsite facilities for employees, among other things. Using the assumption that
16
there are 317 kg CO2 in 1 barrel of crude oil, the Team found that we produce 3.26 million kg CO2 per year (Bliss). Initially, this seems like a huge number; however, the Team compared this value to several other carbon footprints using the EPA’s Greenhouse Gas Equivalencies Calculator. This is equivalent to 481 home’s electricity use for one year. The University of Illinois at Urbana-Champaign uses enough electricity in one year to power between 40,000 and 50,000 homes (“Campus Energy Use”). This school has about 44,000 students, and the University of Arizona has about 43,000 (as of 2015) students for reference of how many people use this electricity. In comparison, the proposed facility hardly uses any electricity! Additionally, the EPA’s calculator shows that the Team’s carbon footprint is equivalent to 0.0009 coal fired power plants in one year. Thus, the proposed plant has a very low environmental impact when put into perspective with other carbon emitting activities. While the aforementioned environmental considerations are important to study, it is worth noting the factors that this facility does not affect. The emissions, while contributing to acid rain, do not deplete the ozone, and they are not respiratory inorganics. No part of this facility produces ionizing radiation or chemicals that cause eutrophication, desiccation, or ecotoxicity. Considering the small amount of resource depletion occurring, and the relatively small carbon footprint, the major environmental consideration is the hydrogen sulfide emissions, which can be mitigated. 9. Economic Analysis When designing an early production facility, or any facility, economic feasibility is one of the number one concerns. Therefore, the ability to reach a break-even point in a timely manner is highly sought after. As can be seen in Table 9.1, using the assumed industry standard discount rate of 10% allows for a positive net present value between 2 and 3 years and an investor’s rate of return of 40.27% allows for a break even point after 10 years.

17
Table 9.1: Net Present Value Calculations
Therefore, after 10 years the Team’s plant is expected to have paid back all initial investments as well as generated $138 million over the 10 years. However, according to the Basis of Design in Appendix A, 50% of profits are split between Mordor Oil and the government of Turkey, meaning that the company will receive $69 million in profit. There will need to be some negotiations between Mordor Oil and the government of Turkey to ensure that this does not mean half of revenue from sales. If this is the case, the plant will not be economically feasible ($27 million in debt after 10 years). (See Appendix L for calculations).

18
Table 9.2: Total Capital Investment Report
The majority of assumptions made for Table 9.2 come from Seider et al., which utilizes U.S. industry standards to give percentages of how various capital costs relate to one another. The Team completed additional calculations (Appendix F Offsite and Utility Assumptions Calculations) for the Cserv and Calloc portions of Table 9.2, which account for the various portions of the plant which are allocated for off-site plant support, such as cafeterias and housing for all plant personnel as well as allocations for electricity generation and wastewater treatment.

19
Table 9.3: Annual Costs Report
Table 9.3 consists of the annual operating costs of the EPF from which the majority of values are derived from relationships using Seider et al. Utility costs are not included in this table due to the fact that all utilities are internally produced at the cost of reduction of sales product which have been subtracted from the total sales. According to estimates from Appendix F, it has been assumed that the plant will require 21 total personnel ranging from operators to a safety team, which are included in DW&B. All other costs are calculated based on U.S. industry standard percentages of other costs. Included in the dropbox are calculations of process equipment and sales. For the process equipment, the Team utilized Seider et al. equations to find purchasing costs and bare module costs. All sizing factors are derived from Aspen after optimization (such as Appendix D), except for the nitrogen generator and electrostatic coalescers, whose purchasing costs were derived from vendor estimates (Appendices J and K). As previously mentioned, the material of all process equipment will be coated carbon steel, which Seider et al. does not include in their material factor for multiple equipment calculations. Therefore, each of these factors has been increased to account for this special coating. For sales calculations, the current light and heavy oil prices in April 2017 are being used to calculate sales per year. This therefore assumes that this price will not fluctuate over time. These prices are assumed to be $48.35 per barrel of heavy oil, and $49.57 per barrel of light oil (“U.S. Domestic Crude Oil First Purchase Prices with API Gravity

20
20.0 degrees or less” and “U.S. Domestic Crude Oil First Purchase Prices with API Gravity 35.1 to 40.0 degrees”). As previously mentioned, Figure 4.2 and 4.3 demonstrate the possible fluctuations inherent to the crude oil industry. Therefore, the most influential economic hazard for this project will be the stability or growth of the crude oil market. Although Figure 4.1 does show a general upward trend in the past year for the price of crude oil, there are no guarantees that this will be the case. Other economic hazards could be future regulations by the government of Turkey relating either to environmental or renewable energy. More stringent environmental regulations on H2S and SO2 would require an additional investment into a sulfur repurposing process, which may become an extra source of profit over time. Political climate also may have a large effect on annual wages of workers, which is a large portion of the plant’s annual costs. As the workers would most likely be paid in Turkish currency (Turkish Lira), an unprofitable exchange rate could hurt the ability to pay workers what they were promised. A final economic hazard also coincides with a safety hazard: terrorism. Any attack on the facility could lead to potential damages to process equipment or buildings, which would require investment in order to repair these damages. Future work to be completed based on cost includes optimizing process design according to economics such as an economic comparison of one electrostatic coalescer instead of two in each of the parallel processes or altering of operating temperatures in order to save on purchasing and operating costs of the coalescer and the heat exchanger. The Team waited to perform economic calculations after the process had been designed and based optimization not on cost, but on the conservation of resources. Therefore, a more rigorous evaluation of the process could allow for reduction of operating and bare-module costs. As was mentioned previously, sulfur could be recovered and sold as another value stream, and could therefore become another source of revenue, provided that it is economically profitable. Thus, an economic feasibility analysis could be performed on this sulfur conversion process. 10. Conclusions and Recommendations Based on the data and information presented in the above documents, the team has come to several conclusions. First, based on the environmental analysis, the Team deemed the proposed EPF as feasible, highlighting the following: the carbon footprint of this facility is smaller than that of the University of Arizona and the amount of crude oil being removed from the world’s resources is minimal, amounting to be only about 0.002% over ten years. While the sulfur emissions are an issue, they do not deplete the ozone and are not respiratory organics; none of the emissions from this facility are directly harmful to the surrounding ecosystems.

21
In order to address the excess hydrogen sulfide emissions, the Team feels that future work should be conducted on analyzing the possibility of introducing a supporting plant to recover elemental sulfur from gaseous hydrogen sulfide. As mentioned in the Environmental Impact Statement (Section 8), implementing a support facility to remove the sulfur from emissions to potentially sell could boost profits as an added bonus to reducing rain acidification. However, until an economic analysis and environmental investigation are completed, it is unknown as to whether this could benefit the EPF. Economically, the EPF itself is feasible. There is enough revenue to be able to pay back capital expenses as well as overcome annual costs, assuming that negotiations between Mordor Oil and the government of Turkey have taken place (see Section 9). The plant makes a considerable profit and has a high investor’s rate of return, which is extremely desired in the building of a facility. Throughout the design of the EPF, several assumptions were made. One of the most prominent assumptions is that all of the sulfur present in both wells is in the gas phase as hydrogen sulfide. To improve this process, and make it more realistic, this assumption should be discarded, introducing the need for reactors. With more time, the Team would be able to investigate different types of catalysts and how introducing catalytic reactors into the process would affect economics, environmental, and safety assessments. Because the electrostatic coalescer is a unique piece of equipment, Aspen Hysys does not have a piece of equipment that models it. For this reason, the EC is a main source for assumptions in this EPF proposal. In Aspen, the series of ECs is modeled using a single vessel that separates nearly all of the emulsified water and salt from the crude. While this meets the product specifications, it is not realistic and introduces error into the process. Because of Aspen’s inability to model this piece of equipment, the Team utilized hand calculations to try and create a more representative separation; however, by doing this, the streams that exit the ECs no longer match the streams that leave the EC in Aspen, leaving us with a discontinuity. To the best of our ability, the Team reconciled these errors. While the Team tried to contact vendors of ECs, with more time, the Team might receive a response, thus improving the overall proposal. Another important assumption that was applied to this facility was the use of U.S. standards for economic calculations. If the plant had been priced according to Turkish standards, costs of not only wages, but most likely many costs to build the plant would be reduced, thus increasing the profitability of the plant. When completing the environmental analysis, the Team utilized the U.S. EPA regulations for hydrogen sulfide emissions. This assumption introduces some error into the conclusions that can be drawn from this analysis because Turkey may not have the same standards as the U.S.

22
Because this is the largest area for concern from the environmental analysis, further research should be conducted for Turkey’s environmental regulations. After analyzing the process, another major improvement that could be implemented would be to use the natural gas that leaves the phase separator as fuel for the pumps and heaters. By doing this, the EPF would be able to reduce the amount of product used for facilities and make a larger profit. On the other hand, instead of using the off gas for fuel, the EPF could include equipment to purify the natural gas and sell it, increasing profits. Without completing the analysis for this addition, it is unknown as to if this would be beneficial. In conclusion, the Team has determined that the proposed EPF is both profitable and feasible.
23
11. References "ANSI B16.5 - Steel Pipe Flanges - Maximum Pressure and Temperature Ratings - Group 1.2." The Engineering ToolBox. N.p., n.d. Web. 26 Apr. 2017. http://www.engineeringtoolbox.com/ansi-flanges-pressure-temperature-d_342.html Bliss, Jim. “Carbon Dioxide Emissions per Barrel of Crude.” The Quiet Road, 2008. Web. 23 Apr. 2017. http://numero57.net/2008/03/20/carbon-dioxide-emissions-per-barrel-of-crude/ “Campus Energy Use.” University of Illinois at Urbana-Champaign, 2015. Web. 23 Apr. 2017. http://www.library.illinois.edu/committee/energy/campusenergyuse.html “Clean Air Act.” United States Environmental Protection agency, 2017. 13 Apr. 2017. https://www.epa.gov/laws-regulations/summary-clean-air-act Costello, R.C. "Distillation Part 1 – Packed Towers vs. Tray (Plate) Towers." COSTELLO. N.p., 16 Nov. 2016. Web. 24 Apr. 2017. http://rccostello.com/wordpress/distillation/distillation-part-1-packed-towers-vs-tray-plate-towers “Crude Oil: Forecast.” Trending Economics, 2017. 11 Feb. 2017. http://www.tradingeconomics.com/commodity/crude-oil "ELECTROSTATIC SEPARATION." THERMOPEDIA™. N.p., n.d. Web. 24 Apr. 2017. http://www.thermopedia.com/content/727/ “Environmental Law and Practice in Turkey: Overview.” Practical Law. Thomson Reuters, 2017. 13 Apr. 2017. https://uk.practicallaw.thomsonreuters.com/7-522-2040?__lrTS=20170411180623535&transitionType=Default&contextData=(sc.Default)&firstPage=true&bhcp=1 “Greenhouse Gas Equivalencies Calculator”. US Environmental Protection Agency. May 2016. Web. 23 Apr. 2017. https://www.epa.gov/energy/greenhouse-gas-equivalencies-calculator%20 “Habonim - Engineering Information - Corrosion Data.” N.p., n.d. Web. 23 Apr. 2017. http://habonim.com/corrosion.asp Heat Exchanger Type Selection. N.p., n.d. Web. 24 Apr. 2017. http://www.hcheattransfer.com/selection.html Inline Heaters. N.p., n.d. Web. 24 Apr. 2017. http://www.wattco.com/inline-heaters.html

24
Konkel, Lindsey. “Salting the Earth: The Environmental Impact of Oil and Gas Wastewater Spills.” National Institute of Health. U.S. Department of Health and Human Services, Dec. 2016. Web. 12 Apr. 2017. https://ehp.niehs.nih.gov/124-a230/ Ladd, Brent, Matthew Robertson, Abigail Nalbandian, Kelsey Kaplan, Steve Cotton. “Strippers.” College of Engineering: Chemical Engineering at the University of Michigan. Visual Encyclopedia of Chemical Engineering. Web. 26 Feb. 2017. http://encyclopedia.che.engin.umich.edu/Pages/SeparationsChemical/Strippers/Strippers.html “Land.” Oil Spill Prevention and Response. American Petroleum Institute, 2015. Web. 12 Apr. 2017. http://www.oilspillprevention.org/oil-spill-cleanup/land-oil-spill-cleanup Lanzoni, Joseph A. “Improving Lightning Safety of Petroleum Storage Tanks.” Lightning Eliminators, 2009. 22 Apr. 2017. http://www.lightningprotection.com/pdfs/resources/knowledge-transfer/technical-papers/improving_lightning_safety_of_petroleum_storage_tanks-oct_2009-lanzoni.pdf Meidanshahi, Vida, Abdolhossein Jahanmiri, and Mohammad Reza Rahimpour. “Modeling and Optimization of Two Stage AC Electrostatic Desalter.” Separation Science and Technology, 2012. http://dx.doi.org/10.1080/01496395.2011.614316 "Nitrogen Generators How It Works - Compressed Gas Technologies." Nitrogen Generators - Compressed Gas Technologies. N.p., n.d. Web. 26 Apr. 2017. http://www.nitrogen-generators.com/nitrogen-generators-how-it-works/ “Official Statistics Portal.” Official Statistics. Turkstat, 2017. 13 Apr. 2017. http://www.officialstatistics.gov.tr/?q=en/content/ministry-environment-and-urbanization-moeu “OPEC Share of World Crude Oil Reserves.” Organization of the Petroleum Exporting Countries. Organization of the Petroleum Exporting Countries, 2017. Web. 12 Apr. 2017. http://www.opec.org/opec_web/en/data_graphs/330.htm “Overview and Best Practices for Optimum Simulations.” Aspen HYSYS Property Packages. Aspen Tech, 2006. Web. 17 Feb 2017. http://sites.poli.usp.br/d/pqi2408/BestPracticesOptimumSimulationsHYSYSPropertyPackages.pdf “Property Methods and Calculations.” HYSIS Property Selection. Web. 17 Feb. 2017. http://people.clarkson.edu/~wwilcox/Design/HYSYSpropSelect.pdf

25
“Secondary National Ambient Air Quality Standards (NAAQS) for Nitrogen Dioxide (NO2) and Sulfur Dioxide (SO2).” Sulfur Dioxide Pollution. United States Environmental Protection Agency, 2016. https://www.epa.gov/so2-pollution/secondary-national-ambient-air-quality-standards-naaqs-nitrogen-dioxide-no2-and-sulfur Sedlak, Stephanie. “Toledo Refinery: Procedure.” BP Oil -- Toledo Refinery, 2017. Section 5.1. Web. 24 Apr. 2017. http://toledobp.com/pages/cm/work_procedures/Safety/SAF-026.pdf Seider, Warren D., Daniel R. Lewin, J. D. Seader, Soemantri Widagdo, Rafiqul Gani, and Ka Ming Ng. Product and Process Design Principles Synthesis, Analysis and Evaluation. 4th ed. New York: John Wiley & Sons, 2016. Print. "Static mixer - Efficient mixing with no moving parts!" Entec International: A clean environment through a clear vision. N.p., n.d. Web. 24 Apr. 2017. http://www.entec-international.com/static-mixer.html "Tankguard Plus." – chemical resistant novolac tank lining l Jotun. N.p., n.d. Web. 26 Apr. 2017. http://www.jotun.com/uk/en/b2b/paintsandcoatings/products/Tankguard-Plus.aspx “U.S. Domestic Crude Oil First Purchase Prices with API Gravity 20.0 degrees or less.” Petroleum & Other Liquids. Independent Statistics & Analysis: U.S. Energy Information Administration, 2017. 11 Feb. 2017. https://www.eia.gov/dnav/pet/hist/LeafHandler.ashx?n=PET&s=F000000013&f=M “U.S. Domestic Crude Oil First Purchase Prices with API Gravity 35.1 to 40.0 degrees.” Petroleum & Other Liquids. Independent Statistics & Analysis: U.S. Energy Information Administration, 2017. 11 Feb. 2017. https://www.eia.gov/dnav/pet/hist/LeafHandler.ashx?n=PET&s=F000000053&f=M

26
12. Appendices Appendix A See file “Design Basis for Endor EPF” in D2L dropbox. This is the file that Adam sent to us when we first started the project; some pieces of the assumptions and expectations have been changed, but these were mentioned throughout the report. Appendix B Electrostatic Coalescer Calculations See files “EC Calcs - Light Crude” and “EC Calcs - Heavy” in D2L dropbox. The operation of the electrostatic coalescers (EC) was determined in the following method. The concentration of salt in each well stream was determined and then found listed in the Basis of Design (see Appendix A). A stream balance was set up for a single EC and for two ECs in series. Solver was used to determine what dilution water would be required hit the salt concentration specification. A recycle stream setup was modeled by setting aside a cell to show the salt concentration in the stream going into the first EC. The actual stream balance salt concentration was entered by hand, which caused the set aside cell value to change. The process was repeated until the integers in both cells matched. Appendix C Stream Table Calculations See file “Stream Table Final Version” in D2L dropbox The streams were taken from Aspen and the Electrostatic Coalescer Calculations files. Salt was not modeled in Aspen so it was tracked in the stream tables by hand. Because the Aspen values did not match the initial EC calculations, the EC calculations were rerun with the values in Aspen. These results were compiled in the stream tables. Also, the emulsions were not modeled in Aspen but the water was added and removed from the streams as needed to obtain the correct heating values. This means there were more streams in Aspen than in the PFD. To model this correctly in the stream tables PFD streams were broken down into their Aspen stream components and summed together (See Appendix M for Aspen Figures). Appendix D See file “Equipment Optimization” in D2L dropbox. This file contains Aspen screenshots of sizing factors and characteristics of important pieces of equipment. Appendix E Economic Calculations See file “Economic Calculations” in D2L dropbox.

27
This file contains all economic calculations including sales calculations, an NPV table, a total capital invest table, an annual costs table, and calculations for process equipment bare-module costs. The main assumptions included in these calculations come from Seider et al., with sizing factors coming from Aspen after optimization. Also, electricity costs have been taken out of sales and are not included in the annual costs table. A discount rate of 10% has been assumed due to being common in industry. Any plant support costs come from the subsequent calculations (Offsite and Utility Assumptions Calculations) including the number of workers and Calloc and Cserv costs. For pricing of the EC and nitrogen generator, see “EC pricing”, and see “NG pricing” for bare-module costs. Appendix F Offsite and Utility Assumptions Calculations See file “Offsite and Utility Assumptions Calculations” in D2L dropbox. ● Assumptions for number of workers and security ● Assumptions and calculations for sizing of offsite plant support building and price ● Calculations for utility allocated cost ● Calculations of oil used in electric generation and carbon dioxide emitted
Appendix G G-1: Resource Depletion Calculations EPF production over 10 years:
Percent of world’s resources that is being removed by proposed EPF:
G-2: H2S ppb Calculations Heavy crude:
Light crude:
Appendix H Overall Mass Balance See file “Overall Mass Balance” in D2L dropbox.

28
Appendix I See files “Hazop_Last name”, where last name is Everly, Kujawski, McGuckin or Peterson in D2L dropbox. These files assess the hazard and operability of four major pieces of equipment. Appendix J See file “EC pricing” in D2L dropbox. This file contains calculations to determine the price of the EC. The price of the transformer that must be included with the EC was priced by a vendor, in which the email is located in this document. Appendix K See file “NG pricing” in D2L dropbox. This file contains a table sent from a vendor by email in order to price the nitrogen generator. Appendix L See file “Economic Calculations Half Sales” in D2L dropbox. This file shows the economic analysis if the Turkish government and Mordor Oil are splitting overall revenue from sales as opposed to profits. Appendix M See file “Aspen Light Process Screenshot” and “Aspen Heavy Process Screenshot” in D2L dropbox. These files show the process set up in Aspen Hysys. Appendix N See files “Aspen Files Heavy” and “Aspen Files Light” in D2L drobox. This file is the Aspen Hysys file that was used to model the entire system.