design of a sales management system for organisations with
TRANSCRIPT

Department of Technology Management and Economics Division of Innovation and R&D Management CHALMERS UNIVERSITY OF TECHNOLOGY Göteborg, Sverige 2017 Report No. E 2017:035
Design of a Sales Management System for Organisations with an Equal Focus on Standard and Project Business
Master of Science Thesis in the Quality and Operations Management Programme
FINN PETERSEN

MASTER’S THESIS E 2017:035
Design of a Sales Management System for an Organization with an Equal Focus on Stand-
ard and Project Business
FINN PETERSEN
Tutor, Chalmers: Björn Lantz
Department of Technology Management and Economics
Division of Innovation and R&D Management
CHALMERS UNIVERSITY OF TECHNOLOGY
Göteborg, Sweden 2017

Design of a Sales Management System for Organisations with an Equal Focus on Standard and Pro-ject Business FINN PETERSEN
© FINN PETERSEN, 2017.
Master’s Thesis E 2017: 035
Department of Technology Management and Economics Division of Innovation and R&D Management Chalmers University of Technology SE-412 96 Göteborg Sweden Telephone: + 46 (0)31-772 1000 Cover: The six elements of a Sales Management System framework based on own research. Reprint from page 14 and used on page 21 and 46 in adapted form. Chalmers Reproservice Göteborg, Sweden 2017
V
Design of a Sales Management System for Organisations with an Equal Focus on Standard and Project Business
FINN PETERSEN
Department of Technology Management and Economics
Division of Service Management and Logistics
Chalmers University of Technology
Abstract
The primary purpose of this study is to provide a framework for sales management in situations where standard and project business are equally important because current research does not account for this particular case. Therefore, the study aims to identify the requirements of such a Sales Management System before designing the framework based on these demands.
In the first part, six dimensions of a Sales Management System were identified and presented using a literature review. The research showed that it is difficult to change all dimensions at once and therefore only Sales Force Management and Sales Planning & Steering are opti-mised in this thesis. The study then identified six requirements of a Sales Management Sys-tem, using a single exploratory case study augmented with literature studies. Based on these requirements and the generalised prerequisites of the case company, a Sales Management framework was created, including an incentive system suggestion, a price setting approach and eleven key performance indicators (KPIs)
In conclusion, it is argued that it is possible to account for the different challenges from stand-ard and project business through using two different price setting approaches and resulting key performance indicators for the two business types. These distinctive KPIs are augmented with three aggregated KPIs in Sales Planning & Steering and four common KPIs in Sales Force Management, allowing for both business types to be managed together. The thesis hopes to contribute to the development of research in the sales management field and reduce problems for organisations with an equal focus on standard and project business.
Keywords: Sales management; sales force management; sales planning and steering; sales and operations; incentive system; KPIs; framework; case study

VI
Acknowledgement
Finalising this master’s thesis means that six years of studies are over for me and for now, it is time to attack new challenges outside academia but someday I might return. Six years in which I expanded my knowledge, met incredible people, and build friendships all over the world. Finalising my thesis means also that it is time to say, “thank you” to those who helped me along the way.
A big thank you, to Björn for supporting me with feedback and support along the way. Thanks to all the great people at LESER that I met during the last six years. Especially Dirk and Kai who supported me in my master’s and bachelor’s theses and provided me with the help but also creative freedom needed in the respective situations. I’m looking forward to working with you soon. Lastly, a special thank you to my family and friends who supported me along the way, even though my communication could have been more frequent at times.
Gothenburg, May 2017
Finn Petersen

VII
Table of Contents
Abstract ................................................................................................................................. V
Table of Contents ................................................................................................................ VII
Table of Figures ................................................................................................................... IX
Table of Tables...................................................................................................................... X
1 Introduction ...................................................................................................................... 1
1.1 LESER – The case company................................................................................... 2 1.2 Purpose and outline of the report ............................................................................ 4
2 Elements of a Sales Management System ...................................................................... 5
2.1 Sales Force Management ....................................................................................... 8 2.2 Sales Strategy ......................................................................................................... 9 2.3 Sales Organisation ................................................................................................ 10 2.4 Sales Processes.................................................................................................... 11 2.5 Sales Planning & Steering ..................................................................................... 12 2.6 Culture .................................................................................................................. 12 2.7 Synthesis of the Literature Review ........................................................................ 14
3 Research Questions & Delimitations .............................................................................. 15
3.1 Research Questions .............................................................................................. 15 3.2 Delimitations .......................................................................................................... 15
4 Methodology .................................................................................................................. 16
4.1 Research Strategy and Design .............................................................................. 16 4.2 Research Process ................................................................................................. 17
4.2.1 Addressing the First Research Questions ................................................... 17 4.2.2 Addressing the Second Research Questions .............................................. 19
4.3 Analysis of Data .................................................................................................... 19 4.4 Quality of Research ............................................................................................... 19 4.5 Societal, Ethical and Ecological Considerations .................................................... 20
5 Description of the Case ................................................................................................. 21
5.1 The Company ........................................................................................................ 21 5.2 Sales Strategy ....................................................................................................... 22 5.3 Sales Organisation ................................................................................................ 22 5.4 Sales Processes.................................................................................................... 24 5.5 Culture .................................................................................................................. 24
6 Analysis of Requirements for a Sales Management System .......................................... 26
6.1 Price Setting Approach Aligned with Incentives and Situation ............................... 26 6.2 Common Indicators to Steer Overall Sales and Plan Production ........................... 27 6.3 Control Parameters that Allow Comparability between Transactions ..................... 28 6.4 Have Early and Late Indicators for Sales Development ......................................... 30 6.5 Ensuring Resource Availability of the Sales Force................................................. 31 6.6 Focus on Input and Outcome/Behaviour Control in Sales Force Management ...... 32

VIII
7 Design of the Sales Management System ..................................................................... 33
7.1 Transferring the Balanced Scorecard Concept to a Sales Management System ... 34 7.2 Defining the Content of the Sales Management System ........................................ 35
7.2.1 Type of Incentive System ............................................................................ 35 7.2.2 Price Setting Approach ............................................................................... 38 7.2.3 Key Performance Indicators for Sales Planning and Steering ..................... 39 7.2.4 Key Performance Indicators for Sales Force Management ......................... 43
7.3 Synthesis of the Sales Management System ......................................................... 46
8 Discussion ..................................................................................................................... 48
9 Conclusion ..................................................................................................................... 51
References .......................................................................................................................... 53
Appendix .............................................................................................................................. XI
IX
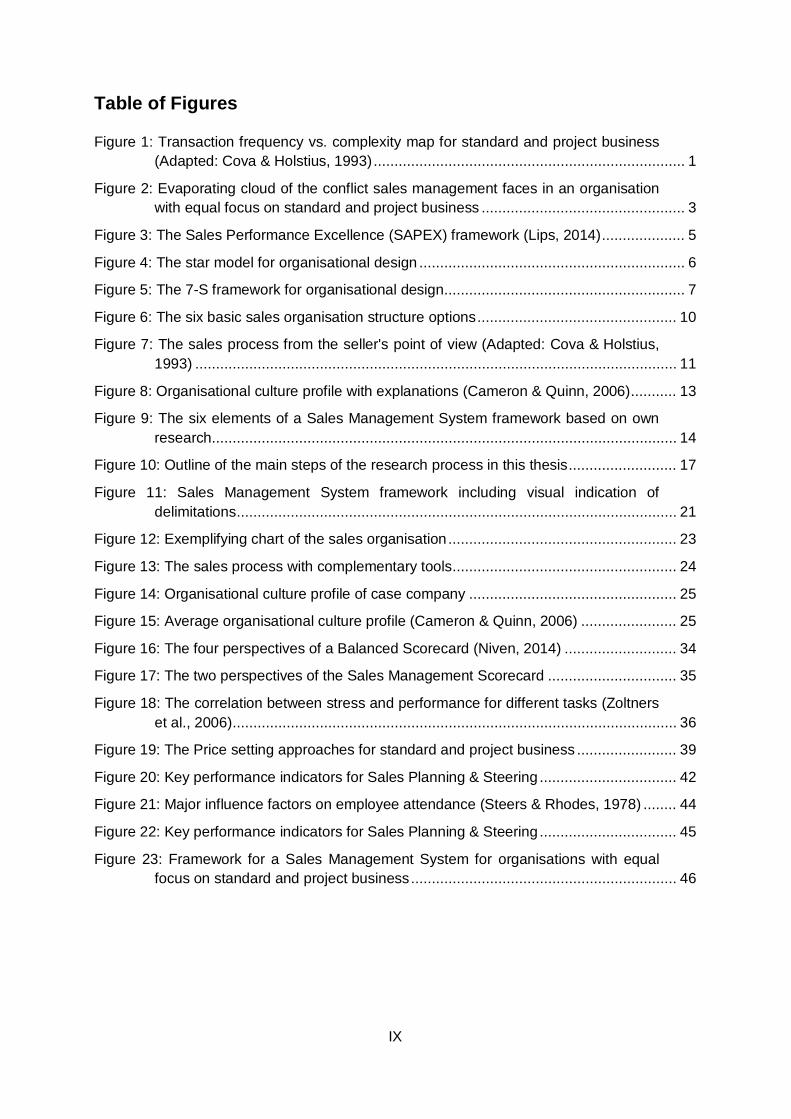
Table of Figures
Figure 1: Transaction frequency vs. complexity map for standard and project business (Adapted: Cova & Holstius, 1993) ........................................................................... 1
Figure 2: Evaporating cloud of the conflict sales management faces in an organisation with equal focus on standard and project business ................................................. 3
Figure 3: The Sales Performance Excellence (SAPEX) framework (Lips, 2014) .................... 5
Figure 4: The star model for organisational design ................................................................ 6
Figure 5: The 7-S framework for organisational design .......................................................... 7
Figure 6: The six basic sales organisation structure options ................................................ 10
Figure 7: The sales process from the seller's point of view (Adapted: Cova & Holstius, 1993) .................................................................................................................... 11
Figure 8: Organisational culture profile with explanations (Cameron & Quinn, 2006) ........... 13
Figure 9: The six elements of a Sales Management System framework based on own research ................................................................................................................ 14
Figure 10: Outline of the main steps of the research process in this thesis .......................... 17
Figure 11: Sales Management System framework including visual indication of delimitations .......................................................................................................... 21
Figure 12: Exemplifying chart of the sales organisation ....................................................... 23
Figure 13: The sales process with complementary tools ...................................................... 24
Figure 14: Organisational culture profile of case company .................................................. 25
Figure 15: Average organisational culture profile (Cameron & Quinn, 2006) ....................... 25
Figure 16: The four perspectives of a Balanced Scorecard (Niven, 2014) ........................... 34
Figure 17: The two perspectives of the Sales Management Scorecard ............................... 35
Figure 18: The correlation between stress and performance for different tasks (Zoltners et al., 2006) ........................................................................................................... 36
Figure 19: The Price setting approaches for standard and project business ........................ 39
Figure 20: Key performance indicators for Sales Planning & Steering ................................. 42
Figure 21: Major influence factors on employee attendance (Steers & Rhodes, 1978) ........ 44
Figure 22: Key performance indicators for Sales Planning & Steering ................................. 45
Figure 23: Framework for a Sales Management System for organisations with equal focus on standard and project business ................................................................ 46
X
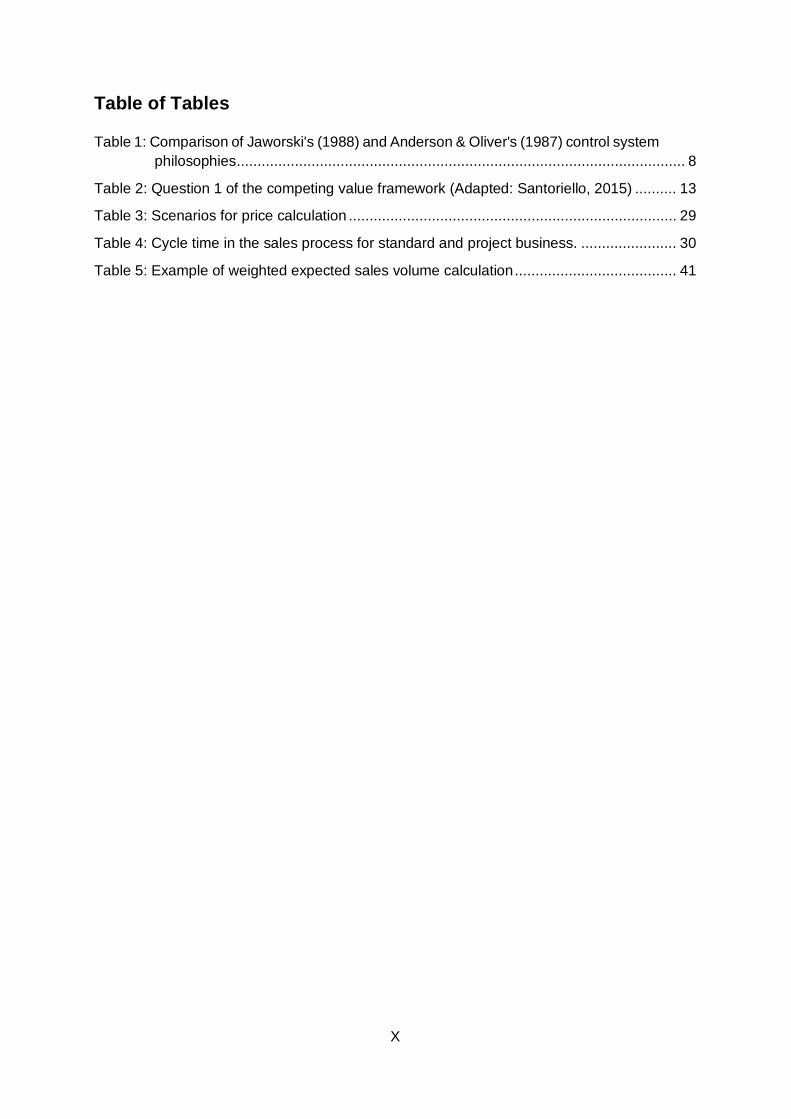
Table of Tables
Table 1: Comparison of Jaworski's (1988) and Anderson & Oliver's (1987) control system philosophies ............................................................................................................ 8
Table 2: Question 1 of the competing value framework (Adapted: Santoriello, 2015) .......... 13
Table 3: Scenarios for price calculation ............................................................................... 29
Table 4: Cycle time in the sales process for standard and project business. ....................... 30
Table 5: Example of weighted expected sales volume calculation ....................................... 41
1
1 Introduction
Since the 1990s, the importance of project business for organisations has increased, becom-ing a cornerstone of internationalisation and growth (Cova & Holstius, 1993). Many research-ers have pointed out the problem that the research on sales management is limited to tradi-tional standard business and does not account for the differences in project business (Bansard, Cova, & Salle, 1993; Cova & Holstius, 1993).
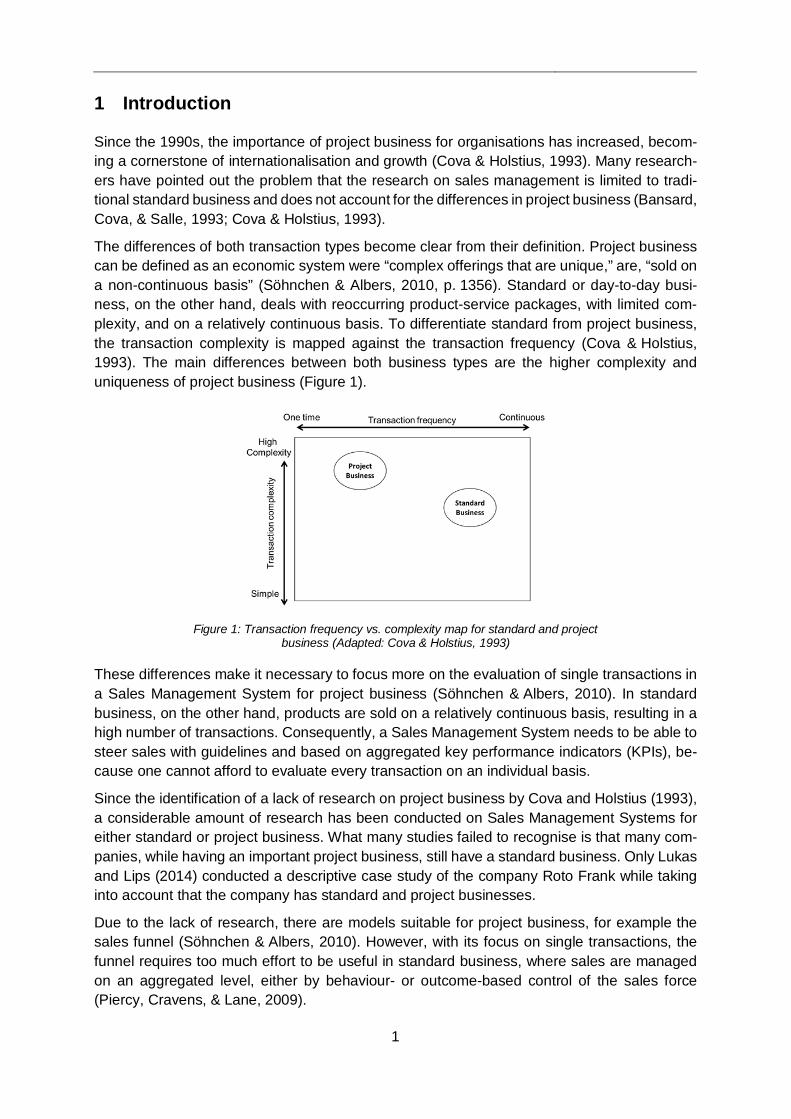
The differences of both transaction types become clear from their definition. Project business can be defined as an economic system were “complex offerings that are unique,” are, “sold on a non-continuous basis” (Söhnchen & Albers, 2010, p. 1356). Standard or day-to-day busi-ness, on the other hand, deals with reoccurring product-service packages, with limited com-plexity, and on a relatively continuous basis. To differentiate standard from project business, the transaction complexity is mapped against the transaction frequency (Cova & Holstius, 1993). The main differences between both business types are the higher complexity and uniqueness of project business (Figure 1).
Figure 1: Transaction frequency vs. complexity map for standard and project
business (Adapted: Cova & Holstius, 1993)
These differences make it necessary to focus more on the evaluation of single transactions in a Sales Management System for project business (Söhnchen & Albers, 2010). In standard business, on the other hand, products are sold on a relatively continuous basis, resulting in a high number of transactions. Consequently, a Sales Management System needs to be able to steer sales with guidelines and based on aggregated key performance indicators (KPIs), be-cause one cannot afford to evaluate every transaction on an individual basis.
Since the identification of a lack of research on project business by Cova and Holstius (1993), a considerable amount of research has been conducted on Sales Management Systems for either standard or project business. What many studies failed to recognise is that many com-panies, while having an important project business, still have a standard business. Only Lukas and Lips (2014) conducted a descriptive case study of the company Roto Frank while taking into account that the company has standard and project businesses.
Due to the lack of research, there are models suitable for project business, for example the sales funnel (Söhnchen & Albers, 2010). However, with its focus on single transactions, the funnel requires too much effort to be useful in standard business, where sales are managed on an aggregated level, either by behaviour- or outcome-based control of the sales force (Piercy, Cravens, & Lane, 2009).

2
The lack of research is relevant, because “sales managers today face rapidly changing and increasingly complex selling environments and the need for updated conceptual frameworks, models, and tools to address their decision problems is pressing” (Albers & Mantrala, 2008, p. 164). Furthermore, sales is typically the most expensive department but can at the same time be the driver of competitive advantage and improvement (Dannenberg & Zupancic, 2009).
A second aspect of the problem is seen in the industry. As a result of the importance of project business increasing in recent years (Cova & Holstius, 1993), many organisations are nowa-days involved in project business but merely adapted their Sales Management System for standard business. This causes several problems, exemplified by the case of LESER GmbH & Co. KG (hereafter LESER), a German manufacturer of safety valves.
1.1 LESER – The case company LESER is changing from handling mostly standard business to a project-orientated organisa-tion. Some years ago, single orders with low complexity and single order volume accounted for 95% of the revenue, whereas now project orders account for most of the growth and already 30% of the revenue. This shift in focus poses many management challenges, and one of those is to find KPIs that enable management to monitor the day-to-day business in an efficient way (aggregated control and planning on a macro level), but at the same time enable the effective management of the project business (control and planning on a micro level).
Nowadays, the dominating control parameter for LESER’s sales management is the discount, based on the traditional focus on standard business. Discount, as the main steering parameter, enables the sales force to give different customers different discount levels, based on certain guidelines provided by management.
Furthermore, the products in project business become more unique, meaning that there is a higher share of design to order (DTO) product features. DTO features are those product ele-ments that are designed and produced for an order. For these features, no list price exists because they are only created for the specific transaction. Thus, giving a discount on the list price is not a suitable steering tool anymore. A cost of goods sold (COGS) calculation is nec-essary to determine the price in a bottom-up approach to avoid accepting orders with too low margins, despite for strategic reasons. With the company’s focus on both standard and project business, as well as discount as steering parameter, several other significant problems arise:
• The company’s planning process is based on a yearly forecast for every country. This forecast plus the target discount for the country is used to calculate a gross sales fore-cast, which in turn is used to plan production capabilities. Not using discounts in the project business makes this planning process impossible.
• The company’s COGS calculation process is not standardised, and the enterprise-re-source-planning system (SAP in this case) is only designed for price setting based on discounts. This makes it a struggle to generate prices in the project business. The re-sults are different approaches from time-to-time and person-to-person, not providing comparability between offers.
• Often the margin is uncertain in the offer processes due to the not standardised COGS calculation. Furthermore, the company tends to make aggressive price commitments in project business, often without knowing their own positioning in the market and the target price. These two factors, unawareness of their own margin and aggressive price commitments leads to a creeping reduction of margins.
3
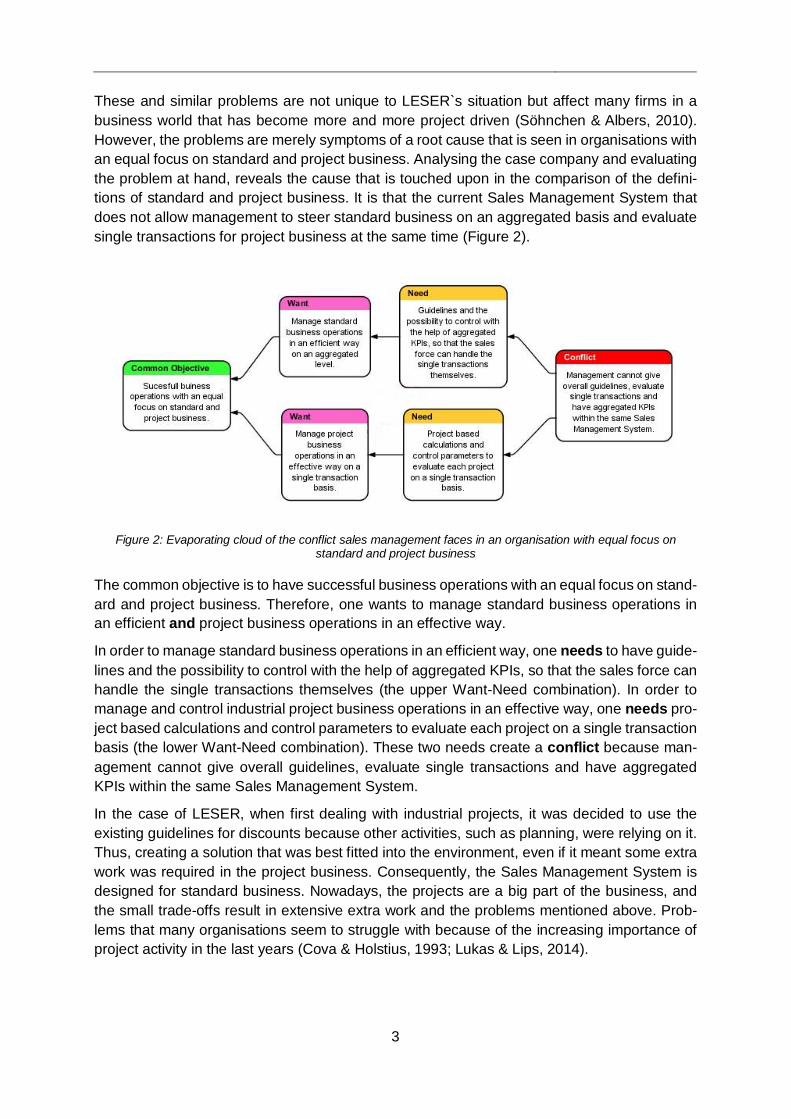
These and similar problems are not unique to LESER`s situation but affect many firms in a business world that has become more and more project driven (Söhnchen & Albers, 2010). However, the problems are merely symptoms of a root cause that is seen in organisations with an equal focus on standard and project business. Analysing the case company and evaluating the problem at hand, reveals the cause that is touched upon in the comparison of the defini-tions of standard and project business. It is that the current Sales Management System that does not allow management to steer standard business on an aggregated basis and evaluate single transactions for project business at the same time (Figure 2).
Figure 2: Evaporating cloud of the conflict sales management faces in an organisation with equal focus on
standard and project business
The common objective is to have successful business operations with an equal focus on stand-ard and project business. Therefore, one wants to manage standard business operations in an efficient and project business operations in an effective way.
In order to manage standard business operations in an efficient way, one needs to have guide-lines and the possibility to control with the help of aggregated KPIs, so that the sales force can handle the single transactions themselves (the upper Want-Need combination). In order to manage and control industrial project business operations in an effective way, one needs pro-ject based calculations and control parameters to evaluate each project on a single transaction basis (the lower Want-Need combination). These two needs create a conflict because man-agement cannot give overall guidelines, evaluate single transactions and have aggregated KPIs within the same Sales Management System.
In the case of LESER, when first dealing with industrial projects, it was decided to use the existing guidelines for discounts because other activities, such as planning, were relying on it. Thus, creating a solution that was best fitted into the environment, even if it meant some extra work was required in the project business. Consequently, the Sales Management System is designed for standard business. Nowadays, the projects are a big part of the business, and the small trade-offs result in extensive extra work and the problems mentioned above. Prob-lems that many organisations seem to struggle with because of the increasing importance of project activity in the last years (Cova & Holstius, 1993; Lukas & Lips, 2014).

4
1.2 Purpose and outline of the report Therefore, this thesis proposes a framework for sales management in situations where stand-ard and project business are equally important. This framework aims to provide organisations that have an equal focus on standard and project business with a Sales Management System that enables them to manage both business types at the same time.
The remainder of this paper is divided into eight chapters. First, the relevant theory about ele-ments of a Sales Management System is presented in chapter 2. Then, the research questions to guide the remainder of the thesis and achieve its purpose are formulated in chapter 3. Chap-ter 4 elaborates on the methodology chosen to answer the research questions. Afterwards, the case is described in detail in chapter 5 to increase the transferability of the research and lay the basis for the analysis of requirements to a Sales Management System with an equal focus on standard and project business in chapter 6. The list of requirements is then used to design the framework for the Sales Management System in chapter 7. Finally, the research is discussed and concluded in the last two chapters.
5
2 Elements of a Sales Management System
The following chapter explores the literature and establishes the current knowledge within the field of Sales Management Systems. First, a general understanding as to what elements com-pose a Sales Management System is achieved, to be able to direct research activity to specific elements of the Sales Management System. Then the different elements are studied in detail. This research identifies six main elements of a Sales Management System:
• Sales Force Management • Sales Strategy • Sales Organisation • Sales Processes • Sales Planning & Steering • Culture
These elements are reoccurring in sales controlling- (Kesten & Lühn, 2012), sales perfor-mance- (Lips, 2014) and general organisational design literature (Galbraith, 2014; Waterman, Peters, & Phillips, 1980). Although different sources have different focuses, all authors agree upon the interdependence of all elements and that the system elements need to be aligned to achieve optimal performance (Lips, 2014).
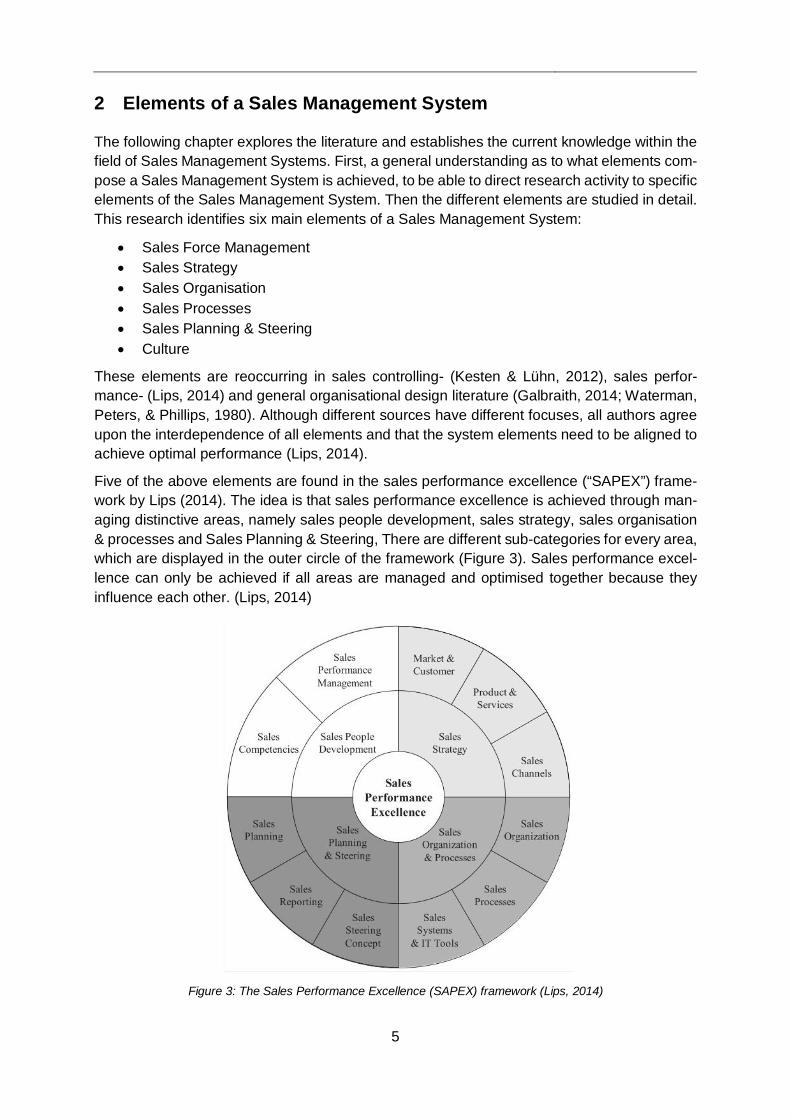
Five of the above elements are found in the sales performance excellence (“SAPEX”) frame-work by Lips (2014). The idea is that sales performance excellence is achieved through man-aging distinctive areas, namely sales people development, sales strategy, sales organisation & processes and Sales Planning & Steering, There are different sub-categories for every area, which are displayed in the outer circle of the framework (Figure 3). Sales performance excel-lence can only be achieved if all areas are managed and optimised together because they influence each other. (Lips, 2014)
Figure 3: The Sales Performance Excellence (SAPEX) framework (Lips, 2014)
6
The inner circle of the framework displays the four main categories, while the outer circle dis-tinguishes further. Thus, one can read every part of the diagram as follows: “In order to achieve sales performance excellence the sales people need to be developed, through developing of sales competencies.” The alignment between the distinct parts of the model is crucial, because of the earlier mentioned interdependencies. For example, an organisation with detailed pro-cesses requires another set of competencies when compared to an organisation without ma-ture processes. (Lips, 2014)
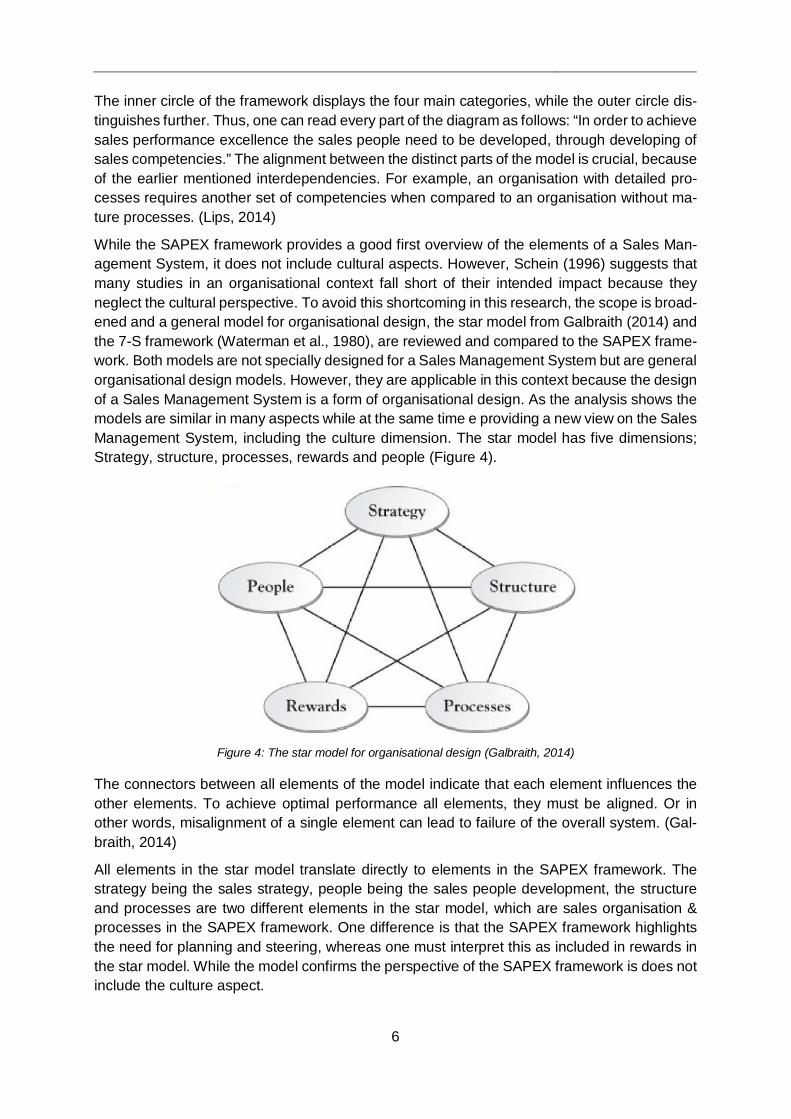
While the SAPEX framework provides a good first overview of the elements of a Sales Man-agement System, it does not include cultural aspects. However, Schein (1996) suggests that many studies in an organisational context fall short of their intended impact because they neglect the cultural perspective. To avoid this shortcoming in this research, the scope is broad-ened and a general model for organisational design, the star model from Galbraith (2014) and the 7-S framework (Waterman et al., 1980), are reviewed and compared to the SAPEX frame-work. Both models are not specially designed for a Sales Management System but are general organisational design models. However, they are applicable in this context because the design of a Sales Management System is a form of organisational design. As the analysis shows the models are similar in many aspects while at the same time e providing a new view on the Sales Management System, including the culture dimension. The star model has five dimensions; Strategy, structure, processes, rewards and people (Figure 4).
Figure 4: The star model for organisational design (Galbraith, 2014)
The connectors between all elements of the model indicate that each element influences the other elements. To achieve optimal performance all elements, they must be aligned. Or in other words, misalignment of a single element can lead to failure of the overall system. (Gal-braith, 2014)
All elements in the star model translate directly to elements in the SAPEX framework. The strategy being the sales strategy, people being the sales people development, the structure and processes are two different elements in the star model, which are sales organisation & processes in the SAPEX framework. One difference is that the SAPEX framework highlights the need for planning and steering, whereas one must interpret this as included in rewards in the star model. While the model confirms the perspective of the SAPEX framework is does not include the culture aspect.
7
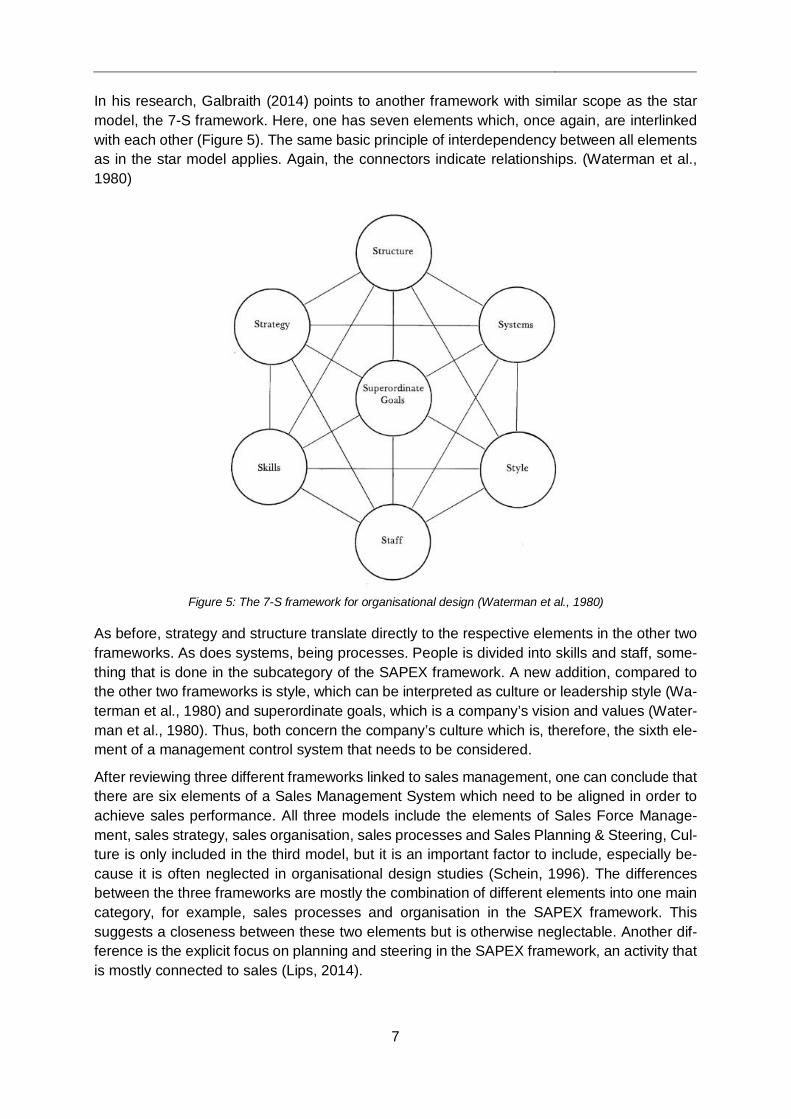
In his research, Galbraith (2014) points to another framework with similar scope as the star model, the 7-S framework. Here, one has seven elements which, once again, are interlinked with each other (Figure 5). The same basic principle of interdependency between all elements as in the star model applies. Again, the connectors indicate relationships. (Waterman et al., 1980)
Figure 5: The 7-S framework for organisational design (Waterman et al., 1980)
As before, strategy and structure translate directly to the respective elements in the other two frameworks. As does systems, being processes. People is divided into skills and staff, some-thing that is done in the subcategory of the SAPEX framework. A new addition, compared to the other two frameworks is style, which can be interpreted as culture or leadership style (Wa-terman et al., 1980) and superordinate goals, which is a company’s vision and values (Water-man et al., 1980). Thus, both concern the company’s culture which is, therefore, the sixth ele-ment of a management control system that needs to be considered.
After reviewing three different frameworks linked to sales management, one can conclude that there are six elements of a Sales Management System which need to be aligned in order to achieve sales performance. All three models include the elements of Sales Force Manage-ment, sales strategy, sales organisation, sales processes and Sales Planning & Steering, Cul-ture is only included in the third model, but it is an important factor to include, especially be-cause it is often neglected in organisational design studies (Schein, 1996). The differences between the three frameworks are mostly the combination of different elements into one main category, for example, sales processes and organisation in the SAPEX framework. This suggests a closeness between these two elements but is otherwise neglectable. Another dif-ference is the explicit focus on planning and steering in the SAPEX framework, an activity that is mostly connected to sales (Lips, 2014).
8
The following subchapters present, in short, the current state of research in each of the six areas of a Sales Management System. This allows a better understanding of the areas, through defining them and giving insight into what frameworks can be used to describe the status quo in the case description in chapter 5.
2.1 Sales Force Management One can identify two different philosophies within the Sales Force Management literature (Mül-ler, 2009). The first is the concept of Anderson and Oliver (1987), who distinguish behaviour-based and outcome-based control. Outcome-based control systems make the sales force ac-countable to achieve predefined goals, e.g. margin or revenue while giving a free hand to the way these goals are achieved. Behaviour-based control systems, on the other hand, focus on the behaviour of the sales force, setting behaviour goals, such as the number of customer visits. (Anderson & Oliver, 1987)
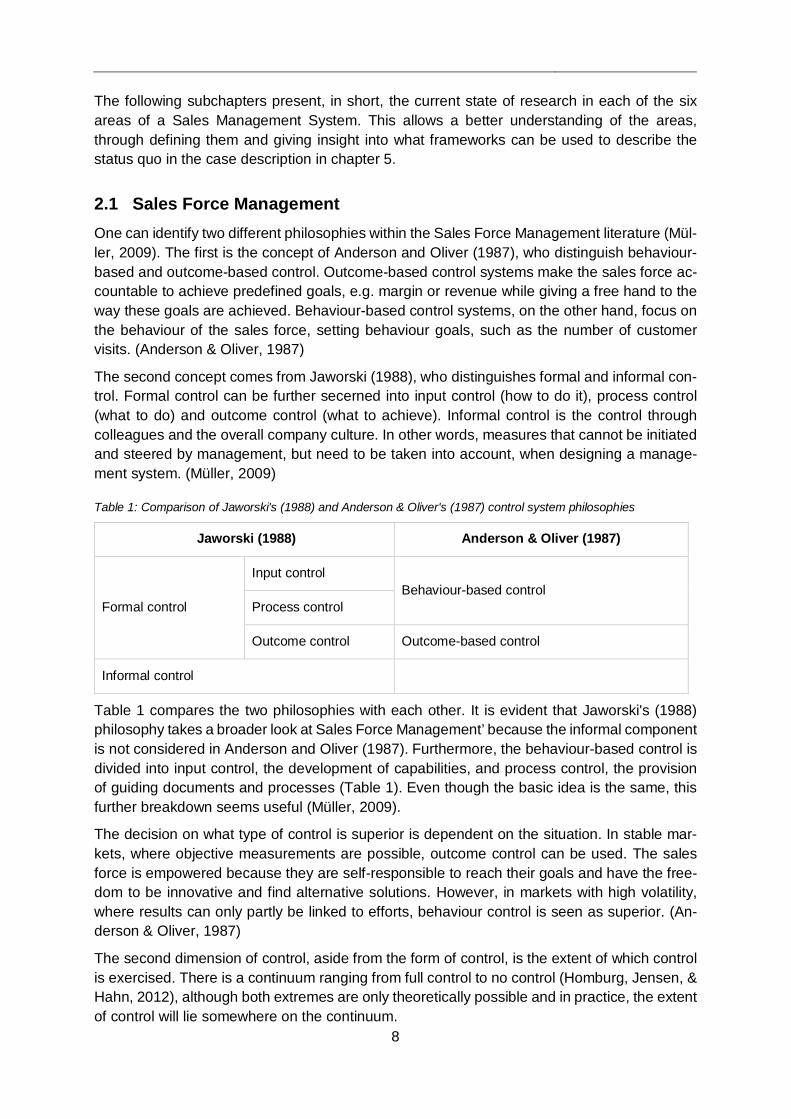
The second concept comes from Jaworski (1988), who distinguishes formal and informal con-trol. Formal control can be further secerned into input control (how to do it), process control (what to do) and outcome control (what to achieve). Informal control is the control through colleagues and the overall company culture. In other words, measures that cannot be initiated and steered by management, but need to be taken into account, when designing a manage-ment system. (Müller, 2009)
Jaworski (1988) Anderson & Oliver (1987)
Formal control
Input control Behaviour-based control
Process control
Outcome control Outcome-based control
Informal control
Table 1 compares the two philosophies with each other. It is evident that Jaworski's (1988) philosophy takes a broader look at Sales Force Management’ because the informal component is not considered in Anderson and Oliver (1987). Furthermore, the behaviour-based control is divided into input control, the development of capabilities, and process control, the provision of guiding documents and processes (Table 1). Even though the basic idea is the same, this further breakdown seems useful (Müller, 2009).
The decision on what type of control is superior is dependent on the situation. In stable mar-kets, where objective measurements are possible, outcome control can be used. The sales force is empowered because they are self-responsible to reach their goals and have the free-dom to be innovative and find alternative solutions. However, in markets with high volatility, where results can only partly be linked to efforts, behaviour control is seen as superior. (An-derson & Oliver, 1987)
The second dimension of control, aside from the form of control, is the extent of which control is exercised. There is a continuum ranging from full control to no control (Homburg, Jensen, & Hahn, 2012), although both extremes are only theoretically possible and in practice, the extent of control will lie somewhere on the continuum.
Table 1: Comparison of Jaworski's (1988) and Anderson & Oliver's (1987) control system philosophies
9
The research on the optimal extent of control is contradictory. On the one hand, there are studies, which argue for more control instead of less (Baldauf, Piercy, & Cravens, 2005). On the other hand, a tight control is seen to be counterproductive, because the tacit knowledge, or intuition, of sales personnel, cannot be replaced by guidelines given from management (Homburg, Jensen et al., 2012). A way to combine the contradicting views on the extent of control is a tight-loose control system, which leaves the employees freedom in operational decisions and relies on guiding values throughout the sales force (Merchant & van der Stede, 2007). Relating back to Jaworski's (1988) philosophy, the informal control through culture is tight, while the formal control through management is loose. However, since informal control cannot directly be influenced by management, this type of control system cannot be forced on any organisation, but needs to be customised and can only work when the culture allows it. (Jaworski, 1988)
At least for pricing decisions, there seems to be an inverted U-shaped correlation between sales force performance and management control. Empowering the employees is beneficial up to a certain threshold before disadvantages offset positive effects (Homburg, Jensen et al., 2012). An explanation is that the salespeople have better knowledge of the customers than top management. Therefore, it is advantageous to empower them with price decisions. How-ever, the bigger the price decisions become, the more important it is to focus on the overall company performance, an area where top management has more knowledge. Thus, the U-shaped correlation (Homburg, Jensen et al., 2012). One can hypothesise that this inverted U-shaped correlation is also applicable for other types of control, but it is not addressed in their research.
2.2 Sales Strategy “Sales strategy is the planning of sales activities: methods of reaching clients, competitive dif-ferences and resources available” (Srivastava, Run, & Fam, 2008, p. 16). There is research that suggests a weak link between strategy and sales person performance (Baldauf, Piercy, & Cravens, 2011). However, this study takes the overall strategy into account and not the more specific sales strategy. To assure sales performance, it is important to align the Sales Man-agement System to the sales strategy (Albers & Mantrala, 2008; Lips, 2014). To define a sales strategy one has to define the target market or customers; the offered product-service package and the choice of sales channels (Lips, 2014). The 4P model, consisting of product, price, promotion and place, can be used to analyse the sales strategy (Pizam, 2011).
The product is a physical object or a service that the company offers to fulfil the customer needs. The product is the central part of the sales strategy since this is what can differentiate the company from their competitors by providing a unique feature. The product offer includes factors around the core product like quality, design, brand, packaging or other features. This product offer can then be augmented with benefits and services, for example, guarantees, installation and services after the sale. (Khan, 2014)
Price is the value of the product and what the customers pay to purchase the product and its benefits. Price is a key factor in the sales strategy and can influence the customer's buying behaviour. To provide customer satisfaction, one has to balance the price and offered product-service package. (Khan, 2014)
Promotion describes the methods of reaching clients (Srivastava et al., 2008). It is the com-munication with the customer, the advertising, selling, relation and marketing that makes the
10
customer aware of the product-service package. This is the part of the sales strategy that can influence the customer's way of thinking and behaviour. The promotion will give customers information about the attractive product attributes that the company offers and can make the customer take action and purchase the product. (Khan, 2014)
Finally, the place is the location where the product is offered or the channels through which the product is distributed. The company should carefully choose their distribution system, so the customer easily finds the product, availability of many channels will make the product ac-cessible. (Khan, 2014) The setup of the channels influences the sales organisation, which is described in the next subchapter.
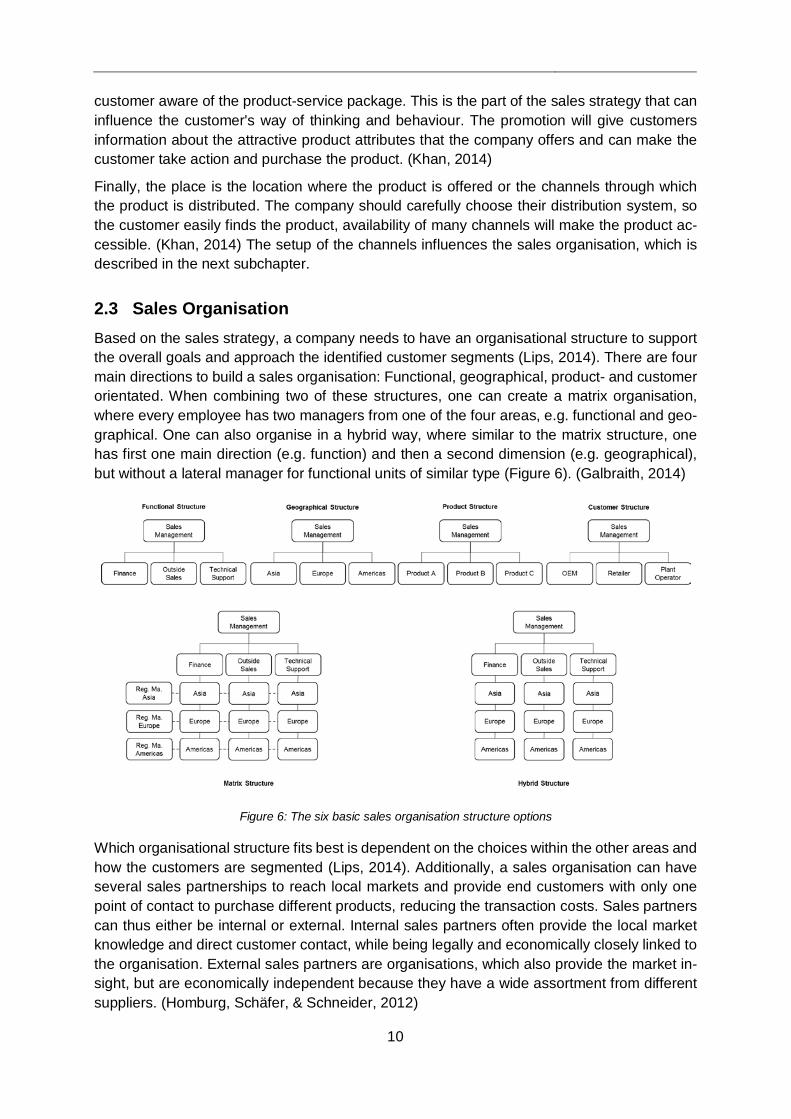
2.3 Sales Organisation Based on the sales strategy, a company needs to have an organisational structure to support the overall goals and approach the identified customer segments (Lips, 2014). There are four main directions to build a sales organisation: Functional, geographical, product- and customer orientated. When combining two of these structures, one can create a matrix organisation, where every employee has two managers from one of the four areas, e.g. functional and geo-graphical. One can also organise in a hybrid way, where similar to the matrix structure, one has first one main direction (e.g. function) and then a second dimension (e.g. geographical), but without a lateral manager for functional units of similar type (Figure 6). (Galbraith, 2014)
Figure 6: The six basic sales organisation structure options
Which organisational structure fits best is dependent on the choices within the other areas and how the customers are segmented (Lips, 2014). Additionally, a sales organisation can have several sales partnerships to reach local markets and provide end customers with only one point of contact to purchase different products, reducing the transaction costs. Sales partners can thus either be internal or external. Internal sales partners often provide the local market knowledge and direct customer contact, while being legally and economically closely linked to the organisation. External sales partners are organisations, which also provide the market in-sight, but are economically independent because they have a wide assortment from different suppliers. (Homburg, Schäfer, & Schneider, 2012)
11
Inside the internal sales organisation, a general trend in the industry is to create “Sales Excel-lence Teams“ as supporting units, which drive the development of centralised processes and try to reduce complexity in the sales organisation (Lips, 2014, p. 239). This leads to the next element of a Sales Management System, the sales processes.
2.4 Sales Processes In the SAPEX framework, sales organisation and processes are one element (Lips, 2014). One reason for this close correlation is that „if structure is thought of as the anatomy of the organisation, processes are its physiology or functioning” (Galbraith, 2014, p. 14). Thus, one cannot work without the other, much like a skeleton needs the nervous and muscles system to move.
There are two types of processes, vertical and horizontal. Vertical processes are the collection of data from different organisational units and the usage of this data to make informed deci-sions about resources, budgeting or measurements to affect sales. Horizontal processes are organised around the workflow to fulfil the customers’ requirements. (Galbraith, 2009)
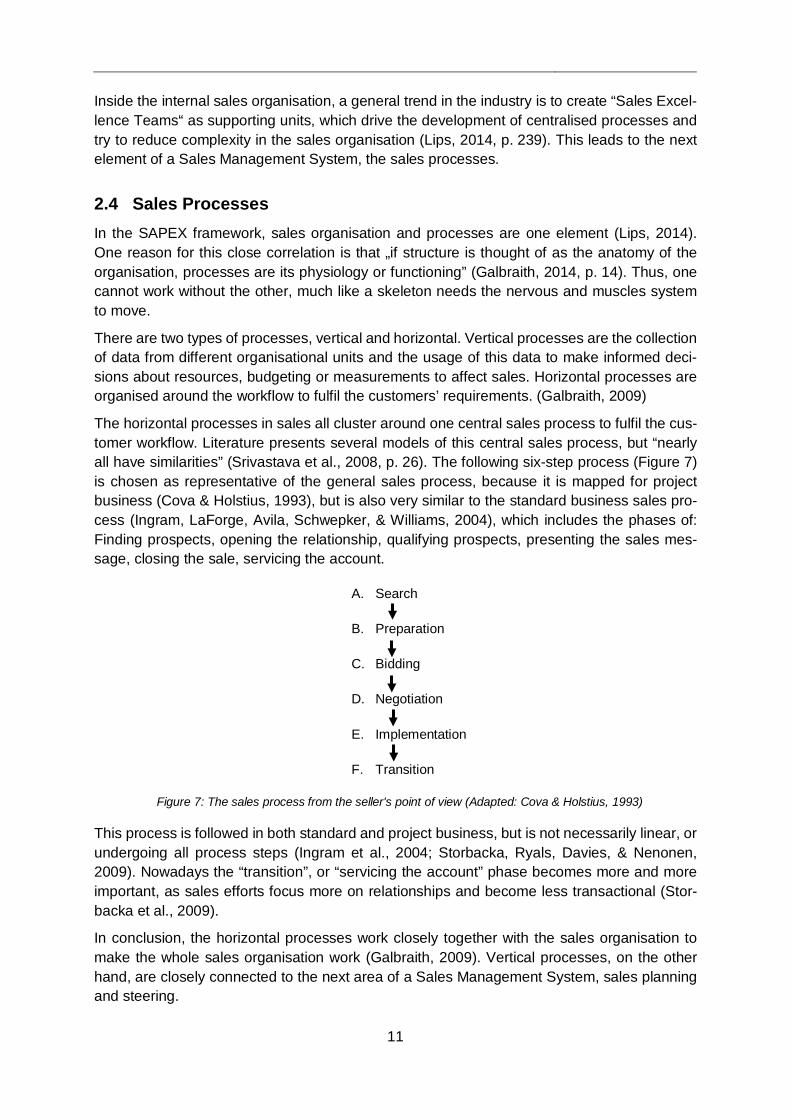
The horizontal processes in sales all cluster around one central sales process to fulfil the cus-tomer workflow. Literature presents several models of this central sales process, but “nearly all have similarities” (Srivastava et al., 2008, p. 26). The following six-step process (Figure 7) is chosen as representative of the general sales process, because it is mapped for project business (Cova & Holstius, 1993), but is also very similar to the standard business sales pro-cess (Ingram, LaForge, Avila, Schwepker, & Williams, 2004), which includes the phases of: Finding prospects, opening the relationship, qualifying prospects, presenting the sales mes-sage, closing the sale, servicing the account.
A. Search
B. Preparation
C. Bidding
D. Negotiation
E. Implementation
F. Transition
This process is followed in both standard and project business, but is not necessarily linear, or undergoing all process steps (Ingram et al., 2004; Storbacka, Ryals, Davies, & Nenonen, 2009). Nowadays the “transition”, or “servicing the account” phase becomes more and more important, as sales efforts focus more on relationships and become less transactional (Stor-backa et al., 2009).
In conclusion, the horizontal processes work closely together with the sales organisation to make the whole sales organisation work (Galbraith, 2009). Vertical processes, on the other hand, are closely connected to the next area of a Sales Management System, sales planning and steering.
Figure 7: The sales process from the seller's point of view (Adapted: Cova & Holstius, 1993)
12
2.5 Sales Planning & Steering The Sales Planning & Steering element can be divided into three subcategories: Planning, reporting and steering concept. Thus, it includes the decisions what and how to measure KPIs, how they are reported, what the expected level of the KPIs is and how to use them to steer sales. The expression sales controlling is often used as a synonym to the above-described decision complex. (Lips, 2014)
Sales controlling literature suggests using the balanced scorecard for sales planning and steer-ing, with indicators in the four dimensions of finance, customer, processes and learning (Kes-ten & Lühn, 2012). Not only having financial, but also soft measurements is supported by stud-ies in connection with the sales excellence framework from section 2. Lukas and Lips (2014) point out that companies with both measurement dimensions tend to be successful. However, even though it seems obvious to have such a controlling setup, it is not consequently imple-mented in all Sales Management Systems studied (Lukas & Lips, 2014).
The Sales Planning & Steering system needs to be carefully aligned with all other elements of the Sales Management System, especially in multinational sales organisations, because it ul-timately affects the bottom line priorities of the sales force (Lips, 2014). With regard to project business, sales quotas can lead to pursuing projects for too long, even though earlier indicators show that a project will likely be won by competition. Similarly, a planning and steering system based on revenue leads to the maximisation of revenues, but decrease of margins. (Söhnchen & Albers, 2010) Therefore, a Sales Planning & Steering system needs to be aligned with all other areas of the Sales Management System, to avoid for example having a strategy that focuses on margin maximisation, but having a steering system that leads to margin decrease. The design of the appropriate Sales Planning & Steering system is one of the core elements of the proposed Sales Management System in this thesis.
2.6 Culture Culture is one of the aspects not included in the SAPEX framework, but taken from the 7-s model. Organisational culture can be defined as “a pattern of shared basic assumptions that was learned by a group as it solved its problems of external adaptation and internal integration, that has worked well enough to be considered valid and, therefore, to be taught to new mem-bers as the correct way to perceive, think, and feel in relation to those problems” (Schein, 2004, p. 17).
Scott, Mannion, Davies and Marshall (2003) conducted a literature review of different models to assess organisational culture in a health care context and find that the Competing Values Framework (CVF) seems best fitted to easily assess the culture of an organisational group. The framework is also applicable outside of a healthcare context (Santoriello, 2015) Its relia-bility is supported by a “strong theoretical basis” (Scott et al., 2003, p. 930).
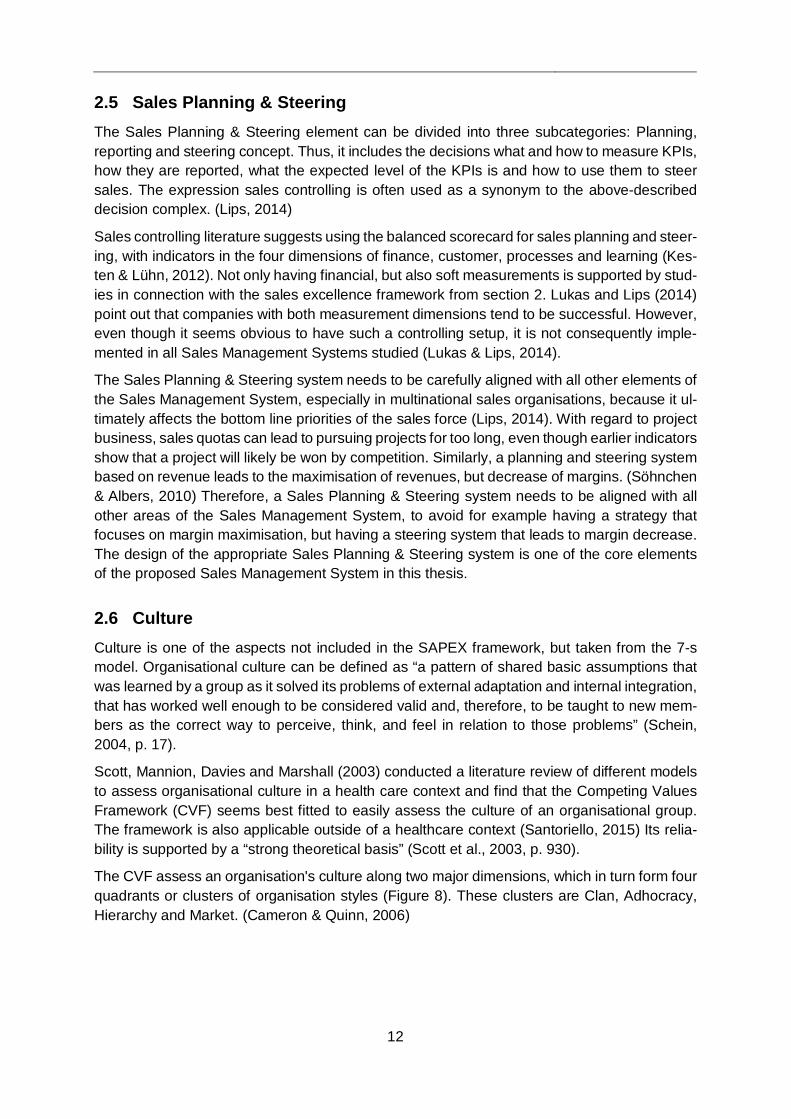
The CVF assess an organisation's culture along two major dimensions, which in turn form four quadrants or clusters of organisation styles (Figure 8). These clusters are Clan, Adhocracy, Hierarchy and Market. (Cameron & Quinn, 2006)
13
The above figure represents the final assessment diagram including the four dimensions. The meaning of each dimension is shortly explained afterwards. A longer description of each type is included in Appendix 1.
Clan culture is a culture form where the organisation “focuses on internal maintenance with flexibility, concern for people, and sensitivity to customers”.
Adhocracy culture is a culture form where the organisation “focuses on external positioning with a high degree of flexibility and individuality”.
Market culture is a culture form where the organisation “focuses on external positioning with a need for stability and control”.
Hierarchy culture is a culture form where the organisation “focuses on internal maintenance with a need for stability and control”. (Cameron & Quinn, 2006, p. 67)
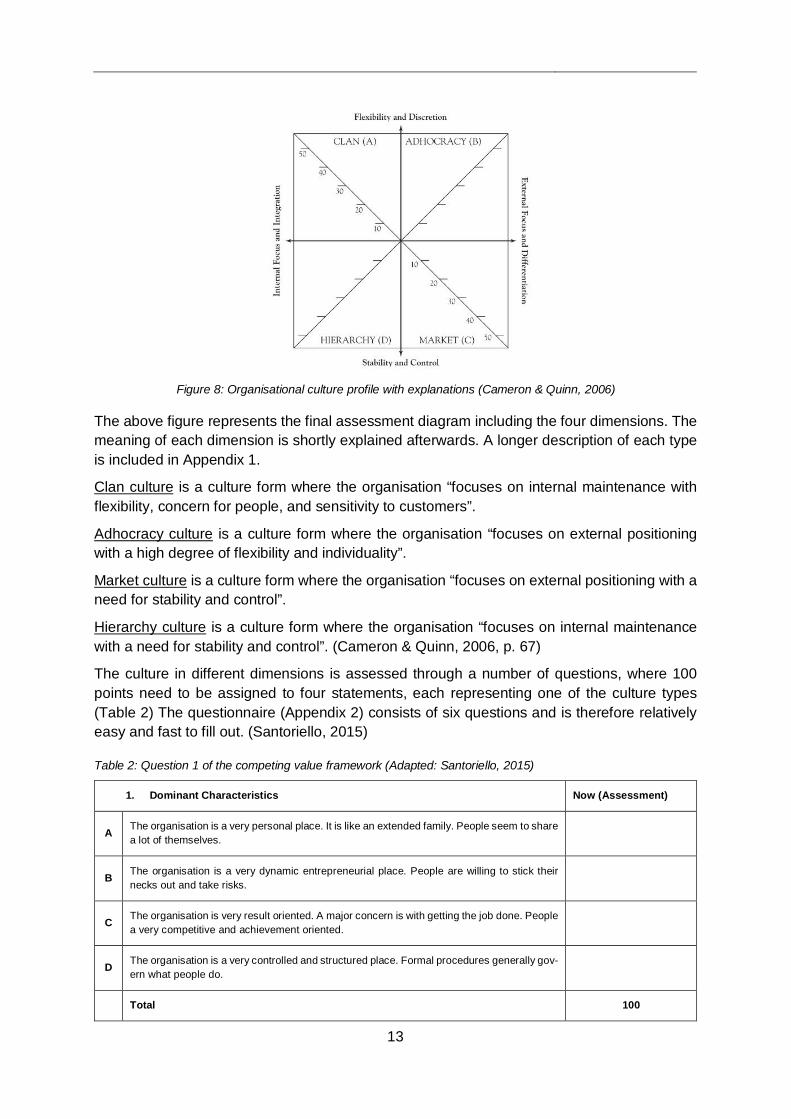
The culture in different dimensions is assessed through a number of questions, where 100 points need to be assigned to four statements, each representing one of the culture types (Table 2) The questionnaire (Appendix 2) consists of six questions and is therefore relatively easy and fast to fill out. (Santoriello, 2015)
1. Dominant Characteristics Now (Assessment)
A The organisation is a very personal place. It is like an extended family. People seem to share a lot of themselves.
B The organisation is a very dynamic entrepreneurial place. People are willing to stick their necks out and take risks.
C The organisation is very result oriented. A major concern is with getting the job done. People a very competitive and achievement oriented.
D The organisation is a very controlled and structured place. Formal procedures generally gov-ern what people do.
Total 100
Figure 8: Organisational culture profile with explanations (Cameron & Quinn, 2006)
Table 2: Question 1 of the competing value framework (Adapted: Santoriello, 2015)
14
Each of these cultures can to some degree be present in an organisation, but the highest scoring clusters tend to indicate the culture that is emphasised most in the studied organisation (Cameron & Quinn, 2006).
One major problem with the assessment of organisational culture is that individuals tend not to share their “private beliefs and opinions” in qualitative studies and with unknown researchers (Scott et al., 2003, p. 939). Therefore, measures have to be taken to identify the real culture and not only the culture the sales force might expect their leaders to have. This can be done using multiple methods, connecting on a personal level with the participants or clearly show that one has no hidden agenda. (Scott et al., 2003)
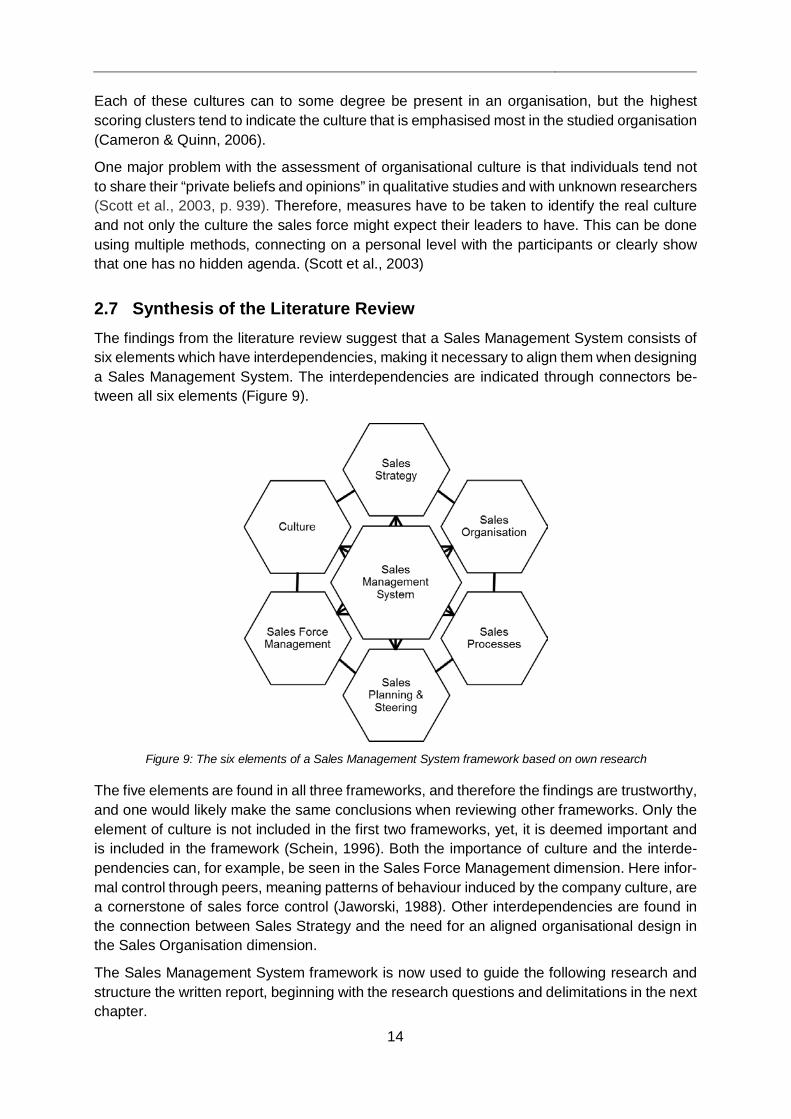
2.7 Synthesis of the Literature Review The findings from the literature review suggest that a Sales Management System consists of six elements which have interdependencies, making it necessary to align them when designing a Sales Management System. The interdependencies are indicated through connectors be-tween all six elements (Figure 9).
The five elements are found in all three frameworks, and therefore the findings are trustworthy, and one would likely make the same conclusions when reviewing other frameworks. Only the element of culture is not included in the first two frameworks, yet, it is deemed important and is included in the framework (Schein, 1996). Both the importance of culture and the interde-pendencies can, for example, be seen in the Sales Force Management dimension. Here infor-mal control through peers, meaning patterns of behaviour induced by the company culture, are a cornerstone of sales force control (Jaworski, 1988). Other interdependencies are found in the connection between Sales Strategy and the need for an aligned organisational design in the Sales Organisation dimension.
The Sales Management System framework is now used to guide the following research and structure the written report, beginning with the research questions and delimitations in the next chapter.
Figure 9: The six elements of a Sales Management System framework based on own research

15
3 Research Questions & Delimitations
The following chapter discusses the research questions that result from the initial problem formulation and analysis of current literature. Furthermore, the delimitations of the research are pointed out.
3.1 Research Questions As stated earlier the purpose of this study is to develop a universally applicable approach for sales management in situations, where standard and project business are equally important. The analysis of theory shows that there are six elements of a Sales Management System, which need to be aligned and in this case optimised for the two different business situations.
Consequently, the line of research is to first define the situation at hand and analyse the re-sulting requirements for the Sales Management System with an equal focus on standard and project business. Thus, the first research question is:
(1) What requirements of a Sales Management System emerge from an equal focus on standard and project business?
One can expect a thorough case description and a list of requirements to form the answer to this question. Both the requirements and description of the general situation provide the basis to design a framework for a Sales Management System. Subsequently, answering the re-search question:
(2) How can a Sales Management System be designed to fulfil the requirements from (1) and account for an equal focus on standard and project business?
Answering the second question provides a framework for organisations to use, which have an equal focus on standard and project business.
3.2 Delimitations All elements of a Sales Management System are interdependent, resulting in a complex sys-tem. Because of these interdependencies, developing a universal framework is considerably complicated. A solution that is used in sales force optimisation is to freeze different aspects and only optimise the problem for a certain number of effects. (Albers & Mantrala, 2008) In fact, models that tried to solve “three or more direct control decisions […] have had limited success” (Albers & Mantrala, 2008, p. 167). Therefore, the design of a Sales Management System is limited to two of the six elements. The other elements are explored in the case description, but not changed. In this context, changes in the areas of sales strategy, sales organisation, sales processes and culture take the longest. Thus, the scope of this thesis is limited to the optimisation of Sales Planning & Steering and Sales Force Management, be-cause here are more operational decisions included. However, the four frozen aspects are still investigated during the study and explained in detail in chapter 5. This is necessary to increase the transferability of the research and allow to understand design decisions in later chapters, which are influenced by all six areas because of the interdependencies.
The research is designed as a case study, and therefore the framework might not be the best solution for organisations, which differ greatly from the case company. This limitation of trans-ferability or generalizability (Lincoln & Guba, 1985), is addressed in the methodology section.

16
4 Methodology
After the research questions and aims of this thesis are analysed in the previous chapter, the suitable methodology to answer the two research questions is explored. This chapter describes the research methodology of the thesis. First, the research strategy is explained in section 4.1. Section 4.2 describes the research process and how the two research questions are ad-dressed. The third section describes the analysis of data. Finally, the last two sections of this chapter describe the considerations and measures to ensure research quality and ethics.
4.1 Research Strategy and Design Research strategy can be described as the general orientation of how to conduct research (Bryman & Bell, 2015). One distinguishes qualitative and quantitative research as two main clusters in business research strategy. Quantitative research bases its conclusions on meas-urements of variables that are often decided beforehand. In qualitative research, on the other hand, the set of variables is not decided beforehand, so it allows for new phenomenon to be discovered during data analysis. (Bryman & Bell, 2015) However, in practical situations, one seldom has a pure qualitative or quantitative approach (Easterbrook, Singer, Storey, & Damian, 2008).
From the first problem description in the introduction, it became evident that not all variables are known, and the aim is instead of discovering relevant aspects of the Sales Management System during this research. Therefore, a qualitative approach was chosen as the research strategy.
Furthermore, the research approach used inductive theory and the observations from the case were generalised and augmented with literature to derive at a theory for a Sales Management System (Bryman & Bell, 2015). This means, in this case, a Sales Management System frame-work that supports an equal focus on standard and project business was the expected outcome of the conducted research.
Third, research can have four main aims: Exploratory, descriptive, explanatory, and improving (Robson, 2011; Runeson & Höst, 2009).
• Exploratory is the process of researching a situation to generate innovative ideas or hypotheses.
• Descriptive research has the purpose of describing a situation or phenomenon in all its aspects.
• Explanatory research tries to find explanations for situations. Often using cause and effect methodology.
• Improving (Emancipatory in a social context) seeks to improve the studied situation.
The first research question aimed for an exploration of the requirements for a Sales Manage-ment System for an organisation with an equal focus on standard and project business. The aim of the second research question was to find a new framework that improves the situation at hand. However, the effects of this improvement were not studied in this research; it is merely hypothesised that the new framework will improve the situation. Therefore, one can argue that the study was of improving but also of exploratory nature.
17
In conclusion, the overall research strategy of this thesis was qualitative, more specifically; it was an exploratory case study augmented with literature studies for the first and an exploratory literature study augmented with interviews for the second research question. The more de-tailed research process is described in the following chapter.
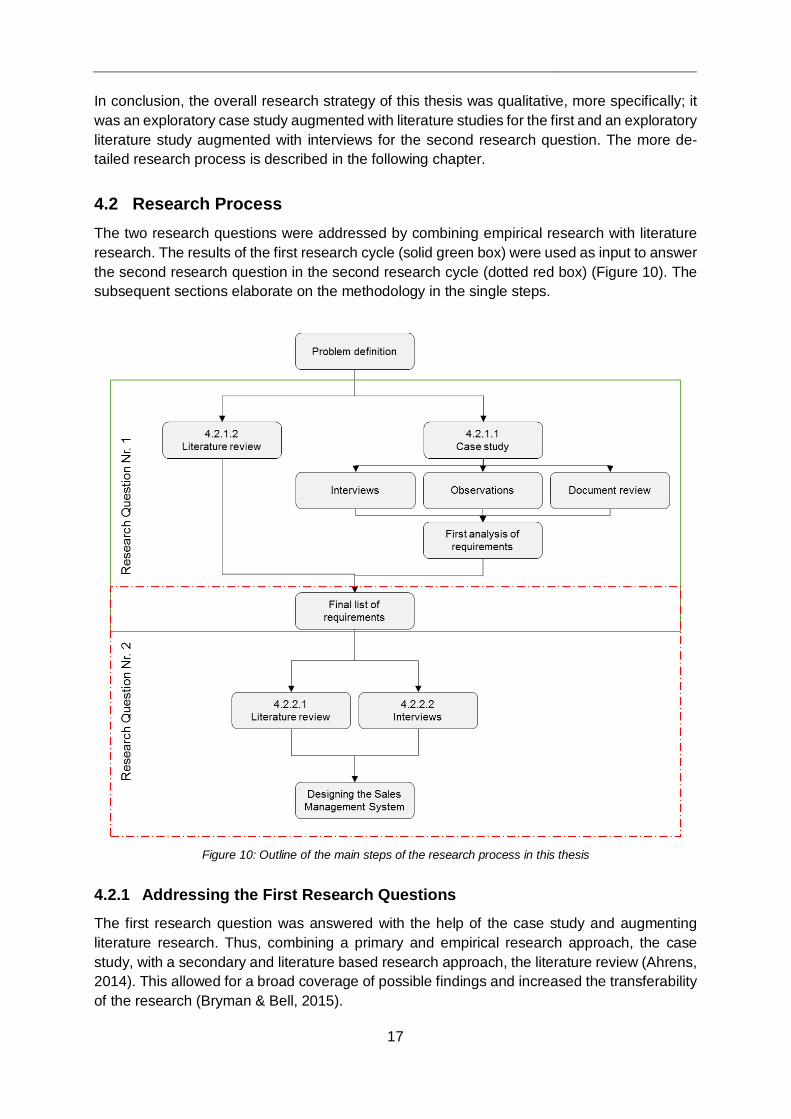
4.2 Research Process The two research questions were addressed by combining empirical research with literature research. The results of the first research cycle (solid green box) were used as input to answer the second research question in the second research cycle (dotted red box) (Figure 10). The subsequent sections elaborate on the methodology in the single steps.
4.2.1 Addressing the First Research Questions
The first research question was answered with the help of the case study and augmenting literature research. Thus, combining a primary and empirical research approach, the case study, with a secondary and literature based research approach, the literature review (Ahrens, 2014). This allowed for a broad coverage of possible findings and increased the transferability of the research (Bryman & Bell, 2015).
Figure 10: Outline of the main steps of the research process in this thesis
18
4.2.1.1 The Case Study
The case study had three means of collecting information: Case interviews, case document review and case observations (Figure 10).
Case interviews
The case interviews were the basis of the case study and its most important source of infor-mation (Yin, 2014). They were also the basis for most of the analysis of requirements in later chapters. The interview participants were selected through snowball sampling, with the head of sales operations as a focal point. This approach was most promising to understand the full extent of the case, because it made use of the internal understanding of the situation, with participants pointing out interesting future participants. (Bryman & Bell, 2015)
Interviews were mostly conducted face to face, with follow-up questions asked via email. They followed a semi-structured format to get a more open discussion and to allow for follow-up questions where needed. (Bryman & Bell, 2015) An exemplary interview guideline is attached in Appendix 3.
Case observations
The aim of including observations in the case study was to reveal patterns of behaviour that were otherwise not studied, either because people do not do what they say, or have problems expressing their tacit knowledge (Bryman & Bell, 2015). In a case study, one has generally two possible options for observation, being direct and participating observations (Yin, 2014).
Both types of observations were used in this research. On the one hand, observing the sales force during the workday from the outside. On the other hand, observing procedures and pro-cess as a part of the sales force. Both approaches helped to get a better understanding of the current situation in the six areas of a Sales Management System in the case company. The participating observations were possible because the author had prior work experience with the case company and could simply be integrated into the workflow.
Case document review
The third source of information was internal documents. One reason to do a document review is to check the statements in the interviews for correctness. Another is to generate more data from information that has not been mentioned in the interviews. (Yin, 2014) Therefore, docu-ments were reviewed after they were mentioned by participants. The data from the document review was then included in the data to be coded and analysed.
4.2.1.2 Literature Review
The purpose of this literature review was to identify controversies or confirm conclusions drawn from the case study. Furthermore, the literature helped to generalise the findings and thus increased the transferability of the study. (Bryman & Bell, 2015) The process of the study was to find literature related to the requirements that emerged from the case study. Often using the code, see 4.3 Analysis of Data, as search words in the summon search tool accessed through Chalmers library homepage or Google scholar. The software Citavi was used to support the literature review and collect all notes in one place.
19
4.2.2 Addressing the Second Research Questions
The second research question was answered through synthesis and analysis of different so-lutions, based on the prior findings. Here, in particular, the problem-solving cycle of system engineering was followed (Ahrens, 2014). The main methodology to answer the second re-search question was literature research, augmented by expert interviews.
4.2.2.1 Literature Review
Again, a literature review was conducted with a focus on the Sales Management System and how to incorporate the different requirements. The resulting requirements from answering re-search question one were used as search words in the summon search tool accessed through Chalmers library homepage or Google scholar. Again, Citavi was used to support the literature review and collect all notes in one place.
4.2.2.2 Interviews
The interviews were again conducted as semi-structured interviews, to allow for an open dis-cussion and new inspiration (Bryman & Bell, 2015). Participants were selected for areas where the literature study together with the empirical case data was inconclusive. Thus, they ranged from academia to sales management in the case organisation to sales management in a sim-ilar organisation, Armatec AB (see Appendix 4 for the interview guideline).
4.3 Analysis of Data The proposed methodology for data collection resulted in a large amount of data, as with most qualitative approaches (Bryman & Bell, 2015). The data collection through interviews, using the snowball method to find new interview partners was conducted until saturation was reached. That is until enough data in a certain area of interest was collected which was as-sessed through constant comparison of the data and emerging concepts, following the grounded theory approach. (Bryman & Bell, 2015)
To get an initial overview of the data, the interviews were transcribed (not word by word, but the main messages). All transcriptions were done in English, even though different interviews were held in German or Swedish. Internal documents or articles were studied afterwards and included as data to support and confirm the findings (Yin, 2014).
The data, consisting of interview transcripts and augmenting documents, was then coded. Coding is referred to as the process of categorising and labelling pieces of data. The infor-mation from interviews and literature was broken down into components (open coding), grouped (axial coding) and analysed for relationships (selective coding). This allowed to re-duce the amount of data and make it more easily accessible because chunks of data from different interviews were now collected under the same code. (Bryman & Bell, 2015) The soft-ware NVivo 11 was used to support the coding process.
4.4 Quality of Research Guba and Lincoln (1994) suggest evaluating qualitative research based on two primary criteria, trustworthiness and authenticity. Trustworthiness can be further divided into credibility, trans-ferability, dependability and confirmability (Lincoln & Guba, 1985).
20
To ensure the credibility of the findings respondent validation and triangulation were used (Bry-man & Bell, 2015). Each interviewee received a transcript or summary of the interview and the conclusions, for validation. The data was only included in the analysis, after correction and acceptance through the participants. Furthermore, the earlier indicated methods to address the research questions, interviews and literature research, ensured that more than one method and source of data was used, in other words triangulating before reasoning (Bryman & Bell, 2015).
The question arises if the results are transferable, thus external valid because the situation at LESER is likely unique. While answering the first research question, literature research was used to formulate wider requirements to a Sales Management System with an equal focus on standard and project business than those found at LESER. This step increased the general transferability of the findings in research question two. Additionally, to enable potential readers to judge the transferability of the research, a “thick description” of the case was given (Lincoln & Guba, 1985).
The dependability was supported through meeting with a supervisor and peers, where the research process and progress was discussed. This form of audit established confirmability of the research results and ensured objectivity. (Bryman & Bell, 2015) A potential problem, in the context of objectivity, was also the risk to of going "native" and focusing too narrowly on the given context at LESER. To avoid this, the research was carried out at the university, and the organisation was only visited for data collection. (Bryman & Bell, 2015)
4.5 Societal, Ethical and Ecological Considerations It is important to consider ethical aspects, especially harm to participants, lack of informed consent, invasion of privacy and deception when conducting a research study (Bryman & Bell, 2015).
During the interviews, the possibility of anonymity was essential to prevent any of the partici-pants to be harmed, personally or professionally. If names were included in the final report, the ones who are cited had the chance to review the concerning parts before publishing. To ensure that there was no invasion of privacy the interviewee was initially informed that he or she can at any point during the interview choose not to answer or abort the interview com-pletely. Also, every participant had the opportunity to speak "off the record" to the researcher during all phases to address issues he/she felled not comfortable with sharing "on the record".
Deception was mitigated, by informing the participants about the purpose of the research and not have another agenda than stated. This information was given beforehand, so that the in-terviewees had the possibility to take a decision about whether to participate based on all facts, thus having informed consent about being included in the study. Furthermore, the participants could review their statements afterwards, as pointed out earlier.
From a sustainable development point of view, the resulting thesis includes no harmful aspects to either the environment nor the potential users of the framework. Travelling during the re-search was reduced to a minimum, though only conducting initial interviews face to face. Fol-low-up questions were asked via telephone or email to reduce the CO2 imprint during the research. When using the KPIs it is important not to use them to evaluate the performance of individuals, which might cause harm(Bryman & Bell, 2015).This is done by defining KPIs in the Sales Force Management dimension on a team level and not breaking them down further.
21
5 Description of the Case
The case description in this chapter focuses on the four frozen elements of culture, sales strat-egy, sales organisation and sales processes before the next chapter presents the require-ments that emerge for the areas of Sales Force Management and Sales Planning & Steering. This description increases the transferability of the research and provides an introduction into the case before the specific requirements are explored in the next chapter.
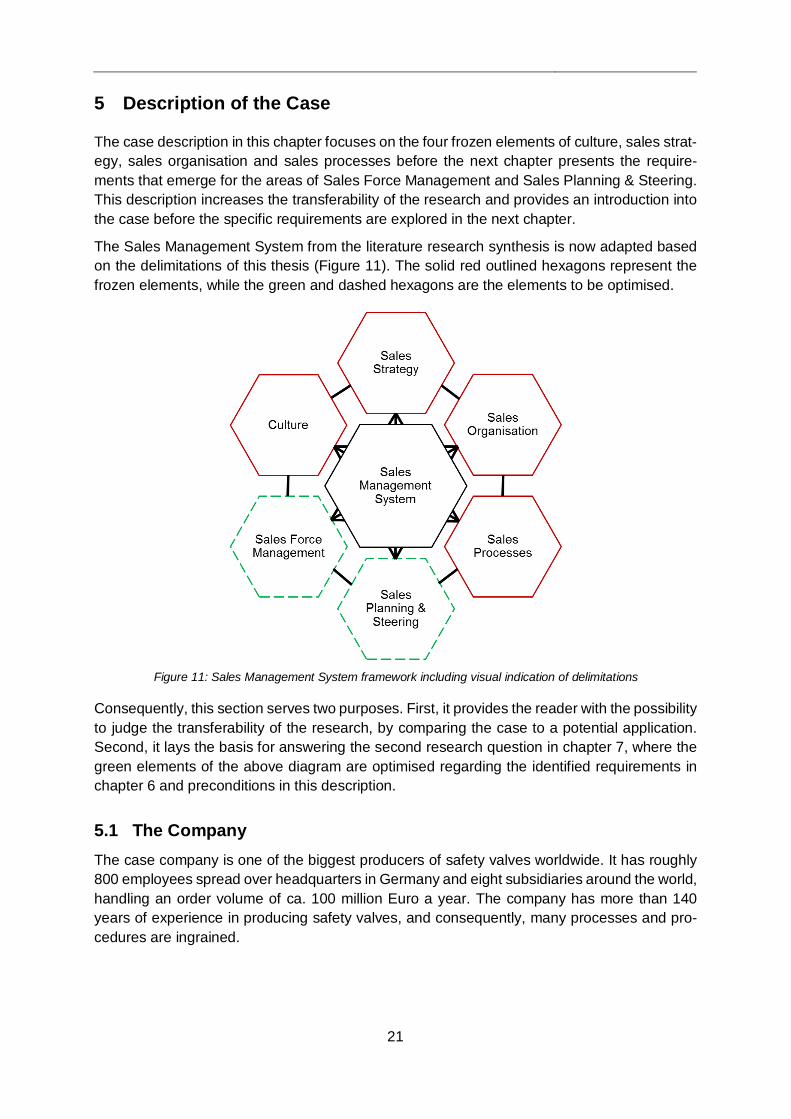
The Sales Management System from the literature research synthesis is now adapted based on the delimitations of this thesis (Figure 11). The solid red outlined hexagons represent the frozen elements, while the green and dashed hexagons are the elements to be optimised.
Consequently, this section serves two purposes. First, it provides the reader with the possibility to judge the transferability of the research, by comparing the case to a potential application. Second, it lays the basis for answering the second research question in chapter 7, where the green elements of the above diagram are optimised regarding the identified requirements in chapter 6 and preconditions in this description.
5.1 The Company The case company is one of the biggest producers of safety valves worldwide. It has roughly 800 employees spread over headquarters in Germany and eight subsidiaries around the world, handling an order volume of ca. 100 million Euro a year. The company has more than 140 years of experience in producing safety valves, and consequently, many processes and pro-cedures are ingrained.
Figure 11: Sales Management System framework including visual indication of delimitations
22
5.2 Sales Strategy The Sales strategy is described using the 4P framework (Pizam, 2011). Safety valves as a product are highly regulated and standardised. Therefore, the company does not necessarily compete with its basic design, but with product extras, a full product range and additional ser-vices packages. It strives for application-orientated product solutions in their portfolio.
The price strategy focuses on selling high-quality products at a competitive price level and provide extra value in customer service to attract customers and achieve low lifecycle costs, even though competition might first be cheaper. Furthermore, each product group should be profitable on its own, avoiding negative contribution margins for products that are needed in the offer.
The promotion strategy is to raise brand awareness to achieve the status as the supplier of choice and increase the offer conversion rate. To support the application-oriented product strategy, the company provides consulting in finding solution alternatives for special applica-tions.
The products are placed or distributed according to the results of a thorough market analysis. Therefore, different concepts can be chosen in different countries, depending on the market situation. Local partners and retailers, which act on commissions basis, help to reach markets around the world with technical support from headquarters. Today, there is the opportunity to have different channels for the standard and project business, by handling the project business directly from headquarters and the local partner taking care of the standard business. (Meindl, 2016)
In conclusion, a Sales Management System must build on this strategy and account for the different sales channels, as well as the focus on service packages. The research is transfera-ble to organisations with a similar approach, but not for companies competing only on price, because they will likely have a different focus in sales management.
5.3 Sales Organisation The sales force in the case company has been organised with a geographical focus since 2011. There are four divisions: Germany, Europe, Americas, and Asia. Each department has different functional units, which the organisation structure below exemplifies based on division Germany.
23
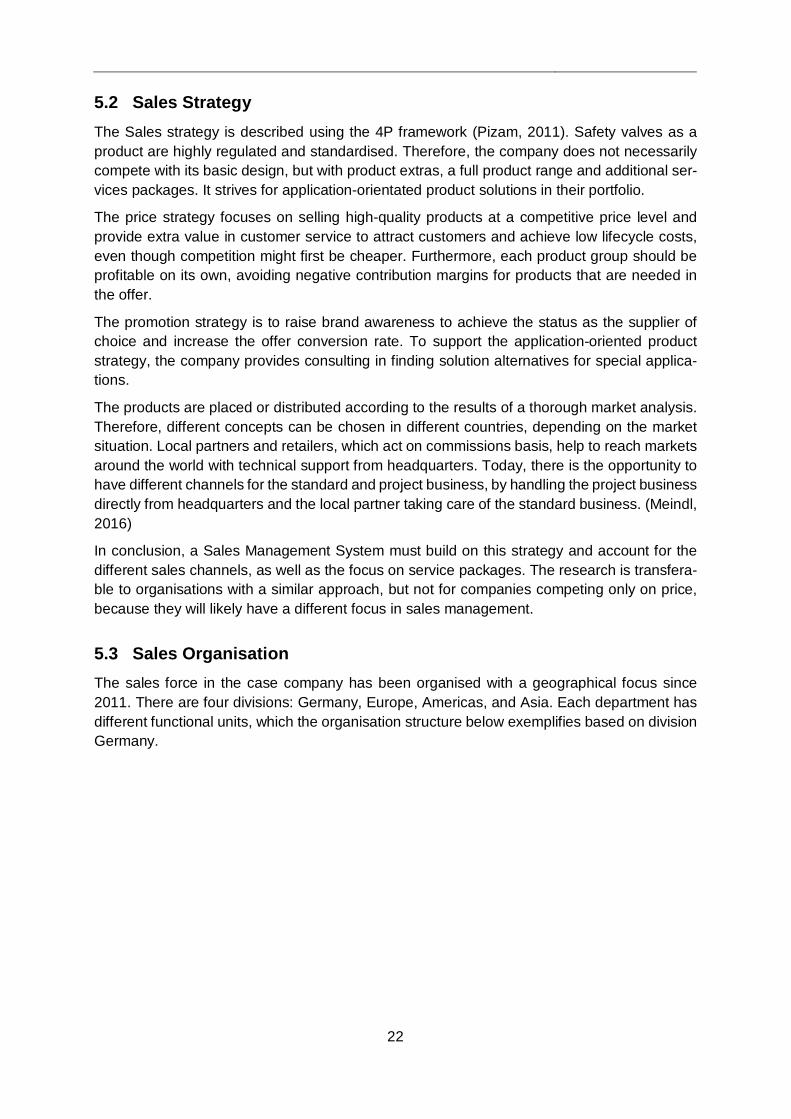
Figure 12: Exemplifying chart of the sales organisation
The four functional units are the same for every department and are shortly explained afterwards.
Sales Market Development focuses on the development of customer relationships, managing the local partners and handling customer contact in project business.
Technical Sales specialises in preparing complex and high value offers, as they typically ap-pear in project business. Additionally, they provide technical support for standard business, if needed.
Customer care focuses on communication with partners and clients regarding standard busi-ness.
Order Inquiry Management deals with standard offers and all orders. In case standard offers require technical support, they are assisted by Technical Sales.
Additionally, the supporting unit sales operations coordinate development of processes across divisions. It was introduced three years ago, because the working procedures of the same functions in different divisions drifted apart, due to a lack of coordination.
Sales Market Development and Technical Sales units can roughly be assigned to handling project business. However, they are also integrated into the standard business, through part-ner development or technical support. On the other hand, customer care and order inquiry management are mostly handling standard business, but also help with project business through customer contact or supporting work.
The framework developed in this thesis can, therefore, be transferred to organisations with a similar setup, where standard and project business are partially handled by the same sales force and which have a strong network of local sales partners.
Sales management
Division Germany
Sales Market Development
Technical Sales
Customer Care
Order Inquiry Management
Division Europe
[...]
Division Asia
[...]
Division Americas
[...]
Sales Operations
24
5.4 Sales Processes The sales processes in the organisation are standardised to a high degree. This standardisation is driven by sales operations and thus especially productive in the last three years after the department was founded. This approach of having a sales operations depart-ment to handle and standardise business processes, is a general industry trend (Lips, 2014, p. 239).
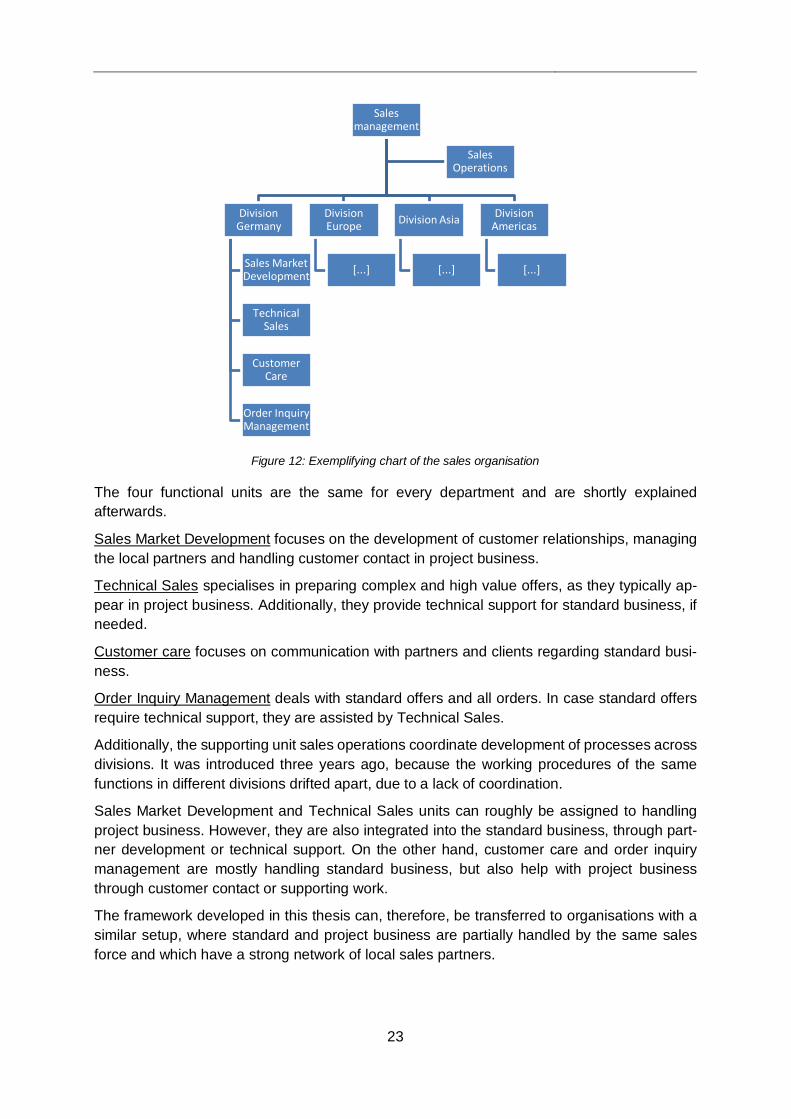
The sales process at the case company is a maximum process, meaning it includes all poten-tial process steps to prepare for all possible sales scenarios, but only some of them are nor-mally executed. It is similar to the standard sales process described by (Cova & Holstius, 1993). Sales activities in standard business are mostly done in the preparation, bidding and negotiation phases, while project business requires sales activities from early project lead stages until transition (Figure 13).
The process is supported by some tools, especially Valvestar for sizing of valves and project lead tracking to coordinate activities to secure projects. The different process steps can be used to align a Sales Planning & Steering system through, for example, defining a conservation rate for every process step and monitoring the early phases to predict sales later in the process (Söhnchen & Albers, 2010).
In conclusion, all organisations with a comparable sales process should be able to apply the resulting Sales Management System. However, if an organisation focuses on individual efforts instead of well-established procedures, the transferability is limited.
5.5 Culture The organisation culture is assessed using the competing value framework, described in sec-tion 2.6. The culture assessment is done with a small sample size of individuals who worked at most of the different divisions at some point during their career. Thus, allowing for a broad exposure to the culture in all divisions. All participants were previously known to the re-searcher, and the questionnaire was promised to be anonymous. Therefore, it can be said that “private beliefs and opinions” (Scott et al., 2003, p. 939), have been shared and the assess-ment presents a picture of the actual culture (Figure 14).
Figure 13: The sales process with complementary tools
25
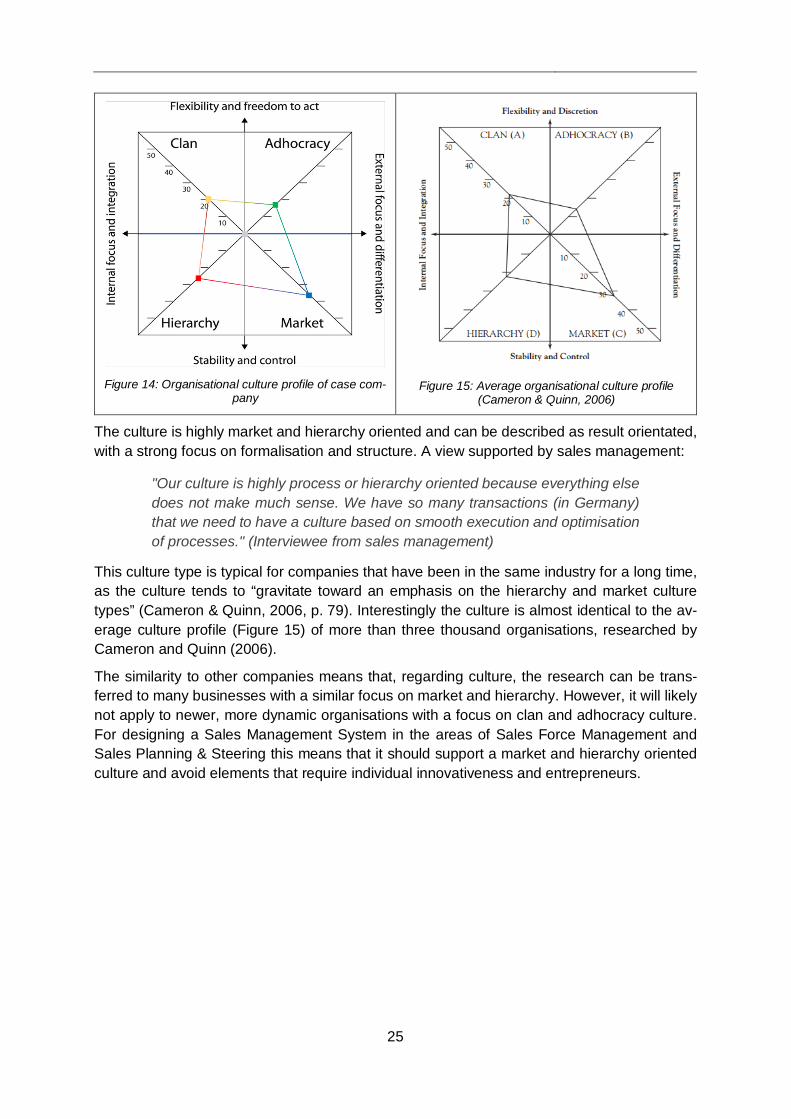
The culture is highly market and hierarchy oriented and can be described as result orientated, with a strong focus on formalisation and structure. A view supported by sales management:
"Our culture is highly process or hierarchy oriented because everything else does not make much sense. We have so many transactions (in Germany) that we need to have a culture based on smooth execution and optimisation of processes." (Interviewee from sales management)
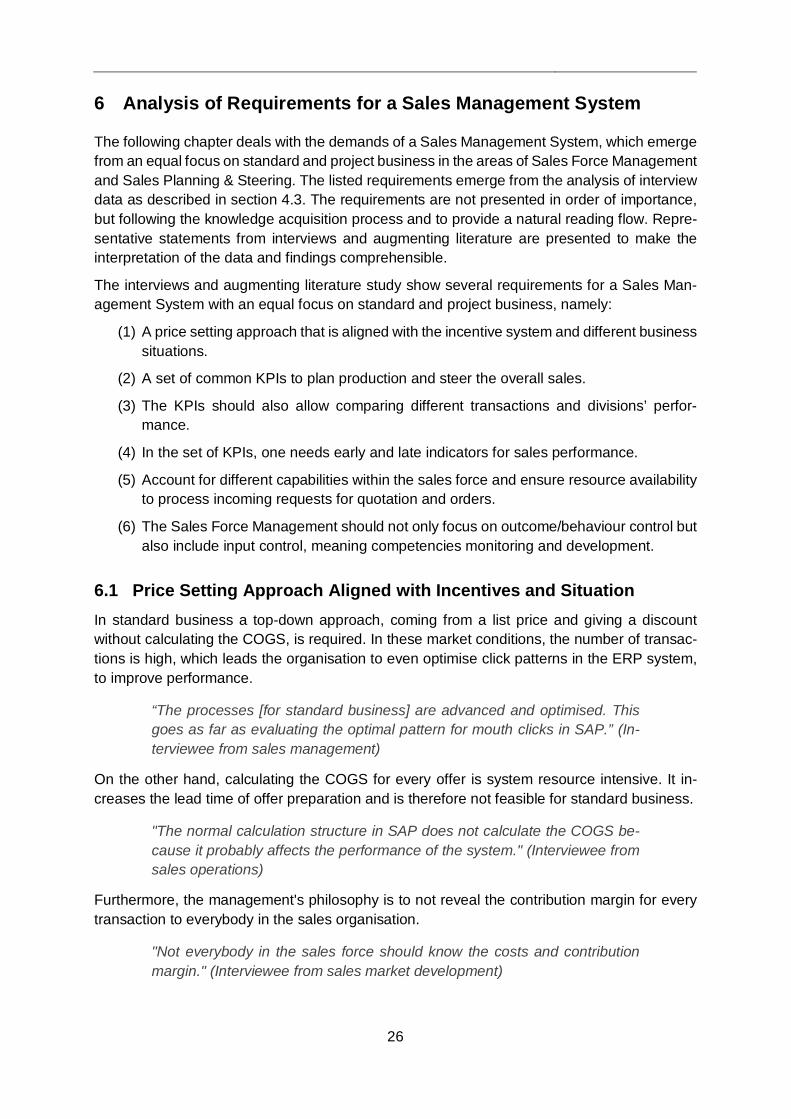
This culture type is typical for companies that have been in the same industry for a long time, as the culture tends to “gravitate toward an emphasis on the hierarchy and market culture types” (Cameron & Quinn, 2006, p. 79). Interestingly the culture is almost identical to the av-erage culture profile (Figure 15) of more than three thousand organisations, researched by Cameron and Quinn (2006).
The similarity to other companies means that, regarding culture, the research can be trans-ferred to many businesses with a similar focus on market and hierarchy. However, it will likely not apply to newer, more dynamic organisations with a focus on clan and adhocracy culture. For designing a Sales Management System in the areas of Sales Force Management and Sales Planning & Steering this means that it should support a market and hierarchy oriented culture and avoid elements that require individual innovativeness and entrepreneurs.
Figure 14: Organisational culture profile of case com-
pany
Figure 15: Average organisational culture profile
(Cameron & Quinn, 2006)
26
6 Analysis of Requirements for a Sales Management System
The following chapter deals with the demands of a Sales Management System, which emerge from an equal focus on standard and project business in the areas of Sales Force Management and Sales Planning & Steering. The listed requirements emerge from the analysis of interview data as described in section 4.3. The requirements are not presented in order of importance, but following the knowledge acquisition process and to provide a natural reading flow. Repre-sentative statements from interviews and augmenting literature are presented to make the interpretation of the data and findings comprehensible.
The interviews and augmenting literature study show several requirements for a Sales Man-agement System with an equal focus on standard and project business, namely:
(1) A price setting approach that is aligned with the incentive system and different business situations.
(2) A set of common KPIs to plan production and steer the overall sales.
(3) The KPIs should also allow comparing different transactions and divisions’ perfor-mance.
(4) In the set of KPIs, one needs early and late indicators for sales performance.
(5) Account for different capabilities within the sales force and ensure resource availability to process incoming requests for quotation and orders.
(6) The Sales Force Management should not only focus on outcome/behaviour control but also include input control, meaning competencies monitoring and development.
6.1 Price Setting Approach Aligned with Incentives and Situation In standard business a top-down approach, coming from a list price and giving a discount without calculating the COGS, is required. In these market conditions, the number of transac-tions is high, which leads the organisation to even optimise click patterns in the ERP system, to improve performance.
“The processes [for standard business] are advanced and optimised. This goes as far as evaluating the optimal pattern for mouth clicks in SAP.” (In-terviewee from sales management)
On the other hand, calculating the COGS for every offer is system resource intensive. It in-creases the lead time of offer preparation and is therefore not feasible for standard business.
"The normal calculation structure in SAP does not calculate the COGS be-cause it probably affects the performance of the system." (Interviewee from sales operations)
Furthermore, the management's philosophy is to not reveal the contribution margin for every transaction to everybody in the sales organisation.
"Not everybody in the sales force should know the costs and contribution margin." (Interviewee from sales market development)
27
There are several reasons that not everybody should know the margin, but the main one is that incentives are based on revenue. If incentives are based on revenue, it is natural for sales agents to try to win as many projects as possible "rather than defending the firm's profit margin" (Homburg, Jensen et al., 2012, p. 65).
Additionally, the margin that can be calculated in an offer is only the first contribution margin, purely based on costs of goods and services. It does not include direct sales costs nor fixed costs of the company.
“The problem is, that only CM2 (sales price – direct material & production costs) is used for steering. But if one has a CM2 of 30%, there is no bottom-line profit, after engineering to order, project management and sales costs are subtracted.” (Interviewee from sales management)
A sales agent, whose incentives are based on revenue might neglect this and tend to offer lower prices if being aware that the margin is greater than 30%. Therefore, the COGS calcu-lation and margin should not be available for all standard transactions.
In project business, on the other hand, the consideration of COGS is necessary, because the list price is not correct anymore. Most projects include design to order components, which do not have a list price. The COGS need to be calculated and multiplied by a factor to reach a sales price.
“A fictive list price is calculated via a factor according to [internal document] But it is most likely not accurate, especially in big project offers.” (Interviewee from sales operations)
Additionally, sellers in project business “typically compete on a price basis” (Bansard et al., 1993, p. 126), which means that the margins decrease and it becomes more important to know the COGS to make informed decisions whether a certain price can be met.
It is, therefore, necessary to align the price setting approach to the incentives system and the situation. Whether this leads to a diverse or unified price calculation approach for standard and project business needs to be defined while answering research question two, in chapter 7.
6.2 Common Indicators to Steer Overall Sales and Plan Production Based on the previous chapter, a Sales Management System can have different price ap-proaches. However, even in such a case that for standard business a top-down and for project business a bottom-up calculation is done, the various business transactions need to be com-parable. The pricing structure for the standard and project business is connected to almost all departments of the case company.
Backlog processes, such as planning, steering, and controlling functions, require a unified set of KPIs. The need for this can be seen in the current approach at the case company, where a fictive list price is generated, to be able to give a discount. The discount together with order intake and revenue is then used to compare single transaction and aggregated sales numbers for regions and divisions.
“We use the discount to steer sales in both standard and project business.” (Interviewee from sales management)
28
If the discount is the right choice of KPI is to be discussed, but the need of common KPIs becomes apparent. Even more after looking at the production capacity planning process, which is based on the gross sales volume for both standard and project business together.
“Capacity and performance are measured in minutes for every ma-chine/workgroup. These minutes equal a certain gross and if the budget/forecast should be increased by x%, the performance in minutes must be increased accordingly.” (Interviewee from finance and controlling)
The production works on safety valves and does not distinguish products from standard or project business, meaning producing parts for valves from standard and project business is the same charge. Therefore, the capacity needs to be planned based on a common parameter, as gross sales are today.
In conclusion, a requirement for a Sales Management System is that joint KPI can be gener-ated, based on the choice of price approach taken in the former decision area.
6.3 Control Parameters that Allow Comparability between Transactions The case company has, as mentioned in the previous section, offer volume, order intake, rev-enue, and discount ratio as the most dominant performance indicators. These four control parameters are used to forecast and evaluate the performance of different regions, countries, and divisions. The discount ratio is not only the given discount but the proportion of discount, based on the net sales price, to account for non-discount eligible items, like documentation. It can also be named total discount.
“The discount ratio is, therefore, the discount (abs.) divided by the gross sales.” (Interviewee from finance and controlling)
Following this definition, the lower the discount ratio, the better for the company.
With the use of discount to steer sales emerges a problem, especially in the follow-up and planning of discount ratio. List prices for standardised options are often deleted in a project to reduce the price complexity and make the project more manageable. Furthermore, to calculate a discount there needs to be an initial price. In project business one often has multiple designs to order items without a list price, which makes it hard to calculate a discount.
There are workaround solutions where, based on the cost for the special material, a fictive list price is defined and later reduced through discounts. The following calculation scenarios ex-emplify the current procedure and highlight the problems one has with using discount ratio.
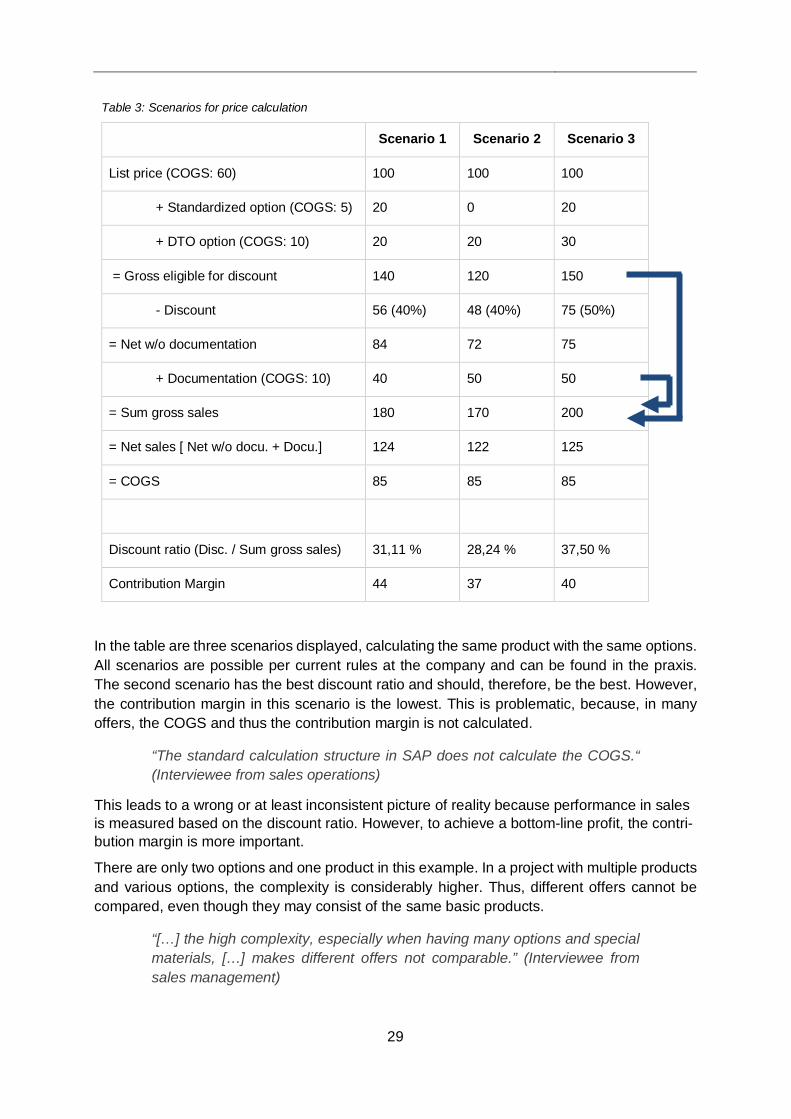
29
In the table are three scenarios displayed, calculating the same product with the same options. All scenarios are possible per current rules at the company and can be found in the praxis. The second scenario has the best discount ratio and should, therefore, be the best. However, the contribution margin in this scenario is the lowest. This is problematic, because, in many offers, the COGS and thus the contribution margin is not calculated.
“The standard calculation structure in SAP does not calculate the COGS.“ (Interviewee from sales operations)
This leads to a wrong or at least inconsistent picture of reality because performance in sales is measured based on the discount ratio. However, to achieve a bottom-line profit, the contri-bution margin is more important.
There are only two options and one product in this example. In a project with multiple products and various options, the complexity is considerably higher. Thus, different offers cannot be compared, even though they may consist of the same basic products.
“[…] the high complexity, especially when having many options and special materials, […] makes different offers not comparable.” (Interviewee from sales management)
Table 3: Scenarios for price calculation
Scenario 1 Scenario 2 Scenario 3
List price (COGS: 60) 100 100 100
+ Standardized option (COGS: 5) 20 0 20
+ DTO option (COGS: 10) 20 20 30
= Gross eligible for discount 140 120 150
- Discount 56 (40%) 48 (40%) 75 (50%)
= Net w/o documentation 84 72 75
+ Documentation (COGS: 10) 40 50 50
= Sum gross sales 180 170 200
= Net sales [ Net w/o docu. + Docu.] 124 122 125
= COGS 85 85 85
Discount ratio (Disc. / Sum gross sales) 31,11 % 28,24 % 37,50 %
Contribution Margin 44 37 40

30
For a Sales Management System, this means that control parameters in an organisation with an equal focus on standard and project business need to be working for both business types, or be clearly separated from each other. Furthermore, control parameters must make offers and orders comparable, both on a single transaction and aggregated basis.
6.4 Have Early and Late Indicators for Sales Development Another requirement for a Sales Management System in the area of sales planning and steer-ing is that early indicators show how the business will develop.
"For me, sales management starts with the request volume. That is an early indicator for me. If the volume goes down, I have time to react before it af-fects my order intake. This is true for standard and project business. How-ever, one can differentiate, because you have more time in project than in standard business. If I only react when the order intake goes back, I am too late." (Interviewee from sales management)
This need for early indicators is also pointed out in sales controlling literature, where early and late indicators for finance, customer, processes, and learning are suggested. The early indica-tors should predict later development, much as the request volume projecting later revenue in the statement above. The late indicators show the bottom line effects of the actions taken, e.g. the revenue as a measurement of financial performance. (Kesten & Lühn, 2012, 659 f.)
This requirement is valid for both business types equally, but as pointed out by the interviewee, the time frame for early indicators can be different. In the case at hand, the average duration of projects from the request for quotation to order intake is two and a half months, and another four months until delivery. How the cycle time is for standard and project business is presented in the below table. Here the average time for each phase of the sales process is presented, based on the company’s historical data (Table 4).
Standard business Project business
A. Search 6 month
B. Preparation 1 week 2 weeks
C. Bidding 2 weeks 1 month
D. Negotiation 2 weeks 1 month
E. Implementation 3 weeks 4 months
F. Transition 1 month
Total 2 months 13 months
Following the average time between the process stages, one can say that for standard busi-ness a change in the request for quotation volume will affect revenue within one or two months and the time to react is very short. On the other hand, once order intake or revenue is affected, it takes only a little time for reactive measurements to be effective.
Table 4: Cycle time in the sales process for standard and project business.
31
In project business, on the other hand, it takes an average of one year between first leads and revenue. Since the time between early leads and request for quotation is quite long, there is more time to introduce reactive measurements. However, once order intake or revenue are changing, it takes an extended period for counter measurements to be effective.
In conclusion, early indicators are essential for both business types but should be more fo-cused on project business, because it is more important to react to changes in due course. The need for early indicators in areas other than financial performance, as suggested by liter-ature, has not been pointed out by any interviewee (Kesten & Lühn, 2012),
6.5 Ensuring Resource Availability of the Sales Force Managing the sales force, one has the problem of theoretical and actual capacity, both in standard and project business. Because the two areas are distinctive and require different capabilities, the sales force cannot be seen as one, but two groups of individuals. However, overlaps exist, and even though personnel for standard business cannot handle project busi-ness, it works the other way around.
“A resource for project business can potentially help in daily business (even though it would create problems with motivation), but not the other way around.” (Interviewee from sales management)
While it is theoretically possible to assign project business sales personnel to standard busi-ness in times of need, it will likely create problems with intrinsic motivation, as pointed out by the interviewee.
The motivation addressed here is intrinsic motivation, which can be interpreted as the inner drive to do one's work. This internal motivation is necessary because motivation systems that heavily rely on extrinsic motivation are often flawed and intrinsic motivation is needed to man-age employees successfully. (Amabile, 1997)
To achieve inner motivation, employees need to feel self-determined and competent in their work. The former, self-determination, is accomplished through autonomy in the tasks and a feeling of competence is achieved through challenging work that contributes to personal de-velopment. (Amabile, 1997) While standard business transactions provide autonomy, it is ar-guably lower than in project business, and while standard business operations are challenging, project activities are arguably more challenging.
If the level of autonomy and challenge is lower in standard business and those two are crucial for intrinsic motivation, then assigning somebody from project to standard business will lower his or her motivation. Therefore, it is not feasible to have overcapacity in the project business sales force and move capacity to standard business if needed. Both areas need to be balanced in capacity.
On the subject of balancing capacity, it is important to point out that project business is more volatile than standard business. Thus, one could assume that it is harder to predict and provide the needed capacity for projects. However, the interviews revealed that it is a problem in both areas to provide the necessary capacity to keep the backlog of request for quotations constant.
"The main challenge is to ensure the availability of resources/ performance. It does not mean to have more resources, but ensure a steady availability of ca. 80% of the theoretical 100%. Added to the challenge is the fact that the
32
business is volatile and demand for resources fluctuates. Even though pro-ject business is more volatile than standard, it is a challenge in both areas." (Interviewee from sales management)
The statement that projects are more unstable and hard to forecast is supported by literature (Bansard et al., 1993). However, projects also have a longer time frame between start and end of the procurement process and are more public. This allows a company to track projects al-ready in early stages and thus have a relatively reliable forecast for the next year (Söhnchen & Albers, 2010).
Ultimately, the resulting requirement for a sale management system with a focus on standard and project business is to account for the different required capabilities within the sales force and ensure resource availability to process incoming requests for quotation in due time.
6.6 Focus on Input and Outcome/Behaviour Control in Sales Force Man-agement
Another requirement related to Sales Force Management is the development of competencies. Through the problems with providing the needed resources for processing standard and pro-ject transaction, the management's time to develop sales force competencies is limited.
“I lack time to develop/manage the personnel. That in turn, limits the perfor-mance of the whole division.” (Interviewee from sales management).
This view from the interviewee is supported by the literature. In the context of Sales Force Management, a study with responses of 300 British sales managers makes a strong argument that the impact of sales manager control level on salesperson behaviour performance is me-diated by sales manager control competencies (Piercy et al., 2009). In other words, a good process control system does not result in salesperson behaviour performance if the skills are missing. In fact, "sales manager control competencies have a larger impact on performance and effectiveness than do control levels” (Piercy et al., 2009, p. 465).
Therefore, a requirement for a Sales Management System is that the Sales Force Manage-ment focuses not only on the outcome- or behaviour-based control, see section 2.1 for defini-tion, but also on input control, as defined by Jaworski (1988). The reason this was not men-tioned by any interviewee, as pointed out in section 6.4, is probably that they do not work with this nowadays, due to lack of time. The implication, for the design of the Sales Management System, is that indicators to monitor and steer the sales force are needed for all three control characteristics.
33
7 Design of the Sales Management System
Based on the empiricism, the analysis of requirements for a Sales Management System with equal focus on standard and project business, the following Sales Management System is designed. The chapter answers the second research question: How a Sales Management System can be designed to account for an equally important standard and project business. The system comes in the form of a scorecard, proposing measurements to account for all six listed requirements from chapter 6.
The empirical research reveals that most of the requirements in the previous chapter deal with either control parameters, KPIs or some other sort of measurable parameter. These areas are managed today but need to be adapted to work better for standard and project business, e.g. the discount ratio (Chpt. 6.3). In fact, only the lack of input control, the training of sales force capabilities, is something that is somehow absent in the case company (Chpt. 6.6). Based on the empirical data it is concluded that what separates this area from the others is that it is not measured today.
Based on this observation, one could state that “if you can't measure it, you can't manage it” (Reichheld, 1994, p. 15), a quote often attributed to Deming, but in fact he stated that “it is wrong to suppose that if you can't measure it, you can't manage it” (Deming, 2000, p. 35) Another proverb indicates that “what gets measured gets managed” (Browne, 1997; Emiliani, 2000, p. 612). It is, however, important to note that this statement, although popularly used, does not mean that, just because something is measured, “the measure gets managed effec-tively”, in fact “often the desired effect is not achieved” (Emiliani, 2000, p. 613).
A way to achieve effective management is to measure the right things, which are aligned to an organisation’s business objectives (Emiliani, 2000). Therefore, the observation in the empirical part and the discussion of the literature allows the conclusion that measuring something en-sures that it is managed, but a special effort needs to be invested in making sure that the management is also effective. In conclusion, a framework that makes sure that the right things, for an equal focus on standard and project business, are measured and in turn managed ef-fectively provides the answer to research question two: How a Sales Management System can be designed to account for an equally important standard and project business. A framework based on the Balanced Scorecard concept does just that (Kesten & Lühn, 2012).
The theory of the Balanced Scorecard is shortly presented in the following subchapter, before the content to account for the listed requirements is defined, based on literature studies and expert interviews.

34
7.1 Transferring the Balanced Scorecard Concept to a Sales Manage-ment System
The Balanced Scorecard is first presented as an approach to measure performance, by not only taking short-term financial measures into consideration but augmenting these with “mon-itoring progress in building the capabilities and acquiring the intangible assets”, which compa-nies “[…] would need for future growth” (Kaplan & Norton, 1996, p. 75). Using not only short-term financial indicators is also one of the requirements for a Sales Management System (Chpt. 6.4), one reason why the Balanced Scorecard concept is useful in this context. How-ever, the application of the Balanced Scorecard is not limited to performance measurements. In fact, it can serve as “the cornerstone of a new strategic management system” and thus, fulfil the purpose it should in the context of this research (Kaplan & Norton, 1996, p. 75).
The Balanced Scorecard consists of four perspectives; Financial, internal business processes, learning & growth, and customer. The measurements in the different perspectives are created based on the company’s vision and strategy and thus different for individual companies, or even functional units of an organisation. (Kaplan & Norton, 1996) The below figure shows the four perspectives and how they derive from one central strategy. The boxes include questions, to get an idea of the kind of measurements that are needed.
Figure 16: The four perspectives of a Balanced Scorecard (Niven, 2014)
These four perspectives have some overlap with the six elements of a Sales Management System. Business processes is a dimension in both frameworks. The finance and customer perspective can be found in the in Sales Planning and Steering, while learning & growth are part of the Sales Force Management. The measurements in each dimension are created based on an organisation's strategy (Kaplan & Norton, 1996). Furthermore, the arrows indicate inter-dependencies, much as in the Sales Management System.
Designing the dimensions in accordance with the strategy can be transferred to the approach in this research, where the Sales Management System the areas of Sales Force Management and Sales Planning & Steering is designed in alignment with the other four areas; Strategy, Sales Organisation, Sales Processes, and Culture.
All in all, the basic Balanced Scorecard approach seems to be applicable for the design of a Sales Management System for an organisation with an equal focus on standard and project business. However, it needs to be adapted to fulfil the exact purpose of this research.

35
While the dimensions overlap, they are not the same, and the aim of this report is to only design the Sales Planning & Steering and Sales Force Management areas of the Sales Man-agement System, freezing the other four areas. These other areas can be added during later research, but here they are all included in the centre of the model. That results in a scorecard framework with only two dimensions (Figure 17)
Figure 17: The two perspectives of the Sales Management Scorecard
7.2 Defining the Content of the Sales Management System As for the measurements in the Balanced Scorecard, the key performance indicators need to be designed in alignment with the situation at hand. Similar to the measurements in the Bal-anced Scorecard, which need to be defined based on the strategy (Kaplan & Norton, 1996). The situation, thus, is that the four ‘frozen’ areas of the Sales Management System, and the resulting requirement, are presented in previous chapters. Following this, the individual meas-urements are defined to create a Sales Management System, in the form of a scorecard, for an organisation with an equal focus on standard and project business.
First, the optimal incentive system is constructed, before researching what the optimal price setting approach is. Based on these two decisions, the suitable key performance indicators for Sales Planning & Steering and Sales Force Management are defined.
7.2.1 Type of Incentive System
In the empirical part of this research, it is concluded that one must define the optimal incentives system for an organisation with an equal focus on standard and project business, before being able to define the best price setting approach and performance measurements (Chpt. 6.1).
The practice of how to design an incentive plan in detail exceeds the scope of this research. Instead one should turn to the relevant literature on this topic (e.g. Zoltners, Sinha, & Lori-mer, 2006). However, to design the Sales Management System one needs to decide on the four main design decisions; Pay level, salary-incentive mix, performance measures and per-formance-pay out relationships (Zoltners et al., 2006).

36
The pay level, or how much salespeople are paid in total, is highly dependent on the industry and attractiveness of the organisation in question. A higher pay can be used to attract top tal-ent. (Zoltners et al., 2006) However, money as an extrinsic motivation source will only to a certain degree foster better performance and can’t replace a work environment that moti-vates the workforce in other, intrinsic ways (Amabile, 1997).
First, a closer look is taken at the incentive system of the case company to set the context. The case company pays a competitive salary to attract talent. This is kept in the further anal-ysis but does not necessary limit the transferability to other organisations, which attract talent through other means. The salary-incentive mix is fourfold. The internal sales force has a fixed salary without incentives. The group leaders in each division have a fixed salary, aug-mented with bonuses based on personal achievement, e.g. the number of internal improve-ment project. As for the external sales force, the sales representatives employed by the com-pany have a fixed salary, plus a moderate commission on revenue, while those who are con-tract partners (e.g. retailers) have only a high commission based on revenue.
Reviewing the literature on the specific topic indicates that the fixed salary proportion of the incentive system is closely linked to the culture because it determines how the sales force is managed and lead. A high salary proportion is best suited for a stable and control orientated culture. Whereas a culture with a focus on flexibility and individuality profits from a high in-centive share. (Zoltners et al., 2006) The culture profile that is the basis for this research is market and hierarchy orientated (Chpt. 5.5), which means that a high salary proportion is suitable.
Another aspect that influences the optimal salary-incentive mix is the nature of the task per-formed. For tasks requiring mostly skill and intellect, a low level of arousal/stress leads to op-timal performance. For tasks requiring endurance and persistence, on the other hand, a higher level of arousal/stress leads to optimised performance (Figure 18). (Zoltners et al., 2006)
Figure 18: The correlation between stress and performance for different tasks (Zoltners et al., 2006)
The curves show the performance outputs in two different tasks under increasing level of arousal/stress. The dotted curve has its performance optimum at a higher stress level. One can interpret the arousal/stress as the percentage of variable pay because it leaves the salesperson with less security over the monthly salary (Zoltners et al., 2006). In conclusion,

37
tasks that require persistence and endurance, as the standard sales force tasks, should have a higher variable share than the project sales force, where more skill and intellect is required (Chpt. 5.3). However, since both functions overlap and sales in the case company is a team effort, it is hard to have different salary incentive mixes for standard and project sales force. Leading to the third key concept, the need for performance measures.
Both literature and the interviewed experts point out the problem with incentives based on revenue (Zoltners et al., 2006). It leads to lower margins than necessary because the sales representatives do not feel the need to defend the margins as fiercely as they would if contri-bution margin was the base for their commission (Söhnchen & Albers, 2010). This problem is reinforced through sales management that “tends to focus on tracking lost deals or monitor-ing behaviour rather than rewarding salespeople for defending margins, leading salespeople to focus on sales growth by closing additional deals rather than defending the firm’s profit margin” (Homburg, Jensen et al., 2012, p. 65). A phenomenon that is also seen in the case company. That is not saying that revenue margin based is always superior to revenue based commission. It does, however, depend on the context.
On the one hand, as Homburg, Jensen et al. (2012) state, a focus on revenue leads to sales growth and is beneficial when entering new markets and in markets with a strong market po-sition. Furthermore, it can be argued that in an organisation with functional separation be-tween sales and procurement, it is not fair to base incentives on margins, because the pro-curement costs cannot be influenced by sales.
“When the procurement costs for an item increase and thus the margin de-creases, it is not the sales departments problem, but procurement.” (Inter-viewee from sales management)
While this statement is provocative, it holds truth for the short term, especially for standard business opportunities.
On the other hand, with established customers and markets, a margin-based approach is ben-eficial to increase the organisation's bottom-line profit through defending margins and prevent-ing “salespeople to trade off effort for price discounts” (Homburg, Jensen et al., 2012, p. 63).
An interesting solution for the problem is found while comparing another company to the case company in an industry expert interview. The company is Armatec AB, an industrial re-tailer in Sweden with similar prerequisites as the case company LESER. They use different parameters for different market situations.
We want to have the volume, and then we want to have the profit, so we measure both. So, it could be that only the volume will create a bonus, or both the volume and the profit. Then it is higher. And that is not fixed, it could be also changed during what we want to achieve. (Sales management at Armatec AB)
In this a solution is presented where incentive systems are flexible and adapted to the business at hand. This approach counters the problems of too much focus on one key performance indicator. An approach that can also be found in literature in a slightly adapted form. It is sug-gested to have independent measures to determine the commission to avoid a too strong focus on the key performance (Zoltners et al., 2006).
Another aspect of this problem, which is not covered by the reviewed literature, is the fact that margin calculation in the offer process are not practical because they are system intensive and give a level of insight into the company’s financials that should not be known to everybody
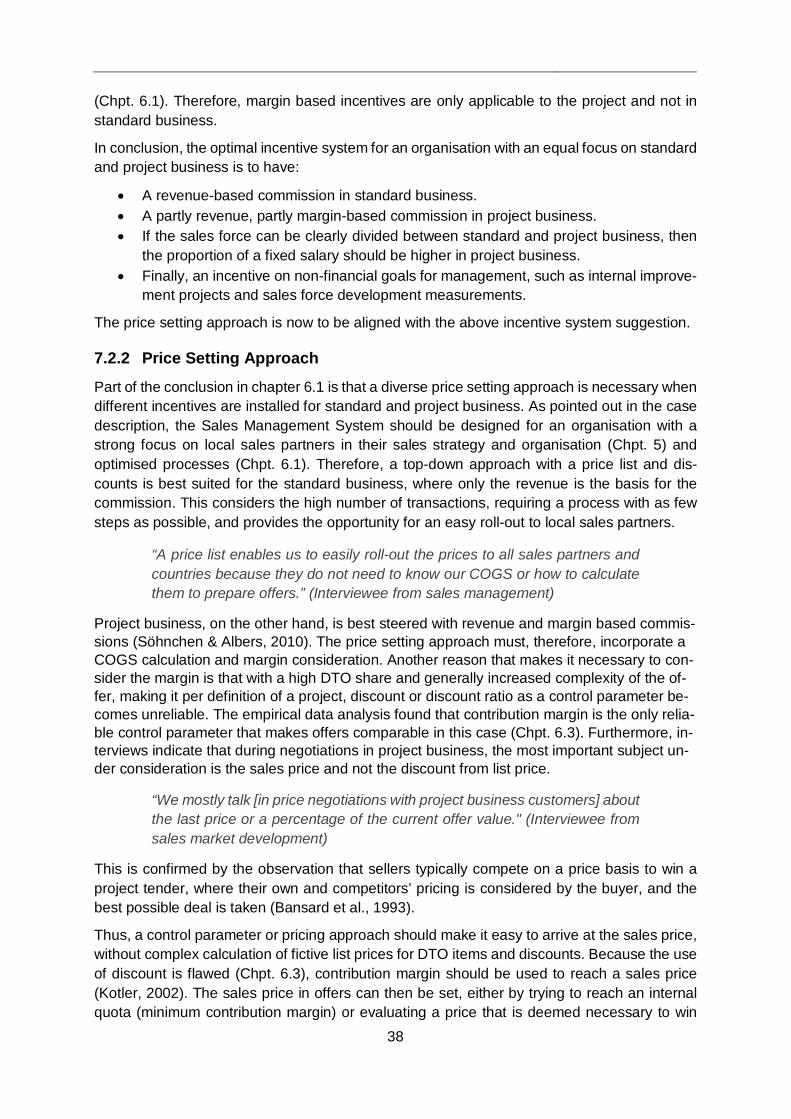
38
(Chpt. 6.1). Therefore, margin based incentives are only applicable to the project and not in standard business.
In conclusion, the optimal incentive system for an organisation with an equal focus on standard and project business is to have:
• A revenue-based commission in standard business. • A partly revenue, partly margin-based commission in project business. • If the sales force can be clearly divided between standard and project business, then
the proportion of a fixed salary should be higher in project business. • Finally, an incentive on non-financial goals for management, such as internal improve-
ment projects and sales force development measurements.
The price setting approach is now to be aligned with the above incentive system suggestion.
7.2.2 Price Setting Approach
Part of the conclusion in chapter 6.1 is that a diverse price setting approach is necessary when different incentives are installed for standard and project business. As pointed out in the case description, the Sales Management System should be designed for an organisation with a strong focus on local sales partners in their sales strategy and organisation (Chpt. 5) and optimised processes (Chpt. 6.1). Therefore, a top-down approach with a price list and dis-counts is best suited for the standard business, where only the revenue is the basis for the commission. This considers the high number of transactions, requiring a process with as few steps as possible, and provides the opportunity for an easy roll-out to local sales partners.
“A price list enables us to easily roll-out the prices to all sales partners and countries because they do not need to know our COGS or how to calculate them to prepare offers.” (Interviewee from sales management)
Project business, on the other hand, is best steered with revenue and margin based commis-sions (Söhnchen & Albers, 2010). The price setting approach must, therefore, incorporate a COGS calculation and margin consideration. Another reason that makes it necessary to con-sider the margin is that with a high DTO share and generally increased complexity of the of-fer, making it per definition of a project, discount or discount ratio as a control parameter be-comes unreliable. The empirical data analysis found that contribution margin is the only relia-ble control parameter that makes offers comparable in this case (Chpt. 6.3). Furthermore, in-terviews indicate that during negotiations in project business, the most important subject un-der consideration is the sales price and not the discount from list price.
“We mostly talk [in price negotiations with project business customers] about the last price or a percentage of the current offer value." (Interviewee from sales market development)
This is confirmed by the observation that sellers typically compete on a price basis to win a project tender, where their own and competitors’ pricing is considered by the buyer, and the best possible deal is taken (Bansard et al., 1993).
Thus, a control parameter or pricing approach should make it easy to arrive at the sales price, without complex calculation of fictive list prices for DTO items and discounts. Because the use of discount is flawed (Chpt. 6.3), contribution margin should be used to reach a sales price (Kotler, 2002). The sales price in offers can then be set, either by trying to reach an internal quota (minimum contribution margin) or evaluating a price that is deemed necessary to win
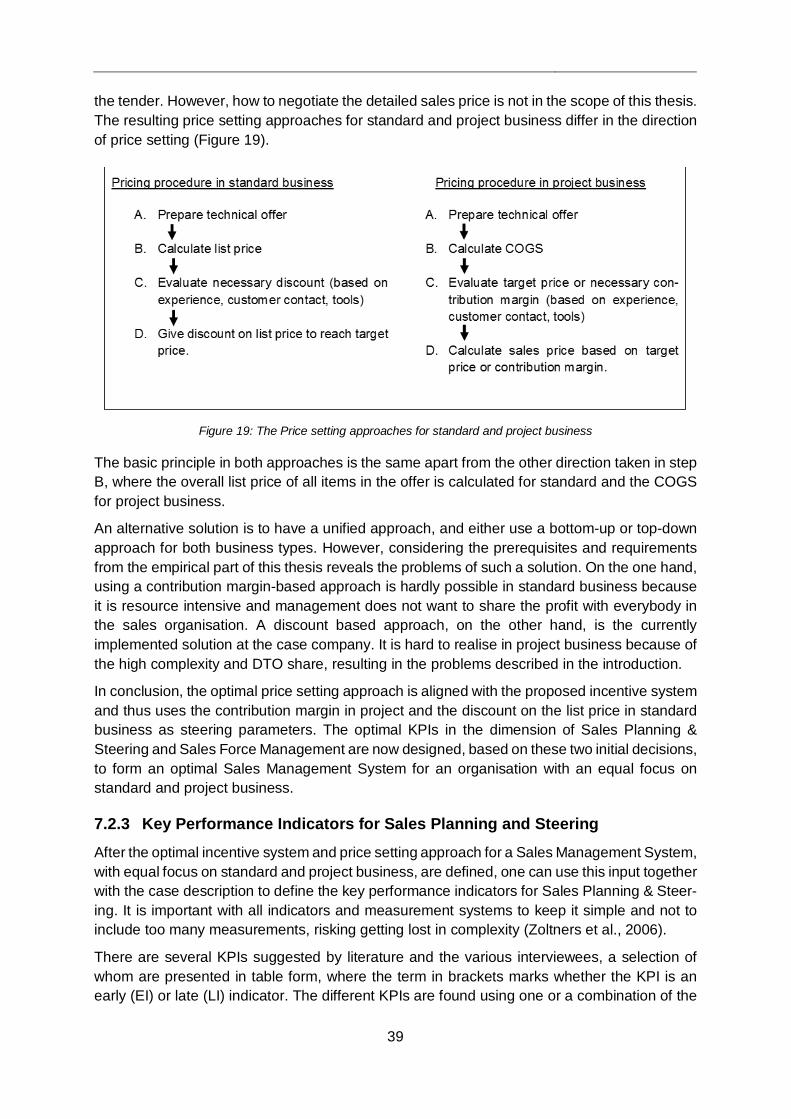
39
the tender. However, how to negotiate the detailed sales price is not in the scope of this thesis. The resulting price setting approaches for standard and project business differ in the direction of price setting (Figure 19).
Figure 19: The Price setting approaches for standard and project business
The basic principle in both approaches is the same apart from the other direction taken in step B, where the overall list price of all items in the offer is calculated for standard and the COGS for project business.
An alternative solution is to have a unified approach, and either use a bottom-up or top-down approach for both business types. However, considering the prerequisites and requirements from the empirical part of this thesis reveals the problems of such a solution. On the one hand, using a contribution margin-based approach is hardly possible in standard business because it is resource intensive and management does not want to share the profit with everybody in the sales organisation. A discount based approach, on the other hand, is the currently implemented solution at the case company. It is hard to realise in project business because of the high complexity and DTO share, resulting in the problems described in the introduction.
In conclusion, the optimal price setting approach is aligned with the proposed incentive system and thus uses the contribution margin in project and the discount on the list price in standard business as steering parameters. The optimal KPIs in the dimension of Sales Planning & Steering and Sales Force Management are now designed, based on these two initial decisions, to form an optimal Sales Management System for an organisation with an equal focus on standard and project business.
7.2.3 Key Performance Indicators for Sales Planning and Steering
After the optimal incentive system and price setting approach for a Sales Management System, with equal focus on standard and project business, are defined, one can use this input together with the case description to define the key performance indicators for Sales Planning & Steer-ing. It is important with all indicators and measurement systems to keep it simple and not to include too many measurements, risking getting lost in complexity (Zoltners et al., 2006).
There are several KPIs suggested by literature and the various interviewees, a selection of whom are presented in table form, where the term in brackets marks whether the KPI is an early (EI) or late (LI) indicator. The different KPIs are found using one or a combination of the
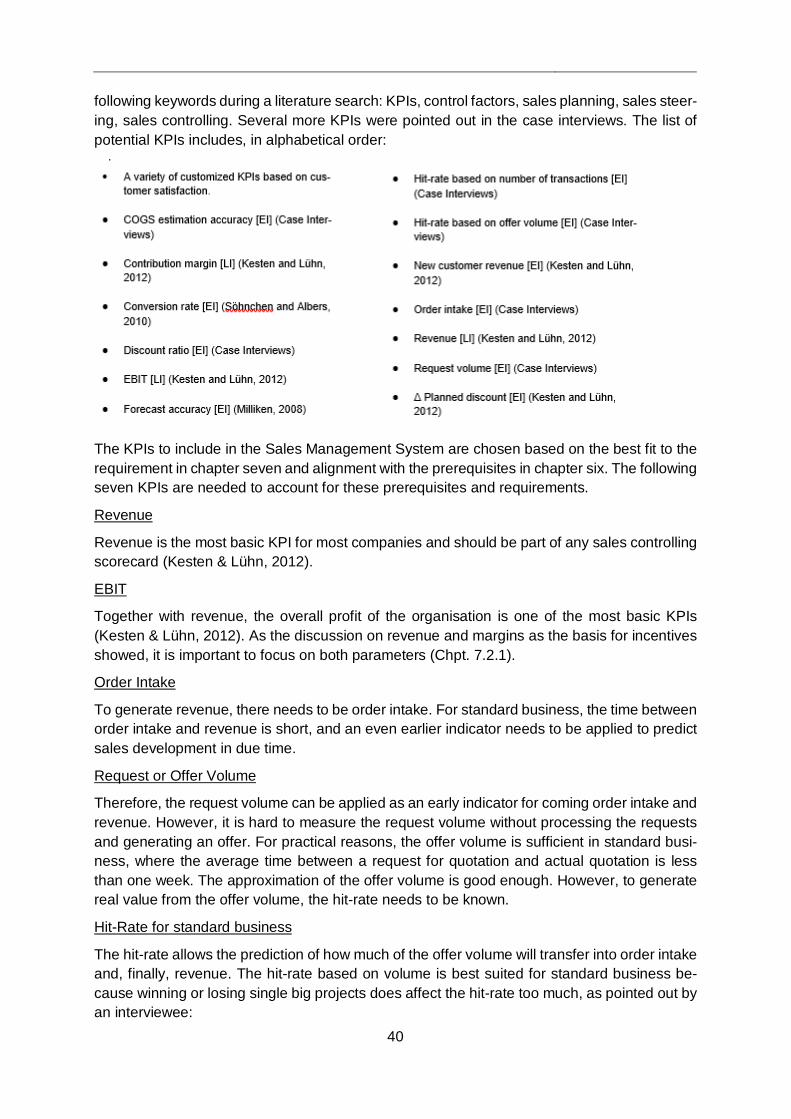
40
following keywords during a literature search: KPIs, control factors, sales planning, sales steer-ing, sales controlling. Several more KPIs were pointed out in the case interviews. The list of potential KPIs includes, in alphabetical order:
The KPIs to include in the Sales Management System are chosen based on the best fit to the requirement in chapter seven and alignment with the prerequisites in chapter six. The following seven KPIs are needed to account for these prerequisites and requirements.
Revenue
Revenue is the most basic KPI for most companies and should be part of any sales controlling scorecard (Kesten & Lühn, 2012).
EBIT
Together with revenue, the overall profit of the organisation is one of the most basic KPIs (Kesten & Lühn, 2012). As the discussion on revenue and margins as the basis for incentives showed, it is important to focus on both parameters (Chpt. 7.2.1).
Order Intake
To generate revenue, there needs to be order intake. For standard business, the time between order intake and revenue is short, and an even earlier indicator needs to be applied to predict sales development in due time.
Request or Offer Volume
Therefore, the request volume can be applied as an early indicator for coming order intake and revenue. However, it is hard to measure the request volume without processing the requests and generating an offer. For practical reasons, the offer volume is sufficient in standard busi-ness, where the average time between a request for quotation and actual quotation is less than one week. The approximation of the offer volume is good enough. However, to generate real value from the offer volume, the hit-rate needs to be known.
Hit-Rate for standard business
The hit-rate allows the prediction of how much of the offer volume will transfer into order intake and, finally, revenue. The hit-rate based on volume is best suited for standard business be-cause winning or losing single big projects does affect the hit-rate too much, as pointed out by an interviewee:

41
“Through the high volatility from project business, it is difficult to forecast. When excluding the big projects, the offer volume hit rate works quite well.” (Interviewee from sales management)
While using the hit-rate, one must consider that not all orders are based on a prior offer. Thus, a certain percentage needs to be added, based on historical data, which contributes for direct orders. In the case company, this share is as high as 45% for some countries, where the company is well established and has good buyer relations with integrated IT systems.
Rolling forecast value for project business
In project business, on the other hand, it is more challenging to predict the order intake, as the interviewee points out. This is because of the “low transaction frequency, which gives rise to uncertainty with regard of regularity of income” (Bansard et al., 1993, p. 132). At the same time, the low transaction frequency allows for a deeper connection with the buyer and commu-nication with the buying centre. This means that the sales force can invest time to evaluate the status of the tender and estimate the percentage of successfully winning a single project. This information can then be used to forecast the weighted expected sales volume (Kühnapfel, 2017). While the detailed procedure can be found in Kühnapfel (2017), the basic procedure is to let the sales force assign probabilities of winning an offer, the expected order value and time of order placement (Kühnapfel, 2017). This information is gathered through their market knowledge and communication with the buyer (Bansard et al., 1993). Then this probability together with the offer volume and expected order date can be used to calculate the weighted expected sales volume, much like the hit-rate can be used to calculate the expected sales volume for standard business.
Customer Project Expected order value Order [%] Expected order date Forecast value
A XYZ 1.000.000 75 % 3 month 750.000
B 123 2.500.000 50 % 1 month 1.250.000
A X12 1.700.000 30 % 7 month 510.000
Weighted expected sales volume 2.510.000
Maximum possible sales volume 4.200.000
The probabilities become more accurate the closer the expected order intake date comes and thus the short-term forecast is more accurate. The total volume can still vary because one either wins or loses a project, and does not get some percentage. However, taking all projects into consideration, the weighted expected sales volume is a good early indicator of future rev-enue from project business (Kühnapfel, 2017).
Expected X-month order volume
The two above KPIs can now be set in relation to the average time it takes between first knowledge of the business opportunity and revenue. This is two months for standard and up to one year for project business (Chpt. 6.4). This allows the calculation of the expected order volume, based on the above methods, for two or twelve months.
Table 5: Example of weighted expected sales volume calculation
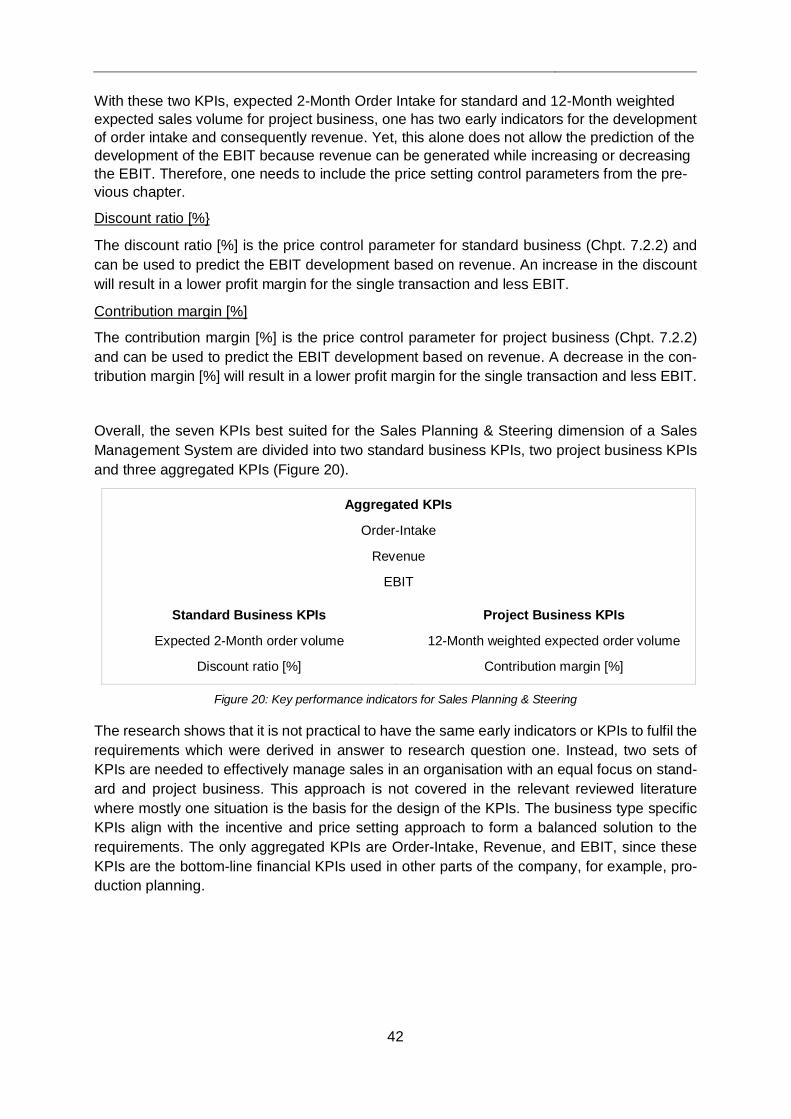
42
With these two KPIs, expected 2-Month Order Intake for standard and 12-Month weighted expected sales volume for project business, one has two early indicators for the development of order intake and consequently revenue. Yet, this alone does not allow the prediction of the development of the EBIT because revenue can be generated while increasing or decreasing the EBIT. Therefore, one needs to include the price setting control parameters from the pre-vious chapter.
Discount ratio [%}
The discount ratio [%] is the price control parameter for standard business (Chpt. 7.2.2) and can be used to predict the EBIT development based on revenue. An increase in the discount will result in a lower profit margin for the single transaction and less EBIT.
Contribution margin [%]
The contribution margin [%] is the price control parameter for project business (Chpt. 7.2.2) and can be used to predict the EBIT development based on revenue. A decrease in the con-tribution margin [%] will result in a lower profit margin for the single transaction and less EBIT.
Overall, the seven KPIs best suited for the Sales Planning & Steering dimension of a Sales Management System are divided into two standard business KPIs, two project business KPIs and three aggregated KPIs (Figure 20).
Aggregated KPIs
Order-Intake
Revenue
EBIT
Standard Business KPIs
Expected 2-Month order volume
Discount ratio [%]
Project Business KPIs
12-Month weighted expected order volume
Contribution margin [%]
Figure 20: Key performance indicators for Sales Planning & Steering
The research shows that it is not practical to have the same early indicators or KPIs to fulfil the requirements which were derived in answer to research question one. Instead, two sets of KPIs are needed to effectively manage sales in an organisation with an equal focus on stand-ard and project business. This approach is not covered in the relevant reviewed literature where mostly one situation is the basis for the design of the KPIs. The business type specific KPIs align with the incentive and price setting approach to form a balanced solution to the requirements. The only aggregated KPIs are Order-Intake, Revenue, and EBIT, since these KPIs are the bottom-line financial KPIs used in other parts of the company, for example, pro-duction planning.

43
7.2.4 Key Performance Indicators for Sales Force Management
The second area in question is the Sales Force Management part of the Sales Management System. The main requirements of this area are to ensure the availability of the sales force and to not only focus on output/behaviour control but to include input control as well. The first steps toward an integration of input control are already done in the incentive system, by defin-ing a non-financial parameter as incentive basis for management. However, the measure still needs to be defined. The question is thus: How to measure the development of business sup-porting capabilities in the sales force?
Again, there are two perspectives needed. First the early indicators, which assess the current development of Sales Force Management and give an early indication for the development of resulting KPIs. Second, the late indicators that assess the bottom line results of the imple-mented Sales Force Management measures (Kesten & Lühn, 2012). The list of potential KPIs includes in alphabetical order:
• Absenteeism frequency [LI] ((Mowday, Porter, & Steers, 1982)
• Adapted rate of continuous education [EI] (Kes-ten & Lühn, 2012)
• Complaints [LI] (Kesten & Lühn, 2012)
• Employee availability [LI] (Case interviews)
• Employee promotions [%] [LI] (Gabcanová, 2012)
• Employee Satisfaction Index [EI] (Kesten & Lühn, 2012)
• Fluctuation rate [EI] (Barenberg & Lohse, 2005)
• Introductory training effort [EI] (Barenberg & Lohse, 2005)
• Offer lead time [EI] (Kesten & Lühn, 2012)
• Order lead time [EI] (Case Interviews)
• Qualification index [EI] (Gabcanová, 2012)
• Rate of continuous education [EI] (Barenberg & Lohse, 2005)
• Share of successful offers [LI] (Kesten & Lühn, 2012)
• Time spend on feedback & evaluation [EI] (Case Interviews)
The KPIs to include in the Sales Management System are chosen based on the best fit to the requirement in chapter seven and alignment with the prerequisites in chapter six. The following four KPIs are needed to account for these prerequisites and requirements in the Sales Force Management dimension.
Share of successful offers
A suitable late indicator in the area of Sales Force Management is productivity, which can be assessed through the share of successful offers. Better training of the sales force leads a shorter offer lead time and a lower complaint rate. (Kesten & Lühn, 2012) Both factors contrib-ute to a higher customer experience and provide the extra service that is part of the company’s strategy.
Rate of continuous education
The corresponding early indicator for a share of successful offers is the rate of continuous education, including both time taken for feedback and training (Barenberg & Lohse, 2005). This measure should also be the basis for management incentives, as pointed out in chapter 7.2.1. However, it is important to have this incentive as a quota to be effective. Management should reach a certain rate of continuous education, which is defined at the beginning of the year, but after reaching the quota, no additional bonuses are paid for achieving a higher rate. This prevents using unnecessary training to receive higher bonuses.
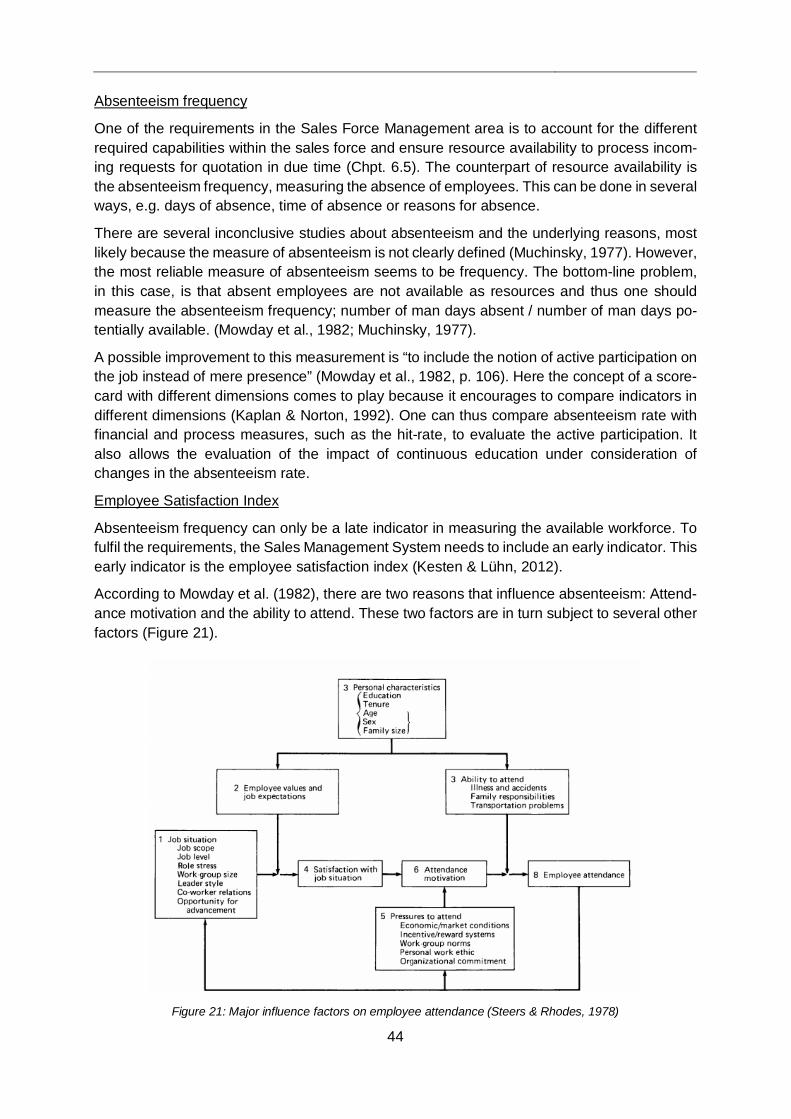
44
Absenteeism frequency
One of the requirements in the Sales Force Management area is to account for the different required capabilities within the sales force and ensure resource availability to process incom-ing requests for quotation in due time (Chpt. 6.5). The counterpart of resource availability is the absenteeism frequency, measuring the absence of employees. This can be done in several ways, e.g. days of absence, time of absence or reasons for absence.
There are several inconclusive studies about absenteeism and the underlying reasons, most likely because the measure of absenteeism is not clearly defined (Muchinsky, 1977). However, the most reliable measure of absenteeism seems to be frequency. The bottom-line problem, in this case, is that absent employees are not available as resources and thus one should measure the absenteeism frequency; number of man days absent / number of man days po-tentially available. (Mowday et al., 1982; Muchinsky, 1977).
A possible improvement to this measurement is “to include the notion of active participation on the job instead of mere presence” (Mowday et al., 1982, p. 106). Here the concept of a score-card with different dimensions comes to play because it encourages to compare indicators in different dimensions (Kaplan & Norton, 1992). One can thus compare absenteeism rate with financial and process measures, such as the hit-rate, to evaluate the active participation. It also allows the evaluation of the impact of continuous education under consideration of changes in the absenteeism rate.
Employee Satisfaction Index
Absenteeism frequency can only be a late indicator in measuring the available workforce. To fulfil the requirements, the Sales Management System needs to include an early indicator. This early indicator is the employee satisfaction index (Kesten & Lühn, 2012).
According to Mowday et al. (1982), there are two reasons that influence absenteeism: Attend-ance motivation and the ability to attend. These two factors are in turn subject to several other factors (Figure 21).
Figure 21: Major influence factors on employee attendance (Steers & Rhodes, 1978)
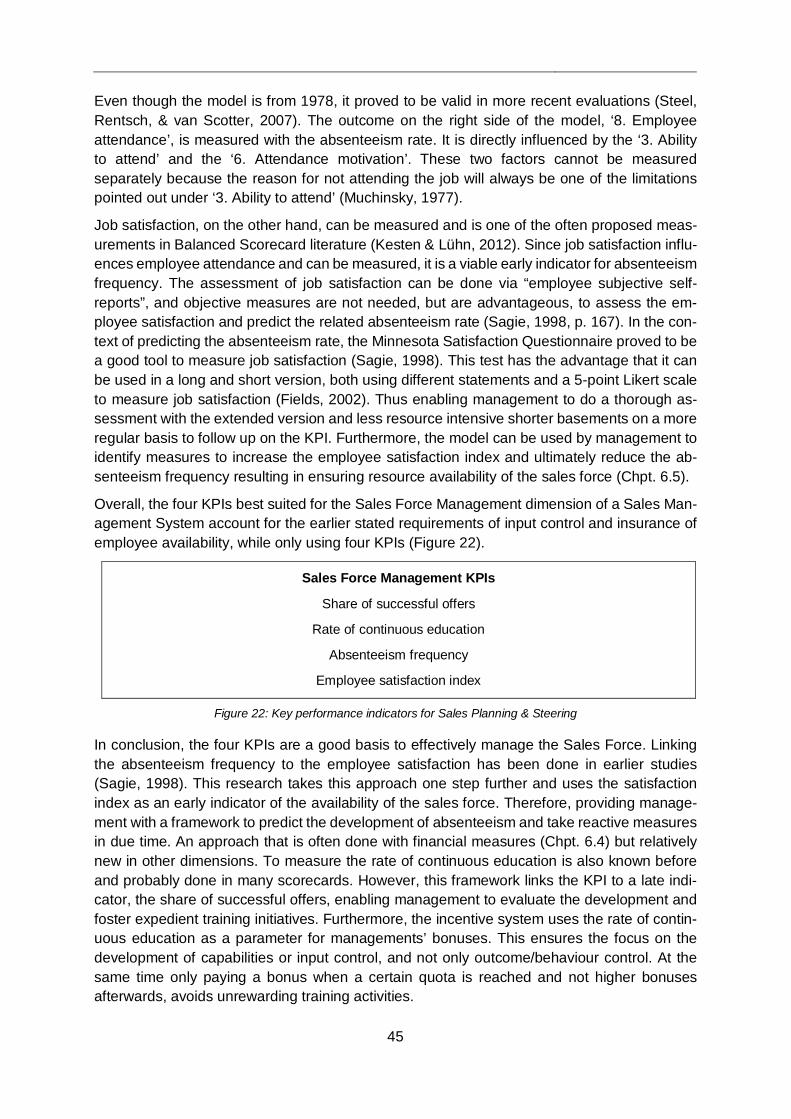
45
Even though the model is from 1978, it proved to be valid in more recent evaluations (Steel, Rentsch, & van Scotter, 2007). The outcome on the right side of the model, ‘8. Employee attendance’, is measured with the absenteeism rate. It is directly influenced by the ‘3. Ability to attend’ and the ‘6. Attendance motivation’. These two factors cannot be measured separately because the reason for not attending the job will always be one of the limitations pointed out under ‘3. Ability to attend’ (Muchinsky, 1977).
Job satisfaction, on the other hand, can be measured and is one of the often proposed meas-urements in Balanced Scorecard literature (Kesten & Lühn, 2012). Since job satisfaction influ-ences employee attendance and can be measured, it is a viable early indicator for absenteeism frequency. The assessment of job satisfaction can be done via “employee subjective self-reports”, and objective measures are not needed, but are advantageous, to assess the em-ployee satisfaction and predict the related absenteeism rate (Sagie, 1998, p. 167). In the con-text of predicting the absenteeism rate, the Minnesota Satisfaction Questionnaire proved to be a good tool to measure job satisfaction (Sagie, 1998). This test has the advantage that it can be used in a long and short version, both using different statements and a 5-point Likert scale to measure job satisfaction (Fields, 2002). Thus enabling management to do a thorough as-sessment with the extended version and less resource intensive shorter basements on a more regular basis to follow up on the KPI. Furthermore, the model can be used by management to identify measures to increase the employee satisfaction index and ultimately reduce the ab-senteeism frequency resulting in ensuring resource availability of the sales force (Chpt. 6.5).
Overall, the four KPIs best suited for the Sales Force Management dimension of a Sales Man-agement System account for the earlier stated requirements of input control and insurance of employee availability, while only using four KPIs (Figure 22).
Sales Force Management KPIs
Share of successful offers
Rate of continuous education
Absenteeism frequency
Employee satisfaction index
Figure 22: Key performance indicators for Sales Planning & Steering
In conclusion, the four KPIs are a good basis to effectively manage the Sales Force. Linking the absenteeism frequency to the employee satisfaction has been done in earlier studies (Sagie, 1998). This research takes this approach one step further and uses the satisfaction index as an early indicator of the availability of the sales force. Therefore, providing manage-ment with a framework to predict the development of absenteeism and take reactive measures in due time. An approach that is often done with financial measures (Chpt. 6.4) but relatively new in other dimensions. To measure the rate of continuous education is also known before and probably done in many scorecards. However, this framework links the KPI to a late indi-cator, the share of successful offers, enabling management to evaluate the development and foster expedient training initiatives. Furthermore, the incentive system uses the rate of contin-uous education as a parameter for managements’ bonuses. This ensures the focus on the development of capabilities or input control, and not only outcome/behaviour control. At the same time only paying a bonus when a certain quota is reached and not higher bonuses afterwards, avoids unrewarding training activities.
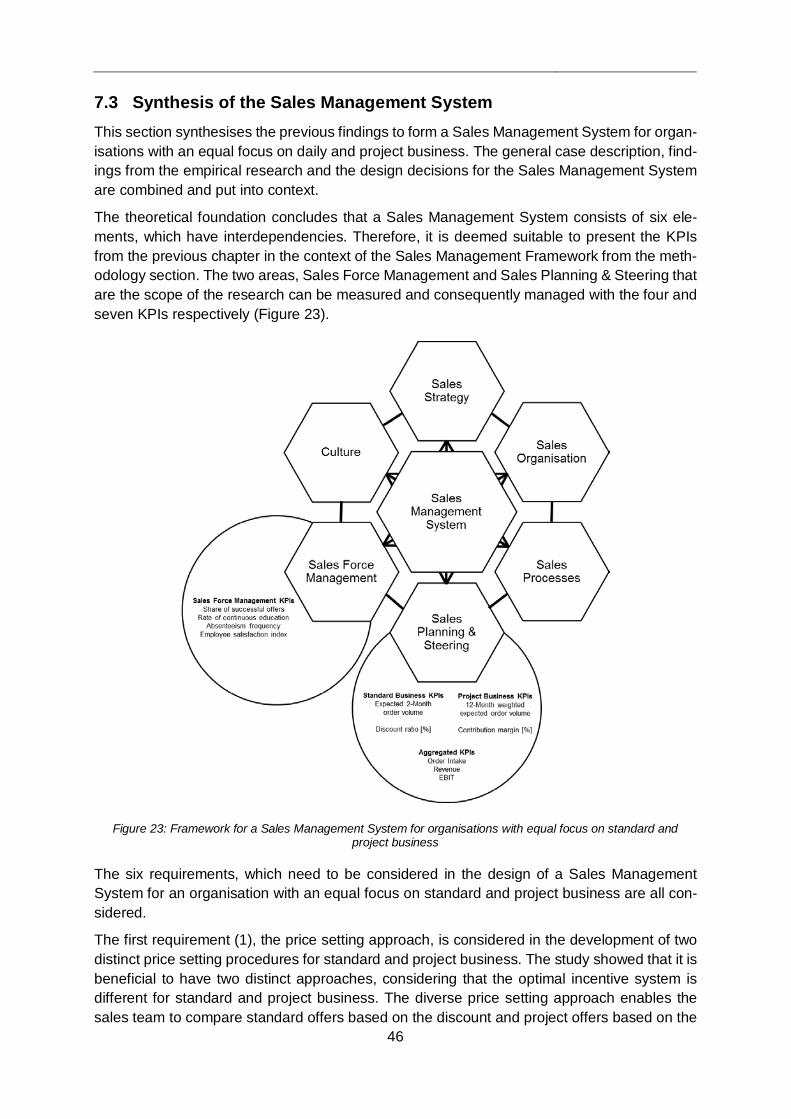
46
7.3 Synthesis of the Sales Management System This section synthesises the previous findings to form a Sales Management System for organ-isations with an equal focus on daily and project business. The general case description, find-ings from the empirical research and the design decisions for the Sales Management System are combined and put into context.
The theoretical foundation concludes that a Sales Management System consists of six ele-ments, which have interdependencies. Therefore, it is deemed suitable to present the KPIs from the previous chapter in the context of the Sales Management Framework from the meth-odology section. The two areas, Sales Force Management and Sales Planning & Steering that are the scope of the research can be measured and consequently managed with the four and seven KPIs respectively (Figure 23).
Figure 23: Framework for a Sales Management System for organisations with equal focus on standard and project business
The six requirements, which need to be considered in the design of a Sales Management System for an organisation with an equal focus on standard and project business are all con-sidered.
The first requirement (1), the price setting approach, is considered in the development of two distinct price setting procedures for standard and project business. The study showed that it is beneficial to have two distinct approaches, considering that the optimal incentive system is different for standard and project business. The diverse price setting approach enables the sales team to compare standard offers based on the discount and project offers based on the
47
contribution margin without the problem that the control parameters can give a false picture of reality, as it is described in the third requirement. At the same time, the three aggregated KPIs, Revenue, EBIT and Order Intake in the Sales Planning & Steering dimension allow an organ-isation to steer overall sales and plan the production process (2). While designing the KPIs, the need for early and late indicators (4) is considered in both Sales Management System dimensions.
In the Sales Force Management dimension, the Employee Satisfaction Index as the early in-dicator for the Absenteeism frequency is of special importance because it also fulfils the fifth requirement (5), the availability of the sales force resources. Even though the KPIs do not ensure that the sales force has a low absenteeism frequency, they provide management with an index to measure and consequently improve the employee satisfaction, leading to a low absenteeism frequency (Steers and Rhodes, 1978).
Finally, the second set of early and late KPIs make the connection back to the first requirement because they provide the necessary indicator to base management's incentives on. It is pointed out that, to ensure focus on input control (6), one needs a KPI that measures the development of capabilities and make it part of management's incentive plan. The rate of con-tinuous education is this indicator and links the Sales Force Management KPIs with the Sales Planning and Steering incentive plan, highlighting once again the interdependencies of a Sales Management System.
The next chapter deepens the discussion of the findings, their connection between each other and their significance in respect to the body of prior research on the topic.

48
8 Discussion
Cova and Holstius (1993), as well as Bansard et al. (1993), highlight the importance of re-search on sales management to expand into organisations with a focus on projects. Their findings are the beginning of a research stream that develops several sales management ap-proaches, which are suited for organisations selling projects. However, seeing the difficulties that the case company LESER faces, one needs to conclude that, while the research on the organisations with a focus on project business is valuable for some companies, the current research seems to neglect the fact that corporations can have both business opportunities governed by the same Sales Management System. This thesis developed a framework for sales management in organisations where standard and project business are equally im-portant.
First, the SAPEX framework suggested by Lips (2014), falls short of capturing all aspects of a Sales Management System. While it delivers valuable insight into five dimensions of sales management, it neglects the Culture element of a functioning Sales Management System. The culture is added as an element after broadening the scope and reviewing general organisa-tional theory. Consequently, it seems like a Sales Management System consist of six ele-ments: Sales Strategy, Sales Organisation, Sales Processes, Sales Planning & Steering, Sales Force Management and Culture.
It is assumed that these elements are all interdependent and decisions in one area affect de-cisions in other areas (e.g. Galbraith, 2014, 2014; e.g. Waterman et al., 1980, 1980). This hypothesis is not neglected during the research. On the contrary, further supporting arguments are found. The price setting approach (Chpt. 7.2.2) relies on the incentive system for the sales force, building a connection between Sales Planning & Steering and Sales Force Manage-ment. Furthermore, the optimal incentive system itself relies on the Sales Strategy and Culture (Chpt. 7.2.1) These findings are only secondary but open the possibility for future studies that should investigate the interdependencies in a Sales Management System, using cross-sec-tional and longitudinal approaches.
Second, the research provides an answer to the first research question
What requirements of a Sales Management System emerge from an equal fo-cus on standard and project business?
The detailed case study reveals six requirements for a Sales Management System for an or-ganisation with an equal focus on standard and project business in the areas of Sales Planning & Steering and Sales Force Management. The research is limited to these two areas because other studies with similar scopes had limited success in trying to solve “three or more direct control decisions” (Albers & Mantrala, 2008, p. 167). Because of this limitation, it is unreason-able to suspect no problems with the Sales Management System after implementing the pro-posed measures, because not all areas are optimised. Nevertheless, it addresses the most critical problem areas at the case company and similar companies like Roto Frank (Lukas & Lips, 2014).
One finding from the empirical data is that the five requirements that are measured today are also managed today, though not always efficiently. In contrast to that, the one requirement with no measurement attached, the need to not only focus on the outcome- or behaviour-based

49
control, but also on input control, is not managed today. This observation relates to a discus-sion in the scientific community as to whether or not something needs to be measured to be managed (Emiliani, 2000). One can define three main points of view in this discussion. Some argue that “if you can't measure it, you can't manage it” (Reichheld, 1994, p. 15), while others assume that “it is wrong to suppose that if you can't measure it, you can't manage it” (Deming, 2000, p. 35). A third view is that something gets managed when it is measured but it is im-portant what measurement is used to achieve the desired effect (Emiliani, 2000). The findings of this study support the view of Emiliani (2000) that aspects that are not measured are unlikely to be managed and that the right measurements are necessary to achieve an effective man-agement. This leads to the conclusion that a Sales Management System that measures the right KPIs is suitable for an organisation with an equal focus on standard and project business.
Third and most importantly, the study provides an initial framework of a Sales Management System that accounts for an equal focus on standard and project business, answering the second research question.
How can a Sales Management System be designed to fulfil the requirements from (1) and account for an equal focus on standard and project business?
One can see that a combination of KPIs which, together with a proposed incentive system and price setting approach, form a framework for a Sales Management System for organisations with an equal focus on standard and project business. It forms the first framework of this type and provides organisations like LESER with the means to eliminate some of their problems due to the equal focus on standard and project business.
The study points out that an organisation with equal focus on standard and project business should have a revenue based commission in standard business, even though this contradicts with the understanding that a margin based commission approach is superior in most cases (Homburg, Jensen et al., 2012; Söhnchen & Albers, 2010; Zoltners et al., 2006). However, the case study reveals two aspects not discussed in the literature. First, a revenue-based ap-proach does not require a margin calculation, making the offer process faster and saving re-sources in the standard business with its high number of transactions. Second, the knowledge of bottom-line profit is reserved for management. This might be different in an organisation with a more clan or adhocracy oriented culture, but for the case company’s management, it is of importance. This finding is of importance for many other organisations because the culture profile of the case company is like the average culture profile (Chpt. 5.5), making the finding applicable in a broader context.
For project business, on the other hand, the incentives should be partly revenue, partly margin based because the price pressure is higher and a COGS calculation is done in most cases anyway (Bansard et al., 1993). Furthermore, a single transaction with a low margin in standard business does not have the same effect on the company’s EBIT as a single transaction with a low margin in project business. The reason is that there are more and lower-value transactions, making the single transaction relatively insubstantial. In project business, there are fewer and higher-value transactions, making the single transaction substantial and the need to protect margins more pressing.
Zoltners et al. (2006) state, based on an analysis of the correlation between stress and perfor-mance for different tasks, that repetitive tasks profit from a higher stress level than tasks re-quiring skill and intellect. During the interviews, it became apparent that standard sales force

50
tasks are more repetitive, while the project sales force tasks require more skill and intellect. Resulting in the conclusion that, if the sales force can be clearly divided between standard and project business, then the proportion of a fixed salary should be higher in project business.
In the case of the optimal price setting approach the findings suggest that two different ap-proaches are necessary. While these results are not surprising, they do not represent the as-piration of management at the case company, which strives for only one price setting ap-proach. In a more general context, a bottom-down price setting approach is likely the best practice for an organisation with only standard business, and so is a bottom-up approach in only project business organisations.
Based on the requirements, the incentive system and price setting approach, the study sug-gests that a set of four KPIs in the Sales Force Management and seven KPIs in the Sales Planning & Steering dimensions, form an effective Sales Management System for organisa-tions with an equal focus on standard and project business.
The case study finds that one needs early and late indicators. This finding is supported by Kesten and Lühn (2012), who even suggest using early and late indicators for non-financial aspects. However, there is no research on what indicators are best used in an organisation with standard and project business. The findings in this thesis indicate two sets of KPIs are needed to effectively manage sales in an organisation with an equal focus on standard and project business.
The use of three aggregated late KPIs, together with two early indicators for each of the two business types, does not only contribute to eliminating the problems of the case company but, because the requirements of the case study were generalised, it provides all similar organisa-tions with a unique framework that was not provided before this thesis.
Initially, the lack of research in the area of Sales Management Systems for organisations with an equal focus on standard and project business is considered relevant, because the selling environment becomes more complex and managers are in need of updated frameworks to persist (Albers & Mantrala, 2008). Furthermore, the sales unit is typically the most expensive department but can at the same time be the driver of competitive advantage and improvement (Dannenberg & Zupancic, 2009). Consequently, a well-developed Sales Management System does not only assure the best use of resources but also drives competitive advantage and improvement.
Overall, the findings do not only provide practitioners with a new framework to resolve the initially stated root cause, the problem is that current frameworks do not allow management to steer standard business on an aggregated basis and evaluate single transactions for project business at the same time. They also offer the opportunity for further research in the advance-ment of the framework. The resulting practical and academic implications are presented in the following conclusion.
51
9 Conclusion
Many organisations struggle with an equal focus on standard and project management in their Sales Management System, resulting from an increasing importance of industrial projects in the last years and not adapting the Sales Management System accordingly. Current theory does not provide the right answers because organisations are mostly seen as either standard business or project business organisations, and no frameworks for dual focus are provided.
This thesis proposes such a framework for the Sales Planning & Steering and Sales Force Management areas of a Sales Management System. The findings suggest that it is possible to account for the initially identified differences, being the higher complexity and lower trans-action frequency of project business, through using two different price setting approaches and resulting KPIs for the two business types. These distinctive KPIs are augmented with three aggregated KPIs in Sales Planning & Steering and four common KPIs in Sales Force Manage-ment, allowing for both business types to be managed together.
It is clear that this approach solves the identified root cause, and resolves the conflict that one cannot give overall guidelines, evaluate single transactions and have aggregated KPIs within the same Sales Management System. The thesis concludes with a brief analysis of the impli-cations for future research and practitioners.
Implications for future research
This thesis, as it is mainly based on an exploratory case study and an inductive approach, provides several opportunities for future research. The opportunities can be divided into two fundamental areas, being further development or validation of the framework.
First, while the framework is elaborated in the areas of Sales Planning & Steering and Sales Force Management, the other four dimensions are merely taken into consideration as prereq-uisites. Thus, the research can be extended into the other areas, and future studies can add new elements to the Sales Management System. Principally, it is possible to proceed with all four areas, but the Sales Processes perspective seems the next logical step, as it is closely linked with the Sales Planning & Steering and Sales Force Management.
Second, current research assumes that there are interdependencies between all six elements of a Sales Management System. Arguments for this view occur during this thesis. It is of inter-est how these interdependencies express themselves and if there is a natural or best flow of alignment. A longitudinal study is deemed suitable to investigating this cause and effect rela-tionship.
Third, apart from future work concerning Sales Management Systems in an organisation with an equal focus on standard and project business, a general suggestion for research in this area is made: Initially, it is found that most research is done on either project or standard business organisations. In this thesis, a framework is proposed that contributes to solving the problems associated with an equal focus on standard and project business. It is, however, worth questioning if there is a point where an organisation should separate into two organisa-tions, one handling the standard and one handling the project business, to avoid all problems associated with a dual focus.

52
Finally, it is necessary to validate the framework and to measure how using the proposed Sales Management System affects an organisation. The findings from the study are not yet imple-mented in a practical situation, and it would be interesting to evaluate their acceptance and effect on sales performance, for example, using action research.
Implication for practitioners
The focus of the study is not to find a practical solution but to provide a universal, applicable framework for organisations with an equal focus on standard and project business. Therefore, it cannot be expected to implement the framework without adaptions, not even in the case company. In the implementation process, an organisation has to specify the incentive system based on their previous pay levels. Then the KPIs need to be implemented in the context of other KPIs management uses. Here it is important to set base levels and goals. Therefore, it can be beneficial to track those KPIs that are new to the company in the background for some time, to evaluate their natural variation, before basing incentive and business decisions on them. However, even though the framework needs additional clarification before implementa-tion, the research provides valuable insight for practitioners and contributes to the reduction of problems associated with an equal focus on standard and project business.
First, using the proposed incentive and price setting approaches, as well as the KPIs will help to eliminate problems with the dual focus on standard and project business. While the various aspects of the proposed framework can be implemented on their own, the implementation of all aspects is beneficial, because the KPIs are based on the price setting approach, which is in turn based on the incentive system. These interdependencies make a partial implementation difficult and lead to the second implication for practitioners.
It is crucial for managers to be aware of the interdependencies between all elements of a Sales Management System. This implies that taking other areas into consideration while facing chal-lenges in a specific area can prove to be useful. Furthermore, the implications of changes should always be considered in the context of the entire system.
Third, while using a set of KPIs for only standard, another for only project and then three aug-mented KPIs seems to increase complexity, it reduces the hidden complexity in the horizontal and vertical sales processes because both reporting and customer request fulfilment become smoother. The same applies for using two distinct price setting approaches instead of one. This implies that managers should not be afraid to consider increasing obvious complexity if concealed complexity can be decreased.
As the research suggests, an organisation with an equal focus on standard and project busi-ness will profit from implementing the framework and adapting it to their specific needs. So does the scientific community, where the framework and the empirical findings provide the starting point for future research in this specific area of Sales Management Systems.

53
References
Ahrens, V. (2014). Abschlussarbeiten richtig gliedern: In Naturwissenschaften, Technik und Wirtschaft. vdf Hochschulverlag AG.
Albers, S., & Mantrala, M. (2008). Models for Sales Management Decisions. In F. S. Hillier & B. Wierenga (Eds.), International series in operations research & management science. Handbook of Marketing Decision Models (Vol. 121, pp. 163–210). Boston, MA: Springer US.
Amabile, T. M. (1997). Motivating Creativity in Organizations: On Doing What You Love and Loving What You Do. California Management Review, 40(1), 39–58.
Anderson, E., & Oliver, R. L. (1987). Perspectives on Behavior-Based versus Outcome-Based Salesforce Control Systems. Journal of Marketing, 51(4), 76–88.
Baldauf, A., Piercy, N. F., & Cravens, D. W. (2005). Sales Management Control Research: Synthesis and an Agenda For Future Research. Journal of Personal Selling & Sales Man-agement, 25(1), 7–26.
Baldauf, A., Piercy, N. F., & Cravens, D. W. (2011). Examining Business Strategy, Sales Management, and Salesperson Antecedents of Sales Organization Effectiveness. Journal of Personal Selling & Sales Management, 21(2), 109–122.
Bansard, D., Cova, B., & Salle, R. (1993). Project marketing: Beyond competitive bidding strategies. International Business Review, 2(2), 125–141.
Barenberg, S., & Lohse, U. (2005). Ganzheitlicher strategiefokussierter Managementansatz für Finanzdienstleistungsunternehmen: Relevanz und Aspekte der Einführung. Zeitschrift für die gesamte Versicherungswissenschaft, 94(3), 391–422.
Browne, J. (1997, May). Climate Change Speech, Stanford University. Retrieved from https://assets.documentcloud.org/documents/2623268/bp-john-browne-stanford-1997-cli-mate-change-speech.pdf, Accessed 24.04.2017
Bryman, A., & Bell, E. (2015). Business research methods (Fourth edition): Oxford University Press.
Cameron, K. S., & Quinn, R. E. (2006). Diagnosing and changing organizational culture: Based on the competing values framework (Rev. ed.). The Jossey-Bass Business & Man-agement Series. San Francisco, Calif.: Jossey-Bass.
Cova, B., & Holstius, K. (1993). How to create competitive advantage in project business. Journal of Marketing Management, 9(2), 105–121.
Dannenberg, H., & Zupancic, D. (Eds.). (2009). SpringerLink : Bücher. Excellence in Sales: Optimising Customer and Sales Management. Wiesbaden: Gabler Verlag / Springer Fach-medien Wiesbaden, Wiesbaden.
Deming, W. E. (2000). The new economics:: For Industry, Government, Education (2nd). London: MIT Press.
Easterbrook, S., Singer, J., Storey, M.-A., & Damian, D. (2008). Selecting Empirical Methods for Software Engineering Research. In F. Shull, J. Singer, & D. I. K. Sjøberg (Eds.), Guide to advanced empirical software engineering (pp. 285–311). Springer London.

54
Emiliani, M. L. (2000). The false promise of “what gets measured gets managed”. Manage-ment Decision, 38(9), 612–615.
Fields, D. L. (2002). Taking the measure of work: A guide to validated scales for organiza-tional research and diagnosis / Dail L. Fields. Thousand Oaks, California: Sage.
Gabcanová, I. (2012). Human Resources Key Performance Indicators. Journal of Competi-tiveness, 4(1).
Galbraith, J. R. (2009). Designing matrix organizations that actually work: How IBM, Procter & Gamble, and others design for success / Jay R. Galbraith (1st ed.). The Jossey-Bass Business & Management Series. San Francisco, Calif.: Jossey-Bass.
Galbraith, J. R. (2014). Designing organizations: Strategy, structure, and process at the busi-ness unit and enterprise levels (Third edition). The Jossey-Bass Business & Management Series: Jossey-Bass.
Guba, E. G., & Lincoln, Y. S. (1994). Competing Paradigms in Qualitative Research. In N. K. Denzin & Y. S. Lincoln (Eds.), The Sage handbook of qualitative research (pp. 105–117). Thousand Oaks: Sage.
Homburg, C., Jensen, O., & Hahn, A. (2012). How to Organize Pricing?: Vertical Delegation and Horizontal Dispersion of Pricing Authority. Journal of Marketing, 76(5), 49–69.
Homburg, C., Schäfer, H., & Schneider, J. (2012). Sales excellence: Systematic sales man-agement. Management for professionals. Berlin, New York: Springer.
Ingram, T. N., LaForge, R. W., Avila, R. A., Schwepker, C. H., & Williams, M. R. (2004). Sales management: Analysis and decision making (4th): South-Western College Pub.
Jaworski, B. J. (1988). Toward a Theory of Marketing Control: Environmental Context, Con-trol Types, and Consequences. Journal of Marketing, 52(3), 23.
Kaplan, R. S., & Norton, D. (1992). The Balanced Scorecard--Measures That Drive Perfor-mance. Harvard Business Review, 70(1), 71–79.
Kaplan, R. S., & Norton, D. (1996). Using the Balanced Scorecard as a Strategic Manage-ment System. Harvard Business Review, 74(1), 75–85.
Kesten, R., & Lühn, M. (2012). Controlling für den internationalen Vertrieb. In L. Binckebanck & C. Belz (Eds.), Internationaler Vertrieb. Grundlagen, Konzepte und Best Practices für Erfolg im globalen Geschäft (pp. 645–663). Wiesbaden: Springer Gabler.
Khan, M. T. (2014). The Concept of 'Marketing Mix' and its Elements: (A Conceptual Review Paper). International Journal of Information, Business and Management, 6(2), 95–107.
Kotler, P. (2002). A framework for marketing management. Upper Saddle River, N.J., Lon-don: Prentice Hall.
Kühnapfel, J. B. (2017). Vertriebscontrolling: Methoden im praktischen Einsatz (2. Auflage). Wiesbaden, Germany: Springer Science and Business Media; Springer Gabler.
Lincoln, Y. S., & Guba, E. G. (1985). Naturalistic inquiry. Beverly Hills, Calif.: Sage Publica-tions.
55
Lips, T. (2014). Sales Performance Excellence als Erfolgsfaktor auf dem Weg zum globalen Unternehmen. In F. Keuper & R. Sauter (Eds.), SpringerLink : Bücher. Unternehmens-steuerung in der produzierenden Industrie. Konzepte und Best Practices (pp. 233–244). Wiesbaden: Gabler.
Lukas, J., & Lips, T. (2014). Globale Vertriebssteuerung im B2B-Produkt- und Projektge-schäft bei Roto Frank. In F. Keuper & R. Sauter (Eds.), SpringerLink : Bücher. Unterneh-menssteuerung in der produzierenden Industrie. Konzepte und Best Practices (pp. 259–267). Wiesbaden: Gabler.
Meindl, J. (2016). LESER Sales Partner Development.
Merchant, K. A., & van der Stede, W. A. (2007). Management control systems: Performance measurement, evaluation and incentives / Kenneth Merchant, Wim A. Van der Stede (2nd ed.). Harlow: FT Prentice Hall.
Mowday, R. T., Porter, L. W., & Steers, R. M. (1982). Employee–Organization Linkages: The psychology of commitment, absenteeism and turnover. Organizational and occupational psychology. New York, London: Academic Press.
Muchinsky, P. M. (1977). Employee absenteeism: A review of the literature. Journal of Voca-tional Behavior, 10(3), 316–340.
Müller, S. (2009). Führung im Vertrieb: Zentrale Konzepte in der internationalen Literatur. Controlling & Management, 53(2), 12–17.
Niven, P. R. (2014). Balanced scorecard evolution: A dynamic approach to strategy execu-tion. Wiley corporate F&A series: John Wiley & Sons.
Piercy, N. F., Cravens, D. W., & Lane, N. (2009). Sales management control level and com-petencies: Antecedents and consequences. Industrial Marketing Management, 38(4), 459–467.
Pizam, A. (2011). The return of the fifth marketing mix P. International Journal of Hospitality Management, 30(4), 763–764.
Reichheld, F. F. (1994). Loyalty and the renaissance of marketing. Marketing Management, 2(4), 10–21.
Robson, C. (2011). Real world research: A resource for users of social research methods in applied settings / Colin Robson (3rd ed.). Oxford: Wiley-Blackwell.
Runeson, P., & Höst, M. (2009). Guidelines for conducting and reporting case study research in software engineering. Empirical Software Engineering, 14(2), 131–164.
Sagie, A. (1998). Employee Absenteeism, Organizational Commitment, and Job Satisfaction: Another Look. Journal of Vocational Behavior, 52(2), 156–171.
Santoriello, A. (2015). Assessing Unique Core Values with the Competing Values Frame-work:. The CCVI Technique for Guiding Organizational Culture Change (Dissertation). Portland state university.
Schein, E. H. (1996). Culture: The Missing Concept in Organization Studies. Administrative Science Quarterly, 41(2), 229.
Schein, E. H. (2004). Organizational culture and leadership (3rd ed.). Jossey-Bass business & management series. San Francisco, Calif., London: Jossey-Bass.
56
Scott, T., Mannion, R., Davies, H., & Marshall, M. (2003). The Quantitative Measurement of Organizational Culture in Health Care: A Review of the Available Instruments. Health Ser-vices Research, 38(3), 923–945.
Srivastava, R. K., Run, E. C. de, & Fam, K. (2008). Sales management (1st ed.). New Delhi: Excel Books.
Steel, R. P., Rentsch, J. R., & van Scotter, J. R. (2007). Timeframes and Absence Frame-works: A Test of Steers and Rhodes' (1978) Model of Attendance. Journal of Manage-ment, 33(2), 180–195.
Steers, R. M., & Rhodes, S. R. (1978). Major influences on employee attendance: A process model. Journal of Applied Psychology, 63(4), 391–407.
Storbacka, K., Ryals, L., Davies, I. A., & Nenonen, S. (2009). The changing role of sales: Viewing sales as a strategic, cross‐functional process. European Journal of Marketing, 43(7/8), 890–906.
Söhnchen, F., & Albers, S. (2010). Pipeline management for the acquisition of industrial pro-jects. Industrial Marketing Management, 39(8), 1356–1364.
Waterman, R. H., Peters, T. J., & Phillips, J. R. (1980). Structure is not organization. Busi-ness Horizons, 23(3), 14–26.
Yin, R. K. (2014). Case Study Research: Design and methods (Fifth edition). London: Sage.
Zoltners, A. A., Sinha, P., & Lorimer, S. E. (2006). The complete guide to sales force incen-tive compensation: How to design and implement plans that work. New York: American Management Association.

XI
Appendix
Appendix 1: Competing value framework culture descriptions (long) ................................... XII
Appendix 2: Competing value framework questionnaire ..................................................... XIII
Appendix 3: Example Interview Guide for the Case Study ................................................... XV
Appendix 4: Interview Guide Armatec AB ........................................................................... XVI

XII
Appendix 1: Competing value framework culture descriptions (long)
(Cameron & Quinn, 2006, p. 66)
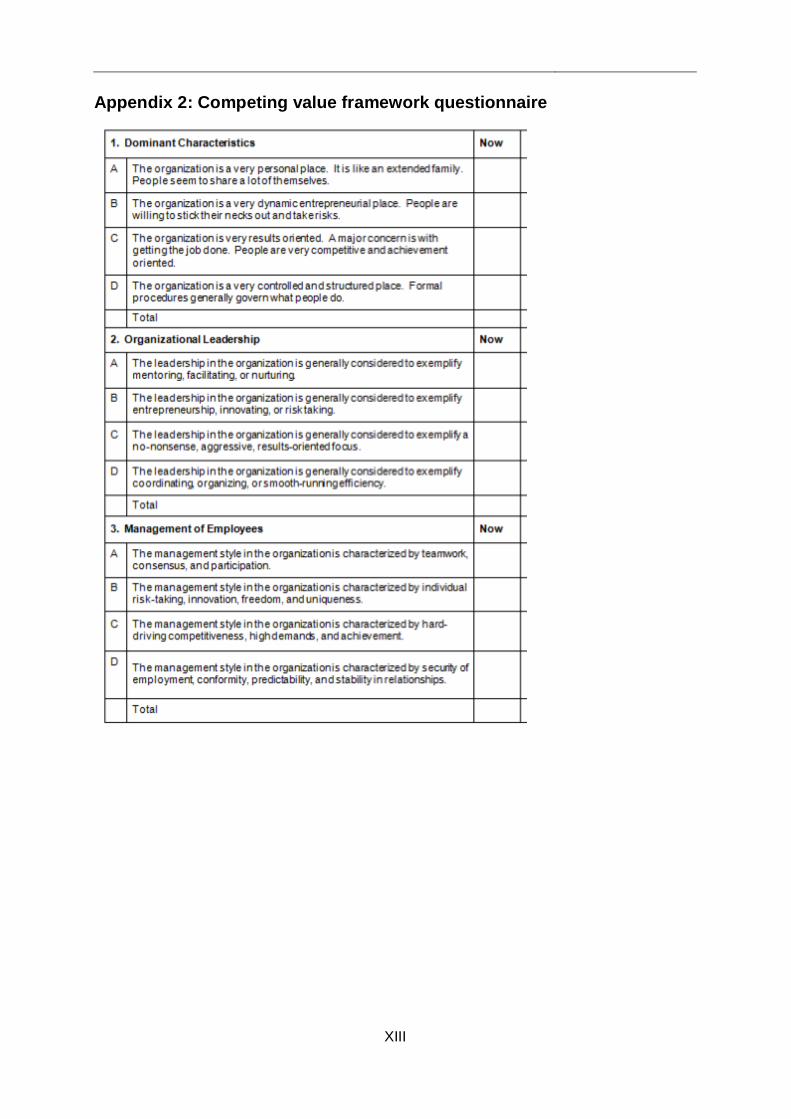
XIII
Appendix 2: Competing value framework questionnaire
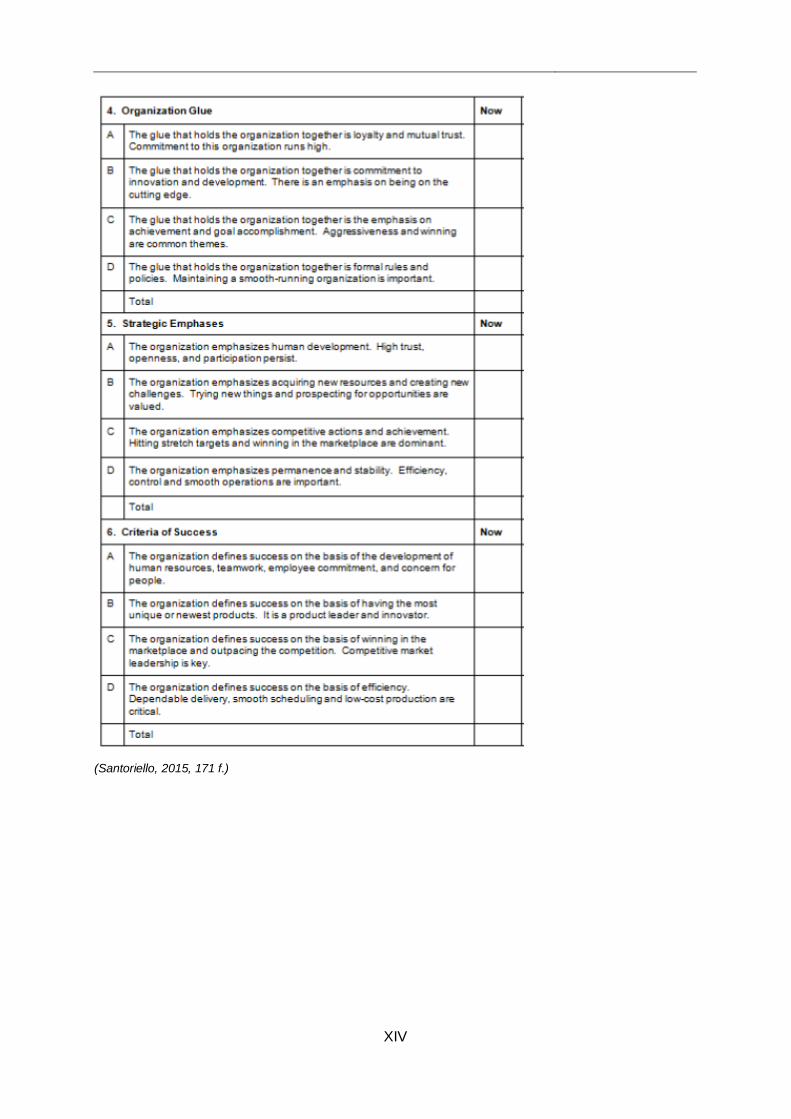
XIV
(Santoriello, 2015, 171 f.)
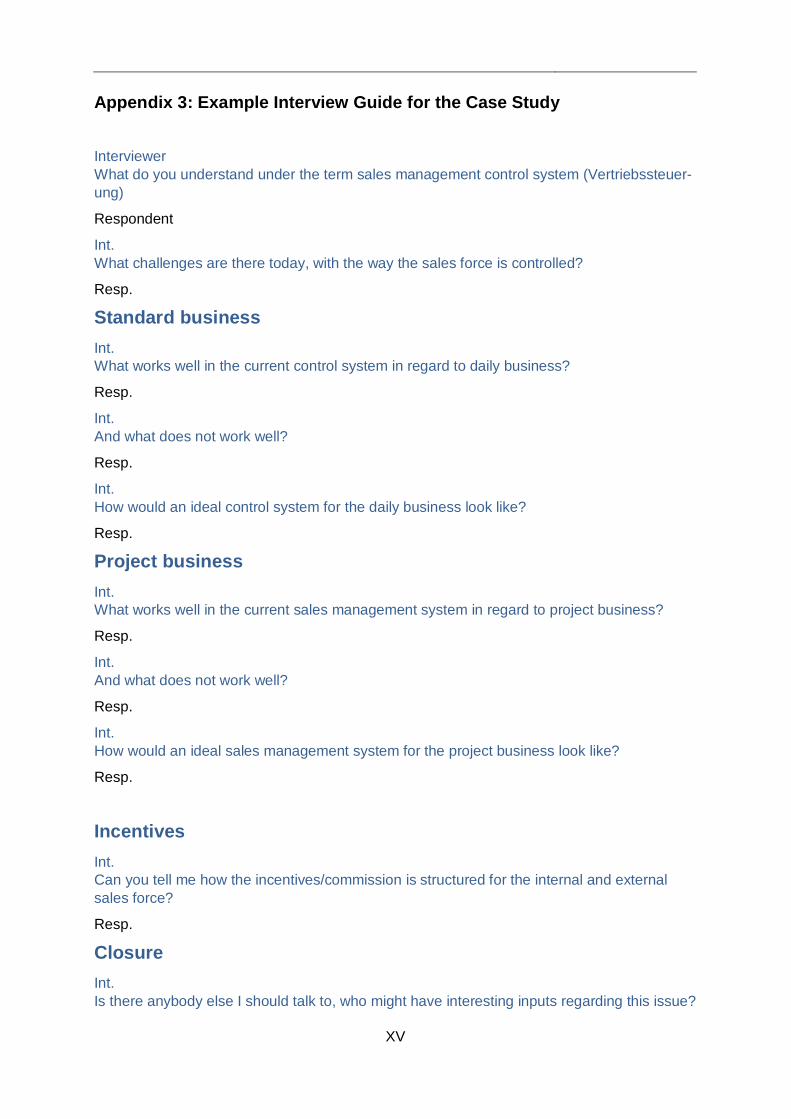
XV
Appendix 3: Example Interview Guide for the Case Study
Interviewer What do you understand under the term sales management control system (Vertriebssteuer-ung)
Respondent
Int. What challenges are there today, with the way the sales force is controlled?
Resp.
Standard business Int. What works well in the current control system in regard to daily business?
Resp.
Int. And what does not work well?
Resp.
Int. How would an ideal control system for the daily business look like?
Resp.
Project business
Int. What works well in the current sales management system in regard to project business?
Resp.
Int. And what does not work well?
Resp.
Int. How would an ideal sales management system for the project business look like?
Resp.
Incentives Int. Can you tell me how the incentives/commission is structured for the internal and external sales force?
Resp.
Closure Int. Is there anybody else I should talk to, who might have interesting inputs regarding this issue?
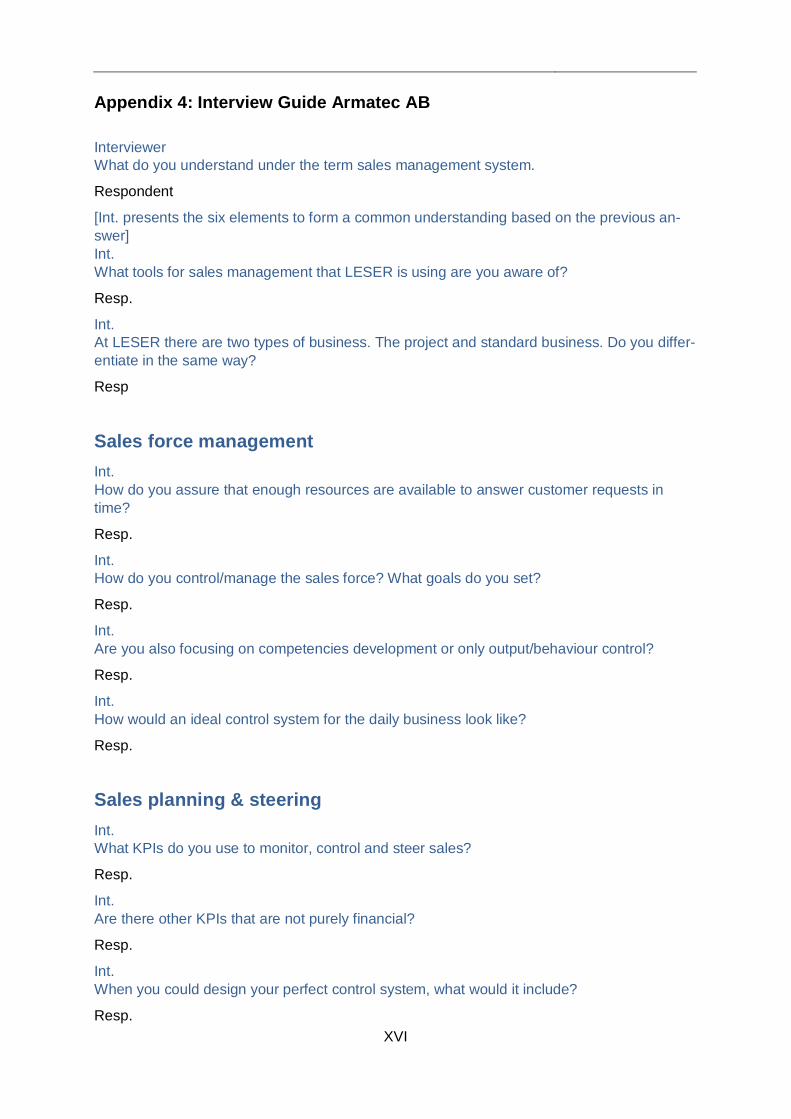
XVI
Appendix 4: Interview Guide Armatec AB Interviewer What do you understand under the term sales management system.
Respondent
[Int. presents the six elements to form a common understanding based on the previous an-swer] Int. What tools for sales management that LESER is using are you aware of?
Resp.
Int. At LESER there are two types of business. The project and standard business. Do you differ-entiate in the same way?
Resp
Sales force management Int. How do you assure that enough resources are available to answer customer requests in time?
Resp.
Int. How do you control/manage the sales force? What goals do you set?
Resp.
Int. Are you also focusing on competencies development or only output/behaviour control?
Resp.
Int. How would an ideal control system for the daily business look like?
Resp.
Sales planning & steering
Int. What KPIs do you use to monitor, control and steer sales?
Resp.
Int. Are there other KPIs that are not purely financial?
Resp.
Int. When you could design your perfect control system, what would it include?
Resp.

XVII
Incentives Int. Can you tell me how the incentives/commission is structured for the internal and external sales force?
Resp.
Closure Int. Is there anybody else I should talk to, who might have interesting inputs regarding this issue?