design of a rating system for suppliers of printed wiring boards at hamilton sundstrand
DESCRIPTION
DESIGN OF A RATING SYSTEM FOR SUPPLIERS OF PRINTED WIRING BOARDS AT HAMILTON SUNDSTRAND. By: Travis Bossidy, IE And Patrick Dabrowski, IE Industrial Advisor: Steve Webster Faculty Advisor: Dr. Abdul Kamal. Introduction. - PowerPoint PPT PresentationTRANSCRIPT

DESIGN OF A RATING SYSTEM FOR DESIGN OF A RATING SYSTEM FOR SUPPLIERS OF PRINTED WIRING SUPPLIERS OF PRINTED WIRING
BOARDS AT HAMILTON SUNDSTRANDBOARDS AT HAMILTON SUNDSTRAND
By:
Travis Bossidy, IE
And
Patrick Dabrowski, IE
Industrial Advisor: Steve Webster
Faculty Advisor: Dr. Abdul Kamal

IntroductionIntroduction
• Needs to improve the way they rate supplier quality for printed wiring boards (PWB).
• Current system uses PPM• Problem: system only takes into account
number of defective parts• Other aspects of quality have to be
considered
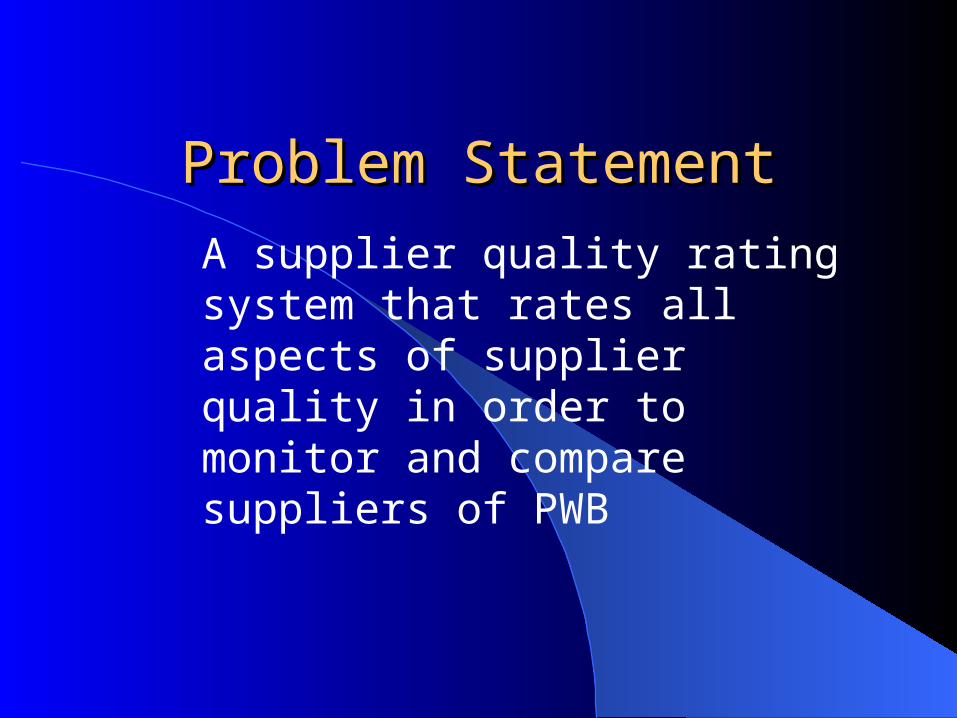
Problem StatementProblem Statement
A supplier quality rating system that rates all aspects of supplier quality in order to monitor and compare suppliers of PWB

Components of Supplier Components of Supplier QualityQuality
PPM
Complexity
Criticality
PAIN
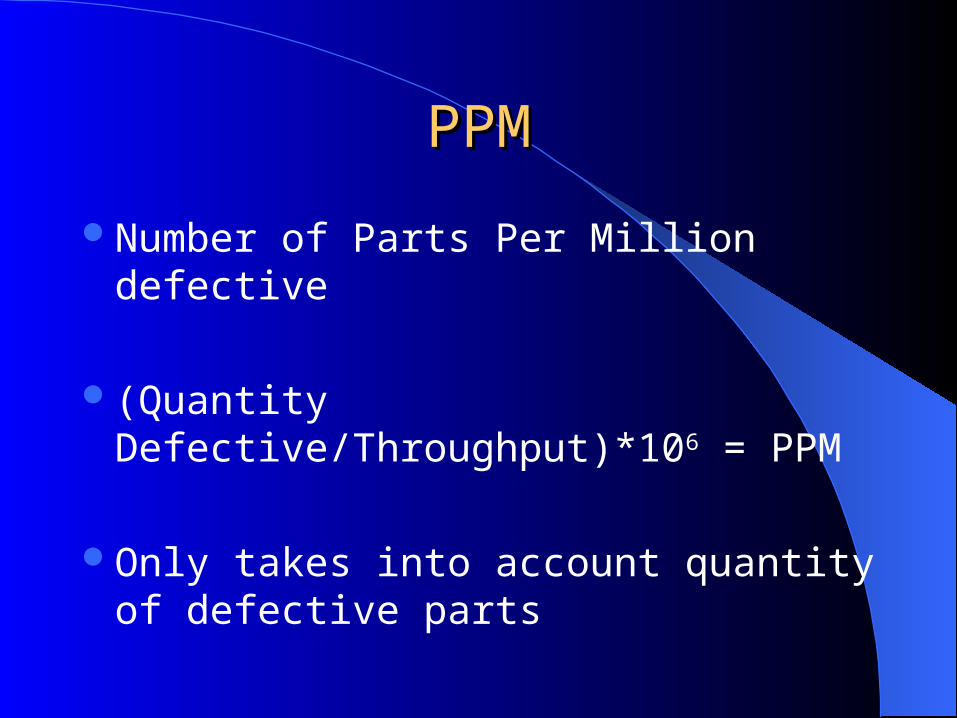
PPMPPM
Number of Parts Per Million defective
(Quantity Defective/Throughput)*106 = PPM
Only takes into account quantity of defective parts

ComplexityComplexity
All PWB differSimpler parts are easier to make according
to specsSuppliers need to be rewarded for making
complex parts
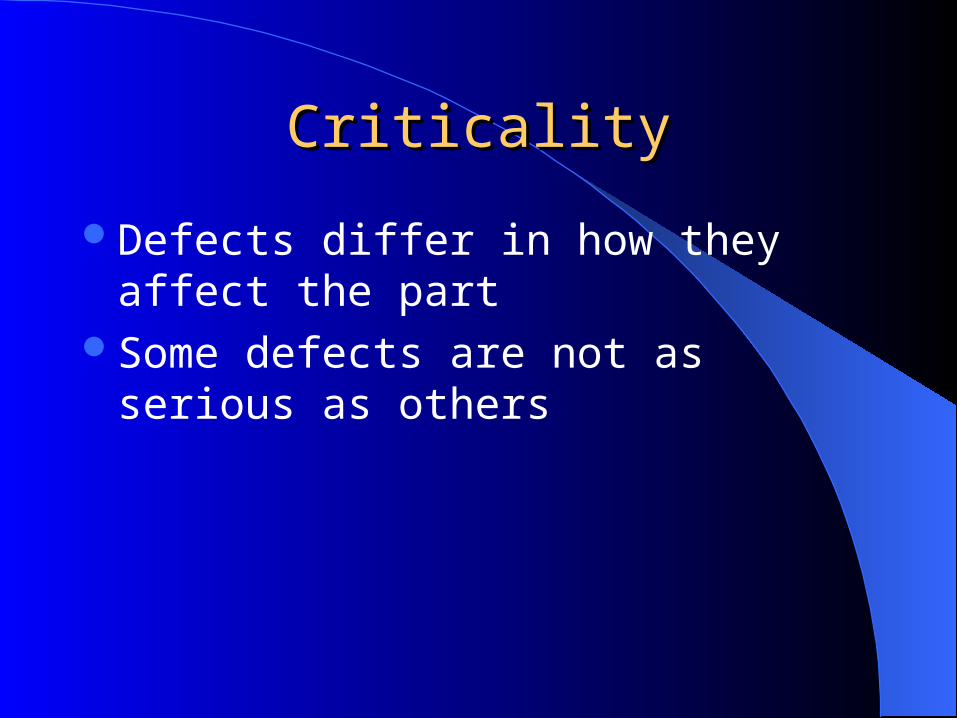
CriticalityCriticality
Defects differ in how they affect the partSome defects are not as serious as others
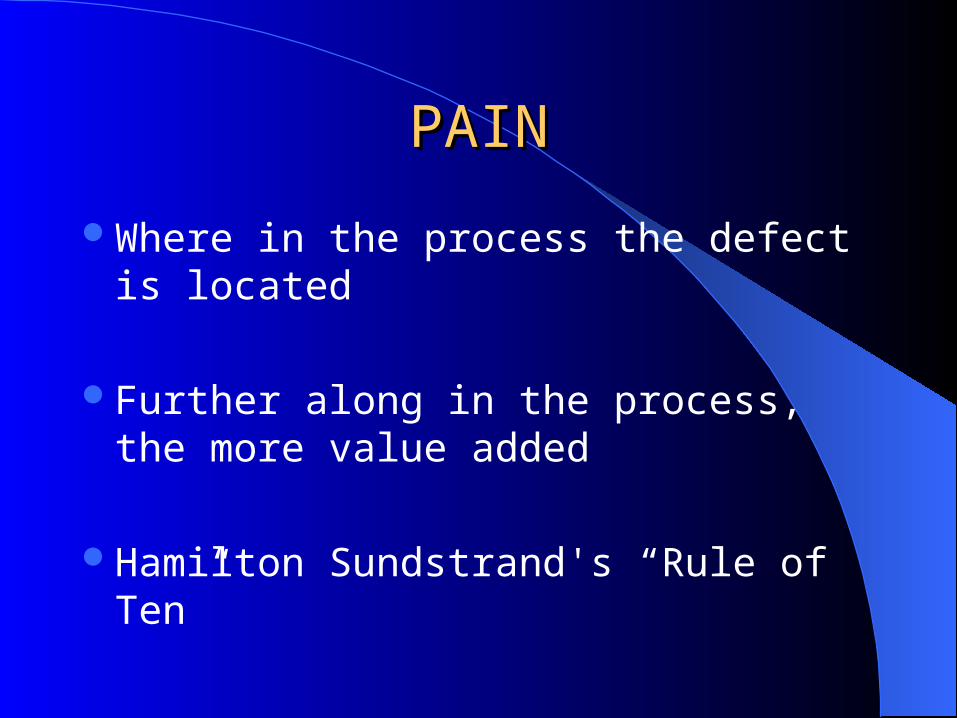
PAINPAIN
Where in the process the defect is located
Further along in the process, the more value added
Hamilton Sundstrand's “Rule of Ten”
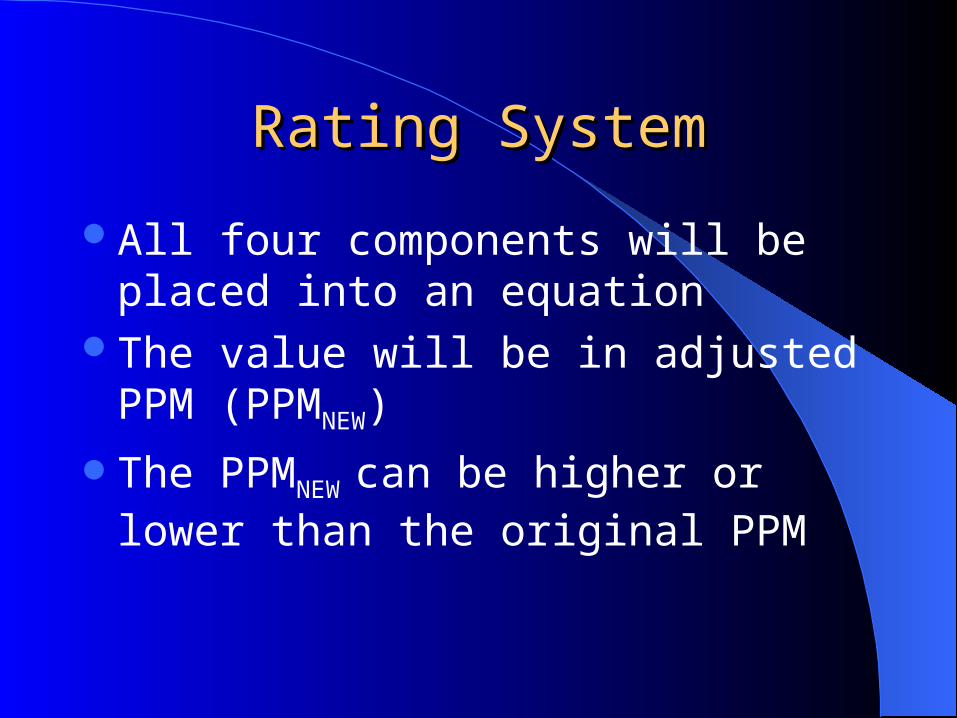
Rating SystemRating System
All four components will be placed into an equation
The value will be in adjusted PPM (PPMNEW)
The PPMNEW can be higher or lower than the original PPM
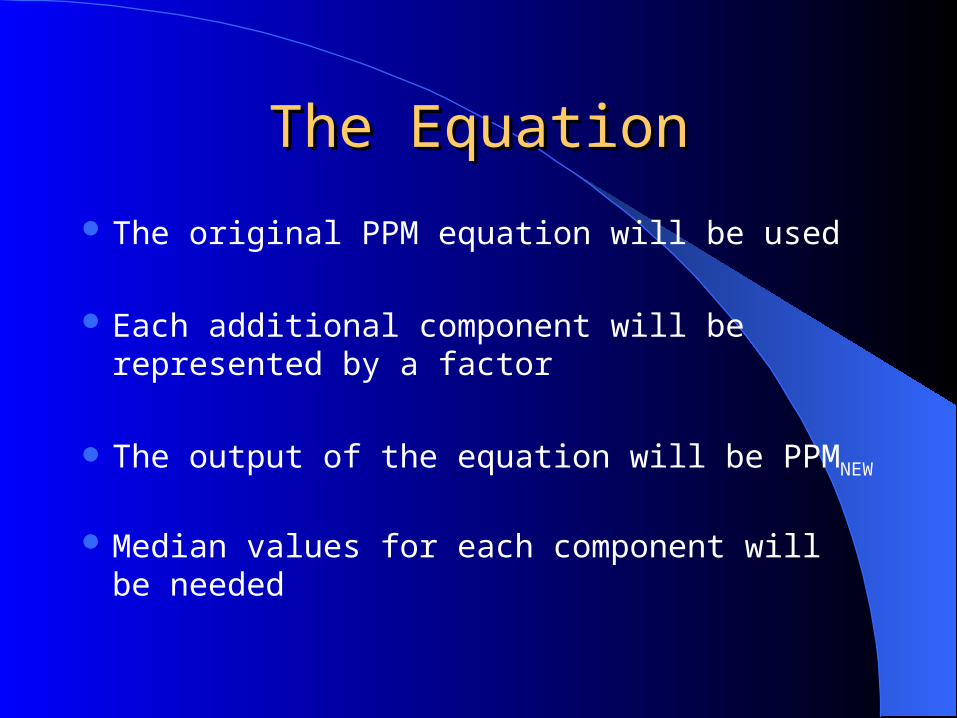
The EquationThe Equation
The original PPM equation will be used
Each additional component will be represented by a factor
The output of the equation will be PPMNEW
Median values for each component will be needed
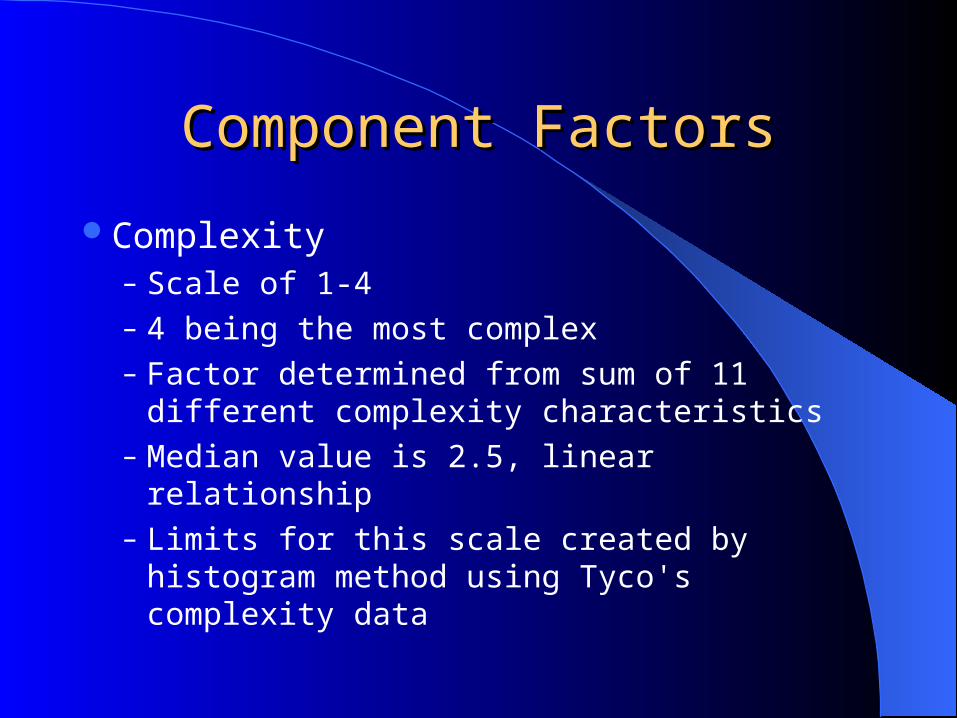
Component FactorsComponent Factors
Complexity– Scale of 1-4– 4 being the most complex– Factor determined from sum of 11 different
complexity characteristics– Median value is 2.5, linear relationship– Limits for this scale created by histogram
method using Tyco's complexity data
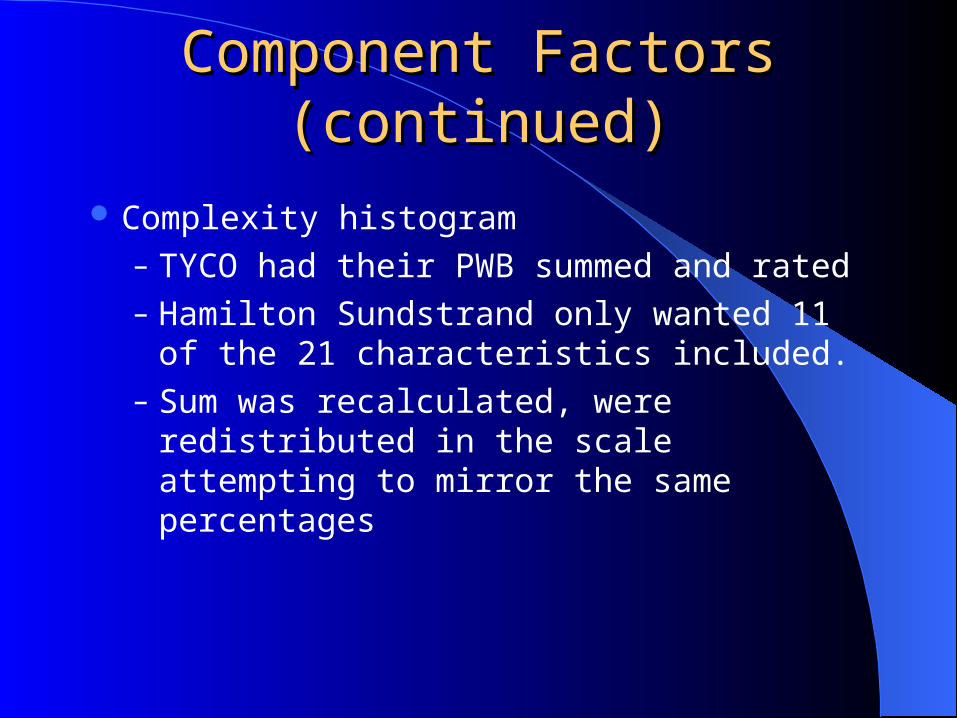
Component Factors (continued)Component Factors (continued)
Complexity histogram– TYCO had their PWB summed and rated– Hamilton Sundstrand only wanted 11 of the
21 characteristics included.– Sum was recalculated, were redistributed in
the scale attempting to mirror the same percentages
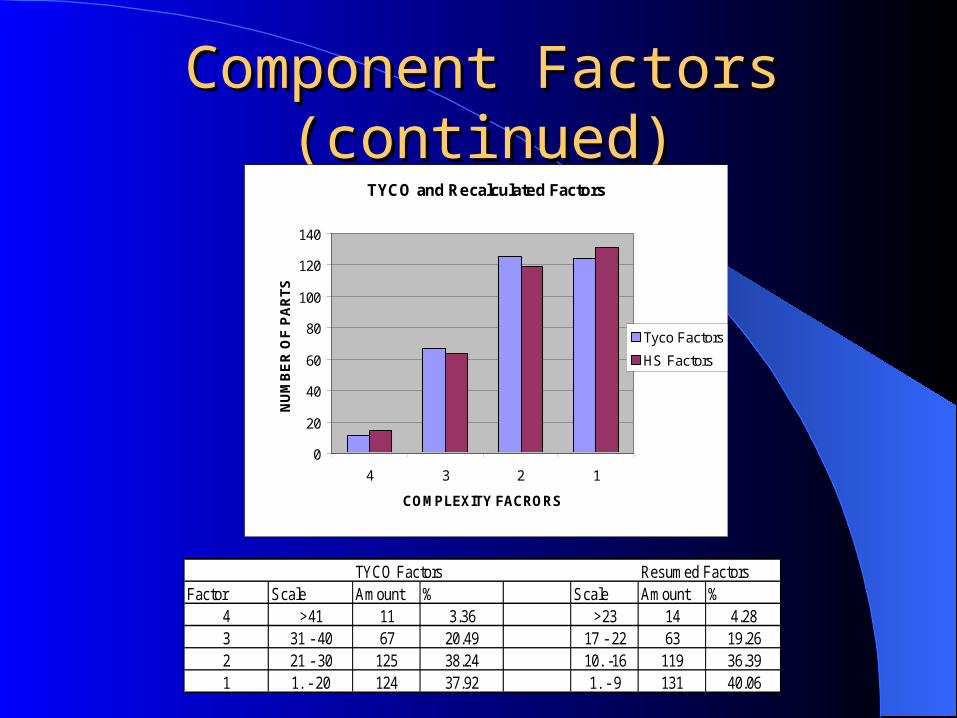
Component Factors (continued)Component Factors (continued)TYCO and Recalculated Factors
0
20
40
60
80
100
120
140
4 3 2 1
COMPLEXITY FACRORS
NU
MB
ER
OF
PA
RT
S
Tyco Factors
HS Factors
TYCO Factors Resumed FactorsFactor Scale Amount % Scale Amount %
4 >41 11 3.36 >23 14 4.283 31 - 40 67 20.49 17 - 22 63 19.262 21 - 30 125 38.24 10. -16 119 36.391 1. - 20 124 37.92 1. - 9 131 40.06
Component Factors (continued)Component Factors (continued)
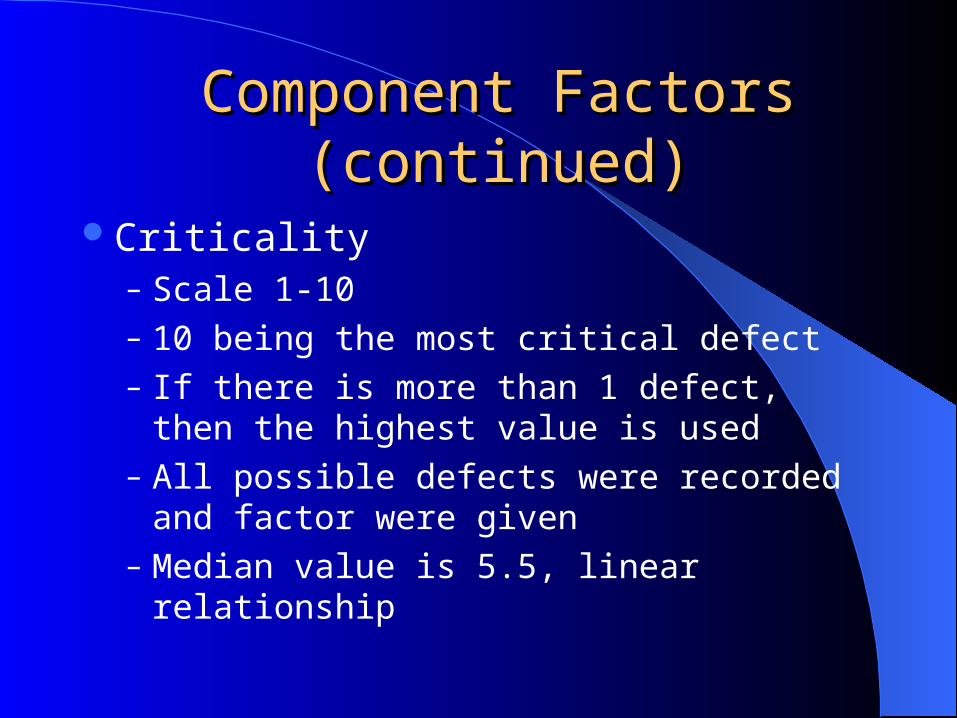
Criticality– Scale 1-10– 10 being the most critical defect– If there is more than 1 defect, then the highest
value is used– All possible defects were recorded and factor
were given– Median value is 5.5, linear relationship

Component Factors (continued)Component Factors (continued) PAIN
– Each step in the process was assigned a value from 10-1000– 10 being receiving inspection, 1000 being field failure– Steps had to be assigned numeric values
HS-Code Step in Process PAIN Numeric StepCRM Production Return 1000 3TEST FAILUREFinal ATP 100 2TEST FAILUREEss Vibe/Thermal 80 1.8TEST FAILUREPreliminary ATP 60 1.6SHOP Functional Test 40 1.4SHOP Cable Test/Genrad 30 1.3SHOP ASSY 20 1.2RI Rec Inspection 10 1

Component Factors (continued)Component Factors (continued)
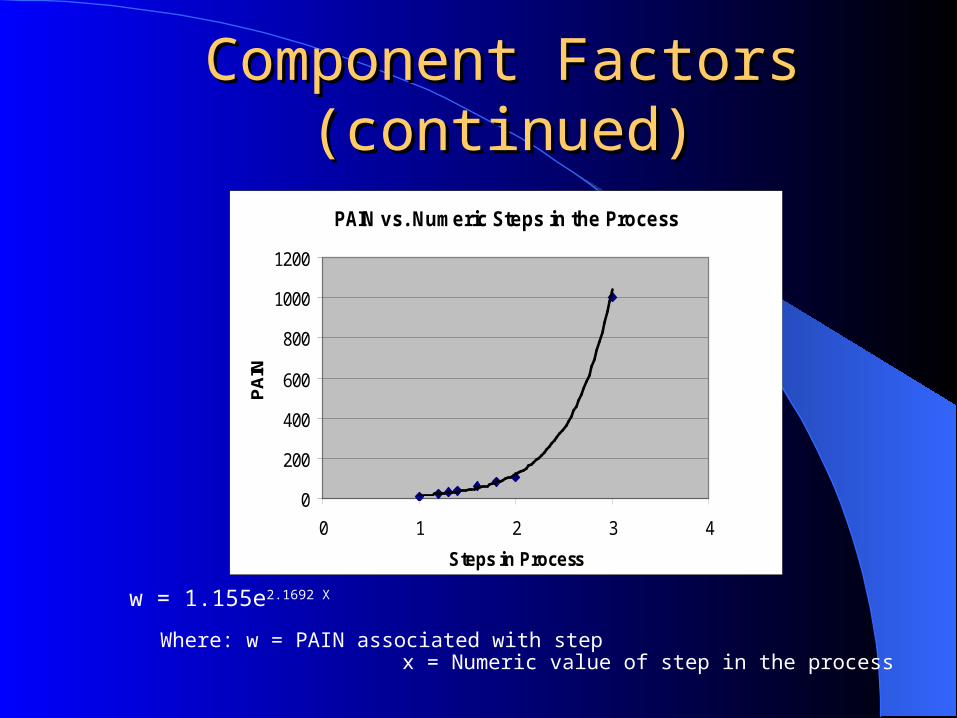
PAIN (continued)– Graph was created with numeric steps and Pain– Then an equation was determined using a trend
linePAIN vs. Numeric Steps in the Process
0
200
400
600
800
1000
1200
0 1 2 3 4
Steps in Process
PA
IN
w = 1.155e2.1692 X
Where: w = PAIN associated with step x = Numeric value of step in the process
Component Factors (continued)Component Factors (continued)
w = 1.155e2.1692 X
Where: w = PAIN associated with step x = Numeric value of step in the process
PAIN vs. Numeric Steps in the Process
0
200
400
600
800
1000
1200
0 1 2 3 4
Steps in Process
PA
IN
Component Factors (continued)Component Factors (continued)
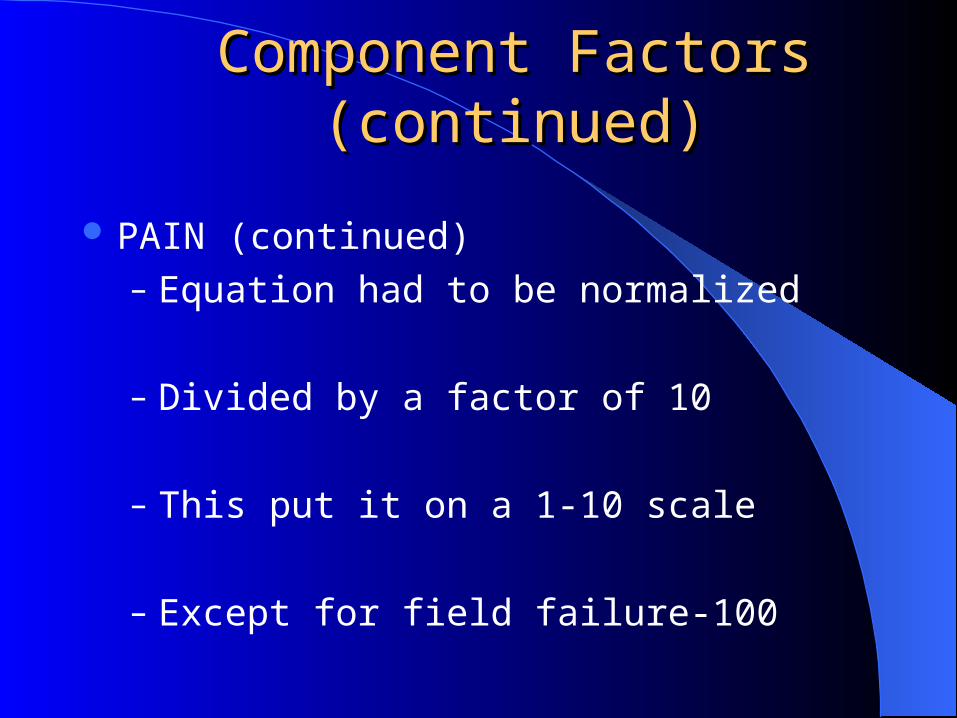
PAIN (continued)– Equation had to be normalized
– Divided by a factor of 10
– This put it on a 1-10 scale
– Except for field failure-100
Component Factors (continued)Component Factors (continued)
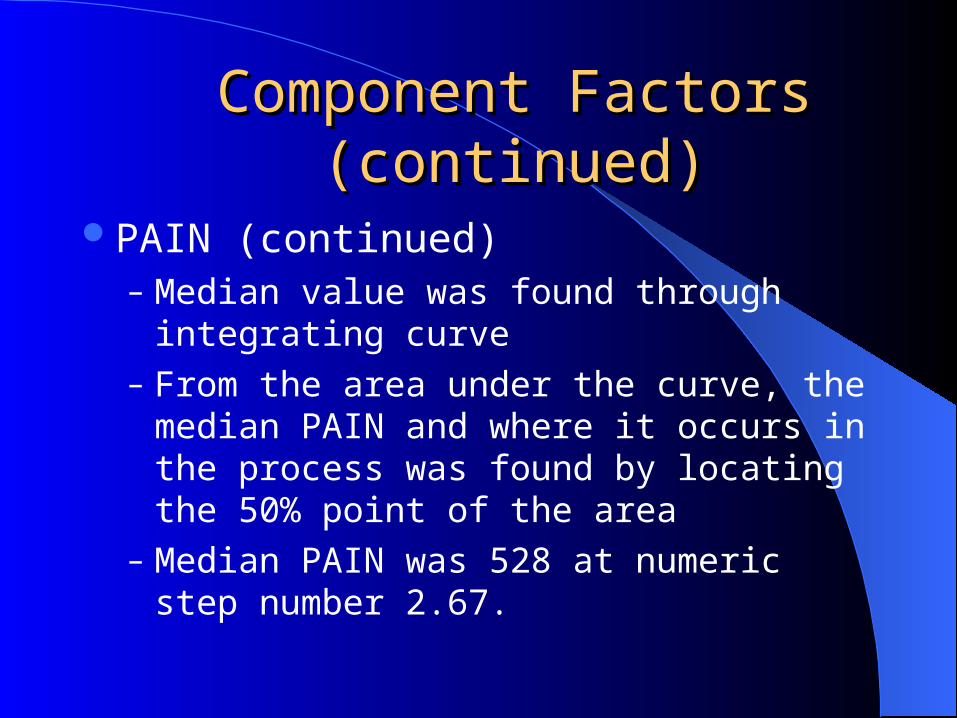
PAIN (continued)– Median value was found through integrating
curve– From the area under the curve, the median
PAIN and where it occurs in the process was found by locating the 50% point of the area
– Median PAIN was 528 at numeric step number 2.67.
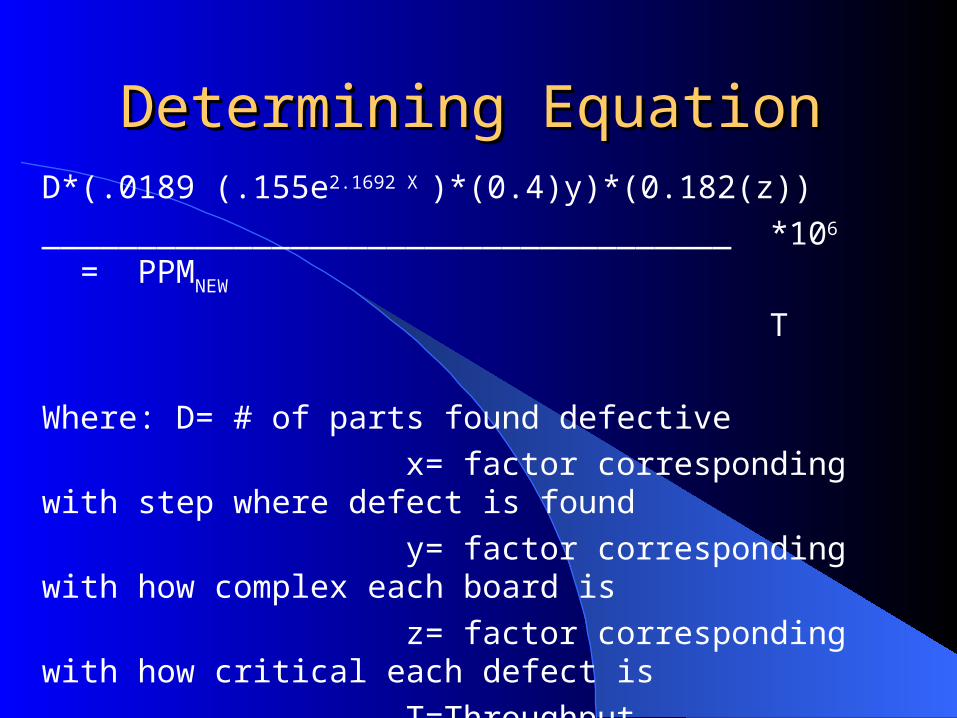
Determining EquationDetermining Equation
D*(.0189 (.155e2.1692 X )*(0.4)y)*(0.182(z))
____________________________________ *106 = PPMNEW
T
Where: D= # of parts found defective
x= factor corresponding with step where defect is found
y= factor corresponding with how complex each board is
z= factor corresponding with how critical each defect is
T=Throughput
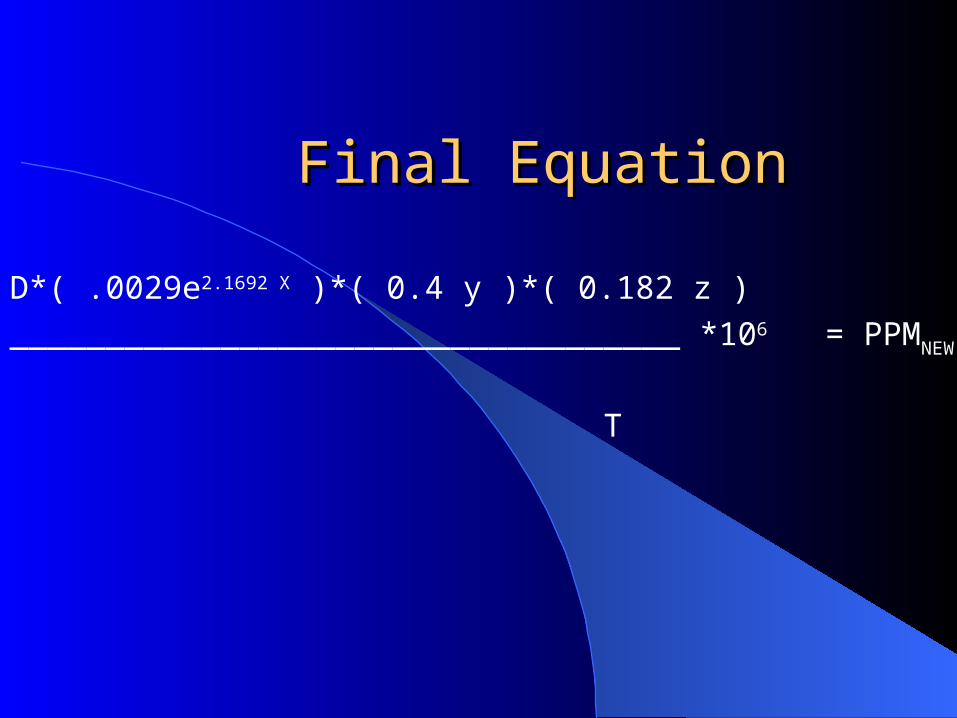
Final EquationFinal Equation
D*( .0029e2.1692 X )*( 0.4 y )*( 0.182 z )
___________________________________ *106 = PPMNEW
T
DATA cubeDATA cube
Once equation was finalized , will be put into a data cube
The data cube has all of TYCO’s quality information needed to produce PPMNEW.
The PPMNEW would be compared to PPM to determine overall impression of TYCO to validate equation
Future of ProjectFuture of Project
Once the equation is ran through Data Cube, the equation can be validated
Then it can be applied to all of PWB suppliers
Moving Average will monitor suppliersCorrective Action can be taken

ABET ConcernsABET Concerns
Economic ConcernsEthical ConcernsSocial ConcernsPolitical ConcernsSustainability

Any Questions ?Any Questions ?