design, modelling, and fabrication of a hybrid energy
TRANSCRIPT

Design, Modelling, and Fabrication of a
Hybrid Energy Harvester
by
Mohammed Ibrahim
A thesis
presented to the University of Waterloo
in fulfillment of the
thesis requirement for the degree of
Master of Applied Science
in
Mechanical Engineering
Waterloo, Ontario, Canada, 2014
© Mohammed Ibrahim 2014

ii
Author’s Declaration
I hereby declare that I am the sole author of this thesis. This is a true copy of the thesis, including any
required final revisions, as accepted by my examiners.
I understand that my thesis may be made electronically available to the public.

iii
Abstract
As sources of energy are becoming more scarce and expensive, energy harvesting is receiving more
global interest and is currently a growing field. Energy harvesting is the process of converting ambient
energy, such as vibration, to electrical energy that can power a multitude of applications. Vibration energy
is the by-product of everyday life; it is generated from any perceivable activity. While typically viewed as
noise, there is a strong potential for harvesting this energy and deploying it to useful applications. The
focus of this thesis will be using vibration as the ambient source of energy.
Hybrid energy harvesters employ more than one of the harvesting technologies. In this thesis, two hybrid
harvesters that utilize piezoelectric, magnetostrictive, and electromagnetic technologies are designed,
modelled, and tested. Both of these harvesters have beams that are spiral in shape. The use of the spiral
geometry allows the system to have a lower natural frequency as opposed to the traditional cantilever
beam, while still maintaining a high volume of active material.
The first harvester that is discussed is the P-MSM harvester. It utilizes piezoelectric and magnetostrictive
material. Both materials are configured in a spiral beam geometry and allowed to resonate independently.
The resonance frequency of these two materials is designed to create wideband energy harvesting. This
allows the harvester to be operating efficiently even if the ambient vibration shifts a small amount.
The second harvester that is discussed is the P-MAG harvester. It utilizes piezoelectric and
electromagnetic technologies. It also incorporates a spiral geometry for the piezoelectric layers and
includes a magnet attached at the centre. The magnet is placed in the centre of the spiral to reduce the
natural frequency of the system and to also actively contribute to the harvesting. This harvester has two
sources operating at the same resonant frequency, which allows it to have a larger power output than if
the sources were separated.
Finally, finite element analysis was used to model both harvesters. ANSYS was used for the piezoelectric
material and COMSOL was used for the electromagnetic material. The results are compared to the
experimental and are in good agreement.

iv
Acknowledgements
I would like to dedicate a special thanks to my supervisor Dr. Armaghan Salehian for her unyielding
support and guidance during the program. I would like to thank and acknowledge Dr. Rafaat Mansour for
generously providing access to the MEMS lab and FEA software.
Also I would like to thank members of my lab group, Tim Pollock, Blake Martin and Steven Lao for their
continued assistance and support. In addition I would like to acknowledge the technical staff at the
University of Waterloo specifically Andy Barber, Chris Mclean, and Richard Parker. I would like to thank
Saman Nazari for assistance in the annealing process.
Last but not least, I would like to thank my family for their continued love, support, and encouragement
during my graduate studies at the University of Waterloo.

v
Dedication
This thesis is dedicated to my mother and father whose sacrifice, love, and support have been the greatest
inspiration in my journey.

vi
Table of Contents
List of Figures ............................................................................................................................................ viii
List of Tables ................................................................................................................................................ x
Nomenclature ............................................................................................................................................... xi
Chapter 1: Introduction ........................................................................................................................... 1
1.1 Background and Motivation.......................................................................................................... 1
1.2 Thesis Organization ...................................................................................................................... 4
Chapter 2: Literature Review .................................................................................................................. 5
2.1 Electromagnetic ............................................................................................................................ 5
2.2 Piezoelectric .................................................................................................................................. 6
2.3 Magnetostrictive ........................................................................................................................... 8
2.4 Hybrid ........................................................................................................................................... 8
2.5 Proposed Designs .......................................................................................................................... 9
Chapter 3: Basic Theory ....................................................................................................................... 13
3.1 Piezoelectric ................................................................................................................................ 13
3.1.1 Material Types .................................................................................................................... 14
3.1.2 Configuration ...................................................................................................................... 15
3.1.3 Poling Direction .................................................................................................................. 16
3.2 Magnetostrictive ......................................................................................................................... 18
3.3 Electromagnetic .......................................................................................................................... 19
Chapter 4: Modelling ............................................................................................................................ 20
4.1 Spiral Beam ................................................................................................................................. 20
4.2 P-MSM ........................................................................................................................................ 20
4.2.1 Piezoelectric Model............................................................................................................. 21
4.2.2 Magnetostrictive Model ...................................................................................................... 24
4.3 P-MAG ........................................................................................................................................ 24

vii
4.3.1 Piezoelectric Model............................................................................................................. 25
4.3.2 Magnet ................................................................................................................................ 28
Chapter 5: Experimental Procedures .................................................................................................... 30
5.1 Material Fabrication .................................................................................................................... 30
5.1.1 Piezoelectric Material ......................................................................................................... 30
5.1.2 MSM ................................................................................................................................... 33
5.1.3 Magnets ............................................................................................................................... 38
5.2 Circuit ......................................................................................................................................... 38
5.3 Testing Setup .............................................................................................................................. 41
5.4 P-MSM ........................................................................................................................................ 44
5.5 P-MAG ........................................................................................................................................ 50
Chapter 6: Validation and Analysis ...................................................................................................... 54
6.1 Damping ...................................................................................................................................... 54
6.2 P-MSM ........................................................................................................................................ 55
6.3 P-MAG ........................................................................................................................................ 58
6.4 Discussion ................................................................................................................................... 60
Chapter 7: Conclusion and Future Work .............................................................................................. 63
7.1 Conclusion .................................................................................................................................. 63
7.2 Future Work ................................................................................................................................ 64
References ................................................................................................................................................... 66

viii
List of Figures
Figure 1: Generic sensor node architecture. .................................................................................................. 1
Figure 2: Mass-spring-damper system experiencing base excitation............................................................ 3
Figure 3: Spiral shaped beam. ..................................................................................................................... 11
Figure 4: P-MSM design concept. .............................................................................................................. 12
Figure 5: P-MAG harvester concept. .......................................................................................................... 12
Figure 6: Poling of piezoelectric material. .................................................................................................. 14
Figure 7: Cantilever beam with the neutral axis (NA) highlighted. ............................................................ 15
Figure 8: Parallel connection. ..................................................................................................................... 16
Figure 9: An analogy for the piezoelectric parallel circuit. ........................................................................ 17
Figure 10: Series connection. ...................................................................................................................... 17
Figure 11: An analogy for the piezoelectric series circuit. ......................................................................... 17
Figure 12: Dimensions of spiral beam. All dimensions are in . ........................................................... 20
Figure 13: The elements of the mesh of the ANSYS simulation and highlighted in yellow are the fixed
boundary conditions. ................................................................................................................................... 21
Figure 14: Displacement of the tip of the piezoelectric bimorph. ............................................................... 22
Figure 15: Contour plot of stress profile for the P-MSM spiral piezoelectric beam. .................................. 23
Figure 16: Contour plot of the strain profile for the P-MSM spiral piezoelectric beam. ............................ 23
Figure 17: Voltage output from the piezoelectric spiral beam. ................................................................... 24
Figure 18: P-MAG harvester (a) from a top view and (b) from a bottom view. ......................................... 25
Figure 19: Contour plot of the stress profile for the P-MAG piezoelectric spiral beam. ............................ 26
Figure 20: P-MAG tip displacement. .......................................................................................................... 26
Figure 21: Contour plot of the strain profile for the P-MAG piezoelectric spiral beam. ............................ 27
Figure 22: P-MAG voltage output. ............................................................................................................. 27
Figure 23: 3-D COMSOL geometry and magnetic flux results. ................................................................. 28
Figure 24: Voltage results for the magnet. .................................................................................................. 29
Figure 25: Diamond drill bit. ...................................................................................................................... 31
Figure 26: A square that was laser machined from the piezoelectric material using high power settings. . 31
Figure 27: A square that was laser machined from the piezoelectric material using low power settings. .. 32
Figure 28: Final cut of the piezoelectric bimorph. ...................................................................................... 33
Figure 29: Microscopic pictures of the piezoelectric material after water jet. ............................................ 33
Figure 30: Metglas 2605 SA1 field annealed vs. no field annealed [47]. ................................................... 35

ix
Figure 31: Explanation of the annealing of the magnetostrictive material. ................................................ 36
Figure 32: Lindberg/Blue M box furnace used for annealing MSM. ......................................................... 37
Figure 33: Oven temperature profile for annealing..................................................................................... 37
Figure 34: The D51-N52 NdFeB Magnet. .................................................................................................. 38
Figure 35: Basic electric circuit. ................................................................................................................. 39
Figure 36: Results of resistance testing of the piezoelectric spiral. ............................................................ 41
Figure 37: Equipment used and test setup. ................................................................................................. 42
Figure 38: Voltage output from the noise of the shaker. ............................................................................. 43
Figure 39: 500 turn coil elevated from the shaker. ..................................................................................... 44
Figure 40: The voltage output of the 500 turn coil elevated from the shaker. ............................................ 44
Figure 41: P-MSM Prototype. ..................................................................................................................... 45
Figure 42: Magnetic field created around the magnetostrictive material.................................................... 45
Figure 43: A plot of the value of the bias magnetic field as experienced by the magnetostrictive layer. ... 46
Figure 44: Piezoelectric displacement from the P-MSM harvester. ........................................................... 47
Figure 45: Piezoelectric power from the P-MSM harvester. ...................................................................... 47
Figure 46: Magnetostrictive power from the P-MSM harvester. ................................................................ 48
Figure 47: Combined power FRF plots for the piezoelectric and the magnetostrictive layers. .................. 48
Figure 48: Total power of the P-MSM harvester. ....................................................................................... 49
Figure 49: P-MAG Prototype. ..................................................................................................................... 50
Figure 50: Piezoelectric displacement for P-MAG harvester. .................................................................... 51
Figure 51: Piezoelectric power for P-MAG harvester. ............................................................................... 51
Figure 52: Magnet power for P-MAG harvester. ........................................................................................ 52
Figure 53: Total power for P-MAG harvester. ........................................................................................... 52
Figure 54: Piezoelectric displacement FRF illustrating the calculation of the damping ratio .................... 54
Figure 55: P-MSM results for the experimental vs. the simulation for the tip displacement of the
piezoelectric spiral. ..................................................................................................................................... 56
Figure 56: P-MSM results for the experimental vs. the simulation for the power output of the piezoelectric
spiral. ........................................................................................................................................................... 56
Figure 57: Animating the mode shapes (a) First peak, (b) Second peak, (c) Third peak. ........................... 57
Figure 58: P-MAG results for the experimental vs. the simulation for the tip displacement of the
piezoelectric spiral. ..................................................................................................................................... 59
Figure 59: P-MAG results for the experimental vs. the simulation for the power output of the piezoelectric
spiral. ........................................................................................................................................................... 59
Figure 60: P-MAG results for the experimental vs. the simulation for the power output of the magnet. ... 60

x
List of Tables
Table 1: Different sources of vibration and their respective frequency and acceleration. ............................ 3
Table 2: Advantages and disadvantages of different energy harvesting technologies. ............................... 10
Table 3: Comparison of different types of piezoelectric material [41]. ...................................................... 15
Table 4: Properties of P-MAG on ANSYS. ................................................................................................ 25
Table 5: COMSOL simulation values. ........................................................................................................ 29
Table 6: Resistance values with the corresponding power output. ............................................................. 40
Table 7: Comparison with other published energy harvester. ..................................................................... 61

xi
Nomenclature
cross-sectional area exposed to the magnetic flux
AWG American wire gauge
magnetic flux density
damping coefficient
magnetostrictive strain coefficient
piezoelectric strain coefficient
electric charge displacement
electric field strength
EDM electric discharge machining
EMF electromotive Force
FEA finite element analysis
FRF frequency response functions
magnetic field intensity
spring stiffness
piezoelectric coupling coefficient
mass
MEMS micro-electro-mechanical system
MSM magnetostrictive material
number of turns in a coil
NA neutral axis
Nd:YAG neodymium-doped yttrium aluminum garnet
NdFeB neodymium
NPD normalized power density
P power output
PSD power spectral density
PVDF polyvinylideneflouride
PZT lead zircronate titanate
mechanical compliance

xii
strain
time
stress
V volume
displacement of mass
velocity of mass
acceleration of mass
displacement of base
velocity of base
acceleration of base
damping coefficient
dielectric permittivity
dielectric permittivity in a vacuum
relative dielectric permittivity
damping ratio
angle between magnetic field and the area of interest
magnetic permeability
phase shift
magnetic flux
frequency
lower 3dB frequency
upper 3dB frequency
damped natural frequency
natural frequency

1
Chapter 1: Introduction
1.1 Background and Motivation
Energy harvesting is the process by which energy is derived from ambient sources, captured, and stored
for various applications such as small wireless autonomous devices (similar to those used
in wireless sensor networks). As traditional energy sources continue to deplete the cost of their utilization
continues to increase. This fact has generated a growing interest in energy harvesting on a global level.
Figure 1 illustrates how a simple energy harvesting scheme is employed to convert and store ambient
energy into electrical energy. The stored electrical energy can then be used by various sensor nodes for
applications such as sensing, actuating, or sending wireless signals.
Figure 1: Generic sensor node architecture.
Solar, wind, and thermal energy are commonly used ambient energy sources for energy harvesting.
Extensive research on both solar and wind energy sources has shown that they are capable of producing
large power outputs, but suffer from a lack of scalability and indoor applications. Thermal energy
harvesters derive energy from thermal gradients, such as a steam turbine, and are typically used alongside
large scale technologies. Since the goal of this thesis is to design, model, and fabricate a small scale
energy harvester, these previously mentioned energy sources are not applicable.
Kinetic energy is an example of another common ambient source of energy that is typically harvested
using smaller-scale technologies. Although kinetic energy harvesters produce significantly less power

2
when compared to harvesters capturing other energy sources, recent advancements in electronics
technology have allowed sensors to operate on far less power than in recent times. Some of today’s low
power electronics only require microwatts of power to be operational thus bridging the gap for ambient
vibration energy conversion methods to become a viable power solution. Vibration energy is the by-
product of everyday life; it is generated from any perceivable activity be it a motor rotation or human
motion. While typically viewed as noise, there is the potential of harvesting this energy and deploying it
to useful ends. The focus of this thesis will be using vibration as an ambient source of energy.
Some advantages of vibration energy harvesting include decreasing the cost of cabling and eliminating
the need to constantly replace batteries. In addition, it allows the sensors to be embedded in locations that
were previously restricted by these wiring limitations. It also allows the harvesters to be self-contained
units with no required external power source, allowing for many more wireless solutions.
The foundation for vibration based energy harvesters can be modelled by a simple mass-spring-damper
system as depicted in Figure 2. The basic equation of motion with base excitation is
(1)
where is the mass, is the damping coefficient, is the spring stiffness, and and are the
displacement of the mass and the base respectively. If the external excitation is sinusoidal, the steady state
response will be
√(
)
(
) ( )
(2)
where is the phase shift of the base input and is the amplitude. The fundamental natural frequency of
the system is
√
(3)
A natural frequency of a system is the frequency at which the system will oscillate during free vibrations.
If the system is subjected to a periodic input of similar frequency then the system will reach resonance.
Most mechanical systems are designed to operate in a range as far from resonance as possible to avoid

3
destructive vibrations. Vibration based energy harvesters however are designed to operate as close to the
resonant frequency of the ambient vibration source as possible to capture the large displacements that will
be imposed on the system. Table 1 shows the values of some of the vibrations that are experienced on a
daily basis.
Figure 2: Mass-spring-damper system experiencing base excitation.
Table 1: Different sources of vibration and their respective frequency and acceleration.
Source Acceleration [ ] Frequency [ ]
Person tapping heel 3 1
Human walking 5-10 <20
Car instrument panel 3 13
HVAC vents in an office 0.2-1.5 60
Base of a 3-axis machine 10 70
Car engine compartment 12 200
This thesis will specifically focus on kinetic energy caused from unwanted ambient vibrations in
structures and mechanisms. In recent years, substantial research has been conducted in this field; energy
harvesting systems typically make use of electrostatic [1, 2, 3], electromagnetic [4, 5, 6, 7], piezoelectric
[8, 9, 10, 11], and magnetostrictive [12, 13, 14, 15] transduction. These different technologies have been
successfully tested and demonstrated in many institutions worldwide. In this thesis the electromagnetic,
piezoelectric, and magnetostrictive technologies will be highlighted. The basic theory behind each of
these technologies will be explained with the history of advancements made in the respective fields.
Furthermore, a method for optimizing energy harvesting devices will be discussed by employing the use
of multiple technologies together to create a hybrid system. This type of system has the potential to be
more efficient and to cover a wider range of operating frequencies.

4
1.2 Thesis Organization
A basic overview of energy harvesting has been given thus far, along with an outline of different sources
of ambient energy and different technologies that are used in vibration based harvesters. This section
outlines the contents and scope of each chapter in this thesis.
Chapter 2 provides details on the field of energy harvesting from the literature. Previous works are
explored to understand what has been performed and to assess their results. Hybrid harvesters are then
explored to better understand which harvesting technologies have been coupled and analyze their
effectiveness. From the information gathered, two hybrid devices are then suggested for modelling,
fabrication, and testing.
Chapter 3 explains the basic physics principles of piezoelectric, magnetostrictive, and electromagnetic
material along with their respective transduction mechanisms. The aim is to provide a better
understanding of how these materials work in order to harvest energy and to lay the groundwork for the
application of these principles throughout the rest of this thesis.
Chapter 4 explains the modelling of the two hybrid harvesters along with the procedure used to produce
the simulation results. The configurations for both of the hybrid harvesters are modelled for stress, strain,
and power output to provide a comparative base for experimental results.
Chapter 5 provides an explanation of the experimentation process. Details of the steps taken to design and
fabricate the harvesters are discussed. The test setup and equipment used are highlighted. Lastly, the
results of the output of both harvesters are displayed.
Chapter 6 brings together the simulation results from Chapter 4 and the experimental results from Chapter
5 to validate the theoretical model developed with the experimental results obtained. An explanation of
any discrepancies is provided.
The thesis concludes with an overview of the results and performance of the harvesters. The benefits and
drawbacks are highlighted and recommended improvements and future work is discussed.

5
Chapter 2: Literature Review
This thesis focuses on the electromagnetic, piezoelectric, and magnetostrictive energy harvesting
technologies. Advancements in each of these areas will be discussed, as well as the use of more than one
technology to create hybrid harvesters. Advantages of using hybrid harvesters with their respective pros
and cons of each are discussed.
2.1 Electromagnetic
There has been substantial work done with electromagnetic energy harvesters that use Faraday’s law of
induction as the underlying principle of operation. Using the fundamental idea that a magnet moving
inside a coil will induce a voltage, Saha et al. [16] developed an electromagnetic energy harvester. There
are two fixed magnets at each end of the device, acting like springs, to produce a repulsive force on the
moving magnet as it approaches either end. A similar design was used by Duffy et al. [17] where the
electromagnetic energy harvester was incorporated in a shoe sole with the aim of gathering energy from
human motion, which has frequencies of less than 30 Hz. An alternate design using repulsive forces was
also considered by placing a coil in-between two magnets that were oriented such that they repelled one
another. As the person would step down, the gap between the magnets decreased causing a change in the
magnetic flux due to the increase in repulsive forces which induces a voltage in the coil. These devices
are relatively large in size and interfere with the human motion and are therefore ineffective for the
proposed application.
In the realm of wireless sensor application devices, a challenging task is to create energy harvesters that
are substantially compact and produce appreciable power output. El-Hami [18] proposed a cantilever
beam with two magnets attached to a c-shaped core. The purpose of such a core is to maximize the
magnetic flux in the gap between the two magnets to induce the maximum amount of voltage in the coil.
Although this configuration allows for a small (millimeter) footprint, it increases the natural frequency of
the system to 322 Hz. This frequency is very high for the purposes of this thesis where the goal is to have
a system with as low of a frequency as possible (less than 30 Hz) to capture vibrations from the ambient.
Different methods have been researched in an attempt to increase the power output of such devices.
Beeby et al. [19,20] employed a similar cantilever beam system to that of El-Hami [18], but had four
magnets arranged in such an orientation to maximize the magnetic flux gradient through the coil in the
centre. The magnets were placed two on each side and were attached to a zinc coated mild steel keeper
which couples the magnetic flux of the magnets. Although the size of this harvester was small, the added

6
weight of the magnets allowed it to resonate at a low frequency of 52 Hz. Even though this harvester
exhibited a small size and low resonance, it was limited by the operating range and may only generate
appreciable energy at its natural frequency.
Yang et al. [21] designed a harvester that operated at the first three resonant modes. It consisted of a
pinned-pinned beam with three equally spaced magnets. Under each magnet was a planar coil that
induced a voltage as the magnets vibrated. This device harvested energy from the first three modes
located at 346 Hz, 958 Hz, and 1145 Hz respectively. Although having multiple harvesting frequencies
was an improvement on previous devices, the high operating range is less than desirable in many
applications.
To increase the range of operation, Soliman et al. [22] introduced a mechanical stopper that is in the range
of motion of a cantilever beam. When the beam comes in contact with the stopper, the stiffness of the
beam increases and will change the resonance frequency of the system. This harvester was able to harvest
energy from 93 Hz to 102 Hz, making it a wide band energy harvester. Wide band energy harvesters
maximize the system’s ability to harvest energy from the environment.
Another method to increase the bandwidth was employed by Sari et al. [23]. The authors proposed a
micro-electro-mechanical system (MEMS) device that consisted of numerous cantilever beams of varying
lengths. This meant that each beam had a different natural frequency. On each beam was a copper wire
coil which moves through the magnetic field of a fixed magnet a specific distance from the beam. The
beams and the coils were connected serially. Essentially, this is similar to having multiple standalone
energy harvesters working side by side to ensure a minimum of one subsystem being excited at any given
time from the input vibration. This harvester also had a wide band harvesting range from 3400 Hz to 4400
Hz. This large operating range at such high frequencies was due to the size of the harvester but for
applications sought by this thesis, it is not practical.
2.2 Piezoelectric
Piezoelectric energy harvesters have been gaining substantial interest due to their natural electro-
mechanical coupling properties and the advancements that are being made in their design and fabrication.
A basic configuration, widely-studied in the field of piezoelectric energy harvesters, consists of two
piezoceramic layers bonded together and referred to a bimorph configuration in the literature. Roundy and
Wright [24] proposed a cantilever beam made from a piezoelectric bimorph. The cantilever orientation
allowed the material to be strained while the system underwent vibrations. Due to the piezoelectric
properties, this strain produced an electric current which is harvested and used to power small devices.

7
The developed harvester is a basic cantilever beam with a tip mass. It is excited at 2.5 and has a
natural frequency of 120 Hz. The piezoelectric cantilever beam has been modelled in various works, see
[25, 26].
The standard rectangular cantilever beam has an uneven strain distribution with the maximum strain
occurring near the clamped end. White et al. [27] proposed a stainless steel tapered base with two layers
of piezoelectric film printed on both sides. The tapered shape was used to allow for even strain
distribution throughout the entire beam. This maximized the deflection of the piezoelectric layers which
in turn maximized power output.
Similar to the harvesters discussed in the previous section, the cantilever beam configuration only works
at a specific frequency. In order for these harvesters to be used in real application they must possess a
wider operating range. Challa et al. [28] proposed a system in which the natural frequency could be
passively tuned to match the source frequency. The configuration consisted of a piezoelectric cantilever
beam with a tip mass and magnets on both sides of the free end. There was also a set of fixed magnets
that surrounded the beam. The distance of these magnets was altered which resulted in a perpendicular
magnetic force on the beam, altering the beam’s stiffness and changing the natural frequency. By varying
the distance of the fixed magnets, this device could be tuned in the frequency range of 22 Hz to 32 Hz.
Another work by Mansoura et al. [9] used magnets to apply a tensile stress on a beam, altering the
stiffness and thus changing the natural frequency of the harvester. It was observed that the tuning range of
this harvester was from 3.19 Hz to 12 Hz. However this tuning range came at the expense of reduced
power output due to the stiffening of the beam. Leland and Wright [29] had similar results while applying
a mechanical axial load to a pinned-pinned piezoelectric bimorph. These three designs [9, 28, 29] were all
tuneable before operation however, as with non-wide band harvesters, their main drawback is that once
the frequency is set it cannot be changed.
With the knowledge that energy harvesters are most efficient under resonance, one must design the beam
to have the natural frequency near the ambient frequency. Studies have been performed that show the
typical vibrations that occur in locations where wireless sensors would typically be located. Examples are
an engine compartment and an HVAC vent in an office building which ranged from 0.2 to 10 at
frequencies below 60 Hz [8]. This means the natural frequency of the harvester should be low enough to
match these values. In cantilever beam configurations, either the length or the tip mass is increased to
lower the natural frequency. This poses a physical limit in the configuration process due to the need of
decreased size for the harvesters. Hu et al. [30, 31] proposed a novel configuration of a piezoelectric beam
with the shape having less stiffness than the cantilever beam. The authors developed a spiral piezoceramic

8
beam, which was fixed in the center and was subjected to a one newton force excitation. After testing it
was observed that the beam had a natural frequency of 50 Hz. Paprotny et al. [32] continued with this idea
and proposed a quad folded cantilever design that harvested energy from the magnetic field emanating
from a current carrying wire. This harvester’s unique design allowed for a natural frequency of 60 Hz.
2.3 Magnetostrictive
A growing interest is starting to form around materials that exhibit the Villari effect, known as
magnetostrictive materials. This type of material has a coupling between the mechanical and the magnetic
domains. As the material is deformed the magnetic polarization changes and conversely the material is
deformed when a changing magnetic field is applied. A common magnetostrictive material is Terfenol-D.
It has an ultra-high coupling coefficient and is generally used as an actuator to strain piezoelectric
material which then produces a voltage. The most common application uses 2 layers of Terfenol-D to
sandwich a piezoelectric layer. A changing magnetic field is then applied to this configuration causing the
Terfenol-D to strain, which causes the piezoelectric layer to strain [33, 34, 35].
Minimal research has been performed using this material to harvest energy. Terfenol-D is extremely stiff
and brittle and cannot be used in vibration based harvesting. Metglas is a thin film magnetostrictive
laminate that is extremely flexible compared to Terfenol-D, due to its construction. Wang and Yuan [36]
were the first to use Metglas for energy harvesting and used 8 magnetostrictive laminates on a bronze
cantilever beam. This setup had a copper coil wrapped around it and through Faraday’s law of induction,
voltage was induced from the deformation of the Metglas layers. The fundamental resonance of this
system was at 58 Hz, confirming the flexibility of this material.
2.4 Hybrid
All the works that have been cited in the previous sections present different methodologies to tune and
improve different energy harvesting devices. The main objective in this field of research is to harvest as
much energy as possible while maintaining a relatively small footprint. Traditionally, energy harvesting
devices use only one of the above mentioned technologies. A method that is gaining more popularity
recently is the creation of hybrid energy harvesting devices. Hybrid energy harvesting devices combine
more than one of these technologies together to create a more efficient unit. The focus of this thesis will
be in hybrid technologies from piezoelectric and electromagnetic technologies.
The simplest integration of these technologies was seen in the work of Wischke et al. [37]. They proposed
a piezoceramic bimorph cantilever beam configuration with magnets acting as the tip mass. As the beam

9
vibrated the magnets passed through a coil. This is unique because not only are two different technologies
being used but each has its own resonance. If tuned appropriately, this type of hybrid technology can be
very effective in harvesting energy over a wider band. An effort was also made to use the energy
harvested by the magnet to tune the piezoelectric stiffness.
Karami [38] developed a similar cantilever beam with piezoelectric patches near the base. The tip mass
was also a magnet but had a unique configuration that interacted with a fixed magnet to induce voltage in
a coil between them. The piezoelectric patches and the magnets attached at the tip both harvested energy
separately. This harvester had a natural frequency of roughly 10 Hz and was capable of such a small
resonance due the large size of the beam (152 in length).
Similar concerns regarding the size arise due to the required dimensions of the cantilever beam
configuration in an attempt to lower the natural frequency of the device. Wu et al. [39] proposed a MEMS
sized device with a unique shape for the piezoelectric beam to lower the natural frequency. The authors
used four uniquely shaped piezoelectric springs and suspended a magnet from four sides. A fixed coil was
located in the centre of the suspended magnet and as the system vibrated a voltage was induced. The
piezoelectric springs were designed to reduce the natural frequency of the structure and contribute to the
energy harvesting process.
2.5 Proposed Designs
The goal of this thesis is to design hybrid harvesters that operate at low frequencies in an attempt to
capture ambient energy that typically has frequencies smaller than 30 Hz (such as human motion). In an
attempt to combine materials that would improve the overall efficiency of the hybrid harvester, Table 2
highlights the major advantages and disadvantages of the technologies that were previously discussed.
There are three possible combinations, piezoelectric-magnetostrictive, electromagnetic-magnetostrictive,
and piezoelectric-electromagnetic.

10
Table 2: Advantages and disadvantages of different energy harvesting technologies.
Material Advantage Disadvantage
Piezoelectric
- high coupling
- scalable (MEMS)
- large output voltage
- chance of depolarization
- brittle
- high output impedance
Electromagnetic - simple modeling
- affordable material
- not very scalable
- small output voltage
- larger mass
Magnetostrictive
- highly flexible
- high or low frequency vibration
- ultra-high coupling
- requires bias magnets
- nonlinear behavior
- harder to model
Analyzing these three combinations with the data presented in Table 2, it is observed that the first
combination (piezoelectric-magnetostrictive) has good potential due to the fact that these two materials
complement each other’s weaknesses. The piezoelectric material is brittle but produces high voltages and
has high input impedance. On the other hand, the magnetostrictive material is very flexible and can
withstand harsh environments while still maintaining ultra-high coupling.
The second combination (electromagnetic-magnetostrictive) will not match effectively because both of
these technologies require a pick-up coil and rely on Faraday’s law of induction. This means that the
magnetic fields would interfere with each other potentially causing destructive interference, impacting the
effectiveness of the pick-up coil. Consequently, this combination of technologies would negatively impact
the quality of the voltage induced in the coil.
The third combination (piezoelectric-electromagnetic) also has good potential since the technologies
harvest energy in different domains and will not interfere with each other. The output of each harvester
could be added separately after the conversion to increase the output of the overall harvester since they
can each operate in separate domains. Electromagnetic technologies are relatively simple to apply and
model; combined with piezoelectricity it can be very effective.
Proposed in this thesis are two hybrid energy harvesting units that employ two different technologies. The
first design (P-MSM) includes piezoelectric and magnetostrictive technologies, and the second design (P-
MAG) employs piezoelectric and electromagnetic technologies.

11
The piezoelectric component in both designs will be a spiral shaped piezoelectric bimorph (shown in
Figure 3 below). The spiral shape will produce a unit with smaller stiffness and therefore will have more
deflection as opposed to the traditional cantilever beam or circular disk configurations. Also, the spiral
shape has the potential of being incorporated into MEMS scale applications due to the fact that it can have
a low natural frequency even at small sizes [40].
Figure 3: Spiral shaped beam.
The first design, the P-MSM harvester, incorporates the piezoelectric spiral bimorph and a
magnetostrictive layer also in a spiral geometry as shown in Figure 4. Each of the layers is fixed at the
point of contact with the mount and the center is allowed to move independently of each other. When the
magnetostrictive material is strained, it introduces a change in the magnetization of the material. When a
copper wire coil experiences this change in magnetic field caused by the strain of the magnetostrictive
layer, then through Faraday’s law of induction a voltage will be induced in the coil which can be
harvested. This concept can be seen in Wang and Yuan’s [36] work. The advantage of this design is the
potential to be very compact and be incorporated in many applications.

12
Figure 4: P-MSM design concept.
The second proposed design, the P-MAG harvester, incorporates a piezoelectric spiral beam with a
magnet attached at the centre (refer to Figure 5). Note that the dimensions of the piezoelectric spiral beam
in both the P-MSM and P-MAG harvesters are the same. The piezoelectric layer is fixed at the points of
contact with the mount and as the system vibrates, due to the spiral shape, it will experience deflection in
the centre. Therefore, the magnet that is attached to center of the piezoelectric spiral will also move
inducing a voltage in the copper coil through Faraday’s law of induction. Both the spiral beam and the
copper wire will actively contribute to the energy harvesting process.
Figure 5: P-MAG harvester concept.
The P-MSM and the P-MAG harvester will be designed, constructed, and tested in this thesis. The results
of each harvester will be highlighted and analyzed to determine the effectiveness of this hybrid strategy.

13
Chapter 3: Basic Theory
This chapter introduces the basic constitutive equations for the materials that are used in the proposed
energy harvesters. The goal is to provide a better understanding of the properties of these materials and
the potential they have to offer. Furthermore, different configurations and material types will be
discussed.
3.1 Piezoelectric
Piezoelectric material is a type of smart or active material that exhibits a coupling between the mechanical
and electrical domains called electromechanical coupling. Applying a force on the material generates a
stress, which in turn results in deformation of the material. The deformed form will produce charge flow
across the material, resulting in a voltage. The reverse effect also holds. For this reason it can be used for
both sensing and actuation applications. Lead zircronate titanate (PZT) is a common piezoelectric
material used today.
The mechanical behavior of piezoelectric materials is described by Hooke’s law,
(4)
where is the external stress applied to the material. Due to this stress the material will elongate. The
total elongation divided by the original length is defined as the strain, . Stress and strain are related by
the compliance of the material, , which is the inverse of the Young’s modulus of elasticity.
The electrical behavior of linear dielectric material is described by
(5)
where is the electric field strength and is the electric charge displacement. They are linearly related
through the dielectric permittivity, . Materials are often expressed in terms of the relative
permittivity, . The relationship with the dielectric permittivity is
(6)
where is the permittivity in a vacuum which is the minimum value of permittivity that can exist.

14
. (7)
Combining Eq. (4) and Eq. (5) and expressing them in matrix form will yield
{ } [
] { } (8)
where is the piezoelectric strain coefficient. This is the coefficient that creates the electromechanical
coupling. If is equal to zero, then Eq. (8) will result in two decoupled equations each representing its
own domain. The larger this value, the larger the effect of the electromagnetic coupling.
3.1.1 Material Types
There are several different types of piezoelectric material. In order to compare their respective energy
harvesting capabilities the piezoelectric coupling coefficient, , is commonly used. This coefficient
describes the coupling between the two domains as shown in Eq. (9).
√ (9)
The subscripts denote the directions that are being considered. The first number represents the face of the
element and second number represents the axis on that specific face. The number “3” indicates the poling
direction of the material as displayed in Figure 6.
Figure 6: Poling of piezoelectric material.
These coupling coefficients measure the efficiency of each specific material in transferring energy
between the mechanical and the electrical domain in each of the specified directions. While the
Poling
Direction
1
2 3

15
coefficients do not specify the actual efficiency of the materials, they provide an indicator through which
materials can be compared. The subscript “33” is out-of-plane, and the subscript “31” is in-plane. Some
of the common piezoelectric materials are shown in Table 3 [41].
Table 3: Comparison of different types of piezoelectric material [41].
Material
PZT-5A 0.72 0.35
PZT-5H 0.75 0.44
PVDF 0.16 0.11
MFC 0.69 N/A
Polyvinylideneflouride (PVDF) is the most flexible but has a very low coupling. PZT on the other hand is
brittle but is generally the preferred material for vibration based harvesters due to its high coupling
coefficient [42].
3.1.2 Configuration
There are two possible configurations for PZT material. One is simply using a single layer of PZT
material, while the other is called a bimorph, which consists of two layers of PZT.
Figure 7 illustrates a cantilever beam with the neutral axis (NA) highlighted. At the NA, the beam
experiences zero stress and strain. If the beam is bending upwards, then above the NA the beam will be in
compression, and below the NA the beam will be in tension.
Figure 7: Cantilever beam with the neutral axis (NA) highlighted.

16
If the beam consisted of a single layer of piezoelectric material, the top half of the beam would produce a
voltage and the bottom half would produce the same voltage but with an opposite sign. As expected, they
will cancel each other out and will result in zero net output voltage from the overall beam.
On the other hand, if the cantilever beam consisted of two piezoelectric layers, referred to as a bimorph
beam, the layers would have the exact same properties and geometry and will result in the NA being
exactly in between them. In this case, if the beam is bending upwards then the top layer would be fully in
compression and the bottom layer would be fully in tension. This results in two layers that produce
opposite voltages, similar to having two different voltage sources.
It is clear that a bimorph configuration is advantageous for harvesting energy due to the fact that if a
single layer is employed the voltage output will be zero. The bimorph configuration is generally used with
vibration based harvesters [43, 44].
3.1.3 Poling Direction
Referring back to the analogy that was made earlier about the bimorph beam acting as two separate
voltage sources, the sign of each source is determined by the poling direction of the layers. Figure 8
depicts a parallel connection in which both layers are poled in the same direction and the poling direction
indicated by the arrows. One layer will be in compression and another layer will be in tension during
vibrations causing the voltage output from each layer to have opposite signs. Figure 9 shows the
equivalent circuit if the layers were modelled as a voltage source. In this configuration both sources
always have opposite voltage output, which will result in flow shown Figure 9.
Figure 8: Parallel connection.

17
Figure 9: An analogy for the piezoelectric parallel circuit.
On the other hand, when the piezoelectric layers are poled in the opposite direction as depicted by the
arrows in Figure 10, one layer will be in compression and the other layer will be in tension thus producing
same-sign voltage outputs from each layer. This will act simply as two voltages sources in series, as
shown in Figure 11.
Figure 10: Series connection.
Figure 11: An analogy for the piezoelectric series circuit.

18
Rectifying circuits used to smooth the signal coming out of the harvester typically have a voltage drop
across them due to some of the components used (such as diodes). It is thus favorable to have a higher
voltage output for energy harvesting application in order to allow for some potential losses. The series
configuration will output twice as much voltage as the parallel configuration. Based on this, the harvesters
proposed in this thesis will be prototyped in a series configuration.
3.2 Magnetostrictive
Magnetostrictive material is a type of smart or active material that exhibits a coupling between the
mechanical and the magnetic domains. When the material is subjected to mechanical stress it changes its
magnetic polarization, which is known as the Villari effect. The reverse effect also holds.
Similar to piezoelectric material, the mechanical properties are described by Hooke’s law (recall Eq. (4))
(4)
where is the external stress and is the strain. They are both related by the compliance of the
material, .
The magnetic properties are related by
(10)
where is the magnetic field intensity and is the magnetic flux density. These are related by , the
magnetic permeability of the material.
Combining Eq. (4) and Eq. (10) in matrix form will yield
{ } [
] { }
(11)
where is the magnetostrictive strain coefficient. Eq. (11) is the constitutive equation for
magnetostrictive materials. It is very similar to the piezoelectric constitutive properties; the difference
being that it utilizes the magnetic domain equation rather than the electric domain equation.

19
3.3 Electromagnetic
The final component of the proposed harvesters is the electromagnetic component. This will entail a
moving magnet with a nearby pick-up coil. The basic principle of this operation is explained by Faraday’s
law of induction.
Faraday’s law states that if a current carrying conductor experiences a changing magnetic field then a
voltage (electromotive force) will be induced in this conductor. A wound up copper coil is an example of
a conductor. The change could be produced by changing the magnetic field strength, moving a magnet
toward or away from the coil, moving the coil into or out of the magnetic field, or rotating the coil relative
to the magnet.
An experiment commonly used to illustrate the concept of Faraday’s law of induction consists of a coil
attached to a galvanometer and a moving magnet. When the magnet is moving the galvanometer deflects
depending on the motion, and when the magnet is stationary no voltage is induced in the coil.
The equation for the induced electromotive force (EMF) is given by Eq. (12).
(12)
EMF is the induced voltage in the coil, and it is proportional to the negative rate of change of the
magnetic flux . is the number of turns in the coil.
The magnetic flux is defined as
(13)
where is the magnetic field and is the area through which it passes. The angle between the magnetic
field and the normal of the area is defined as .

20
Chapter 4: Modelling
This chapter outlines the design and configuration of the spiral beam geometry that is used throughout
this thesis. A finite element analysis (FEA) is used for modelling the P-MSM and P-MAG harvesters. The
results of these simulations are extracted for analysis and comparison with experimental results in Chapter
6.
4.1 Spiral Beam
Both of the proposed harvesters use a spiral beam configuration for the piezoelectric and magnetostrictive
material components. The dimensions of the spiral are shown in Figure 12 below. As depicted in the
figure, the largest dimension of the beam is less than 45 which makes this beam compact in size and
will have low natural frequencies as proven by Hu et al. [30, 31].
Figure 12: Dimensions of spiral beam. All dimensions are in .
The piezoelectric bimorph that forms the spiral is made up of two layers in a series connection as depicted
in Figure 10 in the previous section. The direction of the arrows indicates the direction of polarization of
the material. In a series connection, when one layer is in bending the other would be in compression so
that when they both have opposite poling they will output a voltage with the same phase. This connection
allows for the highest output voltage.
4.2 P-MSM
The P-MSM harvester is constructed with both piezoelectric and magnetostrictive materials. Only the
piezoelectric spiral was modelled on ANSYS.

21
4.2.1 Piezoelectric Model
A finite element model of a spiral piezoelectric bimorph is made in order to analyse the structure and to
validate the experimental results. ANSYS Mechanical APDL 14.0 was used for the piezoelectric spiral
analysis. A 3-dimensional harmonic analysis was run to determine both the deflection and the voltage
output of the piezoelectric spiral bimorph.
The full harmonic solver was used with element type Solid 266 with KEYOPT(1) = 1001 to activate the
electromechanical coupling. It is a coupled field 20 nodes brick element. The top and bottom layer are
made to be electrode layers where the measuring will take place. The two middle layers are electrically
connected. The mesh was made up of 12,320 elements (refer to Figure 13 below). The frequency sweep
went from 10 to 100 Hz with a constant out of plane acceleration of 0.3g. Figure 13 shows the boundary
conditions where the nodes in the areas covered by the yellow boxes are fixed in the x, y, and z axes and
the centre of the spiral is free to deflect. This is similar to a pinned-pinned beam condition.
Figure 13: The elements of the mesh of the ANSYS simulation and highlighted in yellow are the fixed boundary
conditions.
The displacement sensing location is chosen to be the centre of the spiral. Running this simulation
produces the results shown in Figure 14. The first resonance of this beam is at 25 Hz, which is
significantly less than the cantilever beam harvesters discussed in previous sections. The proposed
method of reducing the natural frequency of the system by using a spiral beam geometry is therefore
validated.

22
Figure 14: Displacement of the tip of the piezoelectric bimorph.
The simulated spiral beam in ANSYS can also be used to better understand the mechanics in order to
fabricate and test a real setup. Most importantly, the stresses in the beam should be low enough so that it
will not break or crack from the forcing function (input acceleration). Figure 15 shows a contour plot of
the von Mises stress on the spiral piezoelectric beam, which is used to predict yielding of the material. As
expected, the maximum stress occurs right after the boundary condition. From the results of this
simulation, it is observed from the results of the ANSYS simulation that the beam will not break under
this forcing function.

23
Figure 15: Contour plot of stress profile for the P-MSM spiral piezoelectric beam.
The highest voltage output occurs at the maximum deflection of the beam and for this reason a strain
contour plot is shown in Figure 16. The voltage out of the piezoelectric beam from the simulation is
shown in Figure 17.
Figure 16: Contour plot of the strain profile for the P-MSM spiral piezoelectric beam.

24
Figure 17: Voltage output from the piezoelectric spiral beam.
The piezoelectric bimorph is wired in an open circuit configuration. The maximum voltage is attained at
the maximum strain which occurs at the resonance. As depicted in Figure 17, there are three distinct
voltage peaks with each one representing a mode of the system. The first mode is the most prominent
mode with the highest effective amplitude and will be one of the main design attributes of this harvester.
4.2.2 Magnetostrictive Model
The magnetostrictive laminates were not modeled due to the extremely nonlinear behavior of the
coupling. Furthermore, connecting 100 layers would greatly complicate the simulation. For these reasons
only experimental analysis was conducted.
4.3 P-MAG
The P-MAG harvester has both piezoelectric and electromagnetic materials. Due to the nature of the FEA
software that was used, both components were modelled separately. The piezoelectric component was
modelled on ANSYS, in a similar manner as the P-MSM, while the electromagnetic part was modelled in
COMSOL.

25
4.3.1 Piezoelectric Model
The piezoelectric material was modelled in ANSYS Mechanical APDL 14.0. It was setup in the same way
as the P-MSM harvester with the exception of adding the magnet to the bottom of the spiral (Refer to
Figure 18).
(a) Top view (b) Bottom view
Figure 18: P-MAG harvester (a) from a top view and (b) from a bottom view.
In the ANSYS simulation the magnet was simply added for its mechanical effect on the piezoelectric
material and did not possess any magnetic properties; it was simply added as dead weight by specifying
its dimensions and density. Table 4 shows the difference in setting up the two materials for the
simulation. They both have a different element types due to the fact that the magnet is not a coupled
material and is acting simply as added mass.
Table 4: Properties of P-MAG on ANSYS.
Piezoelectric Magnet
Element Type Solid 226 Solid 186
Number of Elements 12,320 3825
Volume 763.41 78.6
Similar to the P-MSM harvester, the stresses in the piezoelectric beam must be tested in order to ensure
that the added weight of the magnet does not cause any cracks or failure in the beam. Figure 19 shows the
areas with the maximum and minimum stress and as observed from the ANSYS simulation they are well
below the tolerance so the beam will not break or crack.

26
Figure 19: Contour plot of the stress profile for the P-MAG piezoelectric spiral beam.
Similar to the P-MSM simulation, the centre of the spiral is where the displacement sensing takes place.
Figure 20 shows the result of the tip displacement of the beam. The first resonance in this case happens at
23 Hz as opposed to the P-MSM spiral beam which was at 25 Hz. This decrease is expected due to the
added mass of the magnet where the natural frequencies of a system are inversely proportional to the tip
mass.
Figure 20: P-MAG tip displacement.

27
The highest voltage output occurs at the maximum deflection of the beam and for this reason a strain
contour plot is shown in Figure 21. The voltage output of the piezoelectric beam from the simulation is
shown in Figure 22.
Figure 21: Contour plot of the strain profile for the P-MAG piezoelectric spiral beam.
Figure 22: P-MAG voltage output.
The piezoelectric bimorph of the P-MAG harvester is wired in an open circuit configuration as was done
for the P-MSM harvester. Due to the nature of piezoelectric material the maximum voltage is attained at
28
the maximum strain which happens at the resonance. Figure 22 shows the voltage output of the P-MAG
to be very similar in shape as that of the P-MSM. Since one of the goals of this thesis is to harvest energy
at low frequencies the first resonance will be the main focus.
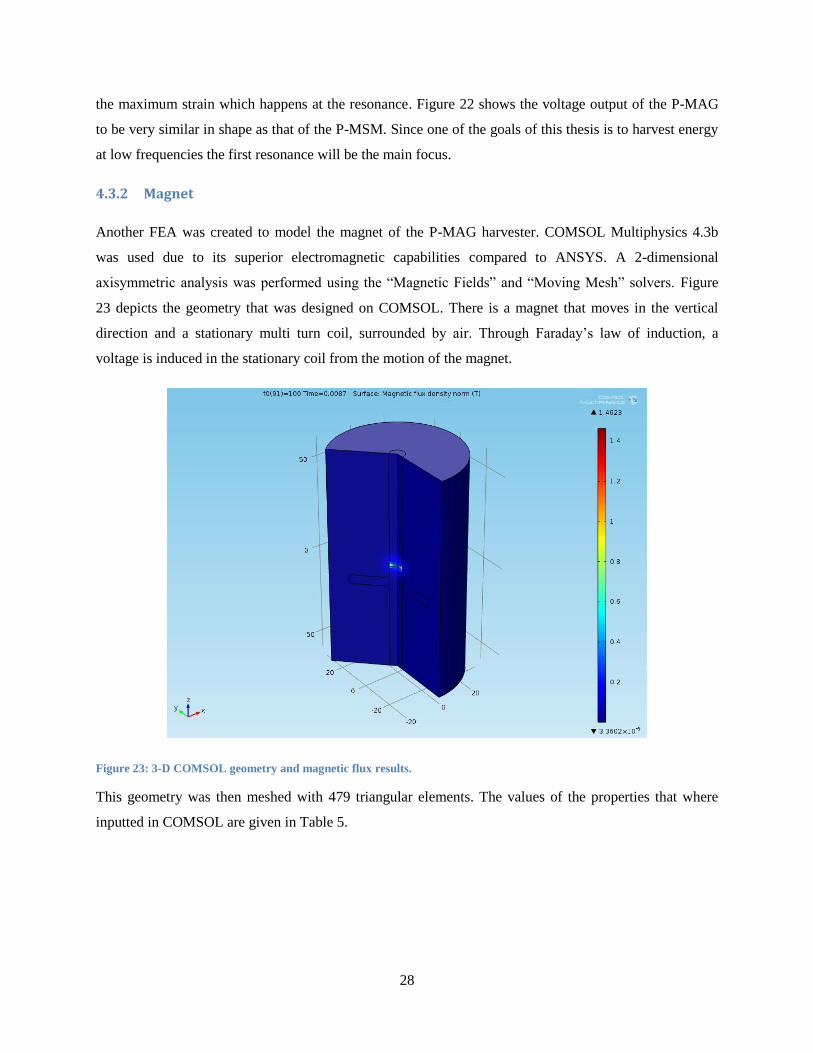
4.3.2 Magnet
Another FEA was created to model the magnet of the P-MAG harvester. COMSOL Multiphysics 4.3b
was used due to its superior electromagnetic capabilities compared to ANSYS. A 2-dimensional
axisymmetric analysis was performed using the “Magnetic Fields” and “Moving Mesh” solvers. Figure
23 depicts the geometry that was designed on COMSOL. There is a magnet that moves in the vertical
direction and a stationary multi turn coil, surrounded by air. Through Faraday’s law of induction, a
voltage is induced in the stationary coil from the motion of the magnet.
Figure 23: 3-D COMSOL geometry and magnetic flux results.
This geometry was then meshed with 479 triangular elements. The values of the properties that where
inputted in COMSOL are given in Table 5.

29
Table 5: COMSOL simulation values.
Property Value
Magnetic Flux 1.48 T
Multi Turn Coil 500 Turns
Coil Material Copper
Wire Gauge 38 AWG
To properly model the magnetic field around the magnet and coil, the air around the magnet and the coil
must also be modelled and meshed in COMSOL. The magnet’s motion is directly inputted into COMSOL
from the ANSYS simulation in order to simplify the model. The air directly above and below the magnet
is modelled as a moving mesh due to the fact that the magnet moves and the mesh must move around to
accommodate this motion. Refer to Figure 23 for the 3-dimensional contour plot of the magnetic flux
density of the model. This figure shows the magnet moving through a multi-turn coil surrounded by air,
which represents the actual system.
Figure 24 shows the voltage output of the copper coil which is directly related to the motion of the
magnet. The motion of the magnet is taken from the motion of the center of the spiral piezoelectric beam.
For that reason the natural frequencies of this graph match perfectly with those in Figure 20. They are one
system that is mechanically connected and expected to have the same resonance frequency.
Figure 24: Voltage results for the magnet.

30
Chapter 5: Experimental Procedures
This chapter describes in detail the experimental procedures. Discussed in this chapter are the steps taken
to perform the experiments as well as the building and design of the prototypes for the two harvesters.
The different equipment and measuring devices used are outlined. Lastly, the chapter presents the results
of the experiments which will appear in the proceedings of AMMCS 2013.
5.1 Material Fabrication
Due to the complex nature of the design geometry, further research was needed to determine an
appropriate fabrication method. This was a necessary step before any reliable testing could begin.
Conventional and non-conventional fabrication methods were tested in order to realize the spiral design
geometry that was intended.
5.1.1 Piezoelectric Material
Piezoelectric material has many different composites that are designed specifically for sensing, actuating,
and harvesting applications. As mentioned in Chapter 2, the piezoelectric material with the highest
coupling is PZT. There are different types within this material as is listed in Table 3. Type 5H has a
higher coupling than type 5A, but only can only be produced in thickness less than 0.25 . For that
reason the testing done in this work used piezoelectric type 5A (PSI-5A4E). The material was purchased
from Piezo Systems Inc. located in Massachusetts and is produced in 0.5 thick plates [45].
Machining
A common method to manufacture piezoelectric material is regular machining. The piezoelectric material
can be successfully cut in straight lines using this method by using a diamond drill bit (depicted in Figure
25). When the same method was applied to the spiral geometry the piezoelectric plate would often break,
due to the relatively small arcs that form the spiral shape. This method proved ineffective for cutting the
spiral shape geometry.

31
Figure 25: Diamond drill bit.
Laser machining
Laser machining using a carbon dioxide laser (CO2 laser) was tested as a method to cut piezoelectric
material. The laser used is a Universal Laser Systems VLS 2.30 desktop laser. The benefit of a CO2 laser
is that it works well on non-metal materials. This laser was successful in cutting piezoelectric material
that was less than 0.125 thick. Any additional increase in thickness caused unreliable cutting and
failure to consistently penetrate through the entirety of the piezoelectric material.
Some of the observations made were that the piezoelectric material heats up to a point where
discoloration begins. Figure 26 depicts a small 1x1 square that was cut from a plate using this
method. From this figure it is clear that the cut did not result in smooth edges and the pieces were red in
color, giving a burnt appearance. This could be attributed to the laser power being too high and thus
creating too much heat.
Figure 26: A square that was laser machined from the piezoelectric material using high power settings.
To avoid discoloration and possible loss of piezoelectric coupling properties through depolarization, the
power of the laser was decreased with the aim of attaining a smooth cut. As depicted in Figure 27 the
edges became orange in color and the cut did not fully penetrate the material. The cut made at the edges is
also very rough and excess heat remained an issue.

32
Figure 27: A square that was laser machined from the piezoelectric material using low power settings.
For this reason a Neodymium-Doped Yttrium Aluminum Garnet laser (Nd:YAG laser) machine was then
tested. This laser has a shorter cutting time than the CO2 laser but is used mainly for cutting metals. The
reasoning behind using this machine is due to the speed of the laser beam. The idea is that if the beam is
faster then it would not stay on the same area for a prolonged period of time and hopefully this would
reduce the heat that the material experiences, decreasing the chances of depolarization. The Nd:YAG
laser, unfortunately, gave very similar results to the CO2 laser and was unsuccessful at cutting the
material.
Water Jet
A water jet was used after the laser machining failed to cut the thick 0.5 piezoelectric sheet. The
water jet method uses highly pressurized water that is shot through a fine tipped nozzle attached on a
robotic arm that controls its motion in the x and y planes. The nozzle heads change depending on the
thickness of the stream of water which then relates to the thickness of the cut. Although water jetting
seems like a very aggressive method it proved to be successful. Figure 28 below shows the final
piezoelectric spiral beam after it was cut. To ensure there were no micro cracks in the material, it was
observed under a microscope. Figure 29 shows a sample of the pictures taken by the microscope at the
edges of the piezoelectric spiral. The piezoelectric spiral has an overall mass of 4.95 .

33
Figure 28: Final cut of the piezoelectric bimorph.
Figure 29: Microscopic pictures of the piezoelectric material after water jet.
5.1.2 MSM
The magnetostrictive material (MSM) that was used is Metglas Magnetic Alloy 2605-SA1, purchased
from Metglas Incorporated [46]. This material was chosen due its high permeability and low magnetic
losses at lower frequencies, which is one of the design features for the harvester. This material comes in
standard 25 thick laminates making the effect of a single layer negligible. For that reason, and to
increase the overall effect, multiple layers were used in conjunction. Different methods where explored to
try and cut this material into a spiral shape.
Laser Machining
Similar to piezoelectric material, the CO2 laser was also tested to cut the magnetostrictive material. As
stated above the MSM comes in very thin laminate sheets, which give it a look almost like aluminium
foil. As soon as the laser beam hits the material it immediately starts wrinkling and deforms. This causes

34
an uneven level for the laser to cut and the material is moved from the focal point of the beam. The result
is a partially cut wrinkled part. Laser machining was not successful for this material.
Electric Discharge Machining
Electric Discharge Machining (EDM) is a machining method that cuts the material by controlling an
electric discharge, which is a spark that is created between two electrodes by applying a voltage on either
side. One of the electrodes is a tip that is controlled by the machine and the other electrode is the material
being cut. For this reason EDM can only be used on conductive material.
Since multiple MSM layers would be needed to produce a stronger magnetic effect and reasonable
harvesting capability, it was necessary to create a stack of multiple layers. In this work, 100 MSM layers
were sandwiched between two pieces of steel that were then tightly clamped together. This was done due
to the nature of the MSM to wrinkle and deform. It also keeps all the MSM layers in line with each other
in order to have a consistent cut through all the layers. This method was successful in cutting MSM, and
the result was 100 layers of spiral shapes pieces that have a mass of 10.27 .
Annealing
MSM is a ferromagnetic material meaning it has magnetic dipoles that are fixed. Generally, a bias
magnetic field is applied to this material to align the magnetic dipoles in one direction. To further increase
the magnetic effect, the magnetic dipoles can be aligned through annealing and then a bias magnetic field
applied. Depicted in Figure 30 is the field annealed versus the no-field annealed properties of this specific
MSM [47]. In both cases, the material is annealed, but one has an external magnetic field during the
annealing process. From the figure there is a clear advantage to annealing while applying a field as it
allows the MSM to have a stronger magnetic field even when the external field is removed.

35
Figure 30: Metglas 2605 SA1 field annealed vs. no field annealed [47].
Figure 31 illustrates the steps that ferromagnetic materials undergo when they are being annealed.
Initially the magnetic dipoles in the material are fixed and un-aligned (refer to Figure 31a). The material
was then placed in an oven and subjected to heat. As it is heated the membrane around the magnetic
dipole starts to weaken (Figure 31b). When it reaches a specific temperature the magnetic dipoles become
free to move in any direction (Figure 31c). This temperature is known as the Curie temperature. When
ferromagnetic material is heated to a temperature surpassing its Curie temperature, they act like a
paramagnetic material. This means that their internal magnetic dipoles are free to move and are
influenced by the environment to which they are subjected. An external magnetic field is then applied
(Figure 31d) and the magnetic dipoles of the material align themselves with the external field (Figure
31e). The material is then cooled in order to rebuild the membrane that surrounds the dipoles and keep
them in place (Figure 31f).

36
(a)
(b)
(c)
(d)
(e)
(f)
Figure 31: Explanation of the annealing of the magnetostrictive material.
For this MSM material two high temperature magnets were used to apply the external magnetic field
during annealing. They supplied 1500 Gauss through the thickness of the spiral, which was applied
throughout the entire heating and cooling cycle. Depicted in Figure 32 is the Lindberg/Blue M box
furnace that was used for annealing.

37
Figure 32: Lindberg/Blue M box furnace used for annealing MSM.
The oven was set following the temperature profile shown in Figure 33 that corresponds to the annealing
steps that were previously explained. As depicted in the figure the oven went from room temperature to
450 ⁰C in one hour. The Curie temperature of the MSM is 425 ⁰C. It then stayed at this temperature for 3
hours to allow ample time for the material’s dipoles to align with the external field. After that it cools
down to room temperature once again in one hour. The temperatures and durations used were specified by
Metglas Incorporated.
Figure 33: Oven temperature profile for annealing.

38
5.1.3 Magnets
As discussed in the Chapter 2, magnets are very common in energy harvesting applications. Through
Faraday’s law of induction a voltage can be produced in a coil if it is exposed to a changing magnetic
field, i.e. a moving magnet. A type of rare earth magnet that is commonly used in harvesting application
is Neodymium magnets (NdFeB magnets) as they are among the strongest permanent magnets that can be
made.
Attaching a magnet in the middle of the piezoelectric spiral would allow for two sources of energy. The
D51 NdFeB magnet Grade N52 purchased from K&J Magnetics, Inc. [48] is used for this application. It
has a diameter of 8 and a thickness of 1.6 and is axially magnetized with a mass of 0.6 (Refer
to Figure 34). This particular size magnet was chosen so that it would not interfere with the spiral beam
during vibrations.
Figure 34: The D51-N52 NdFeB Magnet.
5.2 Circuit
The piezoelectric material as explained in previous sections is wired in a series connection. The output
from the top and bottom layer gives the open circuit voltage. For the purposes of this research, the circuit
attached to the spiral is simplified to a simple resistive load in order to focus on the energy harvesting
aspect.
To obtain the maximum power output for this system the internal resistance of the piezoelectric material,
RI, has to equal the load resistance, RL. This idea is explained by the Maximum Power Transfer Theorem,
and can be seen below.

39
Figure 35: Basic electric circuit.
(14)
(15)
(16)
In order to maximize the power at the load the denominator of Eq. (16) should be at a minimum. This
is performed by taking the derivative of the denominator and equating it to zero.
(
)
(17)
(18)
(19)
Eq. (19) shows that that the maximum power at the load occurs when the internal resistance of the
piezoelectric spiral is equal to the resistance at the load. The next step is to find the internal resistance of
the piezoelectric spiral.
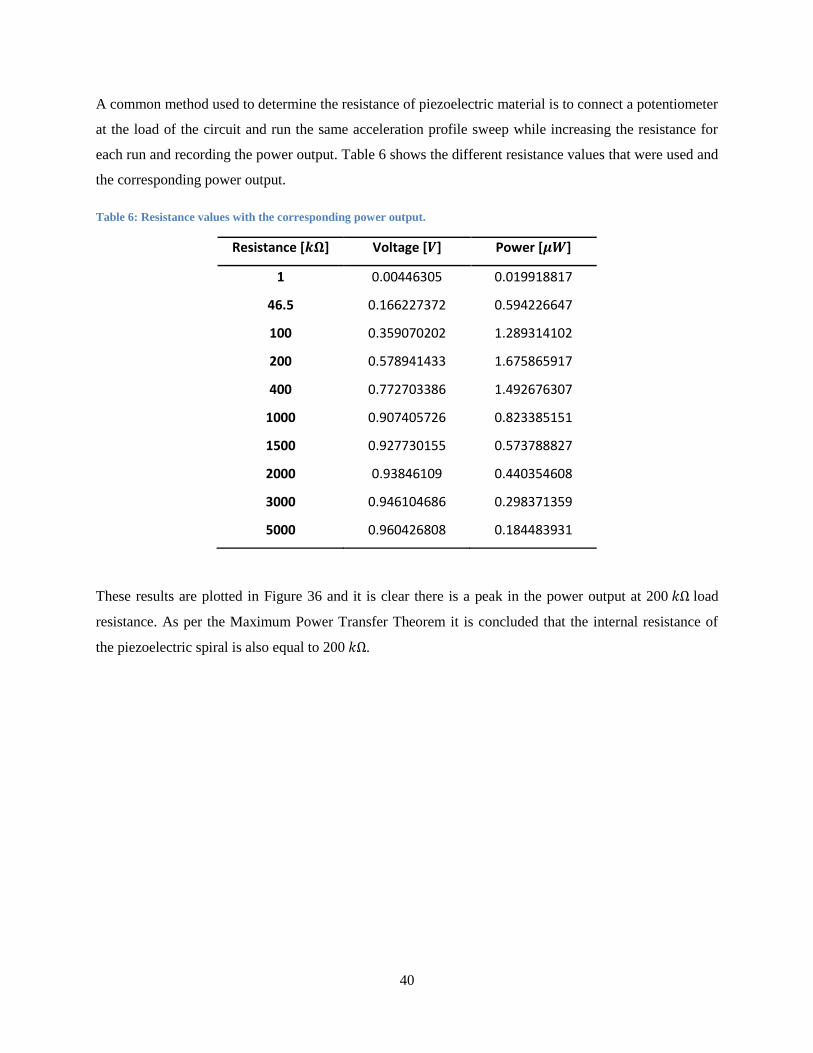
40
A common method used to determine the resistance of piezoelectric material is to connect a potentiometer
at the load of the circuit and run the same acceleration profile sweep while increasing the resistance for
each run and recording the power output. Table 6 shows the different resistance values that were used and
the corresponding power output.
Table 6: Resistance values with the corresponding power output.
Resistance [ ] Voltage [ ] Power [ ]
1 0.00446305 0.019918817
46.5 0.166227372 0.594226647
100 0.359070202 1.289314102
200 0.578941433 1.675865917
400 0.772703386 1.492676307
1000 0.907405726 0.823385151
1500 0.927730155 0.573788827
2000 0.93846109 0.440354608
3000 0.946104686 0.298371359
5000 0.960426808 0.184483931
These results are plotted in Figure 36 and it is clear there is a peak in the power output at 200 load
resistance. As per the Maximum Power Transfer Theorem it is concluded that the internal resistance of
the piezoelectric spiral is also equal to 200 .

41
Figure 36: Results of resistance testing of the piezoelectric spiral.
5.3 Testing Setup
After the fabrication of the material, the prototypes needed to be tested in order to determine their
performance and efficiency. For the testing to be possible, specific measurement equipment was used. To
effectively determine performance of the proposed harvesters they need to be subjected to a known and
controlled vibration input and the resulting output voltage or power needs to be recorded.
Figure 37 shows the test setup and the major components used to record the results. As depicted in Figure
37, the setup consists of an electrodynamic shaker, an amplifier, a laser vibrometer, a vibrometer
controller, a data acquisition system, and the laptop used for set up and viewing of the data.

42
Figure 37: Equipment used and test setup.
A shaker is used as the vibration source for the harvester. It is a Modal Shop 2075E Dual Purpose Shaker.
It is a permanent magnet shaker that can provide up to 334 of force. It has a standard turnnion
mounting base that allows for a 90⁰ rotation for different axis excitation. The armature has a stroke of
25.4 and can be operated at frequencies up to 6500 Hz.
The shaker is controlled by LMS SCADAS Mobile Data Acquisition System (DAS). It has 8 input ports
to record and process data and 2 output ports that regulate signals. It sends a controlled signal to the
shaker through the amplifier in order to reach a desired acceleration. The LMS SCADAS controls this
signal using a feedback loop and an accelerometer is used to ensure the desired acceleration levels are
met.
The accelerometer used is a 352A24 made by PCB Piezotronics. This accelerometer was chosen due to its
versatility. Its sensitivity is 100 and can operate to frequencies up to 10,000 Hz. Another key
component in the setup is the laser vibrometer and its controller. The sensor head is a Polytec OFV 505
and the controller is OFV 5000. It is a laser Doppler vibrometer that works on the Doppler principle,
which sends a light beam at a vibrating structure and measures the returning beam to determine velocity
and displacement. This is used to measure the deflection of the spiral beams due to the input vibration.
A laptop running LMS Test Lab software is connected to the DAS through an Ethernet cable, which
allows it to make the appropriate settings to run the test. The Sine Control module in Test Lab was used.
The acceleration was at a constant 0.3g while the frequency was swept from 10 Hz to 100 Hz.

43
The shaker itself has coils inside it, and when a current goes through them the armature will move. This
implies that the coils will have a magnetic field as a result of the current flow, which might affect the
results of the pick-up coil for the magnet and the MSM. A 500 turn copper coil was placed on the
armature of the shaker. It was exposed to the same vibration profile that will be used for the harvesters in
order to see the effect of the shaker’s magnetic field. The outcome of this test is displayed in Figure 38,
which shows that the coil does indeed pick up noise from the shaker, which will add unwanted noise to
the results.
Figure 38: Voltage output from the noise of the shaker.
An aluminum spacer was then fabricated in order to increase the distance between the test piece and the
shaker (Refer to Figure 39). The same vibration profile was applied again so see if the noise is reduced.
From Figure 40 it is observed that there is around 5 of noise from the shaker after being elevated. This
indicates that there is less noise and the spacer is sufficient to minimize the magnetic field noise emitted
from the shaker.
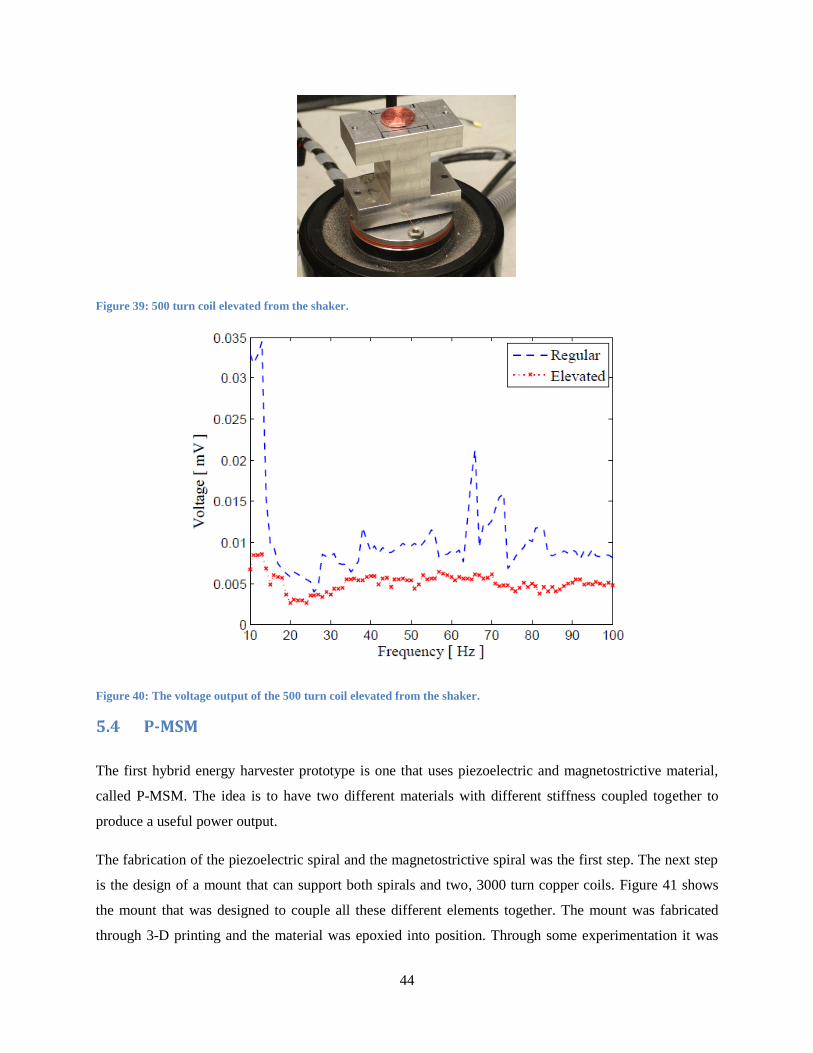
44
Figure 39: 500 turn coil elevated from the shaker.
Figure 40: The voltage output of the 500 turn coil elevated from the shaker.
5.4 P-MSM
The first hybrid energy harvester prototype is one that uses piezoelectric and magnetostrictive material,
called P-MSM. The idea is to have two different materials with different stiffness coupled together to
produce a useful power output.
The fabrication of the piezoelectric spiral and the magnetostrictive spiral was the first step. The next step
is the design of a mount that can support both spirals and two, 3000 turn copper coils. Figure 41 shows
the mount that was designed to couple all these different elements together. The mount was fabricated
through 3-D printing and the material was epoxied into position. Through some experimentation it was

45
determined that the voltage from the magnetostrictive material was low, and one of the methods to
increase the output is to add a bias magnetic field. This bias magnetic field helps align the magnetic poles
of the magnetostrictive material. For that reason two magnet channels were added to the mount design to
hold small magnets strong enough to create an effective biased magnetic field.
Figure 41: P-MSM Prototype.
Three NdFeB magnets were placed on each side of the magnetostrictive material into the channels located
on either side of the mount as can be seen in Figure 41. The field created by these magnets in the area of
the magnetostrictive material is depicted in Figure 42. Due to the use of the magnets the magnetic field
will not be consistent throughout the length of the material. It will be stronger closer to the magnets and it
will weaken at the farthest point from the magnets.
Figure 42: Magnetic field created around the magnetostrictive material.

46
Figure 43 depicts the bias magnetic field values that the magnetostrictive material experiences. The
extents of the spiral go roughly from -20 to 20 on the x-axis and as shown the field has a
maximum at 1500 and the minimum in the centre of the spiral layer at 900 .
Figure 43: A plot of the value of the bias magnetic field as experienced by the magnetostrictive layer.
The addition of the bias magnet significantly increased the output from the magnetostrictive layer. The
unit was then placed on the shaker for vibration testing as explained in previous sections. The power
results of both layers where measured separately then they were totalled to obtain the total power this unit
can harvest.
Figure 44 and Figure 45 display the frequency response function (FRF) of the displacement and power
output of the piezoelectric layer respectively. The displacement is measured at the centre of the spiral
(free end) which is measured by the laser vibrometer. The maximum displacement FRF amplitude was 8
and the maximum power FRF peaked at 20.91 . Both these occurred at 23 Hz, which is the
first resonant frequency of the piezoelectric material. These results will later be used to make a
comparison to the results found in the modelling section.

47
Figure 44: Piezoelectric displacement from the P-MSM harvester.
Figure 45: Piezoelectric power from the P-MSM harvester.
Figure 46 displays the power output from the magnetostrictive layer. The peak occurred at a frequency of
17 Hz with an amplitude of 10.07 . Figure 47 focuses on the power output at the first natural
frequency of the piezoelectric and the magnetostrictive layers. From these results we can conclude that

48
the two power peaks for the different materials did not occur in the same frequency and had different
shapes.
Figure 46: Magnetostrictive power from the P-MSM harvester.
Figure 47: Combined power FRF plots for the piezoelectric and the magnetostrictive layers.

49
In order to see how the system works as a whole the two power plots will be added together to show the
total power FRF for the P-MSM harvester. Figure 48 depicts the power output of the first resonance of
each of the materials. In green is the FRF of the overall power output for the harvester. It is observed that
the first peak had a value of 10.41 at a frequency of 17 Hz and the second peak had a value of
21.88 at a frequency of 23 Hz.
Figure 48: Total power of the P-MSM harvester.
From Figure 48 it is observed that there is a wide band of frequencies that can be used to harvest energy.
The lowest power is 2 , and the highest power is 21.88 . This allows the harvester to be a
wide band harvester that can operate for frequencies from 16 Hz to 26 Hz. This is large in comparison to
the average range of 1 to 3 Hz for simple energy harvesting that occurs at only one peak. This allows the
P-MSM to be advantageous in many applications where the ambient vibration source tends to drift over a
range of frequencies.
The average of the power spectral density (PSD) of the PZT from Figure 47 for the frequency range
shown (17 Hz to 23 Hz) is 1.97 . The PSD for the total power of the hybrid P-MSM harvester in the
same frequency range is 5.151 , which shows a 160% increase.

50
5.5 P-MAG
The second hybrid energy harvesting prototype is one that uses piezoelectric and electromagnetic
material, called P-MAG. It is formed mainly of piezoelectric material and includes a magnet attached at
the centre of the piezoelectric spiral, as shown in Figure 49. Generally, a static mass is used to reduce the
natural frequencies of the structure [49]. The benefit of using a magnet in the P-MAG harvester is not
only to reduce the frequencies of the system, as would a static mass, but to induce a voltage in a nearby
coil. By doing so, the hybrid system produced more power than a simple piezoelectric spiral with only a
static mass at a lower frequency.
Figure 49: P-MAG Prototype.
Figure 50 and Figure 51 display the FRFs for the displacement and power output of the piezoelectric layer
respectively. The displacement is measured at the centre of the spiral where the magnet is also attached.
The maximum displacement amplitude was found to be 8.8 and the maximum power peaked at
18.3 . Both of these occurred at 21 Hz, the first resonant frequency of the piezoelectric material.
These results will later be compared to the modelling results.

51
Figure 50: Piezoelectric displacement for P-MAG harvester.
Figure 51: Piezoelectric power for P-MAG harvester.
The magnet will also resonate at 21 Hz because it is attached to the piezoelectric spiral. From the 500 turn
copper coil the maximum induced power was 33.79 . Figure 53 shows the power of the P-MAG
harvester which is found by combining the power output of the magnet and piezoelectric materials. It has

52
a peak of total power 52 at a frequency of 21 Hz. As expected, the added mass of the magnet
reduced the natural frequency of the spiral.
Figure 52: Magnet power for P-MAG harvester.
Figure 53: Total power for P-MAG harvester.

53
Unlike the P-MSM, the P-MAG only had one peak, which means it cannot be used as a wide band
harvester. It does however result in higher power output and this, allows the harvester to be used in
applications where higher power is necessary.

54
Chapter 6: Validation and Analysis
This chapter compares the experimental and simulated frequency response functions (FRFs) of each
proposed harvester. The validation of the experimental results from Chapter 4 with the simulation results
from Chapter 5 is essential to ensure that this system can be modelled appropriately and that the results
are repeatable.
6.1 Damping
When the simulation was performed, damping was not considered in the system. Damping exists in any
mechanical structure but the value can be small and assumed to be negligible. Damping should be
considered in order to get a more accurate model of the system. In this thesis, the quadrature peak picking
method outlined in Inman [50] is used to determine the damping ratios from experimental FRFs however
many other suitable methods to determine damping ratios exist. The quadrature peak picking method is
applicable for lightly damped systems. To obtain the model damping ratio , the displacement FRF of the
P-MAG harvester is used as an example (Refer to Figure 54).
Figure 54: Piezoelectric displacement FRF illustrating the calculation of the damping ratio

55
From Figure 54, is the damped natural frequency and ( ) √ corresponds to the 3 dB magnitude
drop. The relation of and to the damping ratio is explained.
| ( )| | ( )| | ( )|
√ (20)
(21)
(22)
Eq. (22) provides the expression to calculate the damping ratio . The ANSYS simulation was previously
run without the considering damping. In order to include it ANSYS requires the damping value to be the
damping coefficient .
(23)
Once the damping coefficient of the system is determined, it is used in the ANSYS Mechanical APDL
as the damping value for the model. Adding damping to the model will provide a more realistic
representation of the experiment that is being performed. Additionally, the results will match more closely
with the experiment.
6.2 P-MSM
Recall from Chapter 4 that the piezoelectric layer is the only layer that is modelled in ANSYS for the P-
MSM harvester. Figure 55 and Figure 56 show the results of the piezoelectric layer both for displacement
of the tip and power output. From Figure 55, it is observed that there is less than a 5% difference for the
first peak. The other peak matches closer with the experimental results. This suggests the simulation and
the experimental are in good agreement.

56
Figure 55: P-MSM results for the experimental vs. the simulation for the tip displacement of the piezoelectric spiral.
Figure 56: P-MSM results for the experimental vs. the simulation for the power output of the piezoelectric spiral.
Figure 56 depicts the power output of the piezoelectric material. The first peak and third peak are in good
agreement with the experimental but the second peak is off by a difference of 9%. To obtain a better

57
understanding on the how the spiral is moving at the three peaks the mode shapes were animated and the
results can be seen in Figure 57.
(a)
(b)
(c)
Figure 57: Animating the mode shapes (a) First peak, (b) Second peak, (c) Third peak.

58
Figure 57a shows the shape of the spiral resonating at 23 Hz, which is the first peak in the FRF. As
expected this is the first bending mode of the spiral and the center moves in the same direction as the rest
of the surrounding rings. On the other hand, Figure 57b is a torsional mode at 49 Hz. A torsional mode
produces strain on the spiral beam but due to torsion rather than bending. This explains why there is a
relatively larger second peak in the power plots as opposed to the displacement plots. Torsional modes
cannot be detected by sensing the displacement in only one direction, which is what the displacement
plots show. The animation of the third peak of the FRF is shown in Figure 57c. This shows that the third
peak is the second bending mode of the spiral and also as expected the center of the spiral moves in the
opposite direction of the surrounding rings.
Consequently the difference in the second peak of the power plot is explained by the torsional mode at
that frequency. For a complex geometry like the spiral the torsional mode shapes are more difficult to
model accurately. In this case there is a 9% difference between the experimental and simulation of the
torsional mode, which is an acceptable difference due to the geometry.
6.3 P-MAG
The P-MAG harvester has two components, the piezoelectric layer and the attached magnet. The
piezoelectric layer displacement and power output modelling in comparison to the experimental is shown
in Figure 58 and Figure 59 respectively. It is very similar to the results of the piezoelectric layer in the P-
MSM harvester. The results are generally in good agreement except at the second peak, which has an 8%
difference in this case. This is explained by the torsional mode at 48 Hz, which is an acceptable difference
due to the complex geometry of the spiral.

59
Figure 58: P-MAG results for the experimental vs. the simulation for the tip displacement of the piezoelectric spiral.
Figure 59: P-MAG results for the experimental vs. the simulation for the power output of the piezoelectric spiral.

60
The simulation of the power output from the magnet’s motion was done separately from the piezoelectric.
Figure 60 shows the results of the comparison. It is observed that the results are in agreement and the
model closely represents the experiment.
Figure 60: P-MAG results for the experimental vs. the simulation for the power output of the magnet.
The simulation and experimental results are in good agreement for the P-MSM and the P-MAG
harvesters. This allows the simulation to accurately model experimental setups. This in turn allows for
ease of designing and optimizing the harvesters for different applications.
6.4 Discussion
Currently in the field of energy harvesting there is not one single unified method for comparing the
effectiveness of harvesters due to the large variations in the data that is presented in published works. This
means some assumptions and calculations have to be made from the data provided. S. P. Beeby et al. [20]
derived a measure for normalized power density (NPD) that was used only as an indication of relative
performance. It is described as
(24)

61
where is the peak power output, is the base acceleration, and is the volume of the harvester. Table 7
compares some available harvesters in the literature and their respective NPD information.
Table 7: Comparison with other published energy harvester.
Energy Harvesters Frequency
[ ]
Acceleration
[ ]
Volume
[ ]
Power
[ ]
NPD
[ ]
P-MSM (presented
research) 16-26 2.94 4.74 22 0.58
P-MAG (presented
research) 21 2.94 1.66 52 15.38
Beeby [20] 52 0.589 0.15 46 883.97
Roundy [24] 120 2.5 1 375 60
Karami [38] 8 1.18 8.6 110 9.19
Wu [39] N/A 12 0.0196 23.2 8.22
Ching [51] 110 95.5 1 830 0.09
White [52] 80 2.3 0.125 2.1 3.18
Jeon [53] 13900 106.8 0.000027 1 3.25
Table 7 shows a few harvesters that have higher NPD values than the P-MSM studied in this work. For
example, Beeby et al. [20] has an NPD of 883 which is calculated using only the volume of the
magnets. If the full volume of the harvester which includes the bulk volume of the magnets, the tungsten
mass used to tune the frequency, and the cantilever beam was to be considered, this value would drop to
around 70 . Also the operating frequency is about 52 Hz which is in the higher frequency range
and not practical for the application intended in this thesis. Roundy [24] and White [52] both have
harvesters that operate at 120 Hz and 80 Hz respectively. Also, Jeon [53] and Wu [39] designed MEMS
harvesters that operate in the kHz range. These frequencies are not practical for the applications intended
in this thesis either. The P-MSM in comparison operates in frequencies under 26 Hz. Also, Karami [38]
designed a harvester that operates at 8 Hz but it is large in size with the beam dimensions being 154 x
25 where the P-MSM has a 45 diameter, the volume is also almost double. Karami’s [38]
harvester has a bandwidth of about 2-3 Hz whereas the P-MSM has an operating range of 16-26 Hz.
Lower operating frequency, small dimensions as well as the bandwidth of the frequency operation (10
Hz) are among the advantages of the P-MSM harvesting unit fabricated in this research. The P-MAG
harvester on the other hand, has a narrow frequency bandwidth about 21 Hz but has a higher power

62
output. Therefore, any small changes in the base excitation frequency from the peak value results in a
significant drop in the power of the unit. This design may be pursued for cases where the ambient
excitation frequency is fairly constant.
It should be noted that in general NPD is not an ideal measurement for harvesters of higher frequency
bandwidth due to the power being measured only at the peak frequency. NPD depends highly on how the
volume calculation was performed. Some works incorporate only the active volume, while others use the
volume of the harvester as a whole. Nonetheless, it is only used as a guide for comparison.

63
Chapter 7: Conclusion and Future Work
7.1 Conclusion
Harvesting energy from ambient vibrations is a highly sought after method because of the wide range of
available sources that produce vibration energy, from industrial machinery to human motion application.
Substantial research has been performed on basic energy harvesting technologies such as electromagnetic,
electrostatic, piezoelectric, and magnetostrictive technologies. Hybrid energy harvesters are a new class
of harvesters that employ multiple commonly used harvester technologies into a single system. In this
work, the design of two different hybrid energy harvesters was introduced.
The first prototype studied in this thesis was the P-MSM harvester, which is composed of both
piezoelectric and magnetostrictive technologies. These two materials are both fabricated in a spiral shape
and are allowed to resonate at different frequencies which results in a wide band range of operation. The
second prototype was the P-MAG harvester, which is composed of piezoelectric and electromagnetic
technologies. The piezoelectric layer used for this harvester also is made in to the spiral geometry. A
magnet is attached to the center of the spiral, and a copper coil is employed for harvesting from the
magnet.
Based on the results of this research, the conclusions can be presented as follows:
1. The P-MSM harvester can operate at a wide band of frequencies
The piezoelectric and magnetostrictive layers resonate at different frequencies. This results in a
harvester that is capable of operating between 16 Hz and 26 Hz, with a power output ranging
from 2 to 22 . This wide range of frequencies is very beneficial in applications
where the ambient vibration is not consistent and shifts over time. It allows the harvester to still
be operating at around the peak power output, even with the ambient frequency changing.
2. The P-MAG harvester has the ability to produce a larger power output at a lower frequency
compared to the P-MSM
The piezoelectric layer in the P-MSM harvester resonates at 23 Hz. The added weight of the
magnet on the piezoelectric spiral in the P-MAG harvester results in the reduction of the
resonance frequency to 21 Hz. Since the magnet is attached to the spiral it will also resonate at
the same frequency. Therefore, the materials will both be harvesting the most energy at the
same frequency which will allow for a much larger power output. This harvester has a peak

64
power output of 52 , which is more than double that produced by the P-MSM harvester.
This harvester is ideal in situations where the ambient vibrations are consistently fixed at one
frequency.
3. The simulation and the experimental results are in good agreement
The two harvesters were subjected to a controlled sign sweep that was produced by a shaker
and the resulting power output recorded. It was then compared with the results from
simulations and showed good agreement. The simulation was able to model the torsional mode
in the piezoelectric harvester with a 9% error, due to the complex geometry of the spiral beam.
However, the bending modes were a more accurate representation of the experiment.
4. Magnetostrictive material was shown to a be a viable energy harvesting technology
Magnetostrictive material is not commonly used in vibration energy harvesting application.
Metglas is a magnetostrictive laminate that is produced in 25 thin sheets. 100 layers were
cut, annealed and epoxied together in an effort to magnify the magneto-mechanical effect. It
was successful in producing energy that is comparable to piezoelectric material as well as
possessing high flexibility that allows for a low natural frequency (17 Hz).
5. The spiral geometry greatly reduced the size of the harvester
The cantilever beam is the geometry that is commonly used in this field. The limitation arises
when the beams dimensions get larger in order to have more active material for a higher power
output or when the size is reduced (and thus, the natural frequency significantly increases). The
spiral geometry allows for there to be a larger volume of active material while keeping the
natural frequency relatively low. This is very beneficial for MEMS application where size is an
important criterion of an effective energy harvester.
7.2 Future Work
In this work the two hybrid harvesters were modelled, fabricated, and tested. A continuation of the work
in this thesis can be made as follows:
Optimizing the P-MSM and the P-MAG power output. This can be achieved by tweaking the
spiral geometry in an attempt to maximize the harvester’s capability.

65
Rectifying the signal coming out of the harvesters. In this work the electrical load was reduced to
a resistor. Efforts should be made to rectify and store the output from the harvester, in order to
allow for a sensor to be powered. The rectifier should be a passive rectifier that does not need any
external power to operate, but should be as efficient as possible due to the small signal coming
from the harvester.
Lastly, scaling the design to MEMS scale. Energy harvesting for MEMS application is a field that
received substantial attention from researchers. Efforts can be made towards decreasing the size
of this harvester while still maintaining a reasonable natural frequency and power output. This
can be achievable due to the properties of the spiral beam geometry.

66
References
[1] Mahmoud, M. A. E., Abdel-Rahman, E. M., El-Saadany, E. F, and Mansour, R. R. (2010).
Electromechanical coupling in electrostatic micro-power generators. Smart Materials and
Structures, 19 (2), 1-8.
[2] Mitcheson, P. D., Green, T. C., Yeatman, E. M., and Holmes A. S. (2004). Architectures for vibration-
driven micropower generators. Journal of Microelectromechanical Systems, 13 (3), 429-440.
[3] Roundy S., Wright P. K. and Pister K. S. J. (2002). Micro-electrostatic vibration-to-electricity
converters. ASME International Mechanical Engineering Congress and Expostion, New Orleans
Louisuana.
[4] Khaligh, A., Zeng, P., and Zheng C. (2010). Kinetic energy harvesting using piezoelectric and
electromagnetic technologies—state of the art. IEEE Transactions on Industrial Electronics, 57 (3),
850-860.
[5] Shearwood, C., and Yates, R. B. (1997). Development of an electromagnetic microgenerator. IEE
Electronics Letters, 33 (22), 1883-1884.
[6] Arnold, D.P., Das, S., Cros, F., Zana, I., Allen, M.G., and Lang, J. H. (2006). Magnetic induction
machines integrated into bulk-micromachined silicon. Journal of Microelectromechanical Systems,
15 (2), 406-414.
[7] Holmes, A.S., Hong G., and Pullen, K.R. (2005). Axial-flux permanent magnet machines for
micropower generation. Journal of Microelectromechanical Systems, 14 (1), 406-414.
[8] Roundy, S., Wright, P. K., and Rabaey, J. (2003). A study of low level vibrations as a power source
for wireless sensor nodes. Computer Communications, 26 (11) ,1131-1144.
[9] Mansour, M. O., Arafa, M. H., and Megahed, S. M. (2010). Resonator with magnetically adjustable
natural frequency for vibration energy harvesting. Sensors and Actuators A, 163 (1), 297-303.

67
[10] Lefeuvre, E., Badel, A., Richard, C., and Guyomar, D. (2005). Piezoelectric energy harvesting device
optimization by synchronous electric charge extraction. Journal of Intelligent Material Systems and
Structures,16 (10), 865-876.
[11] Lu, F., Lee, H. P., and Lim S. P. (2004). Modeling and analysis of micro piezoelectric power
generators for micro-electromechanical-systems applications. Smart Materials and Structures, 13
(1), 57-63.
[12] Wu, G., Zhang, R., Li, X., and Zhang, N. (2011). Resonance magnetoelectric effects in disk-ring
(piezoelectric -magnetostrictive) composite structure. Journal of Applied Physics, 110 (12), 1-5.
[13] Li, L., Lin, Y. Q., and Chen, X. M. (2007). CoFe2O4/Pb(Zr052Ti0.48)O3 disk-ring magnetoelectric
composite structures. Journal of Applied Physics, 102 (6), 1-4.
[14] Park, C., Cho, K., Arat, M. A., Evey, J., and Priya, S. (2010). High magnetic field sensitivity in
Pb(Zr,Ti)O3–Pb(Mg1/3Nb2/3)O3 single crystal/Terfenol-D/Metglas magnetoelectric laminate
composites. Journal of Applied Physics, 107 (9), 1-4.
[15] Zhao, X., and Lord, D. G. (2006). Application of the Villari effect to electric power harvesting.
Journal of Applied Physics, 99 (8), 1-4.
[16] Saha, C. R., O’Donnell, T., Wang, N., and McCloskey, P. (2008). Electromagnetic generator for
harvesting energy from human motion. Sensors and Actuators A, 147 (1), 248-253.
[17] Duffy, M. and Carroll, D.(2004). Electromagnetic generators for power harvesting. IEEE Power
Electronics Conference, Aachen, Germany.
[18] El-Hami, M., Glynne-Jones, P., White, N. M., Hill, M., Beeby, S., James, E., Brown, A.D., and Ross,
J.N. (2001). Design and fabrication of a new vibration-based electromechanical power generator.
Sensors and Actuators A, 92 (1-3), 335-342.
[19] Glynne-Jones, P., Tudor, M. J., Beeby, S. P., and White, N. M. (2004). An electromagnetic,
vibration-powered generator for intelligent sensor systems. Sensors and Actuators A, 110 (1-3),
344-349.

68
[20] Beeby, S. P., Torah, R. N., Tudor, M. J., Glynne-Jones, P., O’Donnell, T., Saha, C. R., and Roy, S.
(2007). A micro electromagnetic generator for vibration energy harvesting. Journal of
Micromechanics and Microengineering,17 (7), 1257-1265.
[21] Yang, B., Lee, C., Xiang, W., Xie, J., He, J. H., Kotlanka, R. K., Low, S. P., and Feng, H. (2009).
Electromagnetic energy harvesting from vibrations of multiple frequencies. Journal of
Micromechanics and Microengineering,19 (3), 1-8.
[22] Soliman, M., Abdel-Rahman, E. M., El-Saadany, E. F., and Mansour, R. R. (2009). A Design
Procedure for Wideband Micropower Generators. Journal of Microelectromechanical Systems, 18
(6), 1288-1299.
[23] Sari, I., Balkan, T., Kulah, H. (2008). An electromagnetic micro power generator for wideband
environmental vibrations. Sensors and Actuators A, 145–146, 405–413.
[24] Roundy, S., and Wright, P. K. (2004). A piezoelectric vibration based generator for wireless
electronics. Smart Materials and Structures, 13 (5), 1131-1142.
[25] Jiang, S., Li, X., Guo, S., Hu, Y., Yang, J., and Jiang, Q. (2005). Performance of a piezoelectric
bimorph for scavenging vibration energy. Smart Materials and Structures, 14 (4), 769-774.
[26] Yang, J., Zhou, H., Hu, Y., and Jiang Q. (2005). Performance of a Piezoelectric Harvester in
Thickness-Stretch Mode of a Plate. IEEE Transactions on Ultrasonics, Ferroelectrics, and
Frequency Control, 52 (10), 1872-1876.
[27] White, N. M., Glynne-Jones, P., and Beeby, S. P. (2001). A novel thick-film piezoelectric micro-
generator. Smart Materials and Structures, 10 (4), 850-852.
[28] Challa, V. R., Prasad, M. G., Shi, Y., and Fisher, F. T. (2008). A vibration energy harvesting device
with bidirectional resonance frequency tenability. Smart Materials and Structures,17 (1), 1-10.
[29] Leland E. S. and Wright P. K. (2006). Resonance tuning of piezoelectric vibration energy scavenging
generators using compressive axial preload. Smart Materials and Structures,15 (5), 1413-1420.

69
[30] Hu, H., Xue, H., and Hu Y. (2007). A Spiral-Shaped Harvester with an Improved Harvesting
Element and an Adaptive Storage Circuit. IEEE Transactions on Ultrasonics, Ferroelectrics, and
Frequency Control, 54 (6), 1177-1187.
[31] Lan, J., Hu, L., Wang, H., Cheng, J., Hu, H. (2011). Numerical analysis on an annular bimorph
piezoelectric power harvester with the out-of-plane vibration mode. Piezoelectricity, Acoustic
Waves and Device Applications, Shenzhen, China.
[32] Paprotny, I., White, R. M., and Wright, P. K. Modeling, design and fabrication of a MEMS AC
energy scavenger for smart grid applications. California Energy Commission.
[33] Ryu, J., Carazo, A.V., Uchino, K., and Kim, H. (2001). Magnetoelectric properties in piezoelectric
and magnetostrictive laminate composites. Japanese Journal of Applied Physics, 402 (1), 4948-
4951.
[34] Dong, S., Cheng, J., Li, J.F., and Viehland, D. (2003). Enhanced magnetoelectric effects in laminate
composites of Terfenol-D/Pb(Zr,Ti)O3 under resonant drive. Applied Physics Letters, 83 (23),
4812.
[35] Dai,X., Wen, Y., Li, P., Yang, J., and Li, M. (2011).Energy harvesting from mechanical vibrations
using multiple magnetostrictive/piezoelectric composite transducers. Sensors and Actuators A,166
(1), 94-101.
[36] Wang, L. and Yuan F. G. (2008). Vibration energy harvesting by magnetostrictive material. Smart
Materials and Structures,17 (4), 1-14.
[37] Wischke, M., Masur, M., Goldschmidtboeing, F., and Woias, P. (2010). Electromagnetic vibration
harvester with piezoelectrically tunable resonance frequency. Journal of Micromechanics and
Microengineering, 20(3), 1-7.
[38] Karami, M.A. (2011). Micro-Scale and nonlinear vibrational energy harvesting. Virginia Polytechnic
Institute and State University.
[39] Wu, X., Khaligh, A., and Xu, Y.(2008). Modeling, Design and optimization of hybrid
electromagnetic and piezoelectric MEMS energy scavengers. IEEE Custom Integrated Circuit
Conference, 177-180.

70
[40] Fang, H.B., Liu, J. Q., Xu, Z. Y., Dong, L., Wang, L., Chen, D., Cai, B. C., and Liu, Y. (2006).
Fabrication and performance of MEMS-based piezoelectric power generator for vibration energy
harvesting. Microelectronics Journal, 37 (11), 1280-1284.
[41] Roundy, S. (2005). On the effectiveness of vibration-based energy harvesting. Journal of Intelligent
Material Systems and Structures,16 (10), 809-823.
[42] Gilbert, J. M. and Balouchi, F. (2008). Comparison of energy harvesting systems for wireless sensor
networks. International Journal of Automation and Computing, 5 (4), 334-347.
[43] Cook-Cennault, K. A., Thambi, N., and Sastry, A. M. (2008). Powering MEMS portable devices—a
review of non-regenerative and regenerative power supply systems with special emphasis on
piezoelectric energy harvesting systems. Smart Materials and Structures,17 (4), 1-33.
[44] Donald J.L., (2007). Smart Material Systems. 1st ed. Hoboken, New Jersey: John Wiley and Sons
Incorporated. p 162. Print.
[45] Piezo Systems Inc. PSI-5A4E piezoceramic sheets. [ONLINE] Available at:
http://www.piezo.com/prodsheet1sq5A.html. [Last Accessed November 2013].
[46] Metglas Incorporated. 2605SA1 and 2605HB1 magnetic alloy. [ONLINE] Available at:
http://www.metglas.com/products/magnetic_materials/2605SA1.asp. [Last Accessed November
2013].
[47] Metglas Incorporated. Amorphous alloys for transformer cores. [ONLINE] Available at:
http://www.metglas.com/assets/pdf/2605sa1.pdf. [Last Accessed November 2013].
[48] K & J Magnetics Incorporated. Neodymium disk magnets D51-N52. [ONLINE] Available at:
http://www.kjmagnetics.com/proddetail.asp?prod=D51-N52. [Last Accessed November 2013].
[49] Zhu, D., Tudor, M. J., and Beeby, S. P. (2010). Strategies for increasing the operating frequency
range of vibration energy harvesters: a review. Measurement Science and Technology, 21 (2), 1-29.
[50] Inman, D. J. (2007). Engineering vibration. Upper Saddle River, New Jersey: Pearson Prentice Hall,
p 547. Print.

71
[51] Ching, N.H., Wong, H. Y., Li, W. J., Leong, P. H. W., and Wen, Z. (2001). A laser-micromachined
vibrational to electrical power transducer for wireless sensing systems. Solid State Sensors and
Actuators, Munich, Germany, June 2001.
[52]Glynne-Jones, P., Beeby, S. P., and White, N.M. (2001). Towards a piezoelectric vibration-powered
microgenerator. IEE Science, Measurement and Technology, 148 (2), 68-72.
[53] Jeona, I., Omiya, M., Kishimotob, K., Asahinaa, T., and Im, S. (2005). Modeling of a Gc-sensing
element for the interfacial toughness of metal thin films on substrates. Sensors and Actuators,122
(2), 291-300.