design, development, optimization of 40gw/300-800 ps …
TRANSCRIPT

2008
BARC/2008/E/006B
AR
C/2008/E
/006
DESIGN, DEVELOPMENT, OPTIMIZATION OF 40GW/300-800 PS ND: GLASS LASERSYSTEM AND STUDY OF MATTER AT EXTREME TEMPERATURE AND PRESSURE
byS. Chaurasia, D.S. Munda, C.G. Murali, N.K. Gupta and L.J. Dhareshwar
Laser and Neutron Physics Section, Physics Group,and
Rajasree Vijayan, B.S. NarayanLaser and Plasma Technology Division

BARC/2008/E/006B
AR
C/2
008/
E/00
6
GOVERNMENT OF INDIAATOMIC ENERGY COMMISSION
BHABHA ATOMIC RESEARCH CENTREMUMBAI, INDIA
2008
DESIGN, DEVELOPMENT, OPTIMIZATION OF 40GW/300-800 PS ND: GLASS LASERSYSTEM AND STUDY OF MATTER AT EXTREME TEMPERATURE AND PRESSURE
by
S. Chaurasia, D.S. Munda, C.G. Murali, N.K. Gupta and L.J. DhareshwarLaser and Neutron Physics Section, Physics Group
and
Rajasree Vijayan, B.S. NarayanLaser and Plasma Technology Division

BIBLIOGRAPHIC DESCRIPTION SHEET FOR TECHNICAL REPORT(as per IS : 9400 - 1980)
01 Security classification : Unclassified
02 Distribution : External
03 Report status : New
04 Series : BARC External
05 Report type : Technical Report
06 Report No. : BARC/2008/E/006
07 Part No. or Volume No. :
08 Contract No. :
10 Title and subtitle : Design, development, optimization of 40GW/300-800 ps Nd: glasslaser system and study of matter at extreme temperature and pressure
11 Collation : 111 p., 10 figs., 1 tab.
13 Project No. :
20 Personal author(s) : 1) S. Chaurasia; D.S. Munda; C.G. Murali; N.K. Gupta; L.J. Dhareshwar2) Rajasree Vijayan; B.S. Narayan
21 Affiliation of author(s) : 1) Laser and Neutron Physics Section, Physics Group, Bhabha Atomic Research Centre, Mumbai2) Laser and Plasma Technology Division, Bhabha Atomic Research Centre, Mumbai
22 Corporate author(s) : Bhabha Atomic Research Centre,Mumbai-400 085
23 Originating unit : Laser and Neutron Physics Section,BARC, Mumbai
24 Sponsor(s) Name : Department of Atomic Energy
Type : Government
Contd...
BARC/2008/E/006

BARC/2008/E/006
30 Date of submission : January 2008
31 Publication/Issue date : February 2008
40 Publisher/Distributor : Associate Director, Knowledge Management Group andHead, Scientific Information Resource Division,Bhabha Atomic Research Centre, Mumbai
42 Form of distribution : Hard copy
50 Language of text : English
51 Language of summary : English, Hindi
52 No. of references : 75 refs.
53 Gives data on :
60
70 Keywords/Descriptors : NEODYMIUM; LASER-PRODUCED PLASMA;ICF DEVICES; PULSE AMPLIFIERS; DESIGN; PLASMA DIAGNOSTICS
71 INIS Subject Category : S70
99 Supplementary elements :
Abstract : Laser Plasma interaction studies and experiments related to laser driven shocks as well asinertial confinement fusion (ICF) has resulted in an ever increasing demand of development of high powernanosecond and sub-nanosecond laser. A 12J/300-800 ps (40 GW) laser chain has been developed at ourlaboratory and it is planned to upgrade it to 30 Joules. In this report we describe design and developmentof 12J/300-800 ps (40 GW) laser system built for laser-palsma related and laser driven shock related work.The laser is having focusable intensity of the order of 1014 W/cm2 which is used to carry out variousexperiments in the frontier area of laser produced plasma. The development work described in this reportdiscusses the design and developments of various subsystem such as Laser amplifiers, spatial filters andFaraday isolator, experimental chamber. The necessary electronics also has been described in brief.Theoretical simulation models developed over a period of time to analyze the laser plasma experiments arealso summarized. A number of experiments have been carried out in the existing laser chain. Some of theseexperiments are also presented in the report. Enhancement of x-ray emission (better conversion efficiency)is prime task for the indirect drive inertial confinement fusion. We have done experiments to see theenhancement using various target geometry and the laser focusing geometry and a summary of theseexperiments is presented.

ÃÖÖ¸üÖÓ¿Ö : »ÖêÃÖ¸ü ¯ÖÏê׸üŸÖ ¯ÖÏ‘ÖÖŸÖÖë êú ÃÖÖ£Ö-ÃÖÖ£Ö •Ö›ÍüŸ¾ÖßμÖ ¯Ö׸ü¸üÖê¬Ö ÃÖÓ»ÖμÖ−Ö (†Ö‡ÔÃÖß‹±ú) ÃÖê •Öã›Íêü »ÖêÃÖ¸ü
¯»ÖÖ•´ÖÖ †ÓŸÖ:×ÎúμÖÖ †¬μÖμÖ−Ö ‹¾ÖÓ ¯ÖÏμÖÖêÖÖë êú ±ú»Öþֺþ¯Ö ˆ““Ö ¿ÖÛŒŸÖ ¾ÖÖ»Öê −Öî−ÖÖêÃÖê Óú›ü ‹¾ÖÓ
ÃÖ²Ö-−Öî−ÖÖêÃÖê Óú›ü »ÖêÃÖ¸ü êú ×¾ÖúÖÃÖ ú¸ü−Öê úß ´ÖÖÓÖ ÃÖŸÖŸÖ ²ÖœÍü ¸üÆüß Æîü … ‹ú 12 J/300-800
ps (40GW) »ÖêÃÖ¸ü “Öê−Ö úÖ Æü´ÖÖ¸ß ¯ÖÏμÖÖêÖ¿ÖÖ»ÖÖ ´Öë ×¾ÖúÖÃÖ ×úμÖÖ ÖμÖÖ Æîü †Öî¸ü ‡ÃÖê 30
•Öæ»Ö ŸÖú ˆ®ÖŸÖ ú¸ü−Öê úß μÖÖê•Ö−ÖÖ Æîü … ‡ÃÖ ×¸ü¯ÖÖê™Ôü ´Öë Æü´Ö−Öê »ÖêÃÖ¸ü ¯»ÖÖ•´ÖÖ ÃÖÓ²ÖÓ×¬ÖŸÖ ‹¾ÖÓ
»ÖêÃÖ¸ü ¯ÖÏê׸üŸÖ ¯ÖÏ‘ÖÖŸÖ ÃÖê •Öã›Íêü úÖμÖÔ ÆêüŸÖã 12J/300-800 ps(40 GW) »ÖêÃÖ¸ü ¯ÖÏÖÖ»Öß
×−ÖÙ´Ö×ŸÖ úß ×›ü•ÖÖ‡−Ö ‹¾ÖÓ ×¾ÖúÖÃÖ úÖ ¾ÖÖÔ−Ö ×úμÖÖ Æîü … »ÖêÃÖ¸ü ´Öë 1014 W/cm2 Îú´Ö úß
ÃÖÓëú¦üß ŸÖß¾ÖΟÖÖ ´ÖÖî•Öæ¤ü Æîü וÖÃÖúÖ »ÖêÃÖ¸ü ˆŸ¯ÖÖפüŸÖ ¯»ÖÖ•´ÖÖ êú †ÖÏÖß Öê¡Ö ´Öë ×¾Ö×³Ö®Ö ¯ÖÏμÖÖêÖÖë
êú ×»ÖμÖê ˆ¯ÖμÖÖêÖ ×úμÖÖ •ÖÖŸÖÖ Æîü … ‡ÃÖ ×¸ü¯ÖÖê™Ôü ´Öë ¾ÖÙÖŸÖ ×¾ÖúÖÃÖ úÖμÖÔ ´Öë »ÖêÃÖ¸ü ‹ëÛ¯»Ö±úÖμÖ¸ü,
ïÖê׿ÖμÖ»Ö ×±ú»™üÃÖÔ ‹¾ÖÓ ±îú¸üÖ›êü †Ö‡ÃÖÖê»Öê™ü¸ü, ¯ÖÏμÖÖêÖÖŸ´Öú “Öë²Ö¸ü •ÖîÃÖß ×¾Ö׳Ö−−Ö ÃÖÆü
¯ÖÏÖÖ×»ÖμÖÖë úß ×›ü•ÖÖ‡−Ö ‹¾ÖÓ ×¾ÖúÖÃÖ úß “Ö“ÖÖÔ úß Ö‡Ô Æîü … ‡ÃÖ´Öë †Ö¾Ö¿μÖú ‡»ÖꌙÒüÖ×−Öúß
úÖ ³Öß ÃÖÓ×Ö¯ŸÖ ¾ÖÖÔ−Ö ×úμÖÖ ÖμÖÖ Æîü … »ÖêÃÖ¸ü ¯»ÖÖ•´ÖÖ ¯ÖÏμÖÖêÖÖë êú ×¾Ö¿»ÖêÂÖÖ êú ×»ÖμÖê ãú”û
úÖ»ÖÖ¾Ö×¬Ö êú ¤üÖî¸üÖ−Ö ×¾Öú×ÃÖŸÖ ÃÖî¨üÖÓןÖú †−Öãú¸üÖ ´ÖÖ›ü»ÖÖë úÖ ³Öß ÃÖÖ¸üÖÓ¿Ö ×¤üμÖÖ ÖμÖÖ Æîü …
¾ÖŸÖÔ´ÖÖ−Ö »ÖêÃÖ¸ü “Öê−Ö ´Öë †−Öêú ¯ÖÏμÖÖêÖ ×úμÖê ÖμÖê … ‡−Ö´Öë ÃÖê ãú”û ¯ÖÏμÖÖêÖÖë úÖê ³Öß ‡ÃÖ ×¸ü¯ÖÖê™Ôü ´Öë
¯ÖÏßÖãŸÖ ×úμÖÖ ÖμÖÖ Æîü … ¯Ö¸üÖêÖ ¯ÖÏÖÖê¤ü •Ö›üŸ¾ÖßμÖ ¯Ö׸ü¸üÖê¬Ö ÃÖÓ»ÖμÖ−Ö ÆêüŸÖã ‹ŒÃÖ-¸êü ˆŸÃÖ•ÖÔ−Ö
(²ÖêÆüŸÖ¸ü ¯Ö׸ü¾ÖŸÖÔ−Ö Ö´ÖŸÖÖ) úÖ ˆ®ÖμÖ−Ö ´ÖÆüŸ¾Ö¯ÖæÖÔ úÖμÖÔ Æîü … ×¾Ö×³Ö®Ö ™üÖÖì™ü •μÖÖ×´Ö×ŸÖ ‹¾ÖÓ
»ÖêÃÖ¸ü ±úÖêúØÃÖÖ •μÖÖ×´Ö×ŸÖ úÖ ¯ÖÏμÖÖêÖ ú¸üŸÖê Æãü‹ ˆ®ÖμÖ−Ö úÖê ¤êüÖ−Öê êú ×»Ö‹ ¯ÖÏμÖÖêÖ ×úμÖê ÖμÖê
‹¾ÖÓ ‡ÃÖ´Öë ¯ÖÏμÖÖêÖÖë úÖ ÃÖÖ¸üÖÓ¿Ö ¯ÖÏßÖãŸÖ ×úμÖÖ ÖμÖÖ Æîü …
1
Design, development, optimization of 40GW/300-800 ps Nd:
Glass laser system and study of matter at extreme temperature
and pressure
S. Chaurasia, D. S. Munda, C. G. Murali, N. K.Gupta and
L. J. Dhareshwar
Rajasree Vijayan*, B. S. Narayan*
Laser and Neutron Physics section, Physics Group,
* Laser and Plasma Technology Division
Bhabha Atomic research Center, Mumbai, India 400085

2
Abstract: Laser Plasma interaction studies and experiments related to laser driven shocks as
well as inertial confinement fusion (ICF) has resulted in an ever increasing demand of
development of high power nanosecond and sub-nanosecond laser. A 12J/300-800 ps
(40 GW) laser chain has been developed our laboratory and it is planned to upgrade it
to 30 Joules. In this report we describe design and development of 12J/300-800 ps (40
GW) laser system built for laser-plasma related and laser driven shock related work.
The laser is having focusable intensity of the order of 1014 W/cm2 which is used to
carry out various experiments in the frontier area of laser produced plasma. The
development work described in this report discusses the design and developments of
various subsystem such as Laser amplifiers, spatial filters and Faraday isolator,
experimental chamber. The necessary electronics also has been described in brief.
Theoretical simulation models developed over a period of time to analyze the laser
plasma experiments are also summarized. A number of experiments have been carried
out in the existing laser chain. Some of these experiments are also presented in the
report. Enhancement of x-ray emission (better conversion efficiency) is prime task
for the indirect drive inertial confinement fusion. We have done experiments to see
the enhancement using various target geometry and the laser focusing geometry and a
summary of these experiments is presented.

3
Contents Sl. Titles Page
No. No.
1.0 Introduction 6
2.0 Description of 40GW Nd: Glass laser system 8
3.0 Laser Oscillator 11
3.1 The master oscillator 11
3.2 Compression system 12
3.3 Second Harmonic Generation 12
4.0 High peak power Nd: Glass amplifiers 15
4.1 Glass as Host material 15
4.2 Physical and optical properties of Nd- doped glasses 16
4.3 Laser properties 17
4.4 Design criteria for high power laser amplifiers 19
4.4.1 Damage to optical components and limit on 19
laser Intensity
4.4.2 Gain and energy extraction 21
4.4.3 Inter-stage isolation and suppression of target 22
back reflection
4.4.4 Laser pulse distortion 22
4.4.5 Choice of laser material 23
4.4.6 Material selection for other components 23
4.5 Amplifier head assembly 24
4.5.1 Cooling of the laser rod 24
4.5.2 Pump Cavity 27
4.5.3 Material selection for reflector cavities 27
4.5.4 Optical pumping 28
4.5.5 Electrical characteristics of lamps 29
4.6 Single pass amplifier system and characterization studies 31
4.6.1 Preliminaries: Pulse amplification 31
4.6.2 Determination of delay for triggering the amplifiers 33
4.6.3 Determination of single pass gain of 19 mm amplifiers 33

4
4.6.4 Variation of Gain with input laser pulse duration 33
4.6.5 The study of spatial uniformity of gain profile in 34 large aperture amplifiers
5.0 Spatial filters and optical relay 38
5.1 Degradation of spatial laser intensity profile while 38
propagating through amplifiers
5.2 Theory of spatial filter 40
6.0 Faraday Isolator 44
6.1 Design and development of a large diameter 44
Faraday Isolator
6.2 Working principal of Faraday Isolator 44
6.3 Theory of Faraday Isolator 45
6.4 Mechanical Design and electronics of Faraday Isolator 48
6.5 Optimization 50
7.0 Electronics for 40 GW laser system 55
7.1 Oscillator (EKSPLA- SL 312-2P) 55
7.2 Energy Storage Unit 55
7.3 Master control unit 56
7.4 ARM7TDMI microcontroller based trigger generator 60
7.5 Function of the controller 63
8.0 Experimental chamber with diagnostics 64
9.0 Theoretical simulation models for laser 67
plasma experiments
9.1 Non-LTE model for opacities 67
9.2 Composite Targets 71
9.3 Simulation of Hohlraum Cavities 73
9.4 Hydrodynamic Instabilities 74
9.5 Equation of State (EOS) studies 76
9.6 Hydrodynamics with ultra short lasers 78
9.7 Laser Cluster Interaction Model 81
10.0 Experimental results 95
10.1 X-ray and Ion emission studies from Cu-Au alloy target 85
10.2 Nano Ion emission from copper targets with a 89
copper –nano-particle layer

5
10.3 Thermo luminescent dosimeters absolute measurement 91
of for X-rays from laser produced plasma
10.4 Effect of focal position on x-ray and ion emission with 93
low and high Z targets
10.5 Effect of focal position on line emission of copper plasma 98
11.0 Conclusion 104
Acknowledgments 104
References 105
6
1.0 Introduction
Creation of plasmas by the interaction of high power lasers has a long history.
The study of plasma physics has been stimulated over the past five decades by its
close connection with the goal of creating fusion as an energy source and with
astrophysical plasmas of various types. Because the luminous matter in the universe is
composed almost entirely of plasma, the scientific investigation of plasma is of
extreme importance. The irradiation of a surface with a high-energy laser produces
blow-off plasma that can be quite hot and contains densities suitable for the excitation
of many parametric processes. Hence, high-power lasers offer a convenient way of
producing high temperature, high-density plasmas and to perform laser-plasma
interaction experiments. Nd: Glass lasers are the best-understood high-energy short
pulse laser amongst present lasers [1, 2]. The ever increasing applications using high
laser intensity in the field of laser matter interactions, has resulted in the development
of multigigawatt to petawatt laser system such as NIF, USA [3], NOVA, LLNL [4],
GEKKO, Japan [5], VULCAAN, Rutherford, UK [6]. The National Ignition Facility
(NIF) (currently under construction), with nominal laser energy of 1.8 MJ, is expected
to achieve ignition in both direct [7, 8] and indirect-drive [9] configurations. Apart
from these very big systems, several kilo-joule laser systems exist at many places all
over the world. Two of the important applications of a high power laser are a laser
based X-ray source (which is often termed as a compact table top synchrotron source)
as well as a Laser ion source (LIS). Depending on the irradiated target material and
the parameters of the laser used, a laser X-ray source can produce intense X-ray
emission in any desired spectral region. Such a source would therefore be of great
interest to material scientists. Similarly, a laser ion source (LIS) can deliver ions of
any atomic mass (any material can be evaporated and ionized), with a broad range of
charge states (from 1+ to even above 50+) and with energies from hundreds of
electron volt to hundreds of mega electron volt [10, 12]. Such a source is the first step
of a new generation of table top ion accelerators for material and nuclear research.
Ion implantation [13, 14], Laser as x-ray source [15], generation of ultra high pressure
for EOS measurements [16-19], studies on shock hydrodynamics, highly compressed
matter [20, 21] etc. are some of the most frontier areas of research today.

7
Laser and Neutron Physics section, Physics Group, BARC has been involved
in the studies of extremely high temperature and high-density laser produced plasmas
and ultra high pressure laser driven shock waves. This work has been pursued over
the last several years using nanosecond and sub-nanosecond high power laser
systems, which have always been indigenously developed. The latest laser system
developed for this purpose is an intense Nd: Glass laser chain capable of producing
laser pulses of 300-800 picoseconds duration and maximum single pulse energy of
about 12 Joules. The energy of the laser system is planned to be upgraded up to 30 J
in future by adding few more optical amplifiers. Also this laser chain will be used in
the designing and development of OPCPA based short pulse duration, high power
laser system. Focused laser intensity on targets is in the range of 1012 – 1015 w/cm2.
Plasmas produced with such laser intensities have opened up the possibility of
studying hydrodynamic phenomena in materials at exceedingly high temperatures (a
few hundred electron volts) and pressures (few tens of Megabars) [22]. Such laser-
produced plasma has a lifetime of a few nanoseconds and extends over a few
hundreds of micrometers in space. Diagnostics used to study such plasma are required
to have sub-nanosecond temporal resolution and micrometer spatial resolution [23]. In
this report, we describe the development of the intense laser along with its associated
sub-systems. Several laser plasma diagnostics developed and installed with the
experimental chamber to measure maximum possible parameters. We will also
describe a few recent experimental results carried out with this system and present the
theoretical modeling to validate the experiments.

8
2.0 Description of the 40 GW laser system
The 12J/300-800-psec-laser system consists of a commercial laser oscillator
with output energy of 100 mJ per pulse, operating at a pulse repetition rate of 10Hz,
and a peak to background contrast of 104. Since large energy storage Nd:Glass
amplifiers operate in single shot mode, the oscillator has also been made to operate in
a single shot mode and is synchronized with five amplifier stages using a specially
developed fast synchronization circuit. In order to maintain the laser intensity below
damage threshold, the successive amplifiers are housed with laser rods of increasing
diameters as we proceed away from the oscillator. The laser system used is consists of
two 19 mm x 300 mm Nd:Glass amplifier pumped by six xenon filled flash lamps, two
38 mm x 300 mm and one 50 mm x 300mm Nd:Glass amplifiers pumped by twelve
xenon filled flash lamps each, a spatial filter to remove non-uniformity and expansion
of beam. It is placed in between second and third stage of the chain, a relay system
between stage four and five. And two Faraday Isolator to protect any back reflection
which can cause damage to the optics and laser oscillator. First Faraday Isolator which
is permanent magnet based is placed after first amplifier and the second one is placed
at the last stage. The schematic layout and the photograph of the laser chain are shown
in Figs.2.1&2.2. The description of the components of the laser chain is given below.

9
Lens f/5 Final laser beam with
12J Energy
Laser footprint at the final stage
Laser footprint at the initial stage
Amp 1 Amp 2
Am
p3
Amp 5
Faraday Isolator
Amp 4
Beam exp 1.3 X
Beam exp 2.4 X
M
M
M
Oscillator 150 mJ/ 300- 800 ps
Spatial Filter
T
F. I.
45 mm
Fig. 2.1. Schematic of the 40 GW Nd: Glass laser system

10
Fig.
2.2
. Pho
togr
aph
of th
e 40
GW
Nd:
Gla
ss la
ser s
yste
m

11
3.0 Oscillator
The front end of the laser system consists of a commercial Nd: YAG oscillator.
The laser head comprises four functional parts:
1. The master oscillator,
2. System for optical pulse compression,
3. System for optical pulse amplification and
4. System for second harmonic generation.
3.1 The master oscillator
The schematic of commercial laser oscillator (Model SL 312 TE) is shown in
Fig. 3.1. The master oscillator consists of a flash lamp pumped Nd.YAG rod
generating a single longitudinal mode, Q- switched, output pulse of approximately 3
ns duration and 4-5 mj of energy. A Fabry-Perot etalon is used in the oscillator cavity
for single longitudinal mode selection. An intra-cavity aperture is used for TEM00
mode selection. A Pockel’s cell is used for Q switching the laser pulse. The Q-
switched pulse is compressed in a SBS medium (a cell with CCl4 liquid) to 300 – 800
picoseconds. The pulse duration depends on the focusing geometry of lenses, which
are mounted on stepper motor-controlled translational stages. The laser is then
propagated through a pre-amplifier and a double pass amplifier. The beam
polarization is rotated by 900 during two passes through the quarter wave plate and
enters the final stage consisting of beam shaping optics and harmonics generation.
Fig. 3.2 shows the beam profile of the oscillator at low energy (20mj) and maximum
energy (150mj). The maximum output energy of the SBS compressed laser system is
150mj and the beam size is 7mm. Fig. 3.3 shows the Temporal pulse profiles of
oscillator recorded with optical streak camera.
The oscillator and amplifiers can be operated in single shot or at variable
repetition rate (1- 10Hz). Even in single shot mode the flash lamps will be firing at 10
Hz rates, only the Q switch trigger pulse is given as single shot to get single pulse
laser output. In order to synchronize the laser oscillator with the single shot operation
of the amplifier chain, a synchronizing trigger generator was developed. The laser
12
oscillator can be operated in internal mode or in one of the three modes for external
triggering. In internal mode all the signals are generated internally and the laser
operates at a fixed 10 Hz rep rate, and a sync pulse is available for synchronizing the
external event to the laser pulse. We have used the external trigger mode in which,
sync pulses at 10 Hz available from OUT terminal (12V, 10 Hz, 120μsec) of the
oscillator power supply were used. This output is combined with the single shot
trigger pulse of the laser chain to get the master trigger pulse. The electronic used for
this operation is described in section 7.1.
3.2 Compression system
Switched pulse oscillator compressed in the pulse compressor system, which
consists of two lenses, a quarter waveplate, SBS-cell with CCl4 liquid and a polarizer.
The linear polarized light from the oscillator is passed through a quarter wave plate
and is focused into the double-pass SBS-cell by a lens. Focusing is arranged in such a
way so as to compress the Stokes pulse via backward Stimulated Brillouin Scattering
(SBS) process. The phase reversed backward Stokes Pulse, strictly repeats the path of
the pump pulse in the opposite direction with a reversal of beam divergence. The
compressed pulse is again passed through a quarter wave plate that transforms the
polarization of the Stokes radiation into linear and perpendicular to the polarization of
the oscillator. Thus the pulse is compressed from nanosecond duration to few hundred
pico-seconds, which can be varied from 300 to 800 pico seconds by varying the
position of focusing lens in front of SBC cell.
3.3 Second Harmonic Generation
Second harmonic (532 nm) of the fundamental is generated by passing the
laser beam through a thermally stabilized KD*P crystal which can be tuned precisely
for phase matching to optimize the conversion efficiency. The fundamental and
harmonic pulses can be separated by harmonic separators.

13
Fig.
3.1
Opt
ical
sche
me
of c
omm
erci
al la
ser o
scill
ator
(Mod
el S
L 31
2 TE
)

14
Fig 3.2. Beam profile of laser oscillator at 20mj and 150 mj energy levels.
Fig.3.3. Temporal pulse profiles of Oscillator recorded with optical streak
camera.
15
4.0 High peak power Nd: Glass amplifiers
Glass is one of the most sought after materials as a solid-state laser host. An
ideal host material should have good optical, mechanical and chemical properties.
Other desirable properties include hardness, chemical inertness, absence of internal
strains and refractive index variation and ease of fabrication. Now, let us see how
glass qualifies Vis a Vis the ideal host.
4.1 Glass as host material
Some of the reasons, which make glass a good host, are listed below:-
1) Concentration of active ions can be very high in glass, unlike many crystals. Glass
can be doped with Nd. atoms to a very high concentration (usually 2-3 % of Nd2O3)
with excellent uniformity and it can be made in large pieces of good optical quality.
For example, laser rods of size measuring up to 2 meters long and 7.5 cms in diameter
are made from glass.
2) The practical limit of doping is determined only by the fact that fluorescence
lifetime and the efficiency for stimulated emission decreases with higher
concentrations. Due to the increased doping of Nd3+ ions, glass shows a large
fluorescence line width (Δν=7200 GHz), compared to crystals, (for e.g. Nd.YAG
shows Δν = 120 GHz). The reason for this is, the glass host being amorphous, there is
a lack of unique and well defined crystalline surrounding for the individual active
atoms and hence, each of the Nd3+ ion in glass will face different local field
conditions leading to increased line width. This line broadening is evidently
inhomogeneous, and thus the lasing threshold increases.
3) The high threshold leads to increase in the amount of energy that can be stored in
the amplifier during the pumping operations and therefore, glass becomes much more
suitable for high power Q-switched and mode-locked laser applications. Glass also
gives very sharp pulses.
4) Optimum performance of the laser depends on the stimulated emission cross-
section ‘σ’, intensity dependant refractive index ‘n2’ and thermal expansion
coefficients. A very high value of figure of merit σ/n2 is necessary for optimum
performance of the laser and glass has very high σ/n2 value.

16
5) The Nd3+ ion in glass represents a four-level system, which is an advantage over
three-level systems like Ruby.
Thus, the host glass has an important influence on the ability of the lasing ion
to absorb light from the optical pumping source, to store this energy, and to release it
during the amplification of the laser beam. The rate of energy extraction is governed
by the product of the optical intensity of the extracting beam and the stimulated
emission cross section ‘σ’ of the lasing atoms. Both these factors are strongly
influenced by the characteristics of the host glass. Hence, by appropriate choice of the
host glass, one can produce lasers with widely varying performance.
However the drawbacks of glass are its low conversion efficiency (electrical to
laser) and poor thermal conductivity.
4.2 Physical and optical properties of Nd- doped glasses
The following table gives some of the properties of commercially available
silicate and phosphate glasses. [24]
Glass (Kigre make) type Q- 246 Silicate Q-88 phosphate
Peak wavelength
Stimulated emission cross section
Fluorescent life time
Line width FWHM
Density
Doping of Nd atoms
Non-linear refractive index ‘n2’
Thermal conductivity
1062 nm.
2.9x 10⁻²⁰ cm2
340 μs.
27.7 nm.
2.55 gm/cm3
2 x 10²⁰ atoms/cm3
1.4x 10⁻¹³ esu.
1.30 w/m
1054 nm.
4x 10-20 cm2
330 μs.
21.9nm.
2.71 gm/cm3.
2 x 10²⁰ atoms/ cm3
1.1x 10⁻¹³ esu
0.84 w/m.

17
4.3 Laser properties
To understand the operation of Nd3+ lasers, one must be familiar with the energy level
structure of Nd3+. The Nd.3+ ion in glass represents a four level system. The ground
state is the lowest multiplet component 4I9/2 of the 4I term from which infrared /
visible absorption can take the ions to the various excited levels as shown in the
Fig.4.1. Atoms reaching one of the excited states relax via radiative or multiphonon
(non-radiative) cascading transitions to the upper laser level. The upper laser level 4F3/2 has a spontaneous emission lifetime of 300—600 μs. The 4F3/2 level decays
radiatively through the four laser transitions namely, 4F3/2 →
4I15/2 (λ=1.8μm), 4I13/2
(1.35 μm), 4I11/2 (1.06 μm), and
4I9/2 (0.88μm). Of the four, the predominant laser
line is 1.06μ.The terminal laser level is the 4I11/2 multiplet. The 4I11/2 group empties
spontaneously by radiationless phonon transition to the 4I9/2 ground state. The
published values of the 4I11/2 lifetime vary from 10 to 100ns [25-27].
Fig.4.2. Shows the absorption spectrum of Nd3+ in the commercially available (ED-2)
silicate and (LGH-5) phosphate laser glasses [28]. It may be pointed out that the
phosphate glass is clearer in the U-V than the silicate. The U-V edge, which is
apparent in the silicate glass, is shifted considerably towards the blue in the
phosphate, leading to a significant pumping contribution from the 353 nm band. (4I9/2
→ 4D3/2) thus reducing the severe thermal problems associated with the absorption of
U-V from typical Xenon flash lamps.

18
Fig.4.1 Energy level of free Nd3+ ion

19
4.4 Design criteria for high power laser amplifiers
The basic design philosophy in the development of high peak power laser is
based on master–oscillator power amplifier (MOPA) architecture, where the master
oscillator generates the seed pulse of required temporal, spatial and spectral
characteristics and is amplified by a factor of 105 – 106 in a series of high power
amplifiers cascaded together. The crucial design considerations are as follows:
4.4.1 Damage to optical components and limit on laser Intensity
The optical damage threshold of the active medium and other optical
components of the laser system determine the laser intensity limit at which the laser
system can perform reliably over a long period of time. There are various kinds of
damages, which can occur in a laser amplifier. They are,
a) Surface damage of components.
b) Damage of multi-layer dielectric coatings
c) Bulk damage of laser amplifying medium caused due to the presence of inclusions
such as – micro bubbles, dielectric inclusion like platinum particles (invisible
particles) etc.
d) Laser intensity-dependant non-linear effects such as, whole beam and small scale
self-focusing also severely limit the operation at higher intensity level. A practical
limit for damage-free operation is around 5GW/ cm2 for a clean laser beam. However,
the damage threshold for optical coating, thin film polarizers being much below this
value. The laser power density at all levels of amplification in our laser is kept below
1GW / cm2 to avoid damage risks.

20
Fig
.4.2
. Abs
orpt
ion
spec
tra
of N
d-do
ped
glas
ses

21
4.4.2 Gain and energy extraction
The primary interest in the design of amplifiers is the extraction of total gain
and maximum energy without causing any optical damage to the laser system. The
total energy extracted from an amplifier depends upon the total stored energy in the
form of population inversion, which apart from the flash lamp energy is also a
function of rod parameters like length and diameter. The amplifier rod length is
determined by the desired gain, and the diameter is set by damage threshold
considerations depending upon the output energy. Further, the energy extraction
depends upon the laser pulse duration.
The general expression for gain in an amplifier is given by [29]
G = (Es/ Ein ) ln 1+ [exp (Ein/ Es) –1]G0 where, …(1)
Ein = input pulse energy density,
Es = saturation energy density, and
G0 = exp (g0l) = the small signal single-pass gain. …(2)
When Ein / Es << 1 and G0 Ein / Es << 1, then eq. (3.1) can be reduced to
G ≈ G0 ≡ exp (g0 l). .. (3)
Thus in the small signal gain regime, the gain increases exponentially with rod length.
For high level energy densities, such that Ein / Es >>1,
G ≈ 1+ (Es / Ein) g0l …(4)
Thus, the gain increases linearly with rod length, implying that every excited state
contributes to its stimulated emission. Such a condition therefore, represents a most
efficient energy extraction system. A safe operating limit at a pulse of 100 ps duration
is about 0.2J/cm2. Therefore, the amplifier is operated in the small signal regime. In
the small signal regime, the small signal gain coefficient
go = βEst. … (5)
where,
β = σ / hν … (6)
22
and, Est= nhν is the inversion per unit volume (energy stored per unit volume). The
value of Est depends on pump energy input which in turn depends on various
parameters such as electrical input to flash lamp, pumping efficiency of the cavity etc.
At later stages, as the amplifier diameter increases, the pumping- lamp geometry
limits the coupling efficiency because of the limited number of flash lamps that can
be accommodated closely around the rod. Since all our amplifiers operate in the small
signal regime, no temporal distortion of laser pulse is expected.
4.4.3 Inter-stage isolation and suppression of target back reflection
High gain amplifier stages in a laser chain often suffer from serious problems
like
- amplified spontaneous emission,
- residual feedback from various optical surfaces along the beam axis,
- back reflection from target feeding back into the amplifier chain.
All the above factors could result in pre-lasing, as well as damage to optical
components in the earlier stages. Anti reflection coatings on optical surfaces can
reduce the probability of spurious feedback problems. Amplifier rod surfaces are
generally cut at a small angle of about 20-30 with respect to rod axis to reduce residual
reflection considerably. These precautions are not sufficient and therefore high gain
laser system utilizes inter stage isolation using faraday isolators. These isolators are
used to prevent back reflection from the target feeding back into the amplifier stages.
4.4.4 Laser pulse distortion
The spatial and temporal intensity distribution of the laser beam undergoes a
considerable change as it propagates through various amplifier stages. Spatial
distortion of the pulse profile is caused due to the following reasons-
a). Non- uniform pumping and thermal distortions
b). Diffraction effects caused by beam truncation and presence of dust particles in the
path of the beam.

23
Spatial filtering and image relaying eliminate spatial distortions. Temporal
pulse distortion also occurs in amplifiers due to gain saturation and frequency shift as
a result of frequency modulation.
4.4.5 Choice of laser material
The properties of the amplifier medium have to satisfy certain criteria such as-
- Capability to store large amounts of energy.
- Availability in large sizes.
- High bulk damage threshold to overcome self-focusing, i.e.; a lower value of n2.
The Neodymium-doped laser glasses are of different types such as- silicate,
phosphate, fluorophosphates etc. The figure of merit of these glasses is defined as the
ratio σ / n2, where σ is the stimulated emission cross section. The figure of merit for
phosphate glasses is about 60% higher than that for silicate glasses. Silicate glasses
are more rugged and resistant to humidity, whereas phosphate glasses get fogged due
to humidity. Even though phosphates have high gain and low n2 they are highly
hygroscopic and are not very suitable for use in humid climate. Considering all these
facts, it was decided to use silicate-based Nd: Glass amplifiers in our laser system.
4.4.6 Material selection for other components
This part deals with the selection of material for flash lamp, coolant solution
and hardware components. The hardware components include end plates, reflector
cavity, ‘O’ rings etc.
a) Flash Lamps
For optical pumping, Xenon gas filled linear flash lamps at a fill pressure of
300 torr at room temperature are used. The material used for flash lamp fabrication is
cerium-doped quartz which absorbs flash lamp output radiation below 0.31 micron
and fluoresces at wavelengths between 0.4 micron and 0.65 micron at which strong
absorption occurs in Nd: glass, and thereby prevents the rod from heating due to U -
V absorption. U - V absorption also leads to formation of colour-centers in the glass,

24
which reduces its absorption efficiency. The reasons for selecting Xenon gas lamps
are discussed under the section ‘optical pumping’.
b) Hardware selection
Among various metals used for hardware components it was found that
stainless steel has no reaction with the coolants used (ethylene glycol or saturated
solution of sodium nitrite). We have found that aluminum and brass get corroded in
long-term use. Hence stainless steel was used for the fabrication of end plates of the
amplifier head through which the coolant is introduced. Similarly, white, soft, silicone
‘O’ rings have no reactions on the coolants. It also withstands the pressure and
temperature the system is being subjected to when the laser is operated.
4. 5 Amplifier Head Assembly
As an example, the mechanical design of 50 mm diameter Nd: Glass amplifier
is shown in Fig. 4.3. The amplifier head consists of the laser rod, glass jacket for
coolant circulation, cavity endplates, rod and glass jacket holders, base plate and
stainless steel locknuts meant for tightening the glass jacket and the laser rod. The
stainless steel end plates are mounted on a thick aluminium platform with the reflector
cavity held in between. From the bottom end of the rod holder coolant (saturated
solution of sodium nitrite) is introduced through stainless steel nozzles. Special care is
taken in the design of rod holder for increased circulation rate of coolant. The
reflector cavity is split into two halves and each half along with flash lamps can be
taken out from the amplifier head assembly without disturbing the alignment of the
amplifier.
4.5.1 Cooling of the Laser rod
The effective cooling of the amplifier rod while in operation helps to remove
the heat generated in the laser rod due to optical pumping. The coolant used in this
assembly has a three-fold purpose.
1). It helps in index matching, thus reducing internal reflection from the rod surface
which can cause de-pumping due to off axial modes.

25
Fig
.4.3
. Ass
embl
y dr
awin
g of
50
mm
am
plifi
er

26
2). It is also used as an absorber for that part of pump radiation (mainly U.V) which
falls outside the absorption bands of the active medium.
3). The higher circulation rate of the flowing liquid leads to more efficient heat
transfer from the rod to the coolant.
The coolant employed should have good resistance to chemical decomposition and a
maximum transmission in the pump bands. The temperature increase of the coolant as
it passes through the jacket is given by the expression [30]
p
QT C mΔ = ... (7)
= a constant x P (kW) / fv (lit/s),
where Q = heat extracted by the coolant, Cp= specific heat of the coolant, P = heat
carried away by the coolant, m = mass flow rate, fv = m /ρ, and ρ = density of the
fluid.
Several coolant solutions such as 1) saturated solutions of sodium nitrite, 2)
mixture of ethylene glycol and distilled water in the ratio of 1:1 have been tried [31].
It has been found that saturated solution of sodium nitrite is best suited for silicate
amplifiers as coolant and absorber of U-V radiation emitted by the flash lamps.
Ethylene glycol is found to be more suitable for phosphate rods. Even though heat
transfer is maximized in pure water, the other considerations such as spectral
matching etc. necessitated the use of these solutions. The diameter of the water jacket
is decided by the coupling efficiency. The condition for index matching is [32]
Rj≤ nc Rg ... (8)
where, Rj = water jacket radius,
nc = refractive index of the coolant, and
Rg = laser rod radius.
For uniform irradiation of the rod, Rj should be as close to nc or product of nc
and Rg as possible. By choosing Rj ≤ nc Rg, parasitic ring modes formed due to total
internal reflection at the boundary of the glass jacket air interface can be made to lie
outside the laser rod. Although this suppresses most of the ring type parasitic modes,
the reflection at the laser rod coolant interface could still give rise to parasitic ring
modes. This could be avoided by selecting a coolant whose refractive index is as close
to that of the laser rod. A sealless polypropylene magnetically coupled centrifugal
pump (Model MD-3) is used for pumping the coolant. The flow rate measured at the
outlet of the rod assembly is one liter per minute. Considering the heat transfer

27
efficiency of the coolant and the firing frequency of the amplifier system, it is found
that this rate of coolant circulation is sufficient.
4.5.2 Pump Cavity
The mechanical design of a pump cavity is influenced by two considerations:-
1) geometry for efficient energy transfer from the pump source to the laser material
2) efficient heat removal.
Optically pumped lasers have very small efficiency; hence almost all the
electrical energy supplied to the lamps will have to be removed as heat from the pump
cavity.
The choice of a particular cavity configuration depends on the size of the rod
and the nature of the pump source. Summarizing the reported experimental works on
pump cavity design one can draw the following conclusions [33].
For maximum efficiency and for relatively small rods (up to 10 cms in length
e.g. oscillator rod) a small single elliptical or a spherical cavity is the best. Small
elliptical cavities with low major axis to rod diameter ratios are more efficient than
large cavities. In a small elliptical cavity the fraction of direct radiation is high, and
most of the pump radiation is incident on the rod after a single reflection on the walls.
Therefore, in this geometry, imperfections in the geometry, obstruction of the light
path and a reflectivity of less than unity are less detrimental to the efficiency than in
the case of large elliptical cavities. The length of the elliptical–cylinder cavities
should be as great as possible in relation to the diameter, but the laser rod, pump
lamp, and cavity should be of the same length.
4.5.3 Material selection for reflector cavities
The focusing elliptical or circular cavity requires a highly polished inner
surface. The material used is aluminum, successively polished with different grades of
emery polishing paper to erase pits and tool marks. Then this is polished with metal
polish like Brasso till we get the required finish. In large amplifiers, where the
homogeneity of pumping is important, diffused reflectors are used. Apart from
surface finish and geometry, the type of material and its spectral reflecting properties

28
are also of interest. Reflectivity of most of the metals is wavelength dependent.
Aluminum cavities with gold or silver coating or simply polished aluminum cavities
are the commonly used cavity reflector surfaces. However, in large systems in which
a few mega watts of power is dissipated through the flash lamps, gold and silver
coating get damaged very quickly and hence either polished aluminum or diffused
reflectors are used. Chowdhury et al have reported that electro-polished reflector
cavities yielded 30% more gain than gold coated or mechanically polished cavities
[34].
4.5.4 Optical pumping
In optically pumped solid-state lasers, the pump source produces maximum
emission at wavelengths, which excites fluorescence in the laser material and
minimum emission in regions outside of the useful absorption bands. Various types of
optical pumps are used in solid-state lasers, namely, noble gas flash lamps, metal
vapor discharge lamps, laser diodes etc. The application of a particular pump source
depends on the desired output power, the mode of operation, repetition rate etc.
Although laser diodes are most advantageous as pump sources, because of their
prohibitively high cost, in our laser system we are using Xenon flash lamps. Some of
the advantages in using Xenon flash lamps are:-
1). The output of the Xenon flash lamp extends spectrally from UV to IR region, thus
overlapping the absorption spectrum of Nd+3 in the host material.
2). Xenon flash lamps are sources of high brightness and have good efficiency for
converting electrical to spectral output. Xenon flash lamps convert 40 to 60% of the
electrical input energy into radiation in the 0.2 to 1.0μm region [35, 36]. Hence they
can provide the flux necessary for achieving reasonable stored energy density in Nd:
Glass lasers.
3). Easy availability of good quality lamps. We have an in-house unit in Technical
Physics & Prototype Engineering Division in B.A.R.C. producing good quality flash
lamps according to our needs.
The spectral outputs of a Xenon flash lamp operated at low and high power
densities are having different characteristics. A high current density shifts the spectral
output to the shorter wavelength side making the pumping less effective.

29
4.5.5 Electrical characteristics of lamps
Flash lamps used in high power applications are designed for high life
expectancy. The single shot explosion energy Eexp of thin walled flashtubes, defined
as the minimum input energy to crack the lamp catastrophically is given by the
expression [37],
Eexp =k2 l d (tp)1/2 …(9)
and tp= 3(LC)1/2 ... (10)
where, l is the length, d is the diameter of the tube, tp is the flash lamp pulse duration.
L is the inductance (mH) and C is the capacitance (μF) used in the pulse forming
network. The constant k2 depends on the type of the gas, fill pressure as well as the
physical and thermal properties of the lamp envelope. If l and d are measured in
centimeters tp is in seconds, and if a critically damped single-mesh discharge circuit is
assumed, for a xenon filled lamp Eexp = (1.2 x 10⁴) l d (tp)1/2. The life expectancy of
a xenon flash lamp in terms of number of shots is given by
N=(Eexp/Ein)8.5 …(11)
where Ein = input electrical energy to the flash lamps in KJ. In order to increase the
life expectancy of the flash lamps, and prevent the degradation of the electrodes, the
lamps are fired at about 30% of the explosion limit. For example in A-2, where ‘d’ is
10 mm and ‘l’ is 150 mm Eexp for a 400 μs flash lamp pulse is about 3.5 KJ and we
operate each lamp at about 1.2 KJ.
The arc length of the flash lamp is fixed by the laser rod length and the
diameter is chosen from the expression for Eexp .The number of flash lamps used
depends upon the total energy input. This number in turn, decides the distance from
the laser rod to the flash lamps. A-1 and A-2 have 6 flash lamps each. A-3 (38 mm
diameter), A-4 (38 mm diameter) and a-5 (50 mm) amplifiers have 12 numbers of
flash lamps, respectively, of 300 mm arc length and 20 mm bore diameter. The lamp
assembly is fabricated in 2 halves and each half is mounted on perspex end plates.
The lamps, held in position by nylon caps are sealed by RTV, which provides
electrical insulation at the electrode ends. The flash lamp housing ensured strain free
mounting, demounting, and ease of replacement of the lamps. The Fig. 4.4 shows the
pumping geometry of A-4 (38 mm diameter amplifier).

30
Fig. 4.4. Cross section of the pumping geometry of 38 mm Nd:Glass Amplifier. 1.Reflector
Cavity, 2.Flash lamp, 3. Glass Jacket, 4.Coolant, 5.Active medium.

31
4.6 Single passes amplifier systems and characterization studies
4.6.1 Preliminaries Pulse amplification
The amplification process is based on the energy stored in the upper laser level
prior to the arrival of the input signal. As the input signal passes through the rod, the
atoms are stimulated to release the energy. If we ignore the effect of fluorescence and
pumping during the pulse duration, the population inversion can be expressed as
∂n / ∂t = - γncσφ ….(12)
where γ = (1+g2 / g1), n is population inversion density, φ is photon density,σ is
coefficient of stimulated emission cross-section and c is speed of light in the medium.
The growth of a radiation pulse traversing a medium with an inverted population is
described by the nonlinear, time dependent photon transport equation, which accounts
for the effect of the radiation on the active medium and vice versa
∂φ/∂t = ncσφ - (∂φ⁄∂x)c …(13)
The rate at which the photon density changes in a small volume of material is given
by the net difference between the generation of photons by the stimulated emission
process and the photon flux which flows out from that region (i.e. the term (∂φ / ∂x)).
If we consider a square pulse of duration tp as the input pulse and φ0 as the initial
photon density, the solution for the photon density is
0
),(φ
φ tx = 1-[1- exp(-σnx)]exp[-γσφ0(c(t-x/c) ]-1 …(14)
where n is the inverted population density, assumed to be uniform throughout the
laser material at t = 0. The energy gain for a light beam passing through a laser
amplifier of length x = l is given by
( ) 0 00
1 ln 1 exp 1 n l
p
G c ec t
σγσφ τγσφ
= + −⎡ ⎤⎣ ⎦ …(15)
The input energy per unit area can be expressed as Ein=cφ0tphν …(16)
A saturation fluence Es can be defined as Es= hν/γσ = Est /γg0 … (17),
Here Est = hνn is the stored energy per unit volume, and g0 = nσ is the small signal
gain coefficient. In a four level system γ = 1, and total stored energy per unit volume
in the amplifier is
32
Est = g0 Es … (18)
The extraction efficiency ηE is the energy extracted from the amplifier divided by the
stored energy in the upper laser level at the time of the pulse arrival.
So, ηE= ( Eout -Ein) / g0 lEs … (19)
Where Ein and Eout are the amplifier signal input and output fluence, respectively.
Combining the above equations we can write,
0ln 1 exp 1s in
in s
E EG GE E
⎧ ⎫⎡ ⎤⎛ ⎞⎪ ⎪= + −⎨ ⎬⎢ ⎥⎜ ⎟⎝ ⎠⎪ ⎪⎣ ⎦⎩ ⎭
… (20)
This expression represents the relationship between the gain G, the input pulse energy
density Ein , the saturation parameter Es and the small signal, single pass gain G0=
exp(g 0 l) . For a low- input signal Ein such that
EE
s
in <<1, and G0 EE
s
in <<1, then eq. (4.14) can be approximated to
G ≈ G0 ≡ exp (g0l) … (21)
In this case the ‘low level gain’ is exponential with rod length and no saturation
effects occur. For high level energy densities such that
Ein / Es = >>1, eq (4.14) becomes G ≈ 1+ (Es /Ein)g0l … (22)
Thus, the energy gain is linear with the length of the rod, implying that every atom
excited to the state contributes its stimulated emission to the beam. Such a condition
represents the most efficient conversion of stored energy to beam energy, and for this
reason amplifier design, which operates in saturation, is used wherever practical, with
the major limitation being laser rod damage thresholds. However, in our case the
laser system is being operated in the small signal regime due to pump limitation.
The first and second amplifier stage consists of 19 mm diameter, 300 mm long
Nd: Glass amplifier rod, pumped by 6 numbers of Xenon filled linear flash lamps.
The reflector cavity is a cylindrical, diffused reflecting type. The flash lamps can be
charged and fired at a maximum input electrical energy of 12 kJ. The amplifier design
has taken care of cooling of laser rod by circulating saturated solution of sodium
nitrite. This amplifier has been operated in a single pass configuration to give a gain
of 3 - 4 per pass. Thus the output energy after this amplifier stage is about 2.5 J.
However, the spatial filter losses bring down the laser pulse energy to 2 J.
The third and fourth amplifier stages i.e. A-3 andA-4 consist of a 38 mm
diameter, 300 mm long Nd: Glass rod pumped by 12 flash lamps placed

33
symmetrically around the rod. The capacitor banks provide an input electrical energy
of 20 kJ into the flash lamps. The typical gain of this amplifier is 2x per pass. A
maximum radial gain variation of about 1.6 times has been observed between the rod
center and the rod edge. The laser pulse energy of about 4 J after A-3 gets stepped up
to 8 J after propagating through A-4. The final amplifier stage consists of a 50 mm
dia, 300 mm long rod pumped by 16 flash lamps of 300mm arc length. The final
output energy after the stage A-5measured was 12 J.
4.6.2 Determination of delay for triggering the amplifiers
Maximum energy extraction from the amplifier is possible, if it is in the peak
inversion condition at the time of arrival of oscillator pulse at the amplifier. For this,
the amplifiers are fired ahead of the oscillator. In order to fire the amplifiers and the
oscillator in sequence, an external trigger pulse triggers the master oscillator. The
delay required between the firing of amplifiers and oscillator was experimentally
determined by monitoring the flash lamp profile of the amplifiers and the appearance
of the laser pulse riding over the flash lamp profile using a P-I-N diode. An optimum
delay of 310 µ.s is set for the first 19 mm amplifier and 360 µ.s for the second
amplifier. The Fig. 4.5 shows the appearance of the laser pulse riding over the flash
lamp pulse profile of amplifier –A-1.
4.6.3 Determination of single pass gain of 19 mm amplifiers
A beam expander expands the output beam from the master oscillator by 2.4
times. This expanded beam will be propagated through a series of linear Nd: Glass
amplifiers to enhance the final output energy to the range of 10- 12 J. Two 19 mm
amplifiers, each, pumped by six xenon filled flash lamps are placed serially in this
amplifier chain. The single pass gain of each of the 19 mm amplifier is experimentally
determined as 4 to 5. The laser output energy at the end of amplifier A –2 is 2.5 J.
4.6.4 Variation of Gain with input laser pulse duration
The pulse duration of the oscillator output can be varied from 300 ps to 800
ps. The variation of single pass gain of 19 mm amplifier, pumped by 6 numbers of

34
xenon filled flash lamps, arranged symmetrically around the laser rod in a diffused
reflector cavity was recorded for laser pulse durations varying from 300 –800 ps.
Gain in the amplifier for varying pulse duration has been measured for identical
electrical input energy of 5.4 KJ (charging voltage - 3KV), which is shown in Fig.4.6.
Gain variation is from 4.28 to 4.64. Gain is about 8% higher at longer pulse duration
as compared to short pulse duration. We have also observed an increase in gain (x
5.5) for an increased electrical input energy (6.34 KJ, 500 ps pulse duration).
4.6.5 The study of spatial uniformity of gain profile in large aperture amplifiers
The necessity to investigate and understand the radial gain distribution lies in
the fact that highly non-uniform radial gain profile could result in an undesired
change in the spatial intensity profile of an input beam. When a laser beam
propagates through an amplifier rod having a non-uniform gain profile across its
aperture, the resulting laser beam divergence is seen to be higher than that of a
diffraction limited beam leading to a considerable loss of focusable power on target.
We have measure the single pass radial gain distribution of large aperture diameter
amplifiers (38 mm and 50 mm diameter rod amplifier). We are presenting the
experimental observation with 38 mm diameter Nd: Glass amplifier. The schematic
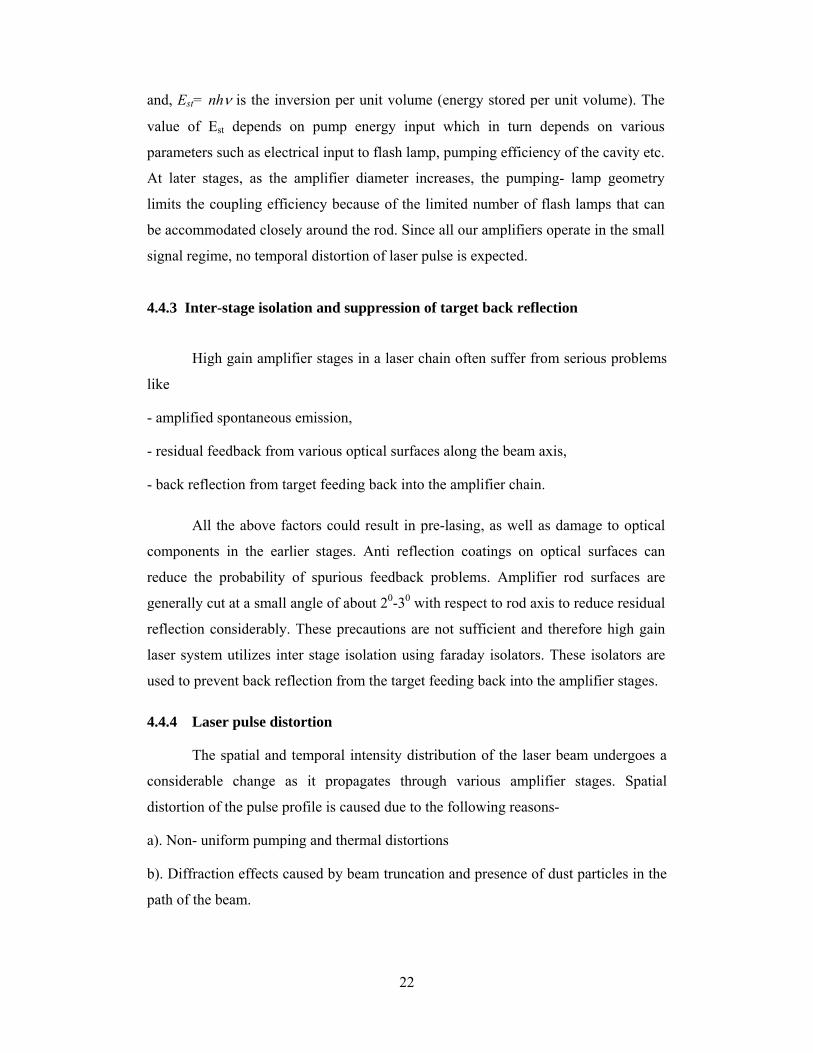
set-up is shown in Fig. 4.7. A 100% reflecting mirror at 450 angle of incidence and a
right angle prism are used to fold the output beam from A-1 and pass it through A-4.
The right angle prism is mounted on a linear translation stage. Initially the laser beam
is passed through the center of the 38-mm rod. When the prism is moved forward the
laser beam will be shifted horizontally along the radius of the rod. The beam splitter
BS1 deflects 4% of the incident beam to a Hamamatsu biplannar photo diode kept
behind a scatterer. The beam splitter BS2 deflects 4% of the output from the 38 mm
amplifier to the above photo diode. A delay of 18 ns is introduced between the two
signals incident on the photodiode. Both the signals are monitored by a 500 MHz
bandwidth (Lecroy make) storage oscilloscope. All the initial alignment is done with
a He-Ne laser, which is in line with the laser beam. Initially, the laser beam is passed
through the center of the 38-mm rod and the reference signal E0 and the output signal
E from the un-pumped rod is monitored. The ratio of E/E0 gives the passive loss in the
amplifier rod. E0 is monitored essentially to take care of shot to shot variation in input

35
400 500 600 700 8004.0
4.5
5.0
5.5
6.0
Gai
n in
Am
plifi
er (a
.u.)
Laser Pulse duration (psec)
gain variation(1) Linear Fit of Data1_B
Fig. 4.6. Gain variation in amplifier with pulse duration
Fig. 4.5. Synchronization of laser pulse with Peak of flash lamp profile.

36
laser energy to amplifier. When A-4 is fired, if E′ is the signal after the amplifier and
E0′ is the reference signal then gain G = E′ E0/ E0
′ E. The spatial profile across the rod
aperture is measured by measuring the gain at various points along the diameter of the
rod. This is done by simply shifting the input beam horizontally along the rod. The
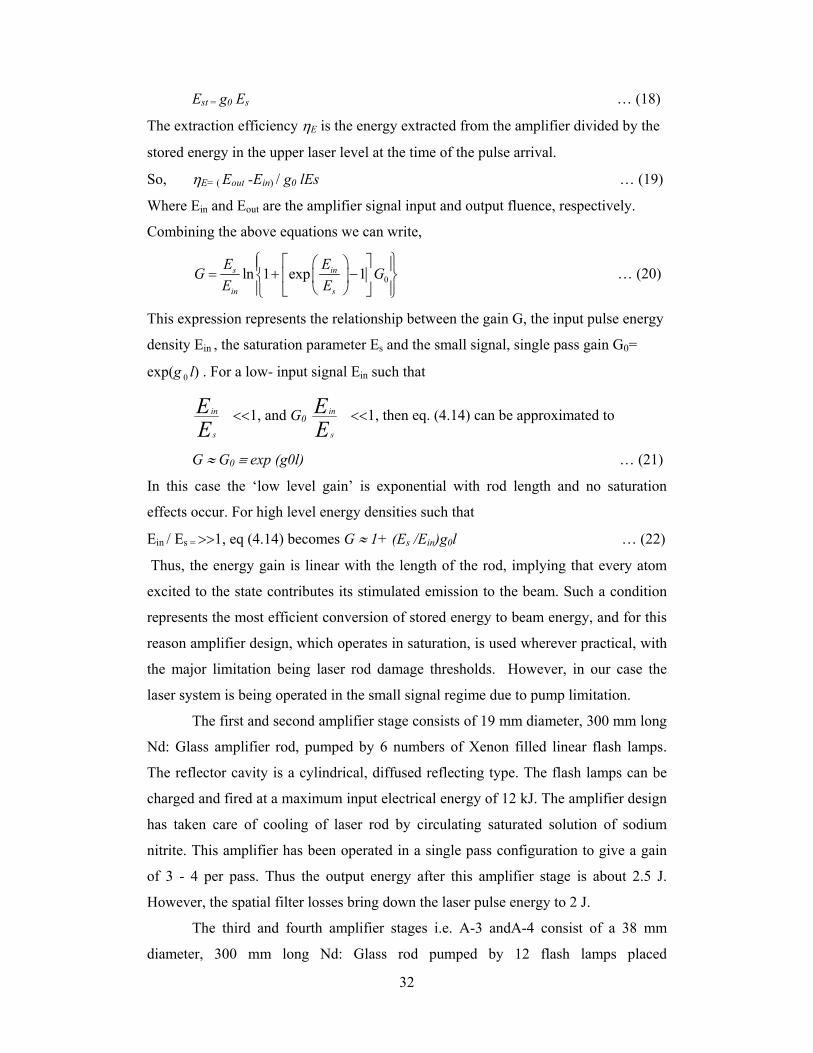
variation of gain along the rod at a fixed input energy and at varying delays between
the laser pulse and the flash lamp pump pulse of the amplifier is measured. The gain
was measured for three different delays, which are 350, 400 and 490 µs. This means
that the gain is scanned temporally over the flash lamp output profile.
It is observed from the Fig. 4.8 that the highest gain of 2.75 at the center of the
rod is reached 400 µ.s. after the flash lamp pulse starts. The gain at the edge of the rod
is seen to be 1.6 times the gain at the center. In the gain curve corresponding to 350
microseconds delay, the population inversion has not reached the peak value by the
time of arrival of the laser pulse. Hence the gain is low in this case. In high power
laser chains, incorporating large diameter amplifiers, this type of gain variation across
the aperture is acceptable. In the Omega laser system at Rochester Laboratory, a 50 to
55% variation in gain from the center to edge of 40 mm and 64 mm diameter
amplifiers has been reported. [38]
The radial gain in rod amplifiers has the effect of raising the edges of the beam
profile because radial locations near the edge show higher gain. When the rod is being
pumped by the flash lamps, absorption of the pump light by the rod is exponential in
nature. Due to this exponential absorption of the pump light, the center of the rod is
pumped less than the edges. Thus the non-uniform pumping leads to higher gain
coefficient at the edges of the rod. This also leads to a thermal gradient in the rod and
causes thermal lensing by the rod. To avoid this type of problem, in large amplifiers,
(with diameter 50 mm or more) the doping of the Nd3+ ions is deliberately kept not
uniform across the radius. The doping concentration is made less towards the
periphery than the center of the rod to take care of the radial gain variation.
37
Osc. Amp
P Amp
PD
M
O
BS1 BS2
0 2 4 6 8 10 12 14 16 180
1
2
3
4
Fig. 7 Variation of radial gain in 38 mm amplifier with delay as a parameter.
Gai
n
D istance freom the centre of the rod (mm)
Delay 350 μs
Delay 490 μs
Delay 400 μs
Fig.4.8. Variation of radial gain in 38 mm Amplifier with delay as a parameter.
Fig. 4.7. Schematic set-up for radial gain measurement.

38
5.0 Spatial Filter and optical relay
5.1 Degradation of spatial laser intensity profile while propagating through
amplifiers
The spatial intensity profile of the laser beam is an important parameter. High
power laser beams normally acquire intensity fluctuations as they propagate through a
series of amplifiers. Diffraction patterns caused due to minute dust particles, which
settle on the various optical components, are the common cause of the intensity
ripples. Inhomogeneity in the optical components also leads to a distortion of the laser
beam wave front. The high frequency ripples riding over the intensity profile grow in
amplitude as the laser beam propagates through the amplifiers. The local power
density in these ripples could reach the damage thresholds of the optical components.
In order to avoid this catastrophe, a spatial filter has to be incorporated in the laser
chain. In our laser system, the spatial frequencies start appearing after the first
amplifier and they grow to a level of 30–40% of the background level by the time
they come out of A-2. Therefore, the spatial filter is placed between A-2 and A-3.
A spatial filter removes the high frequencies and smoothens the profile. A
spatial filter typically consists of two plano-convex lenses separated by a distance
equal to the sum of their focal lengths. A micro pinhole of suitable diameter is placed
at the focal plane as shown in Fig. 5.1. The higher spatial frequencies focus away
from the optic axis of the system. This distance depends upon the spatial frequency
and the focal length of the lens. Thus, the size of the pinhole is decided after recording
the laser intensity profile to ascertain the spatial spatial frequency. The pinhole
diameter is then given by the expression-
Kcut-off = πd/λf …(23)
where, Kcut-off is the highest cut off frequency, d is the diameter of the pinhole, λ the
laser wavelength and f is the focal length of the lens. In our laser system, we have
used a spatial filter after the second amplifier stage and it consists of two lenses L1
and L2 (f 1 = 60 cm and f2 = 120 cm) separated by a distance equal to the sum of their
focal lengths with a pinhole of 900μm diameter located at the common focus of the
lenses. The lenses and pinhole are housed in a vacuum chamber evacuated to a

39
L1 L2
Fig. 5.2 Spatial filter assembly with Beam before the spatial filter and after the spatial filter.
Fig. 5.1 Optical lay out of the spatial filter

40
pressure of 10-2 Torr as shown in Fig. 5.2. Since the spatial filter is introduced
between the 19 mm and 38 mm diameter amplifiers, it is serving the dual purpose of
filtering the higher order spatial frequencies as well as expanding the laser beam to
the required size in order to fill the following larger amplifier. The spatial filter works
on the principle that, the input lens produces the Fourier transform of the input
intensity distribution at the focal plane. Thus, the high spatial frequencies,
corresponding to small-scale intensity modulations of the object, focus at a large
distance from the axis and can be easily filtered out by placing a pinhole of a suitable
diameter. On the other hand, the low-frequency component constituting the smooth
beam profile can pass through the pinhole unperturbed. The output lens of the spatial
filter performs the inverse Fourier transform, projecting the filtered beam pattern onto
the image plane. The output aperture of previous amplifier is image relayed to the
input aperture of the following amplifier. The aim is to geometrically transfer the
beam intensity distribution onto a desired plane located at the next amplifier, thereby,
impeding the growth of the high frequency intensity fluctuations that would otherwise
modify the spatial profile of the laser beam if it was left to freely propagate. The
image relaying thus provides nearly optimal coupling of the beam energy between
adjacent amplifiers. We have also introduced an image relaying system (f 1 =50 cm
and f2 = 70 cm) between fourth and fifth amplifier stages.
5.2 Theory of spatial filter
Fourier Transform:
The Fourier transform of spatial variation of a quantity h(x, y) in the X-
direction can be written as,
F[h(x)] = H(u) = ∫ )(xh e 2πiuxdx …..(23)
Where u is the spatial frequency. We can also write,
h(x) = ∫ −euH )( 2πiux du ……(24)
In this case h(x) is known as the Inverse Fourier Transform of H(u) . Elementary
manipulations give us,
FF[h(x)]= ∫ −euH )( 2πiux du = h(-x) ……(25)
In a similar manner we have, for two -dimensional cases,
F[h(x, y)] = H(u, v) = ∫∫ π2),( eyxh i(ux +vy) dx.dy ……(26)

41
FF[h(x,y)] = h(-x,-y) ...(27)
Fourier transforms properties of a thin lens can be understand with schematic shown
in Fig. 5.3
Let h(x, y) represent the field distribution at the plane P1. The field will
undergo Fresnel Diffraction and on the plane p4 it will be given by,
( ) ( ) ( ) ( ) ( ) ( ) 2 24 exp , exp .2
i ikU ikf h x y d df fξ η ξ η ξ ηλ⎡ ⎤= − − − + −⎣ ⎦∫∫ …(28)
Now the effect of the thin lens of focal length f is to multiply the incident field
distribution by the factor PL given by,
( )( )2 2exp 2LikP x yf
⎡ ⎤= +⎢ ⎥⎣ ⎦ …(29)
Thus on the plane P5 the field distribution will be given by,
( ) ( ) ( )( ) ( ) ( ) ( )( )2 22 25 exp exp , expiU ikf i x y h i x y d df α ξ η α ξ η ξ ηλ
⎡ ⎤= − + − − + −⎣ ⎦∫∫ ...(30)
Where 2k
f fπα λ= =
From plane P5, the field will again undergo Fresnel Diffraction and therefore on plane
P2 it will be given by,
( ) ( ) ( ) ( )21, , i u vg x y h e d dfπ ξ ηξ η ξ ηλ
+= ∫∫ …(31)
where we have neglected the unimportant phase factor exp (-2ikf).
The above equation gives the important result that the field distribution at the
back focal plane of a corrected lens is the Fourier transform of the field distribution
on the front focal plane. In writing the limits in the integral from - ∞ to + ∞ we have
assumed the lens to be of infinite extent. The error involved is usually very small
because in almost all-practical cases a/λ >> 1, where, a, represents the aperture of the
lens. From the above equation it follows that a point (x, y) on the back focal plane of
the lens corresponds to spatial frequency u = x/ λ f and v = y/ λ f of the object.
Therefore the amplitude distribution on the back focal plane actually gives the spatial
frequency distribution of the object.
The theoretic schematic of the spatial filter is shown in Fig.5.4. If h(x, y)
represents the field distribution on the front focal plane of a corrected lens (on the
plane P1) then the field distribution g(x, y) on the back focal plane P2 is the two
dimensional Fourier Transform of h(x, y). Now if we put another lens L2, such that P2

42
z
P1 P2 P5 P4
f f
Fig. 5.4 Schematic set-up of spatial filter assembly.
Fig.5.3 Fourier Transformation behavior of lens.

43
represents the front focal plane of L2, on the back focal plane P3 we will get the
Fourier transform of the Fourier Transform of original field distribution h(x, y), which
will be the original field distribution (except for an inversion). Thus, by putting
suitable stops and apertures on the plane P2 we can filter out certain spatial
frequencies of the incident field distribution. This important result allows us to filter
out ‘unwanted’ spatial frequencies present in the object forms the basis of spatial
frequency filtering.

44
6.0 Faraday Isolator 6.1 Design and development of a large diameter Faraday Isolator
Lasers are used for the generation and heating of high density, high
temperature plasma. When high power laser of the intensity of the order of 1014
W/cm2, is focused on a target, a significant fraction of (10 -25%) of the incident laser
radiation is backscattered from the laser-generated plasma due to some non-linear
processes such as SBS, SRS etc. [39-41]. This light, if allowed to propagate back in
the laser chain, will get amplified and reach intensity beyond the damage threshold of
amplifiers and other optical components in the laser chain. To avoid this, the
backscattered light should be isolated from the laser system. Out of many other
mechanisms such as saturable absorber, plasma isolator, quarter wave plate isolator,
Pockel’s effect Isolators, Faraday Isolator [42- 45] is most suitable for use in high
power laser systems. We have design, development and studies on 60mm diameter
Faraday Isolator developed for the high power Nd: Glass laser system.
6.2 Working principal of Faraday Isolator
The typical arrangement of Faraday Isolator shown in Fig. 6.1a consists of two
polarizers and a faraday rotator. The polarized forward beam after passing through the
Faraday Rotator is rotated by 450. For the return beam, magnetic field B will now be
in opposite direction. Therefore, for this beam θ will -450. Thus the return beam will
be rotated by 900 in double pass and will thereby be rejected by the first polarizer. In
order to avoid any back transmission due to depolarization of light from plasma, a
second polarizer is used after Faraday rotator. The plane of polarization of this
polarizer kept at 450 with respect to first polarizer to pass maximum forward light
beam.

45
6.3 Theory of Faraday Isolator (Faraday Effect)
According to Zeeman effect [46], a radiating substance emitting light at
frequency at 0ν , when placed in a magnetic field H, emits light at three different
frequencies 0 B Hν μ+ , 0ν and 0 B Hν μ− , where 4Be
mcμ π=
However, radiated light at these three different frequencies has different polarizations:
(a) Radiation emitted at 0ν is plane polarized with its polarization parallel to magnetic
field (b) radiation emitted at 0 B Hν μ+ is right circularly (+) polarized in a plane
perpendicular to magnetic field. (c) Radiation emitted at 0 B Hν μ− is left circularly (-)
polarized in a plane perpendicular to magnetic field.
Zeeman effect describes emission of radiation from a substance in presence of
magnetic field. Inverse Zeeman Effect [47] describes absorption of radiation in
presence of magnetic field. If a white light is passed through a substance, which is
placed in a magnetic field, right circularly light will be absorbed at frequency
0 B Hν μ+ whereas left circularly polarized light will be absorbed at 0 B Hν μ− . This
as shown in figure 6.1, these two polarized components will show anomalous
dispersion at different frequencies.
At any other frequency ν, the two components of polarization will have
different refractive indeces. A plane polarized light can be considered as a linear sum
of right circularly and left circularly polarized components. Let the original
polarization of electric field be along x-direction
$ ( ) ( )0 00 1, 1,
2 2E EE x i i= + − ,
Where (1, i) and (1, -i) represent right and left circularly polarized components of
light.
On passing a length l of the medium, phase retardation Φ between two
components:
( )2 lπ η ηλ − +Φ = −
The electric field E after passing through the medium thus becomes
( ) ( )0 01, 1,2 2
iE EE i i e Φ= + −

46
= ( ) ( )0 2 2 21, 1,2
i i iEE e i e i eΦ − Φ Φ⎡ ⎤= + −⎢ ⎥⎣ ⎦
( ) $ ( )$0 2 2 2 2 2
2i i i i iEE e e e x i e e yΦ − Φ Φ − Φ Φ⎡ ⎤= + + −⎢ ⎥⎣ ⎦
,
$ $20 cos sin
2 2i
E E e x yΦ ⎡ Φ Φ ⎤⎛ ⎞ ⎛ ⎞= +⎜ ⎟ ⎜ ⎟⎢ ⎥⎝ ⎠ ⎝ ⎠⎣ ⎦
,
Which show that the output light remains plane polarized and its polarization
is rotated by an angle ( )2Φ from the input beam.
The Faraday Isolator works on the principle of Faraday effect. When a plane
polarized light passes through a Faraday glass kept in a magnetic field with the
direction of magnetic field parallel to that of propagation, the plan of polarization gets
rotated. The rotation due to magnetic field may be expressed in terms e/m, the ratio of
the charge of the electron to its mass. According to theory of Lorentz, an electron
moving in its orbit about an atomic nucleus will change its frequency of revolution
which in turn leads to a rotation of the plane of polarized light through the affected
object. This angle of rotation ‘θ’ has been shown to be
22e dnB VBl
mc dθ λ
λ= =
where e – charge of electron in e.s.u.,
m – mass of the electron,
c – speed of light in cm/sec,
λ – wavelength of light,
l - length of Faraday active material,
V -Verdet constant, which is a property of the material chosen,
B - field strength
dndλ
- derivative of index of refraction with respect to wavelength.

47
V-µBH V V+µBH
n- n+
Fig. 6.1 Dispersion curves for two different polarization of light phase retardation
( )2 lπ η ηλ − +Φ = −

48
6.4 Mechanical Design and electronics of Faraday Isolator:
The schematic setup and the photograph of Faraday Isolator are shown in Figs.6.2a. &
6.2b which consist of two polarizers P1, P2 (160mm x80mm x 20mm) and a Faraday
glass FR5 of M/S Hoya (Tb+3 doped silicate glass with 1 wt % Tb doping). The
thickness of glass was 30 mm and diameter of 60 mm. The Verdet constant of this
glass was 0.001203 degree/G x cm. This required that the pulsed magnetic field of
12.46 KG must be generated for 450 rotations. This magnetic field is obtained within
the Faraday glass by placing it centrally inside a solenoid coil [48]. The solenoid has a
length of 150 mm and three layers (135 turns) of silvered copper wire with EE type
Teflon insulation wound on a hallow nylon cylinder. Any metal used for this purpose
leads to eddy currents and so cannot be used. A Faraday glass is a hygroscopic
material whose highly polished λ/10 surfaces can be easily affected by moisture; the
whole assembly has been made airtight and is connected to a reservoir containing
silica gel. Polarizers were mounted on polarizer holder cut at 60 degree and have
option to change angle by ±2.50 (with resolution 6 minute), which was connected, to
the main body through a S.S. tube by Rack and pinion assembly for the proper
rotation with the resolution of 30 minutes. The whole system has been placed on an
aluminum platform. The height of Isolator can be adjusted and any angular tilt to the
isolator can be given by adjusting the platform.
The Faraday Isolator power supply consists of an energy storage unit
of 600µF and the control module for controlling the charging. The current through the
solenoid varies from 847A to 1.104KA for a charging voltage set up 1.36KV to
2.0KV. The current pulse is generated by triggering the SCR. The current pulse
measured is half sinusoidal with a peak value of about 1.104 KA, duration about 2.32
msec (peak at 1.16msec) as shown in Fig.6.3a and the corresponding magnetic field
profile by Teslameter is shown in Fig 6.3b.

49
Fig. 6.2a- Schematic of Faraday Isolator.
Fig. 6.2b- Photograph of Faraday Isolator

50
6.5 Optimization of Faraday Isolator parameters
a) Measurement of inductance and current in solenoid
The inductance of the coil is measured with the LCR meter and was found to
be 0.9 mH. The current was measured by probing the signal across a 25mΩ resistance
connected in series. It reaches its peak about 800μsec after it firing which is in good
agreement with the expected result. The peak current at 2.2kV input is 1.1 kilo
ampere. The scaling of input current in solenoid with the applied voltage is given in
Fig. 6.4. It is varying linear with the voltage.
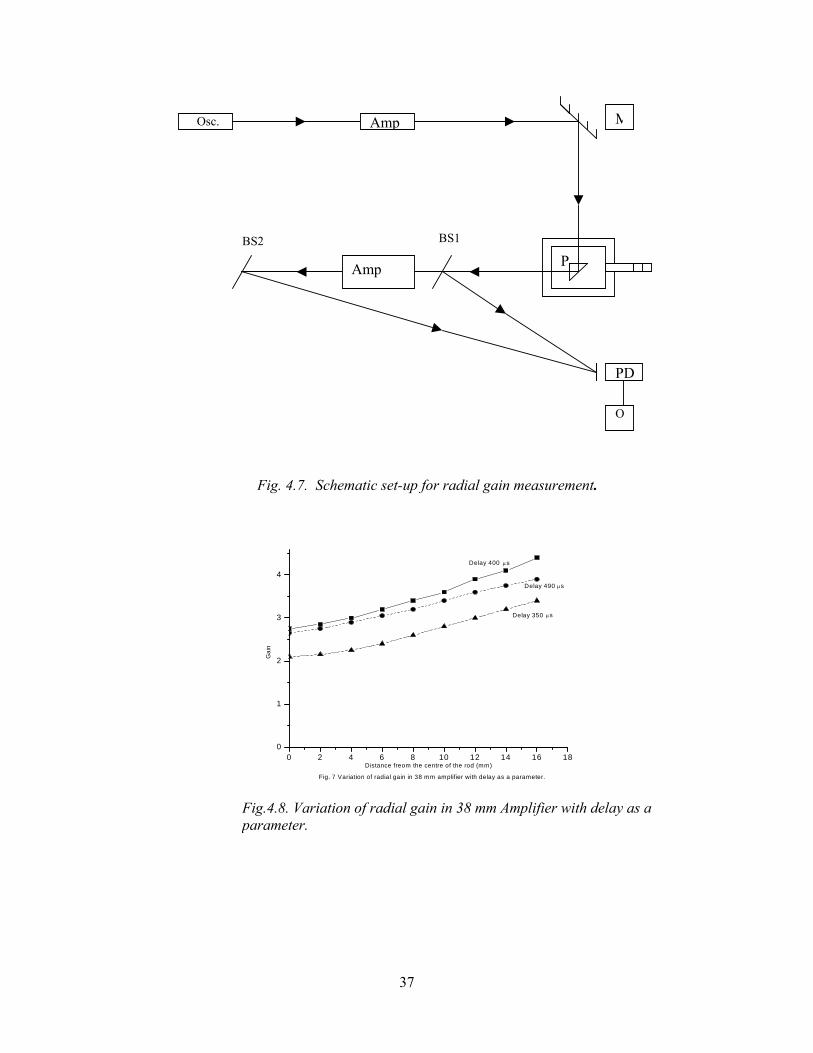
b) Measurement of Magnetic field
For scanning axial and radial magnetic field inside solenoid, a
Gauss/Teslameter (Model 9950 from F. W. Bell Technologies Inc) were used for the
measurement. It is measuring the magnetic flux density using the Hall effect. It can
measure field as low as 10 μG (0.001μT) or as high as 2.9999 MG (299.99 T), at
frequencies up to 50 kHz with extreme accuracy and 4-3/4 digit resolutions. The
variation of magnetic field along the axis and along the radial direction is shown in
Figs.6.5a & 6.5b. Though variation of magnetic field along axis is much larger than
that along transverse direction (almost negligible), the length of solenoid is chosen to
be about 5 times the thickness of glass so that there is no variation of magnetic field in
the region of interest. The field is found to be fairly uniform with variation of less
than 4% in the region of our interest. Also we have kept the probe at center of the
solenoid and measured the peak magnetic field by changing the input voltage as
shown in Fig. 6.6. It varies linearly as was predicted theoretically.
c) Optical Isolation The extinction (ratio of input to back reflected laser intensity) at the center of
the Faraday Isolator is found to be 270: 1. The extinction ratio of the isolator was
measured by changing the input polarizer angle tuning and it was observed that it is
maximum at the input incident angle of 59.50 keeping angle between input and output
polarizer 450 as shown in fig. 6.7. Total transmission loss for input laser measured in
the Faraday Isolator is about 15 %.

51
Fig-6.3a- Current pulse in solenoid measured across 25mΩ
resistance.
Fig. 6.3b. Magnetic field profile measured by Teslameter (caliberation 3V = 30 kG).

52
Fig. 6.4. Scaling of solenoid peak current with the input voltage.
0.2 0.4 0.6 0.8 1.0 1.2 1.4 1.6 1.8 2.0 2.2 2.40.2
0.4
0.6
0.8
1.0
1.2So
leno
id C
urre
nt
Power Supply Volage (KV)
Solenoide Current Vs Applied Voltage

53
-8 -6 -4 -2 0 2 4 6 80
1
2
3
4
5
6
7
8
9
10
11
12
13
14
I=0.847 KA
I=0.944 KA
I=0.992 KA
V=1.104 KA
MA
GN
ETI
C F
IELD
(KG
)
POSITION IN SOLENOID (CM)
Fig. 6.5a- Axial distribution of magnetic field.
20 30 40 50 600.00.51.01.52.02.53.03.54.04.55.05.56.06.57.07.58.08.59.09.5
10.0
I=1.104 KA
I=0.992 KAI=0.944 KA
I=0.847 KA
MAG
NET
IC F
IELD
(KG
)
VERTICAL POSITION AT MIDDLE OF SOLENOID (CM)
Fig. 6.5b-Radial distribution of magnetic field.
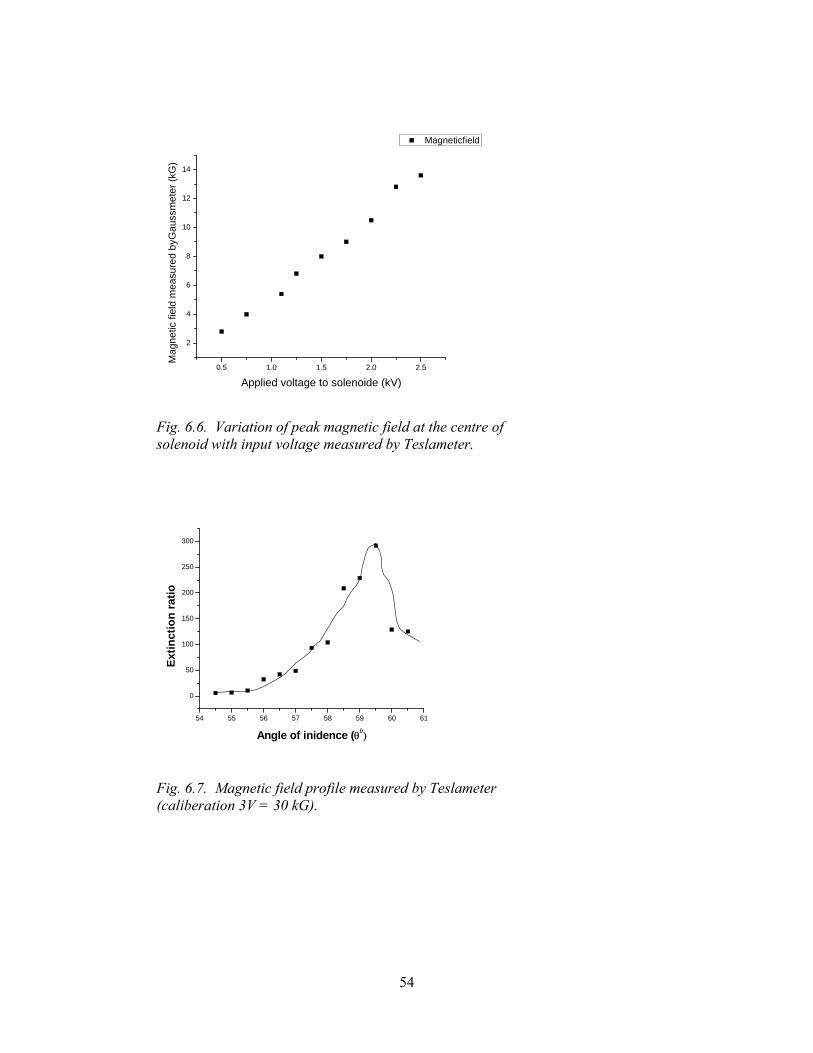
54
0.5 1.0 1.5 2.0 2.5
2
4
6
8
10
12
14
Magneticfield
Mag
netic
fiel
d m
easu
red
byG
auss
met
er (k
G)
Applied voltage to solenoide (kV)
54 55 56 57 58 59 60 61
0
50
100
150
200
250
300
Extin
ctio
n ra
tio
Angle of inidence (θ0)
Fig. 6.6. Variation of peak magnetic field at the centre of solenoid with input voltage measured by Teslameter.
Fig. 6.7. Magnetic field profile measured by Teslameter (caliberation 3V = 30 kG).

55
7.0 Electronics for 40GW Nd:Glass system
The 40GW Nd: Glass laser system consists of a commercial, Q-switched, SBS
compressed Nd: YAG oscillator, 5 linear amplifiers, a spatial filter and a Faraday
isolator. The oscillator and amplifiers are pumped by Xenon flash lamps. The energy
storage capacitors energies the Faraday Isolator solenoid and flash lamps of the
amplifiers and oscillator. Master control unit along with LPC 2138 microcontroller
based on 16/32 bit ARM7TDMI CPU, which controls the trigger/delay generation.
The charging of capacitor banks and their discharge into flash lamps and solenoid
load is initiated by trigger with predetermined delays.
System description
The block diagram of the system shown in Fig. 7.1 consists of a control unit
for the commercial oscillator, energy storage units, Master control unit and control
modules for the amplifiers and ARM7TDMI micro controller based trigger generator
for the entire system.
7.1 Oscillator (EKSPLA- SL 312-2P)
The laser oscillator can be operated in internal mode or in one of the three
modes for external triggering. In internal mode all the signals are generated internally
and the laser operates at a fixed 10 Hz rep rate, only a sync pulse is available for
synchronizing the external event to the laser pulse.
7.2 Energy Storage Unit:
The energy storage units consist of solid-state relay (for controlling the
charging of capacitors), high voltage transformer (5 kV), bridge rectifier, controlling
circuitry and energy storage capacitors. Pressing the ‘Charge’ switch initializes the
charging process. The capacitors get charged to the pre-set level, and when the trigger
switch is activated all the stored energy in the capacitor bank will be discharged

56
through the flash lamps. The energy storage unit contains circuits for generating high
voltage pulse (15k.V), which triggers the flash lamps after a preset delay.
When the firing of the laser is to be aborted, a contactor dumps the energy into
high power resistors by pressing ‘Dump’ switch. At the end of firing, any leftover
energy in the capacitor banks is dumped into resistive loads.
7.3 Master control unit:
The master control unit contains low voltage (+ 5, +12 and – 12 V) power
supplies required for an operation of the system. It also contains circuits which give
outputs to control modules for initiating the charging of energy storage units and for
triggering the flash lamps when charge and trigger push buttons are pressed.
a) Control modules:
The control modules contain comparator circuits to control the charging of
energy storage units. It controls the capacitor charging with the two inputs
coming to it from reference voltage and feedback voltage. The comparator
output controls the conduction of solid-state relay.
b) Trigger pulse Generator:
The amplifiers and Faraday Isolators in high power laser systems normally operate in
single shot mode. The oscillator flash lamps operate at 10 Hz from the thermal
stabilization point of view for good optical beam quality. Even for single shot
operation, the oscillator flash lamps are operated at 10 Hz and only the Q switch
trigger pulse is given as single shot to get single pulse laser output. In order to
synchronize the laser with the single shot operation of the amplifier chain, a
synchronizing trigger generator was developed. The laser oscillator can be operated in
internal mode or in one of the three modes for external triggering. In internal mode all
the signals are generated internally and the laser operates at a fixed 10 Hz rep rate,
only a sync pulse is available for synchronizing the external event to the laser pulse.
In the external trigger mode, we used, sync pulses at 10 Hz, which are available from
OUT terminal (12V, 10 Hz, 120μsec) of the oscillator power supply. This output is
combined with the single shot trigger pulse of the laser chain to get the master trigger
pulse. The block diagram of the trigger system is shown in fig. 7.2.

57
To other control modules
MASTER CONTROL UNIT
Oscillator
Power supply
TRIGGER
PULSE GENERATOR UNIT
CONTROL MODULE
ENERGY STORAGE UNIT
Flash Lamp
LASER HEAD
Fig.7.2. Block diagram of the master trigger generator/synchronization unit.
Fig. 7.1. Block diagram of the laser system power supply.

58
For maximum energy extraction from a laser system, the amplifiers should be in peak
inversion condition when the oscillator pulse arrives at them. For this purpose the
amplifiers are fired ahead of the oscillator with specific delays. The amplifiers are
triggered and controlled by master control unit. When trigger button on the panel is
pressed, a trigger signal is generated after three beeps. This signal initiates the
synchronizing circuit. The 10 Hz pulses from oscillator are also fed to the
synchronizing circuit as shown in the block diagram Fig.7.2. After the appearance of
the trigger pulse (after three audio beeps), makes the synchronizing circuit generates a
master trigger signal as shown in fig.7.3 (third line), which is in synchronization with
10 Hz sync pulses. This master control trigger signal, provided with proper delay
using a delay generator, is given to the oscillator SYNC IN terminal to trigger the
oscillator and amplifier control modules for single shot operation. The delay between
SYNC OUT and SYNC IN is adjusted –ve in the remote control pad of oscillator. The
timing sequences for various trigger pulses to different stages are shown in Fig.7.2.
Maximum delay is provided between the SYNC OUT and SYNC IN pulses to
accommodate the large delay between the triggering of Faraday Isolator and the Q-
switching of oscillator.
Two types of trigger/delay generation circuits were developed. The first circuit
was based on analog devices and the second one was based on ARM7TDMI micro
controller. However the output from analog based circuit caused a jitter of 20-40
microseconds in the delay set between SYNC OUT and SYNC IN signals. So before
each shot, we had to monitor the delay and make changes every time. Even after that
also, there were cases of misfiring of the amplifiers. This is due to the limitation of
the device used for providing the delay. The circuit diagram of I.C based trigger
generator is shown in Fig. 7.4. In order to overcome this drawback, another circuit
based on ARM7TDMI micro controller was developed. The block diagram of this
circuit is given in Fig.7.5. The delay adjustment is done through software and it can
fix delay with the accuracy of 1 μs. The output of this circuit is then used to provide
required delay to the amplifiers, Faraday Isolator and oscillator. Details of the circuit
are described in next subsections.

59
Fig. 7.3. Timing sequence for various trigger pulse

60
7.4 ARM7TDMI microcontroller based trigger generator
a) General Description about Trigger generator unit
The LPC 2138 microcontroller based on 16/32 bit ARM7TDMI CPU with real
time emulation and embedded trace support, which controls the trigger/delay
generation, and produces the 24 different trigger output pulses with different time
interval based on the start pulse for firing the flash lamp power supply and laser unit.
It has built in Flash, RAM and peripherals, EEPROM and power supply.
b) Serial Interface
Half-duplex serial communications, with an RS232, with checksum based
protocol helps to ensure reliable communication in harsh industrial environments.
This protocol also permits simultaneous communication with minimum command
processing Latency.
c) Programs
Using a host computer delay values can be programmed, delay values will be
stored in non-volatile Memory (64k bytes) and initiated via the serial communication
port.
d) Controller Isolated Inputs & isolated Outputs:
Inputs- Opto isolated trigger input (12V, pulse) and Opto isolated Oscillator
input (10Hz, pulse train).
Outputs –24 nos. of opto isolated trigger outputs (5/12V, pulse).

61
Fig.
7.4
. IC
s bas
ed tr
igge
r/de
lay
gene
rato
r.

62
Fig. 7.5. Block diagram of the ARM7TDMI micro controller based trigger/delay generator unit.
Pulse 24
Pulse 1
Input Pulse
PROCESSOR LPC 2138
POWER LED
SYS LED
RS232
PC LED
PC/SYS SW
12V/5V SW
APP/PROG SW
OSC (10Hz)
12/5V OUT
DC To DC CONVERTER
SYNCHRONIZING CIRCUIT
SMPS
ISOLATOR

63
7.5 Function of the Controller
The controller has two mode of operation; Keep PC/SYS switch Down for
SYSTEM Mode, keep switch UP for PC Mode. The LED indication is provided for
each mode.
a) PC Mode
In PC Mode the system will communicate to PC only, using PC application
user can set the pulse delay values of the outputs.
b) System mode
In system mode controller should receive 10Hz clock pulse continuously from
external source in the OSC input. Initially controller waits for the Trigger pulse from
external input, after getting trigger pulse the controller synchronizes it with leading
edge of 10Hz pulse and generates a master trigger pulse which waits for the lowest set
delay and gives the corresponding next outputs pulse.

64
8.0 Experimental chamber equipped with Laser-plasma diagnostics
The 12Joule/300-800psec-laser pulse propagating out of the last amplifier and
Faraday Isolator is finally focused on to the target placed in a vacuum chamber by
using a 50 cm focal length f/5 plano-convex lens [49]. The stainless steel vacuum
chamber of 40cms diameter and 30cms height with 16 numbers of ports for various
diagnostic equipments is evacuated to a pressure of 2x10⁻⁶ Torr is shown in Figs. 8a
& 8b. The targets under study are mounted on a stepper motor controlled x-y-z
translational stage inside the vacuum chamber. Detailed diagnosis of laser target
interaction experiments requires a variety of diagnostics and systems capable of
measurements over a broad range of physical parameters like spatial, spectral and
temporal profile of plasma with high resolution. The laser plasma studies conducted
concerned the time and space resolved X-ray and ion emissions. The diagnostics
used for different measurements for the laser plasma and laser shock studies are
listed in Table-1 along with their specifications.

65
(a) (b)
Fig.
8. V
acuu
m c
ham
ber P
hoto
grap
hs (a
) out
side
vie
w (b
) ins
ide
view

66
Diagnostics Plasma parameter and Specifications
X-ray semiconductor diodes Temporal and Spectral-
Measurement of X-ray emission
from plasma.
Temporal resolution 3 nsec.
7 channel X-ray vacuum
photodiode with various
energy ranges using various
filters.
Temporal and Spectral-
Temperature measurement of
plasma/shock region.
Resolution –100 psec
X-ray pinhole camera-. spatial extent of plasma, shock
region
Spatial resolution –10 and
25µm
X-ray transmission grating
spectrometer–
Spectrum of the emitted x-ray
from laser plasma
Spectral Resolution -6Å
Spectral Resolution -0.5Å
(Under development) Crystal Spectrometer with
TlAP and RbAP crystal
spectrometer for soft x-ray
and LiF and PET crystals
spectrometer for hard x-ray
Hard x-ray spectrum of laser
plasma
Spectral resolution - 0.01Å
Langmuir probe- Ion velocity, ion temperature,
ion current, charge state
measurement,
Faraday Cup (IC) Time-of-flight (TOF)
spectroscopy of ions- Ion
velocity, ion temperature, ion
current, ion charge state etc.
Able to resolve fast ion
components
Electrostatic Ion Energy
Analyzer is being tested for
the ion energy to charge state
spectrum measurements.
Measurement of the energy to
charge (E/z) spectrum of the ion
species, charge state abundance,
Optical streak camera Shock velocity and target
velocity measurements
Resolution -20pec
VISAR set-up Particle velocity measurement
Table-1

67
9.0 Theoretical simulation models for laser plasma experiments
A number of theoretical models are developed over a period of time to
simulate the laser plasma interaction experiments. In the following sub sections, we
describe very briefly some salient features of these studies.
9.1 Non-LTE model for opacities
The present day accurate methods are based on self - consistent Hartree-Fock-Slater
models. However, these calculations are computationally expensive and thus we used
screened hydrogenic atom model, which is widely used, to calculate atomic
properties. The ℓ splitting is included in the model. It reproduces the energy levels for
neutral as well as ionized atoms to reasonable accuracy. As an example, we show in
Fig. 9.1 the ionization potential as a function of state of ionization for three
representative elements. The solid lines in this figure are calculated values while the
solid circles are the experimental. It is seen from it that a good agreement between the
calculated and experimental values exist. The population densities of neutral to fully
ionized ions for any element are obtained by solving the steady state rate equations.
The atomic processes considered are the collisional ionization, 3 bodies and radiative
recombination, and the die-electronic recombination. We show in Fig. 9.2 the
calculated average degree of ionization for gold. Also shown are the values obtained
from Thomas-Fermi scaling law and the solution of the Saha equation (SAHA).
Results from Thomas Fermi agree with the solution of Saha equation (except for shell
effects). At low temperatures simple models like TF and SAHA estimates are close to
non-LTE results. However, at higher temperatures these simple models over predict
the ionization. Absorption and emission coefficients at a photon frequency for any
element consist of bound-bound, bound-free and free-free transitions. Thomson
scattering and plasma oscillation contributions are also included in it. Standard
formulae are used for natural, stark, fine structure and Doppler widths. The oscillator
strengths and radial integrals are again evaluated in screened hydrogenic
approximation. The details are given in [50]. As an example we show Fig.9.3 and Fig.
9.4 the frequency dependent absorption end emission coefficient for gold as
calculated by the above model. The free-free and bound-free contributions are also

68
0 5 10 15 20 25101102103104
Fe(26)
Ionization Stage
0 2 4 6 8 10 12100101102103
Mg(12)Io
niza
tion
Pot
entia
l (eV
)0 1 2 3 4 5 6
101
102
103
Fig. 9.1: Calculated Ionization potentials.
C(6)
101 102 103 1040
20
40
60
80
Fig. 9.2: Average degree of ionization.
Au(79)ρ = 0.1 g/cc
NLTE TF SAHA
Mea
n Io
niza
tion
Sta
te
Temperature (eV)

69
1E-3 0.01 0.1 1 10 10010-1
100
101
102
103
104
105
106
107
Fig. 9.3:Calculated absorption coefficient.
IONMIXff + bf +bb
b-f
f-fA
bsor
ptio
n (c
m2 /g
)
Energy (Kev)
1E-3 0.01 0.1 1 10100
102
104
106
108
Fig. 9.4: Calculated emission coefficent.
ff + bf +bb
b-f
f-f
Em
issi
on (e
rgs/
cm3 /s
tera
d)
Energy (Kev)

70
shown separately in these figures. Also shown by dotted line are the results from the
code IONMIX. Bound - free contribution is significant only for high photon energies
and line contribution is important for frequencies beyond 100 eV. At lower energies,
it is basically the inverse Bremsstrahlung that dominates the absorption coefficient
and it becomes zero beyond 2 KeV.
9.2 Composite Targets
The conversion of intense laser light into incoherent soft x-ray radiation
during the heating of high-Z materials is a subject of much current interest in view of
its relevance to the indirect approach to inertial confinement fusion. High-Z material
is used to fabricate the inside wall of a hohlraum cavity because a high-Z plasma is an
efficient x-ray converter and it offers a high opacity to radiation. Recently we have
shown that a mixture of two or more high-Z elements can provide significantly higher
Rosseland mean opacity than that of pure elements. This occurs when the frequency
regions of small opacity of one element coincide with the regions of large opacity of
another element in the same photon energy band. Since gold has been the most widely
used material for ICF hohlraum fabrication, its mixtures with some other elements,
e.g. Au-Gd, Au-Sm, Au-Cu etc. has been theoretically investigated to determine
optimum composition to achieve high Rosseland mean opacity [51]. Our results on
Au-Cu mixture are verified experimentally at CAT [52, 63]. As an example, we
present in Figs. 9.5 and 9.6 our main results for Au-Sm composite target. These figs.
show respectively the bound-bound and bound-free contribution of opacities for Au
and Sm at a density of 0.01 g/cc and a temperature of 350 eV. Solid line represents
the gold results while dotted line represents the corresponding values of Sm. From
these figures we note the desired features of valleys and peaks combinations. For
energies greater than 1 KeV, we observe the desired features in the opacity curves for
bound-free transitions also. Step like shape of the curve in the Fig. 9.6 corresponds to
opening up of various energy levels. As an example we also show the variation of
Rosseland mean with temperature for gold, Samarium and a 50-50 mixture of Au-Sm
for the density of 0.01 g/cc in Fig. 9.7. From this figures we note that opacity of Au-
Sm mixtures is more than Au or Sm separately at all the temperatures. In Fig. 9.8 we
show the enhancement factor as a function of gold fraction. For the purpose of
comparison, marker points in this figure show the published results from other groups.

71
0.1 1 10
101
102
103
104
Fig. 9.5: Bound-bound contribution to opacities.
T = 350 eVρ = 0.01 g/cc
Au Sm
Kb-
b (c
m2 /g
)
Energy (KeV)
1 1010-4
10-3
10-2
10-1
100
101
102
103
Fig. 9.6: Bound-free contribution to opacities.
T = 350 eVρ = 0.01 g/cc
Au Sm
Kb-
f (c
m2 /g
)
Energy (KeV)

72
0.10 0.15 0.20 0.25 0.30 0.35 0.40102
103
Fig. 9.7: Rosseland mean opacity vs temperature.
ρ = 0.01 g/cc Au Au-Sm Sm
KR (c
m2 /g
)
Temperature (KeV)
0.0 0.2 0.4 0.6 0.8 1.00.50
0.75
1.00
1.25
1.50
Fig. 9.8: Gain in Rosseland mean vs Au fraction.
Au-Smρ = 0.1 g/cc T = 200 ev
KR
,mix /
KR
,Au
Fractional density of Au

73
9.3 Simulation of Hohlraum Cavities
Numerical simulations of radiation cavities require the solution of radiation
transport equations coupled with hydrodynamics [53]. In our model the
hydrodynamics is treated by solving three conservation equations in 1-D Lagrangian
geometry. The shocks are treated by Von-Neumann artificial viscous pressure.
Radiation transport is treated by multi-group radiation diffusion approximation or by
discrete direction Sn method. Tabulated equation of state, opacity and emissivity data
are used. As an example of validation of our model, we present in Figs. 9.9 and 9.10
the simulations of the NOVA experiments. A 3 mm long and 1.6 mm diameter
cylindrical gold hohlraum was driven by 8 laser beams. The temporally shaped 3.3 ns
laser beams of wavelength 0.351 μm having energies from 2.0 to 3.0 K Joules
delivered a total peak power of 16 TW/cm2. We show in fig. 9.9 the time dependent
radiation temperature as calculated by the present model using 1, 100 and 150 groups
of radiation transport. Fig.9.10 shows the dependence of calculated temperature on
mesh spacing used in hohlraum wall. We have used non-uniform mesh with mesh
spacing increasing in a geometric series as we move outwards. Lowest curve
corresponds to a uniform and hence a coarse mesh.
9.4 Hydrodynamic Instabilities
In inertial confinement fusion (ICF), the ablation front of the imploding material is
known to be hydrodynamically unstable. The Rayleigh–Taylor (RT) instability [54-
56] and its shock analog Ritchtmyer-Meshkov (RM) instability are the two main
hydrodynamic instabilities associated with ICF studies. As an example of these
studies, here we summarize our main results on the analysis of RT instability growth
when a heavy flyer (velocity of 5 cm/μs) impacts another heavy and relatively thick
plane target at rest [57]. The hydrodynamics of the impact is simulated using a multi
group radiation hydrodynamic code. The growth of hydrodynamic instability at the
interface of target and flyer strongly depends on the inwards acceleration experienced
by the interface. We show in Fig. 9.11 the time profile of the acceleration at the
interface. We observe strong oscillations in the acceleration as is expected. We also
show in Fig. 9.12 the time profile of Froude number used in Betti’s formulation. We

74
0 1n 2n 3n 4n 5n0
255075
100125150175200
Fig. 9.9: Calculated hohlraum temperature.
1G
150G 100G H
ohlra
um T
emp.
(ev)
Time (sec.)
0.0 1.0x10⁻⁹ 2.0x10⁻⁹ 3.0x10⁻⁹ 4.0x10⁻⁹ 5.0x10-90
30
60
90
120
150
180
Fig. 9.10: Effect of mesh spacing on temperature.
ν=1.0
ν=1.05
ν=1.1
Hoh
lraum
Tem
p. (e
v)
Time (sec.)

75
0.0 2.0µ 4.0µ 6.0µ 8.0µ109
1010
1011
1012
1013
1014
Fig. 9.11: Time profile of interface acceleration.
Acc
eler
atio
n
Time (sec.)
0 2µ 4µ 6µ 8µ 10µ0
2
4
6
8
10
12
Fig. 9.12: Time profile of Froude Number.
Frou
de N
umbe
r
Time (sec.)

76
analyze the growth of any perturbation at the interface using the single-mode, plane-
wave perturbation model. Non-linear saturation is assumed to occur when the
amplitude of perturbation reaches a value of 50% of the mode wavelength. We
considered the most dangerous mode number K = 0.32. The modes of smaller wave
number grow slower while the larger wave number modes enter the non-linear
saturation regime. We used modified Takabe formula and Betti formulation to
calculate the growth rates. Time variation of the growth rate is shown in Fig. 9.13.
The solid and dotted lines respectively denote Betti’s and modified Takabe’s
formulas. The oscillations in the growth rate correspond to the oscillations in the
interface acceleration. After about 3 μs, stabilization is because of strong ablation
flow through the interface as result of its reverse motion. In the unstable period, the
two growth rates are nearly same while Takabe’s modified formula gives much lower
values as compared to Betti’s formulation at later times. Using these growth rates, the
growth of the perturbation with time was evaluated and we show in Fig. 9.14 time
evolution of perturbation. Also shown in this figure is the movement of flyer target
interface. No estimate is made for the initial non-uniformity and therefore we have
considered 3 cases. These cases assume initial perturbation amplitude of 1, 2 and 3 %
respectively. We note that up to about 3 μs, the amplitude is lower than the
compressed slab thickness for all the three cases indicating no danger. However, later
on the amplitude of perturbation becomes more than the compressed region for the
3% initial perturbation.
9.5 Equation of State (EOS) studies
EOS data is an important input to inertial confinement fusion, astrophysics and
hydrodynamic codes used for the simulations of high energy density experiments. The
recent laser driven shock experiments carried out at LLNL show that absolute
equation of state (EOS) data for materials in the range between 10-40 Mbar can be
obtained with desired accuracy. In the recent past, several experiments have been
conducted using direct drive method with impedance-matching technique that consists
of measuring the shock velocity in two different materials. This provided a method for
measuring an EOS point for one of the materials, using the EOS of the other material
as a reference. We performed detailed hydrodynamic simulations for various

77
0.0 2.0µ 4.0µ 6.0µ 8.0µ 10.0µ-4x10⁶
-2x10⁶
0
2x10⁶
4x10⁶
Fig. 9.13: Time profile of RT instability growth rate.
Gro
wth
Rat
e (/s
ec.)
Time (sec.)
0.0 2.0µ 4.0µ 6.0µ 8.0µ0
5
10
15
20
25
Fig. 9.14: Time evolution of interface perturbation.
3%
1%
K = 0.32Interface
Am
plitu
de (c
ms)
Time (sec)

78
combinations of elements. These results were verified in the laser driven shock wave
experiments at CAT for EOS studies of aluminum, gold, copper and uranium used in
planar foil target configurations. Nd: YAG Pico second laser chain is used for
generating shocks in the planar Al foils and Al + sample layered targets. EOS of Au,
Cu and U in the pressure range of 9-14 Mbar is obtained using impedance matching
technique. As an example, we show in Fig. 9.15 our results for Aluminum on gold
target [58-60]. Simulation results show that for the experimental laser irradiation (I =
1014 W/cm2; λ= 1.06 μm; pulse FWHM= 200 ps) the base material must be thicker
than 3.4 μm to reach stationary condition. We also noticed that the shock wave front
is reached a steady state condition at 250 ps after the start of the laser pulse and it
continued in this state till it breaks out from the rear surface at 300 ps. Similarly the
pressure profiles also indicated steady shock pressure conditions attained at 250 ps
after the start of the laser pulse and shock breakout at 300 ps. We have also simulated
for multilayer (Al +Au) targets. The target and laser specifications are as per our
experimental conditions. We find from our simulations that for layered targets (Al
+Au) the shock pressure gets enhanced by nearly a factor of 2 at the boundary of the
two materials. Experimental results show similar pressure enhancement in the
composite target of Al + Au (5 + 1.75 μm) due to impedance mismatch at the
boundary of the two materials. Shock pressure values are correct within an error of
15-18%. We have shown the feasibility of using a simple laser driven system (Nd:
YAG, 2 Joule, 1.06 μm, 200 ps) for EOS measurements of aluminum as reference
material at 4-7 Mbar pressures and then obtained EOS of gold, copper and Uranium in
thin layered targets at shock pressures in 9-14 Mbar range in layered targets. The
results are quite consistent with the theoretical as well as experimental data published
by other laboratories. We have adopted a ‘Quotidian’ equation of state code
MPQEOS developed at MPQ. The calculated Huguenot from this code as well as
isotherms for gold and isochors for aluminum are shown show in Figs. 9.16 to 9.18 as
examples of results from this code.
9.6 Hydrodynamics with ultra short lasers
We have developed a model for the interaction of ultra short high intensity
laser with high-density plasma. The model can calculate the absorption of laser light

79
20 40 60 80 10002468
10121416
Fig. 9.15: Space profile of ablation pressure.
Al-Au Interface
Au(1.75 μm)Al(5.0 μm)400 ps
300 250 200
150
100 50 ps
Pres
ssur
e (M
b)
Mesh Number
1 10 100108
109
1010
1011
1012
1013
1014
1015
1016
Fig. 9.16: Calculated isotherms of gold.
ISOTHERMS FOR GOLD
Pre
ssur
e (M
b)
Density (g/cc)

80
1 2 3 4 5 610-2
10-1
100
101
102
103
104
105
Fig. 9.17: Calculated shock adiabat forfew representative elements.
Calculated HugoniotU
Th
AlCH
AuP
(Mb)
ρ/ρ0
0.01 0.1 1 10 100 100010-8
10-6
10-4
10-2
100
102
104
Fig. 9.18: Constant density pressure contours.
Isochores for Aluminium
P (M
b)
Temperature (eV)

81
for s and p polarized wave incident at any angle. As example, we show in Figs. 9.19
and 9.20 the calculated absorption for two represented cases studied. Details of the
model and comparisons with experiments have been published elsewhere [61] and
therefore are not repeated here. Results are compared with various published
experimental results with a good agreement. The model is also coupled with radiation
hydrodynamics and it permits us to study the hydrodynamics of such interactions.
9.7 Laser Cluster Interaction Model
The interaction of high intensity laser with clusters has drawn considerable
attention since the mid 1990s. These van der Walls bonded clusters can be created by
the expansion of a jet of gas to vacuum. The cooling associated with the gas's
adiabatic expansion caused the gas to supersaturate and the atoms will nucleate in to
clusters. These targets while retaining the advantages of an overall low-density gas
and debris free operation offer very high local solid density, leading to strong laser
heating. Production of high-energy electron and ions, intense X-ray generation, fusion
reaction in deuterium clusters, high orders harmonic generations are few of the
potential applications. The most successful model to date for the laser cluster
interaction has been the Ditmire’s “nanoplasma” model. The model assumes that the
radial plasma density profile remains uniform during the expansion (“uniform density
model”). We have developed a new model for the interaction of intense lasers with
atomic clusters [62]. The model takes in to account the spatial non-uniformities of a
cluster as it evolves in time. The cluster is treated as a stratified sphere having
arbitrary number of layers. Electric and magnetic fields are obtained by solving the
Helmholtz equation. All components of electric and magnetic fields (incident and
scattered) are expanded in vector spherical harmonic functions. Expansion
coefficients are obtained using sufficient number of necessary boundary conditions at
layer interfaces by a recursive algorithm. Scattering and absorption cross sections are
obtained from the knowledge of expansion coefficients. As an example we show in
Fig. 9.21 the results for the radial profile of 600 angstrom radius argon cluster at
various times. The cluster is irradiated by 300 fs, 800 nm laser pulse having a peal
intensity of one peta watt/cm2. Time profile of laser pulse is also shown in this figure
by dotted line. Heating rate with different number of shells to model a 80 angstroms
radius argon cluster is shown in Fig. 9.22. Cluster is irradiated by 130 fs, 825 nm laser

82
0 20 40 60 800.0
0.1
0.2
0.3
0.4
0.5
0.6
0.7
Fig. 9.19: Absorption for 248 nm, 250 fs laser on Al.
S-polarized
P-polarized
Abs
orpt
ion
Angle in degree
1E11 1E12 1E13 1E14 1E15 1E160.0
0.1
0.2
0.3
0.4
0.5
0.6
0.7
Fig. 9.20: Absorption for 308 nm, 400 fs laser at 450 on Al.
S-polarized
P-polarizedAbs
orpt
ion
Peak Intensity (W/cm2)

83
having a peal intensity of 20 peta watt/cm2. Results of this model are compared with uniform density model predicting much higher absorption as compared to uniform density model.

84
Fig.9.21: Space evolution of cluster.
Fig. 9.22: Time evolution of heating rate

85
10.0 Experiments on laser-plasma interaction
10.1 X-ray and Ion emission studies from Cu-Au alloy target
In most of the experiments described below, the laser pulse had a maximum energy of
2Joules and a pulse duration variable from 300-800psecs. The laser pulse had a high
peak to background contrast. In large laser systems pre-pulses are frequently observed
before the arrival of main laser pulse. It is also common to have a weak background
on which the main laser pulse is seen to over ride. In such a condition, targets,
exposed to pre-pulses or background laser radiations can get ablated before the arrival
of the main laser leading to complex results. However, in our laser system, pre-pulses
were absent and peak to background contrast was more than 104. The focused
intensity on the target can be varied from 1013 to 1014 W/cm2. The plasma is formed in
the early rising part of the laser pulse, when intensity exceeds 1011W/cm2. The
remaining part of the laser pulse is absorbed in the plasma by various mechanisms and
heats the plasma to a temperature of 100 to 500 eV. The typical temperature and
density profiles in space and time have been simulated using a one dimensional
Lagrangian Hydrodynamic simulation code including radiation hydrodynamics and
are shown in Fig.10.1. Such a high temperature, high density plasma is a strong
source of broadband, incoherent x-rays, hot electrons and fast ions. We have
characterized the x-ray emission as well as ion emission from targets with varying
atomic numbers. Scaling of X-ray emission with laser intensity has been recorded for
simple metallic and metallic alloys of 1mm thickness, using the X-ray pin diodes
placed at 450 with respect to target normal. Fig. 10.2 shows the comparison of X-ray
emission from pure copper and gold targets with that of an alloy of copper and gold
(0.47Au+0.53Cu - atomic composition). It was observed that for an incident laser
energy of 1.4 J, there was a 10 fold and 2 fold enhancement in X-ray emission from
the Au+Cu mixed target as compared to pure copper and gold targets respectively in
the spectral region 2.5Å- 5Å; 5 fold and 1.5 fold increase respectively in the spectral
region 1Å-2.5Å [63]. Motivation for these experiments was derived from the reports,
which showed that when two more elements are mixed such that the high opacity
region of one element overlaps with the low or opacity region of the other, the
mixture will have higher mean opacity compared to that of the individual elements. A
higher opacity reduces conduction loss and leads to a higher re-emission of absorbed

86
radiation, thus, increasing the overall coupling efficiency between the laser and target.
Recently, cocktail targets, which are combinations of elements- Au-Gd, Au-Sm, Au-
Nd, Au-Cu etc have been proposed [64-66] for the hohlraum cavities used in Inertial
Confinement Fusion studies with intense lasers. It has been shown that a 50% increase
in the hohlraum wall opacity results in a 12% lower laser energy requirement to attain
the same hohlraum temperature [67]. Interesting features have been observed in the
ion dynamics of such mixed targets also. Ion velocity and ion current and their
angular distribution have been measured using array of Langmuir probes and Faraday
cups placed at 130, 300, and 450 with respect to target normal. Fig.10.3 shows the ion
current recorded by Langmuir probe. It is clearly observed that the peak current in a
mixed target is about 1.3 times higher than in copper and 3.37 times high as compared
to gold. The ion velocity should have been the highest for copper targets considering
its low mass and lowest for gold target because of its higher atomic mass. The average
ion velocity for the mixed targets should have been somewhat in between. However,
it is seen that the average ion velocity in case of the mixed target is about 1.4 times
higher as compared to copper target and almost 2 times compared to gold [68]. This
can be an indication towards a higher plasma temperature, perhaps leading to an
enhanced x-ray conversion in plasmas from mixed targets.

87
90 95 100 105 110
0.1
1
10
100
X (μm)
E = 0.2 J
Ion
Tem
p. (E
V)
90 95 100 105 110
0.1
1
10
100
1000
X (μm)
750 500250
100 ps
E = 2 J
90 95 100 105 110
0.1
1
10
E = 0.2 J
Den
sity
(g /c
c)
X (μm)90 95 100 105 110
0.1
1
10
E = 2 J
X (μm)
Fig. 10.1. Spatial profiles of ion temperature and density for laser energy 0.2 Joule and 2Joules.

88
Fig 10.2.Comparison of X-ray emission pure cu and Au with that of Cu +Au alloy
Fig.10.3. Ion current recorded by Langmuir probe.
200 400 600 800 1000 1200 1400 1600 1800 2000 2200
1
2
3
goldNi CuNi MixSNi MixPNi Data1goldNi Data1CuNi Data1MixSNi Data1MixPNi
x-ra
y di
ode
sign
al (a
.u.)
Laser Energy (mJ)
filter - 5micron Nilaser pulse suration- 500psec
200 400 600 800 1000 1200 1400 1600 18000
5
10
15
20
25
30
35
40
45
50
55
60
65
X-r
ay d
iode
sig
nal (
a.u.
)
Laser Energy (mJ)
GoldTiS GoldTiP MixTiS MixTiP Data1GoldTi Data1GoldTi Data1MixTiS Data1MixTiP
filter - 12 micron Tipulse duration - 500 psec
-500 0 500 1000 1500 2000 2500 3000 3500-2
0
2
4
6
8
10
12
14
16
18
Ion
curr
ent (
mA
)
Time (nsec)
mix gold copper
laser energy 1.0Jangle of probe 130 from target normal

89
10.2 Nano Ion emission from copper targets with a copper –nano-particle
layer
It has been proposed by some authors that, targets having surface nano-
structures can lead to a better coupling of laser light through surface plasmons. Most
of these studies have been made with sub-picoseconds laser pulses in the laser
intensity range of 1015 to 1016 W/cm2. In our experiments, we are using a laser pulse
duration three orders of magnitude larger in a lower intensity range. Whereas, other
authors have indicated enhancement of laser absorption in nano-particle coated targets
by measuring X-ray emission in soft or hard region, we have come to this conclusion
by monitoring the ion flux emitted from the plasma. Ion flux measurement is more
directly related to laser absorption than observing X-ray emission in a limited spectral
region. The scaling of ion densities and ion velocities with laser pulse energy for two
polarizations are shown in Fig. 10.4. In conclusion we can say that nano-particle
coating on plane targets of high Z materials can lead to better laser absorption for P
polarized light for sub-nanosecond pulse duration [69, 70].

90
Fig. 10.4. Scaling of ion densities and ion velocities with laser pulse energy for two polarization measured by set three of Langmuir probe placed at various angles.
0 200 400 600 800 1000 1200 1400 1600 1800 2000 2200
0
500
1000
1500
2000
2500
3000 S -pol, 500 psec
Lang
mui
r pro
be s
igna
l (m
V)
Laser Energy (mJ)
Cunano13 Cunano30 Cunano55 Cu13 Cu30 Cu55
200 400 600 800 1000 1200 14000
200
400
600
800
1000
1200
1400
1600
1800
2000
2200
Lang
mui
r pro
be s
igna
l (m
V)
Laser Energy (mJ)
V10Copperna v30copperna v50copperna v10copper v30copper v50copper
320 psec, S- pol
0 200 400 600 800 1000 1200 1400 16000
200
400
600
800
1000
1200
1400
1600
P-Pol, 500 psec
Lang
mui
r pro
be S
igna
l Am
plitu
de(m
V)
Laser Energy (mJ)
nano10degre nano30degre nano55degre Cu10 Cu30 Cu55
0 200 400 600 800 1000 1200 14000
200
400
600
800
1000
1200
1400
1600
500 psec, S and P- PolNano copper
Lang
mui
r pro
be s
igna
l am
plitu
de (m
V)
Laser Energy (mJ)
CunanoP13 CunanoP30 CunanoP55 CunanoS13 CunanoS30 CunanoS55
0 200 400 600 800 1000 1200 1400 16000
200
400
600
800
1000
1200
1400
1600
500 psec S and P pol
Lang
mui
r pro
be s
igna
l am
plitu
de (m
V)
Laser Energy (mJ)
CuS10 CuS30 CuS55 CuP10 CuP30 CuP55

91
10.3 Thermo luminescent dosimeters absolute measurement of X-rays from
laser produced plasma
Measurement of the absolute brightness of X-ray or soft X-ray (SXR) sources
such as laser-produced plasmas, play an important role in complete characterization of
such a source. Calibrated detectors are required when both the conversion efficiency
of laser radiation into X-ray radiation and the absolute spectral brightness are needed.
If time integrated doses of X- rays are to be measured, TLDs can be applied with an
advantage.
The X-rays generated were measured using powder CaSO4: Dy (grain size
varying from 53 -150μm) thermo luminescent dosimeter with the various filters -
polycarbonate (transmission-> 1KeV), B-10 (transmission >700eV), 2µm Al
(transmission 0.8-1.56Kev, >2.1Kev), 5µm (transmission >2.5Kev) Al, and 10µm
(transmission > 4Kev) filters. The CaSO4: Dy (0.05 mole %) phosphor prepared by
recrystallization technique was used to detect the X-rays generated in high power
lasers. The CaSO4: Dy phosphor exhibits dominant TL peak around 220 oC with a
small TL peak around 100 oC. The powder was annealed at 400 oC for 1 hour to erase
any residual TL. The thermo luminescence spectrum was recorded using indigenously
developed TL reader at BARC, which have facility of data acquisition and is
computer controlled. The heating rate was kept at 4 0C/s. The glow curves (as shown
in Fig. 10.5.) were recorded during read out of the TLDs and the area under the glow
curve gives a measure of X-ray dose. The X-ray doses to the TLD placed at a distance
of 80mm from the plasma, with the filters B-10, 2µm Aluminium and 6µm
polycarbonate, 5µm Aluminium and 12µm Aluminium for a single laser shot are
respectively- 287.1 mGy, 131.5 mGy and 96.2 mGy, 21.42 mGy and 9.05 mGy
respectively [71, 72].
It is very clear from the data observed the x-ray emission from laser- produced
plasma is more in longer wavelength region and decreases very rapidly for lower
wavelength.
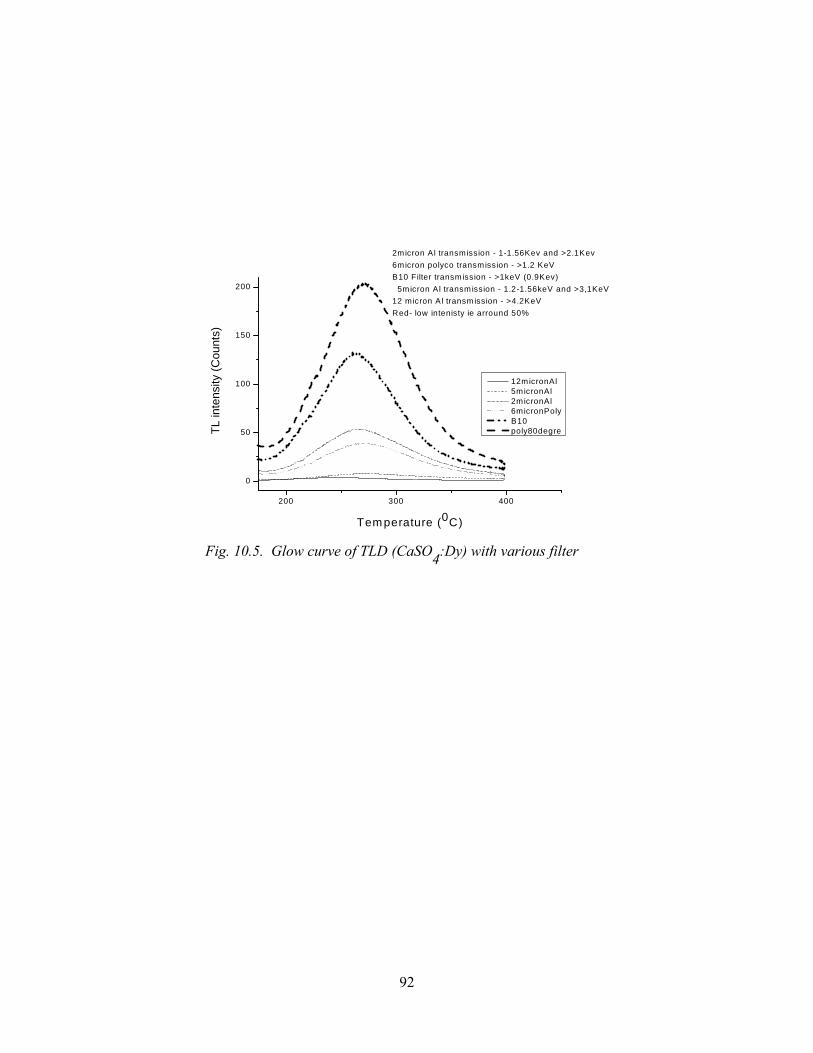
92
200 300 400
0
50
100
150
200
2micron Al transmission - 1-1.56Kev and >2.1Kev6micron polyco transmission - >1.2 KeVB10 Filter transmission - >1keV (0.9Kev) 5micron Al transmission - 1.2-1.56keV and >3,1KeV12 micron Al transmission - >4.2KeVRed- low intenisty ie arround 50%
TL in
tens
ity (C
ount
s)
Temperature (0C)
12micronAl 5micronAl 2micronAl 6micronPoly B10 poly80degre
Fig. 10.5. Glow curve of TLD (CaSO4:Dy) with various filter

93
10.4 Effect of focal position on x-ray and ion emission with low and high Z targets
The experiments were performed with our home built Nd: Glass laser system
(λ=1.06µm), which is capable to produce 12J. The laser system was operated in a
single shot mode with maximum energy of 2J per pulse and pulse duration of 500
psec. High power laser focused in a chamber evacuated to 4x10⁻⁵ mbar of the intensity
of the order of 1012 to 5 x 10¹³ W/cm2. Laser was incident normal to the target.
Diagnostics of the ion flux are based on time-of-flight methods (Ion collector) and x-
ray semiconductor diodes were used for x-ray flux measurement. An indigenously
developed pinhole camera with 25 µm resolution is placed at 900 to the target normal
with the magnification of 10 shown in Fig. 10.6a. Pinhole camera having film
detection as well as online detection in combination with a phosphor screen (P 11
phosphor coated on fiber optic plate) and intensifier and its driving electronics was
used. In our experiments we have used online monitoring of the x-ray from laser-
produced plasma as film based camera require change of film. The ion collector was
placed at 450 with target normal at a distance of 47cm and x-ray detectors were placed
at 450 with respect to target normal at a distance of 43 cm (cover with soft x-ray filter)
and 67cm (cover with hard x-ray filter). A B10 filter was used on XUV 100 x-ray
detector for soft x-ray (>0.7 keV) measurement and a 12micron Ti filter on
100PIN250 detector for harder x-ray (3.2 -4.96 keV) measurement.
Some main observation and discussion from these studies can be summarized as
follows
• Soft x-rays show a decrease towards best focus (Fig. 10.7). This is because of the
total volume of the plasma is less and resulting a minima near best focus. However,
the hard x-rays show a peak emission close to the best focus. This is because close
to the focus intensity is high which create suprathermal electrons. Suprathermal
electrons form only a minor portion of soft x-rays, but they do produce enough
hard x-rays.
• Fast ion current as well as velocity increases as we move towards best focus (Fig.
10.8). It is seen that the ion current shows several peaks with different energy
(67keV to 250 keV) due to different charge states of ions (Fig. 10.10).

94
• It is also seen from the figure 10.11 that as we move towards the best focus
position the peaks of the faster ions group are dominating.
• However thermal ion flux and velocity shows only very slight variations the
focusing geometry changes (Fig. 10.9).
• The Pinhole camera images (Fig. 10.6b) of the plasma plum shows that as we are
far from the best focal position the volume of x-rays are more and the intensity is
low which explain an increase in soft x-rays. However, at the best focus the
volume is small and intensity is much higher as it is showing the saturation (white
part), which is the reason for an increase in hard x-rays.
At higher laser intensities, some part of the laser energy absorbed in the plasma can be
transferred to a small number (1%) of fast electrons accelerated by Langmuir
electrostatic wave due to resonance absorption or parametric instabilities.
Suprathermal electrons form only a minor portion of soft x-rays, but they do produce
enough hard x-rays and the fast ion components. The hard x-ray spectrum provides
information on the fast electrons produced in the plasma radiating in the high-density
regions. Hot electron temperature is strongly reduced (as well as hard x-ray amplitude
and number of fast ions), when using low laser intensities.
The two humps (two maxima) in x-ray dependence on the focus position FP
reflect the essential part of (soft) x-ray radiation with the lower photon energy (<3
keV). The single peak only usually represents the (harder) x-ray radiation with the
much higher photon energy (>3 keV). It is quite clear that the position of Harder x-
ray maximum will be close to FP = 0, where also the TH should be at maximum [73,
74].

95
Fig. 10.6a. Schematic of on line Pinhole camera assembly.
Fig. 10.6b. Pin-hole camera record of x-rays emission at various focusing positions.

96
Fig. 10.7. Effect of focal position variation on soft and hard x-rays.
-10 -8 -6 -4 -2 0 2 4 6 80.20.30.40.50.60.70.80.91.01.11.21.31.41.51.61.71.81.9
X-ra
y si
gnal
am
plitu
de (a
.u.)
Foca l position va ria iton (m m )
H ard x -ray
S o ft x -ray
Fig. 10.8. Effect of focal position variation on fast ion velocity and amplitude.
-10 -8 -6 -4 -2 0 2 4 6 8 100
2
4
6
8
10
12
140 2 4 6 8 10
Ion
velo
city
( x1
07 cm/s
ec)
Fast
ion
ampl
itude
(mV
)
focal position (mm)
Fast ion velocity fast ion amplitude
0
2
4
6
8
10
12
14
Fig.10.9. Effect of focal position variation on thermal ion velocity and amplitude.
-10 -8 -6 -4 -2 0 2 4 6 80
2
4
6
8
10
12
14
16
18
200 2 4 6 8 10
0
2
4
6
8
10
12
14
16
18
20
Ther
mal
ion
velo
city
(x10
6 cm
/sec
)
Ther
mal
ion
curr
ent (
a.u.
)
Focal position variation (mm)
Ampl velocity

97
0.0 2.0x10⁻⁷ 4.0x10⁻⁷ 6.0x10⁻⁷ 8.0x10⁻⁷ 1.0x10-60.00
0.02
0.04
0.06
0.08
0.10
Ion
colle
cote
r am
plitu
de (V
)
TOF ( sec)
Gold Plasma signal
0.0 2.0x10⁻⁶ 4.0x10⁻⁶ 6.0x10⁻⁶ 8.0x10⁻⁶ 1.0x10-50.00
0.02
0.04
0.06
0.08
0.10
Ei= 0.7keV
Ion
colle
ctor
sig
nal (
V)
TOF (μs)
(Ei = 149 keV)
Ei= 19.3 keV
Fig.10.10. Ion collector record of ion emission at best focus. Splitting of fast ions groups (inset).
Fig. 10.11. Effect of focal position variation on ion emission
0.0 2.0x10⁻⁷ 4.0x10⁻⁷ 6.0x10⁻⁷ 8.0x10⁻⁷ 1.0x10⁻⁶ 1.2x10⁻⁶ 1.4x10⁻⁶
0.00
0.05
0.10
0.15
0.20
0.25
-1 mm
+8 mm+7 mm+6 mm
+3 mm+4 mm
+5 mm
+2 mm
Ion
ampl
itude
(V)
Time-of-flight (sec)
0 mm
+1 mm

98
10.5 Effect of focal position on line emission of copper plasma
The experiments were performed with our home built Nd:glass laser system
(λ=1.06µm) which is capable to produce 12J. The laser system was operated in a
single shot mode with maximum energy of 3.5 J per pulse and pulse duration of 500
psec. High power laser focused in a chamber evacuated to 4x10⁻⁵ mbar of the intensity
of the order of 1012 to 9 x 10¹³ W/cm2. Laser was incident normal to the target.
Diagnostics of the ion flux are based on time-of-flight methods (Ion collector). Silicon
semiconductor diodes (PIN diode, 100PIN250, by Quantrad Corporation, USA and
XUV100, by UDT sensor) were used for x-ray flux measurement. An indigenously
developed x-ray crystal spectrometer based on TAP crystal placed at 450 is used for
the line emission studies of copper plasma. For online detection a combination of a
phosphor screen (P 11 phosphor coated on fiber optic plate) and intensifier and its
driving electronics is used. The detector unit was mounted with a flange having a
tapered angle of 180 and was connected to vacuum chamber port flange. The target
was fixed on motorized z-stage which is having a movement of 12 mm. The vertical
movement helps us to measure the x-ray spectrum over a broad spectral range. By
changing the crystal height, the spectrograph is able to cover a wavelength range of
7.1–10.3 Å, with a spectral resolution of 34 mÅ limited by the source size. Two
aluminized polycarbonate foils (Alexander Vacuum Research, Inc., trade name: B-10)
having 1/e cutoff of 0.7 keV were used to prevent any scattered light in the plasma
chamber from coupling to the phosphor screen. In a single shot, the spectrometer can
cover a spectral range of 1.5 Å. The crystal angle was adjusted at a fixed value so that
it can generate the spectrum of the range of 7.7 – 9 Å on the useful area of the
detector. The ion collectors FC1 was placed at (450, 100) with target normal at a
distance of 47.7 cm and FC2 was placed at (450, 350) with target normal at a distance
of 54.7 cm. To measure the soft x-rays, the AXUV detector cover with B10 filter
(transmission >0.7 keV) was placed at angle (θ = 450, φ = 550) with respect to target
normal at a distance of 40 cm and other AXUV cover with 2 μm Al filter
(transmission (0.7-1.56 keV and >2.1 keV) was placed at angle (θ = 450, φ= 800) with
respect to target normal at a distance of 36.2 cm. For harder x-ray measurement a
100 PIN 250 detector cover with 12micron Ti filter (transmission 3.2 -4.96 keV) was
place at (450, 00) and at a distance of 65 cm.

99
Observation: Experiments was carried out on polished copper target to studies the
effect of focal position on the x-rays (bremsstrahlung as well as line emission) and ion
dynamics of copper plasma under intense laser [75].Main result of these studies can
be summarized as follows.
• From figure 10.12 it is observed that, soft x-rays show a decrease towards best
focus. This is because of the total volume of the plasma is less and resulting a
minima near best focus. However, the hard x-rays show a peak emission close
to the best focus. This is because close to the focus intensity is high which
create suprathermal electrons. Suprathermal electrons form only a minor
portion of soft x-rays, but they do produce enough hard x-rays.
• X-ray spectrum measured by crystal spectrometer is shown in figure.10.13.
For a fixed value of the incident angle the spectrum recorded from the detector
is 7.8 to 9 Å. We have taken few lines from the spectrum at wavelength λ =
7.98Å, λ = 8.06Å and λ = l=8.33Å and studied the effect of focal position
variation as shown in figure 10.14. It has been observed that the line emission
also decrease close to best focus.
• Peak ion current decreases as we reach towards the best focus as shown in
figure 10.15 at the same time the ion velocity (i.e. ions kinetic energy)
increases shown in figure 10.16. This is also indicating that as we will reach
towards the best focus plasma volume decreases but the laser intensity
increase and hence the kinetic energy of the ions increases.
• Figure10.17 shows the effect of focal position on ion emission. As away from
best focus the total number of ions are more (area under curve) and are
decreases as we move towards best focus position. Also, the peak of the ion
collector (IC) signal profile is shifting towards the shorter time-of flight means
higher velocity and hence the higher kinetic energy.

100
-10 -9 -8 -7 -6 -5 -4 -3 -2 -1 0 1 2 3 4 5 6 71
10
X-ra
y si
gnal
(a.u
.)
lens position (mm)
AXUVB10 AXUVAl PINTi
31-10-07 copper target
Figure 10.12. Effect of focal position on soft (with B10 and 2 micron AL filter) and Hard (12 micron Ti filter) x-ray
-9 -8 -7 -6 -5 -4 -3 -2 -1 0 1 2 3 4 5100
150
200
250
300
350
400
450
500
550
600
Line
inte
nsity
(a.u
.)
focal position(mm)
λ=7.98Α λ=8.06Α λ=8.33Α
Figure 10.13. Effect of focal position variation on line emission.

101
7.8 8.0 8.2 8.4 8.6 8.8 9.0100
200
300
400
500
600
2s2
2p6 -
2s2p
5 5d (1 S
- (3/
2, 5
/2)
2s2
2p6 -
2s2p
5 4p (1 S
- (1/
2, 1
/2))
2s2
2p6 -
2s2p
5 4p (1 S
- (1/
2, 3
/2))
2s2
2p6 -
2s2p
5 5d (1 S
- (1/
2, 3
/2)
2s2
2p6 -
2s2p
5 6d (1 S
- (3/
2, 5
/2))
X-r
ay In
tens
ity
Wavelength (Α)
2s2
2p6 -
2s2p
5 6d (1 S
- (1/
2, 3
/2)
Copper spectrum
Fig. 10.14. Spectrum of copper plasma recorded by TAP crystal.

102
-10 -8 -6 -4 -2 0 2 4 6
100
1000
Ion
ampl
itude
(mV)
focal position (mm)
FC1Amp FC2ampl
31-10-07 copper target
Figure 10.15. Effect of focal position on ion amplitude.
-10 -8 -6 -4 -2 0 2 4 62.5
3.0
3.5
4.0
4.5
5.0
5.5
6.0
FC1velocity FC2velocity
Ion
velo
city
(x10
7 cm
/sec
)
Focal position (mm)
31-10-07 copper target
Figure 10.16. Effect of focal position on ion velocity.

103
0.0
0.4
0.8
1.2
1.6
0.0 2.0x10⁻⁶ 4.0x10⁻⁶
X Axis
0-1-2-3-4-5-6-7
1234567
Am
plitu
de (V
)
TOF (sec)
Foca
l pos
ition
(mm
)
Figure 10.17. Effect of focal position variation on the ion current density.

104
11.0 Conclusion
In conclusion, a 40 GW peak power Nd: Glass laser system has been
indigenously designed, developed and operated successfully over a long period of
time. The laser system works with 90-95% reliability. This laser system consists of
commercial oscillator, five linear stages of amplifiers, one spatial filter, one relay and
two Faraday Isolator units. The laser thus able to generate a focused intensity of the
order of 1014- 1015 W/cm2 with focal diameter of 100μm. This laser is designed for
both types (x-ray and ion generation studies and laser driven shock studies) of
experiments. The experimental chamber is equipped with many laser plasma
diagnostics. This system is being used for variety of laser plasma experiments by
changing various parameters such as x-ray and ion emission enhancements using
alloy target, effect of nano-structured target in x-ray and ion emission, effect of focal
position on x-ray and ion emission. To validate the experiments theoretical
simulations have been carried out.
Acknowledgement
The authors wish to acknowledge and express their gratitude to the continuous
encouragement and support extended by Dr. S. Kailas, Associate director (N), Physics
Group and Dr. V. C. Sahni, Director, Physics Group. Authors acknowledge Professor
P. Ayyub and his team at Tata Institute for Fundamental Research for providing
nanoparticle coated metal targets. Authors also acknowledge Dr. Munish Kumar and
Dr. R. K. Kher of Radiological Physics and Advisory Division, BARC for their
support for providing TLDs used in the experiments and data interpretation. Authors
wish to thank Shri C. P. Navathe and Shri M. S. Ansari of LESS, RRCAT for their
valuable discussions while designing and testing of the high voltage power supplies.
The on EOS discussed in section 9.5 was carried out at RRCAT.

105
References
1. D. C. Brown, springer Verlag, New York, 1981.
2. Laser Program Annual Report UCRL-50021-77, LLNL, 1977.
3. Special Issue on NIF, UCRI-LR-105821-97-3, LLNL, 1997.
4. LLNL, ICF program Annual Report 1988/89, UCRL-LR-105820-88/89.
5. C. Yamanaka et al., IEEE, Jr. Quant. Electr. QE-17, 1639 (1981).
6. Central Laser Facility Annual report, Rutherford Appleton Laboratory, UK,
1992, 93, 94, 95.
7. C. P. Verdon, Bull. Am. Phys. Soc. 38, 2010 (1993).
8. S. E. Bodner, D. G. Colombant, J. H. Gardner, R. H. Lehmberg, S. P.
Obenschain, L. Phillips, A. J. Schmitt, J. D. Sethian, R. L. McCrory, W. Seka,
C. P. Verdon, J. P. Knauer, B. B. Afeyan, and H. T. Powell, Phys. Plasmas 5,
1901 (1998).
9. J. D. Lindl, Phys. Plasmas 2, 3933 (1995).
10. L. Laska et al., Appl. Phys. Lett. 65 691 (1994).
11. E. Woryna et al., Appl. Phys. Lett. 69 1547 (1996).
12. J. Krasa et al., Laser Part. Beams. 16 5 (1998).
13. F.P. Boody, R. Höpfl, and H. Hora, Laser Part. Beams, 14, 443 (1996).
14. E. Woryna, J. Wolowski, B. Kralikova, J. Krasa, L. Laska, , M. Pfeifer, K.
Rohlena, J. Skala, V. Perina, F. P. boody, R. Hopil, and H. Hora, Rev. Sci.
Instrum. 69, 949 (1998)..
15. G. Mourou et al., Phys. Fluids, B 4 2315 (1992).
16. R. J. Trainor et al., Phys. Rev. Lett. 42, 6188 (1979).
17. F. Cottet et al., Appl. Phys. Lett. 47, 678 (1985).
18. L. Vesser, Phys. Rev. Lett. 40, 1391 (1978).
19. N. C. Woolsey et al., Annual Report of Central Laser facility, RAL, 67 (1994).
20. L. J. Dhareswar et al., Laser Part. Beams 15, 297 (1997).
21. A. Ng et al., Phys. Rev. Lett. 54, 2604 (1985).
22. Dhareshwar et al, shock wave 14, 231 (2005)
23. LLNL report of plasma diagnostics, H. G. Ahlstrom, UCRL 53106 (1982).

106
24. W. Koechner. ‘Solid State Laser Engineering”.Vol.1 5th Ed. P-54, Springer-
Verlag. 1999.
25. D.Duston: IEEE.J.QE-6, 3(1970).
26. M.Michon.Phys.Letter.19, 219 (1965).
27. R. Dumanchin: IEEE. J.QE-7, 53 (1971).
28. D. C. Brown. “High Peak power Nd: Glass laser Systems”.p-4, Springer Verlag
(1981): O. K. Deutschbein et al. IEEE J. Quantum Electronics QE-4, 48 (1968).
29. W. Koechner. “Solid State Laser Engineering”.Vol.1, 5th Ed. P-153, Springer-
Verlag (1999).
30. W. Kochner. “Solid State Laser Engineering” Springer –verlag. NewYork. p.
441, vol.1, 5th Ed, 1999.
31. W.Kochner. “Solid State Laser Engineering” Springer –verlag.
NewYork.p.443, vol.1, 5th Ed, 1999.
32. Prabha Venkatesh and C. R. Prasad, “B. A. R. C. symposium on quantum
Electronics” Jan.14-16 (1985)
33. W. Kochner. “Solid State Laser Engineering” Springer –verlag.
NewYork.p.386, vol.1, 5th Ed, 1999.
34. A. Chowdhury et el National Laser Symposium, IIT Madras, Feb 17-19, 1993
35. J. H. Gonez, P. B. Newell: J.Opt. Soc.Am. 56, 87 (1966)
36. J. H. Gonez ,W. J. Mitchell: IEEE J. QE-3, 330 (1967)
37. W. Kochner. “Solid State Laser Engineering” Springer –verlag.
NewYork.p.302, vol.1, 5th Ed, 1999.
38. W. Seka et al UK LLE Report No. 90 June 1979.
39. K. Nishikawa, J. Phys. Soc. Japan 24, 916 (1968)
40. P. K. Kaw and J. Dawson, Phys. Fluids 12, 2586 (1969).
41. W. Kruer and J. Dawson, Phys. Fluids 15, 446 (1972).
42. LLNL, Laser Program Annual Report, 1974. PP- 160.
43. J. S. Uppal, B. L. Gupta B. S. Narayan and D.D. Bhawalkar, BARC report
(BARC/I-585), 1980.
44. S. Chaurasia, C. G. Murali, S. M. Diwakar, L. J. Dhareshwar, R. Vijayan, A. C.
Shikalgar and B. S. Narayan, NLS 2005, VIT, Vellure, India.
45. C. F. Padula and C. G. Young IEEE J. Quantum Electronics QE-3, 483 (1967).
46. J. N. Powell, B. Crasemann, Quantum Mechanics, pp. 351.
47. L. Harvey, A. White, Fundamental of optics.

107
48. Montgomery D. B., Robert E. Krieger publishing Co. New York IIed. (1980).
49. S. Chaurasia et al., BARC news letter, issue 287, 2 (2007).
50. N. K. Gupta and B. K. Godwal, ‘Effects of non-local thermodynamic
equilibrium conditions on numerical simulations of inertial confinement fusion
plasmas’, Pramana-J. Physics, 59, 33-52, (2002).
51. N. K. Gupta and B. K. Godwal, ‘Effects of various parameters on numerical
simulations of inertial confinement fusion Hohlraum and radiation
hydrodynamics.’ Laser and Particle Beams, 19, 259-265 (2001).
52. J. A. Chakera, V. Arora, S. Sailaja, N. K. Gupta, S. R. Kumbhare, P. A. Naik,
P. D. Gupta, and B. K. Godwal, ‘Dependence of soft x-ray conversion on
atomic composition in laser-produced plasma of gold-copper mix-Z targets,
Appl. Phys. Lett., 83, 27-29, (2003).
53. N. K. Gupta and Vinod Kumar, ‘Angular dependence of M and N band
radiation and the effect of angular anisotropy on the conversion efficiency of x
rays emitted from a laser irradiated gold foil’, Laser and Particle Beams 13,
389-402 (1995).
54. N. K. Gupta and S. V. Lawande, ‘Rayleigh-Taylor instability in spherical
geometry’, Phys. Rev. A33, 2813-2816 (1986).
55. N. K. Gupta and S. V. Lawande, ‘Rayleigh-Taylor instability in multi-
structured spherical targets’, Plasma Phys. Controlled Fusion 28, 925-941
(1986).
56. N. K. Gupta and S. V. Lawande, ‘Effect of density gradients on Rayleigh-
Taylor instability in an ablatively accelerated inertial confinement fusion
target’, Plasma Phys. Controlled Fusion 28, 267-278 (1986)
57. N. K. Gupta, ‘Growth of Rayleigh-Taylor Instability at Interface Between a
Target and a Flyer’, Paper presented at 29th European Physical Society (EPS)
conferences on plasma physics and controlled fusion, Montreux, Switzerland,
June 17-21, (2002).
58. Mayank Shukla, Yogesh Kashyap, P.S.Sarkar, A. Sinha, H.C.Pant*, R.S.Rao,
N.K.Gupta, V. K. Senecha and B.K.Godwal, ‘Laser Induced Shock Pressure
Multiplication in Multi Layered Thin Foil Targets’, Nucl. Fus. 46, 419-431
(2006).
59. M. Shukla, H. C. pant, V. K. Senecha, V. N. Rai, P. Khare, A. K. Verma, R. S.
Rao, N. K. Gupta and B. K. Godwal, ‘Equation of state study of copper using

108
laser-induced shock near 10 Mega bar pressure and revalidation of theoretical
modelling.’ Current Science, 85, 802-808, (2003).
60. H. C. pant, M. Shukla, V. K. Senecha, S. Badyopadhyay, V. N. Rai, P. Khare,
R. K. Bhat, B. K. Godwal, and N. K. Gupta, ‘Equation of state studies using
laser-driven shock wave propagation through layered foil targets.’ Current
Science, 82, 149-157 (2002).
61. Amol R. Hotkundkar, N. K. Gupta and L. J. Dhareshwar, ‘Hydrodynamic
Investigations of Intense sub pic osecond laser mater interaction’, IEEE
transactions on plasma science, 34, 2572-2578, (2006).
62. Amol R. Hotkundkar and N. K. Gupta, ‘Role of radial non-uniformities in the
interaction of intense laser with atomic clusters’ Phys. Plasma, 15, 13105
(2008).
63. Chaurasia, et.al, J. Appl. Phys. 03, 13307 (2008)
64. N. K. Gupta and B. K. Godwal, Laser and particle beams 19, 259 (2001).
65. H. Nishimura, T. Endo, H. Shiraga,Y. Kato, Appl.Phys Lett 62, 1344 (1993).
66. D. Colombant, M. Klapisch and A. Barshalom, Phys. Rev. Lett. 57, 3411
(1998).
67. T. J. Orzechowski, M. D. Rosen, H. Kornblum, J. L. Porter, L. J. Suter, A. R.
Thiessen and R. J. Wallace, Phys. Rev. Lett. 77, 3545 (1996).
68. S. Chaurasia, et al., Radiation Effects and Defects in Solids 163, 1 (2008)
69. S. Chaurasia et al., 3rd Moscow Workshop on Targets and Applications, 15 - 19
October, 2007 Moscow, Russia.
70. S. Chaurasia et al., Laser Part. Beams (Submitted)
71. S. Chaurasia et al., National conference of plasma physics (PLASMA 2006)
72. S. Chaurasia et al., manuscript under preparation
73. S. Chaurasia et al., National conference of plasma physics (PLASMA 2007).
74. S. Chaurasia et al., manuscript under preparation.
75. S. Chaurasia et al., manuscript under preparation.