optimization of a multi-ring detector for ps time of flight - iopscience
TRANSCRIPT

Journal of Physics Conference Series
OPEN ACCESS
Optimization of a multi-ring detector for Ps time offlight measurementsTo cite this article L Di Noto et al 2013 J Phys Conf Ser 443 012074
View the article online for updates and enhancements
You may also likeFrom laboratory experiments to LISAPathfinder achieving LISA geodesicmotionF Antonucci M Armano H Audley et al
-
LISA Pathfinder data analysisF Antonucci M Armano H Audley et al
-
LISA Pathfinder mission and statusF Antonucci M Armano H Audley et al
-
This content was downloaded from IP address 1184122457 on 26122021 at 1335
Optimization of a multi-ring detector for Ps time of flight measurements
L Di Noto13
M Benetti2 S Mariazzi
1 G-F Dalla Betta
2 and R S Brusa
1
1Dipartimento di Fisica Universitagrave di Trento and INFN Gruppo collegato di Trento
Via Sommarive 14 I-38123 Povo Trento Italy 2Dipartimento di Ingegneria e Scienza dellrsquoInformazione Universitagrave di Trento and
INFN Gruppo collegato di Trento Via Sommarive 14 I-38123 Povo Trento Italy
E-mail dinotoscienceunitnit
Abstract We have designed a multi-ring detector (MRD) based on Bismuth Germanate
(BGO) crystals coupled to Silicon PhotoMultipliers (SiPM) for measuring the Ps time of flight
(TOF) The set-up geometry was optimized by Monte Carlo simulations to take into account at
different Ps velocities (i) the background noise due to backscattered positrons (ii) the cross-
talk between adjacent detectors (iii) the lifetime of Ps decay Three parameters were defined to
evaluate the different configurations and a figure of merit was obtained This allows the choice
of the best set up configuration for measuring Ps emitted with a particular energy range
optimizing the signal to noise ratio and keeping the acquisition time acceptable
1 Introduction
A TOF apparatus to investigate Ps cooling by measuring the energy distribution of Ps emitted from
porous materials was developed in Trento [1] and it is being set up at the NEutron induced POsitron
Source MUnich (NEPOMUC) [2] The system was realized to work with continuous e+ beams The
secondary electrons ejected by the e+ entering the sample are used as start signal as recorded by two
channeltrons The stop signal is given by the Ps annihilation rays observed by detectors placed at a
known distance z from the sample surface In order to improve the efficiency of this apparatus we
designed a 4-ring detector where each ring is separated from another ring by tungsten shields A multi-
ring detector MRD allows the acquisition of simultaneously TOF spectra at different distances Since
the MRD requires small size detectors BGO crystals with 4x4x10 mm3 dimensions coupled with
SiPMs were considered [3]
2 Monte Carlo Simulations and results
To take into account the increasing of the noise caused by background signal from the backscattered
positrons and by false counts of Ps that dont annihilate in front of the ring (cross-talk effect between
adjacent detectors) many Monte Carlo simulations have been carried for different configurations
obtained varying the thickness (119905 divide1-9 mm) of the shield among the detectorrsquos rings together with the
3 To whom any correspondence should be addressed
16th International Conference on Positron Annihilation (ICPA-16) IOP PublishingJournal of Physics Conference Series 443 (2013) 012074 doi1010881742-65964431012074
Content from this work may be used under the terms of the Creative Commons Attribution 30 licence Any further distributionof this work must maintain attribution to the author(s) and the title of the work journal citation and DOI
Published under licence by IOP Publishing Ltd 1
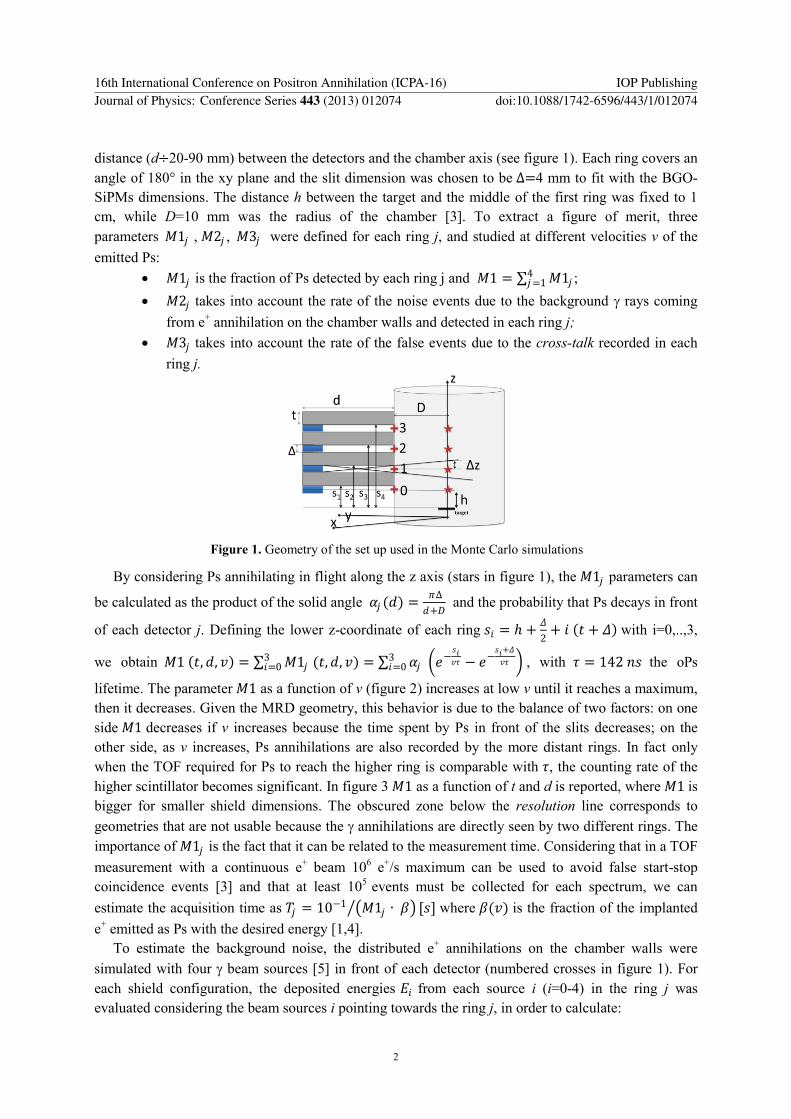
distance (ddivide20-90 mm) between the detectors and the chamber axis (see figure 1) Each ring covers an
angle of 180deg in the xy plane and the slit dimension was chosen to be ∆=4 mm to fit with the BGO-
SiPMs dimensions The distance h between the target and the middle of the first ring was fixed to 1
cm while D=10 mm was the radius of the chamber [3] To extract a figure of merit three
parameters 1198721119895 1198722119895 1198723119895 were defined for each ring j and studied at different velocities v of the
emitted Ps
1198721119895 is the fraction of Ps detected by each ring j and 1198721 = 11987211198954119895=1
1198722119895 takes into account the rate of the noise events due to the background rays coming
from e+ annihilation on the chamber walls and detected in each ring j
1198723119895 takes into account the rate of the false events due to the cross-talk recorded in each
ring j
Figure 1 Geometry of the set up used in the Monte Carlo simulations
By considering Ps annihilating in flight along the z axis (stars in figure 1) the 1198721119895 parameters can
be calculated as the product of the solid angle 120572119895 (119889) = 120587∆
119889+119863 and the probability that Ps decays in front
of each detector j Defining the lower z-coordinate of each ring 119904119894 = ℎ +120549
2+ 119894 119905 + 120549 with i=03
we obtain 1198721 119905119889 119907 = 1198721119895 (119905119889 119907)3119894=0 = 120572119895 3
119894=0 119890minus119904119894119907120591 minus 119890minus
119904119894+120549
119907120591 with 120591 = 142 119899119904 the oPs
lifetime The parameter 1198721 as a function of v (figure 2) increases at low v until it reaches a maximum
then it decreases Given the MRD geometry this behavior is due to the balance of two factors on one
side 1198721 decreases if v increases because the time spent by Ps in front of the slits decreases on the
other side as v increases Ps annihilations are also recorded by the more distant rings In fact only
when the TOF required for Ps to reach the higher ring is comparable with 120591 the counting rate of the
higher scintillator becomes significant In figure 3 1198721 as a function of t and d is reported where 1198721 is
bigger for smaller shield dimensions The obscured zone below the resolution line corresponds to
geometries that are not usable because the annihilations are directly seen by two different rings The
importance of 1198721119895 is the fact that it can be related to the measurement time Considering that in a TOF
measurement with a continuous e+ beam 10
6 e
+s maximum can be used to avoid false start-stop
coincidence events [3] and that at least 105
events must be collected for each spectrum we can
estimate the acquisition time as 119879119895 = 10minus1 1198721119895 ∙ 120573 [119904] where 120573(119907) is the fraction of the implanted
e+ emitted as Ps with the desired energy [14]
To estimate the background noise the distributed e+ annihilations on the chamber walls were
simulated with four beam sources [5] in front of each detector (numbered crosses in figure 1) For
each shield configuration the deposited energies 119864119894 from each source i (i=0-4) in the ring j was
evaluated considering the beam sources i pointing towards the ring j in order to calculate
16th International Conference on Positron Annihilation (ICPA-16) IOP PublishingJournal of Physics Conference Series 443 (2013) 012074 doi1010881742-65964431012074
2
1198722119895 = 119864119894
3119894ne119895 119894=0
119864 where 119864 is the deposited energy from the source placed in front of the ring j
Figure 2 M1 calculated with d=20 mm and t=8
mm and t=1 mm as a function of the Ps velocity
Figure 3 M1 as a function of t and d calculated for Ps
velocity of 119907 = 6 ∙ 104 ms
Similarly the noise due to cross-talk was simulated with beam sources placed on the chamber
axis z (numbered stars in figure 1) and pointing towards the considered ring j 1198723119895 = 119864119894
1198883119894ne119895 119894=0
119864 where
119864119894119888 are the deposited energies in the ring j for each source i 1198722119895 and 1198723119895 express the two effects that
increase the noise of a MRD with respect to a single detector In order to sum the two effects their
relative weights have to be determined Because the Ps emission yield depends on the sample
properties and the Ps energy while the intensity of the backscattered e+ is connected to the e
+ beam to
the sample surface and to the set up characteristics we can look at an experimental TOF spectrum
(figure 3) carried out at Trento by using a single ring detector placed at h= 1 cm (figure 3) From this
plot for each Ps velocity we can extract a signal to background ratio 120575 119907 in order to obtain a new
parameter 119872119895 = 1198723119895 + 1198722119895 120575 119907 for each ring j Thus 119872119895 takes into account both the background
and the cross-talk noise
Figure 4 TOF measurement of escaping Ps in
continuous line background in dot The
vertical bars show the velocities considered as
examples for calculations
Because 119872119895 and 119879119895 prop 1 1198721119895 depend on v also the choice of the best geometry depends on the v
value that is going to be measured As examples we have considered four most significant values of v
(corresponding to values indicated by vertical lines in figure 4) 1) 119907 = 2 ∙ 105 ms where the
background dominates over the Ps signal 2) 119907 = 1 ∙ 105 ms where 1198721 reaches its maximum 3)
119907 = 6 ∙ 104 ms where the background and signal are comparable 4) 119907 = 4 ∙ 104 ms where the
background is lower than the signal From geometric considerations it can be observed that the ring
called 1 or 2 in figure 1 are more exposed to the background and cross-talk noise For this reason in
order to size the MRD we have considered only the second ring where the worst conditions in term of
signal to noise ratio occur Thus the MRD geometry must be chosen looking at the signal to noise ratio
16th International Conference on Positron Annihilation (ICPA-16) IOP PublishingJournal of Physics Conference Series 443 (2013) 012074 doi1010881742-65964431012074
3
119872121198722 the measuring time 1198792 =10minus1
11987212 ∙ 120573[119904] and the spatial resolution ∆119911 =
120549
119889 119889
2+ 119863 (see figure 1)
which is related to the resolution on the kinetic energy value E extracted by a TOF measurement by
the relation ∆119864
119864=
2∆119911
119911
Figure 5 Colours express the value
of the ratio 119872121198722 in log scale as
a function of t and d for four
different Ps velocities (the same
indicated with bars in figure 3) The
limitations imposed by the resolution
(in the bottom) are shown The
resolution ∆119911 on the Ps annihilation
position is marked by red vertical
lines and the measurement time is
indicated by black lines The squares
indicate the best configuration set up
as explained in the text
The behavior of 119872121198722 with the time 1198792 and the ∆119911 values (expressed in the continuous black
and red lines respectively) is shown in figure 5 for the selected four Ps velocities To calculate 1198792 the
parameter 120573 was estimated by multiplying the yield (25) of emitted Ps as reported in [4] to the
fraction (008 006 002 0016) calculated considering the Ps signal in figure 4 From figure 5 we can
observe that the signal to noise ratio 119872121198722 increases going towards the zone in which the shield
dimensions increase because the effect of the decreasing of noise (ie of 1198722) is more relevant with
respect to the decrease of 11987212 Thus by imposing a limitation on the energy resolution and on the
measurement time (if necessary) and optimizing the signal to noise ratio for each velocity the best
configuration can be chosen For instance for larger velocity for which Ps is emitted more abundant
and the measurement time is always less than 3 hours the best set up is with higher values of t and d
(see figure 5ab) On the contrary when the measurement time increases the best configuration can
be chosen by imposing for instance Tlt3 h and ∆119911 lt27 mm as indicated in figure 5c Finally when Ps
with low velocity is of interest the measurement time increases and configurations with smaller shield
are necessary (figure 5 d)
3 References
[1] Di Noto L Mariazzi S Bettonte M Nebbia G and Brusa R S 2012 Eur Phys J D 66 118
[2] Hugenschmidt C 2010 Physics with many positrons ed R S Brusa A Dupasquier and A P Mills
Jr (Amsterdam IOS Bologna SIF) p 399
[3] Mazzuca E Benetti M Mariazzi S Brusa R S Dalla Betta G-F and Piemonte C 2012 J Instr 7 P05006
[4] Mariazzi S Bettotti P and Brusa R S 2010 Phys Rev Lett 104 243401
[5] Gentit F-X 2002 Nucl Instr Meth Phys Res A 486 35
16th International Conference on Positron Annihilation (ICPA-16) IOP PublishingJournal of Physics Conference Series 443 (2013) 012074 doi1010881742-65964431012074
4
Optimization of a multi-ring detector for Ps time of flight measurements
L Di Noto13
M Benetti2 S Mariazzi
1 G-F Dalla Betta
2 and R S Brusa
1
1Dipartimento di Fisica Universitagrave di Trento and INFN Gruppo collegato di Trento
Via Sommarive 14 I-38123 Povo Trento Italy 2Dipartimento di Ingegneria e Scienza dellrsquoInformazione Universitagrave di Trento and
INFN Gruppo collegato di Trento Via Sommarive 14 I-38123 Povo Trento Italy
E-mail dinotoscienceunitnit
Abstract We have designed a multi-ring detector (MRD) based on Bismuth Germanate
(BGO) crystals coupled to Silicon PhotoMultipliers (SiPM) for measuring the Ps time of flight
(TOF) The set-up geometry was optimized by Monte Carlo simulations to take into account at
different Ps velocities (i) the background noise due to backscattered positrons (ii) the cross-
talk between adjacent detectors (iii) the lifetime of Ps decay Three parameters were defined to
evaluate the different configurations and a figure of merit was obtained This allows the choice
of the best set up configuration for measuring Ps emitted with a particular energy range
optimizing the signal to noise ratio and keeping the acquisition time acceptable
1 Introduction
A TOF apparatus to investigate Ps cooling by measuring the energy distribution of Ps emitted from
porous materials was developed in Trento [1] and it is being set up at the NEutron induced POsitron
Source MUnich (NEPOMUC) [2] The system was realized to work with continuous e+ beams The
secondary electrons ejected by the e+ entering the sample are used as start signal as recorded by two
channeltrons The stop signal is given by the Ps annihilation rays observed by detectors placed at a
known distance z from the sample surface In order to improve the efficiency of this apparatus we
designed a 4-ring detector where each ring is separated from another ring by tungsten shields A multi-
ring detector MRD allows the acquisition of simultaneously TOF spectra at different distances Since
the MRD requires small size detectors BGO crystals with 4x4x10 mm3 dimensions coupled with
SiPMs were considered [3]
2 Monte Carlo Simulations and results
To take into account the increasing of the noise caused by background signal from the backscattered
positrons and by false counts of Ps that dont annihilate in front of the ring (cross-talk effect between
adjacent detectors) many Monte Carlo simulations have been carried for different configurations
obtained varying the thickness (119905 divide1-9 mm) of the shield among the detectorrsquos rings together with the
3 To whom any correspondence should be addressed
16th International Conference on Positron Annihilation (ICPA-16) IOP PublishingJournal of Physics Conference Series 443 (2013) 012074 doi1010881742-65964431012074
Content from this work may be used under the terms of the Creative Commons Attribution 30 licence Any further distributionof this work must maintain attribution to the author(s) and the title of the work journal citation and DOI
Published under licence by IOP Publishing Ltd 1
distance (ddivide20-90 mm) between the detectors and the chamber axis (see figure 1) Each ring covers an
angle of 180deg in the xy plane and the slit dimension was chosen to be ∆=4 mm to fit with the BGO-
SiPMs dimensions The distance h between the target and the middle of the first ring was fixed to 1
cm while D=10 mm was the radius of the chamber [3] To extract a figure of merit three
parameters 1198721119895 1198722119895 1198723119895 were defined for each ring j and studied at different velocities v of the
emitted Ps
1198721119895 is the fraction of Ps detected by each ring j and 1198721 = 11987211198954119895=1
1198722119895 takes into account the rate of the noise events due to the background rays coming
from e+ annihilation on the chamber walls and detected in each ring j
1198723119895 takes into account the rate of the false events due to the cross-talk recorded in each
ring j
Figure 1 Geometry of the set up used in the Monte Carlo simulations
By considering Ps annihilating in flight along the z axis (stars in figure 1) the 1198721119895 parameters can
be calculated as the product of the solid angle 120572119895 (119889) = 120587∆
119889+119863 and the probability that Ps decays in front
of each detector j Defining the lower z-coordinate of each ring 119904119894 = ℎ +120549
2+ 119894 119905 + 120549 with i=03
we obtain 1198721 119905119889 119907 = 1198721119895 (119905119889 119907)3119894=0 = 120572119895 3
119894=0 119890minus119904119894119907120591 minus 119890minus
119904119894+120549
119907120591 with 120591 = 142 119899119904 the oPs
lifetime The parameter 1198721 as a function of v (figure 2) increases at low v until it reaches a maximum
then it decreases Given the MRD geometry this behavior is due to the balance of two factors on one
side 1198721 decreases if v increases because the time spent by Ps in front of the slits decreases on the
other side as v increases Ps annihilations are also recorded by the more distant rings In fact only
when the TOF required for Ps to reach the higher ring is comparable with 120591 the counting rate of the
higher scintillator becomes significant In figure 3 1198721 as a function of t and d is reported where 1198721 is
bigger for smaller shield dimensions The obscured zone below the resolution line corresponds to
geometries that are not usable because the annihilations are directly seen by two different rings The
importance of 1198721119895 is the fact that it can be related to the measurement time Considering that in a TOF
measurement with a continuous e+ beam 10
6 e
+s maximum can be used to avoid false start-stop
coincidence events [3] and that at least 105
events must be collected for each spectrum we can
estimate the acquisition time as 119879119895 = 10minus1 1198721119895 ∙ 120573 [119904] where 120573(119907) is the fraction of the implanted
e+ emitted as Ps with the desired energy [14]
To estimate the background noise the distributed e+ annihilations on the chamber walls were
simulated with four beam sources [5] in front of each detector (numbered crosses in figure 1) For
each shield configuration the deposited energies 119864119894 from each source i (i=0-4) in the ring j was
evaluated considering the beam sources i pointing towards the ring j in order to calculate
16th International Conference on Positron Annihilation (ICPA-16) IOP PublishingJournal of Physics Conference Series 443 (2013) 012074 doi1010881742-65964431012074
2
1198722119895 = 119864119894
3119894ne119895 119894=0
119864 where 119864 is the deposited energy from the source placed in front of the ring j
Figure 2 M1 calculated with d=20 mm and t=8
mm and t=1 mm as a function of the Ps velocity
Figure 3 M1 as a function of t and d calculated for Ps
velocity of 119907 = 6 ∙ 104 ms
Similarly the noise due to cross-talk was simulated with beam sources placed on the chamber
axis z (numbered stars in figure 1) and pointing towards the considered ring j 1198723119895 = 119864119894
1198883119894ne119895 119894=0
119864 where
119864119894119888 are the deposited energies in the ring j for each source i 1198722119895 and 1198723119895 express the two effects that
increase the noise of a MRD with respect to a single detector In order to sum the two effects their
relative weights have to be determined Because the Ps emission yield depends on the sample
properties and the Ps energy while the intensity of the backscattered e+ is connected to the e
+ beam to
the sample surface and to the set up characteristics we can look at an experimental TOF spectrum
(figure 3) carried out at Trento by using a single ring detector placed at h= 1 cm (figure 3) From this
plot for each Ps velocity we can extract a signal to background ratio 120575 119907 in order to obtain a new
parameter 119872119895 = 1198723119895 + 1198722119895 120575 119907 for each ring j Thus 119872119895 takes into account both the background
and the cross-talk noise
Figure 4 TOF measurement of escaping Ps in
continuous line background in dot The
vertical bars show the velocities considered as
examples for calculations
Because 119872119895 and 119879119895 prop 1 1198721119895 depend on v also the choice of the best geometry depends on the v
value that is going to be measured As examples we have considered four most significant values of v
(corresponding to values indicated by vertical lines in figure 4) 1) 119907 = 2 ∙ 105 ms where the
background dominates over the Ps signal 2) 119907 = 1 ∙ 105 ms where 1198721 reaches its maximum 3)
119907 = 6 ∙ 104 ms where the background and signal are comparable 4) 119907 = 4 ∙ 104 ms where the
background is lower than the signal From geometric considerations it can be observed that the ring
called 1 or 2 in figure 1 are more exposed to the background and cross-talk noise For this reason in
order to size the MRD we have considered only the second ring where the worst conditions in term of
signal to noise ratio occur Thus the MRD geometry must be chosen looking at the signal to noise ratio
16th International Conference on Positron Annihilation (ICPA-16) IOP PublishingJournal of Physics Conference Series 443 (2013) 012074 doi1010881742-65964431012074
3
119872121198722 the measuring time 1198792 =10minus1
11987212 ∙ 120573[119904] and the spatial resolution ∆119911 =
120549
119889 119889
2+ 119863 (see figure 1)
which is related to the resolution on the kinetic energy value E extracted by a TOF measurement by
the relation ∆119864
119864=
2∆119911
119911
Figure 5 Colours express the value
of the ratio 119872121198722 in log scale as
a function of t and d for four
different Ps velocities (the same
indicated with bars in figure 3) The
limitations imposed by the resolution
(in the bottom) are shown The
resolution ∆119911 on the Ps annihilation
position is marked by red vertical
lines and the measurement time is
indicated by black lines The squares
indicate the best configuration set up
as explained in the text
The behavior of 119872121198722 with the time 1198792 and the ∆119911 values (expressed in the continuous black
and red lines respectively) is shown in figure 5 for the selected four Ps velocities To calculate 1198792 the
parameter 120573 was estimated by multiplying the yield (25) of emitted Ps as reported in [4] to the
fraction (008 006 002 0016) calculated considering the Ps signal in figure 4 From figure 5 we can
observe that the signal to noise ratio 119872121198722 increases going towards the zone in which the shield
dimensions increase because the effect of the decreasing of noise (ie of 1198722) is more relevant with
respect to the decrease of 11987212 Thus by imposing a limitation on the energy resolution and on the
measurement time (if necessary) and optimizing the signal to noise ratio for each velocity the best
configuration can be chosen For instance for larger velocity for which Ps is emitted more abundant
and the measurement time is always less than 3 hours the best set up is with higher values of t and d
(see figure 5ab) On the contrary when the measurement time increases the best configuration can
be chosen by imposing for instance Tlt3 h and ∆119911 lt27 mm as indicated in figure 5c Finally when Ps
with low velocity is of interest the measurement time increases and configurations with smaller shield
are necessary (figure 5 d)
3 References
[1] Di Noto L Mariazzi S Bettonte M Nebbia G and Brusa R S 2012 Eur Phys J D 66 118
[2] Hugenschmidt C 2010 Physics with many positrons ed R S Brusa A Dupasquier and A P Mills
Jr (Amsterdam IOS Bologna SIF) p 399
[3] Mazzuca E Benetti M Mariazzi S Brusa R S Dalla Betta G-F and Piemonte C 2012 J Instr 7 P05006
[4] Mariazzi S Bettotti P and Brusa R S 2010 Phys Rev Lett 104 243401
[5] Gentit F-X 2002 Nucl Instr Meth Phys Res A 486 35
16th International Conference on Positron Annihilation (ICPA-16) IOP PublishingJournal of Physics Conference Series 443 (2013) 012074 doi1010881742-65964431012074
4