derby usd 260 - kansas state department of education finance/budget/budget... · the derby school...
TRANSCRIPT

Derby USD 260

i
• Budget General Information (characteristics of district)
• Supplemental Information for Tables in Summary of Expenditures
• KSDE Website Information Available
• Summary of Expenditures (Sumexpen.xlsx)

1
2013-14 Budget General Information USD #: _260____
Introduction
The Derby School District, covering 50 square miles, is a suburban school district which is part of the Wichita metropolitan area consisting of approximately 500,000 people. Although more than 20,000 people call Derby home, the population of our district boundaries includes large sections of Sedgwick County. The Oaklawn/Sunview area, McConnell Air Force Base, Towne Parc, Oak Knoll and Salem Township are all included within our boundaries. This makes our district population near 40,000. USD 260 serves approximately 6,800 students through nine elementary schools, one sixth grade center, one middle school and one high school. All day kindergarten is offered at each of our elementary schools. The students are exposed to a district wide K-12 curriculum that supports reading/language arts, math, science, social studies, computer technology, music education, and a variety of electives ranging from foreign languages to business courses to the arts. Our students consistently score above the state and national norms in the various assessments that are given K-12. The district has achieved Adequate Yearly Progress (AYP) in each of the last three years. The public voted to approve a $66.7 million bond issue in April, 2012. Construction has started on additions to two elementary schools along with several roofing projects. Over the next two years, a new middle school will be built and the current middle school will undergo a substantial renovation along with the addition of a new library and classrooms. A new central kitchen is also planned. Over 1,000 certified and classified employees in the district support student learning. Of our certified staff, slightly more than 60% have attained a Master’s degree with 36% at a Master’s plus 30 hours or above on our salary schedule. District health, dental, and short-term disability insurance plans are made available to staff through our cafeteria plan. The district continually strives to provide optimal working conditions for all staff members.
Board Members Andree’ Sisco, President 5015 S. Jade Ave., Wichita, KS 67216 R. Matthew Joyce, Vice-President 218 Mallard Drive, Derby, KS 67037 Matt Hoag 1607 Horizon Drive, Derby, KS 67037 Jose Martinez 1406 Cresthill Rd., Derby, KS 67037 Carolyn Muehring 1518 Cardinal Court, Derby, KS 67037 Tom Ostrander 2652 Rough Creek Rd., Derby, KS
67037 Janet Sprecker 818 Rough Creek Loop, Derby, KS
67037

2
Key Staff Superintendent: Craig Wilford Associate or Assistant Superintendents: Heather Bohaty – Assistant
Superintendent/Human Resources, Dr. Charlene Laramore – Assistant Superintendent/Curriculum and Instruction.
Business Office Staff: Don Adkisson – Director of Budget and Finance/Treasurer, Gerie Allen – Budget/Accounting Coordinator, David Clausius – Payroll/Benefits Coordinator, Erica Smith, Purchasing/Accounts Payable Coordinator, Dani Patterson – Secretary/Student Records/Travel, Jacqui Pierce – Accounting Assistant, Jenny Ramsey – Payroll Assistant.
Curriculum & Instruction Staff: Robin Folkerts, James Morgan, Kendal Warkentine – Instructional Coordinators, Kelly Herbst – ELL Testing Coordinator, Pam Lewis – Secretary. Other Key Contacts: Tom Snodgrass – Director of Operations, Dr. Doug Anderson –
Director Of Special Services, Drew Lane – Director of Technology, Jennifer Keller - Director of Community Marketing, Will Young – Transportation/Supply Supervisor, Martha Lawson – Food Services Supervisor, Litona Hoyt – Board Clerk
The District’s Accomplishments and Challenges
Accomplishments: Our students, staff and buildings have a long-standing tradition of excellence. Below you will find a partial listing of some of our shining successes from the 2012-2013 school year. Student Honors DMS 8th graders made the John Philip Sousa Honor Band DHS Senior submitted winning graphic at SkillsUSA National Convention. BEST Robotics team notebook placed 6th out of 28 teams. DHS student chosen as Wichita State University Student Ambassador. DHS art students showcase art work in the Scholastic Art Awards Exhibition. SGC gifted students are semifinalists in Innovation Generation: Christopher
Columbus Award. DHS Basketball team placed 3rd in 6A State Basketball Tournament. Students named for the National Merit Scholarship Program. DHS student places first in Forensics National Competition. DHS students awarded $22,000 in scholarships from Derby Community
Foundation. Five DMS students were selected to participate in Kansas State-Wide Middle
School Orchestra. DMS and SGC student placed 1st and 2nd for Generation A.R.M. writing contest.
Staff Honors Kansas Teacher of the year nominees. 2012 Kansas Gifted Facilitator of the Year. 2012 Kansas General Education Teacher of the Year. DHS outstanding secondary art educators of the year by Kansas Art Association
(KAEA). Horizon Award, sponsored by KSDE, recognizing exemplary first year educators.

3
Many KAKE Golden Apples. Multiple Data Quality Certifications received. SGC principal awarded General Education Administrator of the Year. Elementary student teacher awarded Kansas Teacher of Promise.
Building Honors Elementary school awarded Certificate of Merit by the Confidence in Kansas
Public Education Task. $500,000 grant from Grace Med to build a school based health clinic. Derby Public Schools was presented with $21,140 check from the Education
Funding Group. Cookie Bookie Club receives $2,000 from Target. The Derby Rotary Club donates dictionaries to all third grade classrooms in the
district. Multiple grants were obtained throughout the year to help further education.
Challenges: Derby Public Schools continues to face challenges to ensure all of our students are successful. The District implemented a five year strategic plan which was adopted by the Board of Education on July 9, 2012. This plan is designed to achieve four objectives that are:
1. 100% of our students will graduate. 2. All students will be reading at or above grade level by the end of 3rd grade. 3. Each of our students will score at meets standards or above on state
assessments. 4. We will simultaneously improve the achievement of all students while closing the
achievement gap.
To help obtain these objectives, we have adopted specific strategies. The strategies that are:
1. Derby Public School students will be career and college ready. 2. We will provide quality facilities that meet the educational needs of students. 3. To obtain additional funding sources to meet student needs. 4. Technology will deploy and maintain an environment that supports district goals
and enhances learning opportunities. 5. We will secure and retain highly qualified staff to meet the educational needs of
our students.

4
Supplemental Information for the Following Tables 1. Summary of Total Expenditures by Function (All Funds) 2. Summary of General Fund Expenditures by Function 3. Summary of Supplemental General Fund Expenditures by Function 4. Summary of General and Supplemental General Fund Expenditures by Function 5. Summary of Special Education Fund by Function 6. Instruction Expenditures (1000) 7. Student and Instructional Support Expenditures (2100 & 2200) 8. General Administration Expenditures (2300) 9. School Administration Expenditures (2400) 10. Operations and Maintenance Expenditures (2600) 11. Other Costs (2500 & 2900: Other Supplemental Services) (3000: Non-Instruction
Services) 12. Capital Improvements (4000) 13. Debt Services (5000)
14. Miscellaneous Information - Transfers 15. Miscellaneous Information Unencumbered Cash Balance by Fund 16. Reserve Funds Unencumbered Cash Balance 17. Other Information - FTE 18. Miscellaneous Information Mill Rates by Fund 19. Other Information – Assessed Valuation and Bonded Indebtedness Note: The FTE (full time equivalency) used in this report to calculate the “Amount Per Pupil” is defined as following: Enrollment (FTE) includes the enrollment of the district used for state aid and budget authority, and all other preschool enrollment and kindergarten students attending full time.

5
KSDE Website Information Available K-12 Statistics (Building, District or State Totals) http://svapp15586.ksde.org/k12/k12.aspx
• Attendance / Enrollment Reports • Staff Reports • Graduates / Dropouts Reports • Crime / Violence Reports
School Finance Reports and Publications http://www.ksde.org/Default.aspx?tabid=1870
• Certified Personnel • Enrollment • Dropouts • Graduates • Salary Reports
Kansas Building Report Card http://svapp15586.ksde.org/rcard/
• Attendance Rate • Graduation Rate • Dropout Rate • School Violence • Assessments
o Reading o Mathematics o Writing
• Graduates Passing Adv. Science Courses • Graduates Passing Adv. Math Courses
USD# 260
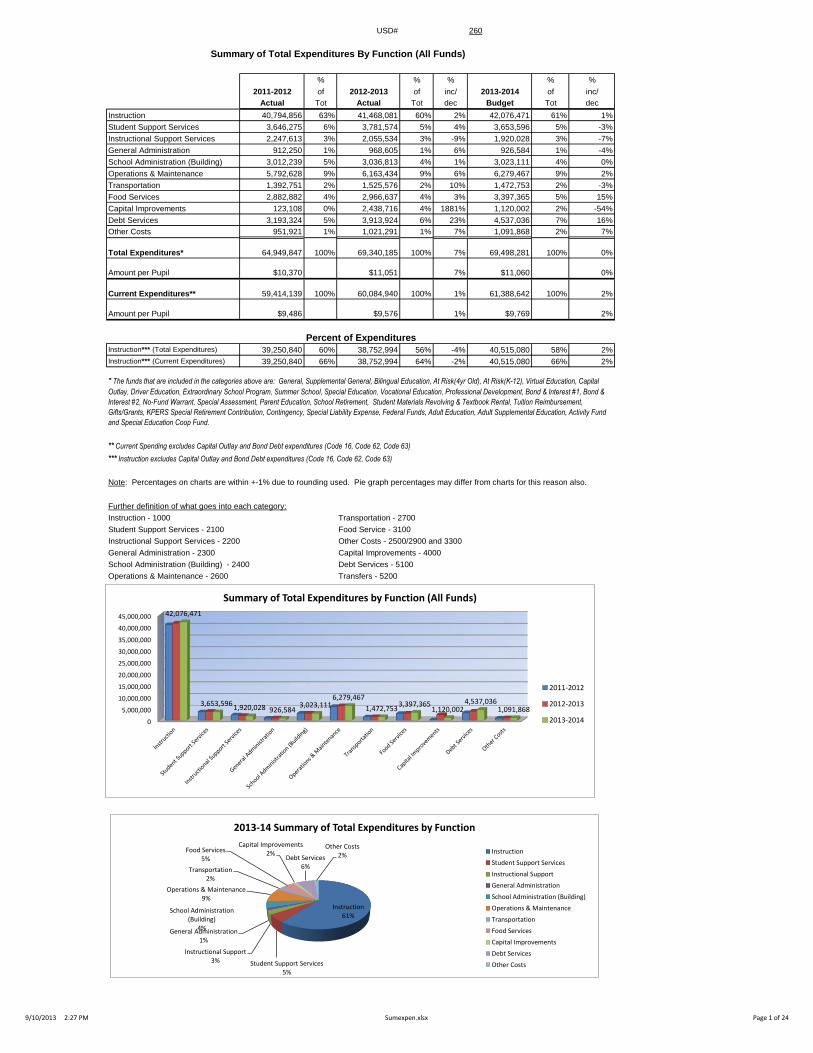
Summary of Total Expenditures By Function (All Funds)
% % % % %
2011-2012 of 2012-2013 of inc/ 2013-2014 of inc/
Actual Tot Actual Tot dec Budget Tot dec
Instruction 40,794,856 63% 41,468,081 60% 2% 42,076,471 61% 1%
Student Support Services 3,646,275 6% 3,781,574 5% 4% 3,653,596 5% -3%
Instructional Support Services 2,247,613 3% 2,055,534 3% -9% 1,920,028 3% -7%
General Administration 912,250 1% 968,605 1% 6% 926,584 1% -4%
School Administration (Building) 3,012,239 5% 3,036,813 4% 1% 3,023,111 4% 0%
Operations & Maintenance 5,792,628 9% 6,163,434 9% 6% 6,279,467 9% 2%
Transportation 1,392,751 2% 1,525,576 2% 10% 1,472,753 2% -3%
Food Services 2,882,882 4% 2,966,637 4% 3% 3,397,365 5% 15%
Capital Improvements 123,108 0% 2,438,716 4% 1881% 1,120,002 2% -54%
Debt Services 3,193,324 5% 3,913,924 6% 23% 4,537,036 7% 16%
Other Costs 951,921 1% 1,021,291 1% 7% 1,091,868 2% 7%
Total Expenditures* 64,949,847 100% 69,340,185 100% 7% 69,498,281 100% 0%
Amount per Pupil $10,370 $11,051 7% $11,060 0%
Current Expenditures** 59,414,139 100% 60,084,940 100% 1% 61,388,642 100% 2%
Amount per Pupil $9,486 $9,576 1% $9,769 2%
Instruction*** (Total Expenditures) 39,250,840 60% 38,752,994 56% -4% 40,515,080 58% 2%
Instruction*** (Current Expenditures) 39,250,840 66% 38,752,994 64% -2% 40,515,080 66% 2%
Note: Percentages on charts are within +-1% due to rounding used. Pie graph percentages may differ from charts for this reason also.
Further definition of what goes into each category:
Instruction - 1000 Transportation - 2700
Student Support Services - 2100 Food Service - 3100
Instructional Support Services - 2200 Other Costs - 2500/2900 and 3300
General Administration - 2300 Capital Improvements - 4000
School Administration (Building) - 2400 Debt Services - 5100
Operations & Maintenance - 2600 Transfers - 5200
Percent of Expenditures
* The funds that are included in the categories above are: General, Supplemental General, Bilingual Education, At Risk(4yr Old), At Risk(K-12), Virtual Education, Capital
Outlay, Driver Education, Extraordinary School Program, Summer School, Special Education, Vocational Education, Professional Development, Bond & Interest #1, Bond &
Interest #2, No-Fund Warrant, Special Assessment, Parent Education, School Retirement, Student Materials Revolving & Textbook Rental, Tuition Reimbursement,
Gifts/Grants, KPERS Special Retirement Contribution, Contingency, Special Liability Expense, Federal Funds, Adult Education, Adult Supplemental Education, Activity Fund
and Special Education Coop Fund.
*** Instruction excludes Capital Outlay and Bond Debt expenditures (Code 16, Code 62, Code 63)
** Current Spending excludes Capital Outlay and Bond Debt expenditures (Code 16, Code 62, Code 63)
0
5,000,000
10,000,000
15,000,000
20,000,000
25,000,000
30,000,000
35,000,000
40,000,000
45,000,000 42,076,471
3,653,596 1,920,028 926,584
3,023,111 6,279,467
1,472,753 3,397,365
1,120,002 4,537,036
1,091,868
Summary of Total Expenditures by Function (All Funds)
2011-2012
2012-2013
2013-2014
Instruction 61%
Student Support Services 5%
Instructional Support 3%
General Administration 1%
School Administration (Building)
4%
Operations & Maintenance 9%
Transportation 2%
Food Services 5%
Capital Improvements 2%
Debt Services 6%
Other Costs 2%
2013-14 Summary of Total Expenditures by Function
Instruction
Student Support Services
Instructional Support
General Administration
School Administration (Building)
Operations & Maintenance
Transportation
Food Services
Capital Improvements
Debt Services
Other Costs
9/10/2013 2:27 PM Sumexpen.xlsx Page 1 of 24

USD# 260
Summary of General Fund Expenditures
by Function
% % % % %
2011-2012 of 2012-2013 of inc/ 2013-2014 of inc/
Actual Tot Actual Tot dec Budget Tot dec
Instruction 20,111,322 80% 19,875,517 80% -1% 20,035,060 79% 1%
Student Support 46 0% 35 0% -24% 0 0% -100%
Instructional Support 6,526 0% 16,211 0% 148% 0 0% -100%
General Administration 587,436 2% 635,738 3% 8% 631,764 3% -1%
School Administration (Building) 2,480,584 10% 2,570,750 10% 4% 2,657,874 11% 3%
Operations & Maintenance 398,535 2% 244,660 1% -39% 306,013 1% 25%
Transportation 742,887 3% 780,977 3% 5% 807,634 3% 3%
Capital Improvements 0 0% 0 0% 0% 0 0% 0%
Other Costs 706,776 3% 749,748 3% 6% 777,202 3% 4%
Total Expenditures 25,034,112 100% 24,873,636 100% -1% 25,215,547 100% 1%
Amount per Pupil $3,997 $3,964 -1% $4,013 1%
The Summary of General Fund Expenditures chart information comes from pages 6-13 and only uses the 'General Fund' line items.
0
5,000,000
10,000,000
15,000,000
20,000,000
25,000,000
20,035,060
0 0 631,764
2,657,874
306,013 807,634 0
777,202
Summary of General Fund Expenditures
2011-2012
2012-2013
2013-2014
Instruction 79%
General Administration
3%
School Administration (Building)
11%
Operations & Maintenance
1%
Transportation 3%
Other Costs 3%
2013-14 Summary of General Fund Expenditures by Function
Instruction
Student Support
Instructional Support
General Administration
School Administration (Building)
Operations & Maintenance
Transportation
Capital Improvements
Other Costs
9/10/2013 2:27 PM Sumexpen.xlsx Page 2 of 24

USD# 260
Summary of Supplemental General Fund Expenditures
by Function
% % % % %
2011-2012 of 2012-2013 of inc/ 2013-2014 of inc/
Actual Tot Actual Tot dec Budget Tot dec
Instruction 2,387,103 24% 2,610,259 25% 9% 2,144,332 21% -18%
Student Support 1,231,011 12% 1,286,376 12% 4% 1,265,312 12% -2%
Instructional Support 1,568,655 16% 1,615,428 15% 3% 1,489,404 15% -8%
General Administration 58,064 1% 54,834 1% -6% 52,997 1% -3%
School Administration (Building) 183,879 2% 162,253 2% -12% 128,795 1% -21%
Operations & Maintenance 4,509,604 45% 4,729,134 45% 5% 4,883,293 48% 3%
Transportation 8,005 0% 8,132 0% 2% 7,361 0% -9%
Capital Improvements 0 0% 0 0% 0% 0 0% 0%
Other Costs 134,653 1% 157,753 1% 17% 166,455 2% 6%
Total Expenditures 10,080,974 100% 10,624,169 100% 5% 10,137,949 100% -5%
Amount per Pupil $1,610 $1,693 5% $1,613 -5%
The Summary of Supplemental General Fund Expenditures chart information comes from pages 6-13 and only uses the 'Supplemental
General Fund' line items.
0
500,000
1,000,000
1,500,000
2,000,000
2,500,000
3,000,000
3,500,000
4,000,000
4,500,000
5,000,000
2,144,332
1,265,312 1,489,404
52,997 128,795
4,883,293
7,361 0 166,455
Summary of Supplemental General Expenditures by Function
2011-2012
2012-2013
2013-2014
Instruction 21%
Student Support 12%
Instructional Support 15%
General Administration 1%
School Administration (Building) 1%
Operations & Maintenance
48%
Other Costs 2%
2013-14 Summary of Supplemental General Fund Expenditures by Function
Instruction
Student Support
Instructional Support
General Administration
School Administration (Building)
Operations & Maintenance
Transportation
Capital Improvements
Other Costs
9/10/2013 2:27 PM Sumexpen.xlsx Page 3 of 24
USD# 260
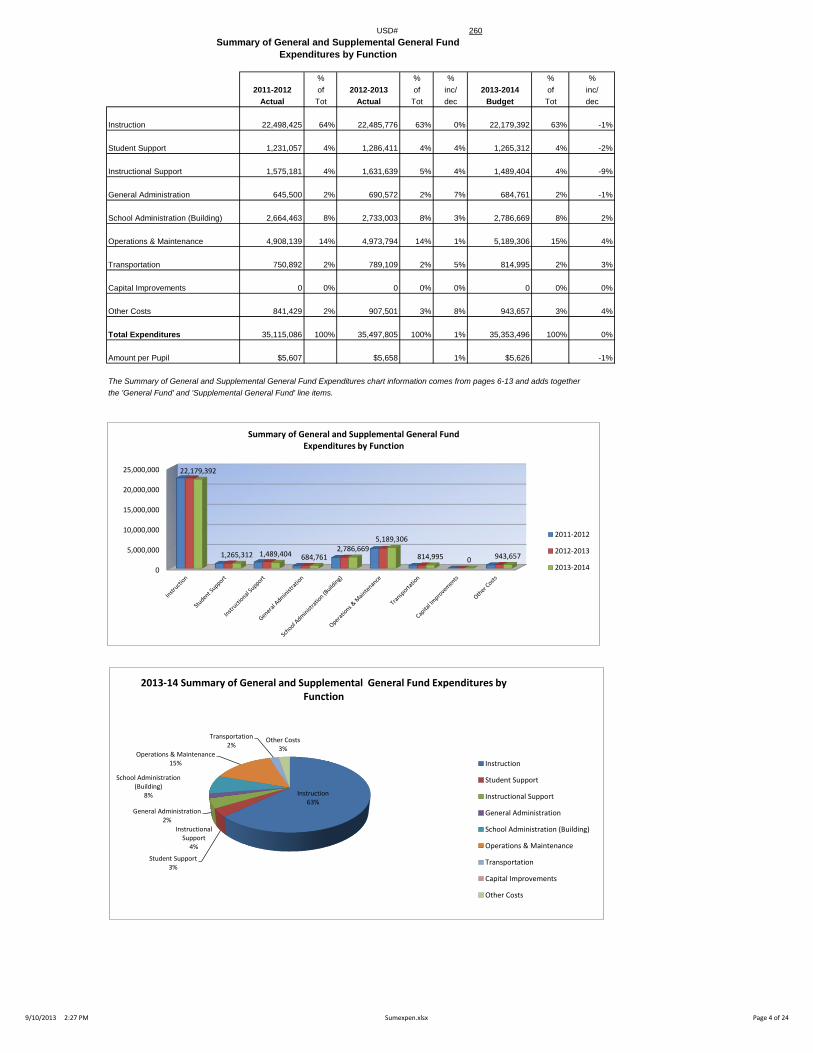
Summary of General and Supplemental General Fund
Expenditures by Function
% % % % %
2011-2012 of 2012-2013 of inc/ 2013-2014 of inc/
Actual Tot Actual Tot dec Budget Tot dec
Instruction 22,498,425 64% 22,485,776 63% 0% 22,179,392 63% -1%
Student Support 1,231,057 4% 1,286,411 4% 4% 1,265,312 4% -2%
Instructional Support 1,575,181 4% 1,631,639 5% 4% 1,489,404 4% -9%
General Administration 645,500 2% 690,572 2% 7% 684,761 2% -1%
School Administration (Building) 2,664,463 8% 2,733,003 8% 3% 2,786,669 8% 2%
Operations & Maintenance 4,908,139 14% 4,973,794 14% 1% 5,189,306 15% 4%
Transportation 750,892 2% 789,109 2% 5% 814,995 2% 3%
Capital Improvements 0 0% 0 0% 0% 0 0% 0%
Other Costs 841,429 2% 907,501 3% 8% 943,657 3% 4%
Total Expenditures 35,115,086 100% 35,497,805 100% 1% 35,353,496 100% 0%
Amount per Pupil $5,607 $5,658 1% $5,626 -1%
The Summary of General and Supplemental General Fund Expenditures chart information comes from pages 6-13 and adds together
the 'General Fund' and 'Supplemental General Fund' line items.
0
5,000,000
10,000,000
15,000,000
20,000,000
25,000,000 22,179,392
1,265,312 1,489,404 684,761 2,786,669
5,189,306
814,995 0 943,657
Summary of General and Supplemental General Fund Expenditures by Function
2011-2012
2012-2013
2013-2014
Instruction 63%
Student Support 3%
Instructional Support
4%
General Administration 2%
School Administration (Building)
8%
Operations & Maintenance 15%
Transportation 2%
Other Costs 3%
2013-14 Summary of General and Supplemental General Fund Expenditures by Function
Instruction
Student Support
Instructional Support
General Administration
School Administration (Building)
Operations & Maintenance
Transportation
Capital Improvements
Other Costs
9/10/2013 2:27 PM Sumexpen.xlsx Page 4 of 24

USD# 260
Summary of Special Education Fund
by Function
% % % % %
2011-2012 of 2012-2013 of inc/ 2013-2014 of inc/
Actual Tot Actual Tot dec Budget Tot dec
Instruction 7,181,950 76% 7,236,161 74% 1% 7,565,437 76% 5%
Student Support 1,751,638 18% 1,851,178 19% 6% 1,800,200 18% -3%
Instructional Support 8,407 0% 4,207 0% -50% 5,000 0% 19%
General Administration 167,271 2% 172,483 2% 3% 176,675 2% 2%
School Administration (Building) 0 0% 0 0% 0% 0 0% 0%
Operations & Maintenance 0 0% 0 0% 0% 0 0% 0%
Transportation 402,135 4% 449,444 5% 12% 464,652 5% 3%
Capital Improvements 0 0% 0 0% 0% 0 0% 0%
Other Costs 0 0% 0 0% 0% 0 0% 0%
Total Expenditures 9,511,401 100% 9,713,473 100% 2% 10,011,964 100% 3%
Amount per Pupil $1,519 $1,548 2% $1,593 3%
The Summary of Special Education Fund Expenditures chart information comes from pages 6-13 and only uses the 'Special Education Fund'
line items. (Total expenditures excludes Special Ed Coop Fund because it would include expenditures for all schools participating in the Coop.)
0
1,000,000
2,000,000
3,000,000
4,000,000
5,000,000
6,000,000
7,000,000
8,000,000
7,1
81
,95
0
1,7
51
,63
8
8,4
07
16
7,2
71
0
0
40
2,1
35
0
0
7,2
36
,16
1
1,8
51
,17
8
4,2
07
17
2,4
83
0
0
44
9,4
44
0
0
7,5
65
,43
7
1,8
00
,20
0
5,0
00
17
6,6
75
0
0
46
4,6
52
0
0
Summary of Special Education Fund Expenditures by Function
2011-2012
2012-2013
2013-2014
Instruction 75%
Student Support 18%
General Administration 2%
Transportation 5%
2013-14 Summary of Special Education Fund by Function
Instruction
Student Support
Instructional Support
General Administration
School Administration (Building)
Operations & Maintenance
Transportation
Capital Improvements
Other Costs
9/10/2013 2:27 PM Sumexpen.xlsx Page 5 of 24
USD# 260
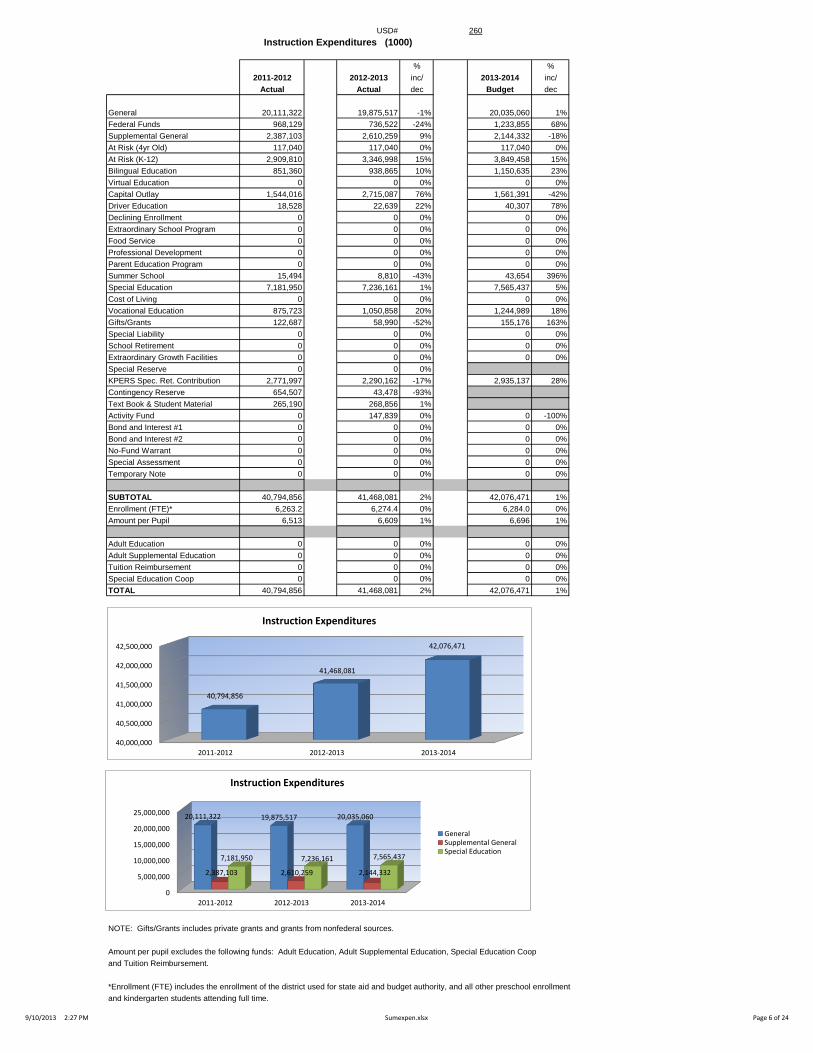
Instruction Expenditures (1000)
% %
2011-2012 2012-2013 inc/ 2013-2014 inc/
Actual Actual dec Budget dec
General 20,111,322 19,875,517 -1% 20,035,060 1%
Federal Funds 968,129 736,522 -24% 1,233,855 68%
Supplemental General 2,387,103 2,610,259 9% 2,144,332 -18%
At Risk (4yr Old) 117,040 117,040 0% 117,040 0%
At Risk (K-12) 2,909,810 3,346,998 15% 3,849,458 15%
Bilingual Education 851,360 938,865 10% 1,150,635 23%
Virtual Education 0 0 0% 0 0%
Capital Outlay 1,544,016 2,715,087 76% 1,561,391 -42%
Driver Education 18,528 22,639 22% 40,307 78%
Declining Enrollment 0 0 0% 0 0%
Extraordinary School Program 0 0 0% 0 0%
Food Service 0 0 0% 0 0%
Professional Development 0 0 0% 0 0%
Parent Education Program 0 0 0% 0 0%
Summer School 15,494 8,810 -43% 43,654 396%
Special Education 7,181,950 7,236,161 1% 7,565,437 5%
Cost of Living 0 0 0% 0 0%
Vocational Education 875,723 1,050,858 20% 1,244,989 18%
Gifts/Grants 122,687 58,990 -52% 155,176 163%
Special Liability 0 0 0% 0 0%
School Retirement 0 0 0% 0 0%
Extraordinary Growth Facilities 0 0 0% 0 0%
Special Reserve 0 0 0%
KPERS Spec. Ret. Contribution 2,771,997 2,290,162 -17% 2,935,137 28%
Contingency Reserve 654,507 43,478 -93%
Text Book & Student Material 265,190 268,856 1%
Activity Fund 0 147,839 0% 0 -100%
Bond and Interest #1 0 0 0% 0 0%
Bond and Interest #2 0 0 0% 0 0%
No-Fund Warrant 0 0 0% 0 0%
Special Assessment 0 0 0% 0 0%
Temporary Note 0 0 0% 0 0%
SUBTOTAL 40,794,856 41,468,081 2% 42,076,471 1%
Enrollment (FTE)* 6,263.2 6,274.4 0% 6,284.0 0%
Amount per Pupil 6,513 6,609 1% 6,696 1%
Adult Education 0 0 0% 0 0%
Adult Supplemental Education 0 0 0% 0 0%
Tuition Reimbursement 0 0 0% 0 0%
Special Education Coop 0 0 0% 0 0%
TOTAL 40,794,856 41,468,081 2% 42,076,471 1%
NOTE: Gifts/Grants includes private grants and grants from nonfederal sources.
Amount per pupil excludes the following funds: Adult Education, Adult Supplemental Education, Special Education Coop
and Tuition Reimbursement.
*Enrollment (FTE) includes the enrollment of the district used for state aid and budget authority, and all other preschool enrollment
and kindergarten students attending full time.
0
5,000,000
10,000,000
15,000,000
20,000,000
25,000,000
2011-2012 2012-2013 2013-2014
20,111,322 19,875,517 20,035,060
2,387,103 2,610,259 2,144,332
7,181,950 7,236,161 7,565,437
Instruction Expenditures
GeneralSupplemental GeneralSpecial Education
40,000,000
40,500,000
41,000,000
41,500,000
42,000,000
42,500,000
2011-2012 2012-2013 2013-2014
40,794,856
41,468,081
42,076,471
Instruction Expenditures
9/10/2013 2:27 PM Sumexpen.xlsx Page 6 of 24

USD# 260
Student Support Expenditures (2100)
% %
2011-2012 2012-2013 inc/ 2013-2014 inc/
Actual Actual dec Budget dec
General 46 35 -24% 0 -100%
Federal Funds 54,026 29,545 -45% 48,020 63%
Supplemental General 1,231,011 1,286,376 4% 1,265,312 -2%
At Risk (4yr Old) 0 0 0% 0 0%
At Risk (K-12) 0 0 0% 0 0%
Bilingual Education 0 0 0% 0 0%
Virtual Education 0 0 0% 0 0%
Capital Outlay 648 15,056 2223% 0 -100%
Driver Training 0 0 0% 0 0%
Declining Enrollment 0 0 0% 0 0%
Extraordinary School Program 0 0 0% 0 0%
Food Service 0 0 0% 0 0%
Professional Development 0 0 0% 0 0%
Parent Education Program 242,506 251,193 4% 246,550 -2%
Summer School 0 0 0% 0 0%
Special Education 1,751,638 1,851,178 6% 1,800,200 -3%
Cost of Living 0 0 0% 0 0%
Vocational Education 0 0 0% 0 0%
Gifts/Grants 2,857 2,911 2% 0 -100%
Special Liability 0 0 0% 0 0%
School Retirement 0 0 0% 0 0%
Extraordinary Growth Facilities 0 0 0% 0 0%
Special Reserve 0 0 0%
KPERS Spec. Ret. Contribution 363,543 341,662 -6% 293,514 -14%
Contingency Reserve 0 3,618 0%
Text Book & Student Material 0 0 0%
Activity Fund 0 0 0% 0 0%
Bond and Interest #1 0 0 0% 0 0%
Bond and Interest #2 0 0 0% 0 0%
No-Fund Warrant 0 0 0% 0 0%
Special Assessment 0 0 0% 0 0%
Temporary Note 0 0 0% 0 0%
SUBTOTAL 3,646,275 3,781,574 4% 3,653,596 -3%
Enrollment (FTE)* 6,263.2 6,274.4 0% 6,284.0 0%
Amount per Pupil 582 603 4% 581 -4%
Adult Education 0 0 0% 0 0%
Adult Supplemental Education 0 0 0% 0 0%
Tuition Reimbursement 0 0 0% 0 0%
Special Education Coop 0 0 0% 0 0%
TOTAL 3,646,275 3,781,574 4% 3,653,596 -3%
Amount per Pupil $582 $601 3% $577 -4%
NOTE: Gifts/Grants includes private grants and grants from nonfederal sources.
Amount per pupil excludes the following funds: Adult Education, Adult Supplemental Education, Special Education Coop
and Tuition Reimbursement.
*Enrollment (FTE) includes the enrollment of the district used for state aid and budget authority, and all other preschool enrollment
and kindergarten students attending full time.
3,550,000
3,600,000
3,650,000
3,700,000
3,750,000
3,800,000
2011-2012 2012-2013 2013-2014
3,646,275
3,781,574
3,653,596
Student Support Expenditures
9/10/2013 2:27 PM Sumexpen.xlsx Page 7 of 24

USD# 260
Instructional Support Expenditures (2200)
% %
2011-2012 2012-2013 inc/ 2013-2014 inc/
Actual Actual dec Budget dec
General 6,526 16,211 148% 0 -100%
Federal Funds 387,922 153,897 -60% 202,786 32%
Supplemental General 1,568,655 1,615,428 3% 1,489,404 -8%
At Risk (4yr Old) 0 0 0% 0 0%
At Risk (K-12) 0 0 0% 0 0%
Bilingual Education 0 0 0% 0 0%
Virtual Education 0 0 0% 0 0%
Capital Outlay 3,630 11,222 209% 0 -100%
Driver Training 0 0 0% 0 0%
Declining Enrollment 0 0 0% 0 0%
Extraordinary School Program 0 0 0% 0 0%
Food Service 0 0 0% 0 0%
Professional Development 124,996 125,000 0% 125,000 0%
Parent Education Program 0 0 0% 0 0%
Summer School 0 0 0% 0 0%
Special Education 8,407 4,207 -50% 5,000 19%
Cost of Living 0 0 0% 0 0%
Vocational Education 0 0 0% 0 0%
Gifts/Grants 6,815 8,262 21% 0 -100%
Special Liability 0 0 0% 0 0%
School Retirement 0 0 0% 0 0%
Extraordinary Growth Facilities 0 0 0% 0 0%
Special Reserve 0 0 0%
KPERS Spec. Ret. Contribution 139,645 121,307 -13% 97,838 -19%
Contingency Reserve 1,017 0 -100%
Text Book & Student Material 0 0 0%
Activity Fund 0 0 0% 0 0%
Bond and Interest #1 0 0 0% 0 0%
Bond and Interest #2 0 0 0% 0 0%
No-Fund Warrant 0 0 0% 0 0%
Special Assessment 0 0 0% 0 0%
Temporary Note 0 0 0% 0 0%
SUBTOTAL 2,247,613 2,055,534 -9% 1,920,028 -7%
Enrollment (FTE)* 6,263.2 6,274.4 0% 6,284.0 0%
Amount per Pupil 359 328 -9% 306 -7%
Adult Education 0 0 0% 0 0%
Adult Supplemental Education 0 0 0% 0 0%
Tuition Reimbursement 0 0 0% 0 0%
Special Education Coop 0 0 0% 0 0%
TOTAL 2,247,613 2,055,534 -9% 1,920,028 -7%
Amount per Pupil $359 $328 -9% $306 -7%
NOTE: Gifts/Grants includes private grants and grants from nonfederal sources.
Amount per pupil excludes the following funds: Adult Education, Adult Supplemental Education, Special Education Coop
and Tuition Reimbursement.
*Enrollment (FTE) includes the enrollment of the district used for state aid and budget authority, and all other preschool enrollment
and kindergarten students attending full time.
1,750,000
1,800,000
1,850,000
1,900,000
1,950,000
2,000,000
2,050,000
2,100,000
2,150,000
2,200,000
2,250,000
2011-2012 2012-2013 2013-2014
2,247,613
2,055,534
1,920,028
Instructional Support Expenditures
9/10/2013 2:27 PM Sumexpen.xlsx Page 8 of 24

USD# 260
General Administration Expenditures (2300)
% %
2011-2012 2012-2013 inc/ 2013-2014 inc/
Actual Actual dec Budget dec
General 587,436 635,738 8% 631,764 -1%
Federal Funds 4,554 3,843 -16% 4,000 4%
Supplemental General 58,064 54,834 -6% 52,997 -3%
At Risk (4yr Old) 0 0 0% 0 0%
At Risk (K-12) 0 0 0% 0 0%
Bilingual Education 0 0 0% 0 0%
Virtual Education 0 0 0% 0 0%
Capital Outlay 1,528 3,164 107% 0 -100%
Driver Training 0 0 0% 0 0%
Declining Enrollment 0 0 0% 0 0%
Extraordinary School Program 0 0 0% 0 0%
Food Service 0 0 0% 0 0%
Professional Development 0 0 0% 0 0%
Parent Education Program 0 0 0% 0 0%
Summer School 0 0 0% 0 0%
Special Education 167,271 172,483 3% 176,675 2%
Cost of Living 0 0 0% 0 0%
Vocational Education 0 0 0% 0 0%
Gifts/Grants 0 0 0% 0 0%
Special Liability Expense 0 0 0% 0 0%
School Retirement 0 0 0% 0 0%
Extraordinary Growth Facilities 0 0 0% 0 0%
Special Reserve 0 0 0%
KPERS Spec. Ret. Contribution 93,397 98,543 6% 61,148 -38%
Contingency Reserve 0 0 0%
Text Book & Student Material 0 0 0%
Activity Fund 0 0 0% 0 0%
Bond and Interest #1 0 0 0% 0 0%
Bond and Interest #2 0 0 0% 0 0%
No-Fund Warrant 0 0 0% 0 0%
Special Assessment 0 0 0% 0 0%
Temporary Note 0 0 0% 0 0%
SUBTOTAL 912,250 968,605 6% 926,584 -4%
Enrollment (FTE)* 6,263.2 6,274.4 0% 6,284.0 0%
Amount per Pupil 146 154 6% 147 -4%
Adult Education 0 0 0% 0 0%
Adult Supplemental Education 0 0 0% 0 0%
Tuition Reimbursement 0 0 0% 0 0%
Special Education Coop 0 0 0% 0 0%
TOTAL 912,250 968,605 6% 926,584 -4%
NOTE: Gifts/Grants includes private grants and grants from nonfederal sources.
Amount per pupil excludes the following funds: Adult Education, Adult Supplemental Education, Special Education Coop
and Tuition Reimbursement.
*Enrollment (FTE) includes the enrollment of the district used for state aid and budget authority, and all other preschool enrollment
and kindergarten students attending full time.
880,000
890,000
900,000
910,000
920,000
930,000
940,000
950,000
960,000
970,000
2011-2012 2012-2013 2013-2014
912,250
968,605
926,584
General Administration Expenditures
9/10/2013 2:27 PM Sumexpen.xlsx Page 9 of 24

USD# 260
School Administration Expenditures (2400)
% %
2011-2012 2012-2013 inc/ 2013-2014 inc/
Actual Actual dec Budget dec
General 2,480,584 2,570,750 4% 2,657,874 3%
Federal Funds 0 0 0% 0 0%
Supplemental General 183,879 162,253 -12% 128,795 -21%
At Risk (4yr Old) 0 0 0% 0 0%
At Risk (K-12) 0 0 0% 0 0%
Bilingual Education 0 0 0% 0 0%
Virtual Education 0 0 0% 0 0%
Capital Outlay 33,524 2,494 -93% 0 -100%
Driver Training 0 0 0% 0 0%
Declining Enrollment 0 0 0% 0 0%
Extraordinary School Program 0 0 0% 0 0%
Food Service 0 0 0% 0 0%
Professional Development 0 0 0% 0 0%
Parent Education Program 0 0 0% 0 0%
Summer School 0 0 0% 0 0%
Special Education 0 0 0% 0 0%
Cost of Living 0 0 0% 0 0%
Vocational Education 0 0 0% 0 0%
Gifts/Grants 0 0 0% 0 0%
Special Liability Expense 0 0 0% 0 0%
School Retirement 0 0 0% 0 0%
Extraordinary Growth Facilities 0 0 0% 0 0%
Special Reserve 0 0 0%
KPERS Spec. Ret. Contribution 309,048 295,628 -4% 236,442 -20%
Contingency Reserve 0 0 0%
Text Book & Student Material 0 0 0%
Activity Fund 0 0 0% 0 0%
Bond and Interest #1 0 0 0% 0 0%
Bond and Interest #2 0 0 0% 0 0%
No-Fund Warrant 0 0 0% 0 0%
Special Assessment 0 0 0% 0 0%
Temporary Note 0 0 0% 0 0%
SUBTOTAL 3,007,035 3,031,125 1% 3,023,111 0%
Enrollment (FTE)* 6,263.2 6,274.4 0% 6,284.0 0%
Amount per Pupil 480 483 1% 481 0%
Adult Education 0 0 0% 0 0%
Adult Supplemental Education 5,204 5,688 9% 0 -100%
Tuition Reimbursement 0 0 0% 0 0%
Special Education Coop 0 0 0% 0 0%
TOTAL 3,012,239 3,036,813 1% 3,023,111 0%
NOTE: Gifts/Grants includes private grants and grants from nonfederal sources.
Amount per pupil excludes the following funds: Adult Education, Adult Supplemental Education, Special Education Coop
and Tuition Reimbursement.
*Enrollment (FTE) includes the enrollment of the district used for state aid and budget authority, and all other preschool enrollment
and kindergarten students attending full time.
2,995,000
3,000,000
3,005,000
3,010,000
3,015,000
3,020,000
3,025,000
3,030,000
3,035,000
3,040,000
2011-2012 2012-2013 2013-2014
3,012,239
3,036,813
3,023,111
School Administration Expenditures
9/10/2013 2:27 PM Sumexpen.xlsx Page 10 of 24

USD# 260
Operations and Maintenance Expenditures (2600)
% %
2011-2012 2012-2013 inc/ 2013-2014 inc/
Actual Actual dec Budget dec
General 398,535 244,660 -39% 306,013 25%
Federal Funds 0 0 0% 0 0%
Supplemental General 4,509,604 4,729,134 5% 4,883,293 3%
At Risk (4yr Old) 0 0 0% 0 0%
At Risk (K-12) 0 0 0% 0 0%
Bilingual Education 0 0 0% 0 0%
Virtual Education 0 0 0% 0 0%
Capital Outlay 481,556 679,259 41% 799,510 18%
Driver Training 3,936 4,190 6% 16,339 290%
Declining Enrollment 0 0 0% 0 0%
Extraordinary School Program 0 0 0% 0 0%
Food Service 27,748 30,456 10% 35,314 16%
Professional Development 0 0 0% 0 0%
Parent Education Program 0 0 0% 0 0%
Summer School 2,505 2,206 -12% 3,779 71%
Special Education 0 0 0% 0 0%
Cost of Living 0 0 0% 0 0%
Vocational Education 0 0 0% 0 0%
Gifts/Grants 0 0 0% 0 0%
Special Liability 0 0 0% 0 0%
School Retirement 0 0 0% 0 0%
Extraordinary Growth Facilities 0 0 0% 0 0%
Special Reserve 0 0 0%
KPERS Spec. Ret. Contribution 306,987 304,936 -1% 235,219 -23%
Contingency Reserve 20,532 0 -100%
Text Book & Student Material 0 0 0%
Activity Fund 0 0 0% 0 0%
Bond and Interest #1 0 0 0% 0 0%
Bond and Interest #2 0 0 0% 0 0%
No-Fund Warrant 0 0 0% 0 0%
Special Assessment 0 0 0% 0 0%
Temporary Note 0 0 0% 0 0%
SUBTOTAL 5,751,403 5,994,841 4% 6,279,467 5%
Enrollment (FTE)* 6,263.2 6,274.4 0% 6,284.0 0%
Amount per Pupil 918 955 4% 999 5%
Adult Education 0 0 0% 0 0%
Adult Supplemental Education 41,225 168,593 309% 0 -100%
Tuition Reimbursement 0 0 0% 0 0%
Special Education Coop 0 0 0% 0 0%
TOTAL 5,792,628 6,163,434 6% 6,279,467 2%
NOTE: Gifts/Grants includes private grants and grants from nonfederal sources.
Amount per pupil excludes the following funds: Adult Education, Adult Supplemental Education, Special Education Coop
and Tuition Reimbursement.
*Enrollment (FTE) includes the enrollment of the district used for state aid and budget authority, and all other preschool enrollment
and kindergarten students attending full time.
5,500,000
5,600,000
5,700,000
5,800,000
5,900,000
6,000,000
6,100,000
6,200,000
6,300,000
2011-2012 2012-2013 2013-2014
5,792,628
6,163,434
6,279,467
Operations and Maintenance Expenditures
9/10/2013 2:27 PM Sumexpen.xlsx Page 11 of 24

USD# 260
Transportation Expenditures (2700)
% %
2011-2012 2012-2013 inc/ 2013-2014 inc/
Actual Actual dec Budget dec
General 742,887 780,977 5% 807,634 3%
Federal Funds 602 0 -100% 0 0%
Supplemental General 8,005 8,132 2% 7,361 -9%
At Risk (4yr Old) 0 0 0% 0 0%
At Risk (K-12) 0 0 0% 0 0%
Bilingual Education 0 0 0% 0 0%
Virtual Education 0 0 0% 0 0%
Capital Outlay 161,054 206,590 28% 93,000 -55%
Driver Training 0 0 0% 0 0%
Declining Enrollment 0 0 0% 0 0%
Extraordinary School Program 0 0 0% 0 0%
Food Service 0 0 0% 0 0%
Professional Development 0 0 0% 0 0%
Parent Education Program 0 0 0% 0 0%
Summer School 0 0 0% 0 0%
Special Education 402,135 449,444 12% 464,652 3%
Cost of Living 0 0 0% 0 0%
Vocational Education 0 0 0% 6,345 0%
Gifts/Grants 0 0 0% 0 0%
Special Liability 0 0 0% 0 0%
School Retirement 0 0 0% 0 0%
Extraordinary Growth Facilities 0 0 0% 0 0%
Special Reserve 0 0 0%
KPERS Spec. Ret. Contribution 78,068 80,433 3% 93,761 17%
Contingency Reserve 0 0 0%
Text Book & Student Material 0 0 0%
Activity Fund 0 0 0%
Bond and Interest #1 0 0 0% 0 0%
Bond and Interest #2 0 0 0% 0 0%
No-Fund Warrant 0 0 0% 0 0%
Special Assessment 0 0 0% 0 0%
Temporary Note 0 0 0% 0 0%
SUBTOTAL 1,392,751 1,525,576 10% 1,472,753 -3%
Enrollment (FTE)* 6,263.2 6,274.4 0% 6,284.0 0%
Amount per Pupil 222 243 9% 234 -4%
Adult Education 0 0 0% 0 0%
Adult Supplemental Education 0 0 0% 0 0%
Tuition Reimbursement 0 0 0% 0 0%
Special Education Coop 0 0 0% 0 0%
TOTAL 1,392,751 1,525,576 10% 1,472,753 -3%
NOTE: Gifts/Grants includes private grants and grants from nonfederal sources.
Amount per pupil excludes the following funds: Adult Education, Adult Supplemental Education, Special Education Coop
and Tuition Reimbursement.
*Enrollment (FTE) includes the enrollment of the district used for state aid and budget authority, and all other preschool enrollment
and kindergarten students attending full time.
1,320,000
1,340,000
1,360,000
1,380,000
1,400,000
1,420,000
1,440,000
1,460,000
1,480,000
1,500,000
1,520,000
1,540,000
2011-2012 2012-2013 2013-2014
1,392,751
1,525,576
1,472,753
Transportation Expenditures
9/10/2013 2:27 PM Sumexpen.xlsx Page 12 of 24

USD# 260
Food Services Expenditures (3100)
% %
2011-2012 2012-2013 inc/ 2013-2014 inc/
Actual Actual dec Budget dec
General 0 0 0% 0 0%
Federal Funds 0 0 0% 0 0%
Supplemental General 0 0 0% 0 0%
At Risk (4yr Old) 0 0 0% 0 0%
At Risk (K-12) 0 0 0% 0 0%
Bilingual Education 0 0 0% 0 0%
Virtual Education 0 0 0% 0 0%
Capital Outlay 0 0 0% 0 0%
Driver Training 0 0 0% 0 0%
Declining Enrollment 0 0 0% 0 0%
Extraordinary School Program 0 0 0% 0 0%
Food Service 2,798,630 2,886,204 3% 3,322,356 15%
Professional Development 0 0 0% 0 0%
Parent Education Program 0 0 0% 0 0%
Summer School 0 0 0% 0 0%
Special Education 0 0 0% 0 0%
Cost of Living 0 0 0% 0 0%
Vocational Education 0 0 0% 0 0%
Gifts/Grants 0 0 0% 0 0%
Special Liability 0 0 0% 0 0%
School Retirement 0 0 0% 0 0%
Extraordinary Growth Facilities 0 0 0% 0 0%
Special Reserve 0 0 0%
KPERS Spec. Ret. Contribution 84,252 80,433 -5% 75,009 -7%
Contingency Reserve 0 0 0%
Text Book & Student Material 0 0 0%
Activity Fund 0 0 0%
Bond and Interest #1 0 0 0% 0 0%
Bond and Interest #2 0 0 0% 0 0%
No-Fund Warrant 0 0 0% 0 0%
Special Assessment 0 0 0% 0 0%
Temporary Note 0 0 0% 0 0%
SUBTOTAL 2,882,882 2,966,637 3% 3,397,365 15%
Enrollment (FTE)* 6,263.2 6,274.4 0% 6,284.0 0%
Amount per Pupil 460 473 3% 541 14%
Adult Education 0 0 0% 0 0%
Adult Supplemental Education 0 0 0% 0 0%
Tuition Reimbursement 0 0 0% 0 0%
Special Education Coop 0 0 0% 0 0%
TOTAL 2,882,882 2,966,637 3% 3,397,365 15%
NOTE: Gifts/Grants includes private grants and grants from nonfederal sources.
Amount per pupil excludes the following funds: Adult Education, Adult Supplemental Education, Special Education Coop
and Tuition Reimbursement.
*Enrollment (FTE) includes the enrollment of the district used for state aid and budget authority, and all other preschool enrollment
and kindergarten students attending full time.
2,600,000
2,700,000
2,800,000
2,900,000
3,000,000
3,100,000
3,200,000
3,300,000
3,400,000
2011-2012 2012-2013 2013-2014
2,882,882
2,966,637
3,397,365
Food Service Expenditures
9/10/2013 2:27 PM Sumexpen.xlsx Page 13 of 24

USD# 260
Other Costs
(2500 & 2900: Other Supplemental Services)
(3300: Community Services Operations)
% %
2011-2012 2012-2013 inc/ 2013-2014 inc/
Actual Actual dec Budget dec
General 706,776 749,748 6% 777,202 4%
Federal Funds 0 0 0% 0 0%
Supplemental General 134,653 157,753 17% 166,455 6%
At Risk (4yr Old) 0 0 0% 0 0%
At Risk (K-12) 0 0 0% 0 0%
Bilingual Education 0 0 0% 0 0%
Virtual Education 0 0 0% 0 0%
Capital Outlay 36,765 40,153 9% 99,700 148%
Driver Training 0 0 0% 0 0%
Declining Enrollment 0 0 0% 0 0%
Extraordinary School Program 0 0 0% 0 0%
Food Service 0 0 0% 0 0%
Professional Development 0 0 0% 0 0%
Parent Education Program 227 1,954 761% 0 -100%
Summer School 0 0 0% 0 0%
Special Education 0 0 0% 0 0%
Cost of Living 0 0 0% 0 0%
Vocational Education 0 0 0% 0 0%
Gifts/Grants 0 50 0% 0 -100%
Special Liability 0 0 0% 0 0%
School Retirement 0 0 0% 0 0%
Extraordinary Growth Facilities 0 0 0% 0 0%
Special Reserve 0 0 0%
KPERS Spec. Ret. Contribution 65,700 59,490 -9% 48,511 -18%
Contingency Reserve 7,800 12,143 56%
Text Book & Student Material 0 0 0%
Activity Fund 0 0 0% 0 0%
Bond and Interest #1 0 0 0% 0 0%
Bond and Interest #2 0 0 0% 0 0%
No-Fund Warrant 0 0 0% 0 0%
Special Assessment 0 0 0% 0 0%
Temporary Note 0 0 0% 0 0%
SUBTOTAL 951,921 1,021,291 7% 1,091,868 7%
Enrollment (FTE)* 6,263.2 6,274.4 0% 6,284.0 0%
Amount per Pupil 152 163 7% 174 7%
Adult Education 0 0 0% 0 0%
Adult Supplemental Education 0 0 0% 0 0%
Tuition Reimbursement 0 0 0% 0 0%
Special Education Coop 0 0 0% 0 0%
TOTAL 951,921 1,021,291 7% 1,091,868 7%
NOTE: Gifts/Grants includes private grants and grants from nonfederal sources.
Amount per pupil excludes the following funds: Adult Education, Adult Supplemental Education, Special Education Coop
and Tuition Reimbursement.
*Enrollment (FTE) includes the enrollment of the district used for state aid and budget authority, and all other preschool enrollment
and kindergarten students attending full time.
850,000
900,000
950,000
1,000,000
1,050,000
1,100,000
2011-2012 2012-2013 2013-2014
951,921
1,021,291
1,091,868
Other Costs
9/10/2013 2:27 PM Sumexpen.xlsx Page 14 of 24
USD# 260
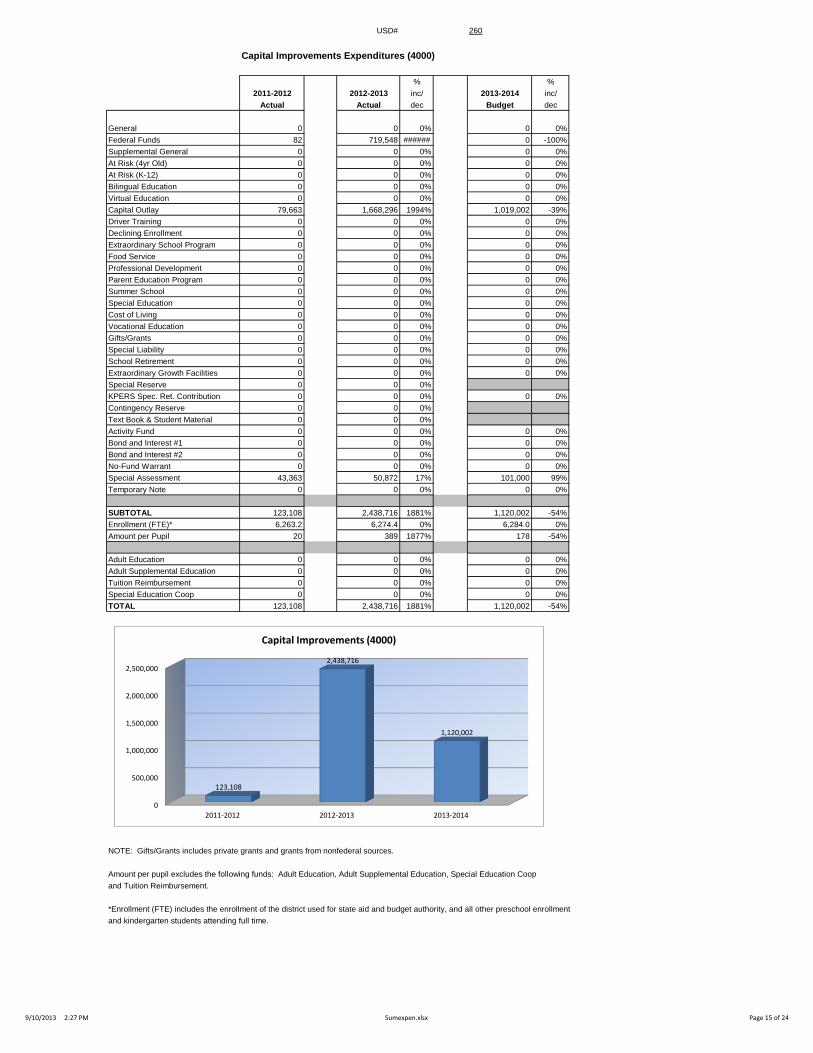
Capital Improvements Expenditures (4000)
% %
2011-2012 2012-2013 inc/ 2013-2014 inc/
Actual Actual dec Budget dec
General 0 0 0% 0 0%
Federal Funds 82 719,548 ###### 0 -100%
Supplemental General 0 0 0% 0 0%
At Risk (4yr Old) 0 0 0% 0 0%
At Risk (K-12) 0 0 0% 0 0%
Bilingual Education 0 0 0% 0 0%
Virtual Education 0 0 0% 0 0%
Capital Outlay 79,663 1,668,296 1994% 1,019,002 -39%
Driver Training 0 0 0% 0 0%
Declining Enrollment 0 0 0% 0 0%
Extraordinary School Program 0 0 0% 0 0%
Food Service 0 0 0% 0 0%
Professional Development 0 0 0% 0 0%
Parent Education Program 0 0 0% 0 0%
Summer School 0 0 0% 0 0%
Special Education 0 0 0% 0 0%
Cost of Living 0 0 0% 0 0%
Vocational Education 0 0 0% 0 0%
Gifts/Grants 0 0 0% 0 0%
Special Liability 0 0 0% 0 0%
School Retirement 0 0 0% 0 0%
Extraordinary Growth Facilities 0 0 0% 0 0%
Special Reserve 0 0 0%
KPERS Spec. Ret. Contribution 0 0 0% 0 0%
Contingency Reserve 0 0 0%
Text Book & Student Material 0 0 0%
Activity Fund 0 0 0% 0 0%
Bond and Interest #1 0 0 0% 0 0%
Bond and Interest #2 0 0 0% 0 0%
No-Fund Warrant 0 0 0% 0 0%
Special Assessment 43,363 50,872 17% 101,000 99%
Temporary Note 0 0 0% 0 0%
SUBTOTAL 123,108 2,438,716 1881% 1,120,002 -54%
Enrollment (FTE)* 6,263.2 6,274.4 0% 6,284.0 0%
Amount per Pupil 20 389 1877% 178 -54%
Adult Education 0 0 0% 0 0%
Adult Supplemental Education 0 0 0% 0 0%
Tuition Reimbursement 0 0 0% 0 0%
Special Education Coop 0 0 0% 0 0%
TOTAL 123,108 2,438,716 1881% 1,120,002 -54%
NOTE: Gifts/Grants includes private grants and grants from nonfederal sources.
Amount per pupil excludes the following funds: Adult Education, Adult Supplemental Education, Special Education Coop
and Tuition Reimbursement.
*Enrollment (FTE) includes the enrollment of the district used for state aid and budget authority, and all other preschool enrollment
and kindergarten students attending full time.
0
500,000
1,000,000
1,500,000
2,000,000
2,500,000
2011-2012 2012-2013 2013-2014
123,108
2,438,716
1,120,002
Capital Improvements (4000)
9/10/2013 2:27 PM Sumexpen.xlsx Page 15 of 24

USD# 260
Debt Services Expenditures (5100)
% %
2011-2012 2012-2013 inc/ 2013-2014 inc/
Actual Actual dec Budget dec
General 0 0 0% 0 0%
Federal Funds 0 0 0% 0 0%
Supplemental General 0 0 0% 0 0%
At Risk (4yr Old) 0 0 0% 0 0%
At Risk (K-12) 0 0 0% 0 0%
Bilingual Education 0 0 0% 0 0%
Virtual Education 0 0 0% 0 0%
Capital Outlay 185,359 185,196 0% 184,998 0%
Driver Training 0 0 0% 0 0%
Declining Enrollment 0 0 0% 0 0%
Extraordinary School Program 0 0 0% 0 0%
Food Service 0 0 0% 0 0%
Professional Development 0 0 0% 0 0%
Parent Education Program 0 0 0% 0 0%
Summer School 0 0 0% 0 0%
Special Education 0 0 0% 0 0%
Cost of Living 0 0 0% 0 0%
Vocational Education 0 0 0% 0 0%
Gifts/Grants 0 0 0% 0 0%
Special Liability 0 0 0% 0 0%
School Retirement 0 0 0% 0 0%
Extraordinary Growth Facilities 0 0 0% 0 0%
Special Reserve 0 0 0%
KPERS Spec. Ret. Contribution 0 0 0% 0 0%
Contingency Reserve 0 0 0%
Text Book & Student Material 0 0 0%
Activity Fund 0 0 0% 0 0%
Bond and Interest #1 3,007,965 3,728,728 24% 4,352,038 17%
Bond and Interest #2 0 0 0% 0 0%
No-Fund Warrant 0 0 0% 0 0%
Special Assessment 0 0 0% 0 0%
Temporary Note 0 0 0% 0 0%
SUBTOTAL 3,193,324 3,913,924 23% 4,537,036 16%
Enrollment (FTE)* 6,263.2 6,274.4 0% 6,284.0 0%
Amount per Pupil 510 624 22% 722 16%
Adult Education 0 0 0% 0 0%
Adult Supplemental Education 0 0 0% 0 0%
Tuition Reimbursement 0 0 0% 0 0%
Special Education Coop 0 0 0% 0 0%
TOTAL 3,193,324 3,913,924 23% 4,537,036 16%
NOTE: Gifts/Grants includes private grants and grants from nonfederal sources.
Amount per pupil excludes the following funds: Adult Education, Adult Supplemental Education, Special Education Coop
and Tuition Reimbursement.
*Enrollment (FTE) includes the enrollment of the district used for state aid and budget authority, and all other preschool enrollment
and kindergarten students attending full time.
0
500,000
1,000,000
1,500,000
2,000,000
2,500,000
3,000,000
3,500,000
4,000,000
4,500,000
5,000,000
2011-2012 2012-2013 2013-2014
3,193,324
3,913,924
4,537,036
Deb Services (5100)
9/10/2013 2:27 PM Sumexpen.xlsx Page 16 of 24

USD# 260
Transfers (5200)
% %
2011-2012 2012-2013 inc/ 2013-2014 inc/
Actual Actual dec Budget dec
General 10,800,669 12,015,674 11% 11,684,136 -3%
Federal Funds 0 0 0% 0 0%
Supplemental General 1,901,849 1,562,128 -18% 2,481,630 59%
At Risk (4yr Old) 0 0 0% 0 0%
At Risk (K-12) 0 0 0% 0 0%
Bilingual Education 0 0 0% 0 0%
Virtual Education 0 0 0% 0 0%
Capital Outlay
Driver Training 0 0 0% 0 0%
Declining Enrollment 0 0 0% 0 0%
Extraordinary School Program 0 0 0% 0 0%
Food Service 0 0 0% 0 0%
Professional Development 0 0 0% 0 0%
Parent Education Program 0 0 0% 0 0%
Summer School 0 0 0% 0 0%
Special Education 0 0 0% 0 0%
Cost of Living 0 0 0% 0 0%
Vocational Education 0 0 0% 0 0%
Gifts/Grants 0 0 0% 0 0%
Special Liability 0 0 0% 0 0%
School Retirement 0 0 0% 0 0%
Extraordinary Growth Facilities 0 0 0% 0 0%
Special Reserve 0 0 0%
KPERS Spec. Ret. Contribution 0 0 0% 0 0%
Contingency Reserve 0 0 0% 0 0%
Text Book & Student Material 0 0 0% 0 0%
Activity Fund 0 0 0% 0 0%
Bond and Interest #1 0 0 0% 0 0%
Bond and Interest #2 0 0 0% 0 0%
No-Fund Warrant 0 0 0% 0 0%
Special Assessment 0 0 0% 0 0%
Temporary Note 0 0 0% 0 0%
SUBTOTAL 12,702,518 13,577,802 7% 14,165,766 4%
Enrollment (FTE)* 6,263.2 6,274.4 0% 6,284.0 0%
Amount per Pupil 2,028 2,164 7% 2,254 4%
Adult Education 0 0 0% 0 0%
Adult Supplemental Education 0 0 0% 0 0%
Tuition Reimbursement 0 0 0% 0 0%
Special Education Coop 0 0 0% 0 0%
TOTAL 12,702,518 13,577,802 7% 14,165,766 4%
NOTE: Gifts/Grants includes private grants and grants from nonfederal sources.
Amount per pupil excludes the following funds: Adult Education, Adult Supplemental Education, Special Education Coop
and Tuition Reimbursement.
*Enrollment (FTE) includes the enrollment of the district used for state aid and budget authority, and all other preschool enrollment
and kindergarten students attending full time.
11,500,000
12,000,000
12,500,000
13,000,000
13,500,000
14,000,000
14,500,000
2011-2012 2012-2013 2013-2014
12,702,518
13,577,802
14,165,766
Transfers (5200)
9/10/2013 2:27 PM Sumexpen.xlsx Page 17 of 24

USD# 260
Miscellaneous Information
Unencumbered Cash Balance by Fund
July 1, 2011 July 1, 2012 July 1, 2013
General 0 0 0
Federal Funds 6,843 -19,692 -503,528
Supplemental General 440,754 635,004 509,451
At Risk (4yr Old) 0 0 0
At Risk (K-12) 0 0 0
Bilingual Education 3,262 0 0
Virtual Education 0 0 0
Capital Outlay 4,819,963 5,549,537 3,072,114
Driver Training 18,242 21,222 22,216
Declining Enrollment 0 0 0
Extraordinary School Program 0 0 0
Food Service 723,452 816,495 808,718
Professional Development 59 5 0
Parent Education Program 30,109 0 0
Summer School 14,587 25,433 25,204
Special Education 1,033,683 843,982 743,345
Cost of Living 0 0 0
Vocational Education 0 0 0
Gifts/Grants 130,705 87,501 78,048
Special Liability 0 0 0
School Retirement 0 0 0
Extraordinary Growth Facilities 0 0 0
Special Reserve 0 0 0
KPERS Spec. Ret. Contribution 0 0 0
Contingency Reserve 2,802,618 2,183,960 2,124,721
Text Book & Student Material 8,713 50,045 86,369
Activity Fund 0 0 0
Bond and Interest #1 2,978,266 2,879,576 3,361,083
Bond and Interest #2 0 0 0
No Fund Warrant 0 0 0
Special Assessment 92,342 127,920 77,048
Temporary Note 0 0 0
SUBTOTAL 13,103,598 13,200,988 10,404,789
Enrollment (FTE)* 6,263.2 6,274.4 6,284.0
Amount per Pupil 2,092 2,104 1,656
Adult Education 0 0 0
Adult Supplemental Education 119,255 122,604 0
Tuition Reimbursement 0 0 0
Special Education Coop 0 0 0
TOTAL 13,222,853 13,323,592 10,404,789
NOTE: Gifts/Grants includes private grants and grants from nonfederal sources.
Amount per pupil excludes the following funds: Adult Education, Adult Supplemental Education, Special Education Coop
and Tuition Reimbursement.
*Enrollment (FTE) includes the enrollment of the district used for state aid and budget authority, and all other preschool enrollment
and kindergarten students attending full time.
0
2,000,000
4,000,000
6,000,000
8,000,000
10,000,000
12,000,000
14,000,000
July 1, 2011 July 1, 2012 July 1, 2013
13,222,853 13,323,592
10,404,789
Unencumbered Cash Balances by Fund
9/10/2013 2:27 PM Sumexpen.xlsx Page 18 of 24

USD# 260
Reserve Funds
Unencumbered Cash Balance
July 1, 2011 July 1, 2012 July 1, 2013
Special Reserve 0 0 0
TOTAL OTHER 0 0 0
Amount per Pupil $0 $0 $0
*School districts are authorized by law to self insure rather than purchase insurance for the following categories: Worker's Comp,
Health Insurance, Life Insurance, Property and Casualty (Risk Management) and Disability Income Insurance. Monies are placed
in the Self Insured Fund to pay for claims which may arise from the categories listed above.
0
0
0
0
0
1
1
1
1
1
1
July 1, 2011 July 1, 2012 July 1, 2013
0 0 0
Unencumbered Cash Balances by Fund (Reserve Funds Only)
9/10/2013 2:27 PM Sumexpen.xlsx Page 19 of 24

USD# 260
2009-2010 2010-2011 % 2011-2012 % 2012-2013 % 2013-2014 %
Actual Actual inc/ Actual inc/ Actual inc/ Budget inc/
dec dec dec dec
Enrollment (FTE)* 6,220.2 6,175.7 -1% 6,261.4 1% 6,296.4 1% 6,334.0 1%
Enrollment (FTE)** 6,310.1 6,288.2 0% 6,263.2 0% 6,274.4 0% 6,284.0 0%
Number of Students -
Free Meals 2,051 2,072 1% 2,198 6% 2,378 8% 2,543 7%
Number of Students -
Reduced Meals 691 791 14% 810 2% 719 -11% 756 5%
*FTE for state aid and budget authority purposes for general fund (excludes 4 yr old at-risk).
** FTE includes 9/20 enrollment used for state aid purposes and adding the additional FTE for preschool programs, headstart, and all-day
kindergarten. For example, preschool students attending half days on September 20th would be counted as .5 FTE. Kindergarten
students attending full time every day would be counted as 1.0 FTE.
Enrollment Information
6230.0
6240.0
6250.0
6260.0
6270.0
6280.0
6290.0
6300.0
6310.0
6320.0
2009-2010 2010-2011 2011-2012 2012-2013 2013-2014
6310.1
6288.2
6263.2
6274.4
6284.0
Enrollment (FTE)** Used for Calculating "Amount per Pupil"
0
500
1000
1500
2000
2500
3000
2009-2010 2010-2011 2011-2012 2012-2013 2013-2014
2051 2072 2198
2378 2543
691 791 810 719 756
Low Income Students
Free Meals
Reduced Meals
6050.0
6100.0
6150.0
6200.0
6250.0
6300.0
6350.0
2009-2010 2010-2011 2011-2012 2012-2013 2013-2014
6220.2
6175.7
6261.4
6296.4
6334.0
FTE Enrollment for Budget Authority
9/10/2013 2:27 PM Sumexpen.xlsx Page 20 of 24

USD# 260
Miscellaneous Information
Mill Rates by Fund
2011-2012 2012-2013 2013-2014
Actual Actual Budget
General 20.000 20.000 20.000
Supplemental General 19.265 18.297 19.342
Adult Education 0.000 0.000 0.000
Capital Outlay 6.000 5.998 6.000
Declining Enrollment 0.000 0.000 0.000
Cost of Living 0.000 0.000 0.000
Special Liability 0.000 0.000 0.000
School Retirement 0.000 0.000 0.000
Extraordinary Growth Facilities 0.000 0.000 0.000
Bond and Interest #1 5.273 7.949 7.900
Bond and Interest #2 0.000 0.000 0.000
No Fund Warrant 0.000 0.000 0.000
Special Assessment 0.092 0.063 0.063
Temporary Note 0.000 0.000 0.000
TOTAL USD 50.630 52.307 53.305
Historical Museum 0.000 0.000 0.000
Public Library Board 0.000 0.000 0.000
Public Library Brd & Emp Benf 0.000 0.000 0.000
Recreation Commission 5.589 5.587 5.589
Rec Comm Employee Bnfts 1.412 1.411 1.412
TOTAL OTHER 7.001 6.998 7.001
0.000
10.000
20.000
30.000
40.000
50.000
60.000
70.000
80.000
2011-2012 2012-2013 2013-2014
50.630 52.307 53.305
Total USD Mill Rates
General 38%
Supplemental General 36%
Capital Outlay 11%
Bond and Interest #1 15%
2013-14 Miscellaneous Information Mill Rates by Fund (Total USD)
General
Supplemental General
Adult Education
Capital Outlay
Special Liability
School Retirement
Declining Enrollment
Cost of Living
Bond and Interest #1
Bond and Interest #2
Extraordinary Growth Facilities
No Fund Warrant
Special Assessment
Temporary Note
9/10/2013 2:27 PM Sumexpen.xlsx Page 21 of 24
USD# 260
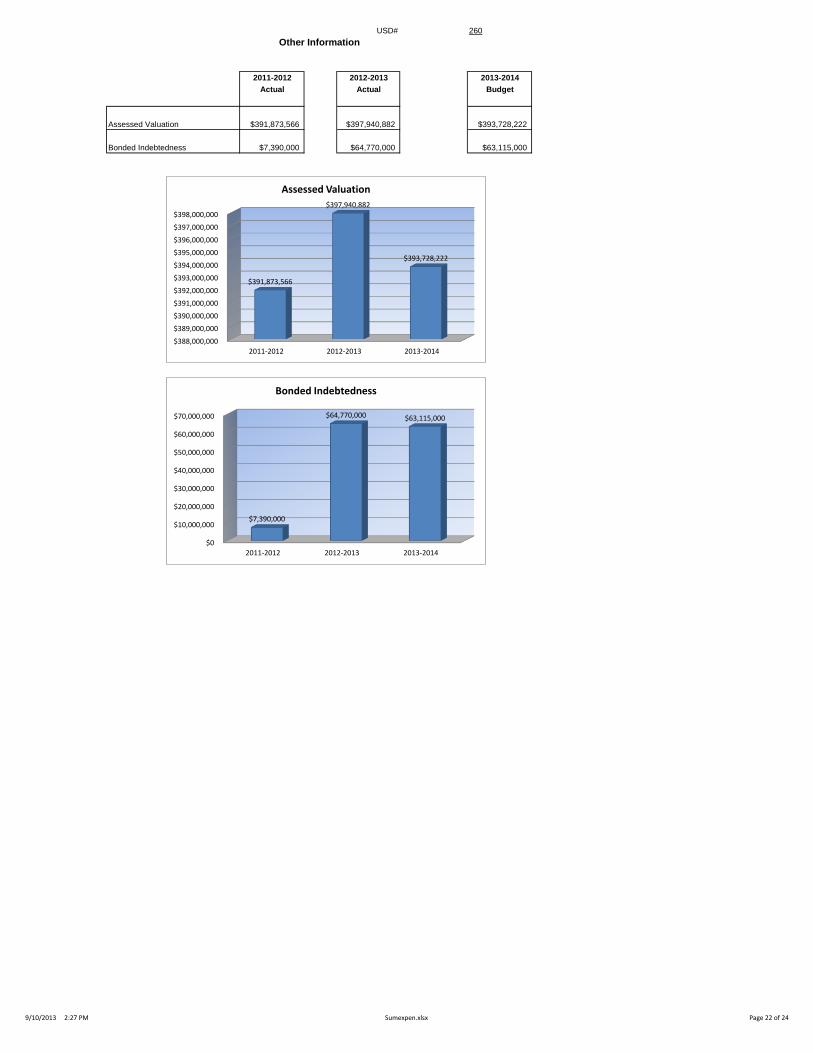
Other Information
2011-2012 2012-2013 2013-2014
Actual Actual Budget
Assessed Valuation $391,873,566 $397,940,882 $393,728,222
Bonded Indebtedness $7,390,000 $64,770,000 $63,115,000
$388,000,000
$389,000,000
$390,000,000
$391,000,000
$392,000,000
$393,000,000
$394,000,000
$395,000,000
$396,000,000
$397,000,000
$398,000,000
2011-2012 2012-2013 2013-2014
$391,873,566
$397,940,882
$393,728,222
Assessed Valuation
$0
$10,000,000
$20,000,000
$30,000,000
$40,000,000
$50,000,000
$60,000,000
$70,000,000
2011-2012 2012-2013 2013-2014
$7,390,000
$64,770,000 $63,115,000
Bonded Indebtedness
9/10/2013 2:27 PM Sumexpen.xlsx Page 22 of 24
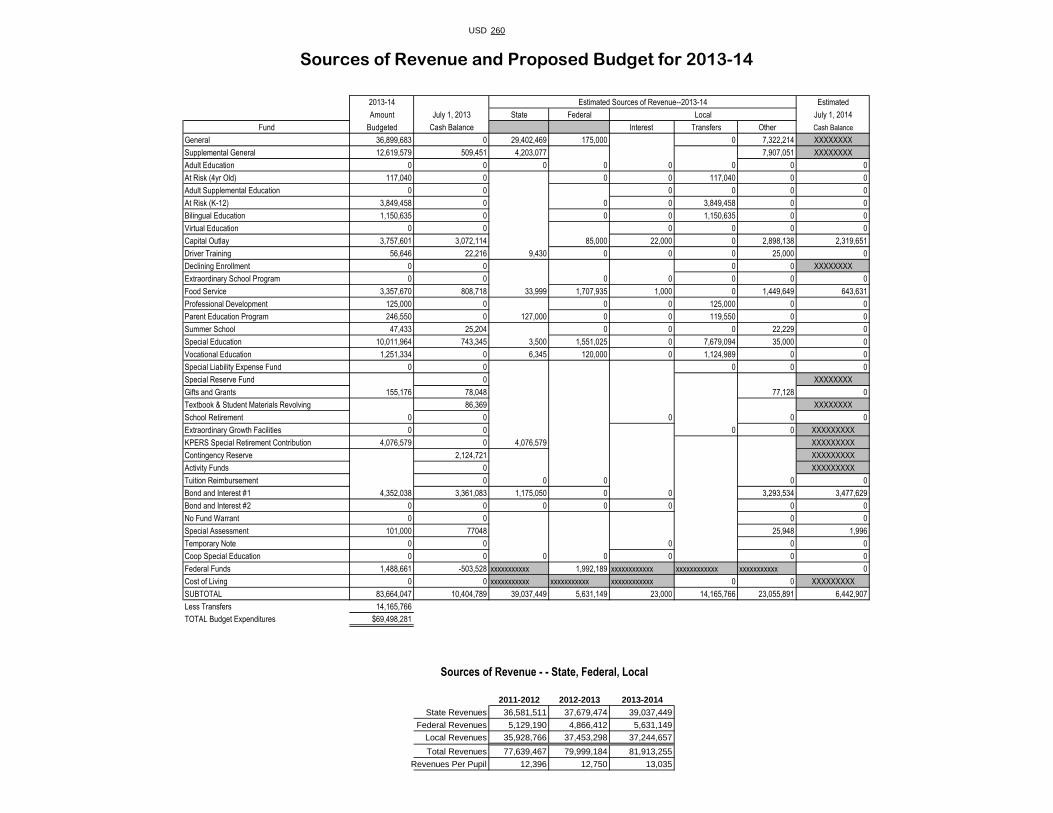
USD 260
2013-14 Estimated Sources of Revenue--2013-14 Estimated
Amount July 1, 2013 State Federal Local July 1, 2014
Fund Budgeted Cash Balance Interest Transfers Other Cash Balance
General 36,899,683 0 29,402,469 175,000 0 7,322,214 XXXXXXXX
Supplemental General 12,619,579 509,451 4,203,077 7,907,051 XXXXXXXX
Adult Education 0 0 0 0 0 0 0 0
At Risk (4yr Old) 117,040 0 0 0 117,040 0 0
Adult Supplemental Education 0 0 0 0 0 0
At Risk (K-12) 3,849,458 0 0 0 3,849,458 0 0
Bilingual Education 1,150,635 0 0 0 1,150,635 0 0
Virtual Education 0 0 0 0 0 0
Capital Outlay 3,757,601 3,072,114 85,000 22,000 0 2,898,138 2,319,651
Driver Training 56,646 22,216 9,430 0 0 0 25,000 0
Declining Enrollment 0 0 0 0 XXXXXXXX
Extraordinary School Program 0 0 0 0 0 0 0
Food Service 3,357,670 808,718 33,999 1,707,935 1,000 0 1,449,649 643,631
Professional Development 125,000 0 0 0 125,000 0 0
Parent Education Program 246,550 0 127,000 0 0 119,550 0 0
Summer School 47,433 25,204 0 0 0 22,229 0
Special Education 10,011,964 743,345 3,500 1,551,025 0 7,679,094 35,000 0
Vocational Education 1,251,334 0 6,345 120,000 0 1,124,989 0 0
Special Liability Expense Fund 0 0 0 0 0
Special Reserve Fund 0 XXXXXXXX
Gifts and Grants 155,176 78,048 77,128 0
Textbook & Student Materials Revolving 86,369 XXXXXXXX
School Retirement 0 0 0 0 0
Extraordinary Growth Facilities 0 0 0 0 XXXXXXXXX
KPERS Special Retirement Contribution 4,076,579 0 4,076,579 XXXXXXXXX
Contingency Reserve 2,124,721 XXXXXXXXX
Activity Funds 0 XXXXXXXXX
Tuition Reimbursement 0 0 0 0 0
Bond and Interest #1 4,352,038 3,361,083 1,175,050 0 0 3,293,534 3,477,629
Bond and Interest #2 0 0 0 0 0 0 0
No Fund Warrant 0 0 0 0
Special Assessment 101,000 77048 25,948 1,996
Temporary Note 0 0 0 0 0
Coop Special Education 0 0 0 0 0 0 0
Federal Funds 1,488,661 -503,528 xxxxxxxxxxx 1,992,189 xxxxxxxxxxxx xxxxxxxxxxxx xxxxxxxxxxx 0
Cost of Living 0 0 xxxxxxxxxxx xxxxxxxxxxx xxxxxxxxxxxx 0 0 XXXXXXXXX
SUBTOTAL 83,664,047 10,404,789 39,037,449 5,631,149 23,000 14,165,766 23,055,891 6,442,907
Less Transfers 14,165,766
TOTAL Budget Expenditures $69,498,281
2011-2012 2012-2013 2013-2014
State Revenues 36,581,511 37,679,474 39,037,449
Federal Revenues 5,129,190 4,866,412 5,631,149
Local Revenues 35,928,766 37,453,298 37,244,657
Total Revenues 77,639,467 79,999,184 81,913,255
Revenues Per Pupil 12,396 12,750 13,035
Sources of Revenue and Proposed Budget for 2013-14
Sources of Revenue - - State, Federal, Local

Intentionally left blank