department of public instruction kirsten baesler, state superintendent 600 east boulevard ave.,...
TRANSCRIPT

Using Data to Guide Improvement in
Schools and Districts
Department of Public InstructionKirsten Baesler, State Superintendent600 East Boulevard Ave., Department 201Bismarck, ND 58505-0440
Beth Larson-StecklerFederal Title ProgramsProgram [email protected]

Objectives for Session
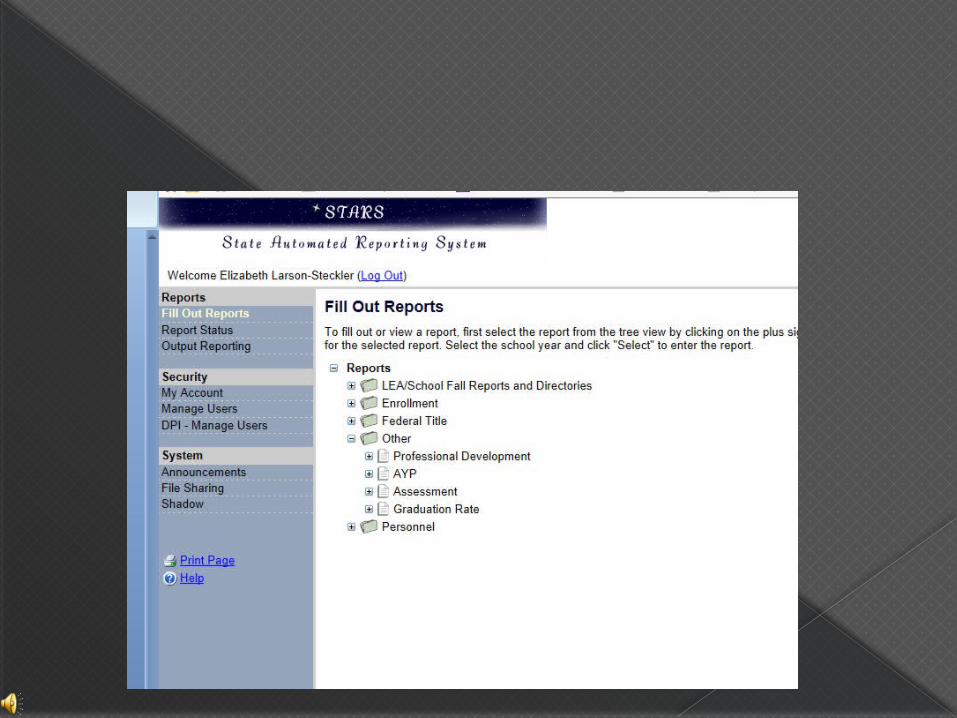
1. Acquaint or re-acquaint participants with the achievement data produced by NDDPI.
2. Acquaint or re-acquaint participants with where specific data can be found and or accessed.
3. Demonstrate how data can be utilized to guide district/school improvement and assist in meeting federal requirements

You are here

Types of Data/Reports Generated by NDDPIAdequate Yearly Progress (AYP)
School Building AYP District AYP State AYP
School District Profile Assessment Participation Rates for Students with Disabilities Special Education Performance Information
Comparative Reports Comparative School Building Reports Comparative District Reports
Statewide Summary Reports State Highly Qualified Teachers School Plant Academic Achievement District Academic Achievement
Growth Model Student Growth Projection Roster Report

ND
DEPA
RTM
EN
T O
F P
UB
LIC
INS
TR
UC
TIO
NN
D S
CH
OO
L D
ISTR
ICT P
RO
FIL
ES
This page can be found @ http://www.dpi.state.nd.us/dpi/reports/Profile/index.shtm

IND
IVID
UA
L DIS
TR
ICT S
CR
EEN


*The Dreaded Asterisk

2004-2005 2005-2006 2006-2007 2007-2008 2008-2009 2009-2010 2010-2011 2011-2012
Math - Goal
0.5048029863
0.506270412300002
0.5035952941
0.671008067800002
0.672102627300002
0.669955716600005
0.835168072300002
0.8351128967
Math - Achieved
0.690454950900001
0.722394678500002
0.7827155825
0.7700862895
0.7823193916
0.797690014900002
0.7961091699
0.7954545455
5%
15%
25%
35%
45%
55%
65%
75%
85%
Perc
enta
ge o
f Stu
dents
in
Pro
ficie
nt
and A
dvanced
State Established Mathematics Goals Compared to Actual Achievement for All (Composite) Students

2004-2005
2005-2006
2006-2007
2007-2008
2008-2009
2009-2010
2010-2011
2011-2012
Math-emat-ics
0.6904549509
0.72239467850000
2
0.7827155825
0.7700862895
0.7823193916
0.79769001490000
2
0.7961091699
0.7954545455
63%
65%
67%
69%
71%
73%
75%
77%
79%
81%
Perc
enta
ge o
f Stu
dents
in
Pro
ficie
nt
and A
dvanced
Longitudinal Mathematics Achievement for All (Composite) Students

2004-2005 2005-2006 2006-2007 2007-2008 2008-2009 2009-2010 2010-2011 2011-2012
Goal - Reading
0.646914893600003
0.663666666700001
0.671057142900001
0.7812592593
0.776160000000001
0.7843030303
0.8901384615
0.884037037
Achieved - Reading
0.704545454500003
0.700000000000001
0.6790123457
0.764705882400004
0.666666666700001
0.7666666667
0.756302521
0.7936507937
5%
15%
25%
35%
45%
55%
65%
75%
85%
95%
Perc
enta
ge o
f Stu
dents
in
Pro
ficie
nt
and A
dvanced
Comparative DataState Established Goals in Reading Compared to Actual Achievement for All Students (Composite)

Longitudinal DataLongitudinal Reading Data for All Students (Composite)
2004-2005 2005-2006 2006-2007 2007-2008 2008-2009 2009-2010 2010-2011 2011-2012
Reading 0.704545454500003
0.700000000000001
0.6790123457
0.764705882400004
0.666666666700001
0.7666666667
0.756302521
0.7936507937
63%
68%
73%
78%
83%
Perc
enta
ge o
f Stu
dents
in P
rofi
cie
nt
and A
dvanced

School Plant Profile
Assessment
Participation Rates for Students with Disabilities
Special Education Performance Information

Assessment Report
Average Daily Attendance Graduation Rates Adequate Yearly Progress School Assessment (Detailed)
› Proficiency Breakouts – by Demographic Group› Proficiency Breakouts – by Grade
School Assessment Over Time Benchmarks (Detailed)
› Benchmark Results – Average Percent Correct –By Grade
› NAEP Results› Highly Qualified Teachers (Specific to District)

Math Achievement Rates (Across All Grades)

Math Participation Rates (Across All Grades)

Proficiency Levels
Advanced
Proficient
Partially Proficient
Novice

Proficiency Levels -Reading
2004-2005 2005-2006 2006-2007 2007-2008 2008-2009 2009-2010 2010-2011 2011-2012
Novice 0.0612 0.0425 0.0335 0.0501 0.0369 0.0437 0.0395 0.0507
Partially Profi-cient
0.1906 0.168 0.1573 0.1776 0.1435 0.1672 0.1647 0.1722
Proficient 0.5626 0.5834 0.619700000000002
0.578700000000002
0.5988 0.589 0.5826 0.5896
Advanced 0.1857 0.2061 0.189400000000001
0.1936 0.2208 0.2001 0.2132 0.1876
10.00%
30.00%
50.00%
70.00%
90.00%
110.00%
Bismarck District Proficiency Levels - READING
Levels
of
Achie
vem
ent

Proficiency Levels-Mathematics
2004-2005 2005-2006 2006-2007 2007-2008 2008-2009 2009-2010 2010-2011 2011-2012
Novice 0.0683 0.0494 0.0489 0.0547000000000002
0.045 0.0372000000000001
0.0408 0.0482
Partially Pro-ficient
0.2138 0.1792 0.1763 0.1843 0.1827 0.172 0.1647 0.1661
Proficient 0.5182 0.5362 0.5217 0.5519 0.5321 0.5083 0.5292 0.5251
Advanced 0.1997 0.2353 0.253 0.2091 0.2402 0.2826 0.2653 0.2606
10.00%
30.00%
50.00%
70.00%
90.00%
110.00%
Rugby District Proficiency Levels - MATHEMATICS
Levels
of
Achie
vem
ent

Proficiency Levels-Science
2004-2005 2005-2006 2006-2007 2007-2008 2008-2009 2009-2010 2010-2011 2011-2012
Novice 0 0 0.0798000000000002
0.0954 0.0802 0.0874 0.078 0.0891
Partially Proficient
0 0 0.2819 0.2606 0.2419 0.2568 0.2509 0.2554
Proficient 0 0 0.4812 0.485900000000001
0.5066 0.480300000000001
0.5113 0.496500000000001
Advanced 0 0 0.1571 0.1581 0.1712 0.1756 0.159900000000001
0.158900000000001
10.00%
30.00%
50.00%
70.00%
90.00%
110.00%
Bismarck District Proficiency Levels - SCIENCE
Levels
of
Achie
vem
ent

Comparative District/School Reports

Comparative District Reports

4th Quartile 3rd Quartile 2nd Quartile 1st Quartile


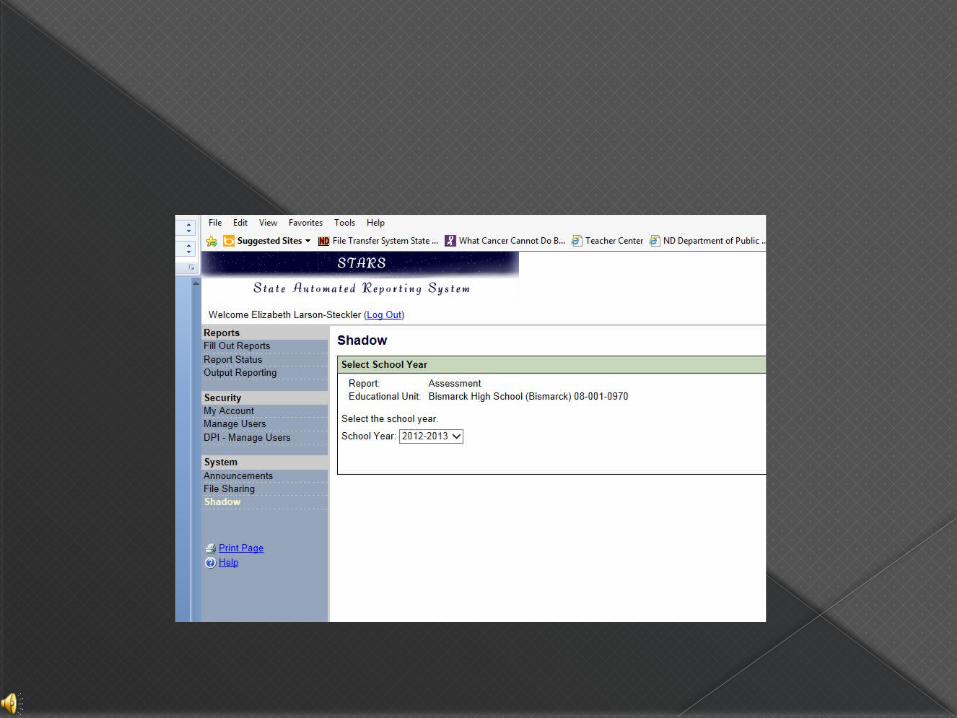
Student Growth Projection

Student Growth Projection


Accessing Student Growth Reports

STARS Administration


Utilizing Data

Needs Assessment
The purpose of the needs assessment is to determine the needs of the LEA’s teaching force in order to be able to have all students meet challenging State content and academic achievementstandards.

Linking Key Elements

Questions

Questions?
Thank You! Have a wonderful day!