department of mathematics, statistics, …webs.wichita.edu/depttools/depttoolsmemberfiles/las/2015...
TRANSCRIPT

DEPARTMENT OF MATHEMATICS, STATISTICS, AND PHYSICS
2015 SELF-STUDY REPORT
Table of contents
Pages
Program Review Self-Study Template ................................................... 1-20
Attachment #1 (Assessment plans) ......................................................... 21-64
Attachment #2 (External reviews describing the professional quality of our
faculty) .................................................................................................... 65-109
Attachment #3 (Office of Planning and Analysis data) .......................... 110-125

1
Program Review Self-Study Template
Academic unit: Mathematics, Statistics, and Physics __________________________________________
College: LAS _________________________________________________________________________
Date of last review 2012
Date of last accreditation report (if relevant) ____________
List all degrees described in this report (add lines as necessary)
Degree: BS Mathematics ______________________________________ CIP* code: _____________
Degree: BS Physics ___________________________________________ CIP* code: _____________
Degree: MS Mathematics _____________________________________ CIP code: ______________
Degree: PhD Mathematics _____________________________________ CIP code: ______________
*To look up, go to: Classification of Instructional Programs Website, http://nces.ed.gov/ipeds/cipcode/Default.aspx?y=55
Faculty of the academic unit (add lines as necessary)
Name * * Faculty signatures are on file in the department.
Mark Arrasmith - Instructor/Unclass Prof.
Elizabeth Behrman - Professor
Stephen Brady – Assoc. Professor
Alexander Bukhgeym – Professor
Dharam Chopra – Professor
Casey Craig – Instructor
Tinka Davis – Instructor
Thomas DeLillo – Professor
Jason Ferguson – Professor
Buma Fridman – Professor
Matthew Gray – Instructor
Hussein Hamdeh – Professor
John Hammond – Instructor
Lop-Hing Ho – Assoc. Professor
Xiaomi Hu – Professor
Leo Huelskamp – Instructor
William Ingle – Instructor/Unclass Prof.
Victor Isakov – Professor

2
Thalia Jeffres – Assoc. Professor
Zhiren Jin – Professor
Buddy Johns – Assoc. Professor
Kirk Lancaster – Professor
Foudil Latioui – Instructor
Tianshi Lu – Assoc. Professor
Chunsheng Ma – Professor
Daowei Ma – Professor
Holger Meyer – Assoc. Professor
Kenneth Miller – Professor
Mathew Muether – Asst. Professor
Hari Mukerjee – Professor
Phillip Parker – Professor
Sandra Peer – Instructor/Unclass Prof.
Rachel Safarik – Instructor
Paul Scheuerman – Instructor/Unclass Prof.
Catherine Searle – Asst. Professor
Nickolas Solomey – Professor
Summer Steenberg – Instructor
Ziqi Sun – Professor
Syed Taher – Assoc. Professor
Richard Traverzo – Instructor
Mark Walsh – Asst. Professor
Submitted by: Buma Fridman, Professor & Chair ______________ Date 04/01/2015 ____
(name and title)
Submitted by: Thomas DeLillo, Professor & Interim Chair ________ Date 04/01/2015 ____
(name and title)
Submitted by: Kirk Lancaster, Graduate Coordinator ____________ Date 04/01/2015 ____
(name and title)
3
1. Departmental purpose and relationship to the University mission (refer to instructions in the WSU
Program Review document for more information on completing this section).
a. University Mission:
b. Program Mission (if more than one program, list each mission):
The mission of the undergraduate program in Mathematics and Statistics is to provide a broadly based
program in undergraduate level mathematics and statistics which will prepare students for either graduate
study in mathematics and statistics or for mathematics-statistics related employment in academic,
industrial or governmental positions. The undergraduate program is committed to providing the
mathematical instruction needed by programs in business, education, engineering and health professions,
as well as in the liberal arts and sciences.
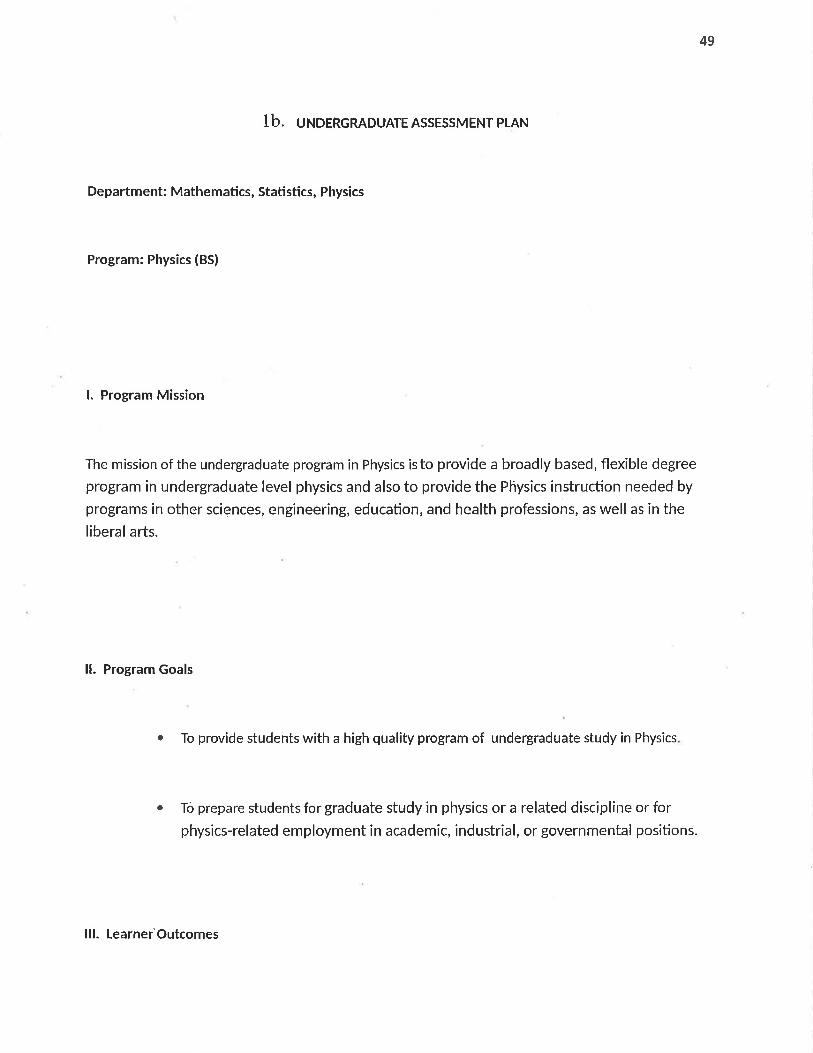
The mission of the undergraduate program in Physics is to provide a broadly based, flexible program in
undergraduate level physics which will prepare students for graduate study in physics or a related
discipline or for physics-related employment in academic, industrial, or governmental positions. The
undergraduate program is also committed to providing the physics instruction needed by programs in
other sciences, engineering, education, and health professions, as well as in the liberal arts.
The mission of the M.S. program in Mathematics is to provide a broadly based, flexible program in
graduate level mathematics and statistics which will prepare students for either doctoral study in
mathematics and statistics; or for mathematics-statistics related employment in academic, industrial or
governmental positions.
The mission of the Ph.D. program in Applied Mathematics is to provide a high quality doctoral program in
applied mathematics that will prepare students to become research mathematicians in either academia,
business or industry.
c. The role of the program (s) and relationship to the University mission: Explain in 1-2 concise paragraphs.
Our department supports the university's educational commitment to the state and community by
providing instruction in mathematics and statistics at all levels from pre-college mathematics through
doctoral study. The need for mathematics permeates the modern technological world and workplace.
Because the extent of mathematical training and expertise required varies considerably according to
profession, the department provides instruction for students with a wide variety of goals and at all levels
from the baccalaureate to the doctoral.
Physics is the root of all sciences and engineering. Without a broad educational base in Physics, programs
in other sciences and in engineering would not have the solid foundation they need, nor would local
industry be provided with the leadership necessary in diverse groups of scientists and engineers.
Both baccalaureate programs and the Master’s program are broadly based programs designed to prepare
students for · employment in any of a wide variety of mathematics, statistics and physics based careers in
science, industry and government, as well as other careers in which logical problem solving skills and
precise thinking are valuable; teaching careers at the middle school, high school, junior college or college
level; further study in mathematics, statistics or physics at a more advanced level.
The mission of Wichita State University is to be an essential educational, cultural, and economic driver for
Kansas and the greater public good.

4
Wichita State University is committed to providing comprehensive educational opportunities in an urban
setting. Through teaching, scholarship and public service the University seeks to equip both students and
the larger community with the educational and cultural tools they need to thrive in a complex world, and
to achieve both individual responsibility in their own lives and effective citizenship in the local, national
and global community.
The Ph.D. program in applied mathematics was developed specifically to support the state's growing
technology-dependent industries. It contributes to and will continue to contribute to the economic
development of the state, and the Wichita metropolitan area in particular. The Ph.D. program aims directly
at building and upgrading the mathematical resources needed to sustain the technological base of the
state. It is designed to provide substantive expertise in areas that are vital to industry in order to promote
effective competition in commercial, governmental and international markets.
The graduate faculty in the department contributes significantly to the university’s research mission. As
reported in ScienceWatch.com on May 31, 2009, WSU ranks in the top 5 universities nationwide in the
contribution of mathematics toward the university’s total research productivity. Effective classroom
teaching and continuing research activity by the faculty are equally important for the well-being and
vitality of the programs offered by the department. Through their professional expertise, members of the
faculty also provide service to the academic community as well as the industrial and commercial
communities within the state.
d. Has the mission of the Program (s) changed since last review? [ ] Yes [X] No
e. Provide an overall description of your program (s) including a list of the measurable goals and objectives of the
program (s) (both programmatic and learner centered). Have they changed since the last review?
[ ] Yes [X] No
The objectives of the undergraduate program in Mathematics and Statistics are:
• to provide students with a solid foundation in the major areas of mathematics and statistics and
an understanding of the role of mathematics and statistics in applications;
• to prepare its graduates for either graduate study in mathematics and statistics, or for careers in
teaching at the high school level or in any of a wide variety of mathematics and statistics based
careers in science, industry and government, as well as other careers in which logical problem
solving skills and precise thinking are valuable.
The objectives of the undergraduate program in Physics are:
• to provide a broadly based, flexible program in undergraduate level physics;
• to prepare its graduates for graduate study in physics or a related discipline or for physics-related
employment in academic, industrial, or governmental positions.
The objectives of the MS program in Mathematics are:
• to provide students with a program of study in which they build on the knowledge acquired in an
undergraduate program in mathematics and statistics by taking more advanced course work (and
optional thesis work) in certain areas of mathematics and/or statistics;
• to prepare its graduates for either further study in mathematics and statistics at the PhD level, a
career in teaching at the high school or junior college level, a career in science, industry or
government that requires graduate level training in mathematics or statistics.
5
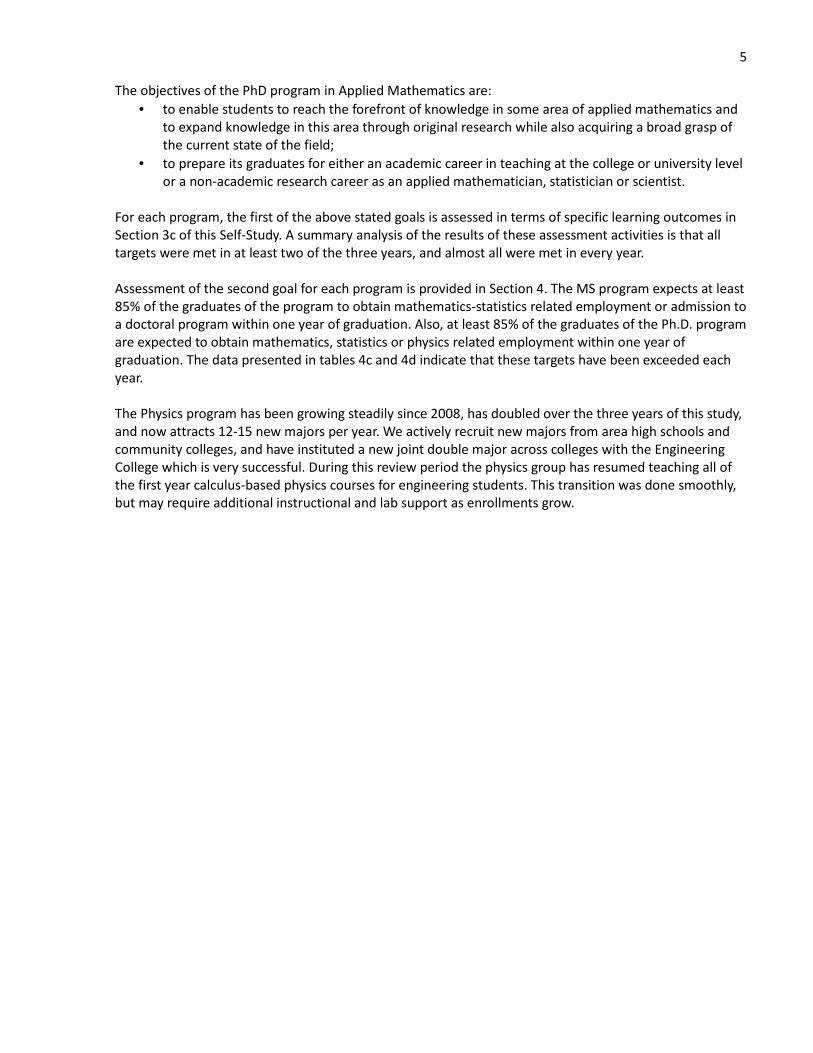
The objectives of the PhD program in Applied Mathematics are:
• to enable students to reach the forefront of knowledge in some area of applied mathematics and
to expand knowledge in this area through original research while also acquiring a broad grasp of
the current state of the field;
• to prepare its graduates for either an academic career in teaching at the college or university level
or a non-academic research career as an applied mathematician, statistician or scientist.
For each program, the first of the above stated goals is assessed in terms of specific learning outcomes in
Section 3c of this Self-Study. A summary analysis of the results of these assessment activities is that all
targets were met in at least two of the three years, and almost all were met in every year.
Assessment of the second goal for each program is provided in Section 4. The MS program expects at least
85% of the graduates of the program to obtain mathematics-statistics related employment or admission to
a doctoral program within one year of graduation. Also, at least 85% of the graduates of the Ph.D. program
are expected to obtain mathematics, statistics or physics related employment within one year of
graduation. The data presented in tables 4c and 4d indicate that these targets have been exceeded each
year.
The Physics program has been growing steadily since 2008, has doubled over the three years of this study,
and now attracts 12-15 new majors per year. We actively recruit new majors from area high schools and
community colleges, and have instituted a new joint double major across colleges with the Engineering
College which is very successful. During this review period the physics group has resumed teaching all of
the first year calculus-based physics courses for engineering students. This transition was done smoothly,
but may require additional instructional and lab support as enrollments grow.
6
2. Describe the quality of the program as assessed by the strengths, productivity, and qualifications of
the faculty in terms of SCH, majors, graduates and scholarly productivity (refer to instructions in the
WSU Program Review document for more information on completing this section). Complete a
separate table for each program if appropriate.
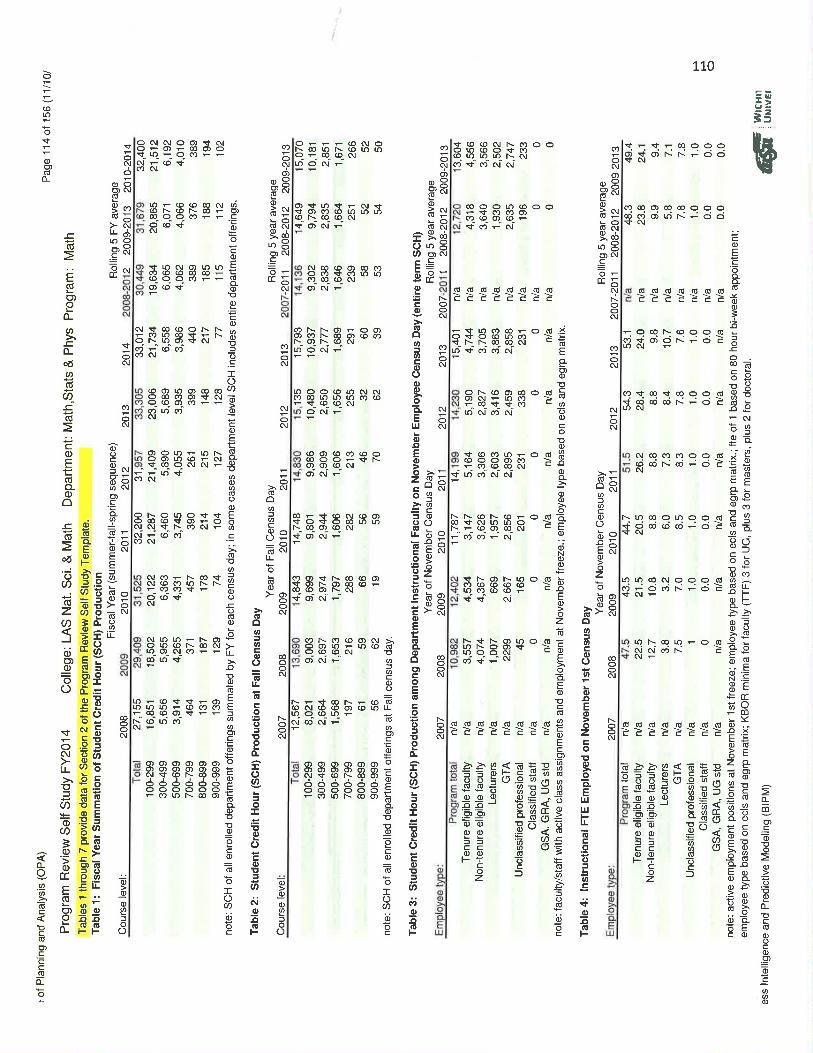
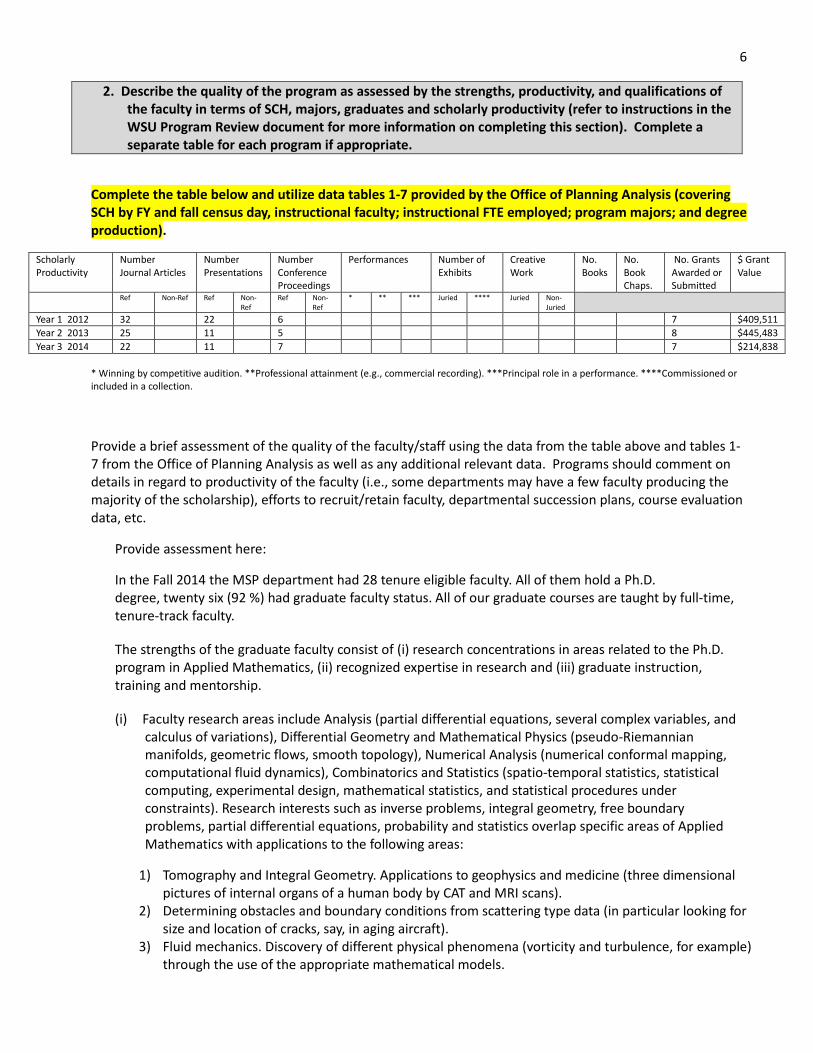
Complete the table below and utilize data tables 1-7 provided by the Office of Planning Analysis (covering
SCH by FY and fall census day, instructional faculty; instructional FTE employed; program majors; and degree
production).
Scholarly
Productivity
Number
Journal Articles
Number
Presentations
Number
Conference
Proceedings
Performances Number of
Exhibits
Creative
Work
No.
Books
No.
Book
Chaps.
No. Grants
Awarded or
Submitted
$ Grant
Value
Ref Non-Ref Ref Non-
Ref
Ref Non-
Ref
* ** *** Juried **** Juried Non-
Juried
Year 1 2012 32 22 6 7 $409,511
Year 2 2013 25 11 5 8 $445,483
Year 3 2014 22 11 7 7 $214,838
* Winning by competitive audition. **Professional attainment (e.g., commercial recording). ***Principal role in a performance. ****Commissioned or
included in a collection.
Provide a brief assessment of the quality of the faculty/staff using the data from the table above and tables 1-
7 from the Office of Planning Analysis as well as any additional relevant data. Programs should comment on
details in regard to productivity of the faculty (i.e., some departments may have a few faculty producing the
majority of the scholarship), efforts to recruit/retain faculty, departmental succession plans, course evaluation
data, etc.
Provide assessment here:
In the Fall 2014 the MSP department had 28 tenure eligible faculty. All of them hold a Ph.D.
degree, twenty six (92 %) had graduate faculty status. All of our graduate courses are taught by full-time,
tenure-track faculty.
The strengths of the graduate faculty consist of (i) research concentrations in areas related to the Ph.D.
program in Applied Mathematics, (ii) recognized expertise in research and (iii) graduate instruction,
training and mentorship.
(i) Faculty research areas include Analysis (partial differential equations, several complex variables, and
calculus of variations), Differential Geometry and Mathematical Physics (pseudo-Riemannian
manifolds, geometric flows, smooth topology), Numerical Analysis (numerical conformal mapping,
computational fluid dynamics), Combinatorics and Statistics (spatio-temporal statistics, statistical
computing, experimental design, mathematical statistics, and statistical procedures under
constraints). Research interests such as inverse problems, integral geometry, free boundary
problems, partial differential equations, probability and statistics overlap specific areas of Applied
Mathematics with applications to the following areas:
1) Tomography and Integral Geometry. Applications to geophysics and medicine (three dimensional
pictures of internal organs of a human body by CAT and MRI scans).
2) Determining obstacles and boundary conditions from scattering type data (in particular looking for
size and location of cracks, say, in aging aircraft).
3) Fluid mechanics. Discovery of different physical phenomena (vorticity and turbulence, for example)
through the use of the appropriate mathematical models.
7
4) Numerical Analysis. Solving of applied problems in various areas, such as fluid dynamics or
mathematical physics, by using high speed computers.
5) Carleman estimates and uniqueness and stability of the continuation for partial differential
equations and related numerical algorithms (for example, determination of vibrations of surfaces
from remote acoustical measurements).
6) Survival Analysis.
7) High energy physics, astrophysics, quantum information, and materials science.
8) Smooth Geometry and Topology (for example, investigating the Hopf Conjecture, Morse functions,
surgery on manifolds).
Our concentrations in partial differential equations (9 graduate faculty), geometry and topology (6
graduate faculty) and probability and statistics (4 graduate faculty) together with faculty research in
several complex variables (3 graduate faculty) and numerical analysis (3 graduate faculty) allow our
graduate students to obtain multiple perspectives of major areas of applied mathematics and statistics
and to learn a large variety of complementary mathematical, computational and statistical techniques
which will assist them in their careers.
(ii) Faculty research expertise is illustrated in many different ways:
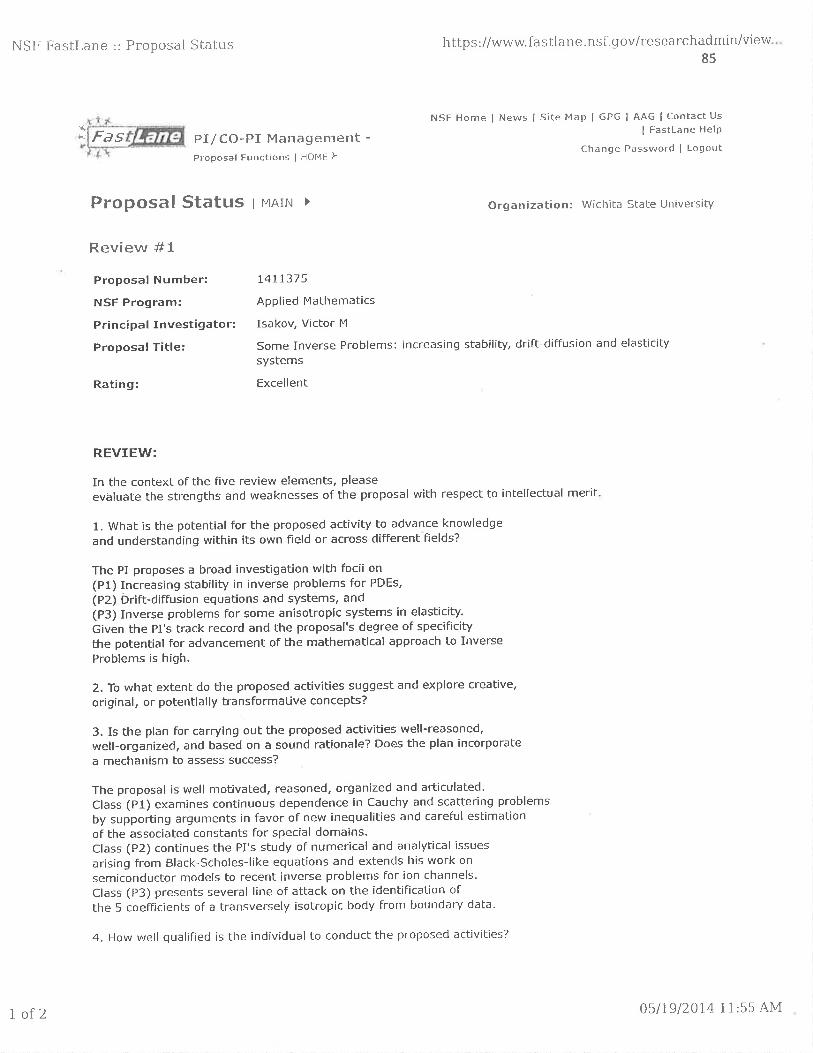
In 2006, Victor Isakov was awarded the rank of Distinguished Professor of Mathematics. It was the first
time in the (more than 100 years of) history of our department that our faculty member received such
an award. We believe that this award, as well as many awards and recognitions our faculty have
received year-after-year in the past 10-15 years, speaks to the quality of fundamental and applied
research our department is involved in. Alan Elcrat (2000) and Victor Isakov (2001) won the WSU
Excellence in Research Award. Chunsheng Ma (2005) and Christian Wolf (2007) won the WSU Young
Faculty Scholar Award.
Over the past three years one faculty has been promoted to Associate Professor, two to Full Professor,
three successfully underwent Professor Incentive review.
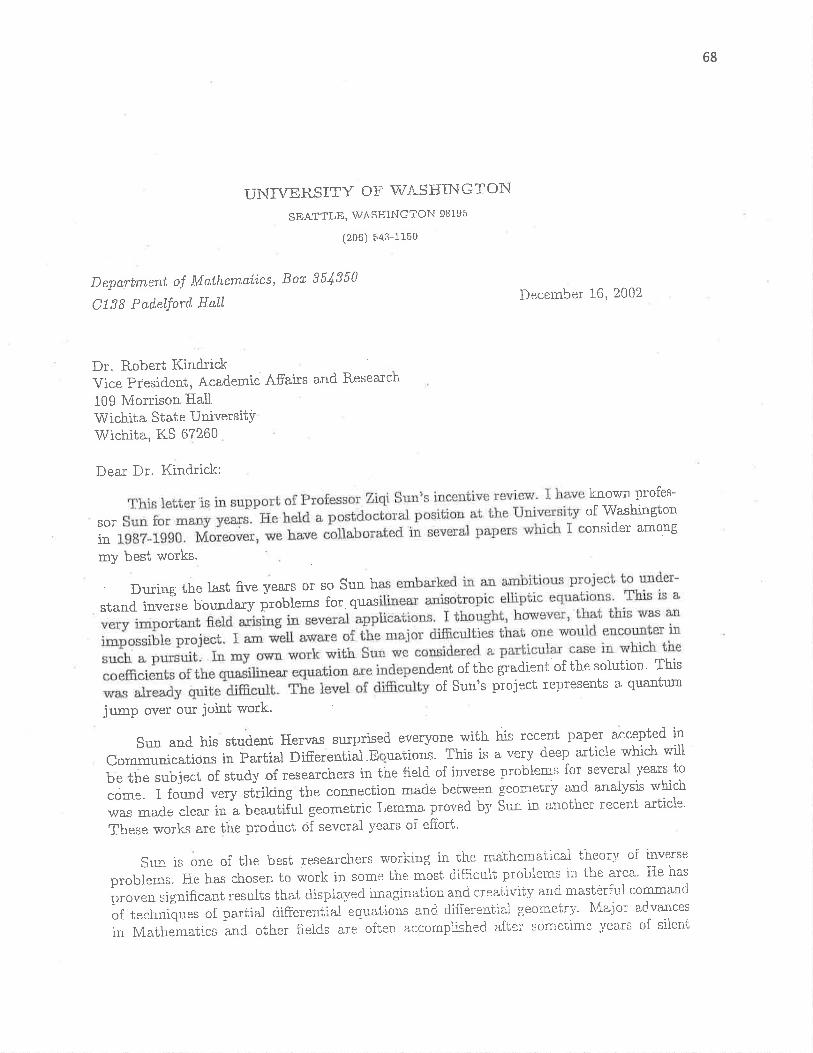
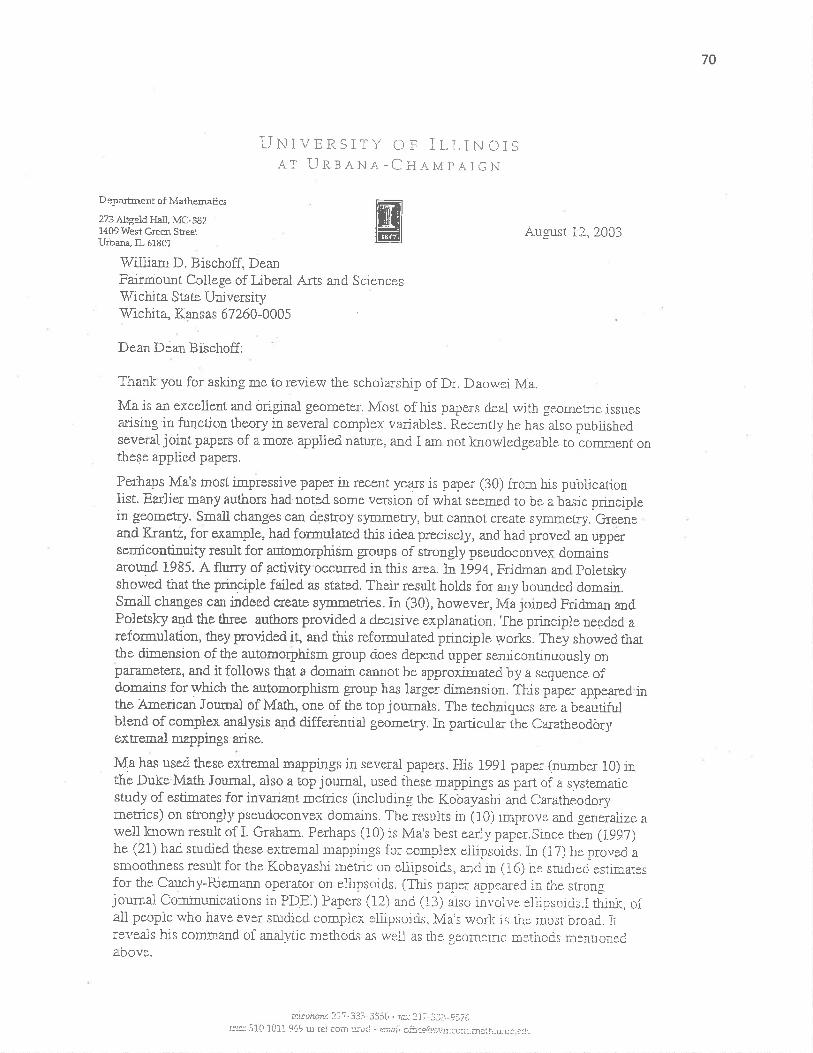
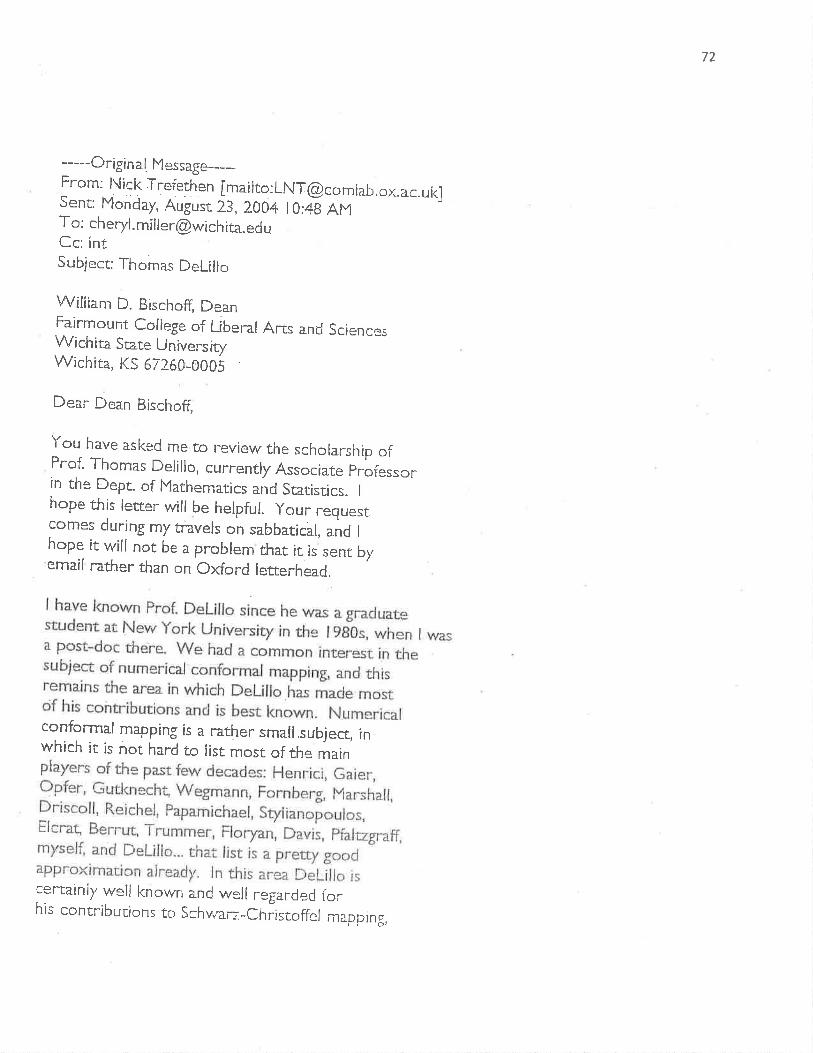
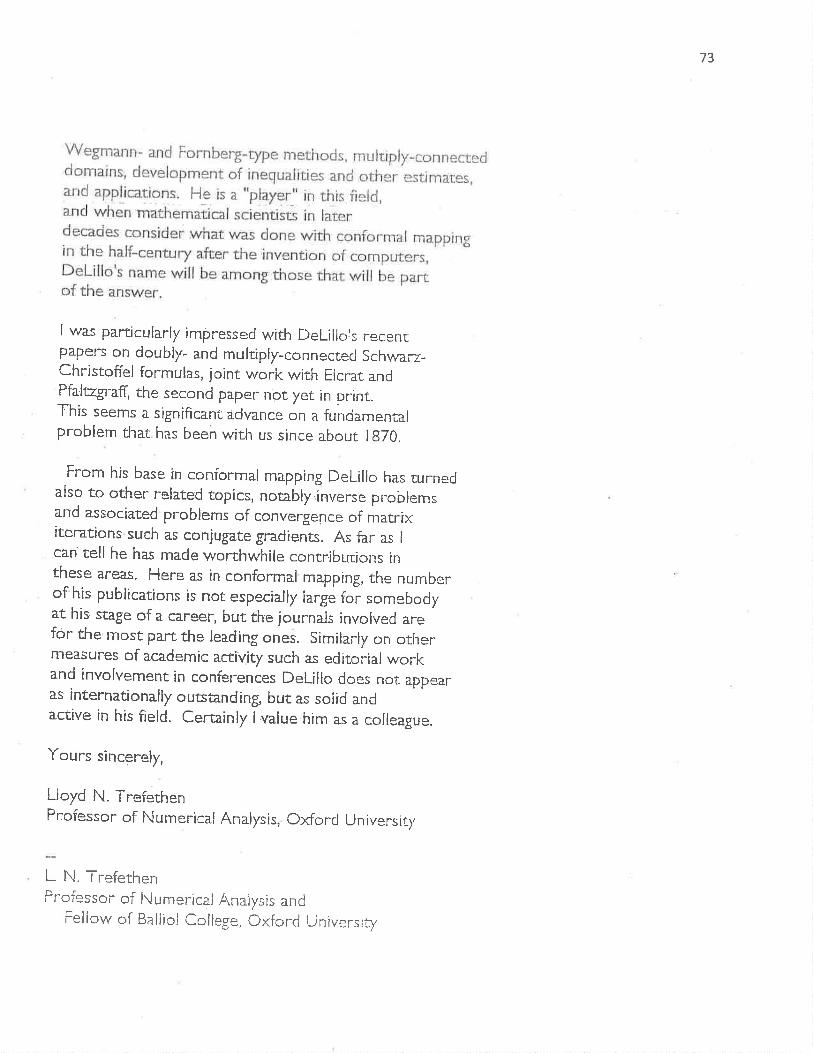
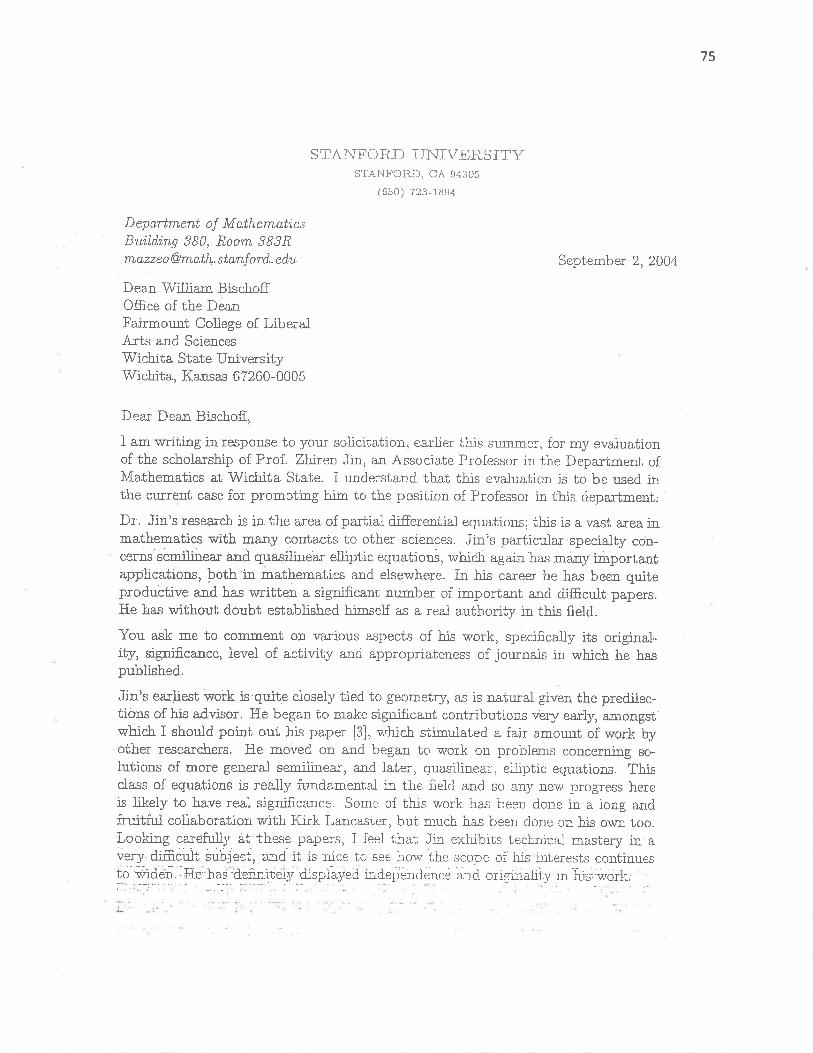
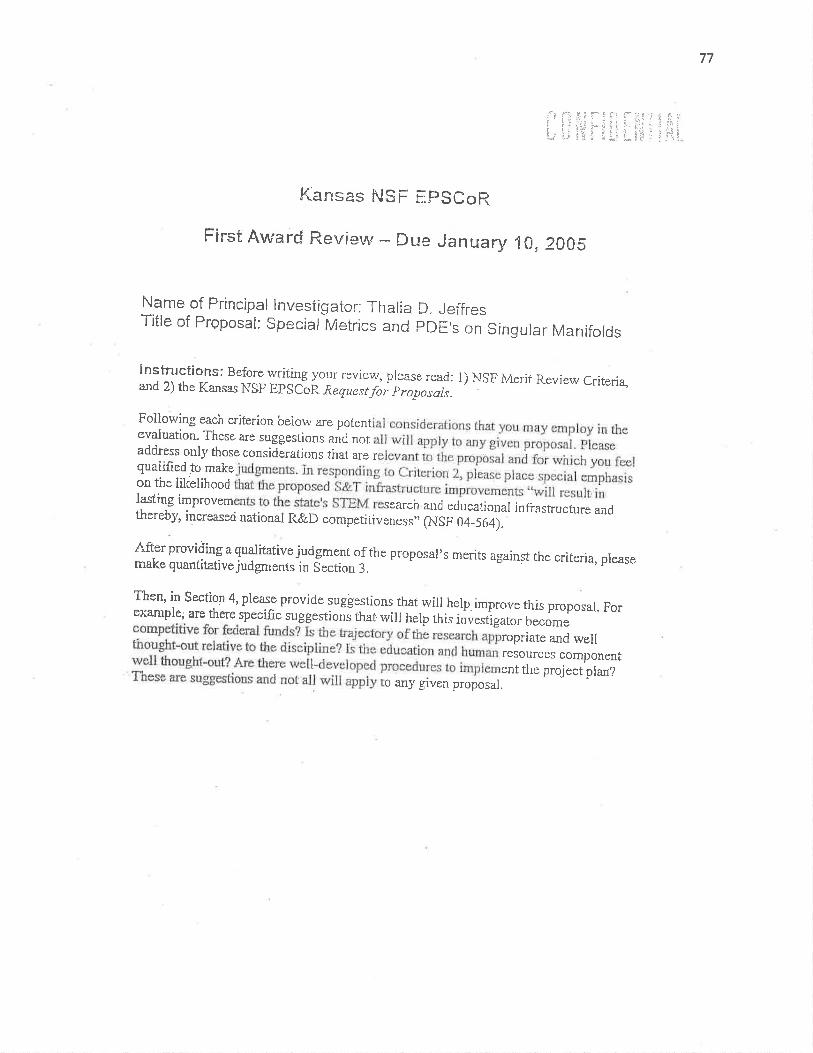
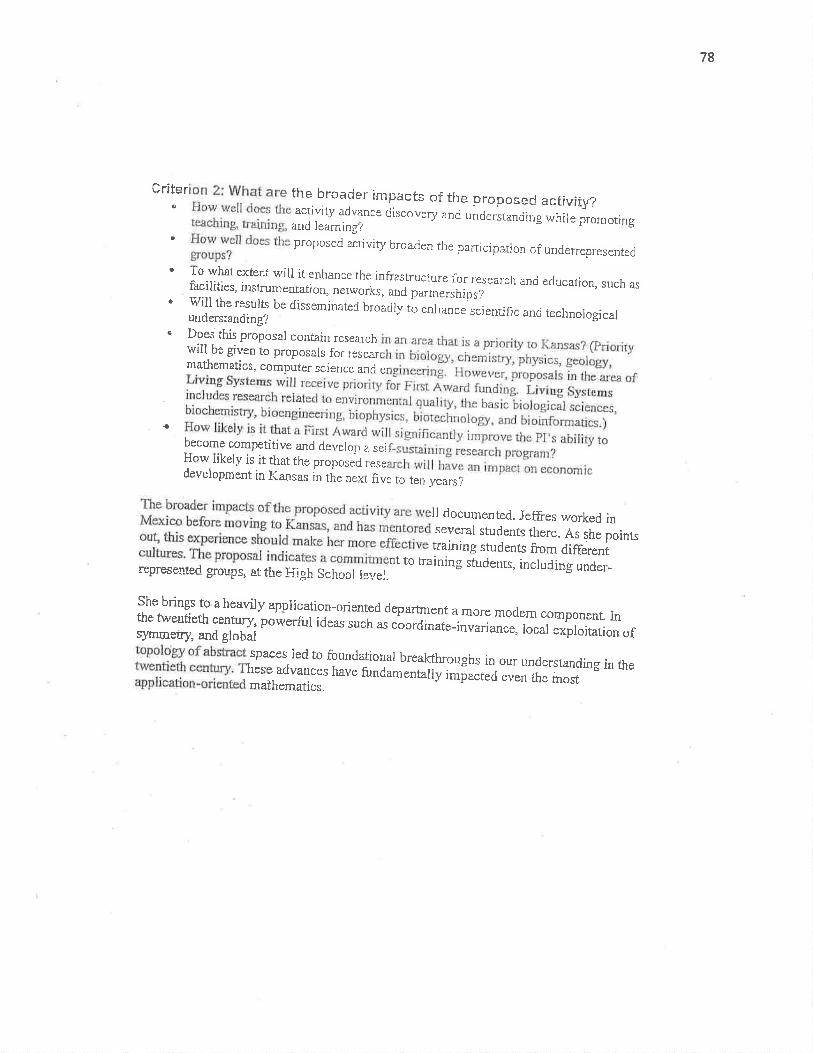
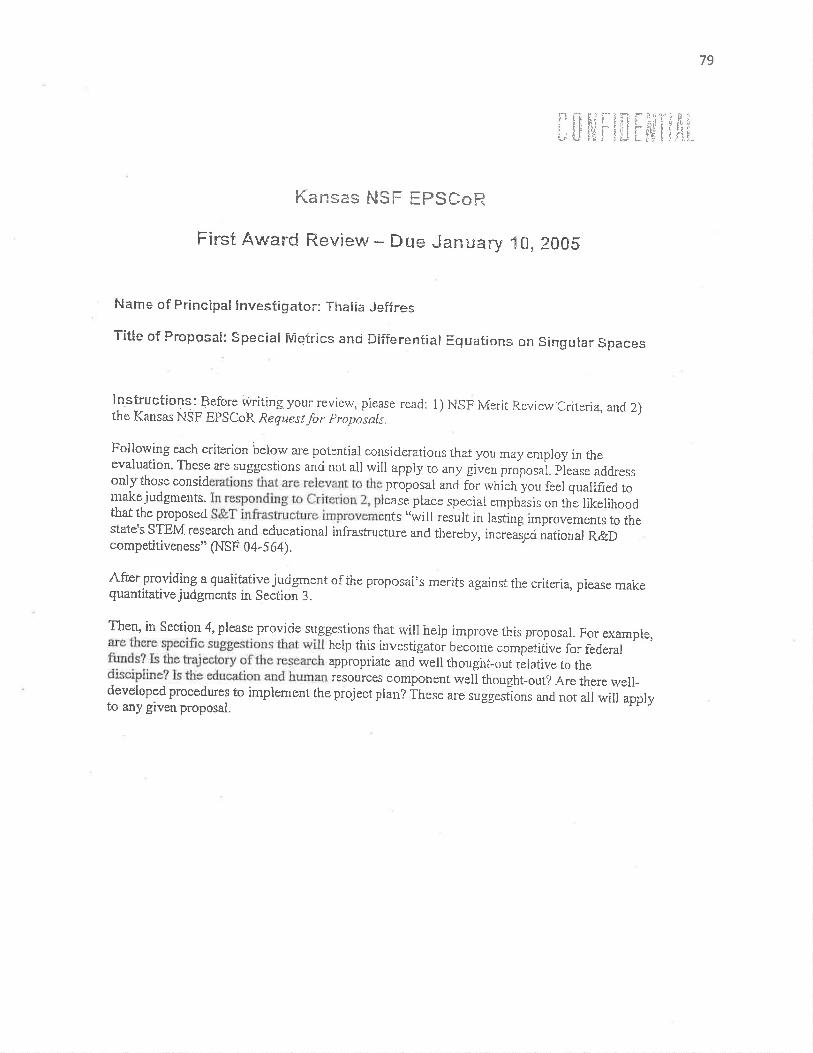
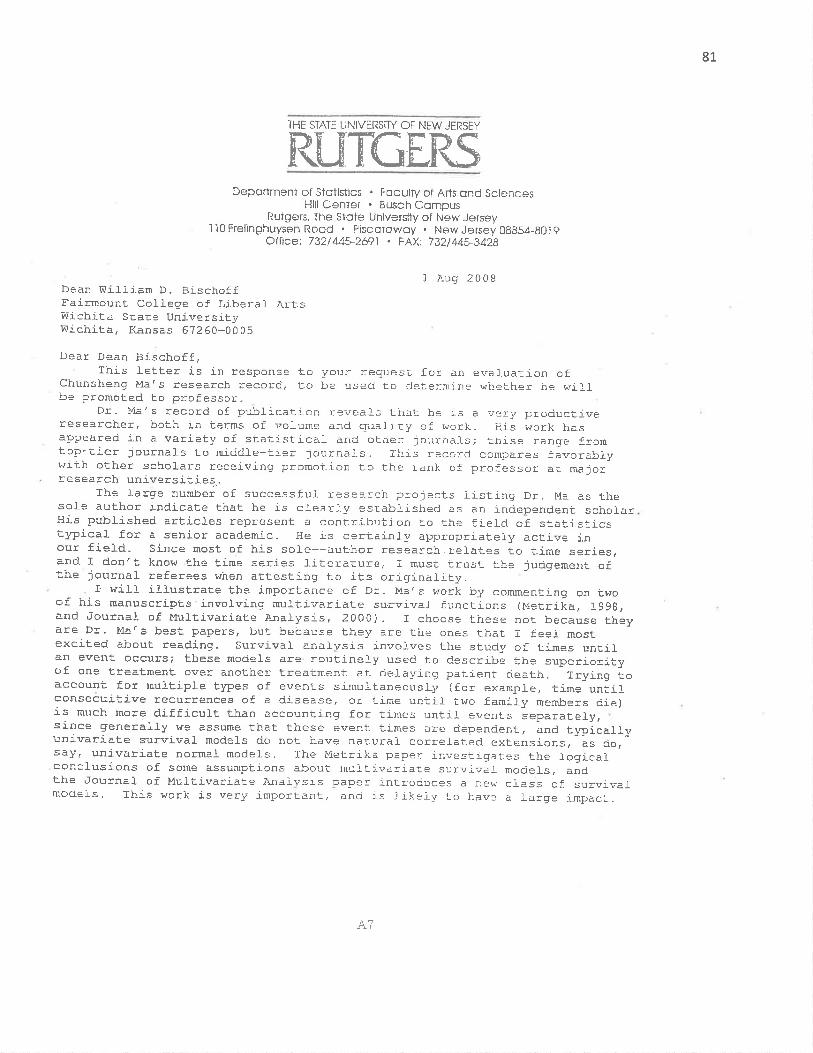
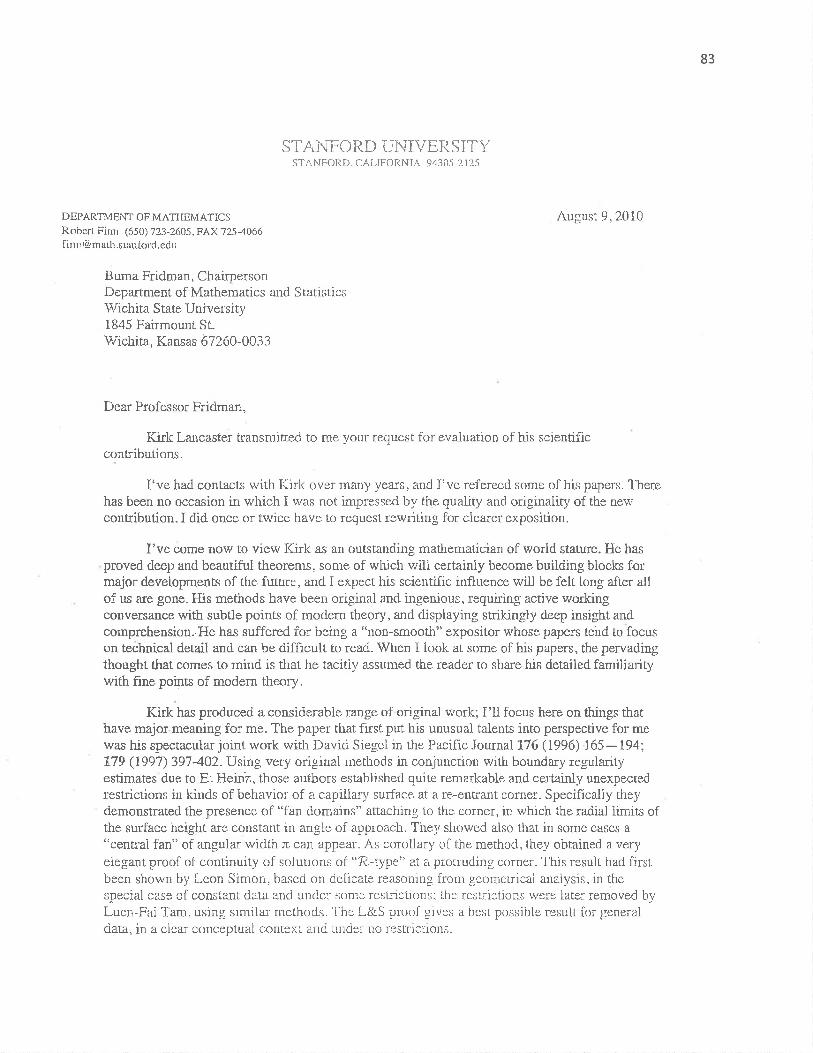
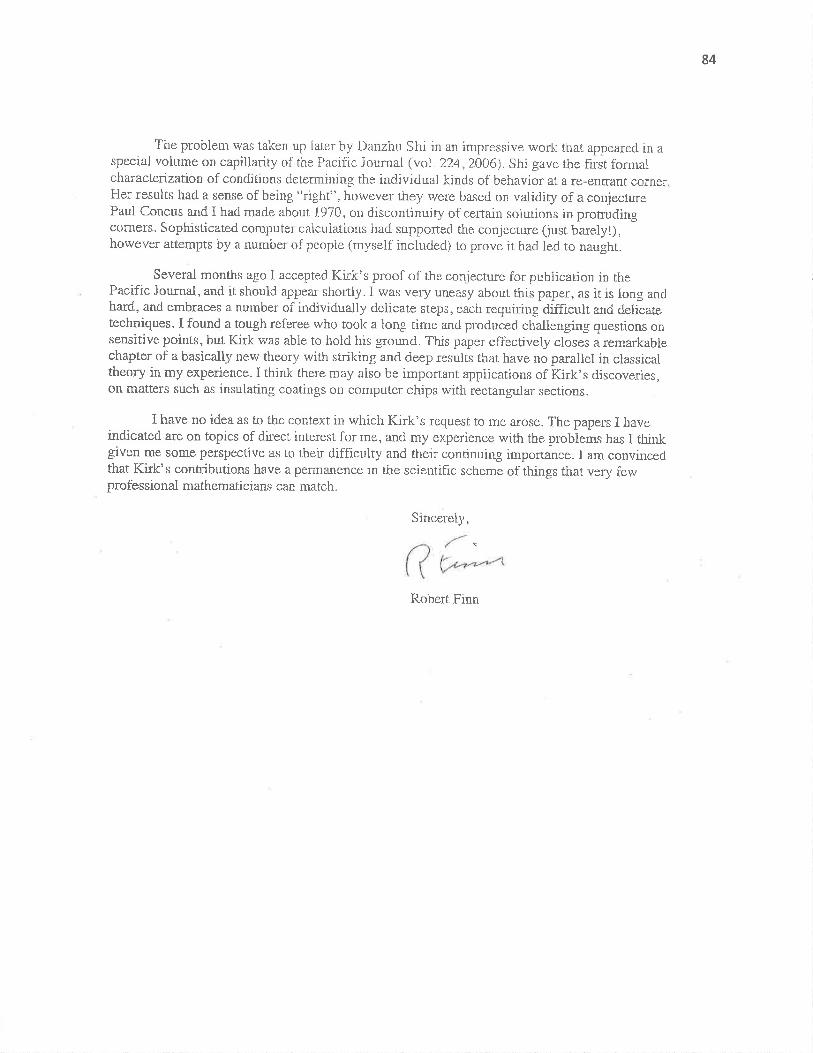
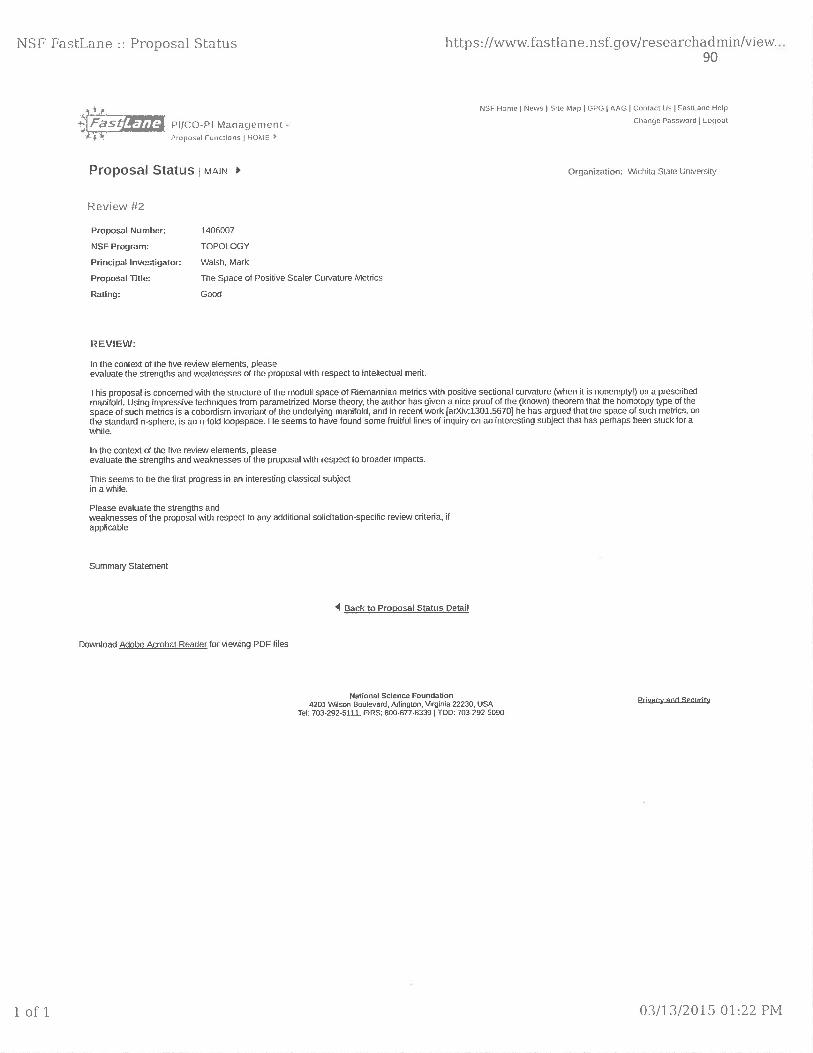
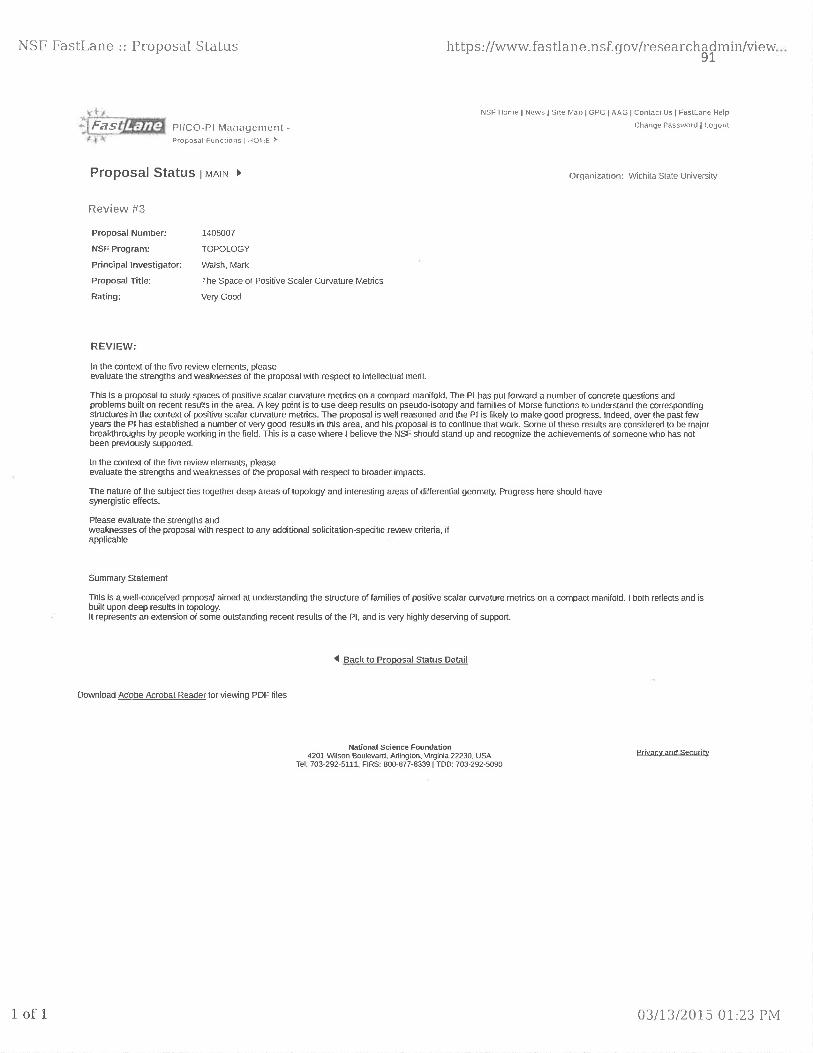
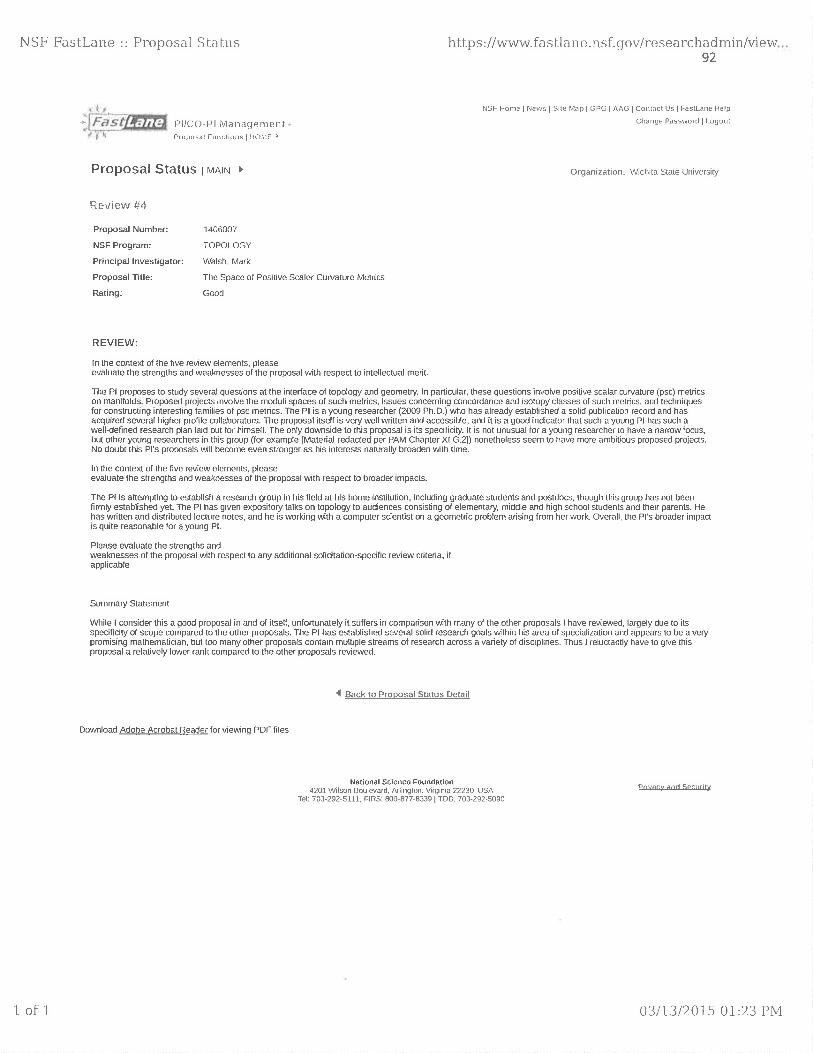
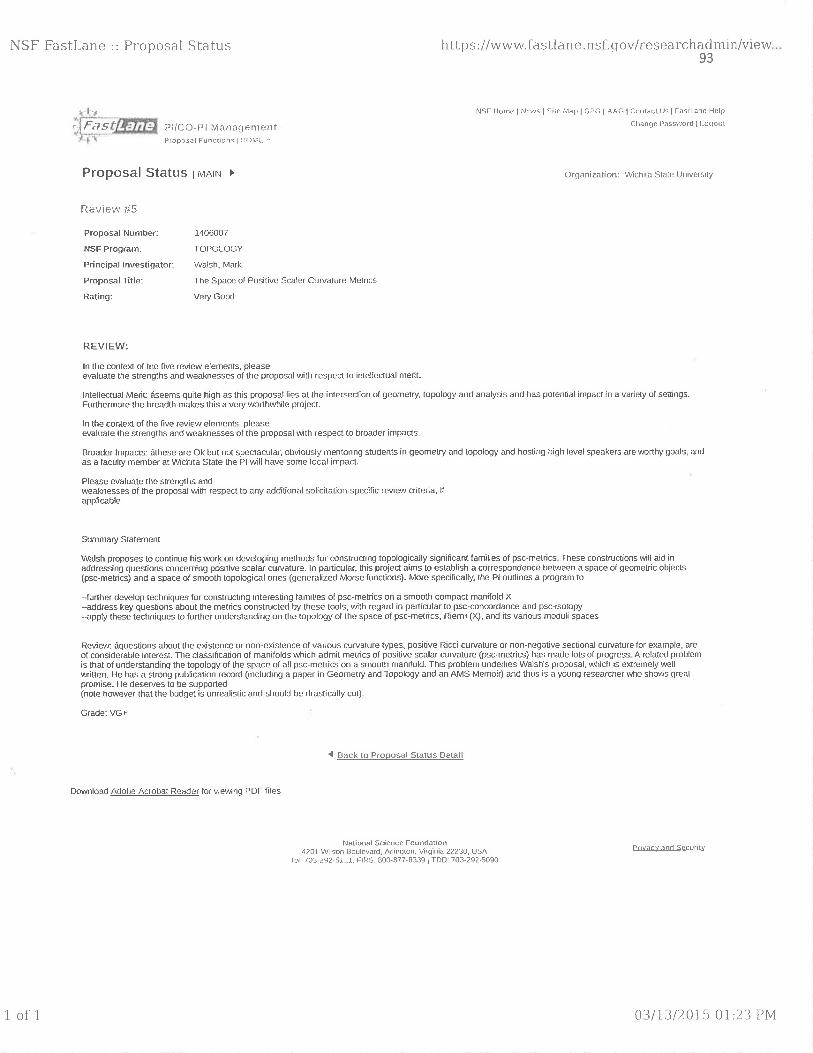
External experts have written about Mathematics & Statistics & Physics faculty in different contexts. One
remark is in order. Starting 2010 we introduced the blind external evaluation for faculty applying for
tenure and/or promotion. Due to confidentiality concerns we cannot exhibit these highly positive
evaluation letters here. The same is true for other review letters talking of the research accomplishments
of our faculty. So, we decided to include in Attachment #2 some of the previous (in years 2000-2010)
letters characterizing the work of our existing faculty. So, a sample of letters from faculty at the University
of Washington, University of Illinois, Oxford University, Stanford University, Rutgers University, and one
Review for the Kansas NSF EPSCoR Award, and are included in Attachment #2.
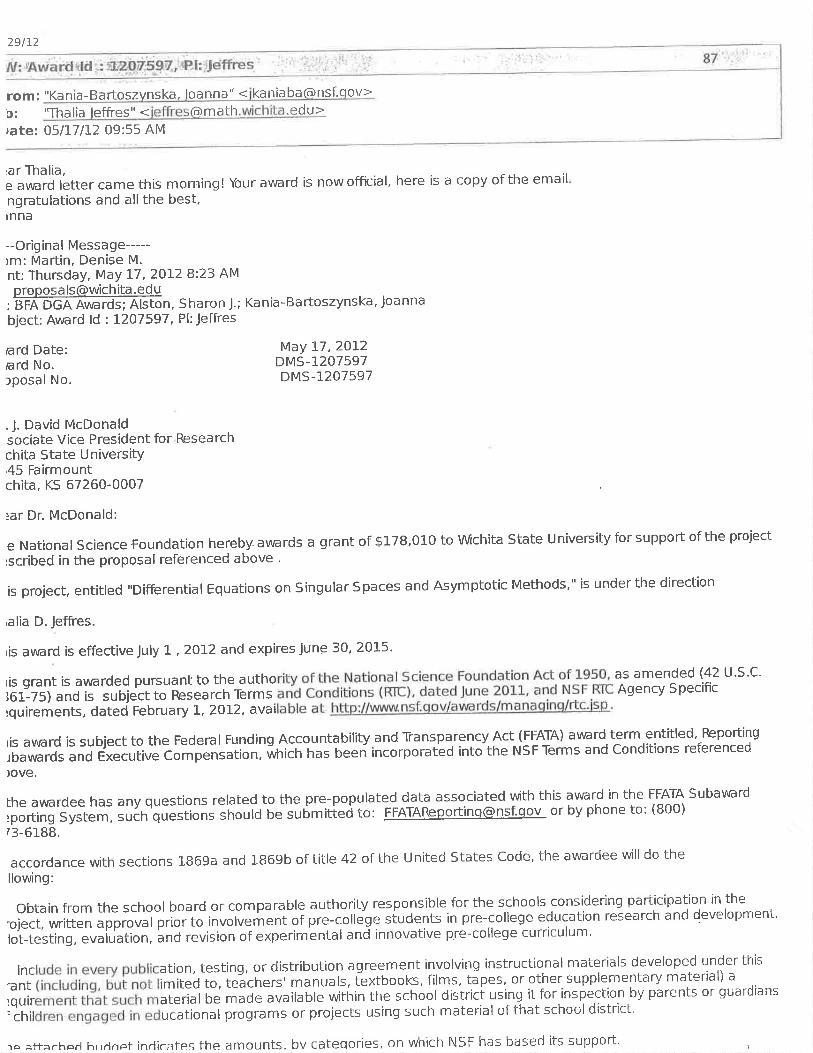
Mathematics, Statistics, and Physics faculty serve on editorial boards of academic research journals. Since
the Ph.D. program in Applied Mathematics was initiated in 1985, faculty have received grants from well-
known and highly competitive federal, state and local agencies such as the National Science Foundation,
Department of Defense, Department of Energy, Air Force, Federal Aviation Administration, National
Research Council, National Geospatial-Intelligence Agency, and The Kansas Health Foundation.
Mathematics & Statistics faculty have given invited addresses at conferences and institutions throughout
the world.

8
3. Academic Program: Analyze the quality of the program as assessed by its curriculum and impact on students.
Complete this section for each program (if more than one). Attach updated program assessment plan (s) as an
appendix (refer to instructions in the WSU Program Review document for more information).
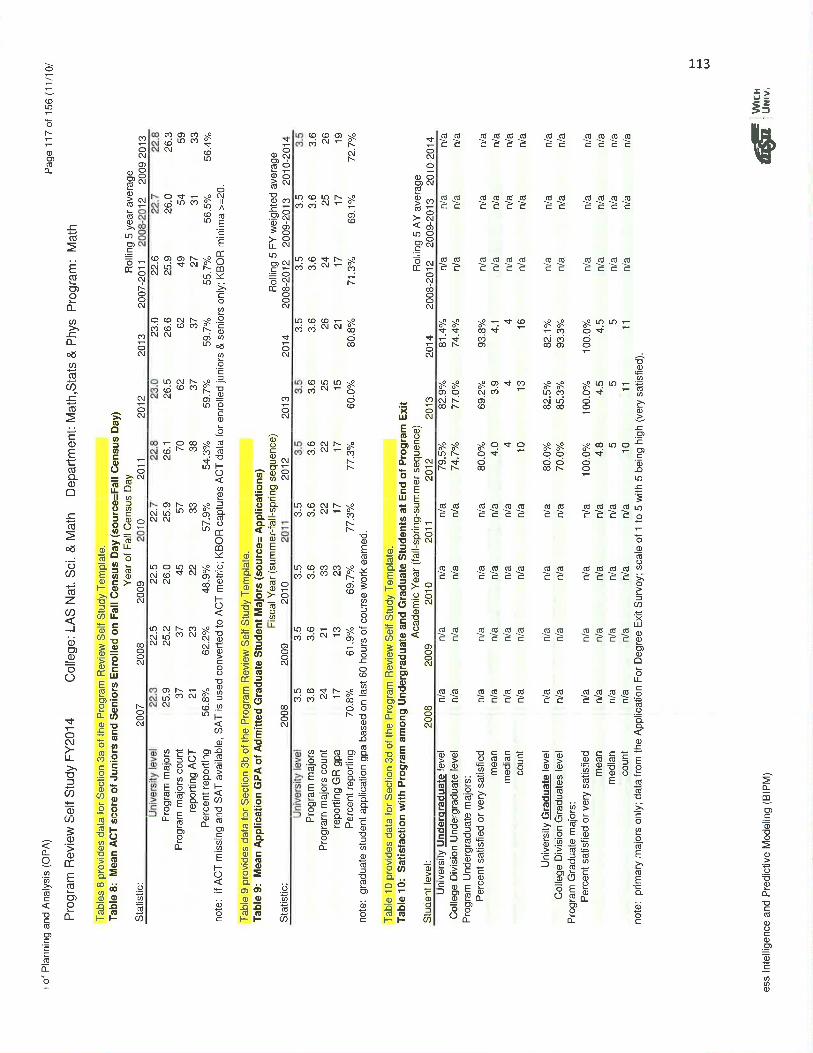
a. For undergraduate programs, compare ACT scores of the majors with the University as a whole.
The mean ACT scores for students in Mathematics and Statistics and for students in Physics are
significantly higher than the mean ACT scores for students in all university undergraduate programs.
Undergraduate students in MSP programs are well prepared for success.
b. For graduate programs, compare graduate GPAs of the majors with University graduate GPAs.*
The mean application GPA of graduate students admitted to MSP graduate programs, 3.6, exceeds the
mean GPA of all admitted graduate students, 3.5. Graduate students entering a MSP graduate program are
well prepared for graduate studies. The mean GPA of students admitted to the PhD program in Applied
Mathematics (FY2012: 3.63; FY2013: 3.89; FY2014: 3.83) exceeded those for the college and university in
FY2013 and FY2014; the mean GPA scores of students admitted to LAS PhD programs were FY2012: 3.70;
FY2013: 3.70; FY2014: 3.73 and the mean GPA scores of students admitted to WSU PhD programs were
FY2012: 3.66; FY2013: 3.68; FY2014: 3.67.
c. Identify the principal learning outcomes (i.e., what skills does your Program expect students to graduate with).
Provide aggregate data on how students are meeting those outcomes. Data should relate to the goals and
objectives of the program as listed in 1e. Provide an analysis and evaluation of the data by learner outcome
with proposed actions based on the results.
In the following table provide program level information. You may add an appendix to provide more
explanation/details. Definitions:
Learning Outcomes: Learning outcomes are statements that describe what students are expected to know and
be able to do by the time of graduation. These relate to the skills, knowledge, and behaviors that students
acquire in their matriculation through the program (e.g., graduates will demonstrate advanced writing ability).
Assessment Tool: One or more tools to identify, collect, and prepare data to evaluate the achievement of
learning outcomes (e.g., a writing project evaluated by a rubric).
Criterion/Target: Percentage of program students expected to achieve the desired outcome for demonstrating
program effectiveness (e.g., 90% of the students will demonstrate satisfactory performance on a writing
project).
Result: Actual achievement on each learning outcome measurement (e.g., 95%).
Analysis: Determines the extent to which learning outcomes are being achieved and leads to decisions and
actions to improve the program. The analysis and evaluation should align with specific learning outcome and
consider whether the measurement and/or criteria/target remain a valid indicator of the learning outcome as
well as whether the learning outcomes need to be revised.
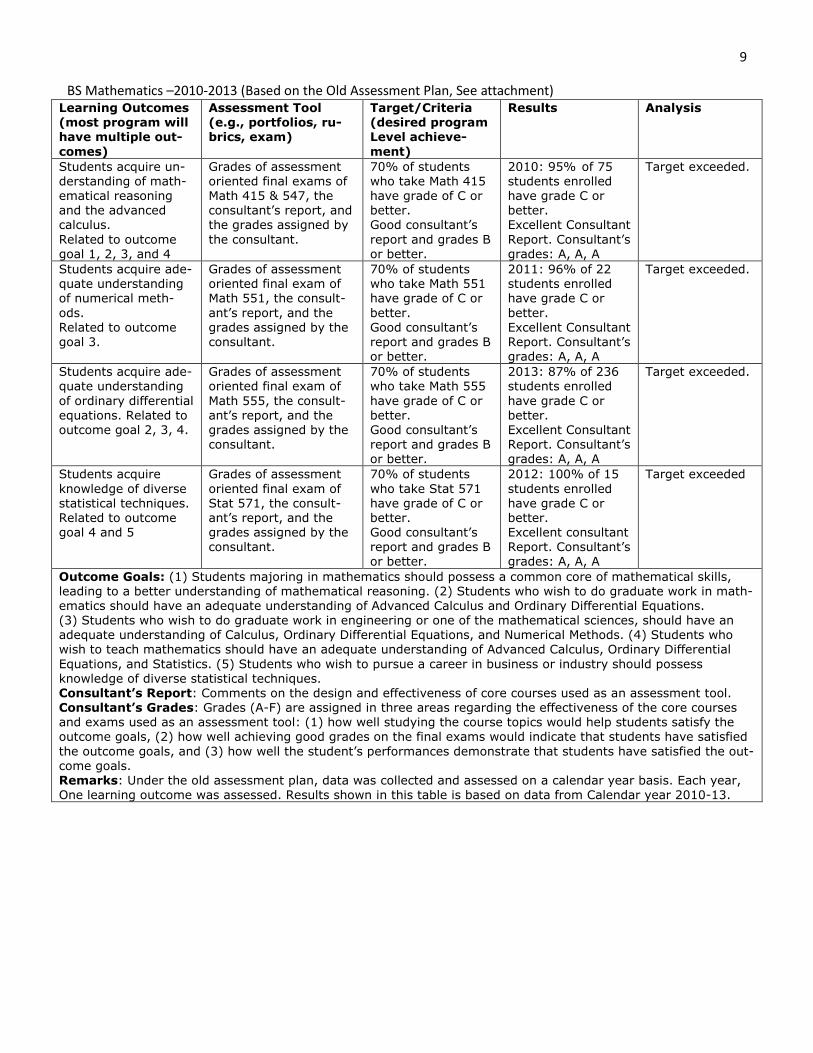
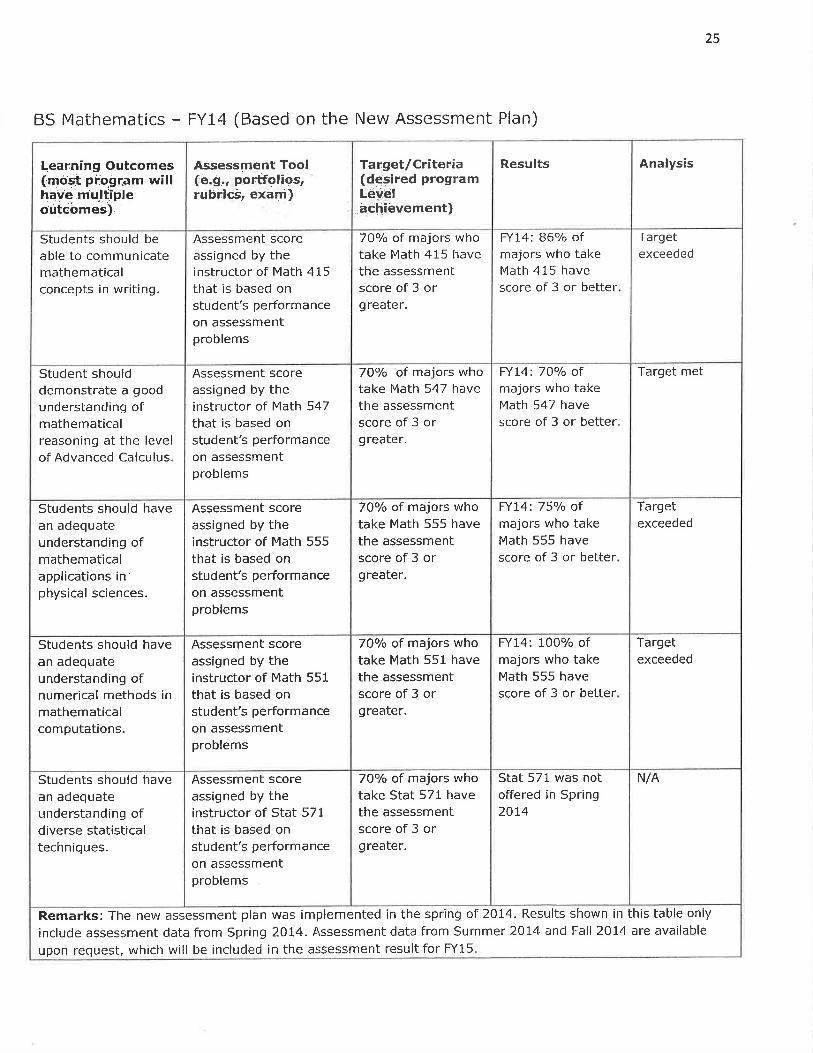
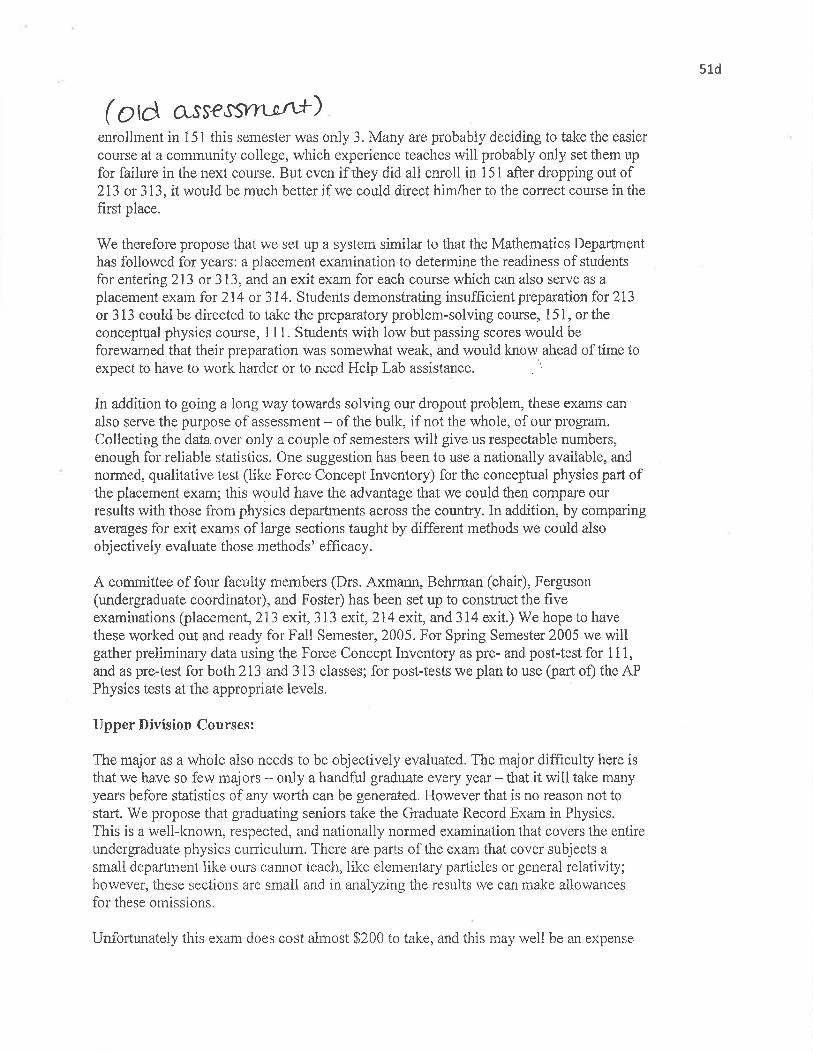
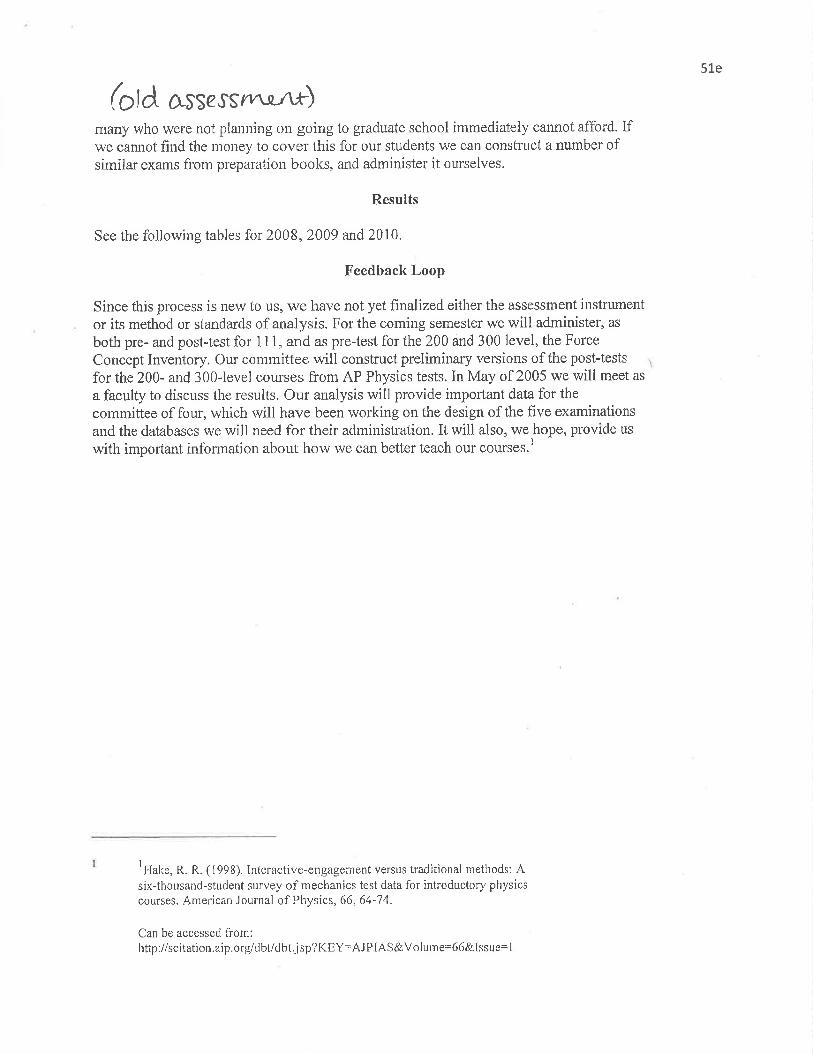
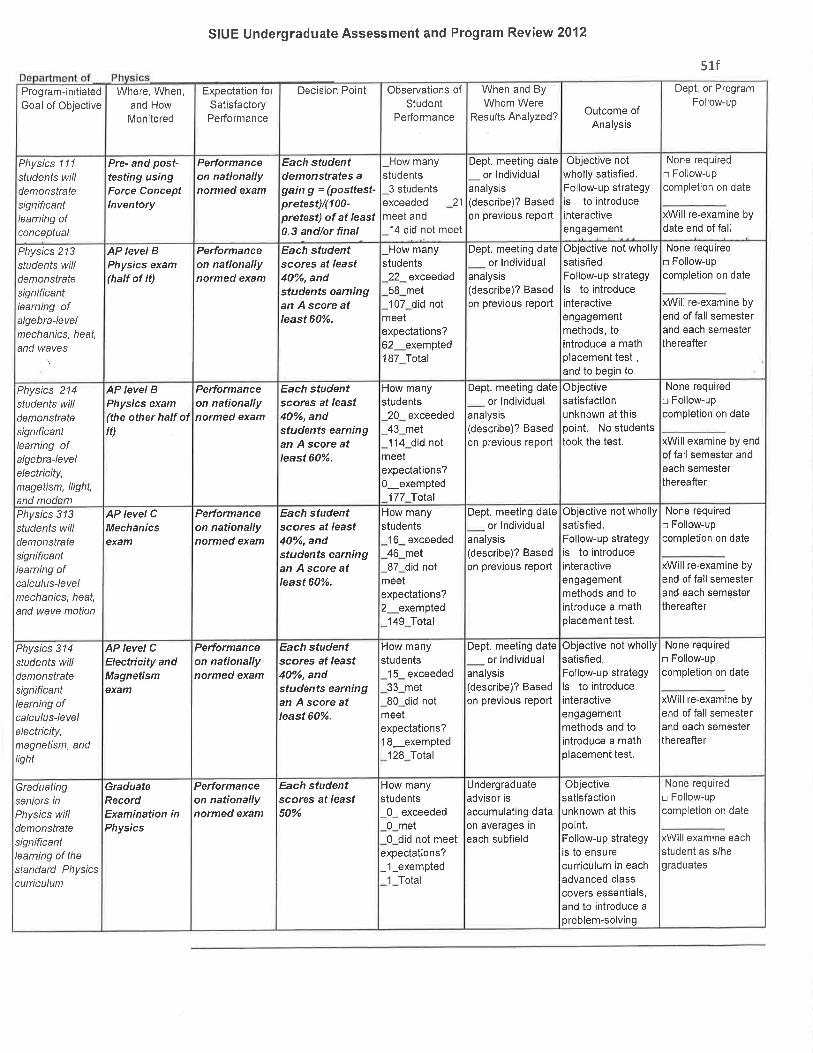
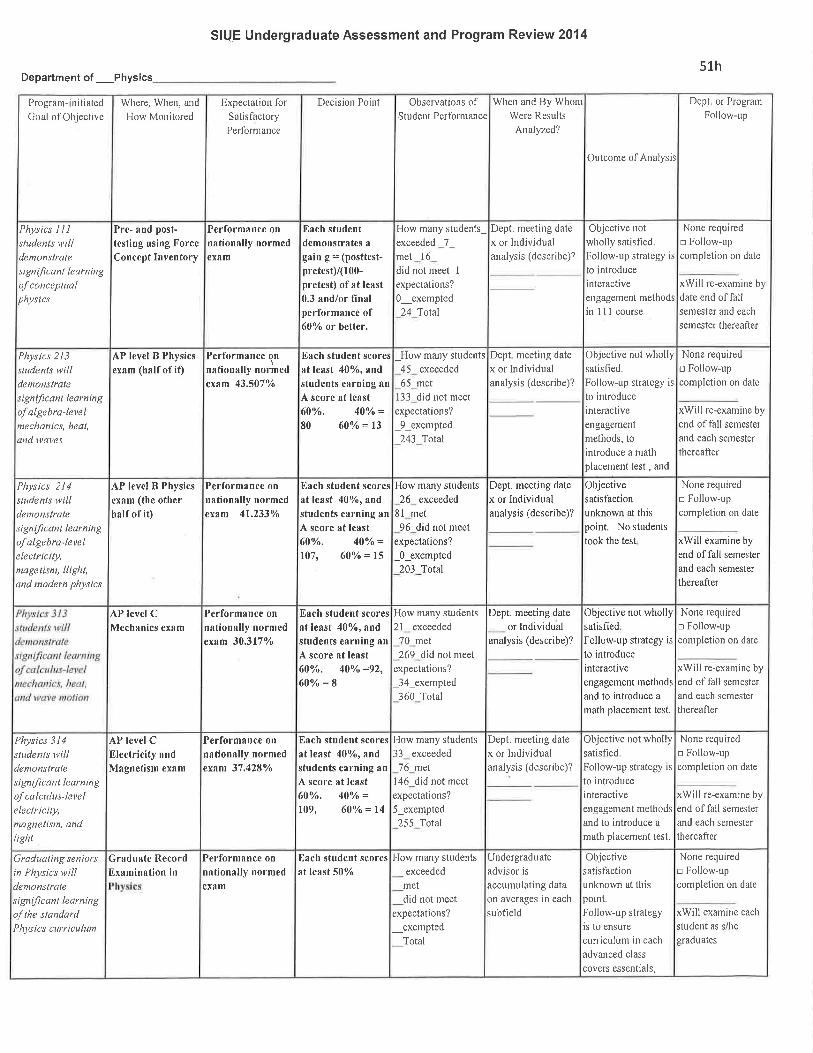
NOTE: For BS Mathematics, two assessment tables are provided following this page. The first table gives
the assessment data from 2010-2013, during which time our assessment on BS Mathematics
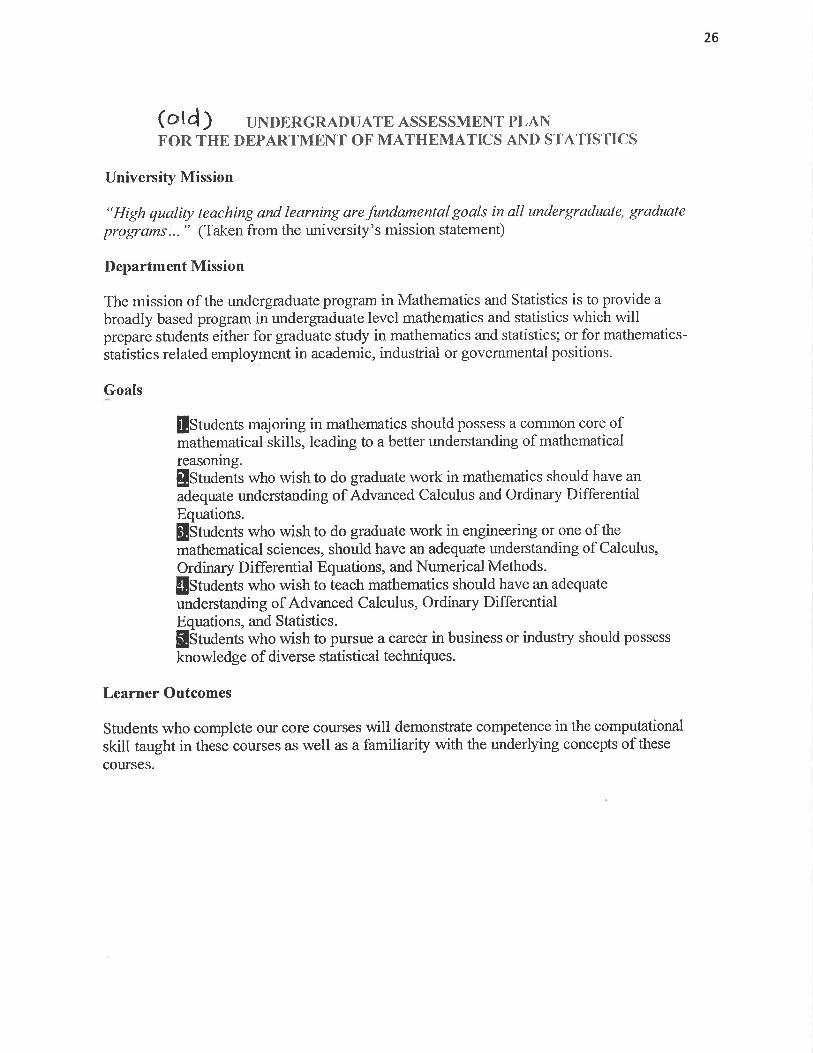
program was based on the old assessment plan (See attachment). Under the old assessment plan,
data was collected and assessed on a calendar year basis. Each year, one learning outcome was
assessed. Thus we provide all available results from Calendar year 2010-13 instead of Fiscal year
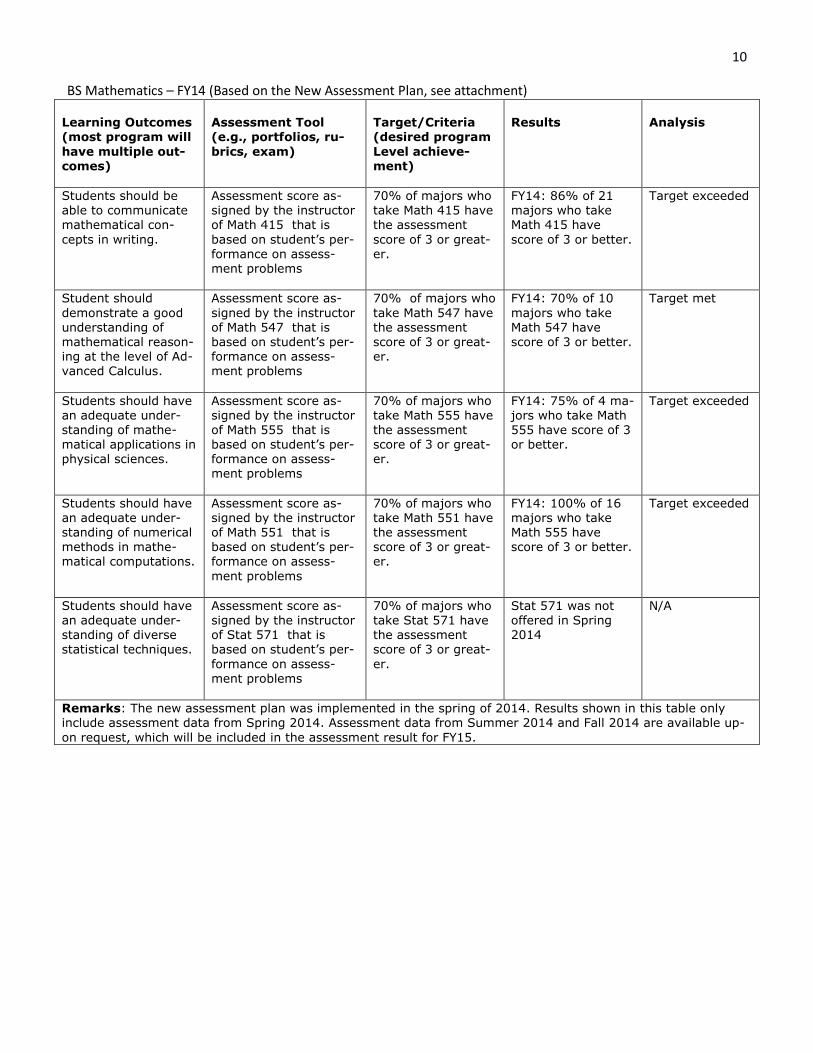
2012-2013. Since the spring of 2014, we adapted a new assessment plan for the BS Mathematics
program (See attachment). The second table (for Fiscal Year 2014) shows assessment data and
result from Spring 2014. Assessment data and results from Summer 2014 and Fall 2014 are
available upon request, which will be included in the assessment result for FY15.
9
BS Mathematics –2010-2013 (Based on the Old Assessment Plan, See attachment)
Learning Outcomes
(most program will
have multiple out-
comes)
Assessment Tool
(e.g., portfolios, ru-
brics, exam)
Target/Criteria
(desired program
Level achieve-
ment)
Results Analysis
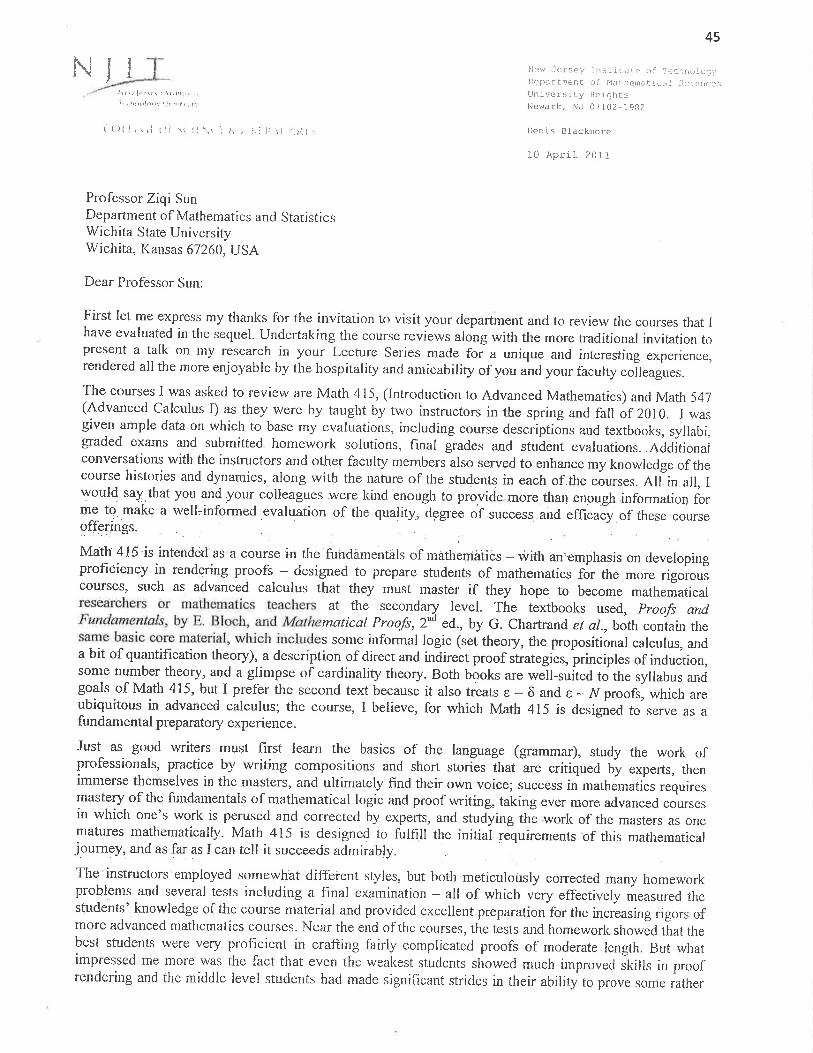
Students acquire un-
derstanding of math-
ematical reasoning
and the advanced
calculus. Related to outcome
goal 1, 2, 3, and 4
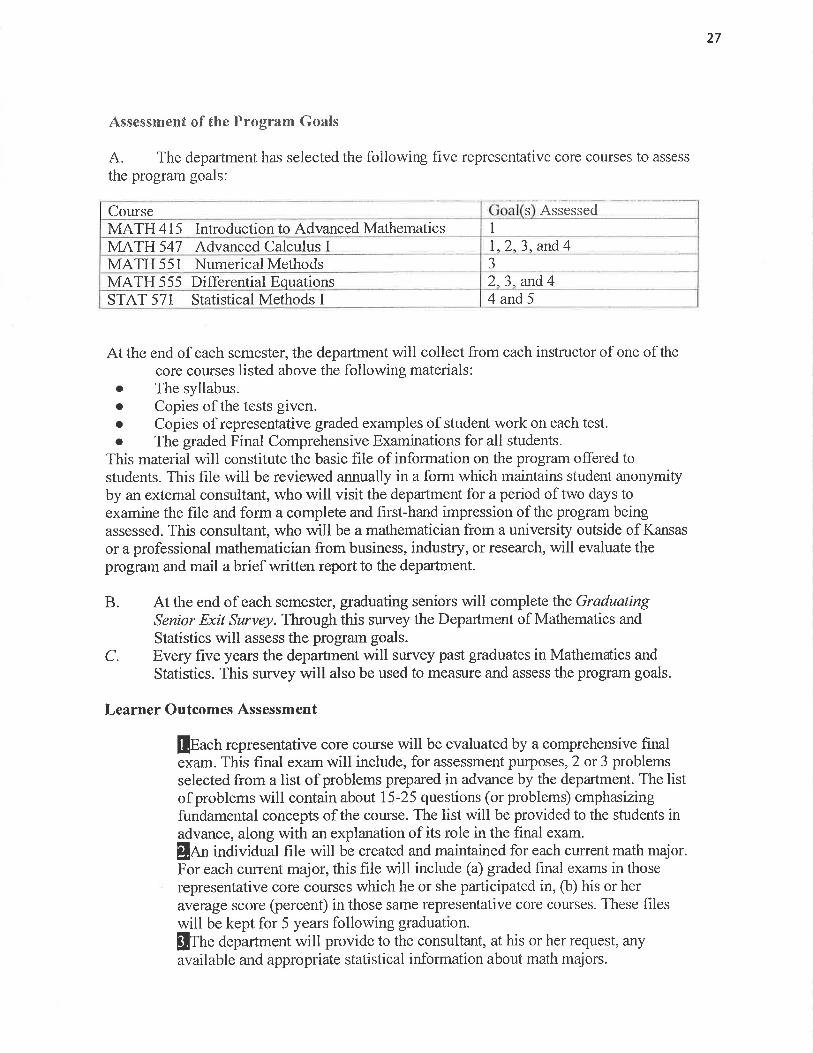
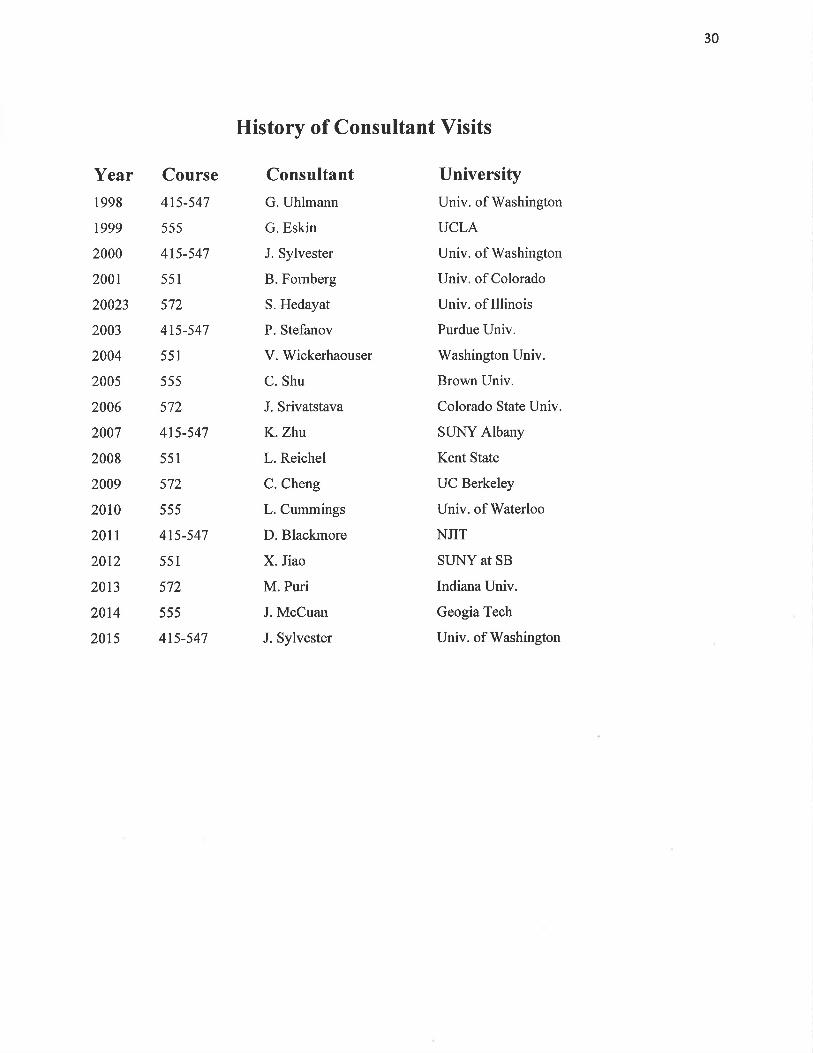
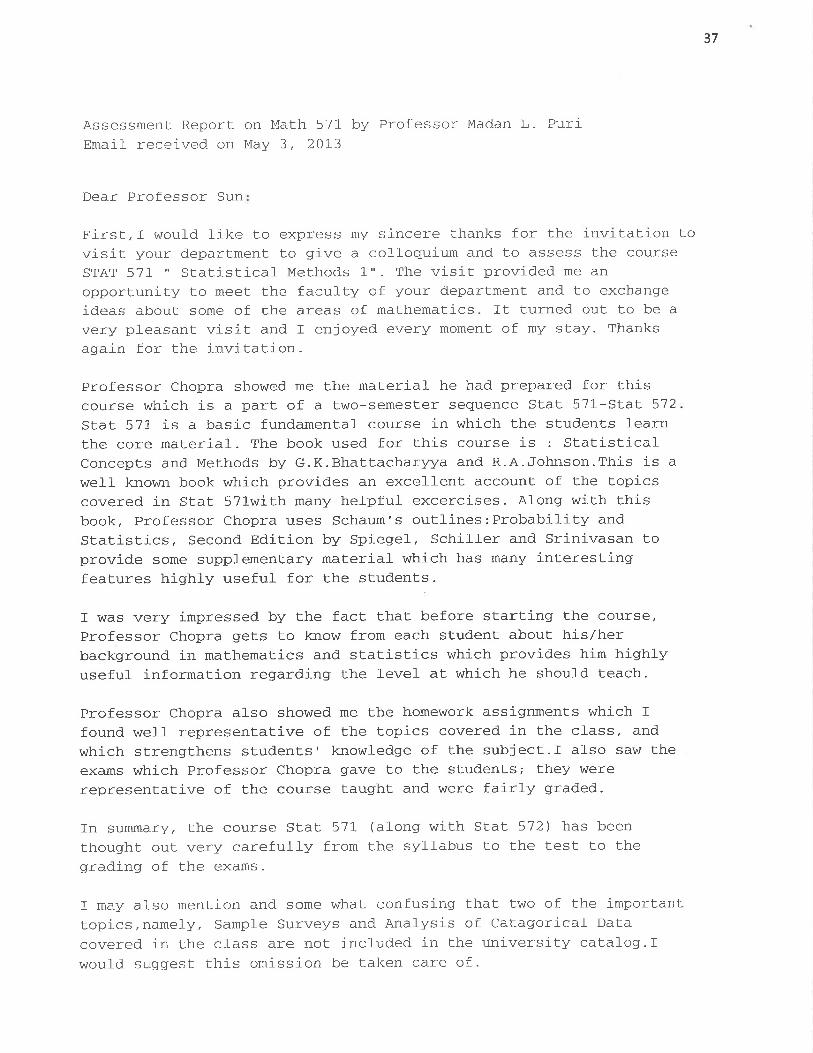
Grades of assessment
oriented final exams of
Math 415 & 547, the
consultant’s report, and
the grades assigned by
the consultant.
70% of students
who take Math 415
have grade of C or
better.
Good consultant’s
report and grades B
or better.
2010: 95% of 75
students enrolled
have grade C or
better. Excellent Consultant
Report. Consultant’s
grades: A, A, A
Target exceeded.
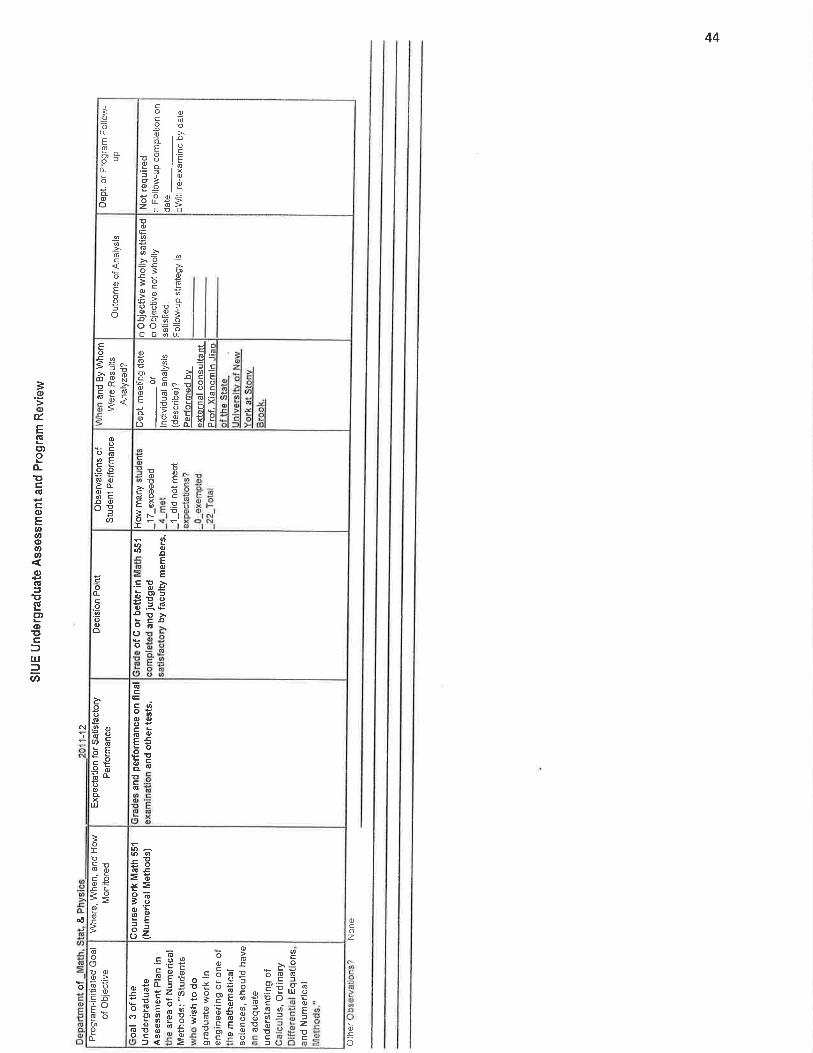
Students acquire ade-
quate understanding
of numerical meth-
ods. Related to outcome
goal 3.
Grades of assessment
oriented final exam of
Math 551, the consult-
ant’s report, and the
grades assigned by the
consultant.
70% of students
who take Math 551
have grade of C or
better.
Good consultant’s
report and grades B
or better.
2011: 96% of 22
students enrolled
have grade C or
better. Excellent Consultant
Report. Consultant’s
grades: A, A, A
Target exceeded.
Students acquire ade-
quate understanding
of ordinary differential
equations. Related to
outcome goal 2, 3, 4.
Grades of assessment
oriented final exam of
Math 555, the consult-
ant’s report, and the
grades assigned by the
consultant.
70% of students
who take Math 555
have grade of C or
better.
Good consultant’s
report and grades B
or better.
2013: 87% of 236
students enrolled
have grade C or
better. Excellent Consultant
Report. Consultant’s
grades: A, A, A
Target exceeded.
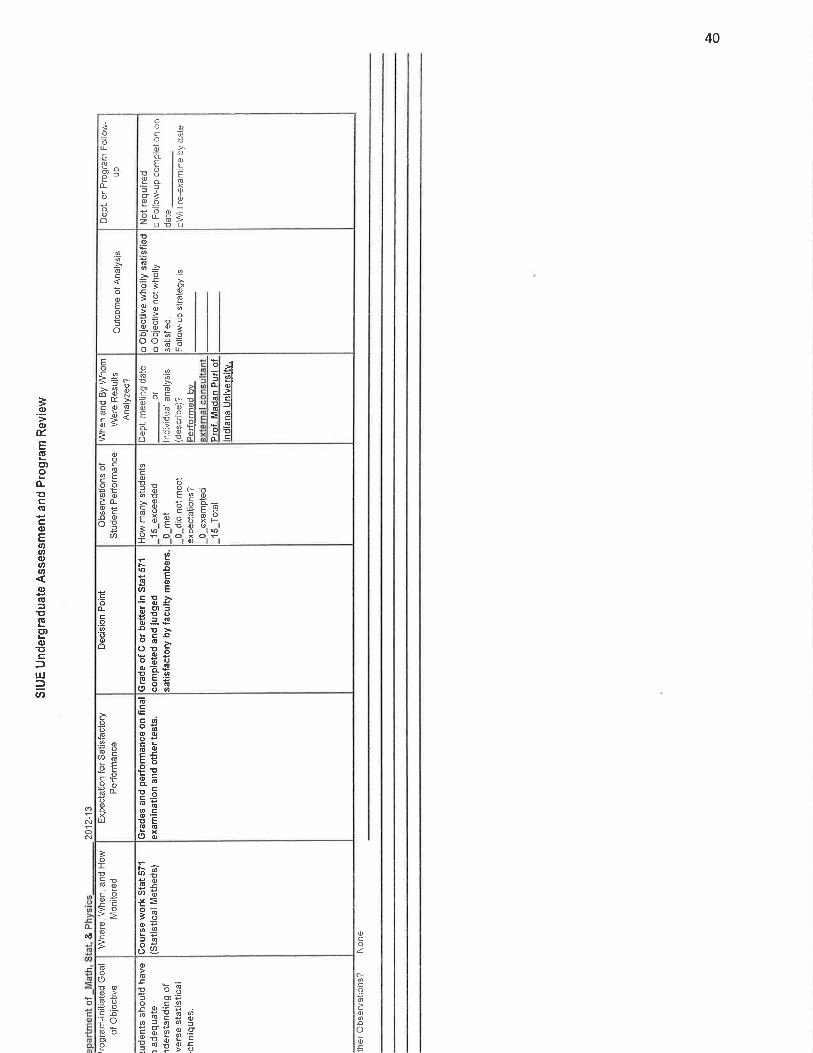
Students acquire
knowledge of diverse
statistical techniques. Related to outcome
goal 4 and 5
Grades of assessment
oriented final exam of
Stat 571, the consult-
ant’s report, and the
grades assigned by the
consultant.
70% of students
who take Stat 571
have grade of C or
better.
Good consultant’s
report and grades B
or better.
2012: 100% of 15
students enrolled
have grade C or
better. Excellent consultant
Report. Consultant’s
grades: A, A, A
Target exceeded
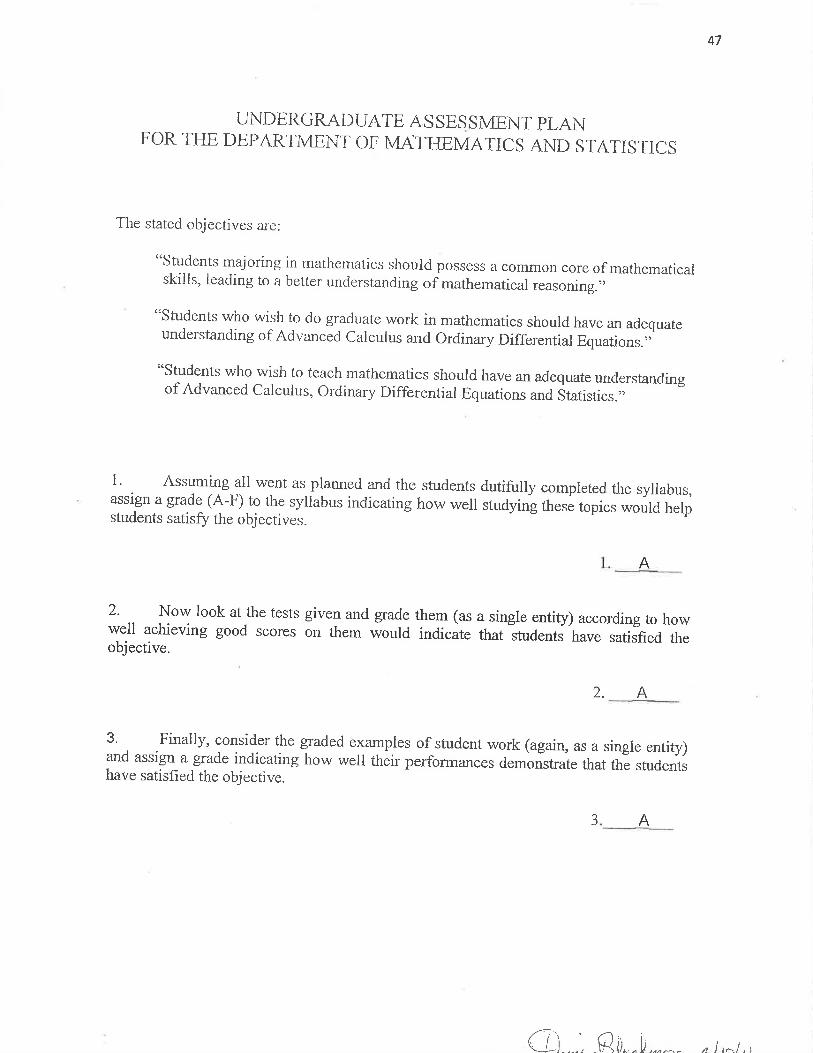
Outcome Goals: (1) Students majoring in mathematics should possess a common core of mathematical skills,
leading to a better understanding of mathematical reasoning. (2) Students who wish to do graduate work in math-
ematics should have an adequate understanding of Advanced Calculus and Ordinary Differential Equations. (3) Students who wish to do graduate work in engineering or one of the mathematical sciences, should have an
adequate understanding of Calculus, Ordinary Differential Equations, and Numerical Methods. (4) Students who
wish to teach mathematics should have an adequate understanding of Advanced Calculus, Ordinary Differential
Equations, and Statistics. (5) Students who wish to pursue a career in business or industry should possess
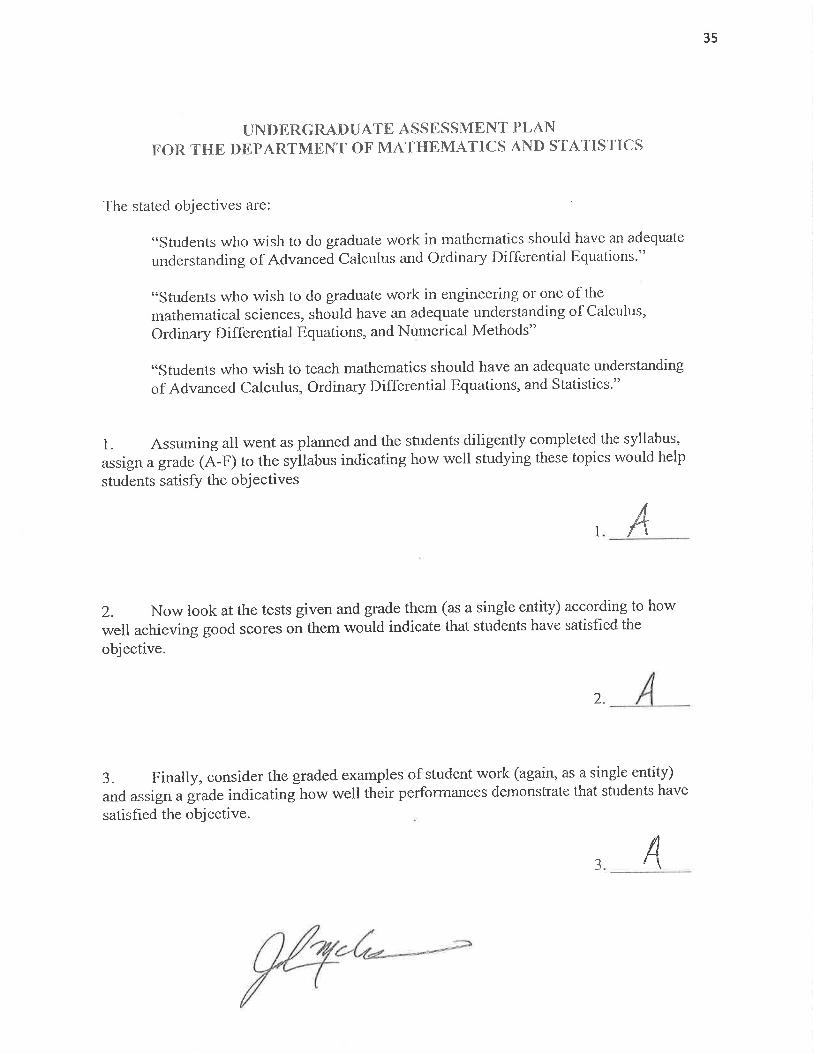
knowledge of diverse statistical techniques. Consultant’s Report: Comments on the design and effectiveness of core courses used as an assessment tool. Consultant’s Grades: Grades (A-F) are assigned in three areas regarding the effectiveness of the core courses
and exams used as an assessment tool: (1) how well studying the course topics would help students satisfy the
outcome goals, (2) how well achieving good grades on the final exams would indicate that students have satisfied
the outcome goals, and (3) how well the student’s performances demonstrate that students have satisfied the out-
come goals. Remarks: Under the old assessment plan, data was collected and assessed on a calendar year basis. Each year,
One learning outcome was assessed. Results shown in this table is based on data from Calendar year 2010-13.
10
BS Mathematics – FY14 (Based on the New Assessment Plan, see attachment)
Learning Outcomes
(most program will
have multiple out-
comes)
Assessment Tool
(e.g., portfolios, ru-
brics, exam)
Target/Criteria
(desired program
Level achieve-
ment)
Results
Analysis
Students should be
able to communicate
mathematical con-
cepts in writing.
Assessment score as-
signed by the instructor
of Math 415 that is
based on student’s per-
formance on assess-
ment problems
70% of majors who
take Math 415 have
the assessment
score of 3 or great-
er.
FY14: 86% of 21
majors who take
Math 415 have
score of 3 or better.
Target exceeded
Student should
demonstrate a good
understanding of
mathematical reason-
ing at the level of Ad-
vanced Calculus.
Assessment score as-
signed by the instructor
of Math 547 that is
based on student’s per-
formance on assess-
ment problems
70% of majors who
take Math 547 have
the assessment
score of 3 or great-
er.
FY14: 70% of 10
majors who take
Math 547 have
score of 3 or better.
Target met
Students should have
an adequate under-
standing of mathe-
matical applications in
physical sciences.
Assessment score as-
signed by the instructor
of Math 555 that is
based on student’s per-
formance on assess-
ment problems
70% of majors who
take Math 555 have
the assessment
score of 3 or great-
er.
FY14: 75% of 4 ma-
jors who take Math
555 have score of 3
or better.
Target exceeded
Students should have
an adequate under-
standing of numerical
methods in mathe-
matical computations.
Assessment score as-
signed by the instructor
of Math 551 that is
based on student’s per-
formance on assess-
ment problems
70% of majors who
take Math 551 have
the assessment
score of 3 or great-
er.
FY14: 100% of 16
majors who take
Math 555 have
score of 3 or better.
Target exceeded
Students should have
an adequate under-
standing of diverse
statistical techniques.
Assessment score as-
signed by the instructor
of Stat 571 that is
based on student’s per-
formance on assess-
ment problems
70% of majors who
take Stat 571 have
the assessment
score of 3 or great-
er.
Stat 571 was not
offered in Spring
2014
N/A
Remarks: The new assessment plan was implemented in the spring of 2014. Results shown in this table only
include assessment data from Spring 2014. Assessment data from Summer 2014 and Fall 2014 are available up-
on request, which will be included in the assessment result for FY15.
11
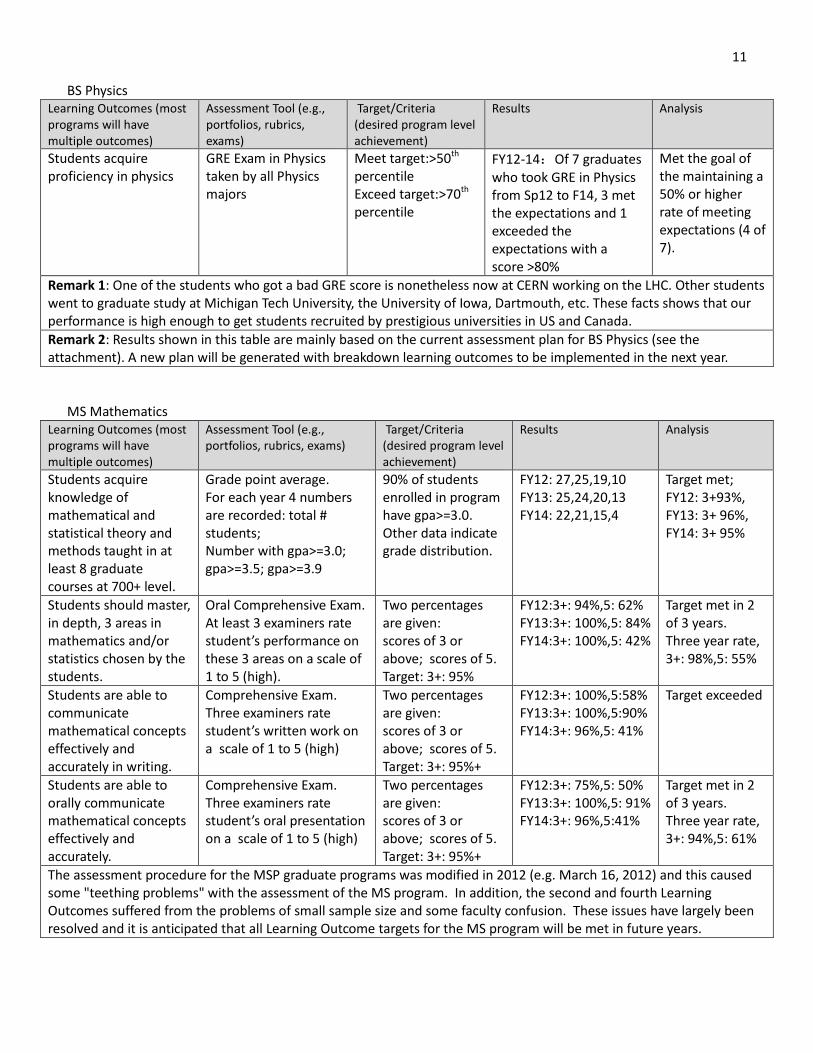
BS Physics
Learning Outcomes (most
programs will have
multiple outcomes)
Assessment Tool (e.g.,
portfolios, rubrics,
exams)
Target/Criteria
(desired program level
achievement)
Results Analysis
Students acquire
proficiency in physics
GRE Exam in Physics
taken by all Physics
majors
Meet target:>50th
percentile
Exceed target:>70th
percentile
FY12-14:Of 7 graduates
who took GRE in Physics
from Sp12 to F14, 3 met
the expectations and 1
exceeded the
expectations with a
score >80%
Met the goal of
the maintaining a
50% or higher
rate of meeting
expectations (4 of
7).
Remark 1: One of the students who got a bad GRE score is nonetheless now at CERN working on the LHC. Other students
went to graduate study at Michigan Tech University, the University of Iowa, Dartmouth, etc. These facts shows that our
performance is high enough to get students recruited by prestigious universities in US and Canada.
Remark 2: Results shown in this table are mainly based on the current assessment plan for BS Physics (see the
attachment). A new plan will be generated with breakdown learning outcomes to be implemented in the next year.
MS Mathematics
Learning Outcomes (most
programs will have
multiple outcomes)
Assessment Tool (e.g.,
portfolios, rubrics, exams)
Target/Criteria
(desired program level
achievement)
Results Analysis
Students acquire
knowledge of
mathematical and
statistical theory and
methods taught in at
least 8 graduate
courses at 700+ level.
Grade point average.
For each year 4 numbers
are recorded: total #
students;
Number with gpa>=3.0;
gpa>=3.5; gpa>=3.9
90% of students
enrolled in program
have gpa>=3.0.
Other data indicate
grade distribution.
FY12: 27,25,19,10
FY13: 25,24,20,13
FY14: 22,21,15,4
Target met;
FY12: 3+93%,
FY13: 3+ 96%,
FY14: 3+ 95%
Students should master,
in depth, 3 areas in
mathematics and/or
statistics chosen by the
students.
Oral Comprehensive Exam.
At least 3 examiners rate
student’s performance on
these 3 areas on a scale of
1 to 5 (high).
Two percentages
are given:
scores of 3 or
above; scores of 5.
Target: 3+: 95%
FY12:3+: 94%,5: 62%
FY13:3+: 100%,5: 84%
FY14:3+: 100%,5: 42%
Target met in 2
of 3 years.
Three year rate,
3+: 98%,5: 55%
Students are able to
communicate
mathematical concepts
effectively and
accurately in writing.
Comprehensive Exam.
Three examiners rate
student’s written work on
a scale of 1 to 5 (high)
Two percentages
are given:
scores of 3 or
above; scores of 5.
Target: 3+: 95%+
FY12:3+: 100%,5:58%
FY13:3+: 100%,5:90%
FY14:3+: 96%,5: 41%
Target exceeded
Students are able to
orally communicate
mathematical concepts
effectively and
accurately.
Comprehensive Exam.
Three examiners rate
student’s oral presentation
on a scale of 1 to 5 (high)
Two percentages
are given:
scores of 3 or
above; scores of 5.
Target: 3+: 95%+
FY12:3+: 75%,5: 50%
FY13:3+: 100%,5: 91%
FY14:3+: 96%,5:41%
Target met in 2
of 3 years.
Three year rate,
3+: 94%,5: 61%
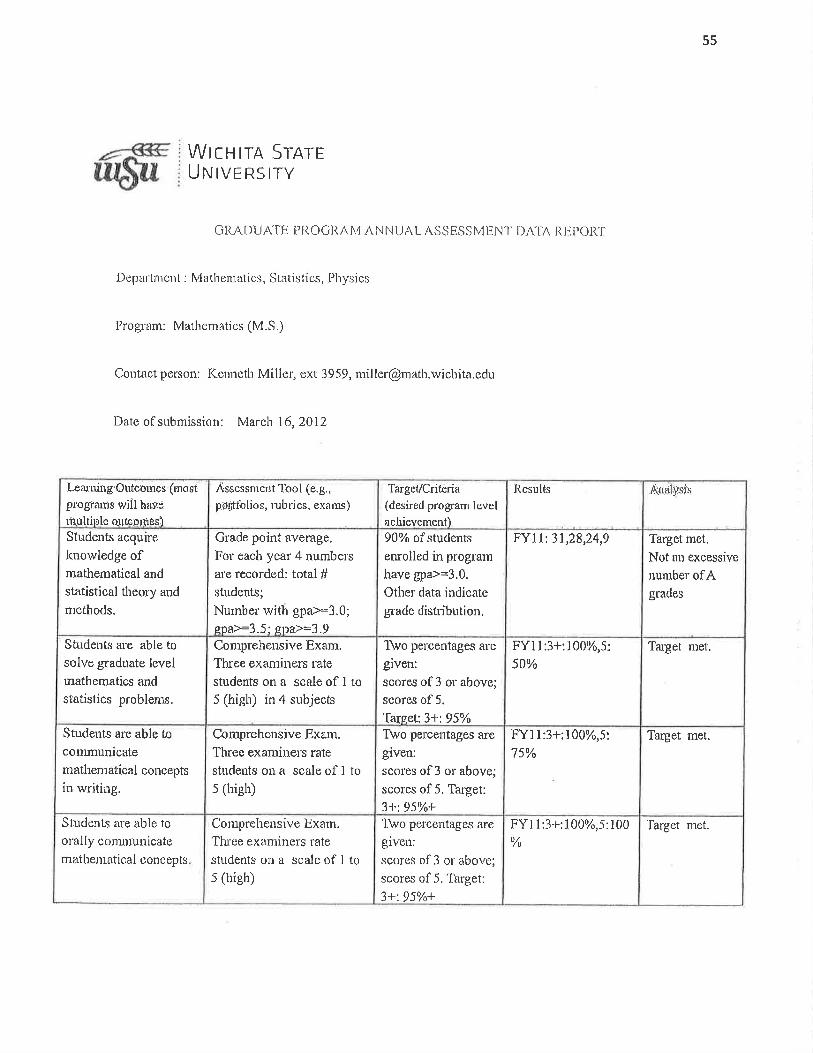
The assessment procedure for the MSP graduate programs was modified in 2012 (e.g. March 16, 2012) and this caused
some "teething problems" with the assessment of the MS program. In addition, the second and fourth Learning
Outcomes suffered from the problems of small sample size and some faculty confusion. These issues have largely been
resolved and it is anticipated that all Learning Outcome targets for the MS program will be met in future years.
12
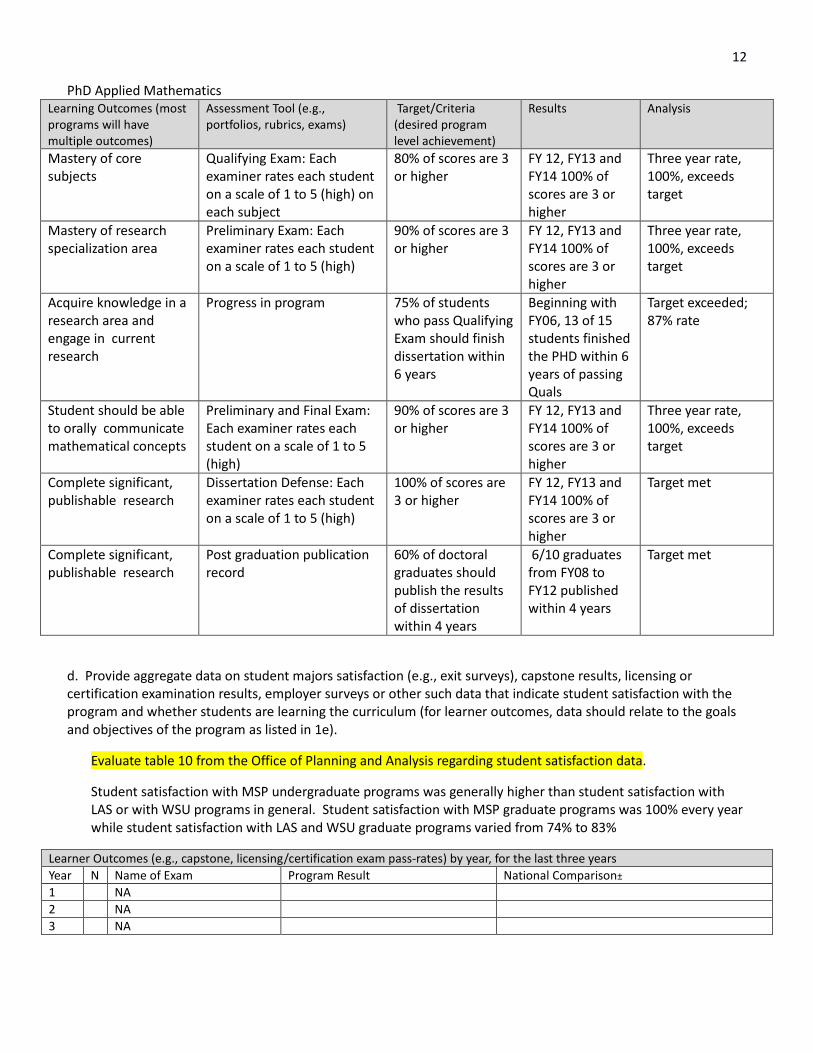
PhD Applied Mathematics
Learning Outcomes (most
programs will have
multiple outcomes)
Assessment Tool (e.g.,
portfolios, rubrics, exams)
Target/Criteria
(desired program
level achievement)
Results Analysis
Mastery of core
subjects
Qualifying Exam: Each
examiner rates each student
on a scale of 1 to 5 (high) on
each subject
80% of scores are 3
or higher
FY 12, FY13 and
FY14 100% of
scores are 3 or
higher
Three year rate,
100%, exceeds
target
Mastery of research
specialization area
Preliminary Exam: Each
examiner rates each student
on a scale of 1 to 5 (high)
90% of scores are 3
or higher
FY 12, FY13 and
FY14 100% of
scores are 3 or
higher
Three year rate,
100%, exceeds
target
Acquire knowledge in a
research area and
engage in current
research
Progress in program 75% of students
who pass Qualifying
Exam should finish
dissertation within
6 years
Beginning with
FY06, 13 of 15
students finished
the PHD within 6
years of passing
Quals
Target exceeded;
87% rate
Student should be able
to orally communicate
mathematical concepts
Preliminary and Final Exam:
Each examiner rates each
student on a scale of 1 to 5
(high)
90% of scores are 3
or higher
FY 12, FY13 and
FY14 100% of
scores are 3 or
higher
Three year rate,
100%, exceeds
target
Complete significant,
publishable research
Dissertation Defense: Each
examiner rates each student
on a scale of 1 to 5 (high)
100% of scores are
3 or higher
FY 12, FY13 and
FY14 100% of
scores are 3 or
higher
Target met
Complete significant,
publishable research
Post graduation publication
record
60% of doctoral
graduates should
publish the results
of dissertation
within 4 years
6/10 graduates
from FY08 to
FY12 published
within 4 years
Target met
d. Provide aggregate data on student majors satisfaction (e.g., exit surveys), capstone results, licensing or
certification examination results, employer surveys or other such data that indicate student satisfaction with the
program and whether students are learning the curriculum (for learner outcomes, data should relate to the goals
and objectives of the program as listed in 1e).
Evaluate table 10 from the Office of Planning and Analysis regarding student satisfaction data.
Student satisfaction with MSP undergraduate programs was generally higher than student satisfaction with
LAS or with WSU programs in general. Student satisfaction with MSP graduate programs was 100% every year
while student satisfaction with LAS and WSU graduate programs varied from 74% to 83%
Learner Outcomes (e.g., capstone, licensing/certification exam pass-rates) by year, for the last three years
Year N Name of Exam Program Result National Comparison±
1 NA
2 NA
3 NA
13
e. Provide aggregate data on how the goals of the WSU General Education Program and KBOR 2020 Foundation
Skills are assessed in undergraduate programs (optional for graduate programs).
Outcomes:
o Have acquired knowledge in the arts, humanities, and natural and
social sciences
o Think critically and independently
o Write and speak effectively
o Employ analytical reasoning and problem solving techniques
Results
Majors Non-Majors
Note: Not all programs evaluate every goal/skill. Programs may choose to use assessment rubrics for this purpose. Sample forms available at:
http://www.aacu.org/value/rubrics/
f. For programs/departments with concurrent enrollment courses (per KBOR policy), provide the assessment of
such courses over the last three years (disaggregated by each year) that assures grading standards (e.g.,
papers, portfolios, quizzes, labs, etc.) course management, instructional delivery, and content meet or exceed
those in regular on-campus sections.
Provide information here:
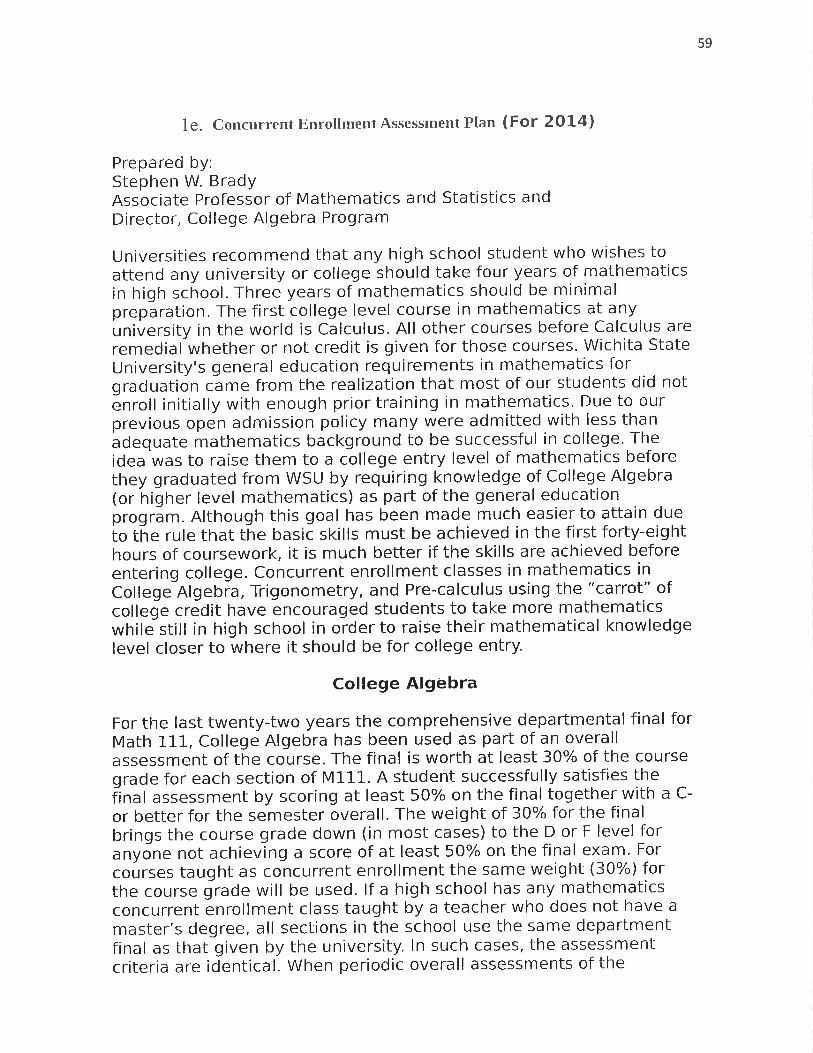
We had concurrent enrollment in the three years under review: the last such enrollment was in the Spring
2014. There is no concurrent enrollment in 2015FY (per WSU Administration decision). In the Attachment
#1e we have put the corresponding Assessment Plan together with Assessment outcomes in the previous
years. As one can see we are in full compliance with KBOR policy.
g. Indicate whether the program is accredited by a specialty accrediting body including the next review date and
concerns from the last review.
Provide information here: Not accredited.
h. Provide the process the department uses to assure assignment of credit hours (per WSU policy 2.18) to all
courses has been reviewed over the last three years.
Provide information here:
The process the department has used to assign credit hours to every course that has been offered in the
past three years (either new offering or a previous course reviewed for any reason) has been in full
compliance with WSU policy 2.18 (http://webs.wichita.edu/inaudit/ch2_18.htm). The procedure we have
followed is identical to the one described in item 3. of Policy 2.18.
i. Provide a brief assessment of the overall quality of the academic program using the data from 3a – 3f and
other information you may collect, including outstanding student work (e.g., outstanding scholarship,
inductions into honor organizations, publications, special awards, academic scholarships, student recruitment
and retention).
The academic programs for the MSP department are very strong. Students in these programs are well
prepared, as demonstrated by ACT scores and entering GPA scores. The assessment targets for the
undergraduate and graduate programs are met or exceeded for almost every Learning Outcome.
Enrollment in the PhD program is strong and between ten (10) and sixteen (16) new graduates of the PhD
program are anticipated by July, 2017. Student satisfaction with the MSP programs is high, including 100%
satisfaction with the MSP graduate programs.

14
4. Analyze the student need and employer demand for the program. Complete for each program if appropriate
(refer to instructions in the WSU Program Review document for more information on completing this section).
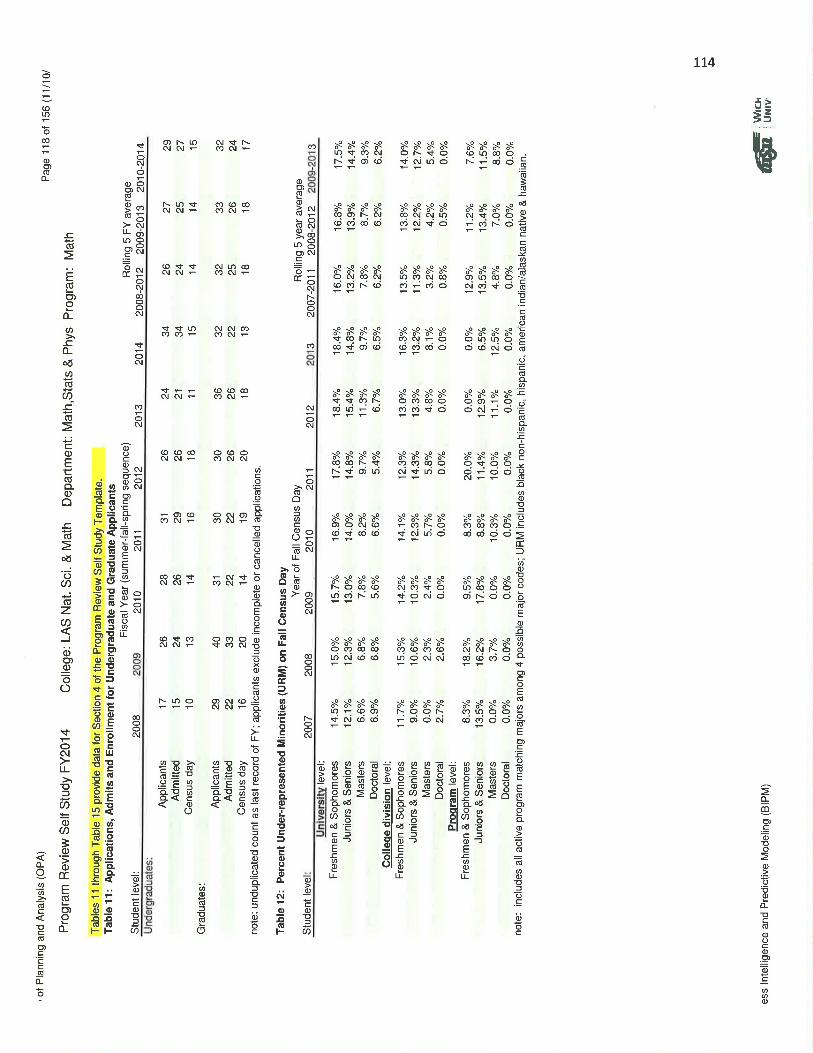
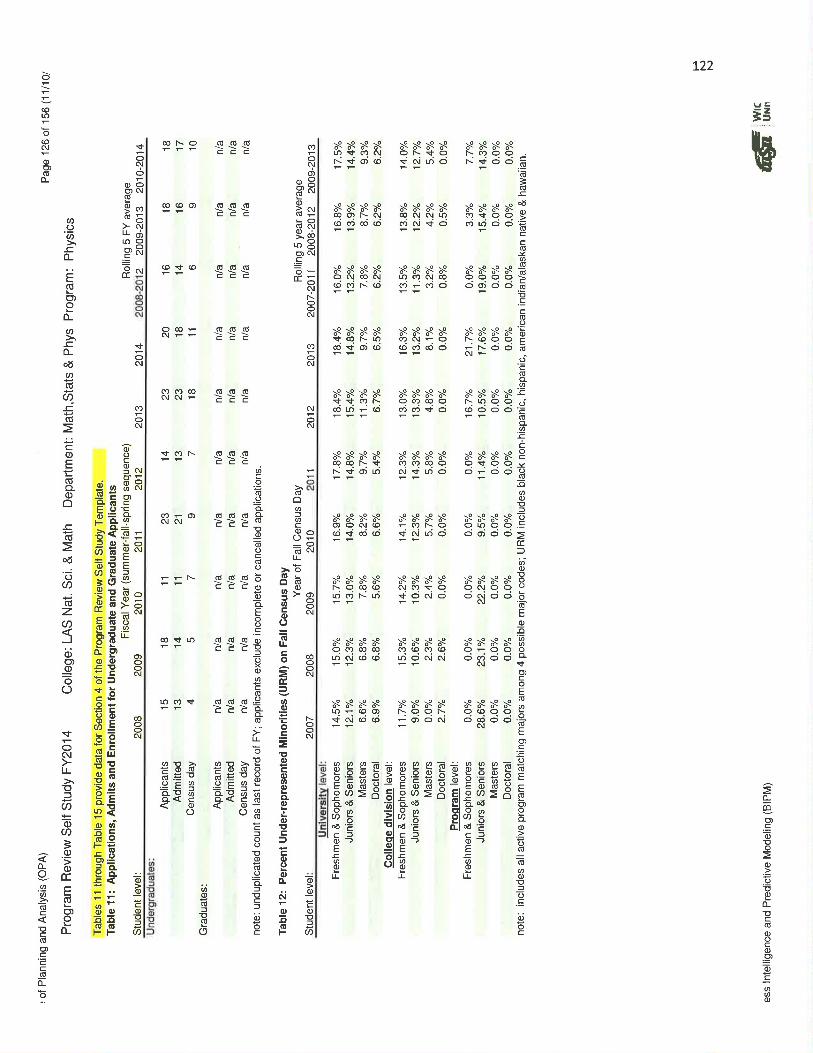
a. Evaluate tables 11-15 from the Office of Planning Analysis for number of applicants, admits, and enrollments
and percent URM students by student level and degrees conferred.
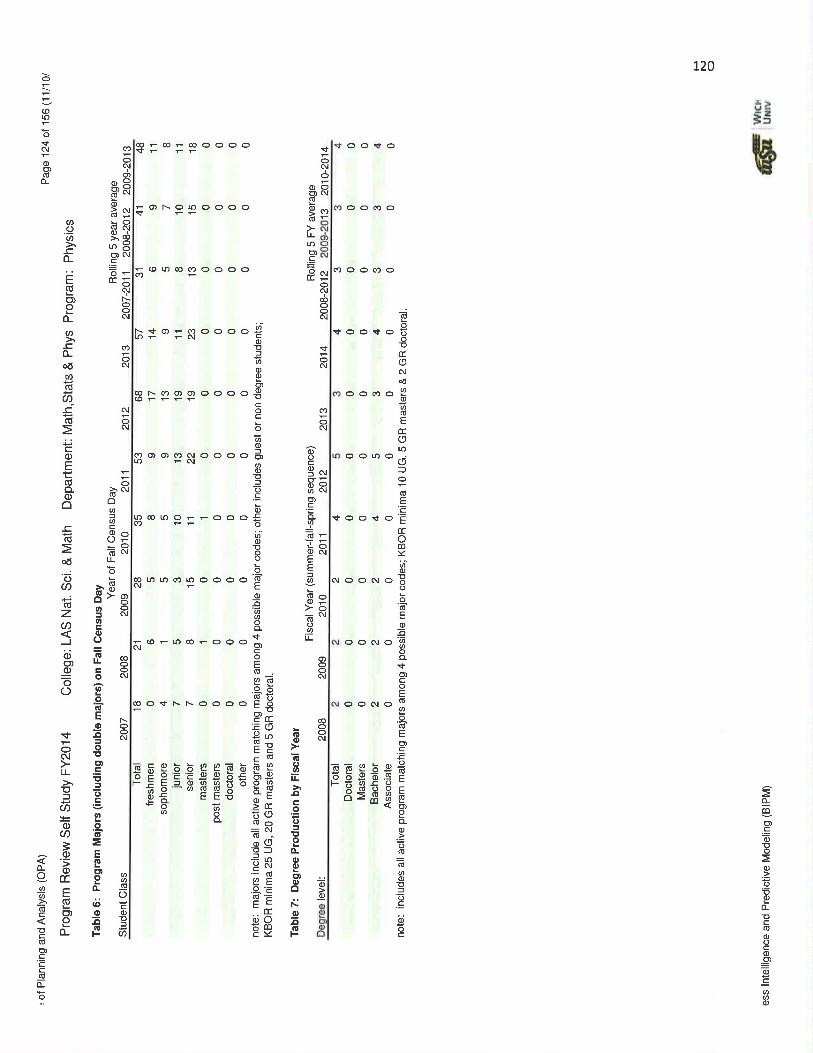
For the BS (Math) program: Students are applying to the Math program (FY2012: 26; FY2013: 24; FY2014:
34), being admitted (FY2012: 26; FY2013: 21; FY2014: 34), and enrolling (FY2012: 18; FY2013: 11; FY2014:
For the BS (Physics) program: Students are applying to the Physics program (FY2012: 14; FY2013: 23;
FY2014: 320, being admitted (FY2012: 13; FY2013: 23; FY2014: 18), and enrolling (FY2012: 7; FY2013: 18;
FY2014: 11) in sufficient numbers for the sustainability of the program.
For the MS program: Students are applying to the MSP graduate programs (FY2012: 30; FY2013: 36;
FY2014: 32), being admitted (FY2012: 26; FY2013: 26; FY2014: 22), and enrolling (FY2012: 20; FY2013: 18;
FY2014: 13) in sufficient numbers for the sustainability of the programs. (The data in Table 11 is
not broken down by graduate program.) Enrollment in the MS program is appropriate (FY2012: 30; FY2013:
27; FY2014: 24) and above the KBOR minimum of 20. Approximately 60% of enrolled MS students are
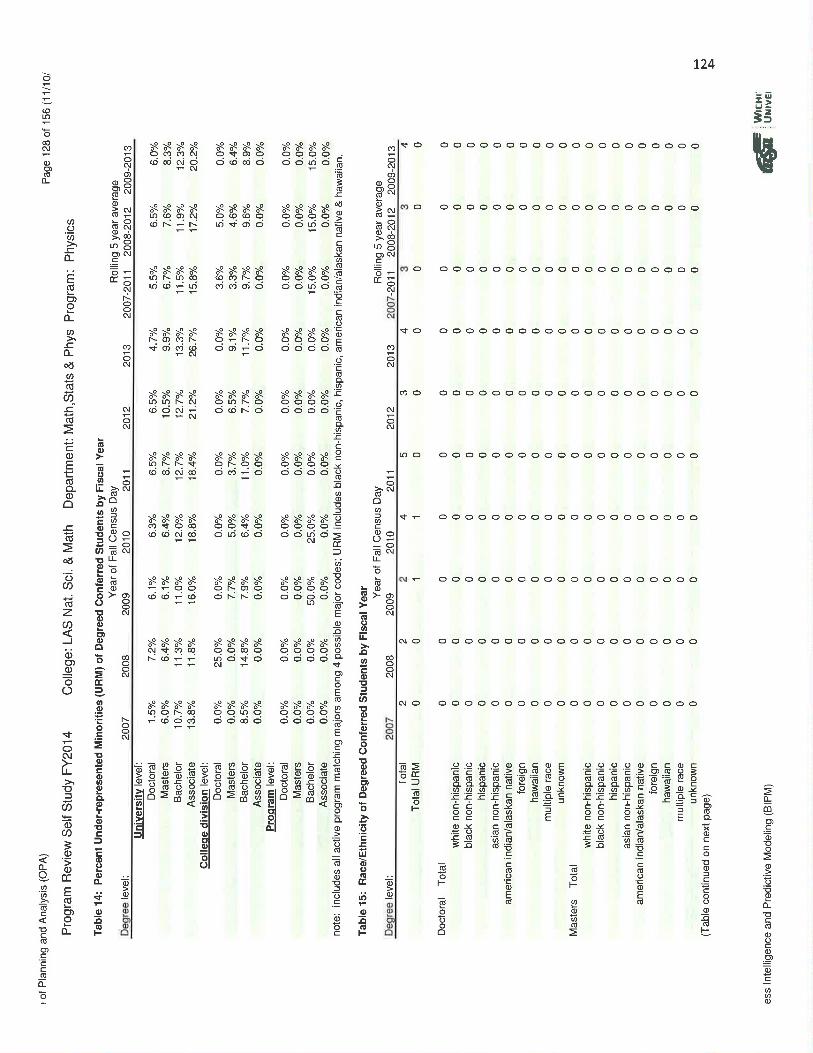
white non-hispanic (FY2012: 17/30; FY2013: 17/27; FY2014: 16/24), 14% are foreign (5/30; 3/27; 3/24)
and other groups include asian (3/30, 3/27, 3/24), hispanic (2/30; 2/27; 1/24) and black non-hispanic
(0/30; 1/27; 0/24) according to Table 13; however, between 0% and 20% of the MS graduates are under-
represented minorities according to Table 14 (FY2012: 0%; FY2013: 12.5%; FY2014: 20%). It would be
desirable if the numbers of under-represented minorities in the MS program increased; however, with
essentially no funding at the department level for advertising and recruiting, MSP is at the mercy of the
college and university with respect to attracting under-represented minorities to the MS program.
For the PhD program: Students are applying to the MSP graduate programs (FY2012: 30; FY2013: 36;
FY2014: 32), being admitted (FY2012: 26; FY2013: 26; FY2014: 22), and enrolling (FY2012: 20; FY2013: 18;
FY2014: 13) in sufficient numbers for the sustainability of the programs. (The data in Table 11 is not
broken down by graduate program.) Enrollment in the PhD program is appropriate (FY2012: 15; FY2013:
13; FY2014: 14) and above the KBOR minimum of 10. Approximately 45% of enrolled PhD students are
white non-hispanic (FY2012: 8/15; FY2013: 6/13; FY2014: 5/14), 45% are foreign (6/15; 6/13; 7/14), and
7% asian non-hispanic (1/15; 1/13; 1/14) according to Table 13. There were no students in the PhD
program who were classified as black non-hispanic, hispanic, american indian/alaskan native, hawaiian or
multiple race. However these groups do not seem to choose to enter PhD programs in MSP in large
numbers; for example, according to the 2013 American Mathematical Society "Report on New Doctorial
Recipients", of 1843 PhDs in mathematics granted in 2012-13, black non-hispanic students earned 2% (44)
of these degrees, hispanic students earned 4% (65) of these degrees, american indian/alaskan native
students earned 0% (5) of these degrees, asian non-hispanic (domestic or foreign) students earned 43%
(800) of these degrees and white non-hispanic students earned 49% (894) of these degrees. It would be
desirable if the numbers of under-represented minorities in the PhD program increased; however, with
essentially no funding at the department level for advertising and recruiting, MSP is at the mercy of the
college and university with respect to attracting under-represented minorities to the PhD program.
15
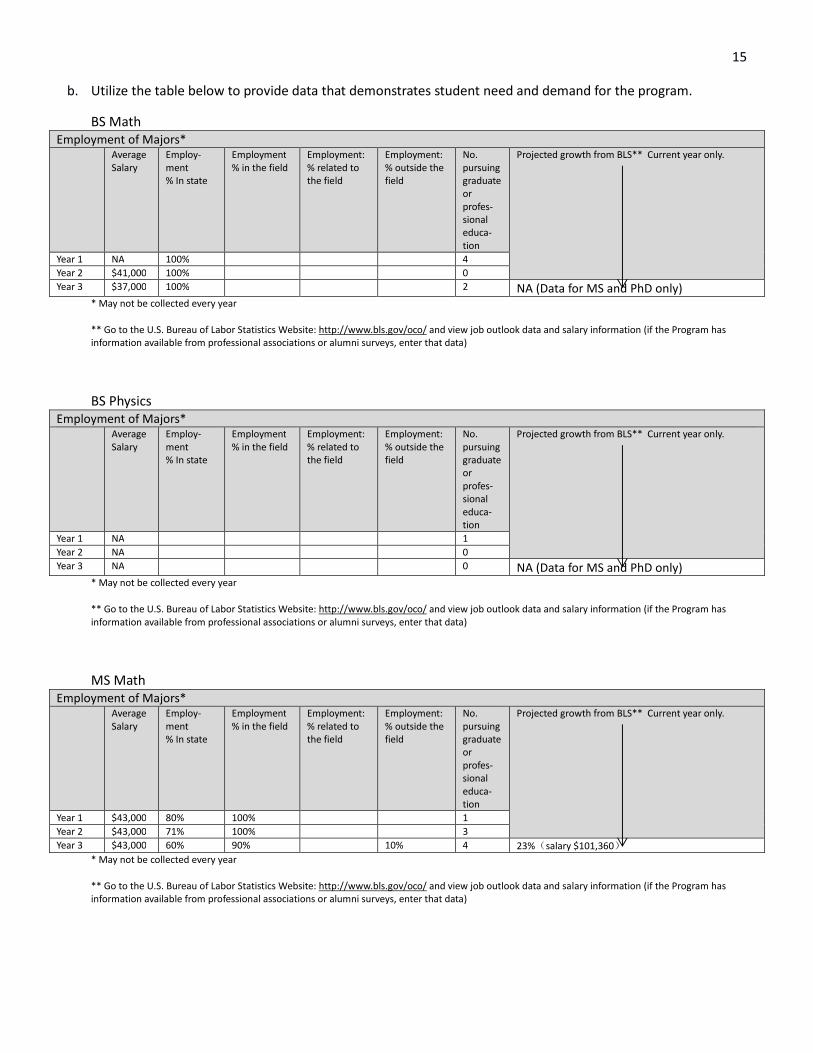
b. Utilize the table below to provide data that demonstrates student need and demand for the program.
BS Math
Employment of Majors* Average
Salary
Employ-
ment
% In state
Employment
% in the field
Employment:
% related to
the field
Employment:
% outside the
field
No.
pursuing
graduate
or
profes-
sional
educa-
tion
Projected growth from BLS** Current year only.
Year 1 NA 100% 4
Year 2 $41,000 100% 0
Year 3 $37,000 100% 2 NA (Data for MS and PhD only) * May not be collected every year
** Go to the U.S. Bureau of Labor Statistics Website: http://www.bls.gov/oco/ and view job outlook data and salary information (if the Program has
information available from professional associations or alumni surveys, enter that data)
BS Physics
Employment of Majors* Average
Salary
Employ-
ment
% In state
Employment
% in the field
Employment:
% related to
the field
Employment:
% outside the
field
No.
pursuing
graduate
or
profes-
sional
educa-
tion
Projected growth from BLS** Current year only.
Year 1 NA 1
Year 2 NA 0
Year 3 NA 0 NA (Data for MS and PhD only) * May not be collected every year
** Go to the U.S. Bureau of Labor Statistics Website: http://www.bls.gov/oco/ and view job outlook data and salary information (if the Program has
information available from professional associations or alumni surveys, enter that data)
MS Math
Employment of Majors* Average
Salary
Employ-
ment
% In state
Employment
% in the field
Employment:
% related to
the field
Employment:
% outside the
field
No.
pursuing
graduate
or
profes-
sional
educa-
tion
Projected growth from BLS** Current year only.
Year 1 $43,000 80% 100% 1
Year 2 $43,000 71% 100% 3
Year 3 $43,000 60% 90% 10% 4 23%(salary $101,360) * May not be collected every year
** Go to the U.S. Bureau of Labor Statistics Website: http://www.bls.gov/oco/ and view job outlook data and salary information (if the Program has
information available from professional associations or alumni surveys, enter that data)
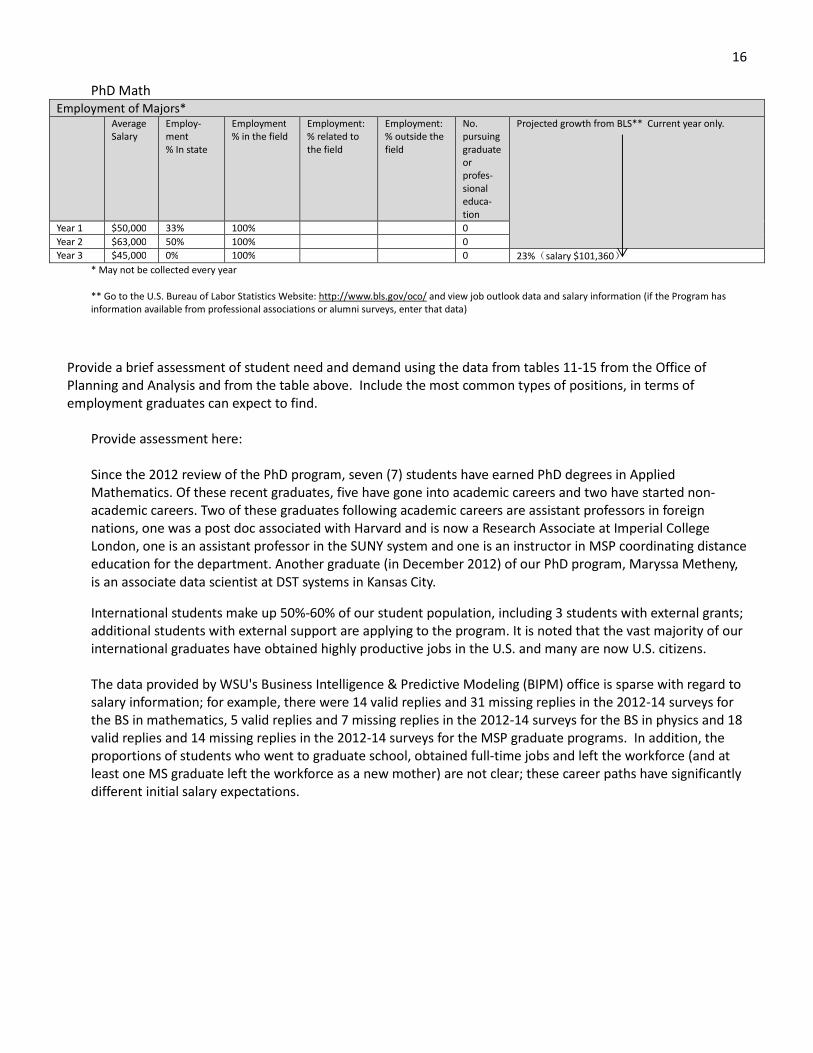
16
PhD Math
Employment of Majors* Average
Salary
Employ-
ment
% In state
Employment
% in the field
Employment:
% related to
the field
Employment:
% outside the
field
No.
pursuing
graduate
or
profes-
sional
educa-
tion
Projected growth from BLS** Current year only.
Year 1 $50,000 33% 100% 0
Year 2 $63,000 50% 100% 0
Year 3 $45,000 0% 100% 0 23%(salary $101,360) * May not be collected every year
** Go to the U.S. Bureau of Labor Statistics Website: http://www.bls.gov/oco/ and view job outlook data and salary information (if the Program has
information available from professional associations or alumni surveys, enter that data)
Provide a brief assessment of student need and demand using the data from tables 11-15 from the Office of
Planning and Analysis and from the table above. Include the most common types of positions, in terms of
employment graduates can expect to find.
Provide assessment here:
Since the 2012 review of the PhD program, seven (7) students have earned PhD degrees in Applied
Mathematics. Of these recent graduates, five have gone into academic careers and two have started non-
academic careers. Two of these graduates following academic careers are assistant professors in foreign
nations, one was a post doc associated with Harvard and is now a Research Associate at Imperial College
London, one is an assistant professor in the SUNY system and one is an instructor in MSP coordinating distance
education for the department. Another graduate (in December 2012) of our PhD program, Maryssa Metheny,
is an associate data scientist at DST systems in Kansas City.
International students make up 50%-60% of our student population, including 3 students with external grants;
additional students with external support are applying to the program. It is noted that the vast majority of our
international graduates have obtained highly productive jobs in the U.S. and many are now U.S. citizens.
The data provided by WSU's Business Intelligence & Predictive Modeling (BIPM) office is sparse with regard to
salary information; for example, there were 14 valid replies and 31 missing replies in the 2012-14 surveys for
the BS in mathematics, 5 valid replies and 7 missing replies in the 2012-14 surveys for the BS in physics and 18
valid replies and 14 missing replies in the 2012-14 surveys for the MSP graduate programs. In addition, the
proportions of students who went to graduate school, obtained full-time jobs and left the workforce (and at
least one MS graduate left the workforce as a new mother) are not clear; these career paths have significantly
different initial salary expectations.

17
5. Analyze the service the Program provides to the discipline, other programs at the University, and beyond.
Complete for each program if appropriate (refer to instructions in the WSU Program Review document for more
information on completing this section).
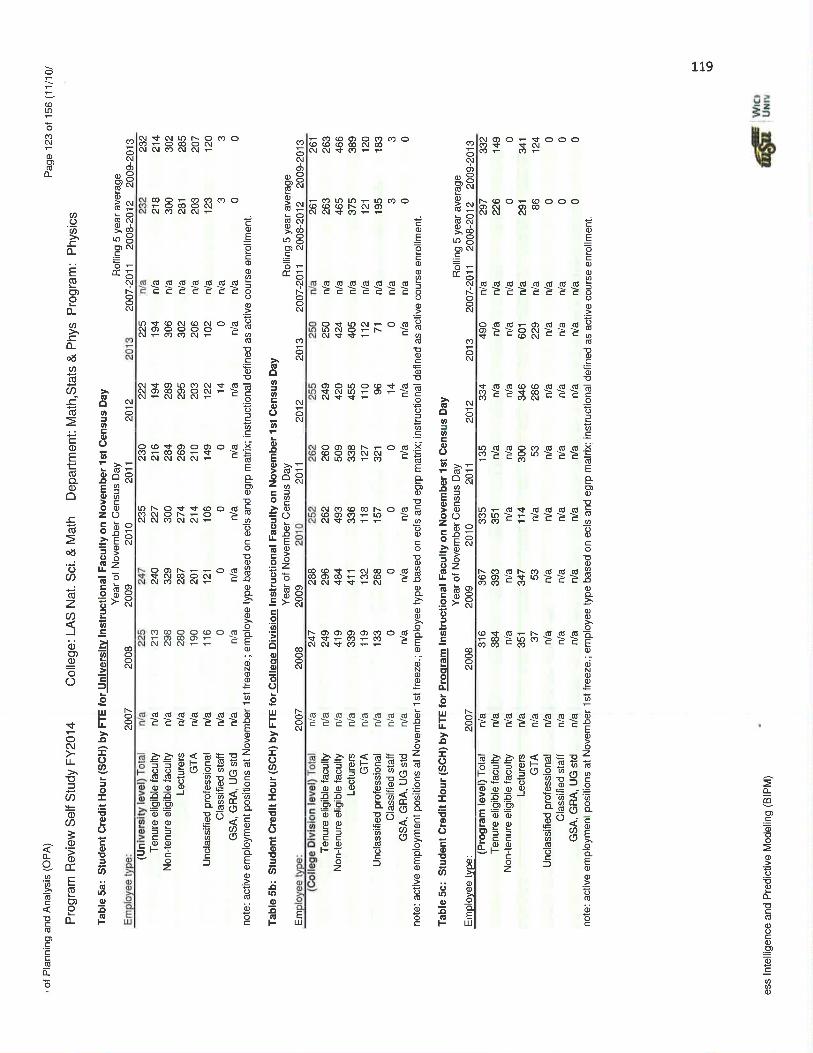
Evaluate table 16 from the Office of Planning Analysis for SCH by student department affiliation on fall census
day.
In the Department of Mathematics, Statistics and Physics, most of our classes offered are services classes
to student in other majors and general education fulfillment requirement classes. This causes a large
burden of introductory classes to be taught. Many of these classes are taught by short term lecturers,
many of whom are our MS and PhD students taking their first job, adjunct or guest professors and, where
possible graduate students. While all of the regular tenured and tenured-track faculty have active research
activities, the lecturers and adjuncts simply fulfill the teaching roll assigned to them. In many cases this
results in simply servicing the classes without any research accompanying activity and, in some cases, the
use of these temporary lecturers and guest faculty results in less experienced instruction, especially for
the evening classes. There are many ways to get around this problem with a slight increase in funding that
would provide a high payback to the University on the research funded activities. We highly encourage
the administration to discuss these arguments. We have seen in the 5 year enrollment averages a 4% and
2.5% jump in Student Credit Hours for Mathematics and Statistics classes from 2008-2012 to 2009-2013
and 2009-2013 to 2010-2014 academic years, while in Physics these numbers have had a 3.6% and a 2.9%
increase in the corresponding 5 year enrollment average Student Credit Hour numbers. With the
continued enrollment of Freshmen at Wichita State University projected to be 20% over the next four
years, this will certainly result in a continued growth of Student Credit Hours for Mathematics and Physics;
however, continued growth in class instruction by simply hiring more graduate students or lectures
without supporting an increase in tenure track faculty will not be able to satisfy this growth because the
number of graduate students is limited by the research active faculty, which continues to drop due to
faculty departures, retirements and deaths that are not being quickly replaced. This will result in a crisis of
not being able to provide adequate instruction for the growing Mathematics and Physics demand unless
action is started this coming academic year to properly address these faculty and lecturer needs.
a. Provide a brief assessment of the service the Program provides. Comment on percentage of SCH taken by
majors and non-majors, nature of Program in terms of the service it provides to other University programs,
faculty service to the institution, and beyond.
Provide assessment here:
As a consequence of the mission of our department, most of our SCH is produced by non-majors. This is
(especially in the graduate programs) dictated by very limited funds (stipends, assistantships, etc.) to
support our students.
The Department of Mathematics, Statistics, and Physics is larger in student credit hours production than
three WSU colleges (Education, Fine Arts, and Engineering). We however are the most inexpensive in
terms of the expenditure of university resources.
18
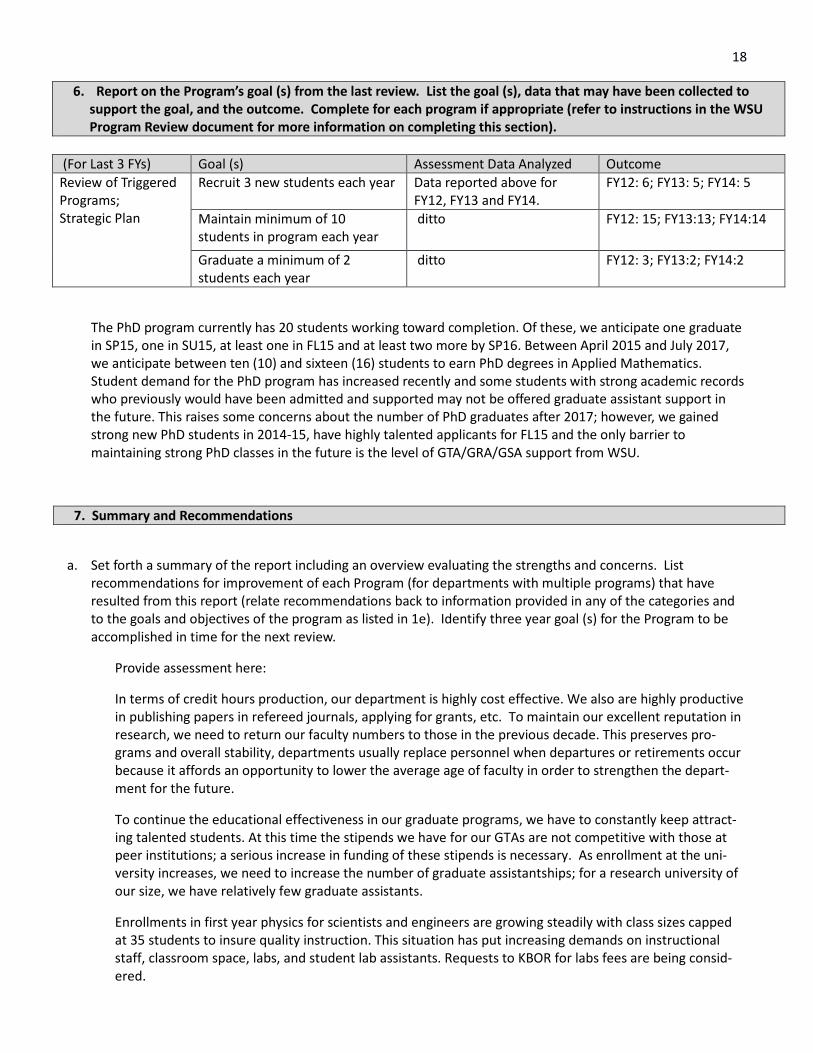
6. Report on the Program’s goal (s) from the last review. List the goal (s), data that may have been collected to
support the goal, and the outcome. Complete for each program if appropriate (refer to instructions in the WSU
Program Review document for more information on completing this section).
(For Last 3 FYs) Goal (s) Assessment Data Analyzed Outcome
Review of Triggered
Programs;
Strategic Plan
Recruit 3 new students each year Data reported above for
FY12, FY13 and FY14.
FY12: 6; FY13: 5; FY14: 5
Maintain minimum of 10
students in program each year
ditto FY12: 15; FY13:13; FY14:14
Graduate a minimum of 2
students each year
ditto FY12: 3; FY13:2; FY14:2
The PhD program currently has 20 students working toward completion. Of these, we anticipate one graduate
in SP15, one in SU15, at least one in FL15 and at least two more by SP16. Between April 2015 and July 2017,
we anticipate between ten (10) and sixteen (16) students to earn PhD degrees in Applied Mathematics.
Student demand for the PhD program has increased recently and some students with strong academic records
who previously would have been admitted and supported may not be offered graduate assistant support in
the future. This raises some concerns about the number of PhD graduates after 2017; however, we gained
strong new PhD students in 2014-15, have highly talented applicants for FL15 and the only barrier to
maintaining strong PhD classes in the future is the level of GTA/GRA/GSA support from WSU.
7. Summary and Recommendations
a. Set forth a summary of the report including an overview evaluating the strengths and concerns. List
recommendations for improvement of each Program (for departments with multiple programs) that have
resulted from this report (relate recommendations back to information provided in any of the categories and
to the goals and objectives of the program as listed in 1e). Identify three year goal (s) for the Program to be
accomplished in time for the next review.
Provide assessment here:
In terms of credit hours production, our department is highly cost effective. We also are highly productive
in publishing papers in refereed journals, applying for grants, etc. To maintain our excellent reputation in
research, we need to return our faculty numbers to those in the previous decade. This preserves pro-
grams and overall stability, departments usually replace personnel when departures or retirements occur
because it affords an opportunity to lower the average age of faculty in order to strengthen the depart-
ment for the future.
To continue the educational effectiveness in our graduate programs, we have to constantly keep attract-
ing talented students. At this time the stipends we have for our GTAs are not competitive with those at
peer institutions; a serious increase in funding of these stipends is necessary. As enrollment at the uni-
versity increases, we need to increase the number of graduate assistantships; for a research university of
our size, we have relatively few graduate assistants.
Enrollments in first year physics for scientists and engineers are growing steadily with class sizes capped
at 35 students to insure quality instruction. This situation has put increasing demands on instructional
staff, classroom space, labs, and student lab assistants. Requests to KBOR for labs fees are being consid-
ered.
19
To further increase efficiency and the productivity of our faculty and GTAs, we need to continue being on
the forefront of the computer revolution which is rapidly changing the way we teach and do research. The
use of state-of–the-art technology already benefits us and our students tremendously. To continue utiliz-
ing the currently available technology we need to be aware of the latest developments in educational
software. One critical need is more computer equipped classrooms. LAS provided us with one such facility
years ago. It is being constantly used and provides us with obvious opportunities for computer use in
teaching mathematics and statistics classes. However, it holds only 32 students at a time and at least one
more such classroom is needed.
In light of the above observations, we are setting the following goals for the next 3 years.
I. FACULTY POSITIONS.
We represent three major STEM disciplines. We are essentially three departments under one roof: Statis-
tics, Mathematics, and Physics. In terms of faculty structure we are stressed in all three departments and
near the breaking point in Statistics.
(a) Statistics.
We need two tenure-track positions for FY2017. We have not hired any statisticians in the past 15 years.
In FY2017, we will have only three statisticians (75% of the statistics portion of the department; we need a
minimum of four PhD statisticians); in addition, one of the three remaining statisticians has been on the
faculty since 1967, was on medical leave in the Fall 2014 semester and will, eventually, no longer be
teaching statistics at WSU. Our goal is to hire two new statisticians to replace one retiring statistician and
to prepare for the eventual retirement of another statistician. We will be unable to provide an adequate
graduate education in statistics and our ability to provide an adequate undergraduate education in statis-
tics will be strongly diminished without filling those two positions by Fall 2016. We have a number (8+)
graduate students studying statistics, include five PhD students in statistics, and the demand for a gradu-
ate statistics education is increasing. Since we didn’t get the statistics positions we requested for FY2016,
one of our statisticians (Hari Mukerjee) postponed his retirement till next year. We need one Assoc. Prof.
to oversee the large number of stat classes taken by students of various colleges (26 sections per year
with 35 students in each; mostly taught by Instructors, Lecturers, and GTAs). We also need to fill another
position in Statistics (Asst. Prof.) to teach our Masters and PhD students (the demand for the statistics de-
gree is growing). We are also missing out on grant activity in an area where there are very good possibili-
ties.
(b) Mathematics.
We need a minimum of two tenure-track positions for FY2017. Due to loss of Alan Elcrat, Ken Miller, An-
drew Acker, John Robertson, Christian Wolf we are in a very difficult situation with our applied math pro-
gram. Over the last 5 years we lost eight (8) Professorial positions, and were allowed to hire only two
(Mark Walsh and Catherine Searle). The losses we suffered not only hurt our graduate program, it also se-
verely limited our abilities to apply for outside grants. We have lost faculty in Analysis (e.g. fluid dynamics,
inverse problems, numerical analysis, partial differential equations), which was and is our strongest re-
search concentration and the principal area for which our research is known nationally; these areas at-
tracted many of our graduate students. This area was also our major contact with the engineering com-
munity and also our major source for grant support. The main Fluid Dynamics people are gone. Next year
we’ll have only two trained Numerical Analysts, one of whom is very busy as Department chair, and nu-
merical analysis is an important part of our graduate education. We are also missing out on applying for
the abundant grant possibilities in these areas (in the past we received over a million dollars of grants by
faculty in these areas).

20
(c) Physics.
The request is for one tenure-track position for 2017 FY. Enrollments in first year physics for scientists and
engineers are growing steadily with class sizes capped at 35 students to insure quality instruction. This
situation has put increasing demands on instructional staff, classroom space, and labs. The credit hour
production of the physics department has increased by over 40% due to the full transfer back to LAS of all
physics classes. Since first year calculus-based physics for scientists and engineers basically gives an over-
view of the entire undergraduate physics curriculum, it is important that PhD level faculty, preferably with
research programs of their own, teach these courses.
The Physics group is currently formulating a plan to restart the suspended MS degree in Physics. This is
discussed in goal III, below.
II. GRADUATE PROGRAM SUPPORT
The request is for an increase in the graduate assistant budget. Our Ph.D. alumni include tenured faculty
members at the University of Arizona and Georgetown University, as well as at other universities like Kent
State University and Towson University, and tenure-track faculty at universities like Texas State Universi-
ty--San Marcos and Xavier University. Graduating PhDs who become tenured faculty members at well-
known and respected universities enhances the reputation of Wichita State University and attracting un-
dergraduates from outside Kansas depends, in part, on a favorable university reputation. Our PhD pro-
gram is on the verge of remarkable success; we anticipate at least ten (and possibly up to 16) new PhD
graduates by July 2017. We need to continue to attract strong new PhD students. Unfortunately, the
amounts of our graduate stipends is significantly lower than our peers and the number of MSP students
with graduate assistantships is significantly lower than at research universities of our size which empha-
size science, technology, engineering and the mathematical sciences.
The second goal of the department is to increase the level of financial support for the MSP graduate pro-
grams so as to increase the number of graduate assistants and increase their stipends to competitive na-
tional levels and to attract the best possible students to these graduate programs by increasing national
recruitment and advertising our (requested) nationally competitive stipend levels. The department's plan
for advancing this goal would be to increase the budget of the graduate program from the current level of
$353,000 (from LAS and the Graduate School) to a level of $500,000 over two years. In FY93, for example,
the graduate programs in Mathematics and Statistics were allocated approximately $253,000 (from LAS
and the Graduate School); in 2015 dollars, this would be worth approximately $420,000. With the antici-
pated enrollment increase and hence the need for additional GTAs to teach lower division MSP courses,
this request is in alignment with university goals.
Additional graduate assistants will be required to support the anticipated increased enrollments at WSU
and an enhanced recruitment of new graduate students provides the expectation that additional Ph.D.
alumni become professors at well-respected universities. Additional financial resources increases the op-
portunity to offer additional GRAs, which provide Ph.D. students with opportunities to enhance their pub-
lication records and possibly to obtain postdoc positions at universities like Cal Tech, Harvard and Stan-
ford; students with postdocs at prestigious universities have enhanced chances of obtaining faculty posi-
tions at good research universities.
III. PHYSICS MASTERS PROGRAM and OUTREACH TO THE INOVATION CAMPUS
A plan is being formulated to restart the suspended MS degree in Physics. This will provide increased op-
portunities for students in STEM fields. A physics option was introduced into the Applied Mathematics
PhD program in 2012, in addition to the existing mathematics and statistics options. The Physics MS will
potentially feed into this new option, providing even more possibilities for students and increasing chanc-
21
es for physics faculty to bring in external funding, as they did previously when their MS program was ac-
tive. Although the restart of the Physics MS is being formulated to work with existing resources and staff,
one part of the plan is to explore possibilities for joint hires with Engineering or other science depart-
ments in areas of mutual interest. For instance, materials science is an active area in both the physics
group and Mechanical Engineering and a joint hire could share research labs and teaching duties. Other
areas of cooperation include or have included chemical physics, quantum information, improvement of
WSU high performance computational facilities, and development of space satellites for solar physics ob-
servations.
The Math/Stat/Physics Department will explore the possibilities of joint work across a broad spectrum of
applied science, technology, and engineering, as the Innovation Campus unfolds. Since the start of the
Applied Mathematics PhD program in the 1980s there have been a number of collaborative efforts involv-
ing our research faculty and PhD students. Joint projects have been undertaken in fluid dynamics, compu-
tational mechanics for the crash sled, scientific computing, inverse problems in cabin acoustics for busi-
ness jets, computational electro-magnetics for lightening strike research, and statistical analysis. External
funding supporting these projects has come from the NSF and NSF EPSCoR, the FAA, the Air Force Office
of Scientific Research, and Admark grants. At least two former PhD students (Clarkson, Harder) and one
faculty member (Hrycak) have been on the staff of NIAR. We anticipate involvement in more joint projects
in the future, in areas related to the proposed WSU research clusters. Rebuilding our research faculty to
former levels will enhance such opportunities greatly.


65
DEPARTMENT OF MATHEMATICS, STATISTICS, AND PHYSICS
2015 SELF-STUDY REPORT
Attachment #3.
Office of Planning and Analysis data.