department of employment services talent …
TRANSCRIPT

DEPARTMENT OF EMPLOYMENT SERVICES
TALENT FORWARD DC: ANNUAL ECONOMIC AND WORKFORCE REPORT FISCAL YEAR 2020
The Department of Employment Services is an Equal Opportunity Employer/Provider. Auxiliary aids and services are available upon request to persons with disabilities.

1
TABLE OF CONTENTS
I- Letter from the Director ........................................................................................................................ 2
II- Highlights .................................................................................................................................................... 3
III- State of the District’s Workforce ........................................................................................................ 8
Workforce Development Overall Outcomes .................................................................................................. 9
IV- Economic Supply and Demand in the District ............................................................................. 15
Employment Data .................................................................................................................................................. 16
Labor Market Demand in the District ............................................................................................................ 22
Labor Market Supply in the District ............................................................................................................... 23
WIOA Performance Outcomes .......................................................................................................................... 25
IV- Looking Forward.................................................................................................................................... 26
V- DOES PROGRAMS AND SUCCESS STORIES ..................................................................................... 28
Program Descriptions .......................................................................................................................................... 29
Success Stories ........................................................................................................................................................ 36

2
LETTER FROM THE DIRECTOR
In the midst of a global pandemic, the District of
Columbia Department of Employment Services
(DOES) continues to rise to the challenge of meeting
the needs of residents, workers and businesses,
exemplifying Mayor Muriel Bowser’s DC Values by
providing a fair shot at economic stability. In fiscal
year (FY) 2020, with innovation as our guide and
our role as economic first responders propelling us
forward, the District’s labor agency made great
strides and further established the District as a
trailblazer in workforce development strategies.
From providing hundreds of millions in financial
support to meet the unprecedented demand for
unemployment benefits, achieving the District’s
#Fightfor15 minimum wage, connecting residents to
in-demand careers through the DC Infrastructure
Academy, and launching the Paid Family Leave
benefits program to administering the first virtual
Mayor Marion S. Barry Summer Youth Employment
Program – DOES remains committed to our Vision
Forward goals of continuing service delivery
improvements, enhancing career pathways that align
education and workforce, expanding our approach
to assessing human capital, and implementing an
integrative data and system-infrastructure
strategy that meets the workforce needs of District
residents and businesses.
FY 2020 saw the rapid change in the District’s
economic landscape due to the COVID-19 pandemic.
The public health emergency placed a heavy burden
on individuals, families, and the business
community and made the need for dependable
government service delivery most critical. At
DOES, our Office of Unemployment Compensation
has been most impacted by the demands of the
economic shift. This year, we saw an increase of
372% in unemployment claims received
compared to a typical year and our Office of
Customer Experience received over 526,000 calls.
The agency continues to adopt the latest policies
to ensure our community has immediate access to
federal and state-level support, as we work to put
District residents and businesses back on
track. We know that stability is not achieved through
unemployment insurance and benefit programs
alone; our agency has a plethora of programs
committed to connecting District talent to
businesses and providing the support and resources
for them to thrive.
Our annual report is designed to highlight the
efforts and accomplishments of the agency in FY
2020. As the DC’s labor administrator, and with our
valued partners and stakeholders, I am proud to
lead a resilient, focused and committed agency in
the building of a robust and reliable system that
meets District needs now and for the future.
Dr. Unique Morris-Hughes
Director

3
MISSION
Our mission is to connect District residents, job seekers, and employers to opportunities and resources that empower fair, safe, and effective working communities.
3

4
VISION
We provide comprehensive employment services to ensure a competitive workforce, full employment, life-long learning, economic stability and the highest quality of life for all.
4

5
WE BELIEVE... • It is our role to serve all residents of the
District from all economic, social, and cultural backgrounds.
• We are responsible for providing excellent service to all of our customers and partners.
• We are the partner of choice for all DC employers to find skilled and talented employees in the District.
• We must increase equitable opportunities for all DC residents so they may secure jobs that provide livable wages and the opportunity for economic advancement.
• We must provide training that is responsive to the needs of employees and innovative to meet the needs of employers in our growing city.
• The key to our success is to leverage cutting edge technology to support residents seeking meaningful employment.
5

6
GOALS 1. Promote the District’s Human Capital
2. Align Workforce with Education
3. Create Equity and Access
4. Achieve Excellence in Service Delivery
5. Operate Smart and Effective Systems
6. Provide Best-in-Class Customer Service
6

STATE OF THE
DISTRICT’S WORKFORCE
7

8
Workforce Development Overall Outcomes
Employment - Describes when an individual or participant is working in a paid, unsubsidized job, therefore has wages reported during the fiscal year.
Participant - For the Workforce Innovation and Opportunity Act (WIOA) Title I Adult, Title I Dislocated Worker, Title I Youth, and Title III programs, a participant is a reportable individual who has received services, after satisfying all applicable programmatic requirements for the provision of services, such as eligibility determination.
Exit - Occurs when a participant, enrolled in multiple partner programs, has not received services from any Department of Labor and locally administered program in which the participant is enrolled, to which the common exit policy applies, for at least 90 days, and no future services are planned.
Services - Defined as all services or training received by participants such as career counseling, One- Stop resources room utilization, Individual Training Account (ITA) training, job readiness workshops, Reemployment Services and Eligibility Assessment (RESEA) workshop, etc.
Average Quarterly Wages- The average quarterly wage earned by employed customers that have exited DOES programs during the fiscal year.
Table 1: Outcomes of Workforce Development Services Provided
Outcomes FY2018 FY2019 FY2020
Total People Served 29,435 28,087 21,136
Total Services Provided 111,789 100,938 63,098
Average Individual Services Provided 4 4 3
Employed 14,520 12,646 9,213
Average Quarterly Wages $6,486 $8,465 $6,516
Total Wages $223,075,441 $228,066,280 $148,839,552
Employment Rate 49% 45% 44%
Average DC Unemployment Rate 5.8% 5.6% 7.3%
Source: DOES; Office of Labor Market Research and Performance
More than 275,000 services were provided to workforce development (federal and local)
participants and/or stakeholders in the last three fiscal years. On average, more than 26,000 individual participants were served during the last three
fiscal years with an average of more than three (3.5) different types of services provided to each of them.
The total number of people served decreased by 25% from Fiscal Year 2019 to 2020. The unemployment rate in the District has increased due to the coronavirus pandemic. Overall, DOES customers have earned almost $600M in wages during the last three
fiscal years.
Total expenditures - Defined as total expenditures for workforce development programs such as Federal Workforce Bureau programs, Division of States Initiative programs by fiscal year.
Cost per services – Defined as the ratio of total expenditures by the total services provided by fiscal year.

9
Cost per individual served – Defined as the ratio of total expenditures by the total unique individuals served by fiscal year.
Table 2: Total Expenditures and Cost Per Service
Expenditure Category FY2018 FY2019 FY2020
Total expenditures for Workforce Development Programs
$72,361,000 $74,523,000 $59,047,000
Cost Per Services $647 $738 $936
Cost Per Individual Served $2,458 $2,653 $2794
Source: DOES; Office of Labor Market Research and Performance
Total expenditures for workforce development programs decreased by 21% from
FY2019 to FY2020. The average cost of services provided has increased by 45% from FY2018 to FY2020,
whereas the average cost per individual served has increased by 14% from FY2018 to FY2020.
Outcomes Distribution by Demographics for FY2019 Participants
Table 3: Employment and Wages for People Served by Ward
Ward People Served Total Wages Earned (Calendar Year)
Ward Total Employed 2019Q4 2020Q1 2020Q2 2020Q3
Ward 1 1,207 549 $2,882,169 $2,627,380 $1,868,984 $2,085,510
Ward 2 296 162 $1,267,599 $1,020,808 $522,476 $515,384
Ward 3 355 170 $1,343,036 $917,877 $636,184 $792,487
Ward 4 1,879 724 $3,275,051 $2,819,775 $2,097,513 $2,596,899
Ward 5 2,797 1,128 $4,823,296 $4,384,890 $3,345,242 $3,814,321
Ward 6 1,728 741 $3,445,212 $2,819,305 $2,482,607 $2,718,654
Ward 7 5,081 1,989 $7,319,140 $6,170,472 $5,072,598 $5,718,892
Ward 8 5,284 1,987 $7,137,517 $6,165,552 $5,281,241 $6,850,817
Unknown 2,509 1,763 $19,409,620 $12,469,493 $5,964,157 $6,177,394
Total 21,136 9,213 $50,902,640 $39,395,552 $27,271,002 $31,270,358
Source: DOES; Office of Labor Market Research and Performance
Almost two-thirds (62%) of participants served through workforce development programs lived in the three Wards with the highest unemployment (Wards 5, 7 and 8).
10
No. of People
6,000
5,000
4,000
3,000
2,000
1,000
0
Total Served Employed
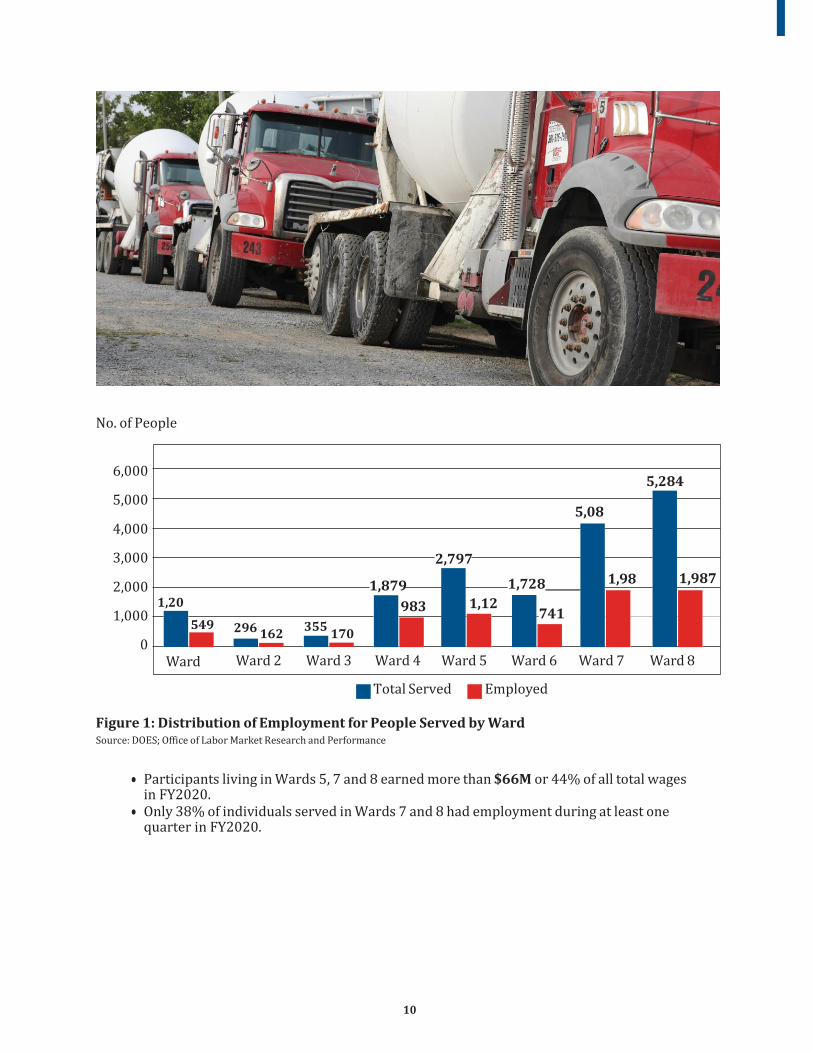
Figure 1: Distribution of Employment for People Served by Ward Source: DOES; Office of Labor Market Research and Performance
Participants living in Wards 5, 7 and 8 earned more than $66M or 44% of all total wages in FY2020.
Only 38% of individuals served in Wards 7 and 8 had employment during at least one quarter in FY2020.
5,284
5,081
2,797
1,989 1,20
7
1,879
983 1,128 549
1,728
741
Ward 1
296 162 355
170
Ward 2 Ward 3 Ward 4 Ward 5 Ward 6 Ward 7 Ward 8
1,987
11
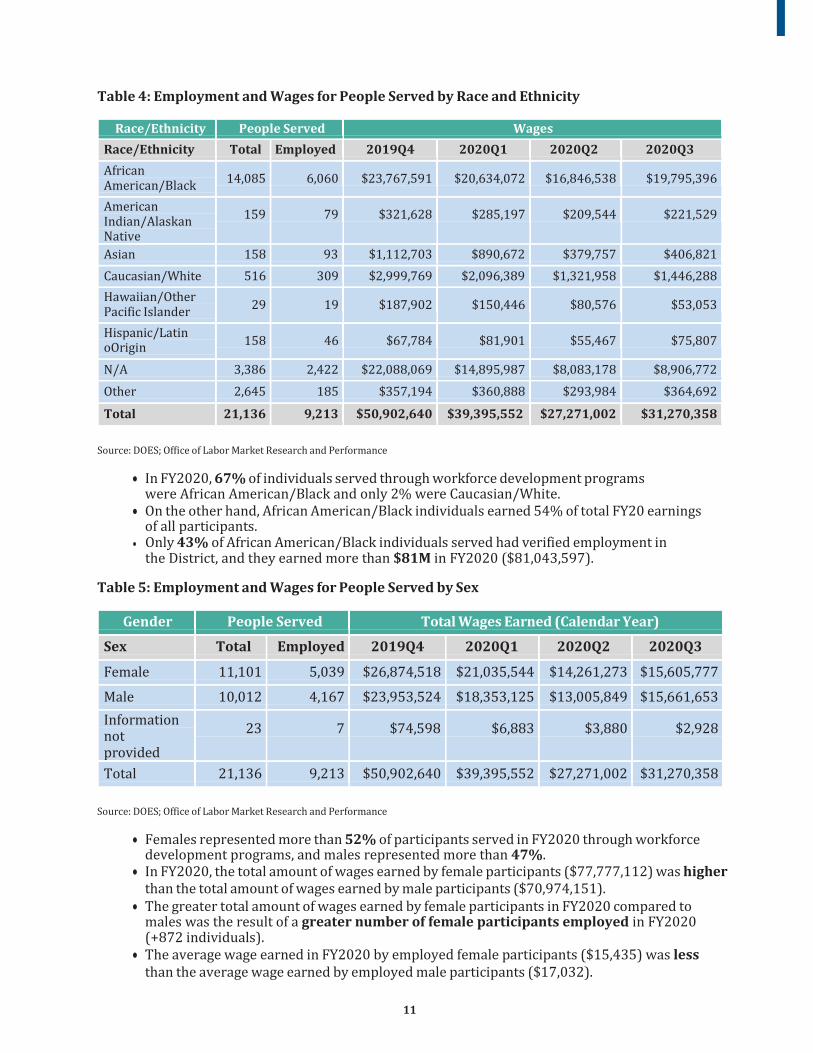
Table 4: Employment and Wages for People Served by Race and Ethnicity
Race/Ethnicity People Served Wages
Race/Ethnicity Total Employed 2019Q4 2020Q1 2020Q2 2020Q3
African American/ Black
14,085 6,060 $23,767,591 $20,634,072 $16,846,538 $19,795,396
American Indian/ Alaskan Native
159 79 $321,628 $285,197 $209,544 $221,529
Asian 158 93 $1,112,703 $890,672 $379,757 $406,821
Caucasian/White 516 309 $2,999,769 $2,096,389 $1,321,958 $1,446,288
Hawaiian/Other Pacific Islander
29 19 $187,902 $150,446 $80,576 $53,053
Hispanic/Latino Origin
158 46 $67,784 $81,901 $55,467 $75,807
N/A 3,386 2,422 $22,088,069 $14,895,987 $8,083,178 $8,906,772
Other 2,645 185 $357,194 $360,888 $293,984 $364,692
Total 21,136 9,213 $50,902,640 $39,395,552 $27,271,002 $31,270,358
Source: DOES; Office of Labor Market Research and Performance
In FY2020, 67% of individuals served through workforce development programs were African American/Black and only 2% were Caucasian/White.
On the other hand, African American/Black individuals earned 54% of total FY20 earnings of all participants.
Only 43% of African American/Black individuals served had verified employment in the District, and they earned more than $81M in FY2020 ($81,043,597).
Table 5: Employment and Wages for People Served by Sex
Gender People Served Total Wages Earned (Calendar Year)
Sex Total Employed 2019Q4 2020Q1 2020Q2 2020Q3
Female 11,101 5,039 $26,874,518 $21,035,544 $14,261,273 $15,605,777
Male 10,012 4,167 $23,953,524 $18,353,125 $13,005,849 $15,661,653
Information not provided
23 7 $74,598 $6,883 $3,880 $2,928
Total 21,136 9,213 $50,902,640 $39,395,552 $27,271,002 $31,270,358
Source: DOES; Office of Labor Market Research and Performance
Females represented more than 52% of participants served in FY2020 through workforce development programs, and males represented more than 47%.
In FY2020, the total amount of wages earned by female participants ($77,777,112) was higherthan the total amount of wages earned by male participants ($70,974,151).
The greater total amount of wages earned by female participants in FY2020 compared to males was the result of a greater number of female participants employed in FY2020 (+872 individuals).
The average wage earned in FY2020 by employed female participants ($15,435) was lessthan the average wage earned by employed male participants ($17,032).

12
Table 6: Employment and Wages for People Served by Educational Attainment
Education Level People Served Total Wages
Earned Education Level Total Employed 2019Q4 2020Q1 2020Q2 2020Q3
Associate Degree
4 1
$112
Bachelor's Degree & Higher
9
2
$28,814
$27,894
$30,894
$24,536
Certificate of Attendance/ Completion (Disabled Individuals)
1
College Student
112 54 $205,316 $186,484 $216,323 $221,685
College/ Technical/ Vocational School
2,466
1,576
$8,994,010
$7,348,216
$4,365,082
$4,721,492
High School- Unknown if Current Students, Drop Outs, or Graduates
3,706
1,012
$1,610,198
$1,655,279
$1,442,024
$1,877,414
High School Diploma/ Equivalent (GED)
5,388
3,126
$14,216,202
$11,664,136
$8,253,754
$8,907,228
Information Not Available
5,986
2,407
$21,505,463
$15,045,265
$10,870,669
$13,110,909
Less Than High School Diploma
3,464
1,035
$4,342,637
$3,468,278
$2,092,144
$2,407,094
Total 21,136 9,213 $50,902,640 $39,395,552 $27,271,002 $31,270,358
Source: DOES; Office of Labor Market Research and Performance
Fifty-nine percent of all participants served through workforce development had a High School Diploma or less.
In total, participants with a High School Diploma or less earned almost 42% of all earnings in FY2020.

13
6,000
5,000
4,000
3,000
2,000
1,000
0
High School Diploma/ Equivalent (GED)
College/Technical/ Vocational School
Total Served
Less Than High
School Diploma
Employed
High School -
Unknown if Current Students, Drop Outs,
or Graduates.
Figure 2: Distribution of Employment for People Served by Educational Attainment Source: DOES; Office of Labor Market Research and Performance
3,126
3,464 3,706
2,466
1,576 1,01
2 1,035
5,388

14
ECONOMIC SUPPLY AND DEMAND IN
THE DISTRICT 14
15
Employment Data
8%
7
6
5 2015 2016 2017 2018 2019 2020
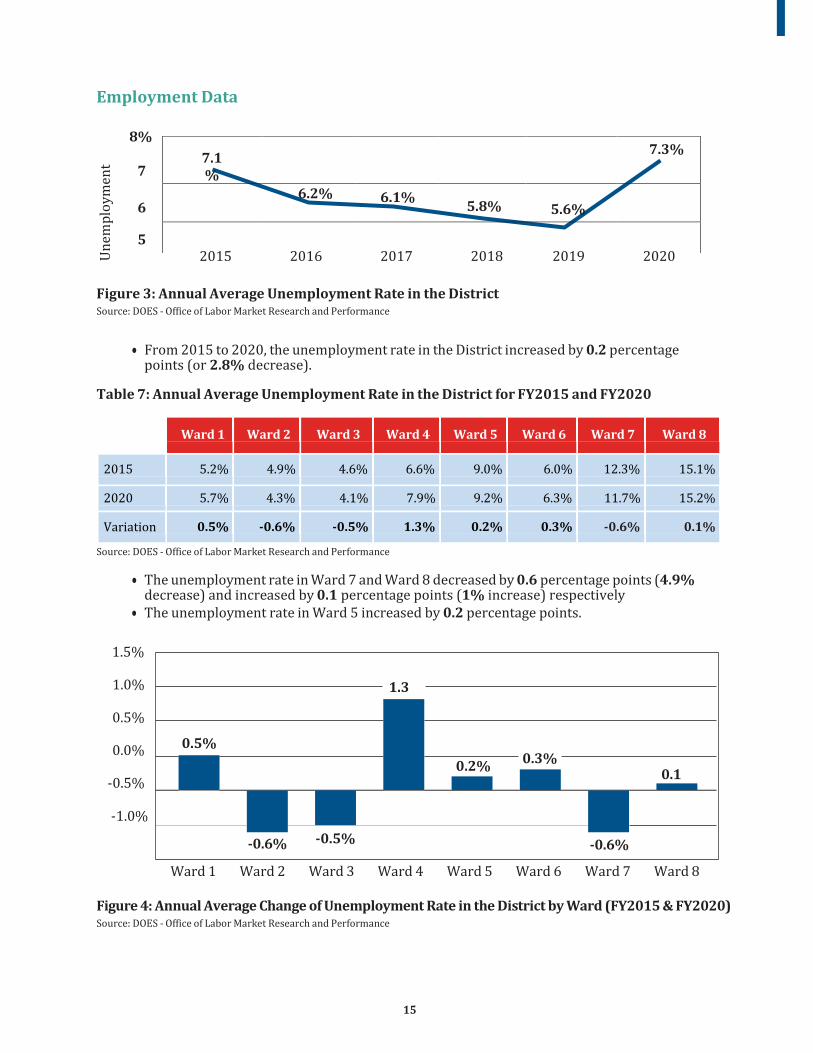
Figure 3: Annual Average Unemployment Rate in the District Source: DOES - Office of Labor Market Research and Performance
From 2015 to 2020, the unemployment rate in the District increased by 0.2 percentage points (or 2.8% decrease).
Table 7: Annual Average Unemployment Rate in the District for FY2015 and FY2020
Ward 1 Ward 2 Ward 3 Ward 4 Ward 5 Ward 6 Ward 7 Ward 8
2015 5.2% 4.9% 4.6% 6.6% 9.0% 6.0% 12.3% 15.1%
2020 5.7% 4.3% 4.1% 7.9% 9.2% 6.3% 11.7% 15.2%
Variation 0.5% -0.6% -0.5% 1.3% 0.2% 0.3% -0.6% 0.1%
Source: DOES - Office of Labor Market Research and Performance
The unemployment rate in Ward 7 and Ward 8 decreased by 0.6 percentage points (4.9% decrease) and increased by 0.1 percentage points (1% increase) respectively
The unemployment rate in Ward 5 increased by 0.2 percentage points.
1.5%
1.0%
0.5%
0.0%
-0.5%
-1.0%
Ward 1 Ward 2 Ward 3 Ward 4 Ward 5 Ward 6 Ward 7 Ward 8
Figure 4: Annual Average Change of Unemployment Rate in the District by Ward (FY2015 & FY2020) Source: DOES - Office of Labor Market Research and Performance
1.3%
0.5%
0.2% 0.3%
0.1%
-0.6% -0.5% -0.6%
Un
emp
loy
men
t R
ate
7.1%
7.3%
6.2% 6.1% 5.8%
5.6%

16
Figure 5: Map of FY2020 Average Unemployment Rate in the District by Ward
FY2020, the lowest unemployment rate in the District was in Ward 3 (4.1%), and the
highest was in Ward 8 (15.2%).
Table 8: Unemployment Rate in the District by Race and Ethnicity
Race Unemployment Rate
All Races 7.2%
Caucasian/White 3.4%
African American/Black 13.9%
Hispanic/Latino Origin 8.7%
Source: Bureau of Labor Statistics; Current Population Survey
In FY2020, the unemployment rate for African American/Black District residents (13.9%) was four times that of Caucasian/White residents (3.4%).
Ward 4: 7.9%
Ward 3:
4.1%
5.7%
Ward 5:
9.2% Ward 2:
4.3%
Ward 6:
6.3%
Ward 7: 11.7%
Ward 8: 15.2%

17
50
40
30
20
10
0
-10
-20
-30
2015 2020 Difference
Caucasian/White African American/Black Hispanic/Latino All Races
Figure 6: Median Duration of Unemployment in the District for 2015 and 2020 (In weeks) Source: DOES - Office of Labor Market Research and Performance
The weekly median duration of unemployment for African American/Black residents decreased by 22.3 weeks from FY2015 to FY2020.
Table 9: Total Number of Jobs and Private Sector Jobs in the District
Year Number of Jobs Number of Private Sector Jobs
2015 759,400 521,500
2020 771,500 531,100
Difference (2015-2020) 12,100 9,600
Source: DOES - Office of Labor Market Research and Performance
The share of private sector jobs in the District stayed constant at 69% from FY2015 to FY2020.
1,000,000
800,000
600,000
400,000
200,000
0
2015
2020
Total Number of Jobs in D.C. Total Private Sector Jobs in D.C.
Figure 9: Total Number of Jobs and Private Sector Jobs in the District Source: DOES - Office of Labor Market Research and Performance
759,400 771,500
521,500 531,100
42.5
28.5
19.5
20.2
12.8
11.1
11.9
14.5
-1.7 -7.6
-14 -
22.3
Th
ou
san
ds
of J
ob
s

18
From 2015 to 2020, the number of jobs in the District increased by 12,100 and the number of private sector jobs increased by 9,600.
Table 10: Top 5 Industries with the Highest Employment Increase in the District from 2015 to 2020
Industry FY2015 FY2020 Variation
Professional and Business Services 160,600 169,500 8,900
Other Services 70,900 77,400 6,600
Information 17,100 19,900 2,800
Government 238,000 240,400 2,400
Education and Health Services 123,900 125,000 1,100
Source: DOES - Office of Labor Market Research and Performance
Professional and Business Services, had the highest employment increase by industry with 8,900 since FY2015.
10,000
9,000
8,000
7,000
6,000
5,000
4,000
3,000
2,000
1,000
0
Professional
and Business Services
Other
Services
Information
Government
Educational and Health Services
Figure 7: Top 5 Sectors with the Highest Employment Increase in the District (FY2015 to FY2020) Source: DOES - Office of Labor Market Research and Performance
Educational and Health Services industry added 1,100 new jobs between FY2015 and FY2020.
Th
ou
san
ds
of J
ob
s
8,900
6,600
2,800
2,400
1,100

19
420,000
410,000
400,000
390,000
380,000
370,000
360,000
350,000
340,000
330,000
2015 2016
2017 2018 2019 2020
Labor Force Employed
Figure 8: Employed District Residents (2015-2020) Source: DOES - Office of Labor Market Research and Performance
From FY2015 to FY2020, the labor force increased by 5% which leads to a labor force participation rate of 69.9% in 2020.
From FY2015 to FY2020, total number of District residents that were employed increased by 16,000 or 4%.
Table 11: Private Sector by Establishments, Size Class
Quarterly Establishments
Size Class 2017Q1 2018Q1 2019Q1 2020Q1
All sizes 38,777 39,013 39,678 41,852
Fewer than 5 26,980 26,865 27,375 29,453
5 to 9 4,287 4,382 4,376 4,355
10 to 19 3,148 3,178 3,252 3,311
20 to 49 2,528 2,690 2,748 2,790
50 to 99 958 974 1,008 1,006
100 to 249 594 648 639 659
250 to 499 195 188 191 192
500 to 999 56 58 57 58
1000 or more 31 30 32 28
Source: Quarterly Census of Employment and Wages - Bureau of Labor Statistics
In 2020, almost 89% of all private sector businesses had less than 20 employees, and slightly more than 95% of them had less than 50 employees.
400,000 404,000
408,000 405,000
394,000
387,000 385,000
375,000 381,000
376,000
369,000
360,000

20
Table 12: Average Employment by Size Class for Private Sector
Average Employment
Size Class 2017Q1 2018Q1 2019Q1 2020Q1
All sizes 515,311 528,089 532,617 541,562
Fewer than 5 29,823 31,154 31,445 33,360
5 to 9 27,855 28,536 28,544 28,608
10 to 19 42,860 42,976 44,035 45,280
20 to 49 76,627 81,184 82,611 85,002
50 to 99 65,349 66,552 68,719 69,068
100 to 249 89,418 98,388 95,809 99,564
250 to 499 65,607 63,267 64,562 65,564
500 to 999 38,350 39,411 38,050 39,656
1000 or more 79,423 76,621 78,843 75,461
Source: Quarterly Census of Employment and Wages - Bureau of Labor Statistics
Despite this saturation, businesses with less than 20 employees represent less than 20% of the private sector workforce and wages paid in the District during the period.
Table 13: Total Quarterly Wages by Establishment and Size Class for Private Sector
Total Quarterly Wages
Size Class 2017Q1 2018Q1 2019Q1 2020Q1
All sizes $11,745,697,676 $12,263,484,733 $12,804,572,142 $13,598,921,331
Fewer than 5 $699,906,863 $740,884,688 $750,951,600 $811,871,603
5 to 9 $634,122,020 $660,414,652 $689,534,404 $718,123,636
10 to 19 $956,241,510 $1,006,350,541 $1,038,598,273 $1,085,554,797
20 to 49 $1,619,819,094 $1,802,877,614 $1,903,723,218 $2,054,128,137
50 to 99 $1,518,100,726 $1,504,480,905 $1,594,402,956 $1,609,987,834
100 to 249 $2,239,779,897 $2,365,625,722 $2,449,202,276 $2,681,563,295
250 to 499 $1,522,857,011 $1,569,222,999 $1,569,996,088 $1,653,270,826
500 to 999 $874,532,406 $939,777,304 $1,032,559,914 $1,250,071,375
1000 or more
$1,680,338,149 $1,673,850,308 $1,775,603,413 $1,734,349,828
Source: Quarterly Census of Employment and Wages - Bureau of Labor Statistics
Total wages paid by the private sector in first quarter of 2020 increased by more than $1.8B since the first quarter of 2017.
Small businesses with less than 20 employees paid more than $2.6B in wages in the first quarter of 2020.
Almost $13.6B of wages were paid by the private sector in the District in the first quarter of 2020.

21
Table 14: Top 5 Job Openings in the District (Average Monthly Unique Job Postings)
Occupation Avg. Monthly
Postings (Oct 2019 - Sep 2020)
Annual Median Wages
Software Developers and Software Quality Assurance Analysts and Testers
5,023 $117,130
Computer Occupations, All Other 3,491 $119,000
Registered Nurses 2,880 $91,470
Management Analysts 2,702 $103,420
Information Security Analysts 2,683 $118,740
Source: DOES - Office of Labor Market Research and Performance
The highest in-demand occupations are Software Developers and Software Quality Assurance Analysts and Testers, with an average monthly opening of 5,023 in FY2020.
Table 15: Top 5 Job Openings Requiring Less Than Bachelor’s Degree in D.C.
Occupation
Average Monthly Postings
(Oct 2019 - Sep 2020)
Annual Median Wages
Computer User Support Specialists 2,075 $68,240
Web Developers and Digital Interface Designers 1,451 $82,640
First-Line Supervisors of Office and Administrative Support Workers
1,296 $75,220
Executive Secretaries and Executive Administrative Assistants
965 $72,590
Secretaries and Administrative Assistants, Except Legal, Medical, and Executive
963 $49,240
Source: DOES - Office of Labor Market Research and Performance
The highest in-demand occupation requiring less than a Bachelor’s degree is Computer User Support Specialist with an average monthly opening of 2,075 in FY2020

22
Labor Market Demand in the District
Table 16: Top 25 Job Postings by Occupation
Occupation
Average Monthly Postings 2020
Education
Annual
Median Wage
Software Developers and Software Quality Assurance Analysts and Testers
5,023 Bachelor's degree $117,130
Computer Occupations, All Other 3,491 Bachelor's degree $119,000
Registered Nurses 2,880 Bachelor's degree $91,470
Management Analysts 2,702 Bachelor's degree $103,420
Information Security Analysts 2,683 Bachelor's degree $118,740
Network and Computer Systems Administrators 2,529 Bachelor's degree $99,070
Computer User Support Specialists 2,075 Some college, no degree
$68,240
Public Relations and Fundraising Managers 2,039 Bachelor's degree $169,600
Marketing Managers 1,951 Bachelor's degree $153,340
Computer Systems Analysts 1,936 Bachelor's degree $107,250
Personal Service Managers, All Other; Entertainment and Recreation Managers, Except Gambling; and Managers, All Other
1,851
Bachelor's degree
$141,330
Lawyers 1,720 Doctoral or profes- sional degree
$164,210
Accountants and Auditors 1,548 Bachelor's degree $97,420
Sales Managers 1,483 Bachelor's degree $130,440
Web Developers and Digital Interface Designers 1,451 Associate's degree $82,640
First-Line Supervisors of Office and Administrative Support Workers
1,296 High school diploma or equivalent
$75,220
Project Management Specialists and Business Operations Specialists, all Other
1,283 Bachelor's degree $96,970
Public Relations Specialists 1,218 Bachelor's degree $93,080
Computer and Information Systems Managers 1,127 Bachelor's degree $164,200
Financial Managers 1,115 Bachelor's degree $155,560
Market Research Analysts and Marketing Specialists 1,035 Bachelor's degree $75,400
Executive Secretaries and Executive Administrative Assistants
965 High school diploma or equivalent
$72,590
Secretaries and Administrative Assistants, Except Legal, Medical, and Executive
963 High school diploma or equivalent
$49,240
Customer Service Representatives 907 High school diploma or equivalent
$42,650
General and Operations Managers 835 Bachelor's degree $143,780
Source: DOES - Office of Labor Market Research and Performance; EMSI
23
There were more than 1.81 million total job postings in the District for Fiscal Year 2020, of which more than 464,317 were unique.
76% of the top 25 job postings in the District in Fiscal Year 2020 required a Bachelor’s degree and above.
Labor Market Supply in the District
Table 17: Unemployment Rate by Educational Attainment Level (Population 25 years and Over)
Educational Attainment Unemployment Rate
Less Than a High School Diploma 18.6
High School Graduates, No College 1 18.4
Some College or Associate Degree 12.5
Bachelor’s Degree and Higher 2 3.0 1 Includes persons with a high school diploma or equivalent 2 Includes person with bachelor’s, master’s, professional and doctoral
degrees Source: DOES - Office of Labor Market Research and Performance
Only 3% of District residents who have a Bachelor’s degree and higher are unemployed. Therefore, there is a large unemployment rate gap based on educational attainment level in the District labor market.

24
Labor Market Demand and Supply Ratio in the District
Table 18: 2019 Labor Market Supply and Demand
Description
Average Monthly
Job Postings
(Demand)
2020 Unemployment & DCNetworks
Candidates (Supply)
Ratio
(Demand / Supply)
Management Occupations 15,456 790 19.6
Business and Financial Operations Occupations
10,133 426 23.8
Computer and Mathematical Occupations 21,050 476 44.2
Architecture and Engineering Occupations 2,700 75 36
Life, Physical, and Social Science Occupations
1,242 123 10.1
Community and Social Service Occupations 1,538 195 7.9
Legal Occupations 2,445 124 19.7
Educational Instruction and Library Occupations
2,003 166 12.1
Arts, Design, Entertainment, Sports, and Media Occupations
3,331 280 11.9
Healthcare Practitioners and Technical Occupations
6,802 148 46
Healthcare Support Occupations 1,212 186 6.5
Protective Service Occupations 1,318 222 5.9
Food Preparation and Serving Related Occupations
2,052 322 6.4
Building and Grounds Cleaning and Maintenance Occupations
678 165 4.1
Personal Care and Service Occupations 908 107 8.5
Sales and Related Occupations 4,764 288 16.5
Office and Administrative Support Occupations
6,749 1,483 4.6
Construction and Extraction Occupations 853 222 3.8
Installation, Maintenance, and Repair Occupations
1,701 153 11.1
Production Occupations 802 70 11.5
Transportation and Material Moving Occupations
2,036 357 5.7
Military-only occupations 18 6 3
Unclassified Occupation 6,565 377 17.4
Source: DOES - Office of Labor Market Research and Performance
25
Healthcare Practitioners and Technical Occupations have the highest ratio of demand and supply (i.e. has more jobs in demand than candidates available to fill those jobs in the District). Computer and Mathematical Occupations, which include IT related occupations, have the second highest ratio of demand and supply.
Military-only Occupations have the lowest ratio of demand and supply (i.e. there are more candidates than jobs available). Construction and Extraction Occupations have the second lowest ratio of demand and supply.
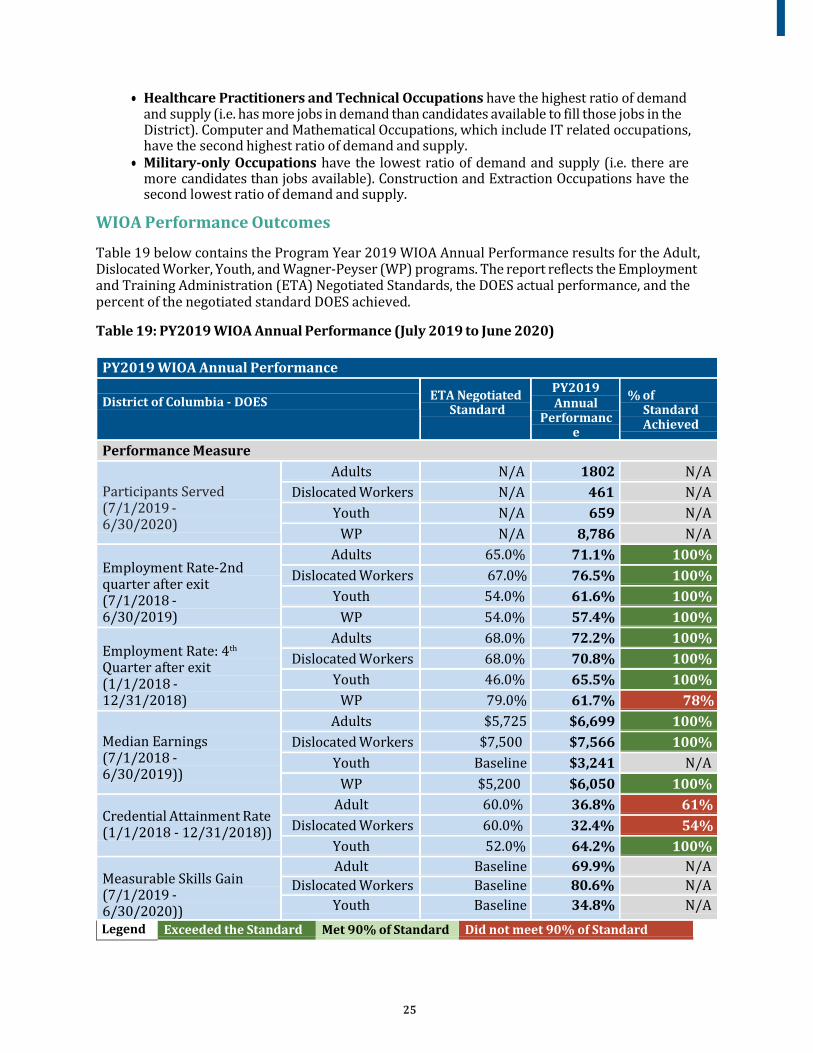
WIOA Performance Outcomes
Table 19 below contains the Program Year 2019 WIOA Annual Performance results for the Adult, Dislocated Worker, Youth, and Wagner-Peyser (WP) programs. The report reflects the Employment and Training Administration (ETA) Negotiated Standards, the DOES actual performance, and the percent of the negotiated standard DOES achieved.
Table 19: PY2019 WIOA Annual Performance (July 2019 to June 2020)
PY2019 WIOA Annual Performance District of Columbia - DOES
ETA Negotiated Standard
PY2019 Annual
Performance
% of Standard Achieved
Performance Measure
Participants Served (7/1/2019 - 6/30/2020)
Adults N/A 1802 N/A
Dislocated Workers N/A 461 N/A
Youth N/A 659 N/A
WP N/A 8,786 N/A
Employment Rate-2nd quarter after exit (7/1/2018 - 6/30/2019)
Adults 65.0% 71.1% 100%
Dislocated Workers 67.0% 76.5% 100%
Youth 54.0% 61.6% 100%
WP 54.0% 57.4% 100%
Employment Rate: 4th
Quarter after exit (1/1/2018 - 12/31/2018)
Adults 68.0% 72.2% 100%
Dislocated Workers 68.0% 70.8% 100%
Youth 46.0% 65.5% 100%
WP 79.0% 61.7% 78%
Median Earnings (7/1/2018 - 6/30/2019))
Adults $5,725 $6,699 100%
Dislocated Workers $7,500 $7,566 100%
Youth Baseline $3,241 N/A
WP $5,200 $6,050 100%
Credential Attainment Rate (1/1/2018 - 12/31/2018))
Adult 60.0% 36.8% 61%
Dislocated Workers 60.0% 32.4% 54%
Youth 52.0% 64.2% 100%
Measurable Skills Gain (7/1/2019 - 6/30/2020))
Adult Baseline 69.9% N/A
Dislocated Workers Baseline 80.6% N/A
Youth Baseline 34.8% N/A
Legend Exceeded the Standard Met 90% of Standard Did not meet 90% of Standard

LOOKING FORWARD
26
CONCLUSION
In March 2020, when the District of Columbia suffered its first confirmed cases of coronavirus, the Bowser Administration acted quickly, declaring a state of emergency and public health emergency along with issuing several orders to limit the spread of the virus. The administration’s quick actions saved the lives of many District residents. Like every other state in the nation, the District had to adapt to a new way of serving customers and conducting business.
The Department of Employment Services’ professionals transitioned to a remote-access environment, with staff teleworking and using technology to assist clients and conduct work activities. New trainings were developed to assist customers and staff with the new virtual environment because in-person services were replaced with virtual services. Whether assisting customers in person or virtually, the DOES has continued to make employment services a top priority.
Despite the challenges FY2020 provided, the DOES commitment to District residents was demonstrated by several of the agency’s accomplishments. The DOES launched a successful Paid Family Leave Program; The MBSYEP was 100% virtual, for the first time ever, and served more than 9,000 participants; Unemployment claims increased over 300%, from the previous year, resulting in close to 2 billion dollars in unemployment benefits distributed since March 2020, and the Reemployment Services and Eligibility Assessment (RESEA) program went completely virtual in May 2020. The DOES provided more than 63,000 services to over 21,000 residents, many of whom came through the doors of an American Job Center (AJC) and were connected to job training programs or employment opportunities. DOES’ customers have generated almost $150 million in wages during FY2020 and nearly $600 million over the last three fiscal years. Since Mayor Bowser has taken office in January 2015, the unemployment rate in the District had dropped each fiscal year until FY2020, with FY2019 being the lowest at 5.6%. The FY2020 unemployment rate of 7.3% is .2 percentage points higher than the January 2015 rate of 7.1%. Despite the slight increase in the FY2015 – FY2020 unemployment rate, there were three Wards that showed decreases over that period, Wards 2, 3 and 7. In Ward 2 the unemployment rate decreased by .6%, in Ward 3 by .5%, and by .6% in Ward 7. The total number of District residents that are employed has increased by 16,000, while the total number of jobs in the District increased by over 12,000 from 2015 to 2020.
The District will certainly face some serious challenges in recovering from the economic impact of the pandemic. Many businesses closed and many workers left the labor force or were unemployed for long periods in 2020. With the strong leadership and vision of DOES Director Dr. Morris- Hughes, DOES embraces the challenge of connecting residents to sustainable high paying careers. The economic recovery of the District will need to be a collaborative effort among all community partners. As the Director stated in her Vision Forward Plan, “Leveraging the strengths of our workforce partners, which include community-based organizations, educational institutions, training providers, government agencies and other stakeholders, is the key to the success of our plan.” The strategic partnerships that the Director mentioned will ensure that in FY2021 the District is agile and innovative in its response to unemployment.
27

DOES PROGRAMS AND SUCCESS STORIES
28

29
Customer Navigation Center (CNC)
The Department of Employment Services Customer Navigation Center (CNC) is a centralized communication facility that is used for the purpose of receiving and/or transmitting a large volume of customer requests by telephone, e-mail correspondence, and web chat services.
For More Information [email protected], [email protected], and [email protected]
The Office of Youth Programs (OYP)
The Office of Youth Programs (OYP) develops and administers workforce development programs for District youth ages 14 to 24. OYP provides occupational skills training, work experience, academic enrichment and life skills training to facilitate the development of work habits and skills that are essential for success in the workplace. The following programs are currently being offered through the Office of Youth Programs.
• The Marion S. Barry Summer Youth Employment Program (MBSYEP)
• MBSYEP - Opportunity Scholarship (MOS)
• The Marion Barry Youth Leadership Institute (MBYLI)
• The Youth Innovations Grants (YIG):
• High School Internship Program (HSIP):
• The Pathways for Young Adults Program (PYAP)
• Youth Earn & Learn Program (YEALP):
For More Information [email protected]
The Marion S. Barry Summer Youth Employment Program (MBSYEP)
The Marion S. Barry Summer Youth Employment Program (MBSYEP) provides District youth ages 14 to 24 with enriching and constructive summer work experiences through subsidized placements in the private and government sectors.
Employers in the Washington, D.C. metropolitan area make this annual program possible by volunteering to serve as Host Employers and providing structured job opportunities for youth during the summer.
For More Information [email protected]
MBSYEP - Mayor’s Opportunity Scholarship (MOS)
The Executive Office of the Mayor has partnered with the Department of Employment Services, Office of Youth Programs to pilot the Mayor’s Opportunity Scholarship. Through the Mayor’s Opportunity Scholarship, DOES seeks to support the post-secondary endeavors of participants in the Marion S. Barry Summer Youth Employment Program (MBSYEP).
For More Information [email protected]

30
Jobs for Veterans State Grants (JVSG):
The Jobs for Veterans State Grants (JVSG) program provides federal funding, through a formula grant, to 54 State Workforce Agencies (SWAs) to hire dedicated staff to provide individualized career and training-related services to veterans and eligible persons with significant barriers to employment and to assist employers fill their workforce needs with job-seeking veterans.
For More information [email protected]
Reemployment Services and Eligibility Assessment (RESEA):
The Reemployment Services and Eligibility Assessment (RESEA) program addresses the individual reemployment needs of individuals receiving unemployment insurance compensation and works to detect and prevent improper unemployment insurance (UI) payments. RESEA participants are active job seekers and UCX (ex-service members) who are receiving UI benefits. Program services include enrollment in the states’ Job Bank, one-on-one coaching for developing an individual reemployment plan that includes work search activities and assessment for UI benefit eligibility.
For More information [email protected]
Marion Barry Youth Leadership Institute (MBYLI):
The Marion Barry Youth Leadership Institute was founded in 1979 as a year-round program to train young Washingtonians in the concepts of leadership and self-development. The program’s training model emphasizes practical, hands-on experience and a holistic approach to developing leaders for the 21st century.
For More Information [email protected]
The Youth Innovations Grants (YIG):
The Youth Innovations Grants program provides District youth ages 14 to 24 with enriching, non- traditional, fast track work experiences through subsidized placements which explore post-secondary education preparation and entrepreneurial training options.
For More Information [email protected]
High School Internship Program (HSIP):
The High School Internship Program serves high school seniors in the District who are between the ages of 14 and 21. The program provides participants with structured internships and individualized assistance to successfully obtain a high school diploma and secure full-time, unsubsidized employment, or to enroll in a post-secondary education or an advanced training program upon completion of the program.
For More Information [email protected]

31
The Pathways for Young Adults Program (PYAP):
The Pathways for Young Adults Program is designed to assist out-of-school and out-of-work District residents ages 18 to 24 by combining occupational training, life skills development and work readiness instructions to connect them back to the world of work successfully. The three areas of occupational training include: Allied Health, Administrative Services and Basic IT/Admin.
For More Information [email protected]
Youth Earn & Learn Program (YEALP):
The Youth Earn & Learn Program provides District youth, ages 16 to 24, who are not enrolled in school, unemployed, and facing significant barriers support towards obtaining their secondary school credential or GED and employment.
For More Information [email protected]
Office of Unemployment Insurance (UI)
The Office of Unemployment Compensation (OUC), also referred to as Unemployment Insurance (UI) Office, serves claimants and employers of more than 30,000 businesses in and around the District of Columbia.
For More Information [email protected]
American Job Center (AJC):
The American Job Center offers job-seekers, students, businesses and career professionals access to a comprehensive array of employment-related services and tools in one convenient location. Through the American Job Center, residents can utilize resources such as career counseling, career planning, resume assistance, direct job placement, classroom and on-the-job-training, information about local and national labor markets, unemployment compensation and much more. The Department of Employment Services, supported with resources from the District government and the US Department of Labor, operates centers that are strategically located and accessible throughout the District.
For More Information [email protected]
Office of Apprenticeship, Information and Training (OAIT):
The Office of Apprenticeship, Information and Training is responsible for administering the District’s Apprenticeship program and the enforcement of DC Law 2-156 and the federal Davis-Bacon and Related Acts (DBRA) on District-funded projects. These services include recruiting and enrolling apprentices; registering employers as apprenticeship sponsors; and providing oversight, technical assistance, and monitoring to ensure compliance with federal and state laws. Apprenticeship is a comprehensive training program that combines on-the-job learning experiences with supplemental job-related classroom instruction.
For More Information [email protected]
32
Office of Talent and Client Services (TCS)
The Office of Talent and Client Services offers businesses in the Washington, D.C. region a variety of complimentary services to help meet the workforce development needs of the employer. A team of professionals deliver employment and training services that grow employer business and talent acquisition; candidate pre-screening; targeted hiring events; and access to DCNetworks through a virtual job board, which serves as a virtual recruiting tool where businesses can post job descriptions, view resumes, and candidate qualifications.
For More Information [email protected]
Workforce Opportunity Tax Credit (WOTC)
The Workforce Opportunity Tax Credit is a federally-funded program that reduces the federal tax liability of private-for-profit employers hiring new employees from selected target groups who have consistently had difficulty obtaining or maintaining employment. Tax credit amounts vary and are based on a percentage of wages paid to, and hours worked by, properly certified employees.
For More Information [email protected]
Workforce on Wheels (WOW)
Workforce on Wheels is the cutting-edge mobile outreach team of the Department of Employment Services. The Workforce on Wheels team is dispatched to various communities across the District to address the needs of District youth and residents. Commissioned to serve constituents in under- served communities, the Workforce on Wheels team brings the resources and services of the American Job Center to neighborhoods where access is often limited.
For More Information [email protected]
Rapid Response
Rapid Response services are performed by state and local workforce development agencies in partnership with local American Job Centers. The Rapid Response team responds to layoffs and plant closings by quickly coordinating services and providing immediate aid to companies and their affected workers.
For More Information [email protected]
Office of Paid Family Leave (OPFL)
The mission of the Office of Paid Family Leave is to plan, develop, and administer a paid leave program for the District of Columbia under the provisions of the Universal Paid Leave Amendment Act of 2016. The Paid Leave Act provides up to eight weeks of parental leave to bond with a new child, six weeks of family leave to care for an ill family member with a serious health condition, and two weeks of medical leave to care for one’s own serious health condition. On July 1, 2019, the

33
District began the collection of taxes from employers and on July 1, 2020, the District began administering paid leave benefits.
For inquiries regarding the Paid Family Leave program, please contact the Office of Paid Family Leave.
For More Information [email protected]
Project Empowerment
Project Empowerment provides job readiness and life skills training, work experience, job search assistance and a variety of supportive services to District residents who face multiple barriers to employment.
For More Information [email protected]
DC Career Connections
DC Career Connections provides young adults ages 20 to 24 the opportunity to earn as they learn while providing the support they need to be empowered and connected to rewarding career opportunities.
For More Information [email protected]
Senior Community Service Employment Program (SCSEP)
The Senior Community Service Employment Program is a program to help older Americans get back into or remain active in the workforce. It is a part-time community service and work-based training program where participants gain career skills through on-the-job training in community-based organizations in identified growth industries.
For More Information [email protected]
Learn, Earn, Advance, Prosper (L.E.A.P.)
L.E.A.P. is a network of interconnected District partners working together to refer, train, support, and employ residents in District jobs. Through extensive coordination of efforts, District government agencies, educational organizations, community partners, and employers leverage their resources to provide L.E.A.P. participants with paid on-the job work experience at District agencies for up to one year. Individuals in the program earn wages, accumulate work experience, and obtain stackable credentials toward an obtainable career pathway.
For More Information [email protected]

34
Administrative Hearings Division, Office of Hearings and Adjudication
The Administrative Hearings Division conducts formal administrative hearings under the D.C. Workers’ Compensation Act of 1979, as amended, D.C. Code §32-1501 et seq.
For More Information [email protected]
Office of Wage-Hour (OWH)
The Office of Wage-Hour conducts compliance audits and may recover back wages for employees who have not been paid under D.C. wage laws, either administratively or through court action. Wage- Hour Compliance involves enforcing the wage laws of the District of Columbia.
For More Information [email protected]
Office of Occupational Safety and Health (OSH)
The Office of Occupational Safety and Health conducts worksite visits within the District of Columbia to assure compliance with Federal Occupational Safety and Health Administration (OSHA) Standards. The visits are at the request of the prime contractor or small business representative that wants a voluntary review of their worksite, review their written programs or request training on a given safety and/or health subject.
For More Information [email protected]
Office of Workers’ Compensation (OWC)
The Office of Workers’ Compensation provides services to employees of the private sector who sustain work-related injuries and/or suffer job-related illnesses/ diseases during the performance of their duty.
For More Information [email protected]
Compensation Review Board (CRB)
The Compensation Review Board provides administrative appellate review of private-sector workers’ compensation claims decided by the Department of Employment Services’ Administrative Hearings Division and the Office of Workers’ Compensation, including appeals from Special Fund decisions and public-sector disability claims decided by the District of Columbia Office of Administrative Hearings. The Compensation Review Board also makes the initial agency decision upon receiving a case remand from the D.C. Court of Appeals.
For More Information [email protected]

35
Labor Market Research and Performance
The Labor Market Research and Performance Unit provides businesses with relevant labor market, economic, and demographic data, such as employment and wages, unemployment rates, and population trends to help businesses gain a more competitive advantage in the labor market.
For More Information [email protected]
Office of First Source Compliance
Workforce Intermediary Establishment and Reform of the First Source Amendment Act of 2011, effective February 24, 2012 (D.C. Law 19-84).
The First Source Law requires all beneficiaries of contractual agreements totaling $300,000 or more to enter into a First Source Employment Agreement with the Department of Employment Services.
For more than 30 years, First Source has been one of the driving forces in the District’s strategy to reduce unemployment by ensuring that D.C. residents receive priority consideration for new jobs created by local government-assisted projects or contracts.
For More Information [email protected]
On-the-Job Training Program
On-the-Job training is a program in which employers have an opportunity to train, mentor and hire candidates who are not fully proficient in a particular skillset or job function. Through the On-the-Job Training model, candidates receive the hands-on training necessary to increase their skills, knowledge, and capacity to perform the designated job function. OJT ensures unemployed and underemployed jobseekers have a chance to enter/re-enter the workforce through an earn while you learn model. This streamlined approach allows employers to be reimbursed up to 75 percent of an established wage rate in exchange for the training provided to participating candidates for up to six months
For More Information [email protected]
District of Columbia Infrastructure Academy (DCIA)
The District of Columbia Infrastructure Academy (DCIA) is a key initiative of Mayor Muriel Bowser’s Administration, led by the Department of Employment Services (DOES). Infrastructure is one of the fastest growing industries in the country. DOES opened the academy as a way to meet the need for skilled infrastructure professionals in the District of Columbia. Opened in March of 2018, DCIA coordinates, trains, screens, and recruits residents to fulfill the workforce needs of the infrastructure industry with leading employers in these high-demand fields; energy and utilities, transportation, and information technology. DCIA is located at 2330 Pomeroy Road, Southeast in the Anacostia neighborhood in Ward 8.
For More Information [email protected]

36
SUCCESS STORIES
American Job Centers
A customer was working as a cab driver and enjoyed driving but deep down he knew he wanted to increase his income. He had heard that the WIOA program could pay for CDL training and he took off from work to go to the American Job Center to find out more information. He was able to be enrolled in WIOA and was sent to CDL training at 1st CDL of NOVA. After a delay due to the pandemic, he was able to obtain his CDL Class A in September 2020. Since that time, he has started his own transportation company. The customer shared the following message about his experience, “I really appreciate you! If not for you I should not complete my training and have job now. You assisted me on your lunch break by understanding my desperation to support my family. If I didn’t have this job I might be homeless by now with my family. I will be creating 4 job opportunities by end of March.”
American Job Centers
A customer visited the American Job Center during the month of July 2019. The customer expressed an interest in receiving career services to include occupational skills training in a CompTIA Security+ training program offered through the Vets Group. The WDS supported the customer’s goals by conducting a career assessment, individual training plan and an Objective Assessment Summary to determine suitability for training. As a result of the program assessment, the customer was enrolled into training, and successfully obtained a certification in CompTIA Security+. The customer was extremely determined and committed to securing a full-time position to support his family. The WDS supported the customer’s goals with consistent resources, job leads and employer referrals. As a result of the customer’s efforts and dedication, the customer landed a position as a Lead Investigator @ $76,126 annually for the Department of Health. The customer’s effective date of hire was on August 31, 2020. Commentary/email by the customer-
37
“Dear staff, what an amazing year I have had working with you on finding employment. From the day we first me, I was confident that we would succeed. I was excited when I enrolled in the CompTIA Security+ program at the VETS Academy. After I successfully acquired my certification, I was ready to take on the world. Then the coronavirus hit, and my job opportunities dried up like autumn leaves. We communicated throughout the shutdown. I remained hopeful and optimistic, and finally, you sent that fateful email that included an opportunity to help keep DC healthy as a Lead Investigator on the Contact Tracing Force. I dreamt of the day I could say goodbye to my previous job, and I had a goal to do so earlier this year. I kept the faith even though it was waning. and it has paid off. You are immensely professional, compassionate, empathetic, and affable. Without you, I would never have had this opportunity. I am truly thankful. Continue doing what you do best. Be safe”.
RESEA/AJC
A customer was a Dislocated Worker, referred by RESEA who was enrolled in WIOA on June 17, 2019. The customer worked with WDS staff to create an employment plan to obtain full time employment as an Economist. The customer successfully completed PMP training 9/13/19. The customer was hired by Customs & Border Protection, U.S. Department of Homeland Security as a full-time Economist earning $52.00 per hour. The customer began work on Dec 1, 2019.
DC Career Connections (DCCC)
A customer participated in Run Hope Work’s Apprenticeship program from August 2019- December 2019. He received certifications in Flooring, Drywall and Glazing. In February 2020, the customer was offered a full-time position at Ruppert Landscaping as a Crew Member earning $15.25 per hour.
Jobs for Veterans State Grant (JVSG)
A customer was present for the biweekly orientation at the Veteran Center that is co-located with the Department of Veteran Affairs Vocational Rehabilitation and Employment Program (VR&E). As the Intensive Service Coordinator for the DC Area, staff provided a detailed overview of services available at the American Job Centers and an introduction to Labor Market Information (LMI).
The staff met one on one with the customer immediately after orientation on February 18, 2020 and discussed ways to improve his employability and provide detailed feedback on the Federal Hiring Process and the Federal Resume. The customer’s resume and areas of interest were also provided to Local Veterans’ Employment Representative (LVER) for further assistance with connecting with employers. He applied recommendations made to his resume and started to increase the number of applications submitted for federal employment.
The customer was hired and began work on November 9, 2020 with Centers for Disease Control as an IT Specialist GS 13 with a salary of $125k per year. He was very appreciative of the advice, feedback (especially federal resumes), and positivity provided by the DOES Veteran Staff.
Email from the customer below:
Good morning staff
How are you? Thank you for your email. I wanted to let you know that I am now employed. So for now, I’m off the market.

38
I appreciate all the help that you and Mike have provided me.
Thank you! I am working with CDC in Atlanta. My job title is “IT Specialist”GS-13. Current salary is $125k/year. I started with CDC November 9th, 2020.
Talent And Client Services (TCS)
DC Department of Employment Services’ Office of Talent and Client Services has facilitated more than 25 virtual recruitment events during the global coronavirus pandemic. Our team has worked in close collaboration with other District agencies, employers, and community stakeholders to ensure the continuity of employment opportunities for District residents during this unprecedented time. These efforts have resulted in over 150 DC residents being connected to employment.
On-the-Job Training:
The past 12 months have been challenging for everyone during this global pandemic. The workforce was hit hard, and some OJT employers had to lay off employees. Thankfully, some candidates were not only able to gain employment during the pandemic but were also able to be retained. One employer had tried to hire through the OJT program well over a year earlier but due to unforeseen issues could not participate until recently. In December of 2019, JLAN Solutions hired their first OJT participant only to realize that she would soon have to be out for maternity leave. By providing clear OJT expectations for long-term opportunities, the employer created a plan of action to temporarily backfill her position and shift the replacement into another role once the mother-to-be returned. I worked with the employer to ensure that there would not be a gap in service by having the replacement start as soon as the new mom went out. Prior to her returning to work we developed a training plan modification to adjust for her time away. Around that same time, during the Summer of 2020, the employer expressed an interest in hiring an OJT for the finance department. They were willing to take someone with little skill and train them up to expectation. All three customers have completed their training period, mastered their training plan objective and are all retained with JLAN Solutions.

39
DC Infrastructure Academy
Pepco
The Pepco program has successfully graduated and employed 40 participants between FY19 and FY20 where the participants gained employment either with Pepco or its sub-contractors. This is a great feat as the Pepco program is a rigorous program where participants must be District residents 21 years of age or older. Participants interested in the Pepco program must have a high school diploma or a GED and pass a pre-employment check that includes: a criminal background check; driving record history; a drug screening; an initial interview; and a physical abilities test, which is new to the program. The new, physical abilities test requires participants to carry a 50 pound kettle ball for 20 feet, and participants must be able to both lower and raise a 30 pound kettle ball before entering the program.
Washington Gas
The Washington Gas program is DCIA’s newest program meeting the needs of District residents. The Washington Gas program offers District residents the ability to create a pathway to the middle class by training for positions in the utilities sector. The training program was scheduled to launch on March 16th, a week after DCIA operations were suspended due to the COVID pandemic. During this time, the leadership at Washington Gas and DCIA were faced with many complex challenges that involved keeping the trainees engaged, standing up a labor-intensive program virtually, providing technological access for remote learning and ensuring that each graduate had an opportunity to interview with an employer upon program completion. A total of thirteen District residents enrolled in the program. The cohort graduated all thirteen participants with eight of the participants gaining employment, a 62% success rate for a program that was faced with the challenge of a pandemic. The Office of Talent and Client Services worked closely with Washington Gas to engage twenty-two employer partners to interview program participants for potential jobs. Following interviews, 90% percent of the cohort who engaged in hiring events received a job offer. One participant received six jobs offers!

DEPARTMENT OF EMPLOYMENT SERVICES
DEPARTMENT OF EMPLOYMENT SERVICES
4058 Minnesota Avenue, NE | Washington, D.C. 20019 Phone: 202-724-7000 | Fax: 202-673-6993 | TTY: 202-698-4817
Website: does.dc.gov | Email: [email protected]