department of aeronautical engineering · 0o suniversity of minnesota institute of technology c...
TRANSCRIPT

0O
SUNIVERSITY OF MINNESOTAINSTITUTE OF TECHNOLOGY
C
DEPARTMENT OF AERONAUTICAL ENGINEERING
Progress Report No 20THEORETICAL PARACHUTE INVESTIGATIONS
Aeronautical Systems Division Contract No.AF 33(616)-8310; Project No 6065; Task No 60252
1 December 1961 to 28 February 1962
Department of Aeronautics and Engineering
Mechanics, No 50077
University of Minnesota
MINNEAPOLIS 14, MINNSO]tA

CLEARINGHOUSE FOR FEDERAL SCIL1IFIC ANn. iFb,-INCAL INFORMATION, CFSTI
DOCUMENT MANAGEMENT BF ": -10.11
LIMITATION!; IN REPRODUCTION QUALITY
Accession # 4! O / Z
1. 1e regret that legibility o, & .' document is in part,iisatisfactory. ReproductiL I iias been made from bestavailable copy.
0 2. A portion of the origi'1 Jocument contains fine detailwhich may ,make readin3 cf photocopy difficult.
0 3. The original documint contains color, but distributioncopies ara available in black-and-white reproduction only.
0 4. Pie initial distribution copies contain color whichwill be shown in black-and-white when it is necessary tornprint.
5. Limited supply on hand; when exhausted, document will
oe available in MWcrofiche only.
0 6. Limited supply on hand; when exhausted document will not
be available.
7. Document is avai],ihle in Microfiche only.
08. Document available on loan from CPSTI (TT documents only).
09.
Processors
NBS 9/64
(
Progress Report No 20
THEORETICAL PARACHUTE INVESTIGATINSAeronautical Systems Division Contract No.
N•. AF 33(616)-8310; Project No 6065; Task No 60252
1 December 1961 to 28 February 1962
Department of Aeronautics and Engineering
Mechanics, No 5007.
University of Minnesota
Dr. H. G. Heinrich, Professor, Department of Aeronautics andEngineering Mechanics
Dr. T. Riabokin, Research Associate, Department of AeronauticsPrf.and Engineering MechanicsProf. S. K. Ibrahim, Research Fellow, Department of Aeronautics
and Engineering MechanicsMr. E. L. Haak, Senior Engineer, Department of Aeronautics and-r.Engineering Mechanics
Mr. R. J. Niccum, Senior Engineer, Department of Aeronauticsand Engineering Mechanics D
and graduate and undergraduate students oAeronautics and Engineering Mechanics (se
SEP 1 1964
DDC.IRA E
TABLE OF CON'TENTS
Projeat No Pase
Investigation of Wake Effects on the Behaviorof Parachutes and Other Retardation DevicesBehind Large Bodies at Subsonic and SupersonicS p e e d s . * a 0 . a. . 0 . . . . . .# a 4. a .1 . . . 2
a) Width of Wake Behind Basic Bodies ofRevolution in Subsonic Flow
b) Analytical Analysis of Turbulent-Vehm-inSupersonic Flow
Investigation of Basic Stability Parameters ofConventional Parachutes . . . . . . . . . . . . . . 20
a) Experimental Determination of the ApparentMomen of Inertia of Parachute CartWShapes
b) Wind Tunnel Investigation of Parachute Models
7 iheoretical Study of Supersonic ParachutePhenomena . . . . .* . . . . . .* . . . . . . . . . . 29
a) SupersonicWIrA Tunnel Studies ofFlexible Spiked Parachute
b) Pressure Distribution Studies on Spike4Parachute in Supersonic Flow
c) Supersonic Wind Tunnel Studies of SpikedRibbon Parachutea
.Theoretical Analysis of the Dynamics of theOpening ?arachute . . . . . . . . .. .. .. . .. 42
a) Analytical Investigation of Parachute
Inflation Time and Opening Force
b) Size-force History of an Inflating Parachute
c) Drag Studies on Reefed Parachutes
9 Statistical Analysis of gxtraction Time,Deployment Time, Opening Time, and DragCoefficient for Aerial Delivery Parachutesand Systems . . . . . . . . . . . . . . . . . . . . 43
i
S1 Study of *asic Principles of New Parachutes
and Retardation Devices . ...... .44
12 •'-GidingAerodynamic Decelerator . . . . . . . . . . 45Effective Porosity Studies ......... .. . 54
a) -Parachute Cloths,
b) -- Ribbon Grid Configurations
1J4 Study of Ilow tatterns of Aro ynamicDecelerators by Means of the.&rfacei*ave Analogy .. . . . . . . . . . . . . . . . . . . 62
16 Stress Analysis of the T-lOT-roop-ParachuteA .... 71
2ii
=_-
THEORETICAL PARACHUTE INVESTIGATIONS
Progress Report No 20
INTRODUCTION
1.0 This is the twentieth quarterly report covering the
time from 1 December 1961 to 28 February 1962 on the study
program on basic information of Aerodynamic Deceleration.
1.1 As in preceding reporting periods, work during this
reporting period has been pursued in accordance with the
technical program, and is described in the following sections
of this report.
1

Project No 1
2.0 Investigation of Wake Zffects on the Behavior of
Parachutes and Other Retardation Devices Behind
LAkrze Bodies at Subsonic and SuEersonic SEeeds.
2.1 Width of Wake Behind Basic Bodies of Revolution in
Subsonic Flow
2.1.1 Tntroduntion
In Ref 1# the velocity and pressure distribution in the
wake and the width of the wake behind a fairly streamlined body
of revolution were investigated. It was shown that the agreement
between analytical predictions and measured results varied with
the location of the investigated area, which led to the conclusion
that the)k value should be considered as a function of the dis-
tance. A further extension of these studies was the investigation
of the wakes of bodies with widely varying drag coefficients,
with the general objective to establish the relationship between
A and the related drag coefficients as well as the variation of ak
with the downstream distance.
The present effort In this field is the establishment
of the width of the wake as a function of X/D using the experi-
mental data presented in Progress Report No 17. It wan postulated
that this functional dependence of wake width could be presented
in the form
bIt= k
where b w radial width of wake
R - radius of primary body D/2
n. k - constants
X - distance behind body.
2

Equation (1.1) has the form
log y - log k + n log x.
which plots as a straight line on log-log coordinate paper, with
the slope n and intercept k easily determined.
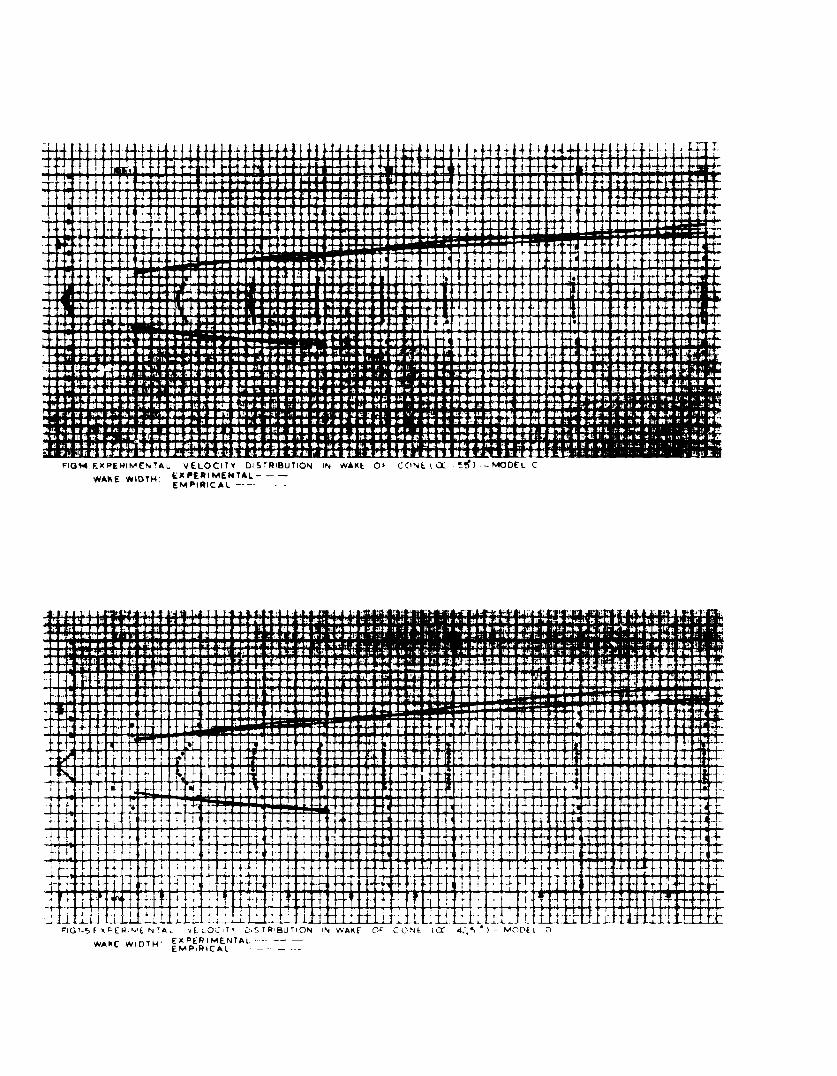
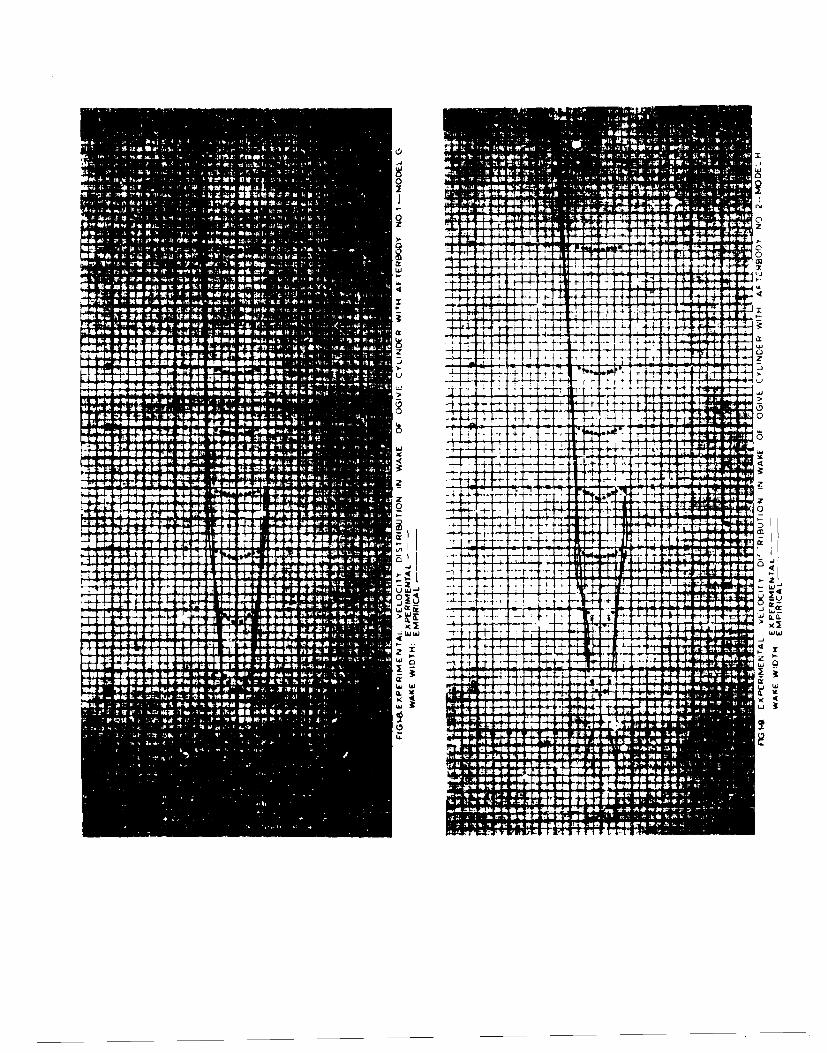
2.1,2 Calculations
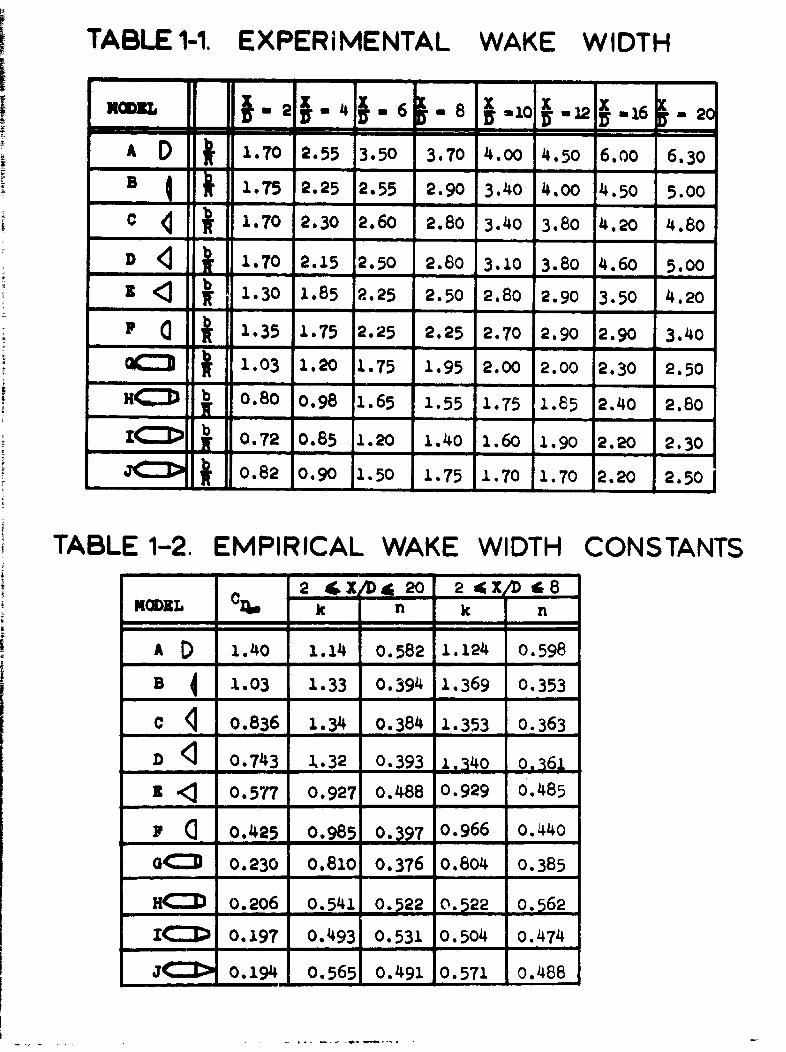
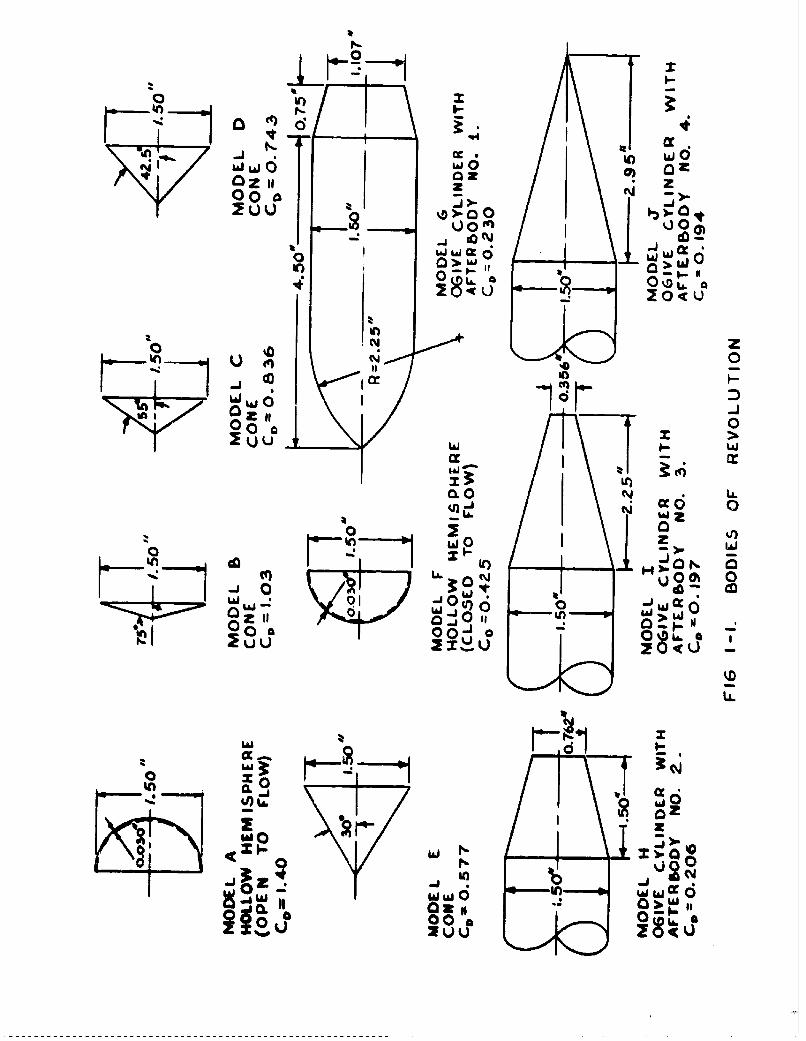
The experimental data for the models shown in Fig 1-1
was presented in Progress Report No 17 as a pressure coefficient,
Cp, versus X/D, from which the velocity ratio was extracted and
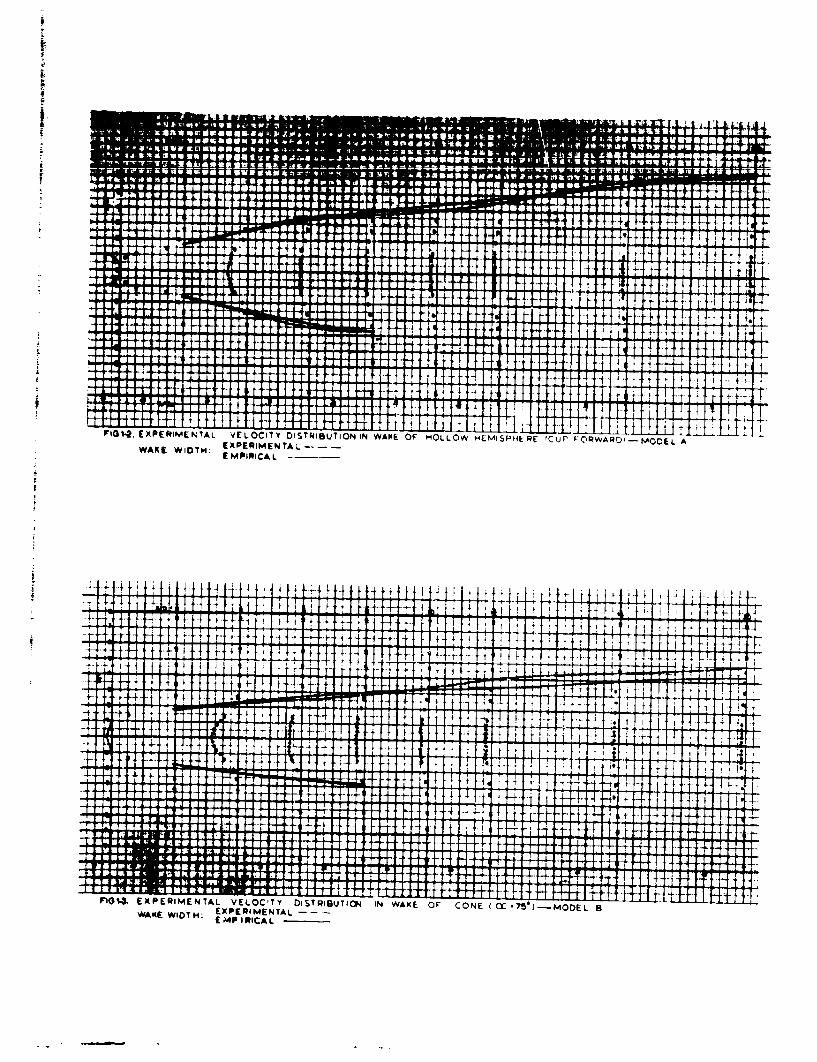
is presented in Pigs 1-2 through 1-11 of this report. The experi-
mental width of the wake was then defined as that point where
the velocity defect is 10 percent of the velocity defect at the
centerlinel i.e., (VO - Vb)/(Vu. - VCL) - 0.10. Table 1-i shows
the numerical values and Fig 1-12 is a graphical presentation of
the wake width so determined for the ten bodies.
It can be seen that the experimental data are merely
approximately distributed along a straight line, which had to be
expected. However, if one assumes straight lines for each curve
of Fig 1-12, one obtains an approximate representation of wake
width for all models over the X/D range from 2 to 20. This has
been done, and the constants k and n so determined are presented
in Table 1-2. Using these constants, the empirical wake width
was calculated, and is presented in Figs 1-2 through l-ll, togetherwith the velocity distributions on the upper half of each graph.
It should be noted that these graphs are scaled to be geometrically
accurate.In problems of aerodynamic retardation, the region from
X/D - 3 to X/D - 8 is of particular interest. Therefore, the con-stants of the empiric~l wake width have been recalculated in an
attempt to obtain a better agreement with experiment in this region.
The constants k and n so determined are also presented in Table 1-2,and this empirical wake width is superimposed on the lower half of
Figs 1-2 through 1-Il. We see that quite accurate representations
3

are obtained. A further exploitation of these findings will be
attempted during the next reporting period.
292 Analytical Analysis of Turbulent Wake in Supersonic
Plow
2.2.1 IntroductionA set of linearized partial differential equations des-
cribing the velocity, pressure, temperature, and density fieldsin the wake of an axially syiuetric body was derived and presented
in Eqns (1.1c), (1.2c), (1.2d), and (1. 6 c) of Progress ReportNo 19, An error in printing was made in Eqn (l.2c). The first
term on the right hand side should be
- (p,. /pea UaP'e*/ax*.
During this reporting period, an attempt was made to
solve this set of equations. The results are presented in thefollowing paragraphs. Symbols are as defined in Progress Report
No 19.
2.2.2 AssumptionsTo solve the set of linear differential equations,
several assumptions must be made as follows:
1) The pressure, temperature, and density gradients
in the axial direction are negligible
2) The shear stress in the radial direction isnegligible ((xrT o 0)
3) The shear stress in the axial direction is given by
'TrXT - B9- U.fx*uw r (1.2)
4
where B - experimental constant
f(x*) - arbitrary function of x* representing variationof turbulent viscosity in axial direction(to be determined experimentally)
U~x - maximum velocity defect (at r* = 0).
The first two assumptions are usually made in wake analysis, and
should be very accurate at large distances downstream. It is
difficult to Justify the third assumption, since little is knownabout the turbulent shear stress in supersonic wakes. However,a similar form of the expression is widely used in incompressiblewake analysis, with f(x*) representing the local width of thewake. Therefore, it is hoped that Eqn (1.2) can be successfullyemployed in supersonic wake analysis.
Using these assumptions, the set of differential
equations becomes:Continuity:
+ - r (1.3)
x -momentum:
Bfý .)-*-4 r* * P (1.4)5-rT r7 'max "r*
r-momentum:
4 *= P-0 ap*
- . .m. r (1.5)
energy:
S(1.6)j --v a•2.2.3 Solution for u*
To solve Eqn (1.4), we assume a solution of the form
U* = g(x*)e-h(x*)r*2 (1.7)
5

We then obtain the term
rj4 (r*M ) gx)~*)-~ r *2 h x*)-1(1.8)
Also, since uix occurs at r* - 0, we have
ulax = g(x*). (1.9)
Introducing Eqns (1.7), (1.8), and (1.9) into Eqn (1.4), we obtain
g,(x*) + tgBg2 (x*)h(x*)f(x*) -
[8 (x*)ht(x*) + 4Bg2 (x*)h 2 (x*)f(x*)]Ir*2 (l .10)
where 0' indicates differentiation with respect to x*.For this equation to be satisfied for all r*, each side
must be identically zero. Then we have
g'(x*) + 4Bg2 (x*)h(x*)f(x*) - 0, (1.11)
g(x*)h'(x*) + 4Bg2 (x*)h 2 (x*)f(x*) - 0, (1.12)
Multiplying Eqn (I.ii) by h(x*) and substracting Eqn (1.12) from
the result yields
g'(x*)h(x*) - g(x*)h'(x*) - 0, (1.13)
which can be integrated to give
g(x*) -K1h(x*), (1.14)
where K1 is a constant of integration. Substituting this
6
expression into Eqn (1.11) gives
. I4BK•f(x*)h3(,*), (1.15)
which can be integrated to give
h(x*) - 8BYff (x*)dx* + Y,](1.16)
where K2 is a constant of integration.Equation (1.7) now becomes
U* - Klh(X*)e-h(x*)r*2 (1.17)
where h(x*) is given by Eqn (1.16).
2.2.4 Solution for v*Subtracting Eqn (1.2) from Eqn (1.4) gives
f( ax*. (r a-*- - ý re (r*v*), (1.18)
which can be rewritten as
j-4[Bf(x*)u~xr* a u* + r*v*] = 1(119)
or, after integration
v* - Bf(x*)U;ax " (1.20)
Substituting the expression for u* from Eqn (1.17) gives
V* = 2BK 1 2f(x*)h3(x*)r*e~h(x)r. (1.21)
7
Solution tor p*Substituting the value of1. obtained from Eqn (1.21)
Into Xqn (1.5) yields
m2rnr 2M e -h( 2r*[3r(x*)h (x* )ht(x*)+
+ h 3 (x*)t,(x*) - f(x*)h 3 (x*)h,(x*)r*]. (1.22)
Integration and rearranging gives
p*. uf ) [3r(x*)ht(x*) + f,(x*)h(x*).Je-h(x*)r*2 -
Uitem -ML f(z*)h(x*)h'(x*)[ h(x*)r*2 + e• .h(x*)r, 2 +
+ o(x*). (1.23)
whore o(x*). is an arbitrary function of x*. To determine this
function, use the fact
lim p* a 0 (1.24)
From Eqn (1.23) we see that
11. p* O (x*). (1.25)
Therefore c(x*) - 0. Then Eqn (1.23) becomes
L B2R 13pw U.02h4(x*) f2(X*)-h(x*)r( *.hhx.)r2 +"p ~ 1 °""h(x*)r* 2 +
+ ,jI) - 2 . (1.26)+ Zlhijz*)f9(x*)
' 8
2.2.6 Solution for T*Introduce the Prandtl and Reynolds numbers which are
defined respectively as
Pr" M• ' Rend (1.27)
where C; - specific heat of fluid at constant pressure
d - characteristic dimension of body
K - thermal conductivity of fluid
U- w free stream velocity
A a dynamic viscosity of fluid.
Then Eqn (1.6) becomes
) + I • (1.28)
We assume a solution of the form
T* - gi(x*)e'hl(x*)r*2 " (1.29)
Then Eqn (1.28) becomesRerg-.(x*)*2Rr x*
-- + hh(x*)] - r*2 (x*) + 4hi 12(x*) (1.30)
Since this must be satisfied for all r*, both sides of theequation must be identically zero. Then
Rer gl' (x*)
r (*) + 4h 1 (x*) 0 0 (1.31)
Ier
Solving Eqn (1.32) for hi(x*) gives
h1 (x*) = + K3 (1.33)
9
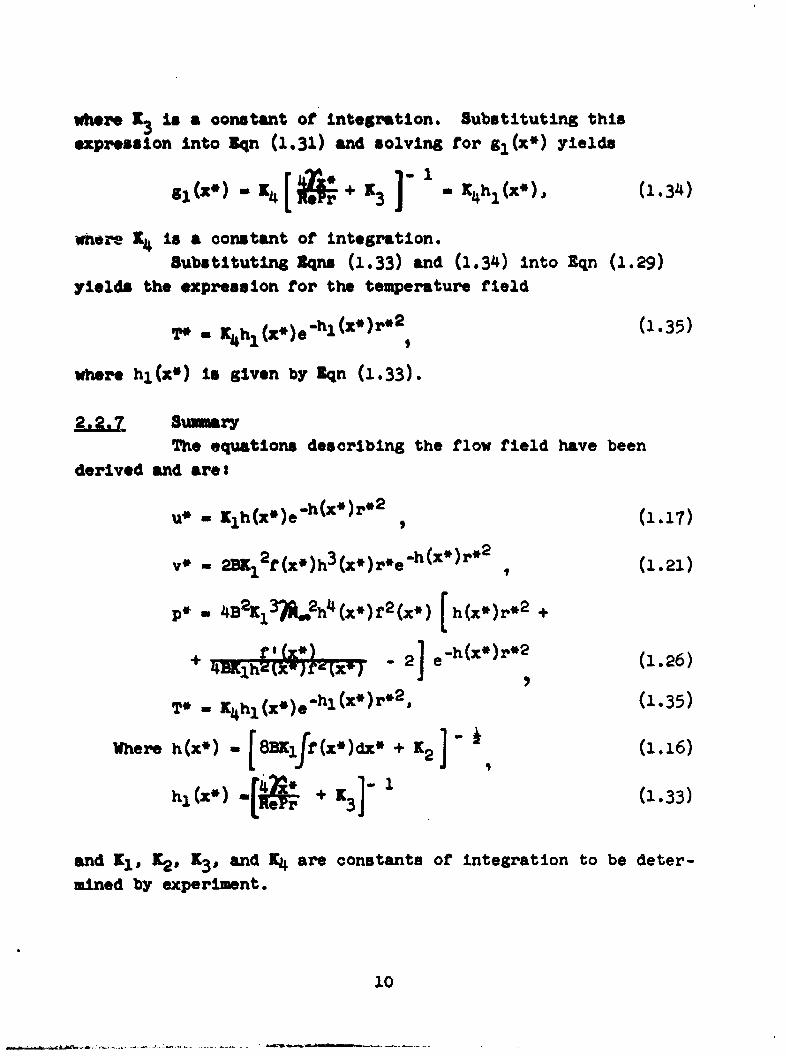
where X3 Is a constant of integration. Substituting this
expression into Iqn (1.31) and solving for gl(x*) yields
gl(x*) - 14[ + M3 1 K4h(x*), (1.34)
where X is a constant of integration.Substituting Zqns (1.33) and (1.34) into Eqn (1.29)
yields the expression for the temperature field
T* = KXhl(X*)Oeh1 (x*)r*2 (1.35)
where hl(x*) is given by Rqn (1.33).
SSum aryThe equations describing the flow field have been
derived and ares
u* - Xlh(x*)e'h(x*)r.2 (1.17)
v*- =2B12f(x*)h3(x*)r*e.h(x*)r* 2 (1.21)
p*- 14B2 Kl3?• 2 h 4 (x*)f2(x*) [h(x*)rh12 +
+ • h• J• - 2] eh(x)r*2 (1.26)
T* . K14hl(x)e-hl(x*)r*2, (1.35)
Where h(x*) - [sBlff(x*)dx* + X2] (1.16)
h l (x*) + X31] (1.33)
and Kl, K2, K3, and KX are constants of integration to be deter-mined by experiment.
10

2.2.8 Proposed WorkDuring the next reporting period, a comparison will be
initiated betwreen the above theory and experiments, and the con-
stants of integration will be determined for various bodies.
REfBRNCBS
1. Heinrich, H. G. and Riabokin, T.: Analytical and Experi-
mental Considerations of the Velocity Distribution in theWake of a Body of Revolution, WADC TR 60-257, December 1959.
2. Schlichting, H.z Boundary Layer Theory, McGraw-Hill,New York, 1955.
11
V
TABLE 1-1. EXPERIMENTAL WAKE WIDTH
""2 4 6" 86 X-8o -12vm16 2
A D 1 1.70 2.55 3.50 3.7o 4.00 4. r5o 6oo 6.301.75 2.25 2.55 2.90 3.40 4.00 4
a -5 - -0-5-0-
C ~J * 1.70 2.30 2.60 2.80 3.40 13.80 ~4.20 14.801
D 1 1-.70 2.15 2.50 2.80 3.10 3.80 4.60 5.00
B < f 1.30 1.85 2.25 2.50 2.80 2.90 3.50 4.20
Q t1.35 1.75 2.25 2.25 2.70 2.90 2.90 3.40Ol 1.03 1.20 1.75 1.95 2.00 2.00 2.30 2.50
H4=D b 0.80 0.98 1.65 1.55 1.75 1.85 2.40 2.80
I<=•> I. 0.72 0.85 1.20 1.40 1.60 1.90 2.20 2.30
__ =__ ft 0.82 0.90 150 1.o75 1.70 1.70 2.20 2.50
TABLE 1-2. EMPIRICAL WAKE WIDTH CONSTANTS2 4X,,A 20 2 4X/ G8
MODEL CIo k n k n
A D 1.40 1.14 0.582 1.124 0.598B 1.03 1.33 0.394 1.369 0.353
C0.836 134 0.384 1.353 0.363
D 0• .743 1.32 0.393 1,340 0.361
Z < 0.577 0.927 0.488 0.929 0.485
I F 0.425 0,985 0.397 0.966 0.440
o= 0.230 0.810 0.376 0.804 0.385
H<= 0.206 0.541 0.522 0.522 0.562
I< 0.197 0.493 0.531 0.504 0.474i- -
3 0> .1914 0.565 0.1491 0.571 0.488
W)
I-t
w 0
00o
2 u 0. ON.) a
0000 00'huO zOUJ Lc
o 0 C ), >, La_
0. 0
U 0
*j co I m
0 wo J %
iz . 0
U)
J-0
co
ui 0~
J •. ,•.o,,,,,u =Q• e•'
144+f+uI T
+
-T-
+
4+-T,
j : - +++ i jj
4 +t- t- t+
+++
I+f+ -dih El T'
hTt t 1FIGII-2. EXPERIMENTAL VELOCITY DISTRIBUTION IN WANE OF' HOLLOW HLIVIISPý4k RE fCUP VORWARDI-MODEL A
WAKIE WIDTH.- EXPERIMENTAL---EMPINICAL
IT T-17f F. f., -4 1 H +H i t! 11-1! I i f 4T
r T -. 17+7 TIII i4 il i- m4- r 44T7t t- T- -4-
t I t f
4
t -if i II t .71 tt" - I
4- t Fv I+ -JA1+ 4 11 4 1 1 z z t --i 1 4- 4
4-,4- -4--4 44-H+ + +I I T r- I ! -I f -T +j- -j_;+T 1 4-
44 4 -T-I + T+114 +4 + L4: :qT7' L-1 1 I-T
I rrT TPELOC'TY DISTRIBUTION IN WAKE OF CONEF10%& EXPERIMENTAL V CC 75*)-MODEL 8AAKE WIDTH: EXPERIMENTAL
E MP IRICAL
-H4~~~~ ~ ~ ~ M44 4 H 4I 4-4 fIIf+-11++--flHfI ltfIH4-4-4 , t Lp44k 44. 04H-H4
,- -.
; 4.v-A
t[
4T- T. T 4 I -]'I ILI'
-t + T4H4 h+ 4-0
,1 4 .+. -
f -i 9i f4 f
+4 1 '
I AL~
F1014.EXPERIMEN'AL VELOCITY DISTRIBUTION IN WAKE OF CONE(C I aiý) -- MODEL C
WAKE WIDTH: LXPERRIMENTAL-EMPIRICAL -- - -
1~~~~~ -- rr i !
41 + : +
WAK WIDTH E4PERIMENTAL-- -+ EMPI--------------

411+ +4+-all au,4Its I ++i V f 1 4 11+44 f++.t
L I I I I t I I a II If I
+A. 44 k -44
I ... I . . ...a+ 4++Hi 11 1 1 -I T L
tit"T R .44A + +A- 4-
-1 1 L
1 47-1 1 i++ III, I I _T +L I L i
I L I- I L 5A L
r I
FIGII.G. E X PE RiME NTAL VELOCITY DISTRIBUTION IN WAKE OF C NE(OC' )-MODEL E
WAKE WIDTH: EXPERIMENTAL�EMPIRICAL
I It'll I L.)A. .6,I I I X IF7!
Amurir-
13LI
4T X LAM I
T, 1 -1 Ulrrl
I Ll A:1 TV- IL. r
A+-r
444 t- +
F I jL,T
_r 7
+H I r 'T T T I i I
+I
FIG 1-7 EXPERIMENTAL VELOCITY DISTRIBVTON IN WAKE OF HOLLOW MEM!SPHERE (CUP BACKWARD)-MODEL FWAkE WIDTH: EXPERIMENTAL�-
EMPIRICAL -
-JT
~ AL
4z

CCC
4411 a
L.JJ
A I a
C CC
ILý 1. 4; ? Z b
o of
41 C
*mew

~5
4 So- .""gS ..0
%3 ad- -" -
2
E -r E-- ,'"" , (CON ES
1 2 3 4 X/D 6 8 1012 16 20 30 407 !6 -' - _ _ - - - - -
4
3 .0000-3-
Il HEMISPHERES
1 2 3 4 X/' 6 8 10 12 16 20 30 403 m- - -I - - I a -
2 "09 -
09 IT I'
_ H-- 1w; .....
-H- rOGIVE CYLINDERS
1 2 3 4 X6 8 1012 16 20 30 40
FIG1-12.EXPERIME NTAL WAKE WIDTH ASA FUNCTION OF X/D
Project No 4
3 .Investigati9n of Basic Stability Parameters of
Copventional Parachutes
ILI Experimental Determination of the Apparent Moment
of Inertia of Parachutes
1 Introduction
In setting up the dynamic stability equations for para-
chutes, it is necessary to consider the apparent mass and the
apparent moment of inertia of the parachute.
Strictly speaking, the moment of inertia of a body
applies only for motion in a vacuum. When the motion takes place
in a fluid, the virtual or apparent moment of inertia must be
considered in order to account for the inertia of the fluid mass
affected by the motion. The added inertia will depend on the
body shape and motion and the density of the fluid.
The analytical determination of the apparent mass and
apparent moment of inertia is very difficult and the available
theories can be applied only to simple geometrical shapes such as
spheres and ellipsoids. For shapes of practical interest such
as parachute canopies, it is necessary at present to resort to
experimentation for determining the apparent mass and apparent
moment of inertia.
3p. Literature SurveyIn order to determine the best experimental method for
measuring the apparent moment of inertia of parachute canopy
shapes, an extensive literature survey was made. The following
brief comments deal with the more relevant and significant refer-
ences surveyed.
Reference 1 gave a detailed analytical treatment for
the case of solid, symmetric bodies revolving in a fluid and
presented values of the inertia coefficients "k" enabling the
20
calculation of the apparent additional masses and the apparent
additional moments of inertia for various ellipsoids. The
shapes analyzed are not of specific interest for parachute work,
but the data presented may be of value for a comparison with
experimentally obtained results or a check on experimental
technique.
References 2 and 3 dealt with the experimental deter-
mination of the moments of Inertia of airplanes and suggested a
somewhat similar arrangement for rigid parachute models. Prelim-
inary tests with this arrangement proved impractical as mentioned
below. References 4 and 5 described methods for the experimental
determination of the added mass and added mass moment of inertia
of a ship model. It was found in Reference 5, for example, that
the added mass and mass moment of inertia for heaving and pitch-
ing were of the same order of magnitude as those of the shipitself. It may be mentioned that while the motions o• a ship
model differ from those of a parachute, the underlying theory and
experimental techniques have many features in common.Reference 6 presented a simple experimental arrangement
for determining the virtual mass and moments of Inertia of discs
and cylinders. In view of its relative simplicity and adaptability.
it was decided to use a very sinilar experimental arrangement for
our purpose) the underlying theory of the method is given below.References 7 and 8 use the same basic principle to
determine the added masses for lenses, parallel plates, spheres,and cubes. Reference 9 treats the problem of the virtual mass
of two-dimensional shapes and gives a coordinated theoretical
and experi-mental investigation of clusters of parallel circularcylinders. In a specific example given, the theory was confirmedto within an experimental error of + 6%.
1 Experimental ArrangementsAs indicated above, a simple experimental arrangement
21

suggested by References 2 and 3 was first tried. It consistedessentially of a bi-filar torsion pendulum to which is attached
the model under test. By measuring the period of oscillation in
air and in a vacuum and allowing for the characteristics of the
suspension system, the apparent moment of inertia or the model undertest could be calculated. However, preliminary tests with a
hemispherical cup oscillating in still air and in the test section
of the low density wind tunnel with no flow gave very little change
in the period of oscillation. It was concluded that unfavorable
experimental facts such as limited model size, unavoidable fric-
tional losses in the suspension system, slight unsymmetries in
the mod,,. and mounting, etc., made this particular arrangement
impractical.Another experimental arrangement based on that of
Reference 6 was set up, and preliminary tests indicated its
suitability. It consists of a specially designed test frame
incorro" 'in i simple torsion pendulum, adjustable mounting armsfor the models and the necessary apparatus for sensing, recording,
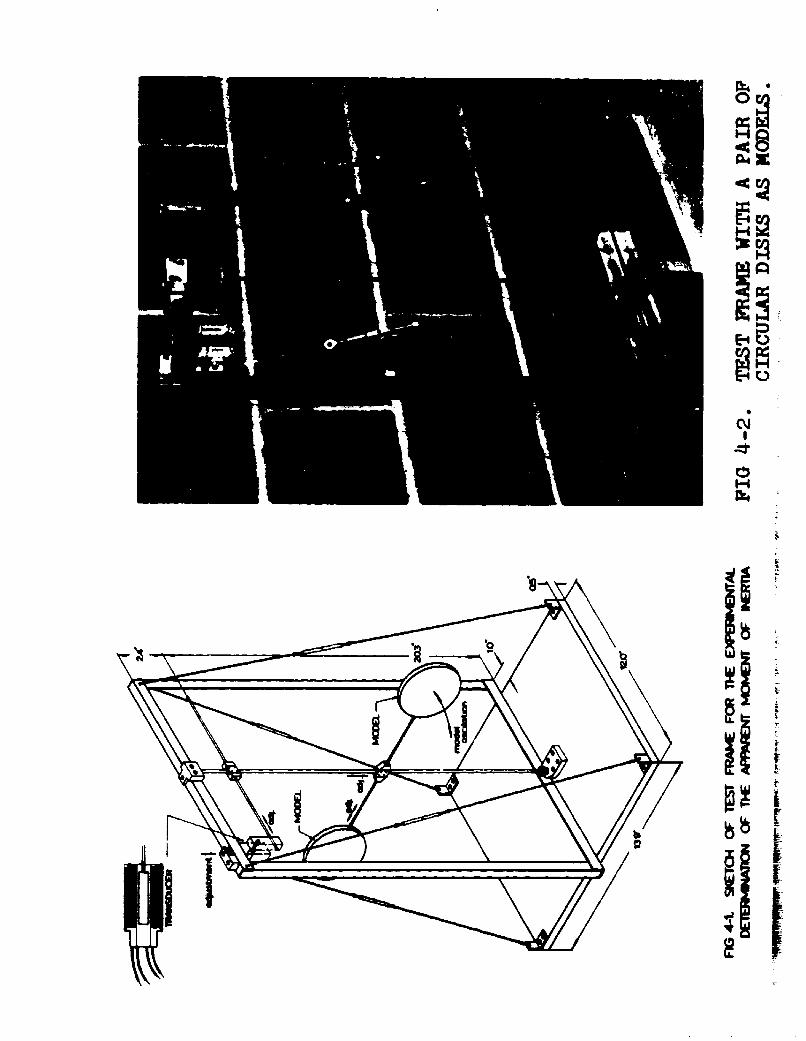
and timing the oscillations. Figure 4-1 illustrates the main
dimensions ar, lesign features of the test frame. The torsion rod
now used is I/B inch in diameter, 22 inches long, and is mounted
vertically and held fixed at both ends. A small fitting is
clamped on the rod at mid-point and carries two threaded 3/32
inch diameter shafts for mounting the models such that the tor-
sional oscillation of the central rod imparts the model motion
under investigation.For symmetry, two identical models mounted on opposite
arms are used unless the motion is about an axis of symmetry in
which case a single model would be attached directly to the
torsion shaft at mid-point. In other words, the center of gravity
of the model system is made to coincide with that of the torsion
rod. The dimensions of the test frame were chosen so that it
can be conveniently immersed in a tank containing water or some
other convenient liquid such as gasoline (p - 0.734 gm/cm3 ).
22
A small, linear variable differential transformer
(Shaevits) is used as a transducer to pick up the oscillations.
The coil Is mounted In a plexiglass fitting attached to the top
member of the test frame while the core is mounted on another
plexiglass fitting attached to the crossarm fitted to the tor-
sion rod near the top as shown. Means are provided for initially
centering the core of the transducer. The transducer is mounted
near the upper end of the torsion rod so that it is just above
the iuneraion level.
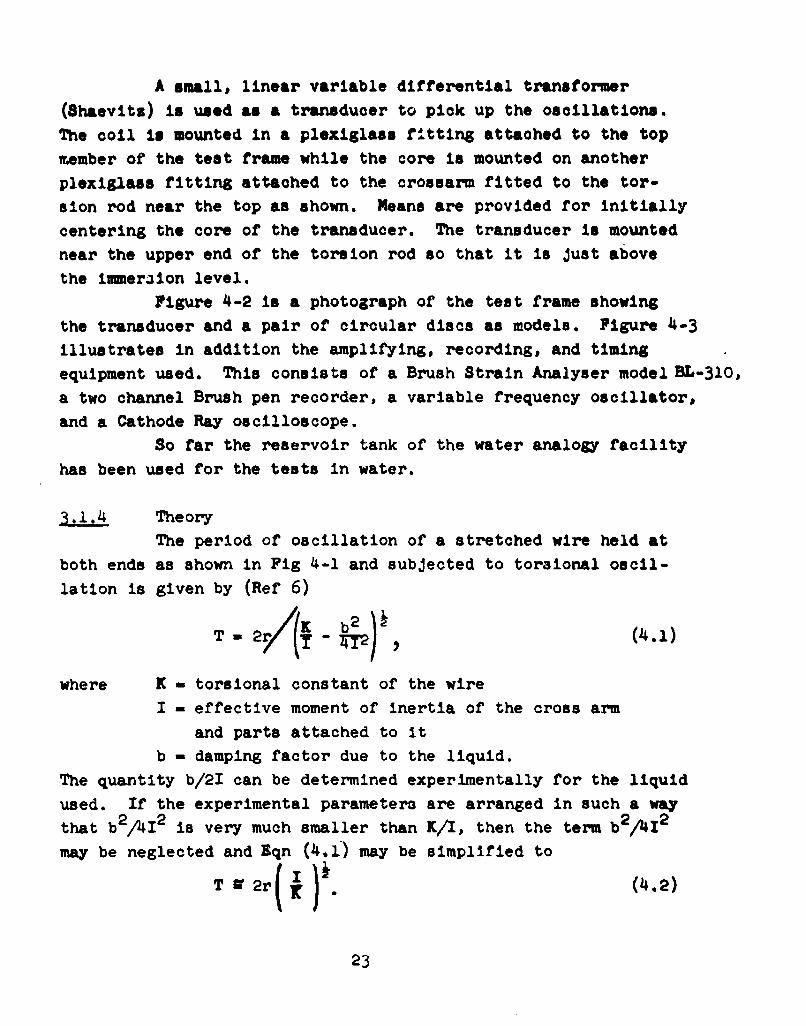
Figure 4-2 is a photograph of the test frame showing
the transducer and a pair of circular discs as models. Figure 14-3
illustrates in addition the amplifying, recording, and timing
equipment used. This consists of a Brush Strain Analyser model BL-310,
a two channel Brush pen recorder, a variable frequency oscillator,
and a Cathode Ray oscilloscope.
So far the reservoir tank of the water analogy facility
has been used for the tests in water.
3.1.4 TheoryThe period of oscillation of a stretched wire held at
both ends as shown in Fig 4-1 and subjected to tor3ional oscil-
lation is given by (Ref 6)
T = 2/(TF'_ b2(4.1)
where K - torsional constant of the wire
I - effective moment of inertia of the cross arm
and parts attached to It
b - damping factor due to the liquid.
The quantity b/2I can be determined experimentally for the liquid
used. If the experimental parameters are arranged in such a way
that b2 /41 2 is very much smaller than K/I, then the term b2/41 2
may be neglected and Eqn (414i) may be simplified to
TV 2r() (4.2)
23
If tests for a given model arrangement are conducted in air and
in a liquid, then
Ta 9 2r (4.3)
and
TI 0 1 (4..4)
The virtual moment of inertia of the entire oscillating memberdue to the liquid is given by:
I naM X(T 1 2 .- Ta 2 ) (4.5)
If the virtual moment of inertia of the system without the modelsattached it Iý, trn the virtual moment of inertia of the modelsystem alone will be given by
IVM I "a " Is " (T 2I - Ta 2 ) - is (4.6)
In the case of a symmetric arrangement of two models
as shown in Figure 4-1, the virtual moment of inertia of eachmodel will be one half that given by Eqn (4.6).
Experimentally, therefore, it is only necessary tomeasure the period of oscillation of the whole system in air (T.),in liquid (T1 ), the period of oscillation of the system in liquidbut without the models attached (T.), and the torsional constant
of the cone K. The latter may be obtained by a separate experiment.Since the virtual moment of inertia is directly propor-
tional to the density of the liquid, the values obtained can beexpressed for some other fluid of specified density.
Proposed Work
In the next reporting period, the experimental parameters
24
such as torsion constant and model size will first be optimized.Next, some standard body shapes will be tested and the experi-
mental results obtained will be compared with the predictions of
theoretical analysis and available experimental data.
When satisfactory agreement is achieved between theory
and experiment, tests with rigid canopy models of the circular
flat, ribbon, and ribless guide surface parachutes will be
conducted.
It is also proposed to introduce certain modifications
and refinements to the test apparatus and experimental techniques.
3.? Wind Tunnel Investigation of Parachute Models
The final draft of the technical report entitled
"Stability and Drag of Parachutes with Varying Effective Porosity"
has been submitted to the Procuring Agency for approval.
Note: The effective porosity studies of common parachute
cloths previously reported under this project are now
presented together with effective porosity studies on
ribbon and grid configurations under Project 13,
"Effective Porosity Studies."
25

1. Zahn, A. F.1 Flow and Force Eauati•ns for a Body Revoyvingin 'a7 , Parts IV and V, NACA TR 323, 1929.
2. Miller, M. P. •n Aacurate Method of Megsuring the Momentsof Inertia of AirDlanes, NACA TN 351.
3. Soule, H. A., and Miller, M. P.: The BxDerimentalDterMIation of the Moments of Inertia of Airplanes,NACA TR 467, 1933.
4. Oeritsma, I. J.: Exoerimental Determination of DampingAdded Mass and Addeg Mass Moment of Inertia of a Shipo International Shipbuilding Progress No 4, 1952,
P. 505.
5. Vossers, I. G.o Fundamentals of the Behavior of Ships inW Part II, Article 14, International ShipbuildingProgress, Volume 6, 1959, p. 538.
6. Yu, Ye. Tak: Virtual Masses and Moments of Inertia of Discsand Cylinders in Various Liguids, Journal of Applied Physics,1942, Volume 13, pp. 66-69.
7. Stelson, J. M., and Mavid, F. T.: Virtual Mass andAcceleration in Fluids, Tranm., A3CE, Volume 22, 1957,
pp. 518-530.
8. Sarpkaya, Turgut: Added Mass of Lenses and Parallel Plates,Journal Eng. Mech. Div. ASCE, JOune, 1960.
9. Ashley, Holt, and Asher, Gifford W.: OQn the Virtual Massof Clustered Boosters, MIT Fluid Dynamics, Res. Lab.Report No 60-7, December, 1960.
26
ci,'
''-
Si~lli
!ii

cY
* IJ
4 1 a -
C',
4
0H
4.
A

Project No 7
4.0 Theoretical Study of Supersonic Parachute Phenomena
4.1 IntroductionThis study has analyzed the behavior of conventional
parachutes in supersonic flow in the wind tunnel and by means ofthe water analogy. Based on this analysis, a superoonic decelera-tar was conceived which utilizes a pressure reducing "spike " inconnection with a solid cloth canopy.
Progress Reports Nos 18 and 19, Project No 10, presentedresults of initial attempts to use the same concept in a combina-tion which includes a ribbon parachute canopy. Since this investi-gation is so closely connected to the study of the original formof the spiked parachvte, it has been decided to present the twoparallel investigations together under this project.
The work done during this reporting period will bereported in the following phases:
a) Supersonic wind tunnel studies of flexible spikedparachutes
b) Pressure distribution studies on spiked parachutesin supersonic flow
c) Supersonic wind tunnel studies of spiked ribbuoi
parachutes.
4.2 Supersonic Wind Tunnel Studies of FlexIble SpikedParachute
4.2.1 Past WorkRigid models of the spiked parachute have been found
stable in wind tunnel tests at Mach numbers of 1.14, 2.0, and3.0, both with and without suspension lines. Progress ReportsNos 17, 18, and 19 reported results of tests on configurations
with textile canopies.
29

In the early tests with flexible canopies, both the
modeO. and the tunnel suspension system suffered mechanical damage,prompting design of a new tunnel suspension system and a deploy-ment device. These systems have proven satisfactory. Damage tothe models was reduced through the use of heavier MIL-C-8021A,Type II nylon cloth (300 lb/in), elimination of wire rings in thecanopy, and improvement of the suspension line connections.
4.2.2 Continuation
Tests have been continued during the present reportingperiod on the spiked parachute with flexible canopy. During the
early part of the period, models continued to suffer damage to
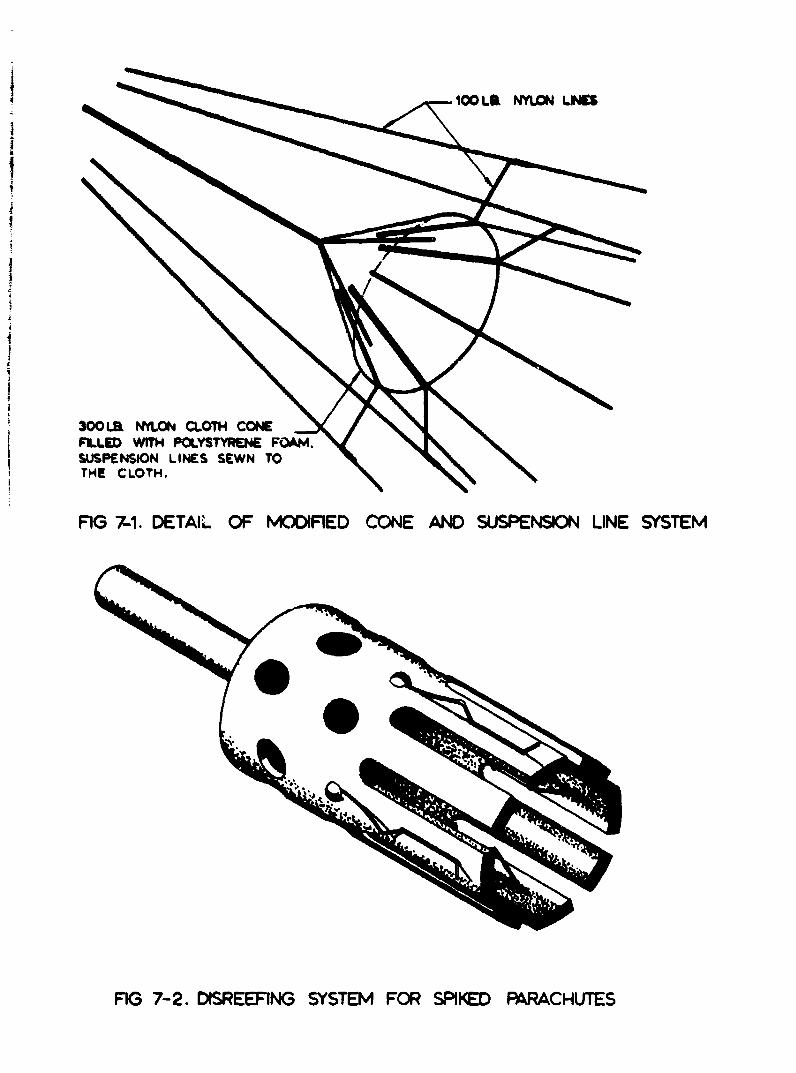
their suspension system. However, it Is felt that this problemhas now been eliminated through the use of a cone cast from poly-styrene foam, which Is much lighter and more resilient than thematerials previously used. As shown in Fig 7-1, the polystyrene
foam is molded within a nylon cloth cone to which the suspensionlines have been previously sewn. Using this modified cone andsuspension system, fifteen tests have been made with nearly 75% of
the models recovered undamaged.
The use of a lighter cone was also prompted by the fact
that the canopy and cone tended to oscillate during testing asindependbnt bodies in a two-mass system. Thus the lighter conehas solved this problem of dynamic balance while simultaneously 2
reducing greatly the number of suspension line connection failures.During this reporting period a new deployment method
was used. As shown in Fig 7-2, the system includes a basket whichholds the cone and the reefed canopy. After the flow in thetunnel is established, the basket is slipped off from the decelera-tor through a downstream movement.
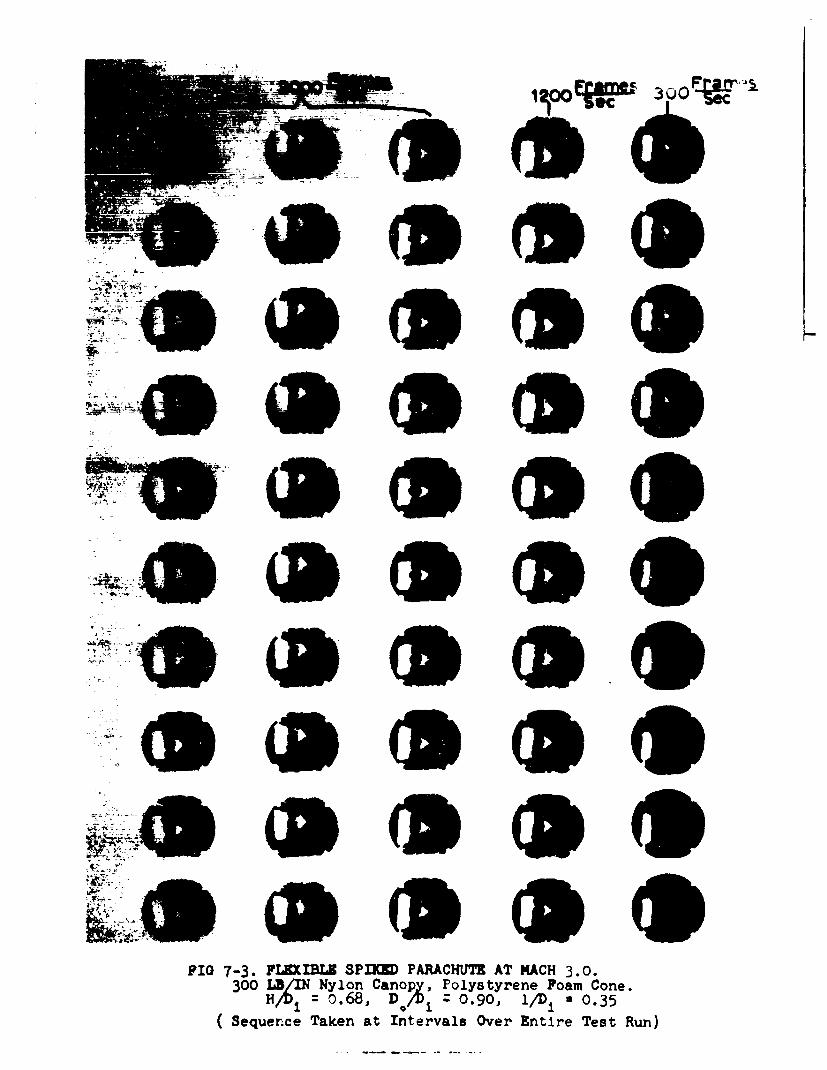
Figure 7-3 presents sequences of Schlieren photographstaken at intervals from a test of a model with a polystyrene foamcone which was deployed as described above. As seen, the model
30

was fully inflated during the test run lanting 30 seconds. The
maximum amplitude of oscillation was + 100.
4.2.3 Proposed WorkSupersonic wind tunnel tests will be continued to further
improve the structural strength and to establish optimum geometryof the spiked parachutes. A number of runs will be made with theintent to validate the encouraging results of the experimentsdescribed above.
i.3 Pressure Distribution Studies on Spiked Parachutes inSupersonic FlowProgress Report No 19 presented results of pressure
distribution studies on models of the spiked parachute at Mach3.0. Figure 7-9 of that report showed a model to measure thepressure distribution throughout the wake area of the cone.
This model has now been tested, and the measurementsreduced to coefficient form as described in Progress Report No 19,Sec 4.3. The results are presented in Table 7-1 and schemati-cally in Fig 7-4, together with the pressure distributions on thecanopy and the base of the cone which were determined previously.
During the next reporting period the pressure distribu-tion models will be tested at Mach 2.0. Also, the models willbe tested at Mach 2.0 and 3.0 with a forebody in order toinvestigate its influence upon the pressure distribution of thespiked parachute.
4.4 Supersonic Wind Tunnel Studies of Spiked RibbonParachutes
4.4.1 Introduction
In view of the success of the above spiked parachute,it appears that the "spike" concept might be applicable to ribbon
parachute canopies. As a first step in this investigation, an
31

extensive series of water analogy tests was conducted on two-Sdimensional models of spiked ribbon parachute configurations as
reported in Progress Report No 18, Project 10. Based on these
studles, rigid models with geometric porosities of 20, 25, and 30percent distributed evenly over the canopy were constructed asshown in Progress Report No 19, PVi 10-4 through lO-6. Designdetails of a typical model, together with nomenclature, are given
in Pig 7-5. The models are shown in Pig 7-6.
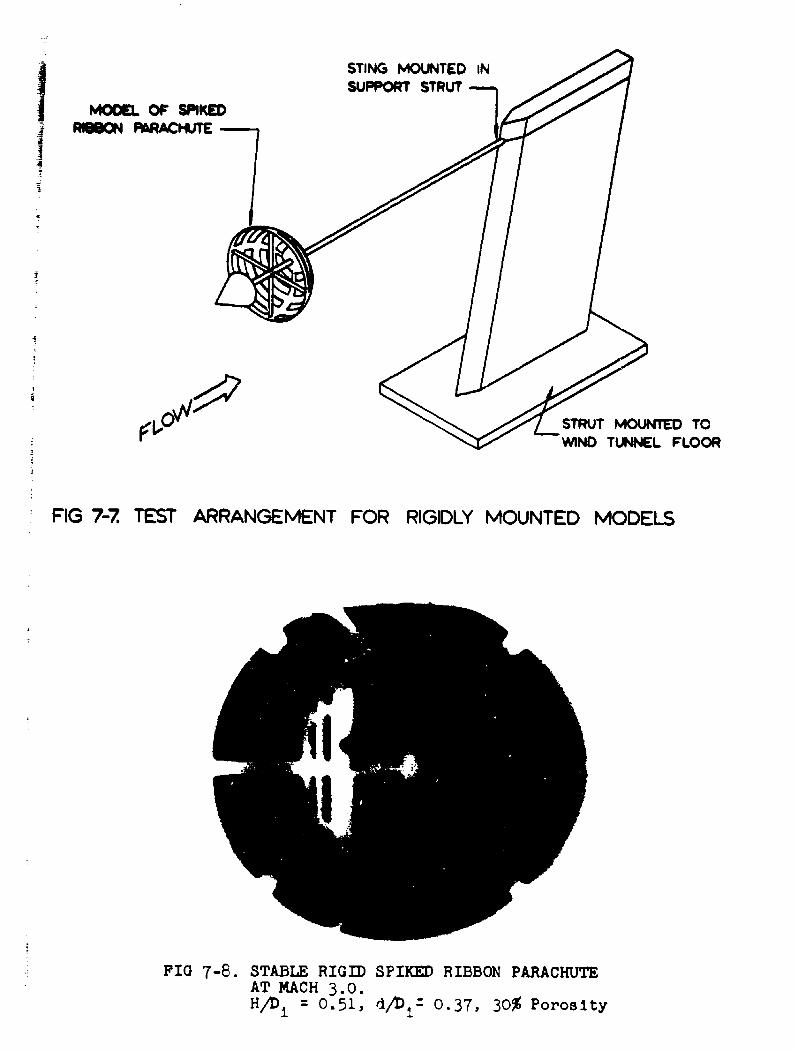
4.4.2 TestsThe rigid models above have been tested in a supersonic
wind tunnel at Mach 3.0. The test arrangement is shown In Fig
7-7. During each test ran, the stability is observed visually
and recorded. Also, high speed Schlieren movies are made ofeach test. The cone Is then moved to a new H/D1 position andthe test is repeated. Thus the cone standoff distance is variedover the desired range for each model.
In order to investigate the effect of cone size, models
were tested with 34* half angle cones, first with a base diameterd of 37% of the canopy inlet diameter Di ("small"), and then with
a base diameter of 47% of the inlet diameter ("large"). All con-figurations tested are listed in Table 7-2.
4 ResultsThe criteria for the degree of stability in the rigid
tests Is a combination of the amplitude of vibration and thesteadiness of the shock patterns as determined from analysis ofthe Schlieren movies. Stability of each configuration Is noted
in Table 7-2. The following general trends were found:a) As the porosity of the canopy was increased,
overall stability of the flow pattern increased,
especially in the region between the base of thecone and the canopy
32

b) As the distance from the cone to the canopy
ws Increased, stability of the flow patterndecreased
a) The models with the small cones were more stable
than corresponding configurations with the largecones.
Figure 7-8 shows the characteristic flow pattern for the configura-tion which has so far displayed the best stability. Figure 7-9
presents a sequence trom the sohlieren movies which shows theextreme instability of the flow pattern typical of configurationswith a forward cone position and low canopy porosity.
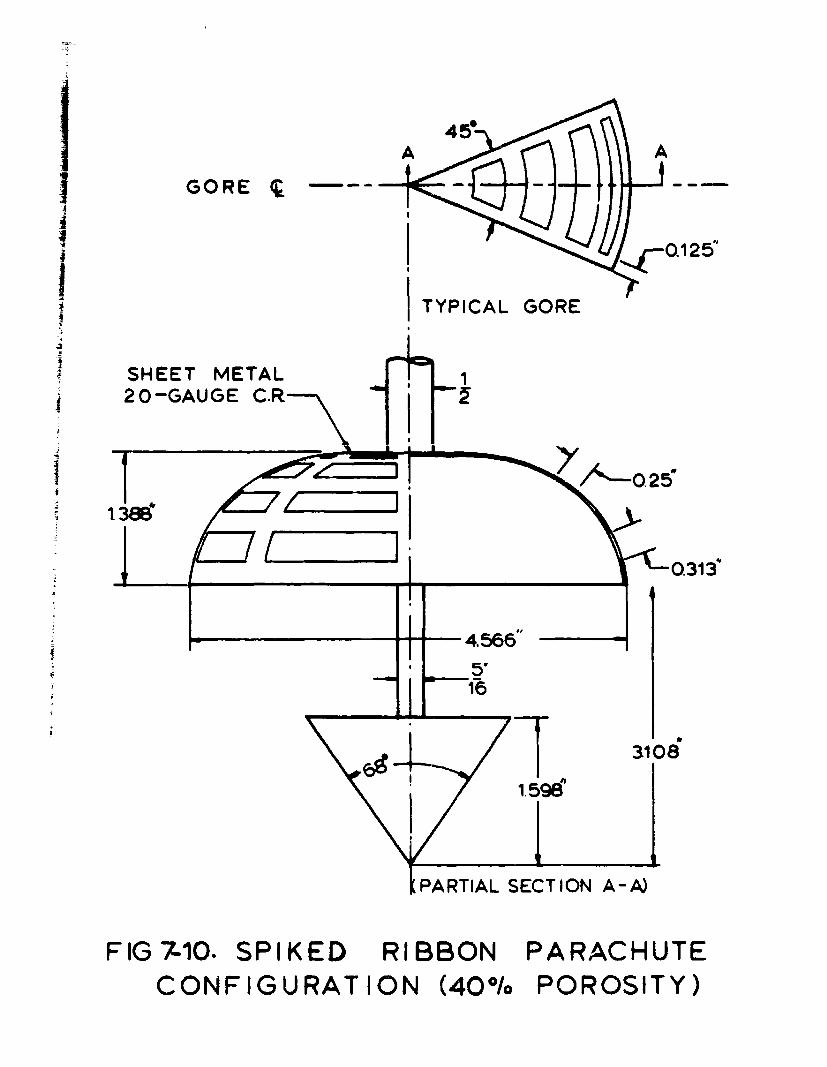
4.4.4 Proposed WorkIn view of the experiments described above, it appears
to be advisable to conduct experiments with models of highergeometric porosity and with cone standoff distances of H/Dt from0.45 to 0.615. Therefore, a model with a geometric porosity of
40 percent has been designed and fabricated as shown in Pigs 7-6and 7-10. If satisfactory results are obtained. a series of pres-sure distribution studies will be made.
33

tt
-1 41 aI 1I
LL.
,1 ai C 4-4 i1CC ;1 0o mcooC
----------------------------------------------------
10 i WI N
30 IN.NCOHCN
FILDWT OLSYEEFWSUPNINLIE ENTTH LOH
FI -. DTI FMXIIDCOEADSSESO IESSE
4A
FI -. DSEFN YTMFRSIE WZCUE
¶¶3Qej flt. 3QQ0 >
'ý. Is
¸--
FIG 7-3. FLEXIUZ SPIKD PARACHUTE AT MACH 3.0.300 LB/IN Nylon Canopy, Polystyrene Foam Cone.
H/b i: o.68, Do/Di = 0.90, I/Di a 0.35( Sequernce Taken at Intervals Over Entire Test Run)

LJC•J=0 cp1 2
FIG 7-4. SCHEMATIC PRESSURE COEFFICIENT DISTRIBUTIONON RIGID SPIKED PARACHUTE MODEL (WITHOUT SUS-PENSION LINES)
4.566" IL34*IA4
5/16"1/20NOT E:
CANOPY PROFILE -- 1.598" LAS DETERMINED
IN PROGRESSREPORT NO 11.SEC 63.2
4 STREAMUNED CURVILINEAR SUPPORTS
FIG 7- 5.WORKING DRAWING OF SPIKED RIBBON PARACHUTE

, 4 1-1
V.4
cc
IV,
"• ~~STING MOUNTED IN i
SUPPORT STRUT
MOOEL OF SPIKEDPAmO RACHUTE
STRUT MOUNTED TO
WIND TUNNEL FLOOR
FIG 7-7. TEST ARRANGEMENT FOR RIGIDLY MOUNTED MODELS
FIG 7-8. STABLE RIGID SPIKED RIBBON PARACHUTEAT MACH 3.0.H/Di = 0.51, d/D 1 : 0.37, 30% Porosity

-i
fll
2 0
4 4)
-A" _94
-446! ~GORE • - • \\A
i 0.126"
TYPICAL GOREI
SHEET METAL- 20-GAUGE C.R
l031
456
1310
/ ,1 59&'
'4PARTIAL SECTION A-A)
FIG7-10. SPIKED RIBBON PARACHUTECONFIGURATION (40%/ POROSITY)

Project So 8
.t0 etical Analysis of the Dy&Mieos of the ODenSrIz
E&JMhfute
Analytical Investigation of Parachute Inflation Timeand Opening ForceNo work has been done on this phase of the investi-
gation during this reporting period.
Site-FPorce History of an Inflating ParachuteThe objective of this study is to exper'imentally
justify the assumptions used in the analytical investigationabove.
The first assumption, that the projected area variesparabolically with time, has been Justified for a 3 ft nominaldiameter circular flat parachute in the finite mass case. Theseresults are presented In Progress Report No 18.
As stated in Progress Report No 19, further tests weremde to investigate the secor4 assumption, that the drag coeff -clent remains constant during the opening process. The datafrom these tests has nov been reduced. However, it was foundthat further refinements in the testing apparatus were necessary.
These corrections have been wade, and wind tunnelsize-force-time studies will be resumed on models of circularflat and 10% flat extended skirt parachutes as soon as a highspeed movie camera is available.
5 Drag Studies on Peefed CanopiesAn extensive wind tunnel study of drag of reefed
canopies has been made, and the data has been reduced. Theseresults are presently being analyzed and will be presented Inthe next progress report.
42

4
Project No 9
65.0 3tatistical Analysis of &xtraction Time. DeploymentTime, ,0ening Time, and Drag Coefficient for Aerial
Dgelivery Parachutes and Systems
The second draft of the technical report for this pro-
ject has been completed and is currently being reviewed.
J43
- Project No 10
Stud~r of ,Lg Pi•rcaiples of- New PElabhutes and&lR~lLtaC .on 12vi.oes
In the last two progress reports, this project has been
concerned with the investigation of the spike-ribbon parachute
ocabinatLon. However, since this investigation is so closely
connected with the study of the spiked parachute which is pre-
sented under Project No 7, the spiked ribbon parachute study will
now also be presented under that project.
44

Project No 12
Gliding Atrodynamig Decelerator
8_1 IrtroduotionThe objective of this study is to develop a self-
Inflating aerodynamic decelerator which has a lift to drag ratio
of 2. Pursuit of this objective involves investigation of pre-
sent aerodynamically unstable parachutes and conventional steer-
able parachutes as well as new concepts in parachute design.
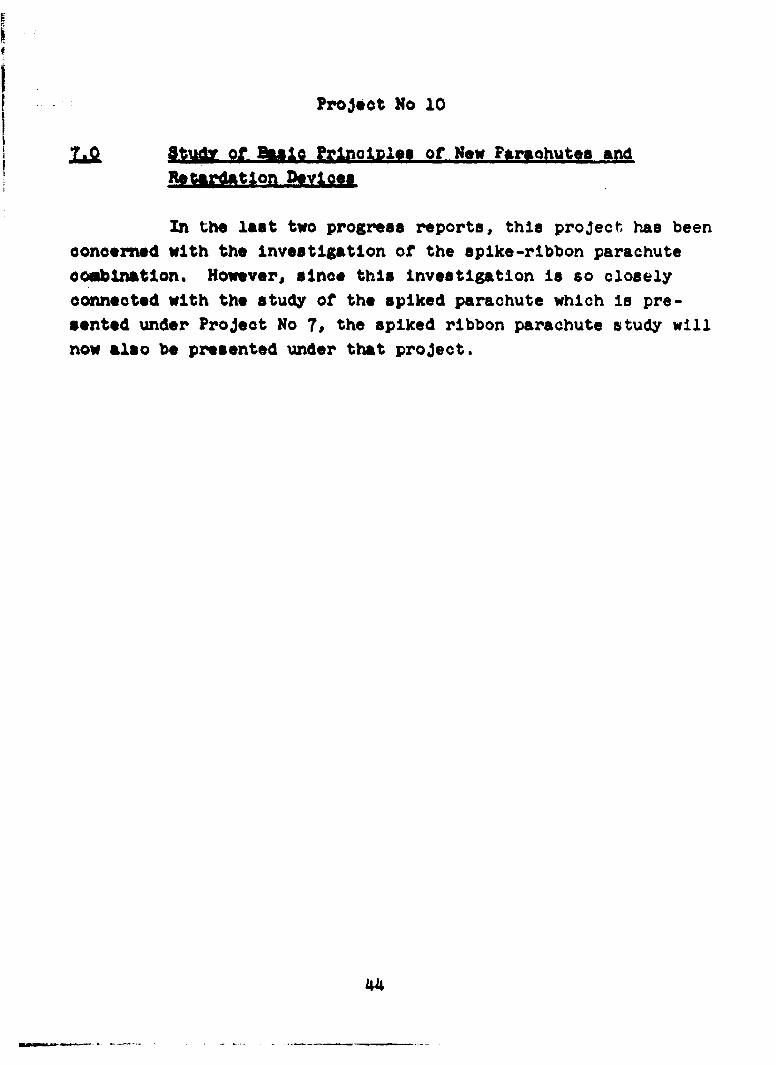
The forces and coordinates for a gliding parachute are
shown in Fig 12-1. We see that for L/D - 2, the angle of attack
of the parachute in
O- tan"1 L/D
- tan"I 2
- 63.5.
Thus the parachute would glide at an angle of 26.5D to the hori-
zon during descent.
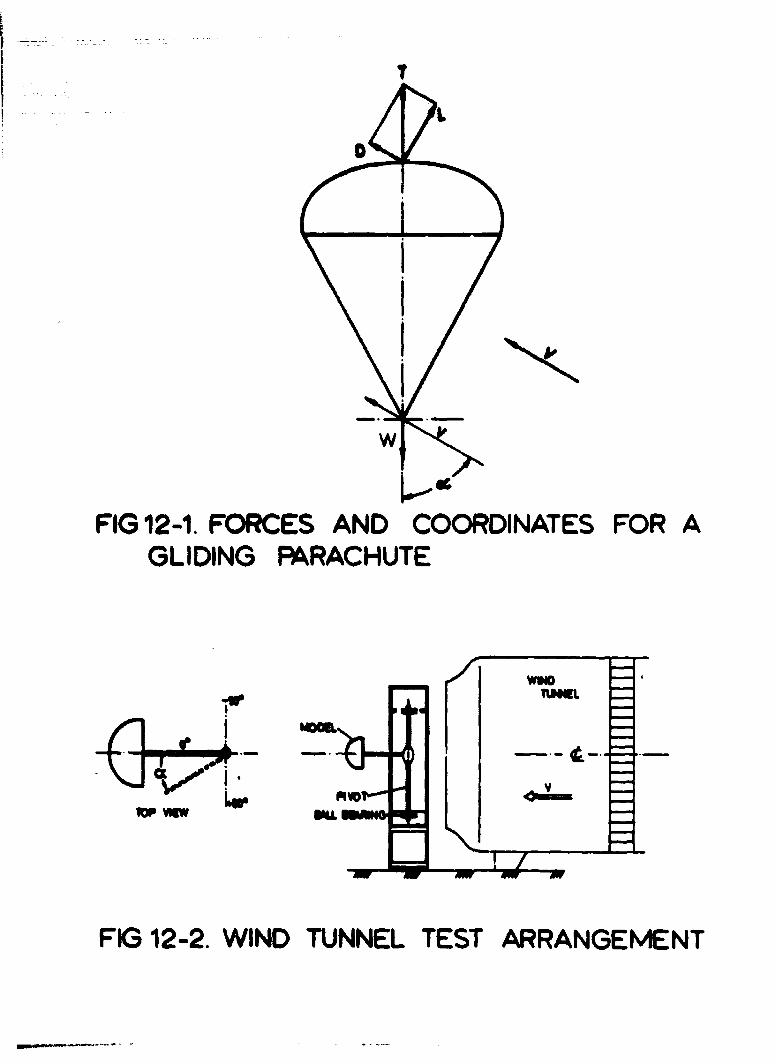
8.2 Experiments
8.2.1 Conventional Steerable Parachutes
During this reporting period several models of unsym-
metrical parachutes were tested in the open test section of the
subsonic wind tunnel (Fig 12-2) or were dropped from low levels
outdoors in still air in order to establish their stable angle
of attack. The test section velocity in the wind tunnel tests
varied from 17 to 25 ft/sec, while the vertical velocity in drop
tests was approximately 13 ft/sec. The results of these tests
are as follows:
a) A 26 inch nominal diameter circular flat canopy
with two double-sized slanted and five straight
personnel guide surface-type extensions shown
"45

in Pis 12-3 was stable at 6' + 20 angle of attack,giving a Slide angle with the horizon of approxi-
ustely 84b) A 70 inch nominal diameter MC-l extended skirt
canopy modified with diametrically opposite slanted
and vented extensions shown in Fig 12-4 exhibited
a stable angle of attack in drop tests of 21.5%
giving a glide angle with the horizon of 68.5*
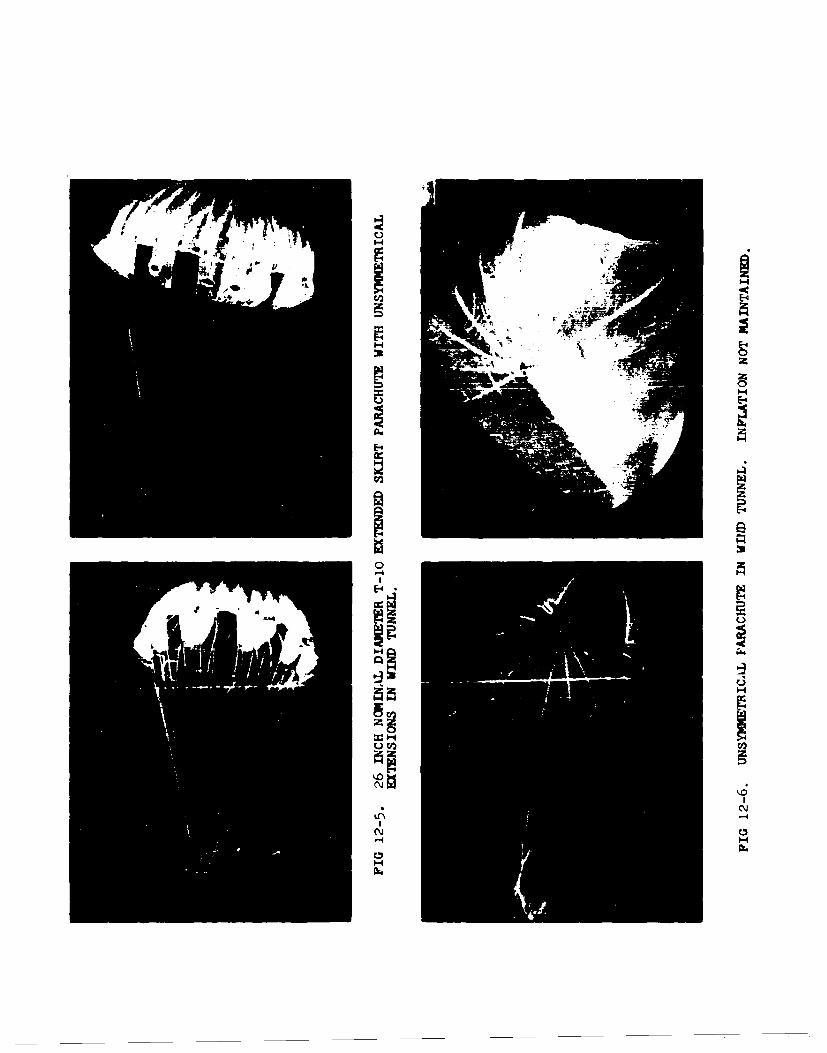
a) A 26 inch nominal diameter T-1O extended skirt
canopy modified with an unsymmetrical arrangementof personnel guide surface-type extensions shown
in Fig 12-5 was stable at 120 + 3%, giving a glide
angle with the horizon of 780 + 30
d) An unsymetrical parachute with the gore pattern
shown in Fig 12-7 was stable at 38* + 3* angle
of attack as shown in Fig 12-6, thus giving a
glide angle with the horizon of 52* + 3*; however,
full inflation could not be maintained in the test
section as shown in Fig 12-6.
We see that none of these parachutes achieve a glide angle of
26.5 degrees with the horizon. Further existing glide parachutes
will be studied as soon as models or other pertinent information
is obtained.
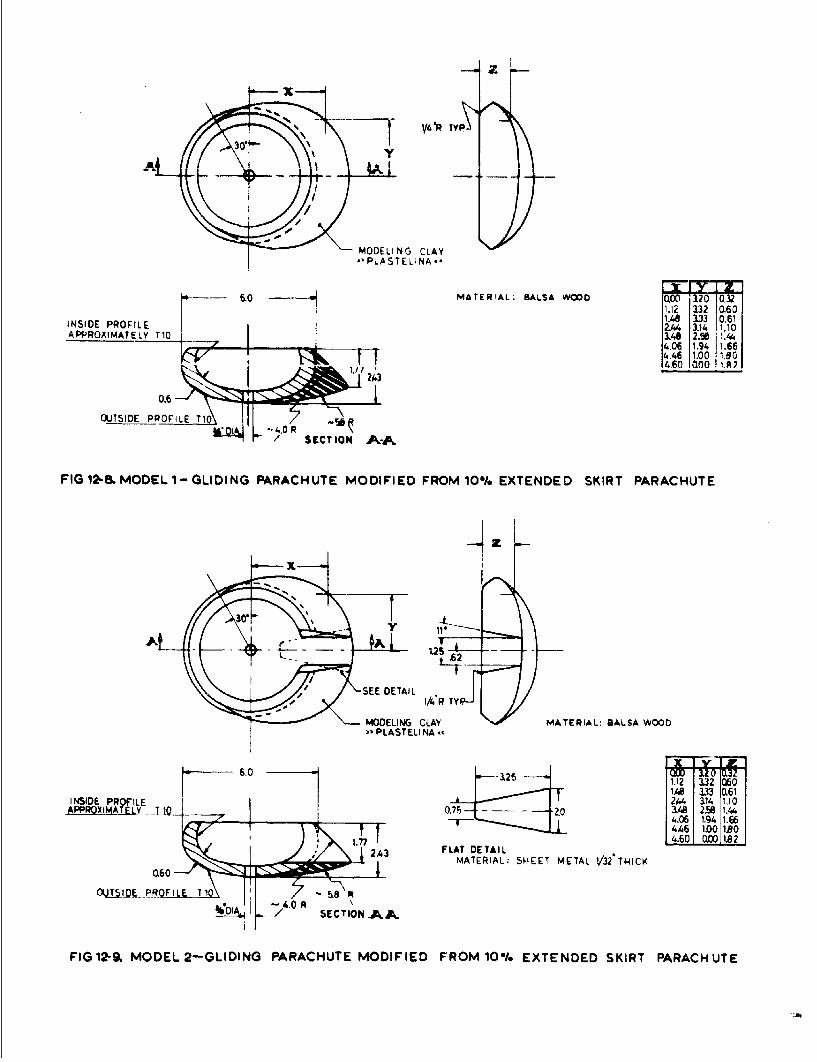
8.2.2 Conceived Gliding ParachuteProgress Report No 18, Sec 9.3.3, reported that the
desired glide angle has been achieved in the wind tunnel using
balsa wood models modified with Plastilina modelling clay.During this reporting period the most favorable of those models,
a modified 10% extended skirt canopy (T-10) was further modified
as shown in Figs 12-8 and 12-9 in an attempt to achieve a con-figuration which could be fabricated from non-rigid materials.
The two proposed shapes are similar with the exception that
Model 2 (Fig 12-9) has a cut-out area in the rear of the canopy,
46

forming an exhaust Jet area. These models were constructed ofbalsa wood and Plastilina and tested in the wind tunnel as shown
in FiS12-10 and 12-11. Results are as follows:a) Model 1 (?IS 12-8) was stable at L48 angle of
attaok, giving a glide angle with the horizon of
~42*
b) Model 2 (Fig 12-9) achieved a stable angle of
attack oa 56, giving a glide angle with the hori-
son ot 340.It can be seen that these models come close to the required glideangle.
An attempt was made to construct flexible canopieswith the shape of Model 2. Although these canopies were only
approximately the desired shape, it was hoped to obtain prelimin-
ary information about the stable angle of attack. The firstmodel was made from paper, and was approximately 18 inches in
diameter. This model achieved a stable glide angle against the
horizon of 270. A second model the same size was made from nylon
cloth with a nominal porosity of 90 ft 3/ft 2 -min. This model wasstable at 430 angle of attack, giving a glide angle of 470.
In order to obtain accurate gore patterns for the above
models, a 24 inch nominal diameter 10% extended skirt canopy wasformed from wood. This basic model is being fitted with ribs
of the desired shape as shown in Fig 12-12. From this model, it
will be possible to obtain gore patterns of the proposed gliding
parachute. This will be done during the next period, and textilemodels of the proposed decelerator will be built and tested inthe wind tunnel.
47
T
FIG 12-1. FORCES AND COORDINATES FOR AGLIDING PARACHUTE
~PIvI--
F 2 NE TN
FIG 12-2. WIND TUNNEL TEST ARRANGEMENT

I i
FIG 12-3. 26 INCH NOMINAL DIAMETER CIRCULAR FLAT "AI.ACHUTE MODIFIED WITHEXTENSIONS IN WIND TUNNEL.I
4
FIG 12-4. 70 INCH NOMINAL DIAMETER MC-I EXTENDED SKIRT CANOPY MODIFIED WITHEXTENSIONS IN DROP TEST.
000
E-4
1-4
-4

ww
0
z
0z
LUUV-- ziLA c.J
Z LLJmuj- Z
w
ww-j-
zF0ACV
- U
" ±1•
WR TV
M D LN6 CLAY
," PLASTELINA-,
- -- .0 MATERIAL: BALSA WOODO 12 0.
1.2I3 0.60INSIDE PROFILE 144 13.14 1.10APPROXIMATELY IO 2.44 3.14 1.10
14.06 1.69 6 14.46 1.00 1.904.60 0100 1.A7
0.6
OUTSIDE PROFILE T10 4RO
S SECT ION PA-A
FIG 12-8. MODEL1- GLIDING PARACHUTE MODIFIED FROM 100/. EXTENDED SKIRT PARACHUTE
z
1.25- - -
SSEE DETAILEEDEA 1/. TY.
MON ' LA MATERIAL: SALSA WOODSPLASTELI NA -
0-125
1A48 a33 0.61INID PO 244 3 114 1. 10
APPROFILM E 0.75P-\__ -0 3.48 2.56 1.44APPPOXMAJIL T 144.06 1.00 1.60
4.60 1.00 1.821.7722A3 FLAT DETAIL1461M18
a0X -i I MATERIAL: SI4EET METAL 3*IC
OJT.WEP FILE 110I
/ . SECTION .Aik
FIG12-9. MODEL2-GLIDING PARACHUTE MODIFIED FROM 10% EXTENDED SKIRT PARACHUTE
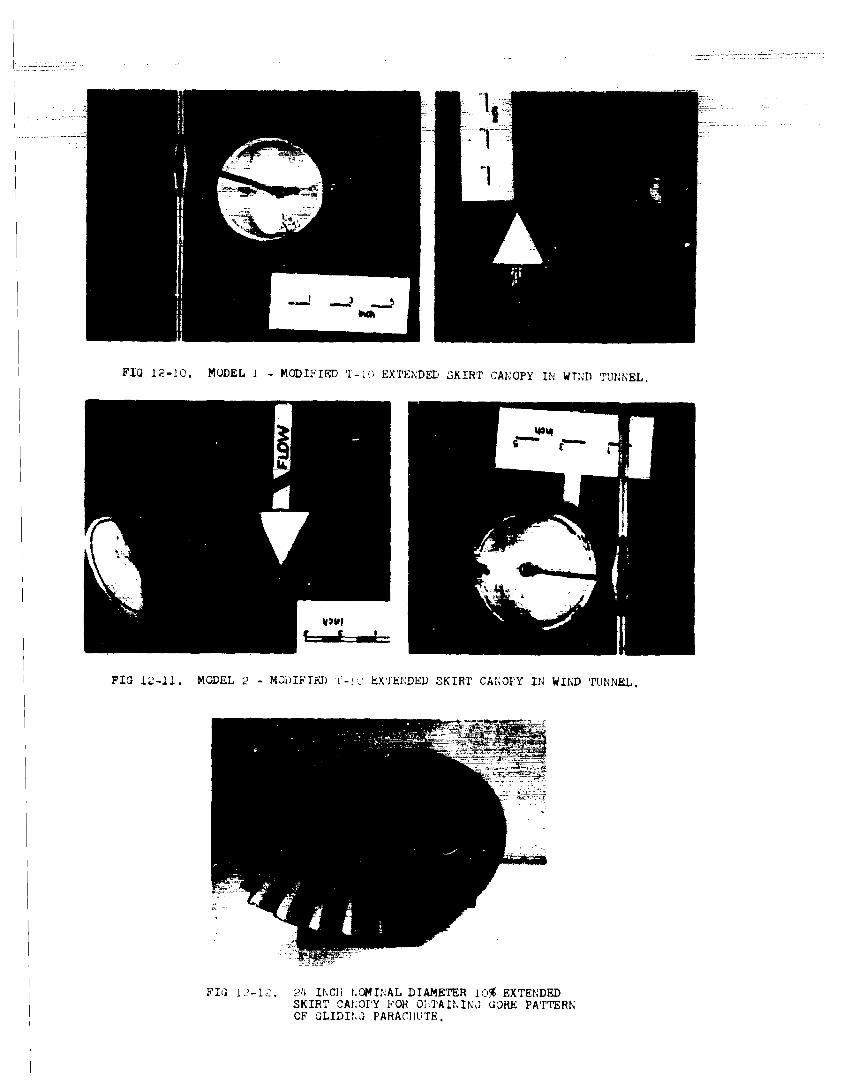
FIG 12-10. MODEL I. MODIFIED TI-" EXTENDED SKIRT ('Al, OPY IN WTND TUNNEL.
FIG 12-11 MODEL M? NDIFI~DF-i En'&kNDED SKIRT CANOTFY 1IN WIND ;PINNEL.
Flu 12-12 24 INCli NOMINAL DIAMWETER 10% EXTENDEDSKIRT CANOPY FOR O!BTAININJJ GORE PATTERNOF GLIDIt~u PARACHUTE.
Project No 13
2A.0 ~ffeptive Porosity Studies
Note: This project, which was formerly titled "Ribbon
Grids for Supersonic Flow," now includes also the
effective porosity studies of parachute cloths which
were previously presented under Project No 4.
2A• Parachute Cloths
9.11 Introduction
Porosity studies of four common parachute cloths for sub-
critical pressure ratios and altitudes above 50,000 ft have been
presented previously. Progress Report Nos 16 and 18 gave details
of a facility which was capable of extending the test range for
cloths over a density range of 0.10 C a 4 1 and a pressure ratio
range of 0.05 , Ap/ApcrX 2.0.In the course of experimentatiun, it was found that the
shape and size of the cloth specimen, as well as the particular
piece of cloth tested, influenced significantly the test results.Also, the cloth stretched and slipped in the test holder, Intro-
ducing elasticity effects and a variation in sample area during
testing.
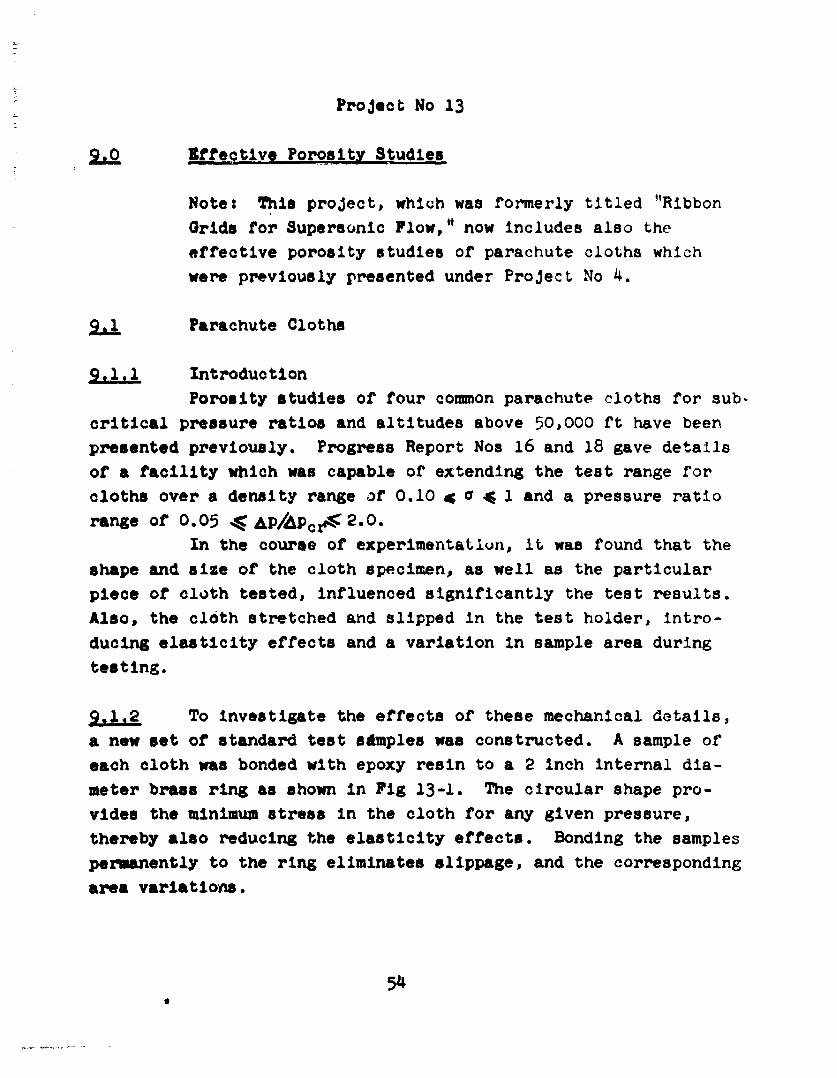
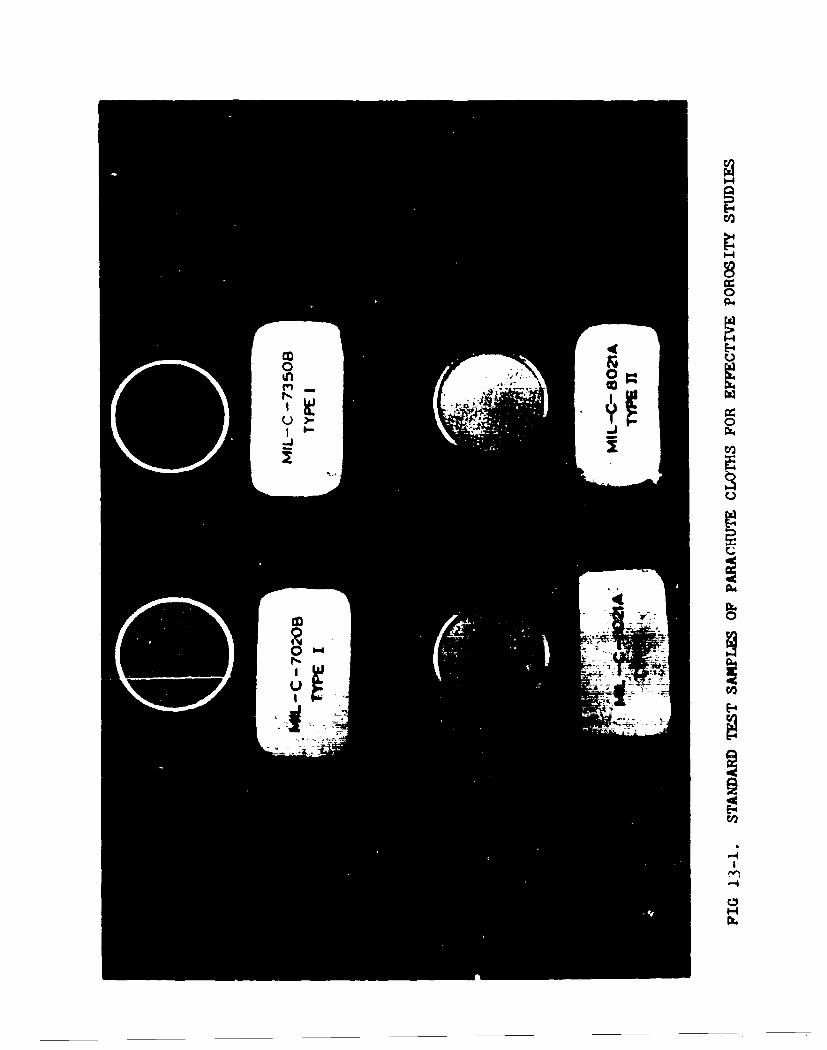
9.1.2 To investigate the effects of these mechanical details,
a new set of standard test stmples was constructed. A sample of
each cloth was bonded with epoxy resin to a 2 inch internal dia-
meter brass ring as shown in Fig 13-1. The circular shape pro-
vides the minimum stress in the cloth for any given pressure,
thereby also reducing the elasticity effects. Bonding the samples
permanently to the ring eliminates slippage, and the corresponding
area variations.
54
These sUnd-rd sampla•e -have been -tested --ower- the de6w-tyand pressure ranges specified above. All pressure measurements
were made with U-tube manometers containing fluids with specific
gravities ranging from 0.81 to 13.5, in order to obtain maximum
sensitivity for all pressure ratios.
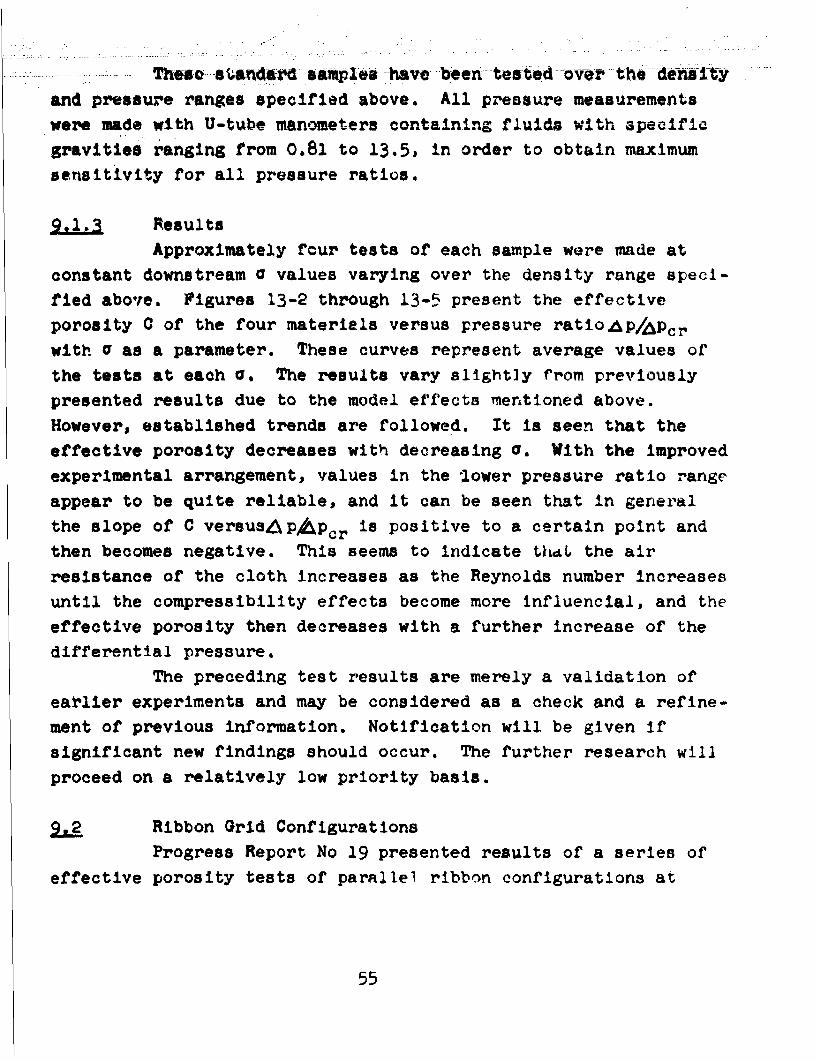
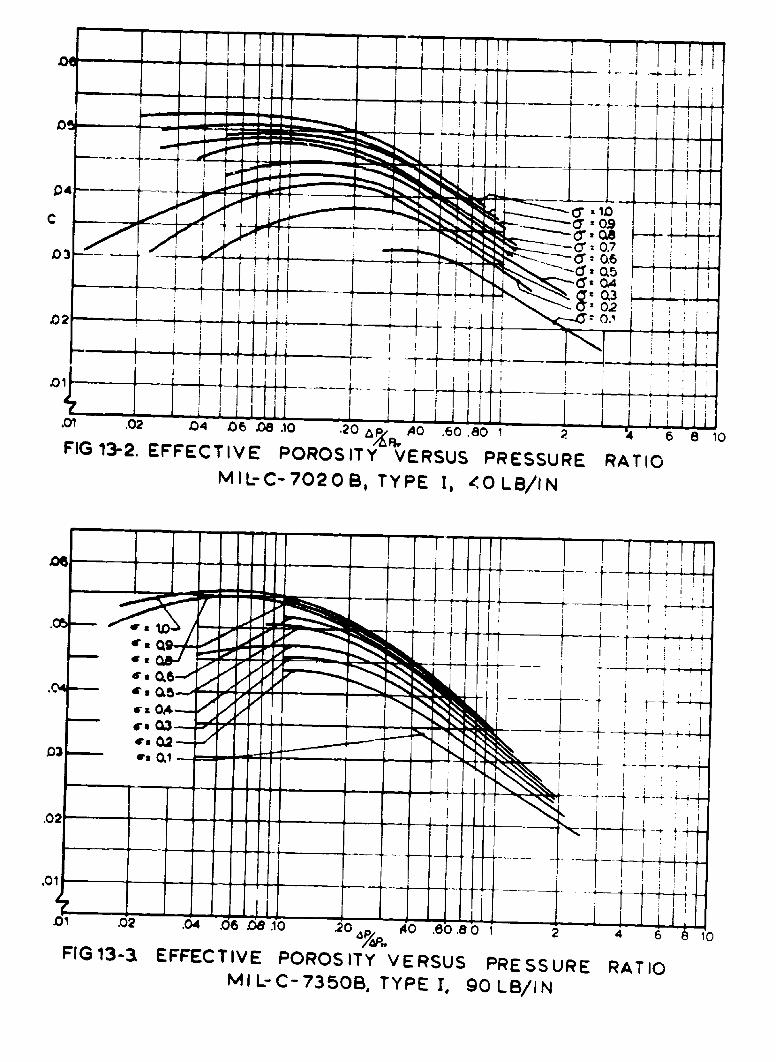
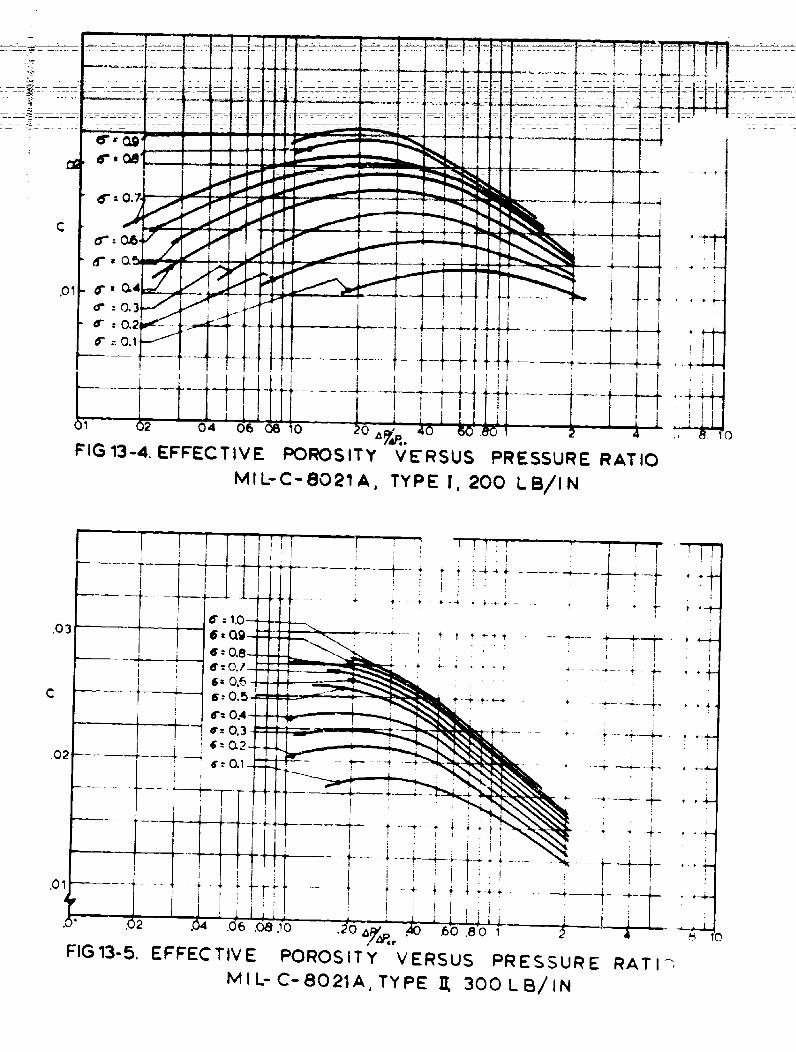
2.1. Results
Approximately four tests of each sample were made at
constant downstream a values varying over the density range speci-
fied above. Figures 13-2 through 13-5 present the effective
porosity C of the four materials versus pressure ratio p/Apcr
with a as a parameter. These curves represent average values of
the tests at each a. The results vary slightly from previously
presented results due to the model effects mentioned above.
However, established trends are followed. It is seen that the
effective porosity decreases with decreasing 0. With the improved
experimental arrangement, values in the 1ower pressure ratio range
appear to be quite reliable, and it can be seen that in general
the slope of C versusLAp/pcr is positive to a certain point and
then becomes negative. This seems to indicate thdL the air
resistance of the cloth increases as the Reynolds number increases
until the compressibility effects become more influencial, and the
effective porosity then decreases with a further increase of the
differential pressure.
The preceding test results are merely a validation of
earlier experiments and may be considered as a check and a refine-
ment of previous information. Notification will be given if
significant new findings should occur. The further research will
proceed on a relatively low priority basis.
2A2 Ribbon Grid Configurations
Progress Report No 19 presented results of a series of
effective porosity tests of parallel ribbon configurations at
55
S.... ...... 'd e r ............. ...... " ------ ------*ale I4e~sty* odlswer moade -both fvom- steel an4i froa
- - ----nlon riboS,, and resu~lts WO 6-iaie anid analyzed to deter-mine the effects of the deformation of the textile models.
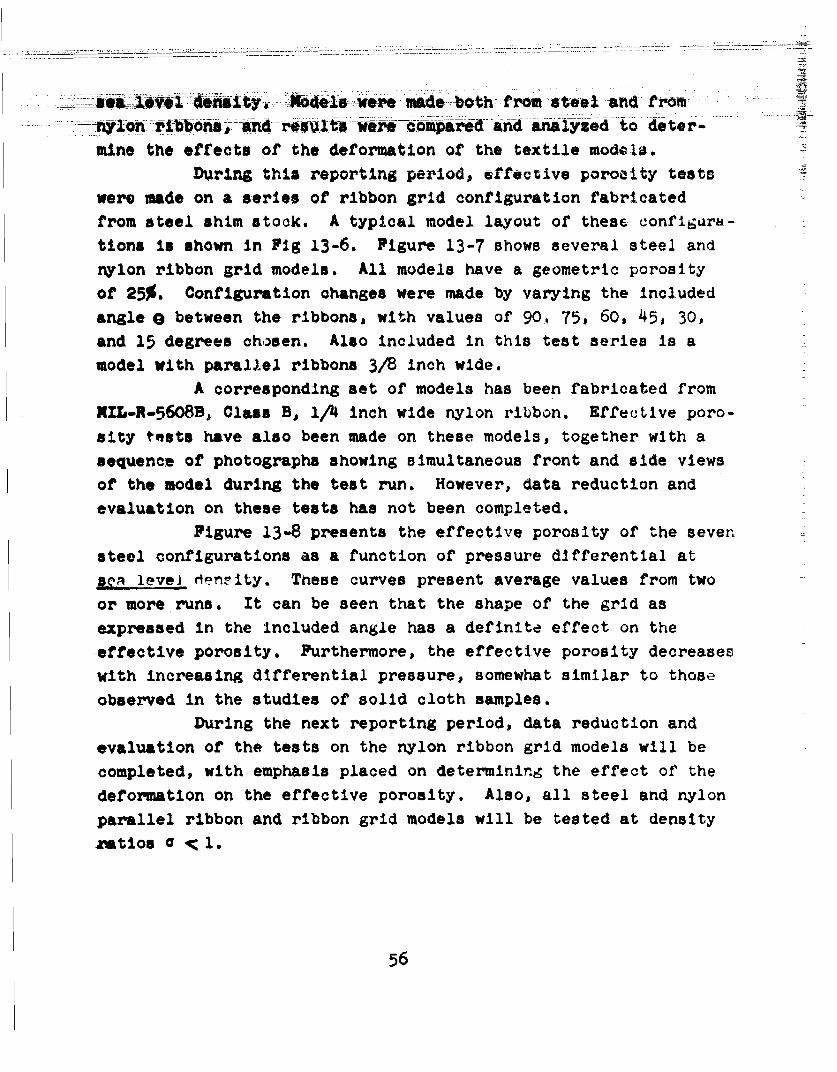
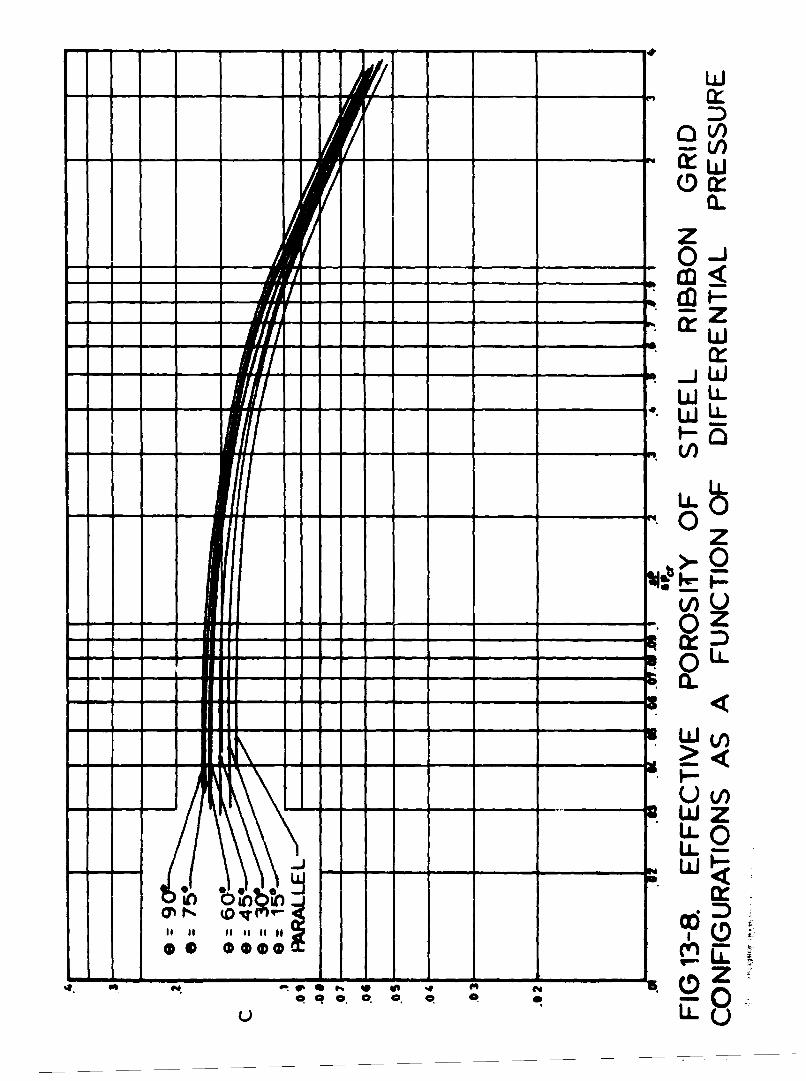
During this reporting period, effective porosity tests
were made on a series of ribbon grid configuration fabricated
from steel shim stock. A typical model layout of these configura-
tions is shown in Fig 13-6. Figure 13-7 shows several steel and
nylon ribbon grid models. All models have a geometric porosity
of 25%. Configuration changes were made by varying the included
angle e between the ribbons, with values of 90, 75, 60, 45, 30,
and 15 degrees chosen. Also included in this test series is a
model with parallel ribbons 3/8 inch wide.
A corresponding set of models has been fabricated from
NIL-R-.5•6B, Class B, 1/4 inch wide nylon ribbon. Effective poro-
sity tests have also been made on these models, together with a
sequence of photographs showing simultaneous front and side views
of the model during the test run. However, data reduction and
evaluation on these tests has not been completed.
Figure 13-8 presents the effective porosity of the seven
steel configurations as a function of pressure differential atsa level denrity. These curves present. average values from two
or more runs. It can be seen that the shape of the grid as
expressed in the included angle has a definite effect on theeffective porosity. Furthermore, the effective porosity decreases
with increasing differential pressure, somewhat similar to those
observed in the studies of solid cloth samples.During the next reporting period, data reduction and
evaluation of the tests on the nylon ribbon grid models will be
completed, with emphasis placed on determining the effect of the
deformation on the effective porosity. Also, all steel and nylon
parallel ribbon and ribbon grid models will be tested at density
Zatios a '< 1.
56
p4
0
00
E-4
105J
Cr 0.
D 3 _ _ _ _ _ _ _ _ aG_ 1~~~~4~c .0 0 .o 0,0 5 ~
MIL--702B, TPE I <0 B/2
.01 .02 .04 .06 De .10 .20~ .4 808 24FIG 13-2. EFFECTIVE POROSITY VERSUS PRESSURE RATIO
MIL-C-7020B, TYPE It 901LB/IN
1- --
0. 3
F'IG 13-4. EF'FECTIVE POROSITY VE7RSUS PRESSURE RATIOMIL-C-8021A, TYPE 1, 200 L B/I N
[-71
d, 4 -4 -4-
.03 t .
a*1-
.01. 0.4
.1 04~.62 ub .0a 10 o0 - to6' 'BojL 1FIG13-5. EFFECTIVE POROSITY VERSUS PRESSURE RAT I
MIL-C-8021A, TYPE It~ 300 LB/IN

ZjI
iE-4
oosI
-4
0 L
OW-
W.& W.
Lfl owOR C.)
r0~ 1.--
CL1
coLL
z_ _ _ _ _ _ 0-_ _ _ _ _ _ - cri
*Lf
.0 z
- 0z-~ ~ ~ ~~~~C D I-~~~~~ -- a -- - . L
LL-J _ _ _ _ LL
0 Se ~ - - -
II Ig pg ii iiad
4p 4R~ 0* 0
Project No 14
-10.0 tudy of Flow PaEtterns of Aerodynamic Declerators byMeans of the Surface Wave Analogy
10.1 IntroductionProgress Report No 19 reported the completion of the
final assembly and sealing or the water channel, the assembly
and initial testing of a shadowgraph arid Schlieren system, andthe development of a simple experimental technique for obtaining
the water depth profile around the models.
102 Present Work
S 10.2.1 Levelling and Final AlignmentThe two hydraulic jacks uaed to obtain a longitudinal
slope of the channel were adjusted until the glass channel floorwas horizontal. This was checked by ensuring the uniformity ofthe placid water depth throughout the channel using the micro-
meter depth gage as indicated In Progress Report No 19. Two
gunners' quadrants obtained from government surplus were mountedon the table near the hydraulic Jack supports and adjusted to
zero when the channel floor was horizontal. In order to set the
channel to any desired slope to correspond to the desired Froudenumber (simulating the Mach number), it is now only necessary to
set the two quadrants to the desired elevation and operate thehydraulic jacks until the level gages of the quadrants are
centered.Next, the carriage guide rails were realigned to be
parallel to the glass surface. This was done by means of anAmes dial gage mounted on the triangular stand of the micrometer
depth gage. The guide rails were adjusted to be parallel to theglass surface near the corresponding side of the table to within+0.001 inch.
62
Finally the transverse beam of the carriage was checked
for parallelism with the glass surface and adjusted by means of
shims to be within +0.005 inch.
10.2.2 Nozzle Plate StiffeningIt was observed that the 52 inch wide, 1/4 inch thick
aluminum alloy nozzle plate tended to sag near the middle. In
addition, it tended to vibrate, producing pulsations in the water
flow. These undesirable effects were greatly reduced by stiffen-
ing the nozzle plate using two 4 inch by 1 1/8 inch aluminum alloy
angle sections bolted to the nozzle plate along the centerline
and perpendicular to it near the discharge end.
10.2.3 Instrumentation
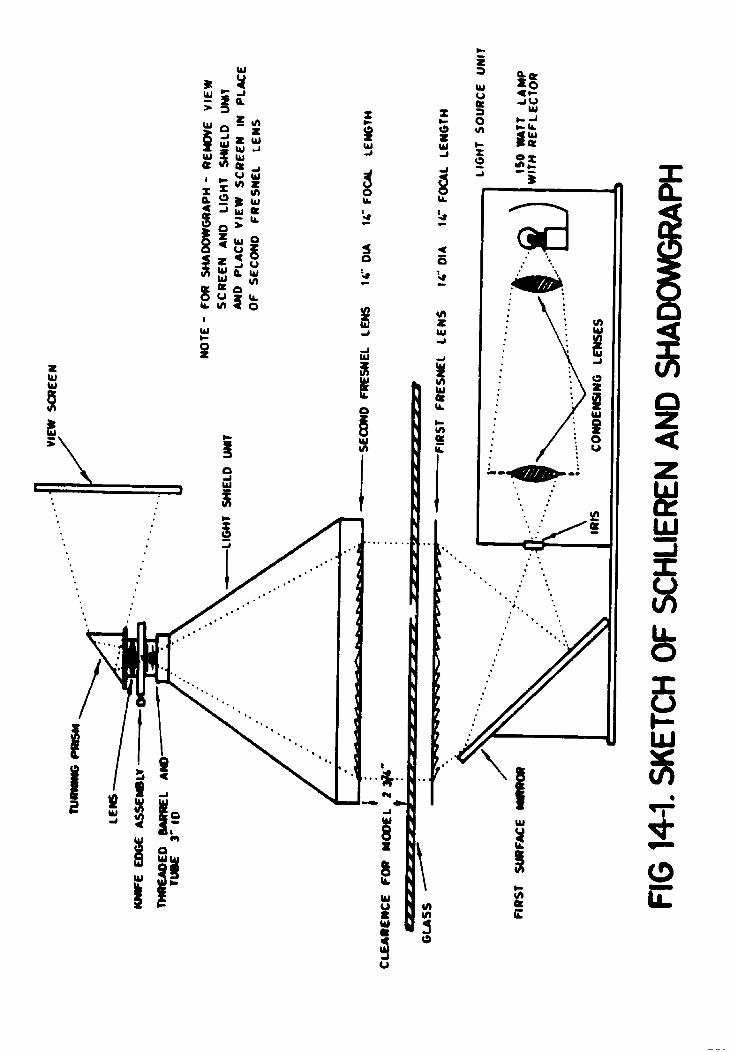
10.2.3.1 Shadowgraph System
The design of the shadowgraph system was finalized and
is shown diagrammatically in Fig 14-1. The light source unit
consists of a 150 watt slide projector lamp with attached reflector,
a condensing lens system, and an iris diaphragm; these components
are mounted inside a rectangular housing located under the glass
floor of the test section. Cooling air for the lamp is circulated
by a 3 inch motor driven fan inside the housing. The light beam
passes through the iris diaphragm and is reflected vertically
upwards by a 45* first surface mirror. A 14 inch diameter, 14 inch
focal length Fresnel lens located directly under the test section
in used to produce a parallel beam of light through the test
section. The shadowgraph image is formed on a frosted glass
screen mounted horizontally above the model, on a frame attached
to the model carriage.
This image can be viewed directly or photographed by
still or movie cameras.
10.2.3.2 Schlieren SystemThe design of the Schlieren system was integrated with
63

that of the shadowgraph to enable a quick change over from one
system to the other. As shown diagramatically in Fig 14-1, the
Sohlieren system shares the same light source, 450 mirror and
Fresnel lens located underneath the channel test section, but
the horisontal viewing screen directly above the model Is removed
and an optical assembly consisting of another Fresnel lens identi-
cal to the first one, a rotating and adjustable knife edge
assembly, lens, and turning prism are mounted in its place.
The parallel light beam through the test section is condensed
by the second Presnel lens and impinges on the knife edge, is
turned 90* by the prism and is then projected onto a frosted
glass screen mounted vertically in a frame attached to the
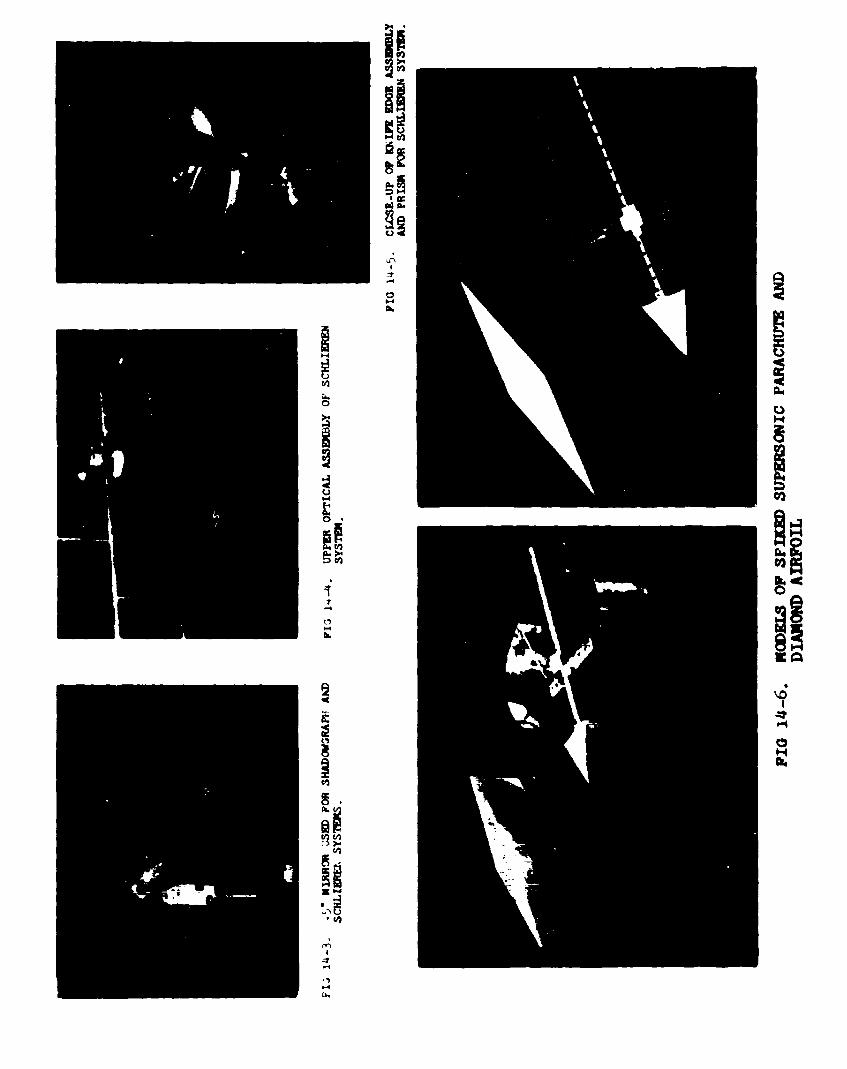
carriage. Figure 14-2 Is a photograph of the general arrange-
ment of the upper assembly of the Schlieren system, and shows
the Sohlieren image of a diamond airfoil projected on the view-
ing screen. Figures 14-3 through 14-5 show various components
of the shadowgraph and Schlieren systems; Fig 14-3 is a close-up
of the 45e mirror, Fig 14-4 shows the top unit of the Schlieren
system, and Fig 14-5 is a close-up of the knife edge and prism
assimbly. This is designed in such a way that the knife edge
can be adjusted fore and aft or rotated to any angle with respect
to the direction of flow. It is also possible to remove the
straight edge and substitute an iris diaphragm and use this as
a circular knife edge.
10.2.3.3 Water Depth Probes
Two pointed probes attached to standard I inch travel
Ames dial gages were designed for mounting on the traversing
carriages as shown in Fig 14-2. Preliminary depth measurements
with these probes indicate good repeatability.
10.2.3.4 Water Pressure ProbesPreliminary tests with a water pressure probe consisting
essentially of an impact or pitot tube connected to a micromanometer
64
I or an inclined tube manometer showed the necessity for a careful
choice of the probe dimensions. In view of the limited waterI depth and the desire to obtain a good resolution from the total
pressure probe, it is necessary to use the minimum size of head
consistent with accuracy and repeatability. Different sizes of
special thin wall brass tubing have been procured and tests to
determine suitable probe configurations will be conducted.
12.3, Water Depth Profile Around Models
Further tests with the Eosin dye technique mentioned
in the last progress report were conducted using two slightly
different experimental procedures. In the first, the dye painted
model was lowered vertically in position into the flowing water
until it made contact with the glass floor. In the second, the
model was set up in the test section prior to starting the flow
circulation. In both cases, with the Rosin Alcohol concentrations
used, the dye was quickly washed away from the immersed portionsof the model and a sharp water line obtained. Care was taken to
f use short test durations of the order of four or five seconds and
to watch for any pulsations of the water flow since the waterline obtained represented the maximum rather than the time aver-
I age water depth at that point. Further experiments may indicatethe desirability of reducing the solubility of the dye to give
I a more representative water depth distribution.
Another dye technique with the object of indicating
the range of variation of water depth at every point during the
test was tried. This method uses coloring agents which form a
very thin colored film which floats on the water surface and
adheres to solid surfaces partly immersed in it. However, tests
showed that the dye marked the stagnation point only, and separated
from the rest of the boundary surface and was quickly washed
away downstream.
65
1a Models
10 4. Calibration Model
The accurate calibration of the water channel involvesobtaining detailed water velocity traverses along and across the
test seotion and calibrating this with respect to the flow dis-
charge from the pump. Such a detailed oalibration can only be
done after completion of the pitot probes. Meanwhile, simulated
Mach numbers can be set by observing the wave angles obtained
with a specified wedge profile and by checking the water depth
by means of the micrometric depth probes. For purposes of
initial calibration, a 10 inch long, 9* half angle symmetrical
diamond profile was milled of solid aluminum alloy and polished
as shown In Fig 7-6. This calibration model will also be used
for checking the Mach number distribution in the test section
prior to the complete traversing with the total pressure probes.
1 Model of Supersonic Spiked ParachuteA model of the spiked supersonic parachute proposed in
Project No 7 and based on the configuration originally given In
Progress Report No 13, Fig 7-7, was designed and constructed as
shown in Fig 14-6. The spike is a solid aluminum alloy wedgeof 20' half angle, 2 inches long and 2 1/2 inches high. A 3/8Inch diameter, 10 inch long threaded steel rod is screwed to the
base of the wedge above the imtersed section and forms thembckbone" of the model. At 1/2 inch intervals along the steel
rod 1/8 inch diameter vertical holes are drilled to provide for
the possible attachment of needle depth probes to determine the
water depth along the centerline in the wake of the spike.A steel fitting can be screwed into the threaded 3/B
inch diameter rod and locked at any desired distance behind the
spike. It carries a transverse plexiglass plate to which can beattached by means of interchangeable bent steel rods, the curved
plates representing the canopy. The main features of the model
66
design adopted are basic simplicity and great flexibility,
enabling a quick change of the spike or canopy profile and a
wide range of settings for the inlet to outlet area ratio and
relative positioning of the canopy with respect to the spike.
Furthermore, the model design allows for the possibility of
water depth probing at practically every point of the field
of interest.
1 Proposed Work
In the next reporting period, it is proposed to conduct
a survey of the simulated flow Mach number in the test section
by means of wave angle and water depth measurement using the
diamond airfoil for calibration purposes. Simultaneously,
repeatability tests with the Eosin dye technique for depth
measurement will be carried out, and attempts to formulate a
correction for surface tension effects will be made.
After satisfactory conclusion of these tests, simulated
pressure distribution tests on the spiked supersonic parachute
model at Mach 2 will be carried out. These tests will be followed
by tests to optimize the design of total pressure probes, and
these probes together with the micrometric depth probes already
available will be used in obtaining longitudinal and transverse
velocity traverses at different sections and preparing detailed
calibration curves for the water channel.
Further improvements to the water channel and refine-
ments in the experimental technique and instrumentation, such as
the use of a reference grid in the test section and improvements
in the flow visualization system, will be introduced when
circumstances permit.
67
w U
zzw U!
ata
U w
#A Zw3 It i
Z
Zi u
0 u I
a z
wofU )
IA t1ah
hiL
fobi
w0vC

4
i0
2
C-,
ft.0
I
-4
0
It
IN
to
I4c
-v-

Project No 16
110 StZMr Analy1is of the T-1O Troop Parachute
Progress Report No 18 presented an analytical metho,.
for obtaining the stress distribution over a fully inflated
Scanopy in s teady descent . The m ethod was applied spe cl fic a ll:.
= to the T-lO extended skirt troop parachute, but was general
enough so that it could be applied to other types of parachut,.
with only minor modifications.
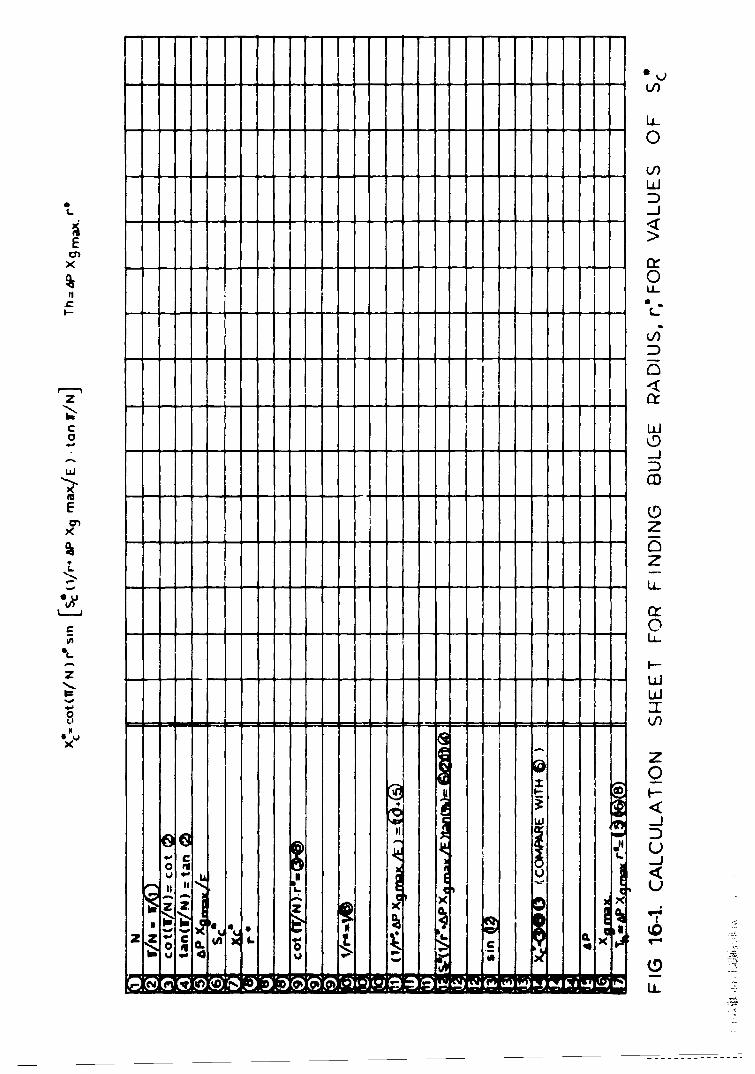
Three minor errors have been detected in the method
presented in Progress Report No 18. In the definition of terL,,,
the modulus of elasticity, E, was defined dimensionally aslb/ft 2 . This should be lb/ft. Secondly, Fig 16-8 presented
a tabulation sheet for finding values of the bulge radius byuse of Eqn (16.15a). The equation was incorrectly given on tWs
tabulation sheet, and a corrected tabulation sheet is presente-here in Fig 16-1. Also, in Fig 16-10 of Progress Report No it.the decimal points in the ordinate axis for r* were left out.This should be corrected so that r* ranges from 0 to 0.40.
Efforts are being made to refine the above analytica4method for finding stress on a fully inflated canopy. Somesimplifications in the use of the theory for finding actualnumerical values of stress appear to be possible, but these ar
not fully developed; these simplifications will be presented in
future progress reports. Also, efforts are being made to exter,,
the theory to the more complex case of finding the stress over
an opening canopy. These efforts will be continued during the
next period.
71
0
LL
E>x - -)f-
z0ii LLJ
-Co
(D
z cr
z
10
F-
zz
-wwx0 (L A
I.L
-- -- -- -- --
APPENDIX
The authors of this report who are listed on theA front page wish to acknowledge the accomplishments and assistance
4 of the following personnel:
Clerical Staff:
E. Zembergs, Sr. Engineering AssistantBeverly M. Broers, Secretary
Graduate Students:
R. 0. Bailey, Research AssistantD. J. Eckstrom, Research AssistantS. R. Hess, Research AssistantE. M. Linhart, Research AssistantD. J. Monson, Research AssistantL. W. Rust, Research Fellow
q Undergraduate Students:B Albrecht, Engineering Assistant
J; Baker,1 Engineering AssistantJ. W. Bushard, Engineering AssistantJ. M. Carlson, Engineering AssistantD. F. Coleman, Engineering AssistantD. D. Evenson, Engineering AssistantR. W. Friestad, Engineering AssistantK. J. Goar, Engineering AssistantL. R. Jamison, Engineering AssistantJ. M. Johnson, Engineering AssistantH. R. Kokal, Engineering AssistantH. M. Lippa, Engineering AssistantD. A. MacLean, Engineering AssistantD. E. McGee, Engineering AssistantW. R. Mueller, Engineering AssistantT. C. Nietz, Engineering Assistant"E. H. Nierengarten, Engineering AssistantD. R. Nordwall, Engineering AssistantD. Pekarek, Engineering AssistantR. 0. Strom, Engineering AssistantL. M. Timmons, Engineering AssistantB. J. Williams, Engineering Assistant
Machine Shop Personnel:
J. Taube, Laboratory MachinistP, A. Huehnert, Wind Tunnel Mechanic
73