department budgets - bridgeport...fy2018-2019 adopted general fund budget city council budget...
TRANSCRIPT
FY 2018-2019 ADOPTED GENERAL FUND BUDGET
CITY OF BRIDGEPORT, CONNECTICUT
MAYOR’S ADOPTED BUDGET for FISCAL YEAR JULY 1, 2018 to JUNE 30, 2019
TABLE OF CONTENTS 1 ACKNOWLEDGEMENTS 5 GFOA LETTER 7 BUDGET MESSAGE 9 BUDGET AMENDMENT RESOLUTION 13 ORGANIZATION CHART 29
BUDGET SUMMARY Accounting Policies 31 Fund Balance Policy 34 Fund Structure 35 Budget Process 41 General Fund by Agency / Type 43 Revenue Summary 44 Personnel Summary 46 Appropriation Category Descriptions 50 Tax Rate Determination 51
BRIDGEPORT AT A GLANCE/IN CONTEXT 54 Community Profile 55 Tax Revenues by Source 2008-2017 57 Population 59 Peer Indicators 60
DIVISION SUMMARIES General Government Divisions 69 Public Safety Divisions 75 Public Facilities 79 Economic Development Divisions 87 Health Divisions 93 Library 99 Board of Education 103
DEPARTMENT BUDGETS Office of the Mayor 105 Central Grants 113
FINANCE DIVISIONS Comptroller’s Office 117 Finance Administration 121 Print Shop 125 Purchasing 129
1
FY 2018-2019 ADOPTED GENERAL FUND BUDGET
CITY OF BRIDGEPORT, CONNECTICUT
Tax Collector 133 Tax Assessor 139 Treasury 145
GENERAL GOVERNMENT Registrar of Voters 149 City Clerk 155 City Attorney 159 Archives & Records 167 Civil Service 171 Grants Personnel / Benefits Administration 177 Labor Relations 183 Pensions / Other Employee Benefits 189 Town Clerk 191 Legislative Department 195 Office of Policy & Management 197 Chief Administrative Office 201 Information Technology Services 205 Small & Minority Business Resource Office 211
PUBLIC SAFETY Police Department / Animal Control 215 Fire Department 229 Weights & Measures 247 Emergency Communications & Operations Center 249
PUBLIC FACILITIES Public Facilities Administration 255 Municipal Garage 263 Facilities Maintenance 271 Roadway Maintenance 285 Sanitation & Recycling 293 Transfer Station 301 D. Fairchild Wheeler Golf Course 307 Beardsley Zoo / Carousel 313 Recreation 321 Department on Aging 329 Parks Administration 335 Parks Maintenance 343 Sikorsky Memorial Airport 347 City Engineering 353 Harbor Master 361
PLANNING & ECONOMIC DEVELOPMENT Office of Planning & Economic Development 367 Building Department 375 Zoning Board of Appeals 381 Zoning Commission 385
2
FY 2018-2019 ADOPTED GENERAL FUND BUDGET
CITY OF BRIDGEPORT, CONNECTICUT
HEALTH & SOCIAL SERVICES Health Administration 391 Vital Statistics 397 Communicable Clinic 403 Environmental Health 409 Housing Code 415 Lead Prevention Program 421 Human Services 427 Persons with Disabilities 431 Veterans’ Affairs 435 Lighthouse / After School Program 439 Social Services 445
NON-DEPARTMENTAL ACCOUNTS Debt Service 451 Other Financing 457 Supportive Contributions / Memberships 459
LIBRARIES Bridgeport Public Library 461
BOARD OF EDUCATION Schools 469 Food Services 479 BOE Debt Service 481
APPENDIX 483 493
REVENUE DETAIL CAPITAL POLICY CAPITAL BUDGETTHREE YEAR COMPARATIVES 523FUND BALANCE 527GLOSSARY 531
500
3

FY 2018-2019 ADOPTED GENERAL FUND BUDGET
CITY OF BRIDGEPORT, CONNECTICUT
This page left blank intentionally.
4
SE
AL
OF
TH
E C
ITY O
F BRIDGEPORT, CO
NN
EC
TIC
UT
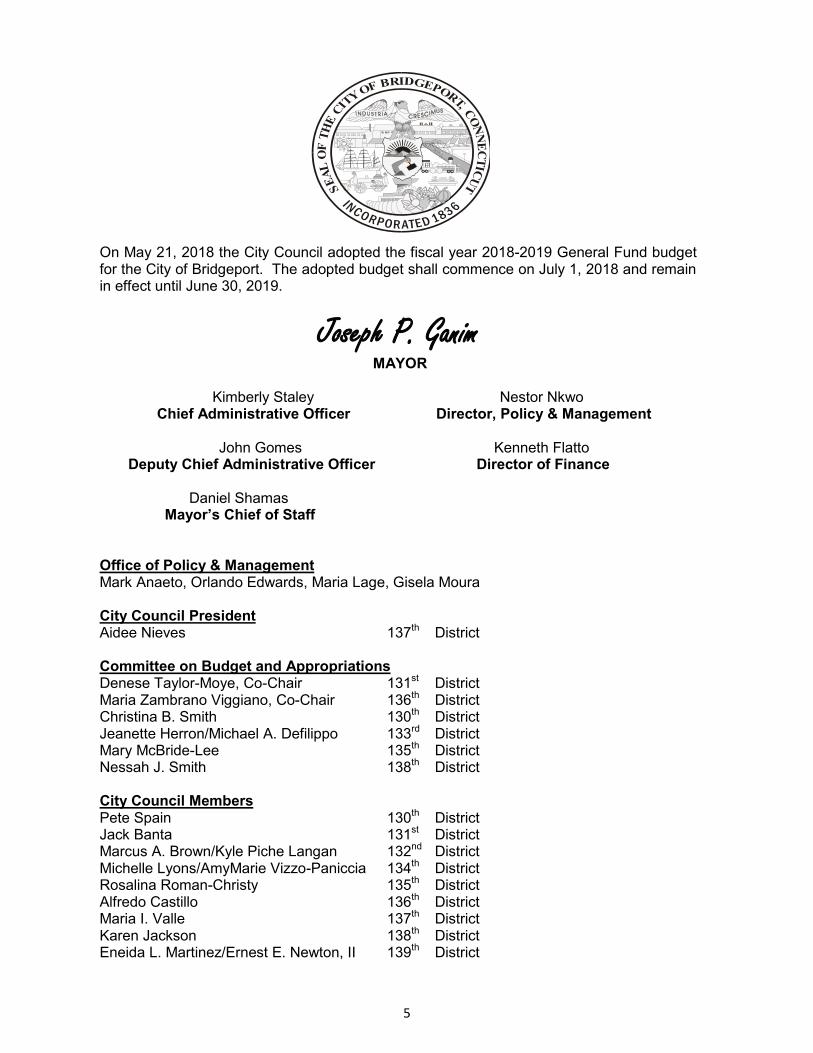
On May 21, 2018 the City Council adopted the fiscal year 2018-2019 General Fund budget for the City of Bridgeport. The adopted budget shall commence on July 1, 2018 and remain in effect until June 30, 2019.
Joseph P. Ganim MAYOR
Kimberly Staley Nestor Nkwo Chief Administrative Officer Director, Policy & Management
John Gomes Kenneth Flatto Deputy Chief Administrative Officer Director of Finance
Daniel Shamas Mayor’s Chief of Staff
Office of Policy & Management Mark Anaeto, Orlando Edwards, Maria Lage, Gisela Moura
City Council President Aidee Nieves 137th District
Committee on Budget and Appropriations Denese Taylor-Moye, Co-Chair 131st District Maria Zambrano Viggiano, Co-Chair 136th District Christina B. Smith 130th District Jeanette Herron/Michael A. Defilippo 133rd District Mary McBride-Lee 135th District Nessah J. Smith 138th District
City Council Members Pete Spain 130th District Jack Banta 131st District Marcus A. Brown/Kyle Piche Langan 132nd District Michelle Lyons/AmyMarie Vizzo-Paniccia 134th District Rosalina Roman-Christy 135th District Alfredo Castillo 136th District Maria I. Valle 137th District Karen Jackson 138th District Eneida L. Martinez/Ernest E. Newton, II 139th District
5
Thanks to the following agencies and departments that participated in the budget process:
Office of the City Clerk Department of Finance
City of Bridgeport Department Heads City of Bridgeport Print Shop
SE
AL
OF
TH
E C
ITY O
F BRIDGEPOR
T, CO
NN
EC
TIC
UT
6
FY2018-2019 ADOPTED GENERAL FUND BUDGET GFOA BUDGET AWARD
CITY OF BRIDGEPORT, CONNECTICUT
The Government Finance Officers Association of the United States and Canada (GFOA) presented a Distinguished Budget Presentation Award to the City of Bridgeport, Connecticut for the Annual Budget beginning July 01, 2017. In order to receive this award, a governmental unit must publish a budget document that meets program criteria as a policy document, as an operating guide, as a financial plan, and as a communication device. This award is valid for a period of one year only. We believe our current budget continues to conform to program requirements, and we will be submitting it to GFOA to determine its eligibility for another award this year.
7
FY 2018-2019 ADOPTED GENERAL FUND BUDGET
CITY OF BRIDGEPORT, CONNECTICUT
This page left blank intentionally.
8
FY 2018-2019 ADOPTED GENERAL FUND BUDGET
CITY OF BRIDGEPORT, CONNECTICUT
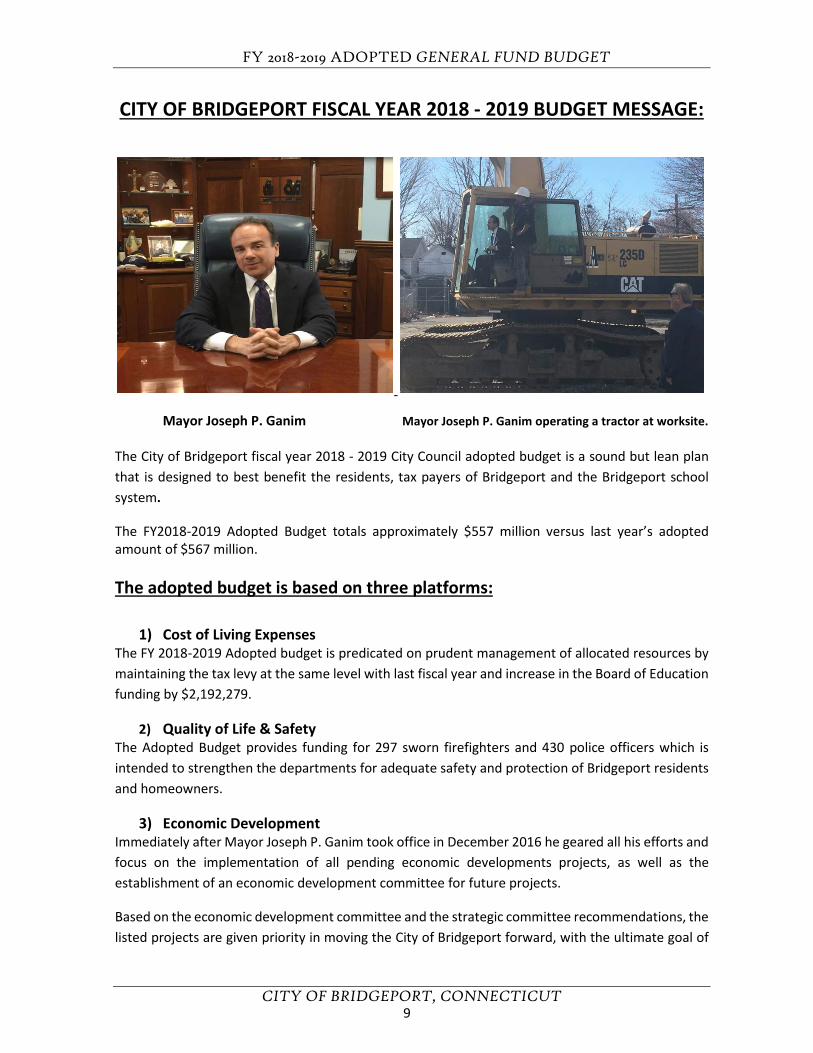
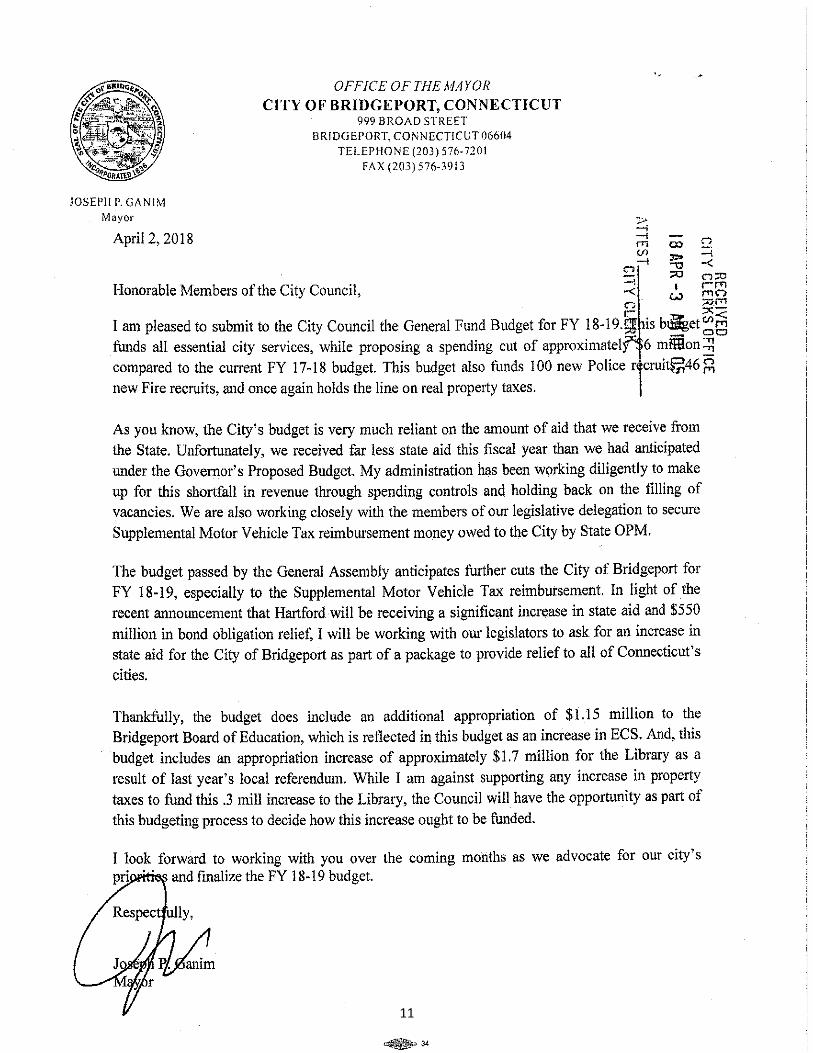
CITY OF BRIDGEPORT FISCAL YEAR 2018 - 2019 BUDGET MESSAGE:
Mayor Joseph P. Ganim Mayor Joseph P. Ganim operating a tractor at worksite.
The City of Bridgeport fiscal year 2018 - 2019 City Council adopted budget is a sound but lean plan that is designed to best benefit the residents, tax payers of Bridgeport and the Bridgeport school system.
The FY2018-2019 Adopted Budget totals approximately $557 million versus last year’s adopted amount of $567 million.
The adopted budget is based on three platforms:
1) Cost of Living ExpensesThe FY 2018-2019 Adopted budget is predicated on prudent management of allocated resources by maintaining the tax levy at the same level with last fiscal year and increase in the Board of Education funding by $2,192,279.
2) Quality of Life & SafetyThe Adopted Budget provides funding for 297 sworn firefighters and 430 police officers which is intended to strengthen the departments for adequate safety and protection of Bridgeport residents and homeowners.
3) Economic DevelopmentImmediately after Mayor Joseph P. Ganim took office in December 2016 he geared all his efforts and focus on the implementation of all pending economic developments projects, as well as the establishment of an economic development committee for future projects.
Based on the economic development committee and the strategic committee recommendations, the listed projects are given priority in moving the City of Bridgeport forward, with the ultimate goal of
9
FY 2018-2019 ADOPTED GENERAL FUND BUDGET
CITY OF BRIDGEPORT, CONNECTICUT
increasing the taxable Grand List and reduce taxes in years to come. The City’s five-year Capital budget supports these economic development projects (see page 501).
10
11

FY 2018-2019 ADOPTED GENERAL FUND BUDGET
CITY OF BRIDGEPORT, CONNECTICUT
This page left blank intentionally.
12
FY2018-2019 ADOPTED GENERAL FUND BUDGET CITY COUNCIL BUDGET AMENDMENT RESOLUTION
CITY OF BRIDGEPORT, CONNECTICUT
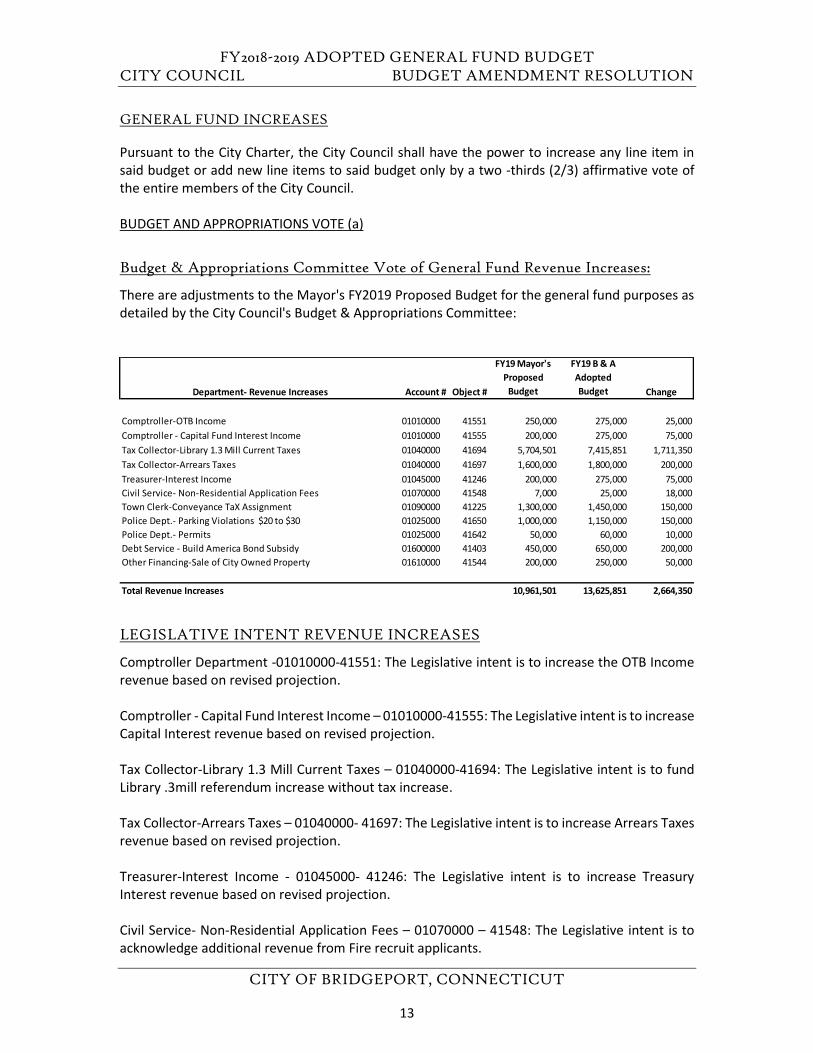
GENERAL FUND INCREASES
Pursuant to the City Charter, the City Council shall have the power to increase any line item in said budget or add new line items to said budget only by a two -thirds (2/3) affirmative vote of the entire members of the City Council.
BUDGET AND APPROPRIATIONS VOTE (a)
Budget & Appropriations Committee Vote of General Fund Revenue Increases:
There are adjustments to the Mayor's FY2019 Proposed Budget for the general fund purposes as detailed by the City Council's Budget & Appropriations Committee:
LEGISLATIVE INTENT REVENUE INCREASES
Comptroller Department -01010000-41551: The Legislative intent is to increase the OTB Income revenue based on revised projection.
Comptroller - Capital Fund Interest Income – 01010000-41555: The Legislative intent is to increase Capital Interest revenue based on revised projection.
Tax Collector-Library 1.3 Mill Current Taxes – 01040000-41694: The Legislative intent is to fund Library .3mill referendum increase without tax increase.
Tax Collector-Arrears Taxes – 01040000- 41697: The Legislative intent is to increase Arrears Taxes revenue based on revised projection.
Treasurer-Interest Income - 01045000- 41246: The Legislative intent is to increase Treasury Interest revenue based on revised projection.
Civil Service- Non-Residential Application Fees – 01070000 – 41548: The Legislative intent is to acknowledge additional revenue from Fire recruit applicants.
Department- Revenue Increases Account # Object #
FY19 Mayor's
Proposed
Budget
FY19 B & A
Adopted
Budget Change
Comptroller-OTB Income 01010000 41551 250,000 275,000 25,000Comptroller - Capital Fund Interest Income 01010000 41555 200,000 275,000 75,000Tax Collector-Library 1.3 Mill Current Taxes 01040000 41694 5,704,501 7,415,851 1,711,350Tax Collector-Arrears Taxes 01040000 41697 1,600,000 1,800,000 200,000Treasurer-Interest Income 01045000 41246 200,000 275,000 75,000Civil Service- Non-Residential Application Fees 01070000 41548 7,000 25,000 18,000Town Clerk-Conveyance TaX Assignment 01090000 41225 1,300,000 1,450,000 150,000Police Dept.- Parking Violations $20 to $30 01025000 41650 1,000,000 1,150,000 150,000Police Dept.- Permits 01025000 41642 50,000 60,000 10,000Debt Service - Build America Bond Subsidy 01600000 41403 450,000 650,000 200,000Other Financing-Sale of City Owned Property 01610000 41544 200,000 250,000 50,000
Total Revenue Increases 10,961,501 13,625,851 2,664,350
13
FY2018-2019 ADOPTED GENERAL FUND BUDGET CITY COUNCIL BUDGET AMENDMENT RESOLUTION
CITY OF BRIDGEPORT, CONNECTICUT
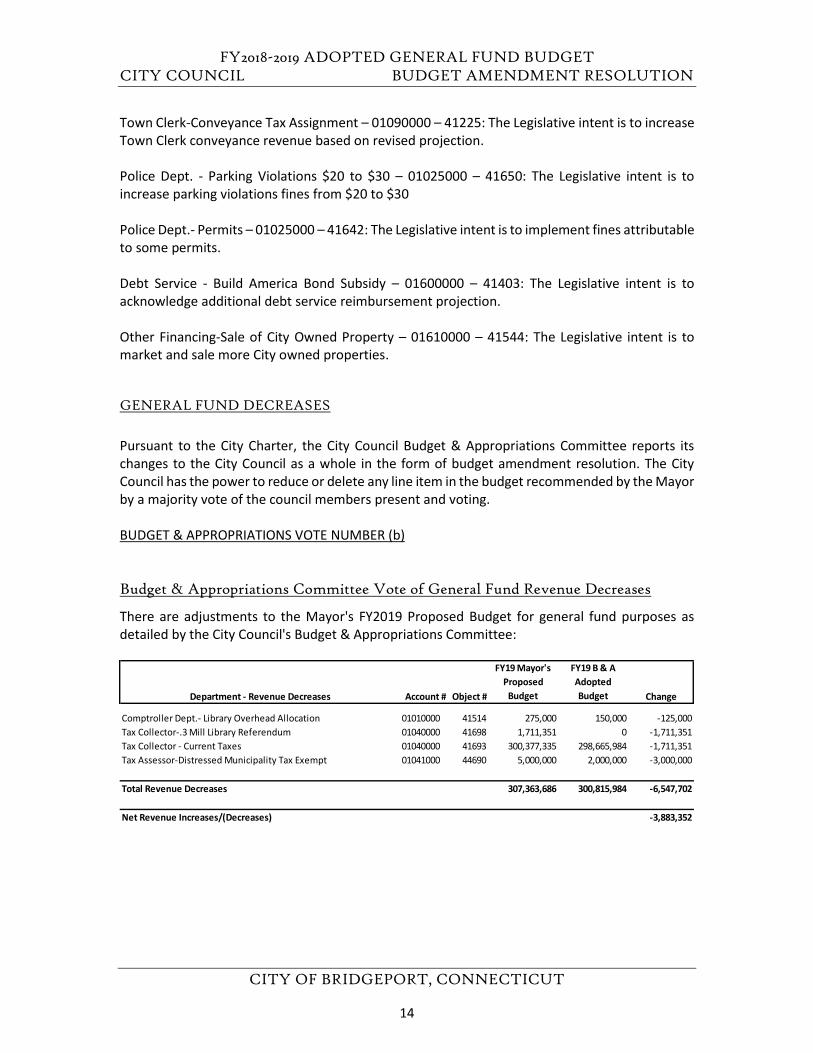
Town Clerk-Conveyance Tax Assignment – 01090000 – 41225: The Legislative intent is to increase Town Clerk conveyance revenue based on revised projection.
Police Dept. - Parking Violations $20 to $30 – 01025000 – 41650: The Legislative intent is to increase parking violations fines from $20 to $30
Police Dept.- Permits – 01025000 – 41642: The Legislative intent is to implement fines attributable to some permits.
Debt Service - Build America Bond Subsidy – 01600000 – 41403: The Legislative intent is to acknowledge additional debt service reimbursement projection.
Other Financing-Sale of City Owned Property – 01610000 – 41544: The Legislative intent is to market and sale more City owned properties.
GENERAL FUND DECREASES
Pursuant to the City Charter, the City Council Budget & Appropriations Committee reports its changes to the City Council as a whole in the form of budget amendment resolution. The City Council has the power to reduce or delete any line item in the budget recommended by the Mayor by a majority vote of the council members present and voting.
BUDGET & APPROPRIATIONS VOTE NUMBER (b)
Budget & Appropriations Committee Vote of General Fund Revenue Decreases
There are adjustments to the Mayor's FY2019 Proposed Budget for general fund purposes as detailed by the City Council's Budget & Appropriations Committee:
Department - Revenue Decreases Account # Object #
FY19 Mayor's
Proposed
Budget
FY19 B & A
Adopted
Budget Change
Comptroller Dept.- Library Overhead Allocation 01010000 41514 275,000 150,000 -125,000Tax Collector-.3 Mill Library Referendum 01040000 41698 1,711,351 0 -1,711,351Tax Collector - Current Taxes 01040000 41693 300,377,335 298,665,984 -1,711,351Tax Assessor-Distressed Municipality Tax Exempt 01041000 44690 5,000,000 2,000,000 -3,000,000
Total Revenue Decreases 307,363,686 300,815,984 -6,547,702
Net Revenue Increases/(Decreases) -3,883,352
14
FY2018-2019 ADOPTED GENERAL FUND BUDGET CITY COUNCIL BUDGET AMENDMENT RESOLUTION
CITY OF BRIDGEPORT, CONNECTICUT
LEGISLATIVE INTENT REVENUE DECREASES
Comptroller Dept.- Library Overhead Allocation – 01010000 – 41514: The Legislative intent is to reduce Library Department Overhead allocation charge
Tax Collector-.3 Mill Library Referendum – 01040000 – 41698: The Legislative intent is not to fund Library Department referendum through taxation.
Tax Collector - Current Taxes – 01040000 – 41693: Legislative intent is to fund .3 mill Library referendum increase without tax increase.
Tax Assessor-Distressed Municipality Tax Exempt – 01041000 – 44690: The Legislative intent is to reduce City reliance on unallocated State Aid
GENERAL FUND INCREASES
Pursuant to the City Charter, the City Council shall have the power to increase any line item in said budget or add line items to said budget only on a two-thirds (2/3) affirmative vote of the entire membership of the Council.
BUDGET AND APPROPRIATIONS VOTE (c)
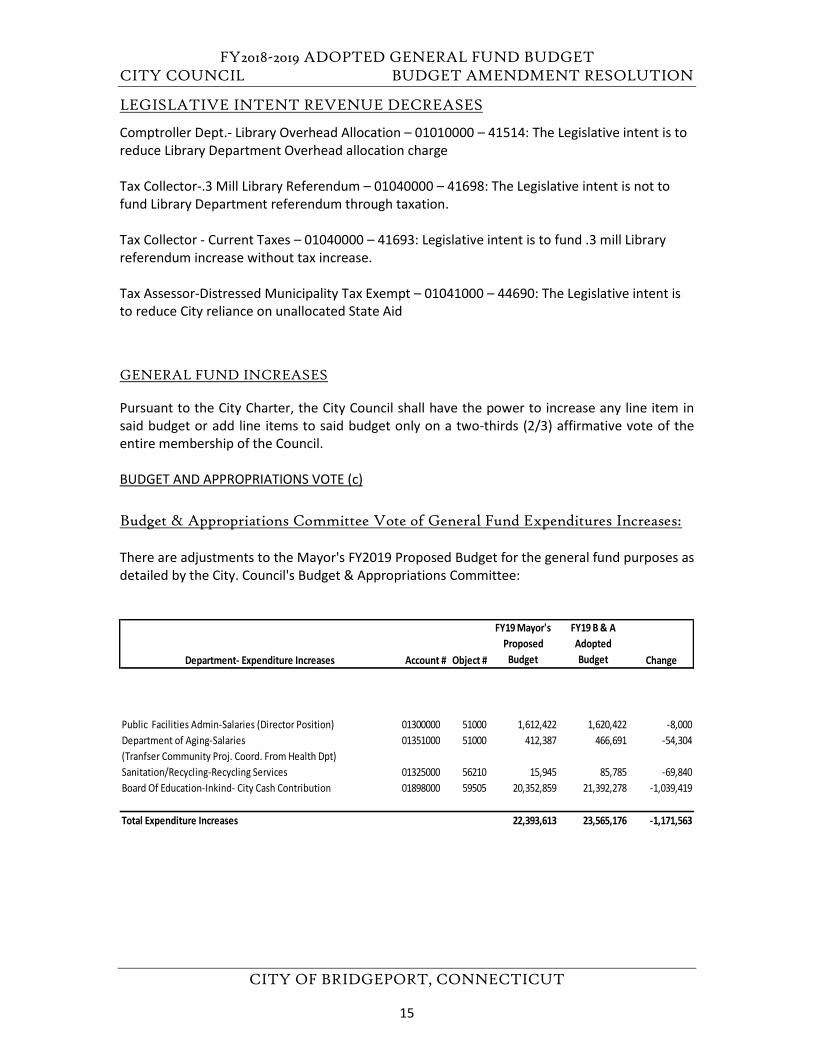
Budget & Appropriations Committee Vote of General Fund Expenditures Increases:
There are adjustments to the Mayor's FY2019 Proposed Budget for the general fund purposes as detailed by the City. Council's Budget & Appropriations Committee:
Department- Expenditure Increases Account # Object #
FY19 Mayor's
Proposed
Budget
FY19 B & A
Adopted
Budget Change
Public Facilities Admin-Salaries (Director Position) 01300000 51000 1,612,422 1,620,422 -8,000Department of Aging-Salaries 01351000 51000 412,387 466,691 -54,304(Tranfser Community Proj. Coord. From Health Dpt)Sanitation/Recycling-Recycling Services 01325000 56210 15,945 85,785 -69,840Board Of Education-Inkind- City Cash Contribution 01898000 59505 20,352,859 21,392,278 -1,039,419
Total Expenditure Increases 22,393,613 23,565,176 -1,171,563
15
FY2018-2019 ADOPTED GENERAL FUND BUDGET CITY COUNCIL BUDGET AMENDMENT RESOLUTION
CITY OF BRIDGEPORT, CONNECTICUT
LEGISLATIVE INTENT APPROPRIATION INCREASES
Public Facilities Admin-Salaries (Director Position) – 01300000 – 51000: The Legislative intent in to increase the Director of Public Facilities salary by $8,000.
Department of Aging-Salaries (Transfer Community Proj. Coord. From Health Dept) – 01351000 – 51000: The Legislative intent in to transfer Project Manager from Health Dpt. To Department of Aging
Sanitation/Recycling-Recycling Services – 01325000 – 56210: The Legislative Intent is to recognize the new cost associated with Recycling tonnages.
Board of Education-In-kind - City Cash Contribution – 01898000 – 59505: The Legislative intent is to allocate additional $1,039,419 to Board of Education in FY19.
16
FY2018-2019 ADOPTED GENERAL FUND BUDGET CITY COUNCIL BUDGET AMENDMENT RESOLUTION
CITY OF BRIDGEPORT, CONNECTICUT
GENERAL FUND DECREASES
Pursuant to the City Charter, the City Council Budget & Appropriations Committee reports its changes to the City Council as a whole in the form of budget amendments resolution. The City Council has the power to reduce or delete any line item in the budget recommended by the Mayor by a majority vote of the Council members present and voting.
BUDGET & APPROPRIATIONS COMMITTEE VOTE (d)
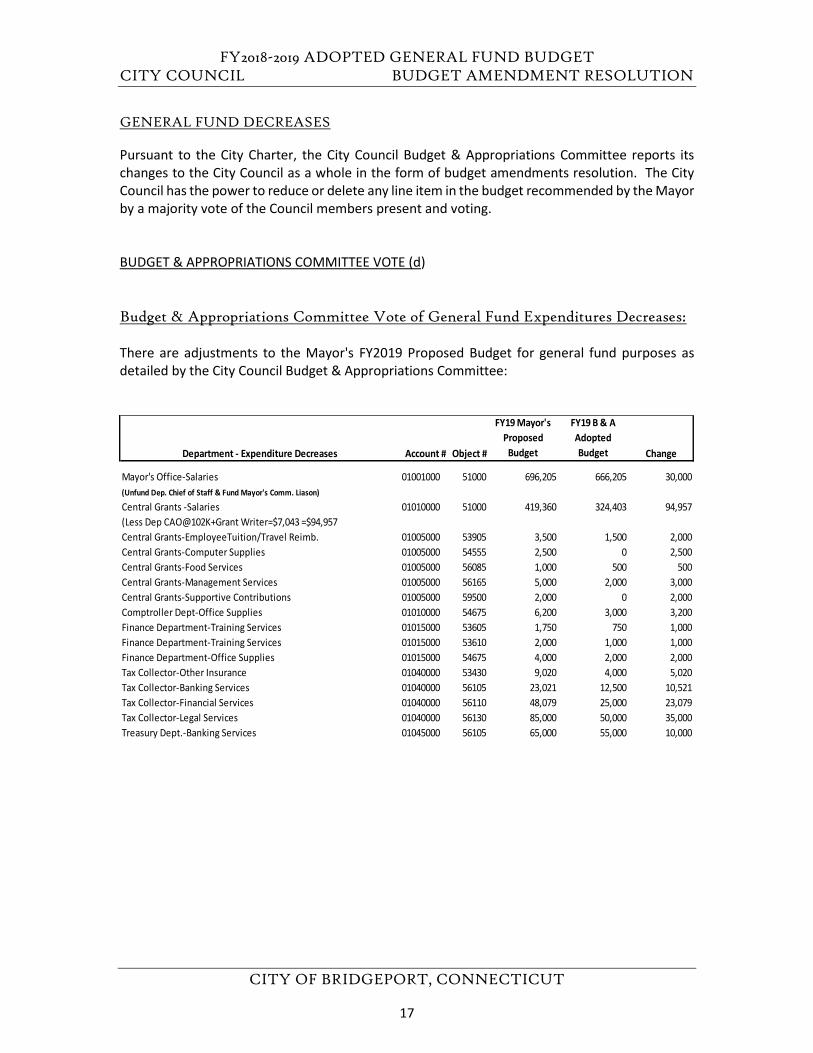
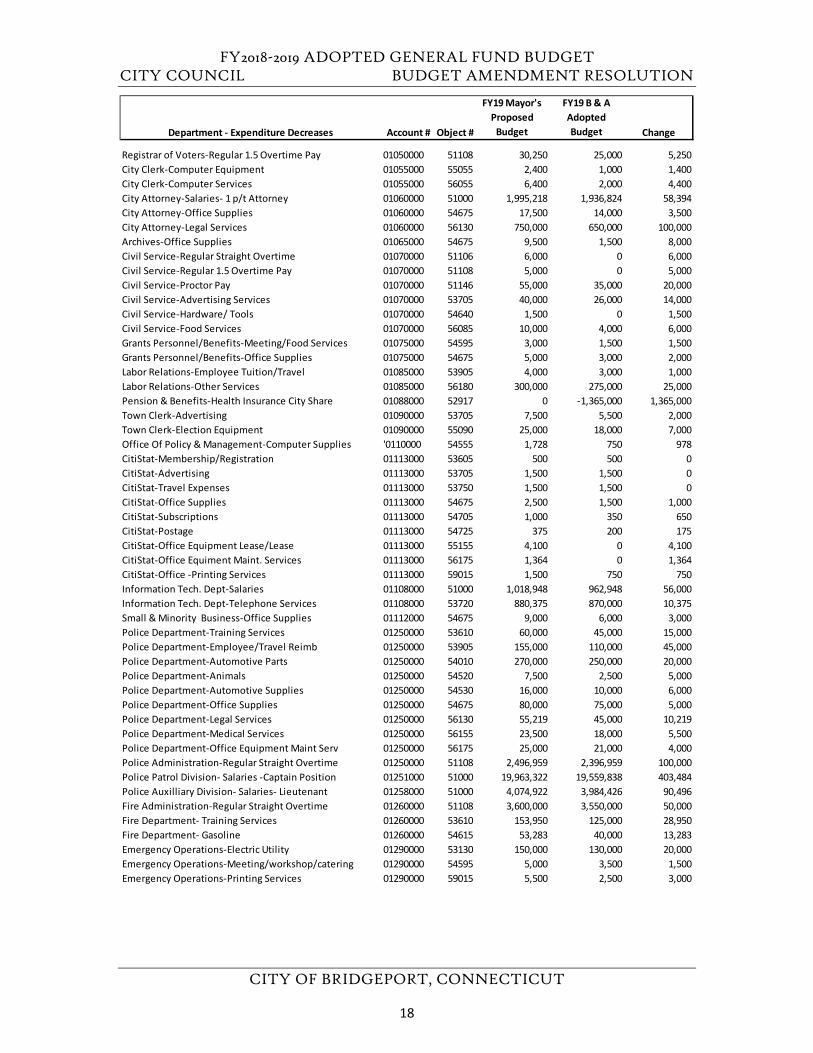
Budget & Appropriations Committee Vote of General Fund Expenditures Decreases:
There are adjustments to the Mayor's FY2019 Proposed Budget for general fund purposes as detailed by the City Council Budget & Appropriations Committee:
Department - Expenditure Decreases Account # Object #
FY19 Mayor's
Proposed
Budget
FY19 B & A
Adopted
Budget Change
Mayor's Office-Salaries 01001000 51000 696,205 666,205 30,000(Unfund Dep. Chief of Staff & Fund Mayor's Comm. Liason)
Central Grants -Salaries 01010000 51000 419,360 324,403 94,957(Less Dep CAO@102K+Grant Writer=$7,043 =$94,957Central Grants-EmployeeTuition/Travel Reimb. 01005000 53905 3,500 1,500 2,000Central Grants-Computer Supplies 01005000 54555 2,500 0 2,500Central Grants-Food Services 01005000 56085 1,000 500 500Central Grants-Management Services 01005000 56165 5,000 2,000 3,000Central Grants-Supportive Contributions 01005000 59500 2,000 0 2,000Comptroller Dept-Office Supplies 01010000 54675 6,200 3,000 3,200Finance Department-Training Services 01015000 53605 1,750 750 1,000Finance Department-Training Services 01015000 53610 2,000 1,000 1,000Finance Department-Office Supplies 01015000 54675 4,000 2,000 2,000Tax Collector-Other Insurance 01040000 53430 9,020 4,000 5,020Tax Collector-Banking Services 01040000 56105 23,021 12,500 10,521Tax Collector-Financial Services 01040000 56110 48,079 25,000 23,079Tax Collector-Legal Services 01040000 56130 85,000 50,000 35,000Treasury Dept.-Banking Services 01045000 56105 65,000 55,000 10,000
17
FY2018-2019 ADOPTED GENERAL FUND BUDGET CITY COUNCIL BUDGET AMENDMENT RESOLUTION
CITY OF BRIDGEPORT, CONNECTICUT
Department - Expenditure Decreases Account # Object #
FY19 Mayor's Proposed
Budget
FY19 B & A Adopted Budget Change
Registrar of Voters-Regular 1.5 Overtime Pay 01050000 51108 30,250 25,000 5,250City Clerk-Computer Equipment 01055000 55055 2,400 1,000 1,400City Clerk-Computer Services 01055000 56055 6,400 2,000 4,400City Attorney-Salaries- 1 p/t Attorney 01060000 51000 1,995,218 1,936,824 58,394City Attorney-Office Supplies 01060000 54675 17,500 14,000 3,500City Attorney-Legal Services 01060000 56130 750,000 650,000 100,000Archives-Office Supplies 01065000 54675 9,500 1,500 8,000Civil Service-Regular Straight Overtime 01070000 51106 6,000 0 6,000Civil Service-Regular 1.5 Overtime Pay 01070000 51108 5,000 0 5,000Civil Service-Proctor Pay 01070000 51146 55,000 35,000 20,000Civil Service-Advertising Services 01070000 53705 40,000 26,000 14,000Civil Service-Hardware/ Tools 01070000 54640 1,500 0 1,500Civil Service-Food Services 01070000 56085 10,000 4,000 6,000Grants Personnel/Benefits-Meeting/Food Services 01075000 54595 3,000 1,500 1,500Grants Personnel/Benefits-Office Supplies 01075000 54675 5,000 3,000 2,000Labor Relations-Employee Tuition/Travel 01085000 53905 4,000 3,000 1,000Labor Relations-Other Services 01085000 56180 300,000 275,000 25,000Pension & Benefits-Health Insurance City Share 01088000 52917 0 -1,365,000 1,365,000Town Clerk-Advertising 01090000 53705 7,500 5,500 2,000Town Clerk-Election Equipment 01090000 55090 25,000 18,000 7,000Office Of Policy & Management-Computer Supplies '0110000 54555 1,728 750 978CitiStat-Membership/Registration 01113000 53605 500 500 0CitiStat-Advertising 01113000 53705 1,500 1,500 0CitiStat-Travel Expenses 01113000 53750 1,500 1,500 0CitiStat-Office Supplies 01113000 54675 2,500 1,500 1,000CitiStat-Subscriptions 01113000 54705 1,000 350 650CitiStat-Postage 01113000 54725 375 200 175CitiStat-Office Equipment Lease/Lease 01113000 55155 4,100 0 4,100CitiStat-Office Equiment Maint. Services 01113000 56175 1,364 0 1,364CitiStat-Office -Printing Services 01113000 59015 1,500 750 750Information Tech. Dept-Salaries 01108000 51000 1,018,948 962,948 56,000Information Tech. Dept-Telephone Services 01108000 53720 880,375 870,000 10,375Small & Minority Business-Office Supplies 01112000 54675 9,000 6,000 3,000Police Department-Training Services 01250000 53610 60,000 45,000 15,000Police Department-Employee/Travel Reimb 01250000 53905 155,000 110,000 45,000Police Department-Automotive Parts 01250000 54010 270,000 250,000 20,000Police Department-Animals 01250000 54520 7,500 2,500 5,000Police Department-Automotive Supplies 01250000 54530 16,000 10,000 6,000Police Department-Office Supplies 01250000 54675 80,000 75,000 5,000Police Department-Legal Services 01250000 56130 55,219 45,000 10,219Police Department-Medical Services 01250000 56155 23,500 18,000 5,500Police Department-Office Equipment Maint Serv 01250000 56175 25,000 21,000 4,000Police Administration-Regular Straight Overtime 01250000 51108 2,496,959 2,396,959 100,000Police Patrol Division- Salaries -Captain Position 01251000 51000 19,963,322 19,559,838 403,484Police Auxilliary Division- Salaries- Lieutenant 01258000 51000 4,074,922 3,984,426 90,496Fire Administration-Regular Straight Overtime 01260000 51108 3,600,000 3,550,000 50,000Fire Department- Training Services 01260000 53610 153,950 125,000 28,950Fire Department- Gasoline 01260000 54615 53,283 40,000 13,283Emergency Operations-Electric Utility 01290000 53130 150,000 130,000 20,000Emergency Operations-Meeting/workshop/catering 01290000 54595 5,000 3,500 1,500Emergency Operations-Printing Services 01290000 59015 5,500 2,500 3,000
18
FY2018-2019 ADOPTED GENERAL FUND BUDGET CITY COUNCIL BUDGET AMENDMENT RESOLUTION
CITY OF BRIDGEPORT, CONNECTICUT
Department - Expenditure Decreases Account # Object #
FY19 Mayor's Proposed
Budget
FY19 B & A Adopted Budget Change
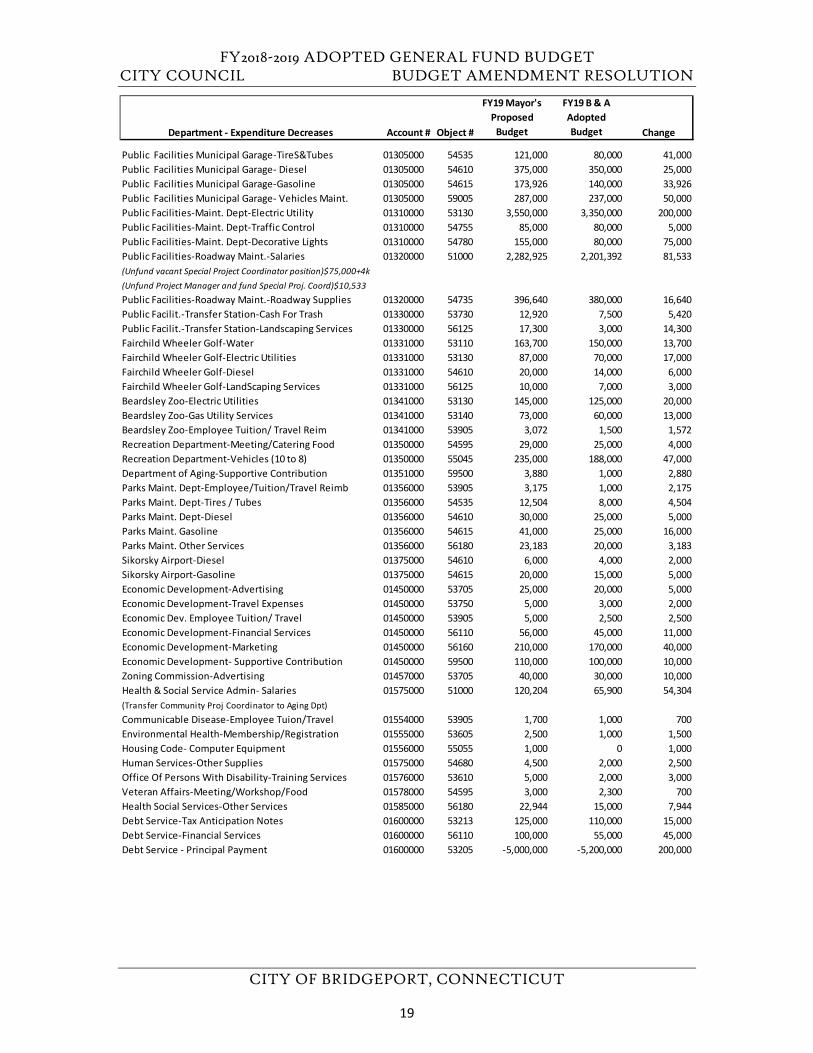
Public Facilities Municipal Garage-TireS&Tubes 01305000 54535 121,000 80,000 41,000Public Facilities Municipal Garage- Diesel 01305000 54610 375,000 350,000 25,000Public Facilities Municipal Garage-Gasoline 01305000 54615 173,926 140,000 33,926Public Facilities Municipal Garage- Vehicles Maint. 01305000 59005 287,000 237,000 50,000Public Facilities-Maint. Dept-Electric Utility 01310000 53130 3,550,000 3,350,000 200,000Public Facilities-Maint. Dept-Traffic Control 01310000 54755 85,000 80,000 5,000Public Facilities-Maint. Dept-Decorative Lights 01310000 54780 155,000 80,000 75,000Public Facilities-Roadway Maint.-Salaries 01320000 51000 2,282,925 2,201,392 81,533(Unfund vacant Special Project Coordinator position)$75,000+4k(Unfund Project Manager and fund Special Proj. Coord)$10,533Public Facilities-Roadway Maint.-Roadway Supplies 01320000 54735 396,640 380,000 16,640Public Facilit.-Transfer Station-Cash For Trash 01330000 53730 12,920 7,500 5,420Public Facilit.-Transfer Station-Landscaping Services 01330000 56125 17,300 3,000 14,300Fairchild Wheeler Golf-Water 01331000 53110 163,700 150,000 13,700Fairchild Wheeler Golf-Electric Utilities 01331000 53130 87,000 70,000 17,000Fairchild Wheeler Golf-Diesel 01331000 54610 20,000 14,000 6,000Fairchild Wheeler Golf-LandScaping Services 01331000 56125 10,000 7,000 3,000Beardsley Zoo-Electric Utilities 01341000 53130 145,000 125,000 20,000Beardsley Zoo-Gas Utility Services 01341000 53140 73,000 60,000 13,000Beardsley Zoo-Employee Tuition/ Travel Reim 01341000 53905 3,072 1,500 1,572Recreation Department-Meeting/Catering Food 01350000 54595 29,000 25,000 4,000Recreation Department-Vehicles (10 to 8) 01350000 55045 235,000 188,000 47,000Department of Aging-Supportive Contribution 01351000 59500 3,880 1,000 2,880Parks Maint. Dept-Employee/Tuition/Travel Reimb 01356000 53905 3,175 1,000 2,175Parks Maint. Dept-Tires / Tubes 01356000 54535 12,504 8,000 4,504Parks Maint. Dept-Diesel 01356000 54610 30,000 25,000 5,000Parks Maint. Gasoline 01356000 54615 41,000 25,000 16,000Parks Maint. Other Services 01356000 56180 23,183 20,000 3,183Sikorsky Airport-Diesel 01375000 54610 6,000 4,000 2,000Sikorsky Airport-Gasoline 01375000 54615 20,000 15,000 5,000Economic Development-Advertising 01450000 53705 25,000 20,000 5,000Economic Development-Travel Expenses 01450000 53750 5,000 3,000 2,000Economic Dev. Employee Tuition/ Travel 01450000 53905 5,000 2,500 2,500Economic Development-Financial Services 01450000 56110 56,000 45,000 11,000Economic Development-Marketing 01450000 56160 210,000 170,000 40,000Economic Development- Supportive Contribution 01450000 59500 110,000 100,000 10,000Zoning Commission-Advertising 01457000 53705 40,000 30,000 10,000Health & Social Service Admin- Salaries 01575000 51000 120,204 65,900 54,304(Transfer Community Proj Coordinator to Aging Dpt)Communicable Disease-Employee Tuion/Travel 01554000 53905 1,700 1,000 700Environmental Health-Membership/Registration 01555000 53605 2,500 1,000 1,500Housing Code- Computer Equipment 01556000 55055 1,000 0 1,000Human Services-Other Supplies 01575000 54680 4,500 2,000 2,500Office Of Persons With Disability-Training Services 01576000 53610 5,000 2,000 3,000Veteran Affairs-Meeting/Workshop/Food 01578000 54595 3,000 2,300 700Health Social Services-Other Services 01585000 56180 22,944 15,000 7,944Debt Service-Tax Anticipation Notes 01600000 53213 125,000 110,000 15,000Debt Service-Financial Services 01600000 56110 100,000 55,000 45,000Debt Service - Principal Payment 01600000 53205 -5,000,000 -5,200,000 200,000
19
FY2018-2019 ADOPTED GENERAL FUND BUDGET CITY COUNCIL BUDGET AMENDMENT RESOLUTION
CITY OF BRIDGEPORT, CONNECTICUT
LEGISLATIVE INTENT APPROPRIATION DECREASES
Mayor's Office-Salaries – 01001000 – 51000: The Legislative intent is to unfund Deputy Chief of Staff and fund Community Liason.
Central Grants -Salaries – 01010000 – 51000: The Legislative intent is to unfund Deputy CAO, Analyst and Fund Grant Writer position.
Central Grants-Employee Tuition/Travel Reimb. – 01005000 – 53905: Legislative intent is to reduce Employee Tuition Travel account.
Central Grants-Computer Supplies – 01005000 – 54555: Legislative intent is to reduce Computer Supplies account.
Central Grants-Food Services – 01005000 – 56085: Legislative intent is to reduce Food Services account.
Central Grants-Management Services – 01005000 – 56165: Legislative intent is to reduce Management Services account.
Central Grants-Supportive Contributions – 01005000 – 59500: Legislative intent is to reduce Supportive Contribution account.
Comptroller Dept-Office Supplies – 01010000 – 54675: Legislative intent is to reduce Office Supplies account.
Finance Department-Training Services – 01015000 – 53605: Legislative intent is to reduce Training Services account.
Finance Department-Training Services – 01015000 – 53610: Legislative intent is to reduce Training Services account.
Department - Expenditure Decreases Account # Object #
FY19 Mayor's Proposed
Budget
FY19 B & A Adopted Budget Change
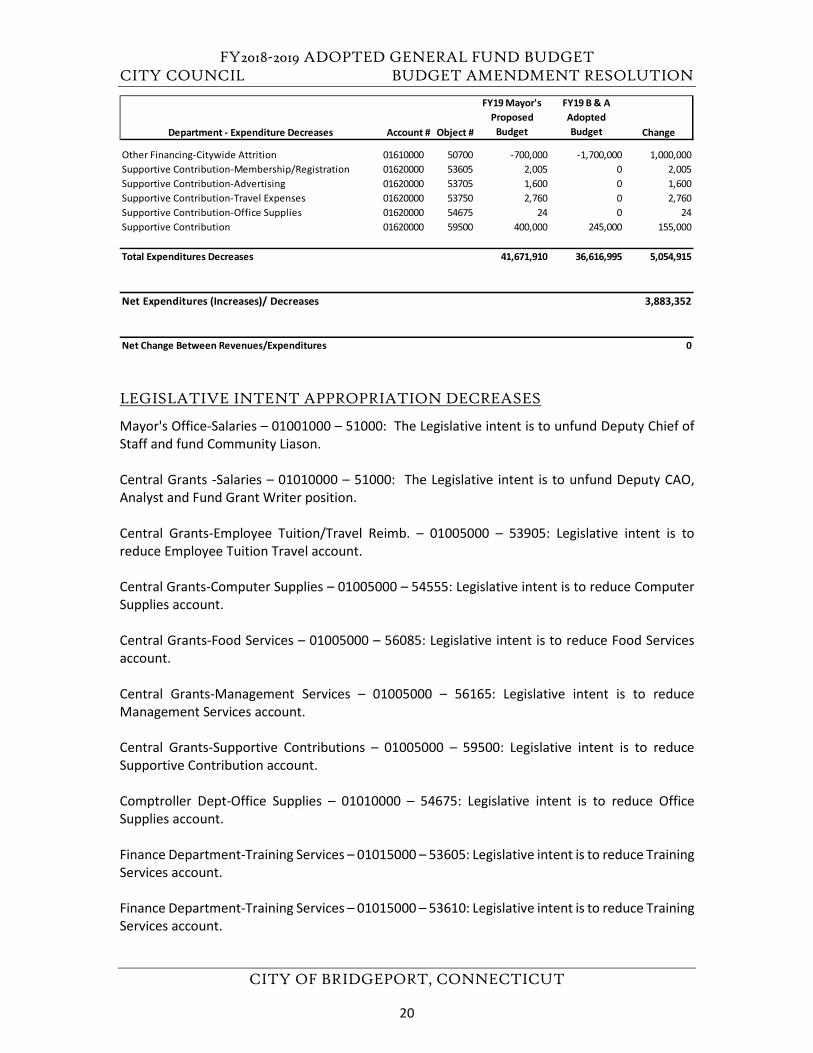
Other Financing-Citywide Attrition 01610000 50700 -700,000 -1,700,000 1,000,000Supportive Contribution-Membership/Registration 01620000 53605 2,005 0 2,005Supportive Contribution-Advertising 01620000 53705 1,600 0 1,600Supportive Contribution-Travel Expenses 01620000 53750 2,760 0 2,760Supportive Contribution-Office Supplies 01620000 54675 24 0 24Supportive Contribution 01620000 59500 400,000 245,000 155,000
Total Expenditures Decreases 41,671,910 36,616,995 5,054,915
Net Expenditures (Increases)/ Decreases 3,883,352
Net Change Between Revenues/Expenditures 0
20
FY2018-2019 ADOPTED GENERAL FUND BUDGET CITY COUNCIL BUDGET AMENDMENT RESOLUTION
CITY OF BRIDGEPORT, CONNECTICUT
Finance Department-Office Supplies – 01015000 – 54675: Legislative intent is to reduce Office Supplies account.
Tax Collector-Other Insurance – 01040000 – 53430: Legislative intent is to reduce Other Insurance account.
Tax Collector-Banking Services – 01040000 – 56105: Legislative intent is to reduce Banking Services account.
Tax Collector-Financial Services – 01040000 – 56110: Legislative intent is to reduce Financial Services account.
Tax Collector-Legal Services – 01040000 – 56130: Legislative intent is to reduce Legal Services account.
Treasury Dept.-Banking Services – 01045000 – 56105: Legislative intent is to reduce Banking Services account.
Registrar of Voters-Regular 1.5 Overtime Pay – 01050000 – 51108: Legislative intent is to reduce Overtime account.
City Clerk-Computer Equipment – 01055000 – 55055: Legislative intent is to reduce Computer Equipment account.
City Clerk-Computer Services – 01055000 – 56055: Legislative intent is to reduce Computer Services account.
City Attorney-Salaries- 1 p/t Attorney – 01060000 – 51000: Legislative intent is not to fund part-time City Attorney position.
City Attorney-Office Supplies – 01060000 – 54675: Legislative intent is to reduce Office Supplies account.
City Attorney-Legal Services – 01060000 – 56130: Legislative intent is to reduce Legal Services account by $100k.
Archives-Office Supplies – 01065000 – 54675: Legislative intent is to reduce Office Supplies account.
Civil Service-Regular Straight Overtime – 01070000 – 51106: Legislative intent is to reduce Overtime account.
Civil Service-Regular 1.5 Overtime Pay – 01070000 – 51108: Legislative intent is to reduce Overtime account.
Civil Service-Proctor Pay – 01070000 – 51146: Legislative intent is to reduce proctor pay account due to less civil service exams in FY19.
21
FY2018-2019 ADOPTED GENERAL FUND BUDGET CITY COUNCIL BUDGET AMENDMENT RESOLUTION
CITY OF BRIDGEPORT, CONNECTICUT
Civil Service-Advertising Services – 01070000 – 53705: Legislative intent is to reduce Advertising Services account.
Civil Service-Hardware/ Tools – 01070000 – 54640: Legislative intent is to reduce Hardware/Tools account.
Civil Service-Food Services – 01070000 – 56085: Legislative intent is to reduce the Food Services account.
Grants Personnel/Benefits-Meeting/Food Services – 01075000 – 54595: Legislative intent is to reduce the Meetings/Food Services account.
Grants Personnel/Benefits-Office Supplies – 01075000 – 54675: Legislative intent is to reduce the Office Supplies account.
Labor Relations-Employee Tuition/Travel – 01085000 – 53905: Legislative intent is to reduce Employee Tuition Travel account
Labor Relations-Other Services – 01085000 – 56180: Legislative intent is to reduce Other Services account.
Pension & Benefits-Health Insurance City Share – 01088000 – 52917: Legislative intent is to acknowledge potential health insurance savings due to planned change in the City Health Insurance Program.
Town Clerk-Advertising – 01090000 – 53705: Legislative intent is to reduce the Advertising Services account.
Town Clerk-Election Equipment – 01090000 – 55090: Legislative intent is to reduce Election Equipment account.
Office of Policy & Management-Computer Supplies – 0110000 – 54555: Legislative intent is to reduce Computer Services account.
CitiStat-Membership/Registration – 01113000 – 53605: Legislative intent is not to reduce Membership & Registration account.
CitiStat-Advertising – 01113000 – 53705: Legislative intent is not to reduce Advertising account.
CitiStat-Travel Expenses – 01113000 – 53750: Legislative intent is not to reduce Office Supplies account.
CitiStat-Office Supplies – 01113000 – 54675: Legislative intent is to reduce Office Supplies account.
CitiStat-Subscriptions – 01113000 – 54705: Legislative intent is to reduce Office Supplies account
CitiStat-Postage – 01113000 – 54725: Legislative intent is to reduce Postage account.
22
FY2018-2019 ADOPTED GENERAL FUND BUDGET CITY COUNCIL BUDGET AMENDMENT RESOLUTION
CITY OF BRIDGEPORT, CONNECTICUT
CitiStat-Office Equipment Lease/Lease – 01113000 – 55155: Legislative intent is to reduce Office Equipment/Lease account.
CitiStat-Office Equipment Maint. Services – 01113000 – 56175: Legislative intent is to reduce Office Equipment Maintenance account.
CitiStat-Office -Printing Services – 01113000 – 59015: Legislative intent is to reduce Printing Services account.
Information Tech. Dept-Salaries – 01108000 – 51000: Legislative intent is to eliminate a vacant Support Specialist 1 position in FY19.
Information Tech. Dept-Telephone Services – 01108000 – 53720: Legislative intent is to reduce Telephone Services account.
Small & Minority Business-Office Supplies – 01112000 – 54675: Legislative intent is to reduce Office Supplies account.
Police Department-Training Services – 01250000 – 53610: Legislative intent is to reduce Training Services account.
Police Department-Employee/Travel Reimb – 01250000 – 53905: Legislative intent is to reduce Employee Travel Services account.
Police Department-Automotive Parts – 01250000 – 54010: Legislative intent is to reduce Automotive Parts account.
Police Department-Animals – 01250000 – 54520: Legislative intent is to reduce Animal account.
Police Department-Automotive Supplies – 01250000 – 54530: Legislative intent is to reduce Automotive Supplies account.
Police Department-Office Supplies – 01250000 – 54675: Legislative intent is to reduce Office Supplies account.
Police Department-Legal Services – 01250000 – 56130: Legislative intent is to reduce Legal Services account.
Police Department-Medical Services – 01250000 – 56155: Legislative intent is to reduce Medical Services account.
Police Department-Office Equipment Maint Serv – 01250000 – 56175: Legislative intent is to reduce Office Equipment Maint. Services account.
Police Administration-Regular Straight Overtime – 01250000 – 51108: Legislative intent is to reduce Police Department Overtime account.
23
FY2018-2019 ADOPTED GENERAL FUND BUDGET CITY COUNCIL BUDGET AMENDMENT RESOLUTION
CITY OF BRIDGEPORT, CONNECTICUT
Police Patrol Division- Salaries -Captain Position – 01251000 – 51000: Legislative intent is not to fund a vacant Captain position of 103,484 and increase police attrition budget by additional $300k.
Police Auxilliary Division- Salaries- Lieutenant – 01258000 – 51000: Legislative intent is not to fund a vacant Lieutenant position of $90,496 in FY19.
Fire Administration-Regular Straight Overtime – 01260000 – 51108: Legislative intent is to reduce Fire Department Overtime account by $50k in FY19.
Fire Department- Training Services – 01260000 – 53610: Legislative intent is to reduce Training Services account.
Fire Department- Gasoline – 01260000 – 54615: Legislative intent is to reduce Gasoline account.
Emergency Operations-Electric Utility – 01290000 – 53130: Legislative intent is to reduce Electricity Utility Services account.
Emergency Operations-Meeting/workshop/catering – 01290000 – 54595: Legislative intent is to reduce Meeting, Workshop, Catering Services account.
Emergency Operations-Printing Services 01290000 – 59015: Legislative intent is to reduce Printing Services account.
Public Facilities Municipal Garage-Tires & Tubes – 01305000 – 54535. Legislative intent is to reduce Tires and Tubes account.
Public Facilities Municipal Garage – Diesel – 01305000 – 54610: Legislative intent is to reduce Diesel account.
Public Facilities Municipal Garage-Gasoline – 01305000 – 54615: Legislative intent is to reduce Gasoline account.
Public Facilities Municipal Garage- Vehicles Maint. – 01305000 – 59005: Legislative intent is to reduce Vehicles Maintenance account.
Public Facilities-Maint. Dept-Electric Utility – 01310000 – 53130: Legislative intent is to reduce Electricity account.
Public Facilities-Maint. Dept-Traffic Control – 01310000 – 54755: Legislative intent is to reduce Traffic Control account.
Public Facilities-Maint. Dept-Decorative Lights – 01310000 – 54780: Legislative intent is to reduce Decorative Lights account.
Public Facilities-Roadway Maint. - Salaries – 01320000 – 51000: Legislative intent is not to fund vacant special project coordinator position of $75k, also not fund the $10k salary increase of the
24
FY2018-2019 ADOPTED GENERAL FUND BUDGET CITY COUNCIL BUDGET AMENDMENT RESOLUTION
CITY OF BRIDGEPORT, CONNECTICUT
project manager; however, fund $4k. (Unfund Project Manager and fund Special Proj. Coord) $10,533. increase for the illegal dump coordinator. Public Facilities-Roadway Maint. -Roadway Supplies – 01320000 – 54735: Legislative intent is to reduce Roadway Supplies account. Public Facilit. -Transfer Station - Cash For Trash – 01330000 – 53730: Legislative intent is to reduce Cash For Trash account. Public Facilit.-Transfer Station-Landscaping Services – 01330000 – 56125: Legislative intent is to reduce Landscaping Services account. Fairchild Wheeler Golf-Water – 01331000 – 53110: Legislative intent is to reduce Water account. Fairchild Wheeler Golf-Electric Utilities – 01331000 – 53130: Legislative intent is to reduce Electricity account. Fairchild Wheeler Golf-Diesel – 01331000 – 54610: Legislative intent is to reduce Diesel account. Fairchild Wheeler Golf-Landscaping Services – 01331000 – 56125: Legislative intent is to reduce Landscaping Services account. Beardsley Zoo-Electric Utilities – 01341000 – 53130: Legislative intent is to reduce Electricity account. Beardsley Zoo-Gas Utility Services – 01341000 – 53140: Legislative intent is to reduce Natural Gas account. Beardsley Zoo-Employee Tuition/ Travel Reim – 01341000 – 53905: Legislative intent is to reduce Tuition/Travel Services account. Recreation Department-Meeting/Catering Food – 01350000 – 54595: Legislative intent is to reduce Meeting, Food Catering Services account. Recreation Department-Vehicles (10 to 8) – 01350000 – 55045: Legislative intent is to reduce the purchase of 10 cars to 8 cars. Department of Aging-Supportive Contribution – 01351000 – 59500: Legislative intent is to reduce the Supportive Contribution. Parks Maint. Dept-Employee/Tuition/Travel Reimb – 01356000 – 53905: Legislative intent is to reduce Employee Tuition and Travel Reimbursement account. Parks Maint. Dept-Tires / Tubes – 01356000 – 54535: Legislative intent is to reduce Tires and Tubes account. Parks Maint. Dept-Diesel – 01356000 – 54610: Legislative intent is to reduce Diesel account.
25
FY2018-2019 ADOPTED GENERAL FUND BUDGET CITY COUNCIL BUDGET AMENDMENT RESOLUTION
CITY OF BRIDGEPORT, CONNECTICUT
Parks Maint. Gasoline – 01356000 – 54615: Legislative intent is to reduce Gasoline account. Parks Maint. Other Services – 01356000 – 56180: Legislative intent is to reduce Other Services account. Sikorsky Airport-Diesel – 01375000 – 54610: Legislative intent is to reduce Diesel Services account. Sikorsky Airport-Gasoline – 01375000 – 54615: Legislative intent is to reduce Gasoline account. Economic Development-Advertising – 01450000 – 53705: Legislative intent is to reduce Advertising account. Economic Development-Travel Expenses – 01450000 – 53750: Legislative intent is to reduce Travel Expenses account. Economic Dev. Employee Tuition/ Travel – 01450000 – 53905: Legislative intent is to reduce Travel account. Economic Development-Financial Services – 01450000 – 56110: Legislative intent is to reduce Financial Services account. Economic Development-Marketing – 01450000 – 56160: Legislative intent is to reduce Marketing Services account. Economic Development- Supportive Contribution – 01450000 – 59500: Legislative intent is to reduce Supportive Contribution account. Zoning Commission-Advertising – 01457000 – 53705: Legislative intent is to reduce advertising account. Health & Social Service Admin- Salaries – 01575000 – 51000: Legislative intent is to transfer Community Project coordinator position from Health Department into Department of Aging in FY19. Communicable Disease-Employee Tuition/Travel – 01554000 – 53905: Legislative intent is to reduce travel account. Environmental Health-Membership/Registration – 01555000 – 53605: Legislative intent is to reduce Membership/Registration Fees account. Housing Code- Computer Equipment – 01556000 – 55055: Legislative intent is not to fund computer equipment account. Human Services-Other Supplies – 01575000 – 54680: Legislative intent is to reduce other supplies account. Office Of Persons With Disability -Training Services – 01576000 – 53610: Legislative intent is to reduce Training Services account.
26
FY2018-2019 ADOPTED GENERAL FUND BUDGET CITY COUNCIL BUDGET AMENDMENT RESOLUTION
CITY OF BRIDGEPORT, CONNECTICUT
Veteran Affairs-Meeting/Workshop/Food – 01578000 – 54595: Legislative intent is to reduce Meeting/Workshop/Food Services account. Health Social Services-Other Services – 01585000 – 56180: Legislative intent is to reduce Other Services account. Debt Service-Tax Anticipation Notes – 01600000 – 53213: Legislative intent is to reduce Debt Services account based on need. Debt Service-Financial Services – 01600000 – 56110: Legislative intent is to reduce Financial Services account based on FY19 need. Debt Service - Principal Payment – 01600000 – 53205: Legislative intent is to reduce Debt Service Principal Payment account based on FY19 debt service schedule and refinancing savings. Other Financing-Citywide Attrition – 01610000 – 50700: Legislative intent is to increase the FY2019 attrition/positions freeze by an additional $1,000,000. Supportive Contribution-Membership/Registration – 01620000 - Legislative intent is not to fund Membership/Registration account. Supportive Contribution-Advertising – 01620000 – 53705: Legislative intent is not to fund Advertising Services account. Supportive Contribution-Travel Expenses – 01620000 – 53750: Legislative intent is not to fund Travel Expenses account. Supportive Contribution-Office Supplies – 01620000 – 54675: Legislative intent is not to fund Office Supplies account. Supportive Contribution – 01620000 – 59500: Legislative intent is to reduce supportive contribution account.
27

FY 2018-2019 ADOPTED GENERAL FUND BUDGET
CITY OF BRIDGEPORT, CONNECTICUT
This page left blank intentionally.
28
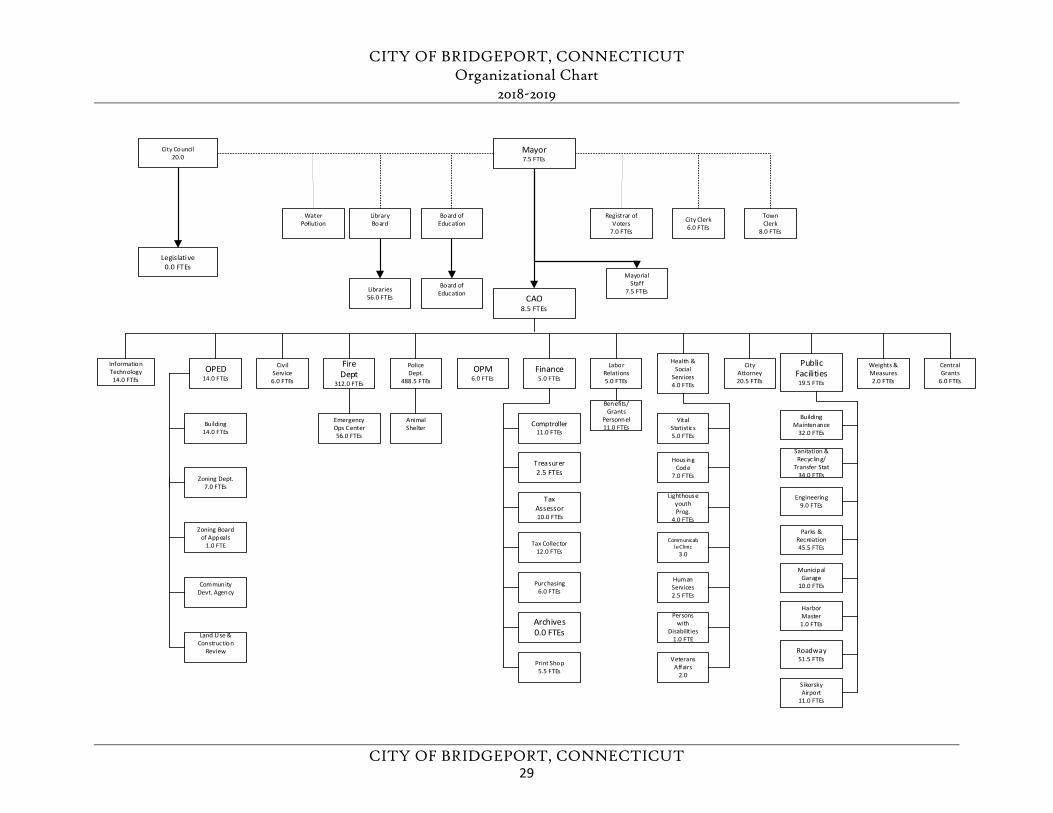
CITY OF BRIDGEPORT, CONNECTICUT Organizational Chart
2018-2019
CITY OF BRIDGEPORT, CONNECTICUT
Mayor7.5 FTEs
CAO8.5 FTEs
City Council20.0
Registrar of Voters
7.0 FTEs
City Clerk6.0 FTEs
Town Clerk
8.0 FTEs
Water Pollution
Legislative0.0 FTEs
Library Board
Board of Education
Civil Service6.0 FTEs
Fire Dept
312.0 FTEs
OPED14.0 FTEs
Police Dept.
488.5 FTEs
Information Technology14.0 FTEs
OPM6.0 FTEs
Finance 5.0 FTEs
Public Facilities19.5 FTEs
Health & Social
Services4.0 FTEs
Labor Relations5.0 FTEs
City Attorney20.5 FTEs
Weights & Measures2.0 FTEs
Central Grants
6.0 FTEs
Libraries56.0 FTEs
Board of Education
Mayorial Staff
7.5 FTEs
Emergency Ops Center56.0 FTEs
Animal Shelter
Building14.0 FTEs
Zoning Dept.7.0 FTEs
Zoning Board of Appeals
1.0 FTE
Community Devt. Agency
Land Use & Construction
Review Print Shop
5.5 FTEs
Comptroller11.0 FTEs
Treasurer2.5 FTEs
Tax Assessor 10.0 FTEs
Tax Collector12.0 FTEs
Purchasing6.0 FTEs
Archives0.0 FTEs
Vital Statistics5.0 FTEs
Hous ing Code
7.0 FTEs
Lighthouse youth Prog.
4.0 FTEs
Communicable Clinic
3.0
Human Services2.5 FTEs
Persons with
Disabilities1.0 FTE
Veterans Affairs
2.0
Building Maintenance
32.0 FTEs
Sanitation & Recycling/
Transfer Stat34.0 FTEs
Engineering9.0 FTEs
Parks & Recreation45.5 FTEs
Municipal Garage
10.0 FTEs
Harbor Master1.0 FTEs
Roadway51.5 FTEs
Sikorsky Airport
11.0 FTEs
Benefits/ Grants
Personnel11.0 FTEs
29
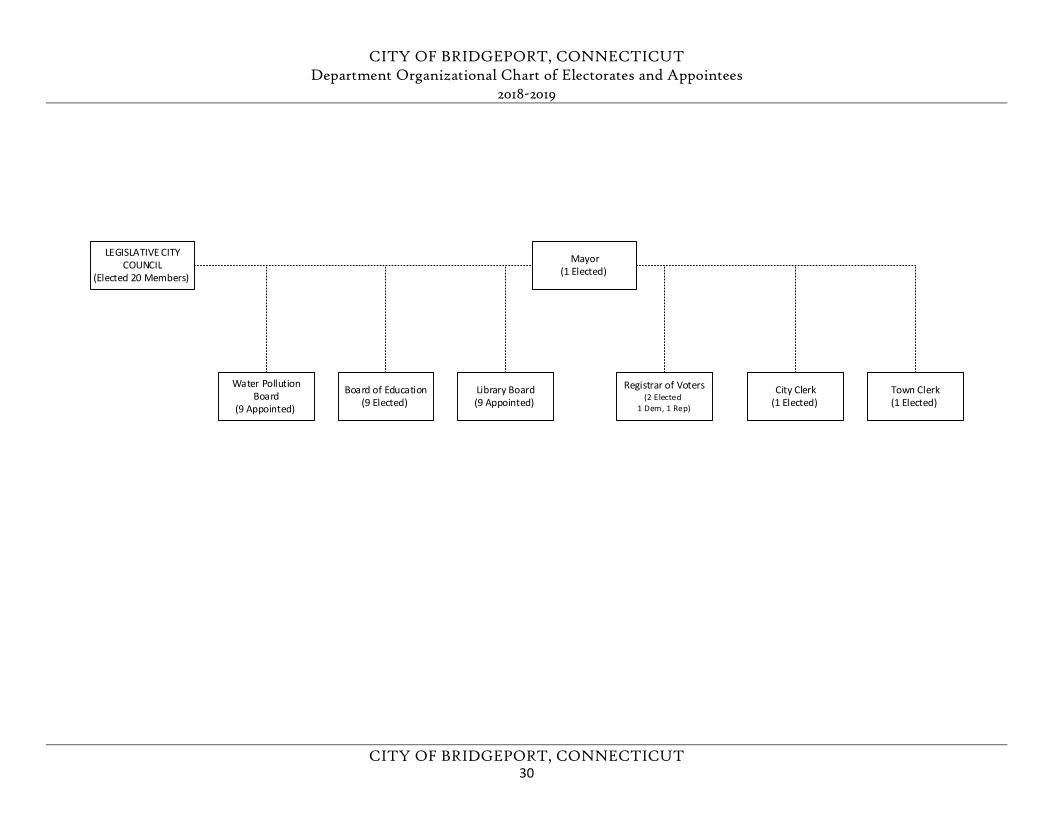
CITY OF BRIDGEPORT, CONNECTICUT Department Organizational Chart of Electorates and Appointees
2018-2019
CITY OF BRIDGEPORT, CONNECTICUT
Mayor(1 Elected)
LEGISLATIVE CITY COUNCIL
(Elected 20 Members)
Water Pollution Board
(9 Appointed)
Board of Education(9 Elected)
Registrar of Voters(2 Elected
1 Dem, 1 Rep)
City Clerk(1 Elected)
Town Clerk(1 Elected)
Library Board(9 Appointed)
30
FY 2018-2019 ADOPTED GENERAL FUND BUDGET BUDGET SUMMARY BUDGET & ACCOUNTING POLICIES
CITY OF BRIDGEPORT, CONNECTICUT
ACCOUNTING POLICIES FISCAL YEAR The City of Bridgeport’s Fiscal Year begins July 1 and ends June 30.
BALANCED BUDGET The Charter of the City of Bridgeport mandates a balanced budget. For the purposes of meeting this requirement, each year a budget is adopted in which the projected expenditures are equal to the projected revenues.
BASIS OF ACCOUNTING The City of Bridgeport’s accounting system is operated on a fund basis. A fund is a fiscal and accounting entity with a self-balancing set of accounts in which cash and other financial resources or balances are recorded and segregated to carry on specific activities or attain certain objectives in accordance with specific regulations and limitations. The operations of the general fund are maintained on a modified accrual basis, with revenues recorded when measurable and available and the expenditures recorded when the services or goods are received and liabilities are incurred. In contrast, accounting records for the City’s enterprise, pension and nonexpendable trust funds are managed on the accrual basis of accounting. The types of funds utilized by the City are as follows: general; special revenue; capital projects; enterprise; and trust and agency. The type and number of individual funds established is determined by GAAP and sound financial administration.
BUDGET PROCEDURE The Mayor’s annual budget is developed by the City’s Office of Policy & Management (OPM). The budget is submitted to the City Council, which in turn makes additions and changes as necessary before turning it over to the Mayor for approval. The City maintains budgetary control through the Office of Policy & Management. The objective of budgetary control is to ensure compliance with the legal provisions embodied in the annual adopted budget approved by the City Council. The level of budgetary control is established by organization, agency, appropriation and object. The City of Bridgeport also utilizes an encumbrance accounting system as one technique for accomplishing budgetary control. Encumbrances reserve appropriations which have been obligated through purchase orders or other contractual documents. Encumbrances are reported as reservations of fund balance at the end of the year. Transfers of certain appropriations between departments require the approval of the City Council. The City of Bridgeport’s Capital & General Fund Budgets must be adopted by the City Council and approved by the Mayor.
INTERNAL CONTROLS The management of the City of Bridgeport is maintained through a control structure designed to ensure that the assets of the City are protected from loss, theft, or misuse and to ensure that adequate accounting data is compiled to allow for the preparation of financial statements in conformity with GAAP. The control structure is designed to provide reasonable assurance that these objectives are met. The concept of reasonable assurance recognizes that the cost of a control should not exceed the benefits likely to be derived from that cost and that the valuation of costs and benefits requires estimates and judgments be made by management. In addition, the City of Bridgeport has an internal audit staff responsible for monitoring the various City
31
FY 2018-2019 ADOPTED GENERAL FUND BUDGET BUDGET SUMMARY BUDGET & ACCOUNTING POLICIES
CITY OF BRIDGEPORT, CONNECTICUT
departments in compliance with the City Charter, ordinances, and all other policies and procedures.
As a recipient of Federal, State and local financial assistance, the City of Bridgeport is responsible for ensuring adequate internal control policies and procedures are in place to ensure and document compliance with applicable laws and regulations related to these programs. This internal control structure is subject to periodic evaluation by management as well.
LEGAL DEBT LIMIT The total overall statutory debt limit for the City is equal to seven times annual receipts from taxation, or $2.19 billion. All long-term debt obligations are retired through General Fund appropriations or user charges. As of June 30, 2017, the City recorded long-term debt of $648.6 million related to Governmental Activities and $38.2 million related to Business-Type Activities, well below its statutory debt limit. For more information on debt service, see the debt service section.
RISK MANAGEMENT The City is exposed to various risks of loss related to torts; theft of, damage to, and destruction of assets; errors and omissions; injuries to employees; and natural disasters. The City carries commercial insurance for insurable risks related to property and casualty claims. The City is self-insured for general liability, workers’ compensation and employee health and dental insurance. Coverage has not been materially reduced, nor have settled claims exceeded commercial coverage or budget reserves for litigation claim expenditures in any of the past three years.
The City carries no insurance coverage for losses arising out of workers’ compensation claims. These claims are paid from the Internal Service Fund. The City estimates a liability for workers’ compensation claims payable and for claims incurred but not reported based on an actuarial valuation. This is accounted for in the Internal Service Fund.
The City maintains a group health plan providing both insured and self-insured medical, prescription drug, dental and vision plan benefits as described below:
The following programs are provided under self-insured administrative only contracts: • Medical benefits for all employees and Non-Medicare-Eligible Retirees• Prescription benefits for all employees and all retirees except Medicare-eligible fire and policeretirees• Dental benefit for all employees and retired teachers and school system administrators• Vision plan benefits for City and BOE employees excluding teachers and school systemadministrators
The following programs are provided under fully insured contracts: • Medical benefits for Medicare-eligible retirees• Prescription benefits for Medicare-eligible fire and police retirees• Dental HMO benefits for approximately 300 people
Approximately 4,137 employees and 3,750 retirees receive their health benefits through these plans. Payments related to these claims are made by outside administrators under administrative
32
FY 2018-2019 ADOPTED GENERAL FUND BUDGET BUDGET SUMMARY BUDGET & ACCOUNTING POLICIES
CITY OF BRIDGEPORT, CONNECTICUT
services contracts and are accounted for in the Internal Service Fund. The current contracts require that approximately $2,461,540 be deposited with amount being recorded as a prepaid asset in the accompanying balance sheet. As of June 30, 2017, the amount of prepaid asset in the fund is $2,461,540.
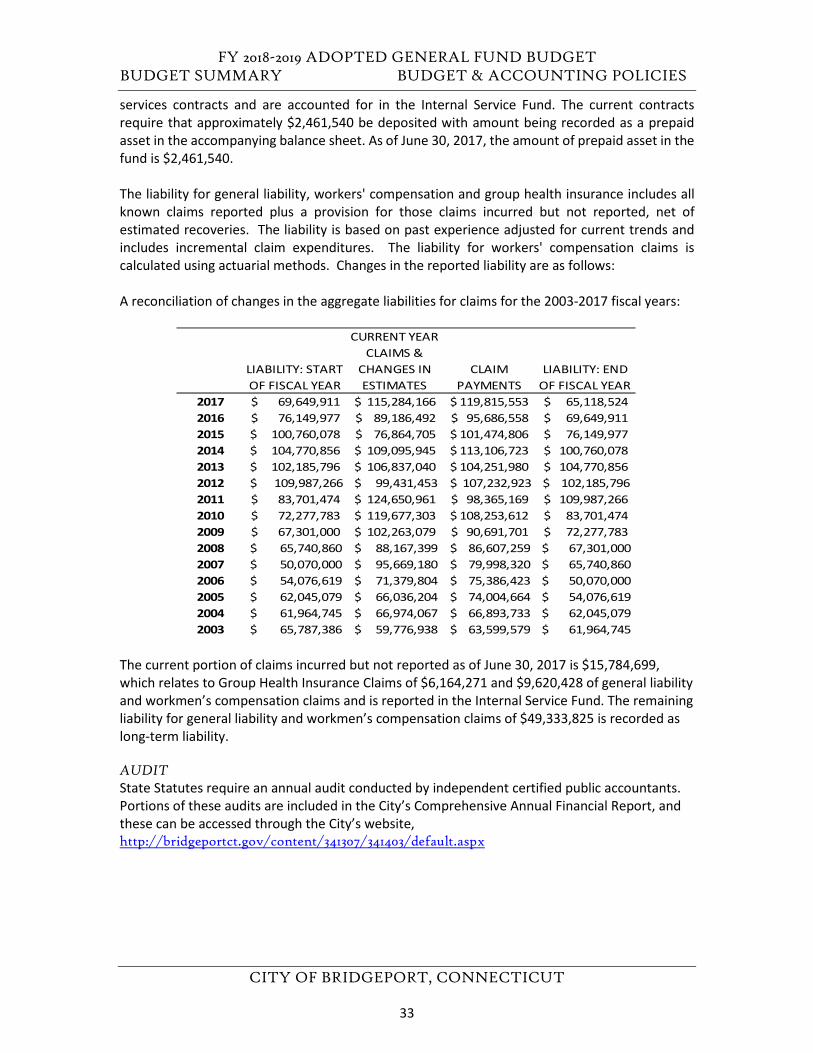
The liability for general liability, workers' compensation and group health insurance includes all known claims reported plus a provision for those claims incurred but not reported, net of estimated recoveries. The liability is based on past experience adjusted for current trends and includes incremental claim expenditures. The liability for workers' compensation claims is calculated using actuarial methods. Changes in the reported liability are as follows:
A reconciliation of changes in the aggregate liabilities for claims for the 2003-2017 fiscal years:
The current portion of claims incurred but not reported as of June 30, 2017 is $15,784,699, which relates to Group Health Insurance Claims of $6,164,271 and $9,620,428 of general liability and workmen’s compensation claims and is reported in the Internal Service Fund. The remaining liability for general liability and workmen’s compensation claims of $49,333,825 is recorded as long-term liability.
AUDIT State Statutes require an annual audit conducted by independent certified public accountants. Portions of these audits are included in the City’s Comprehensive Annual Financial Report, and these can be accessed through the City’s website, http://bridgeportct.gov/content/341307/341403/default.aspx
LIABILITY: START OF FISCAL YEAR
CURRENT YEAR CLAIMS &
CHANGES IN ESTIMATES
CLAIM PAYMENTS
LIABILITY: END OF FISCAL YEAR
2017 69,649,911$ 115,284,166$ 119,815,553$ 65,118,524$ 2016 76,149,977$ 89,186,492$ 95,686,558$ 69,649,911$ 2015 100,760,078$ 76,864,705$ 101,474,806$ 76,149,977$ 2014 104,770,856$ 109,095,945$ 113,106,723$ 100,760,078$ 2013 102,185,796$ 106,837,040$ 104,251,980$ 104,770,856$ 2012 $ 109,987,266 $ 99,431,453 $ 107,232,923 $ 102,185,796 2011 83,701,474$ 124,650,961$ 98,365,169$ 109,987,266$ 2010 72,277,783$ 119,677,303$ 108,253,612$ 83,701,474$ 2009 67,301,000$ 102,263,079$ 90,691,701$ 72,277,783$ 2008 $ 65,740,860 $ 88,167,399 $ 86,607,259 $ 67,301,000 2007 $ 50,070,000 $ 95,669,180 $ 79,998,320 $ 65,740,860 2006 $ 54,076,619 $ 71,379,804 $ 75,386,423 $ 50,070,000 2005 $ 62,045,079 $ 66,036,204 $ 74,004,664 $ 54,076,619 2004 $ 61,964,745 $ 66,974,067 $ 66,893,733 $ 62,045,079 2003 $ 65,787,386 $ 59,776,938 $ 63,599,579 $ 61,964,745
33
FY 2018-2019 ADOPTED GENERAL FUND BUDGET BUDGET SUMMARY BUDGET & ACCOUNTING POLICIES
CITY OF BRIDGEPORT, CONNECTICUT
UNDESIGNATED FUND BALANCE POLICY
PURPOSE To maintain a balance of funds within the total unreserved, undesignated fund balance to be available for unforeseen contingencies. Definition: Unreserved, undesignated fund balance is the remaining balance available following the reduction for “resources not available for spending” or “legal restrictions” (reservation) and “management’s intended future use of resources” (designation).
POLICY The sum of all components identified for the undesignated fund balance level will be set at no less than 8.00% of annual operating expenditures and other financing uses (transfers out) of the prior audited fiscal year with the annual approval by the City Council. If the undesignated fund balance exceeds 12.00%, the amount exceeding this percentage may be available for appropriation at the discretion of the Mayor with the approval of City Council.
RATIONALE The City of Bridgeport recognizes the importance of maintaining an appropriate level of undesignated fund balance on a Generally Accepted Accounting Principles (GAAP) basis to withstand short-term financial emergencies. After evaluating the City’s operating characteristics, its overall financial health, the diversity and flexibility of its tax base, the reliability of non-property tax revenues sources, the City’s working capital needs, the impact of state policies regarding tax exempt properties and PILOT reimbursements on City revenues, Brownfield policies, the national, state and local economic outlooks, emergency and disaster risks, other contingent issues and the impact on the City bond ratings of all these factors, the City of Bridgeport hereby establishes goals regarding the appropriate handling and funding of the undesignated fund balance.
The City of Bridgeport’s formal undesignated fund balance policy shall be to maintain adequate unencumbered reserves to accomplish the following objectives:
(1) Have sufficient funds available for appropriation for unforeseen expenditures orunforeseen shortfalls in revenue after adoption of the annual budget; and
(2) Avoid unexpected spikes in the mill rate caused by non-reoccurring revenues.
REPLENISHMENT OF SHORTFALL The undesignated fund balance of the General Fund may fall below the approved minimum level due to fluctuations between planned and actual revenues and expenditures, other financial emergencies or catastrophic events of an unforeseen nature. When an audited shortfall is reported in the Comprehensive Annual Financial Report (CAFR), it must be rebuilt during the following ensuing fiscal years. This will be achieved by adding an annual appropriation, during the budgeting process of a minimum of 10% of the difference between the fund balance policy level and the undesignated fund balance presented in the latest audited statements.
When dealing with the unanticipated sale of municipal assets, no less than 50% of the “gain on sale of city asset” must be deposited toward the undesignated fund balance until the 12.00% goal has been achieved.
34
FY 2018-2019 ADOPTED GENERAL FUND BUDGET BUDGET SUMMARY BUDGET & ACCOUNTING POLICIES
CITY OF BRIDGEPORT, CONNECTICUT
The maintenance of undesignated levels is not to be construed as surpluses or over-taxation by the City. Rather, it is an element of sound fiscal management required for sustaining a high credit rating and financial management flexibility.
DESCRIPTION OF FUND STRUCTURE
The accounts of the City of Bridgeport are organized on the basis of funds and account groups, utilizing a fund structure in which fund activities are aggregated for specific purposes. A fund is a combination of related accounts used to maintain control & accountability of resources that are dedicated to specific activities or objectives. The City of Bridgeport, like other state & local governments, uses fund accounting to ensure appropriate fiscal control and to demonstrate our compliance with accepted accounting principles set forth by the Governmental Accounting Standards Board.
Detailed financial schedules for all the funds described below are not contained within this budget document. This document includes information on the General Fund, as well as some detail on the Internal Service Fund, and Capital Project Funds. Of these funds, only the General Fund is subject to appropriation. Detail on the other funds described below can be found in the City’s Comprehensive Annual Financial Report, prepared by the Finance Department, and can be accessed through the City’s website, http://www.bridgeportct.gov/finance Grateful acknowledgement of the assistance of the Finance Department in providing certain schedules and detail from the 2016 CAFR is noted here, and we have provided attribution for these throughout the budget book, as is applicable.
GOVERNMENTAL FUNDS The City of Bridgeport maintains 19 individual governmental funds. The major funds of these 19 are discussed below.
THE GENERAL FUND (Total: $557,429,645) is the primary operating fund of the city. It is the largest fund which encompasses traditional governmental services, and is used to account for all financial resources except those required to be accounted for in another fund. The General Fund is primarily supported by the property tax. General Fund revenues are displayed by type in the Revenue Summary section of this budget and by department in the Budget Detail section. Appropriations are also listed by department in the Budget Detail section. Governmental funds are reported using the current financial resources measurement focus and the modified accrual basis of accounting. Revenues are recognized when they are both measurable and available. SPECIAL REVENUE FUNDS (Total: N/A) are used to account for revenues dedicated for a specific purpose. These funds are prescribed by Federal or State program guidelines regarding the distribution or use of revenues. THE DEBT SERVICE FUND (Total: See FY19 Adopted Debt Service budget) is used for the accumulation of resources for, and the payment of, general long term bonded debt to be issued in future years. BOARD OF EDUCATION FUND (2019 Adopted Total $229,908,785 - however also included as part of the total general fund amount above). This fund accounts for the operations of the Board of Education, except for those required to be accounted for in another fund.
35
FY 2018-2019 ADOPTED GENERAL FUND BUDGET BUDGET SUMMARY BUDGET & ACCOUNTING POLICIES
CITY OF BRIDGEPORT, CONNECTICUT
CAPITAL PROJECT FUNDS (2019 Adopted Total: $49,100,000 - See FY19 Adopted Capital Fund budget). are utilized for various construction projects as well as the purchase of the City’s fleet inventory. Capital Project Funds are used to account for the proceeds of general obligation bonds and other financing sources for the planning, acquisition and construction or improvement of major capital facilities such as new schools and urban renewal projects.
PROPRIETARY FUNDS ENTERPRISE FUNDS (2019 Adopted Total: N/A) are used to report activities that are financed and operated in a manner similar to a private business enterprise. In the case of the City of Bridgeport, the Water Pollution Control Authority or WPCA, is one such fund which accounts for the activities of the City’s two sewage treatment plants, sewage pumping stations, and collection systems for the City of Bridgeport. These funds are covered in the Finance Department’s Annual Financial Report, but not in this document. THE INTERNAL SERVICE FUND (2019 Adopted Total: $132,770,860-also included in General Fund Total above) was established by Ordinance to account for self-insured health benefit activities of the City, Board of Education (BOE) and all other departments. Governmental Accounting Standards allow for the use of Internal Service Funds for risk financing activities. The Internal Service Fund is a proprietary type fund, which utilizes the accrual basis of accounting. The use of a separate fund for self insured benefit activities can help smooth the impact of severe claims fluctuations which can now occur in the General Fund. Funding will be provided through the annual General Fund Budget which will separately identify the City, BOE, BOE Grants and Nutrition portions. The amount budgeted will be the amount transferred to the Internal Service Fund. Contributions will be also be made by the WPCA and Grants. Employee contributions will be made directly to the Internal Service Fund. Interest and investment income earned by the fund will be used to pay expenses of the fund. Investment of available funds will be made by the City Finance Director and Treasurer in accordance with Connecticut General Statutes.
FIDUCIARY FUNDS (2019 Adopted Total: N/A) Fiduciary funds are used to account for resources held for the benefit of parties outside the government. These funds are not reflected in government-side financial statements because the resources contained within these funds are not available to provide services for the City’s constituents. The City of Bridgeport has four pension trust funds that support the pensions of City employees. The accounting used for fiduciary funds is much like that used for proprietary funds, and again, is covered in some detail in the Finance Department’s Annual Financial Report, but not in this document.
36
FY 2018-2019 ADOPTED GENERAL FUND BUDGET BUDGET SUMMARY FUNDS BY DEPARTMENT
CITY OF BRIDGEPORT, CONNECTICUT
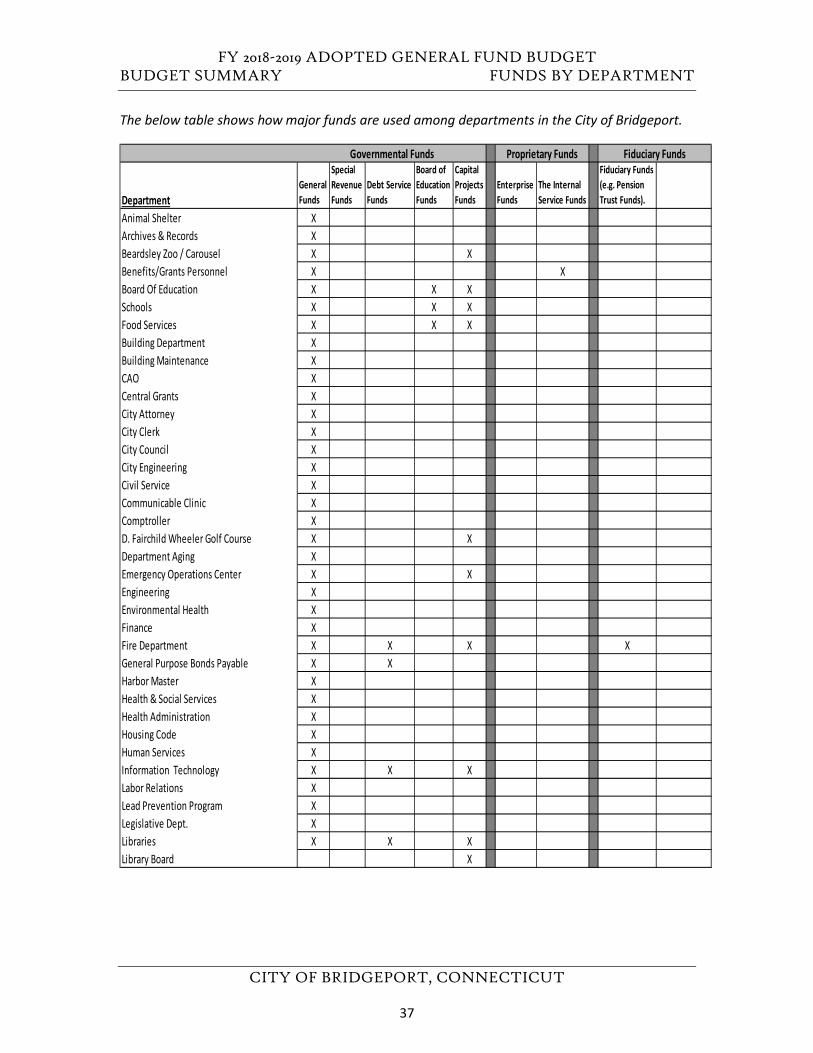
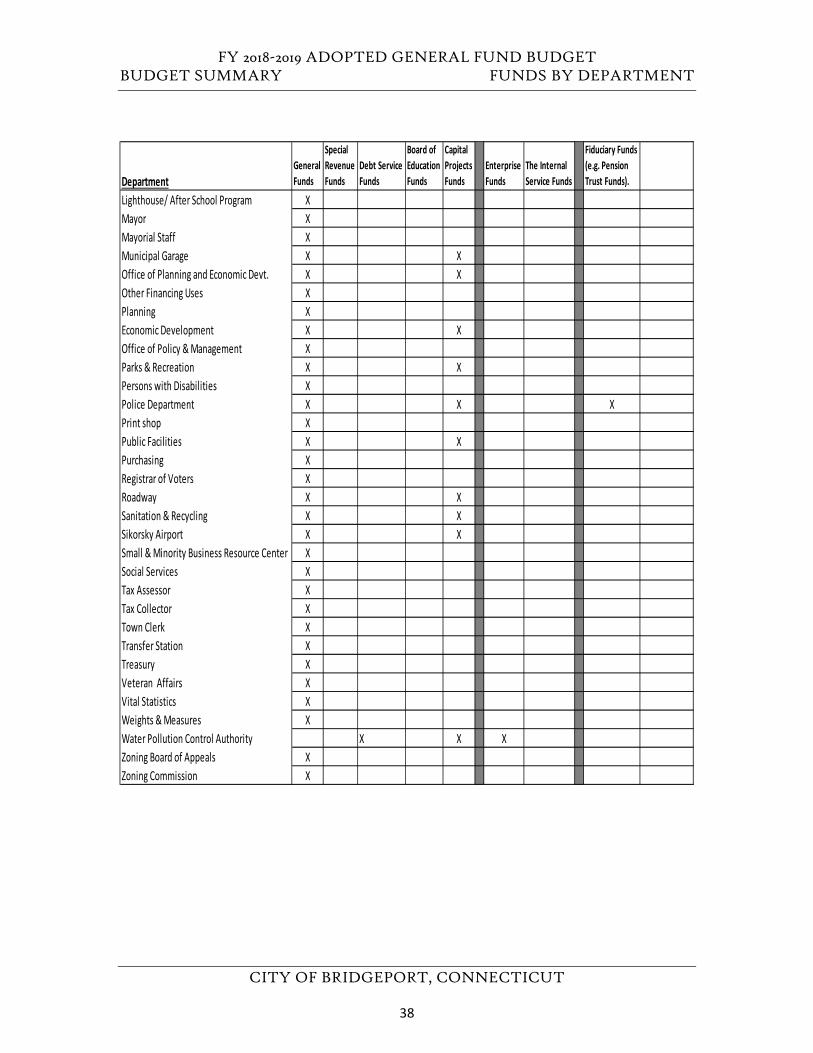
The below table shows how major funds are used among departments in the City of Bridgeport.
DepartmentGeneral Funds
Special Revenue Funds
Debt Service Funds
Board of Education Funds
Capital Projects Funds
Enterprise Funds
The Internal Service Funds
Fiduciary Funds (e.g. Pension Trust Funds).
Animal Shelter XArchives & Records XBeardsley Zoo / Carousel X XBenefits/Grants Personnel X XBoard Of Education X X XSchools X X XFood Services X X XBuilding Department XBuilding Maintenance XCAO XCentral Grants XCity Attorney XCity Clerk XCity Council XCity Engineering XCivil Service XCommunicable Clinic XComptroller XD. Fairchild Wheeler Golf Course X XDepartment Aging XEmergency Operations Center X XEngineering XEnvironmental Health XFinance XFire Department X X X XGeneral Purpose Bonds Payable X XHarbor Master XHealth & Social Services XHealth Administration XHousing Code XHuman Services XInformation Technology X X XLabor Relations XLead Prevention Program XLegislative Dept. XLibraries X X XLibrary Board X
Governmental Funds Proprietary Funds Fiduciary Funds
37
FY 2018-2019 ADOPTED GENERAL FUND BUDGET BUDGET SUMMARY FUNDS BY DEPARTMENT
CITY OF BRIDGEPORT, CONNECTICUT
DepartmentGeneral Funds
Special Revenue Funds
Debt Service Funds
Board of Education Funds
Capital Projects Funds
Enterprise Funds
The Internal Service Funds
Fiduciary Funds (e.g. Pension Trust Funds).
Lighthouse/ After School Program XMayor XMayorial Staff XMunicipal Garage X XOffice of Planning and Economic Devt. X XOther Financing Uses XPlanning XEconomic Development X XOffice of Policy & Management XParks & Recreation X XPersons with Disabilities XPolice Department X X XPrint shop XPublic Facilities X XPurchasing XRegistrar of Voters XRoadway X XSanitation & Recycling X XSikorsky Airport X XSmall & Minority Business Resource Center XSocial Services XTax Assessor XTax Collector XTown Clerk XTransfer Station XTreasury XVeteran Affairs XVital Statistics XWeights & Measures XWater Pollution Control Authority X X XZoning Board of Appeals XZoning Commission X
38
FY 2018-2019 ADOPTED GENERAL FUND BUDGET LONG-TERM FINANCIAL PLANNING
CITY OF BRIDGEPORT, CONNECTICUT
BUDGET, FINANCES AND LONG-TERM PLANNING
The annual budget serves as the foundation for the City of Bridgeport’s financial planning and control. The City has taken budgetary steps to ensure that it has ample contingencies to meet challenges and to continue to improve fund balances. The City receives significant state aid for city purposes, for education and for certain school capital projects. The City is fully funding all required pension obligations as recommended by actuaries.
The City has put into place certain long term planning measures, including the adoption of an annual five-year capital plan. In addition, the City uses multi-year budget planning for internal purposes for forecasting future budget needs. The City also enters into multi-year contracts for various services when beneficial with utility providers and certain health care providers. The City implements multi-year collective bargaining contracts whenever possible.
BRIDGEPORT’S MAJOR FINANCIAL INITIATIVES
The City has instituted significant cost-saving initiatives through charter revision, financial system upgrades, improvement of revenue collection, the restructuring of employee benefits, and renegotiations. In addition, the City is embarking on technology upgrades to improve public customer services such as online payment systems, expansion of web based operations and plans for fiber optic connectivity. Several major historic economic development initiatives will provide a significant boost to the tax base and to budgetary revenues. The City has also adopted several revenue enhancements including improved tax collections, award of several large new federal grants, and an effort to identify and revitalize certain city owned properties.
REVENUE COLLECTION INITIATIVES
The City has implemented innovative strategies for enhancing its tax revenues, accelerating its receipt of delinquent taxes, non-tax revenues and controlling costs. The City uses many methods to increase collection of real estate taxes, including heightened enforcement and the sale of tax liens. Tax lien sales have proven to be an effective management tool for collecting current and arrears taxes, interest and penalties. The Tax Collector’s Office conducts annual lien sales, generating tax, interest and lien revenues. The sale of liens enables the City to realize immediate financial benefit from delinquent taxes, and relieves the City of incurring the expense and delay associated with ongoing collection efforts. The City conducted its last tax lien sale in May 2017 netting over $2 million.
39
FY 2018-2019 ADOPTED GENERAL FUND BUDGET LONG-TERM FINANCIAL PLANNING
CITY OF BRIDGEPORT, CONNECTICUT
CITY INVESTMENT POLICY
Eligible investments for Connecticut municipalities are governed by the Connecticut General Statutes. It is the policy of the City to invest funds in a manner which will provide the highest investment return with the maximum security while meeting the daily cash flow demands of the City and conforming to all statutes governing the investment of funds. The City’s investment of cash and cash equivalents consist primarily of money market investments as well as money invested in the State Short-Term Investment Fund (“STIF”). Because the Connecticut General Statutes do not specify permitted investments for municipal pension funds, the investment of pension funds is generally controlled by the laws applicable to fiduciaries (i.e., prudent person rule) and the provisions of the applicable plan. In accordance with its policy for pension fund investments, the City seeks a long-term, above average total return consisting of capital appreciation and income, while placing an emphasis on preservation of the principal.
40
FY 2018-2019 ADOPTED GENERAL FUND BUDGET BUDGET SUMMARY BUDGET PROCESS
CITY OF BRIDGEPORT, CONNECTICUT
THE BUDGET PROCESS
MAYOR RECOMMENDED PREPARATION City departments begin preparation and documentation processes for the budget in January. The Office of Policy & Management reviews all submitted department requested documents; verifies contractual obligation thresholds, calculates all formula-driven data, and presents a draft budget to the Mayor and selected staff. In accordance with the City Charter, Chapter 9, Section 5(c) the Mayor, no later than the first Tuesday in April of each year, must present to the City Council a proposed budget for the ensuing fiscal year as prescribed in that same section.
CITY COUNCIL PROCESS The City Council’s Budget and Appropriations Committee, under City Council rules, will set a schedule for budget deliberations and in accordance with City Charter, shall hold at least one public hearing before taking final action on the proposed budget and mill rate. The City Council Budgets & Appropriations Committee reports its changes to the Council in the form of a budget amendment resolution. The City Council has the power to reduce or delete any item in the budget recommended by the Mayor by a majority vote of the council members present and voting. It shall have the power to increase any item in said budget or add new items to said budget only on a two-thirds (2/3) affirmative vote of the entire membership of the council. The budget adopted by the City Council shall be submitted to the Mayor not later than the second Tuesday in May of each year. The Mayor shall sign the adopted budget or within fourteen days after adoption of the budget, the Mayor may veto any action taken by the City Council. The veto power of the Mayor shall be that of line item veto only, and any such veto may be overridden by a two-thirds (2/3) vote of the entire membership of the City Council. If the Mayor shall disapprove any action of the City Council, he shall, no later than the close of business of the fourteenth day, return the proposed budget to the City Council with a statement of objections. Thereupon, the President of the City Council shall call a meeting to be held no later than seven days after the receipt of the Mayor’s veto. If the City Council fails to adopt a budget by the second Tuesday in May of any year, the proposed budget of the Mayor shall become the budget of the City for the ensuing year.
41
FY 2018-2019 ADOPTED GENERAL FUND BUDGET BUDGET SUMMARY BUDGET PROCESS
CITY OF BRIDGEPORT, CONNECTICUT
DAY
Friday Departments submit capital project requests and back-up to OPM
Friday Departments (including BOE) data enter budget requests into MUNIS
Mayor formulates General Fund Budget; budget goes to final production
Tuesday Mayor Submits Capital Budget to the City Council
Tuesday Per City Charter, Mayor submits Proposed Budgetto the City Council
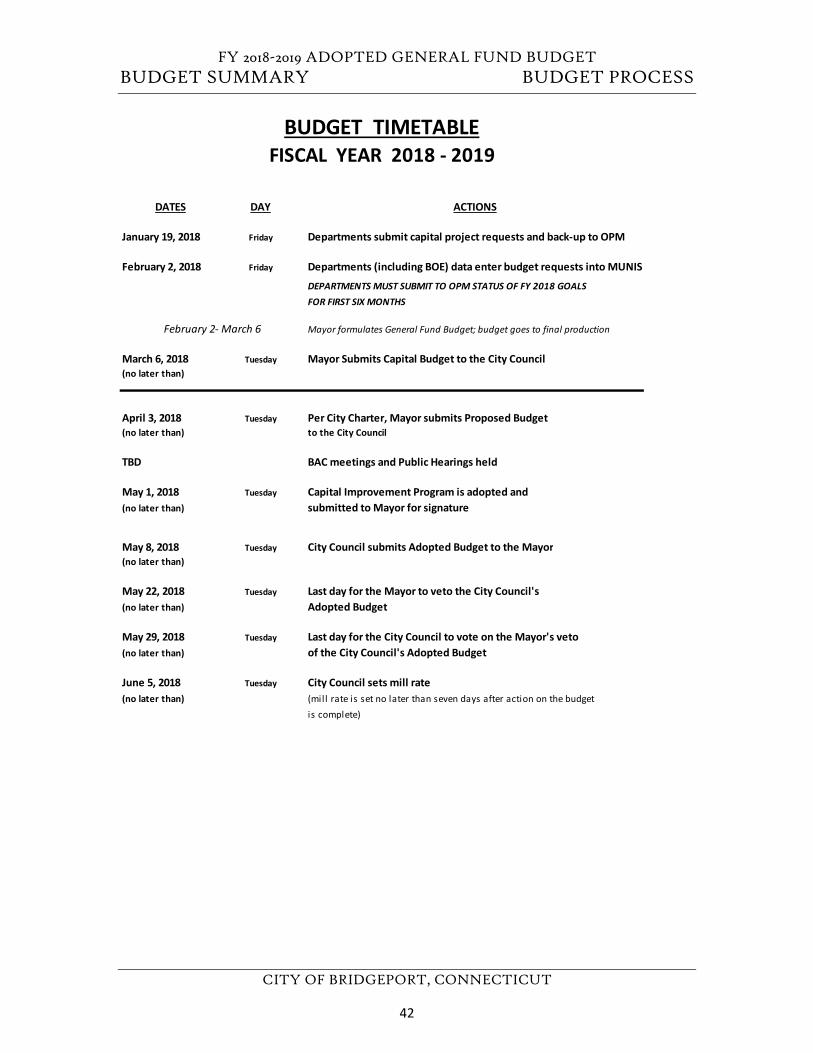
TBD BAC meetings and Public Hearings held
Tuesday Capital Improvement Program is adopted and submitted to Mayor for signature
Tuesday City Council submits Adopted Budget to the Mayor
Tuesday Last day for the Mayor to veto the City Council'sAdopted Budget
Tuesday Last day for the City Council to vote on the Mayor's vetoof the City Council's Adopted Budget
Tuesday City Council sets mill rate(mill rate is set no later than seven days after action on the budget is complete)
(no later than)
June 5, 2018(no later than)
May 8, 2018(no later than)
May 22, 2018(no later than)
May 29, 2018
(no later than)
April 3, 2018(no later than)
May 1, 2018(no later than)
February 2, 2018
DEPARTMENTS MUST SUBMIT TO OPM STATUS OF FY 2018 GOALSFOR FIRST SIX MONTHS
March 6, 2018
BUDGET TIMETABLEFISCAL YEAR 2018 - 2019
DATES ACTIONS
January 19, 2018
February 2- March 6
42
FY 2018-2019 ADOPTED GENERAL FUND BUDGET BUDGET SUMMARY APPROPRIATION SUMMARY
CITY OF BRIDGEPORT, CONNECTICUT
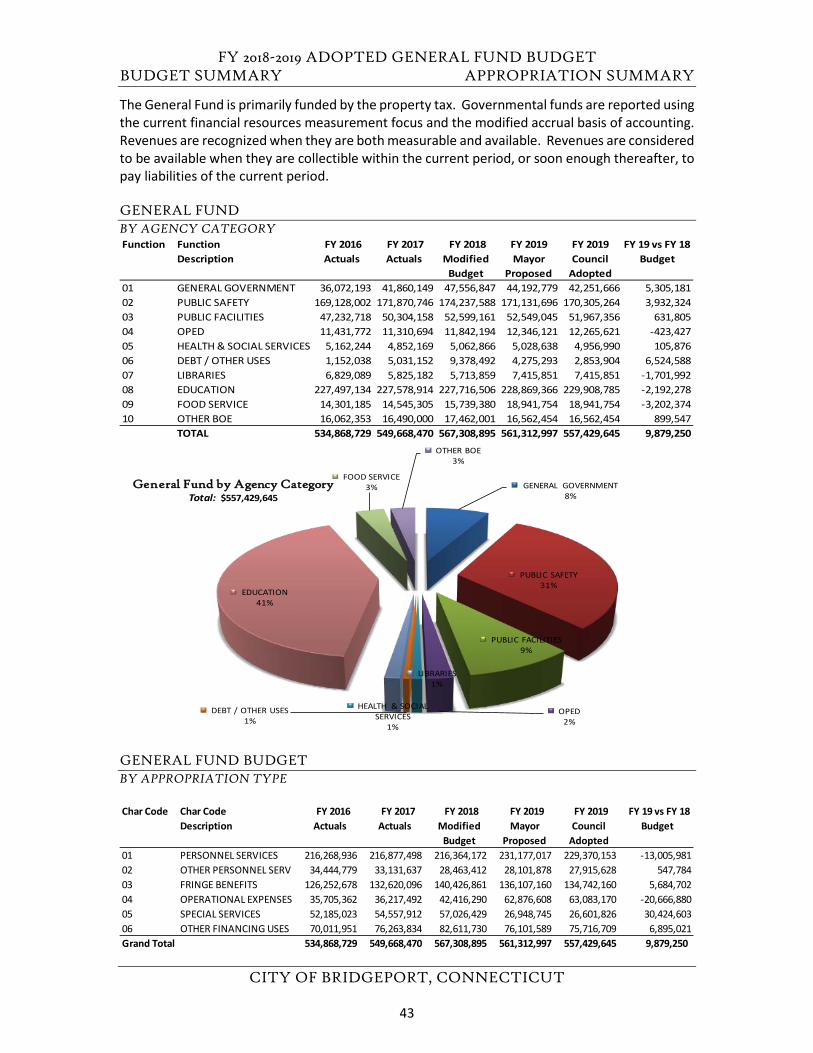
The General Fund is primarily funded by the property tax. Governmental funds are reported using the current financial resources measurement focus and the modified accrual basis of accounting. Revenues are recognized when they are both measurable and available. Revenues are considered to be available when they are collectible within the current period, or soon enough thereafter, to pay liabilities of the current period.
GENERAL FUND BY AGENCY CATEGORY
GENERAL FUND BUDGET BY APPROPRIATION TYPE
Function Function Description
FY 2016Actuals
FY 2017Actuals
FY 2018 Modified
Budget
FY 2019 Mayor
Proposed
FY 2019 Council
Adopted
FY 19 vs FY 18 Budget
01 GENERAL GOVERNMENT 36,072,193 41,860,149 47,556,847 44,192,779 42,251,666 5,305,18102 PUBLIC SAFETY 169,128,002 171,870,746 174,237,588 171,131,696 170,305,264 3,932,32403 PUBLIC FACILITIES 47,232,718 50,304,158 52,599,161 52,549,045 51,967,356 631,80504 OPED 11,431,772 11,310,694 11,842,194 12,346,121 12,265,621 -423,42705 HEALTH & SOCIAL SERVICES 5,162,244 4,852,169 5,062,866 5,028,638 4,956,990 105,87606 DEBT / OTHER USES 1,152,038 5,031,152 9,378,492 4,275,293 2,853,904 6,524,58807 LIBRARIES 6,829,089 5,825,182 5,713,859 7,415,851 7,415,851 -1,701,99208 EDUCATION 227,497,134 227,578,914 227,716,506 228,869,366 229,908,785 -2,192,27809 FOOD SERVICE 14,301,185 14,545,305 15,739,380 18,941,754 18,941,754 -3,202,37410 OTHER BOE 16,062,353 16,490,000 17,462,001 16,562,454 16,562,454 899,547
TOTAL 534,868,729 549,668,470 567,308,895 561,312,997 557,429,645 9,879,250
GENERAL GOVERNMENT8%
PUBLIC SAFETY31%
PUBLIC FACILITIES9%
OPED2%
HEALTH & SOCIAL SERVICES
1%
DEBT / OTHER USES1%
LIBRARIES1%
EDUCATION41%
FOOD SERVICE3%
OTHER BOE3%
General Fund by Agency CategoryTotal: $557,429,645
Char Code Char CodeDescription
FY 2016 Actuals
FY 2017 Actuals
FY 2018 Modified
Budget
FY 2019 Mayor
Proposed
FY 2019 Council
Adopted
FY 19 vs FY 18 Budget
01 PERSONNEL SERVICES 216,268,936 216,877,498 216,364,172 231,177,017 229,370,153 -13,005,98102 OTHER PERSONNEL SERV 34,444,779 33,131,637 28,463,412 28,101,878 27,915,628 547,78403 FRINGE BENEFITS 126,252,678 132,620,096 140,426,861 136,107,160 134,742,160 5,684,70204 OPERATIONAL EXPENSES 35,705,362 36,217,492 42,416,290 62,876,608 63,083,170 -20,666,88005 SPECIAL SERVICES 52,185,023 54,557,912 57,026,429 26,948,745 26,601,826 30,424,60306 OTHER FINANCING USES 70,011,951 76,263,834 82,611,730 76,101,589 75,716,709 6,895,021Grand Total 534,868,729 549,668,470 567,308,895 561,312,997 557,429,645 9,879,250
43
FY 2018-2019 ADOPTED GENERAL FUND BUDGET BUDGET SUMMARY REVENUE SUMMARY
CITY OF BRIDGEPORT, CONNECTICUT
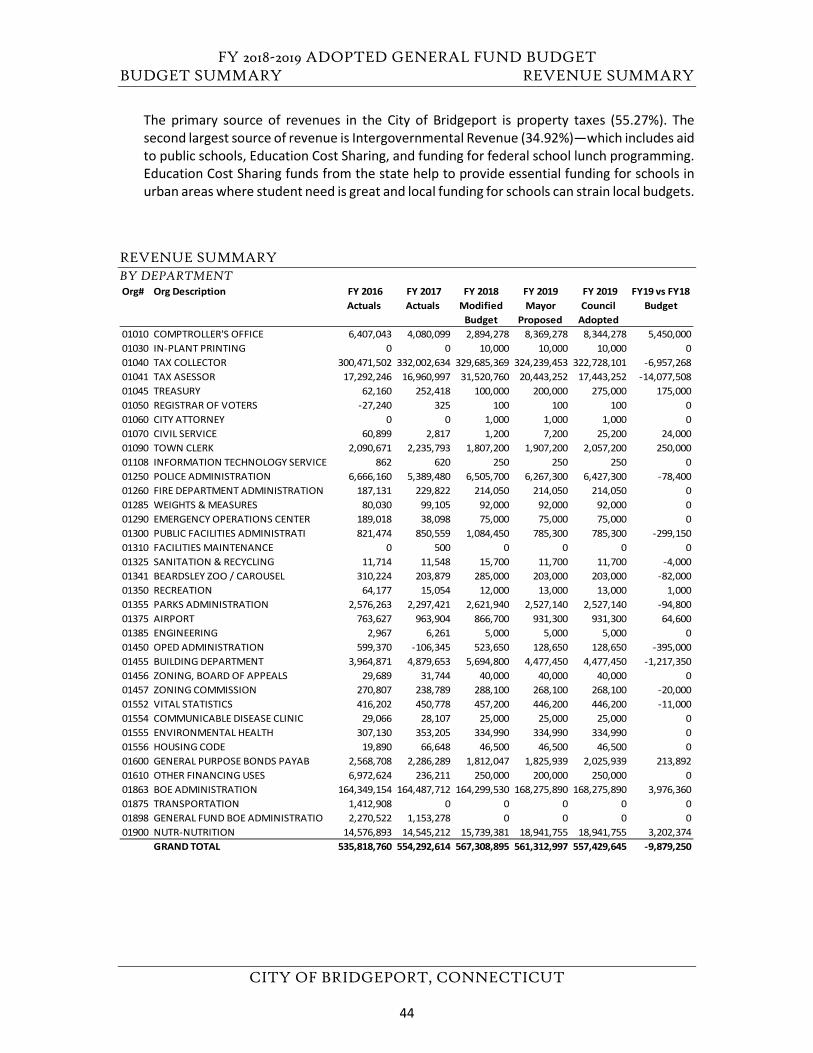
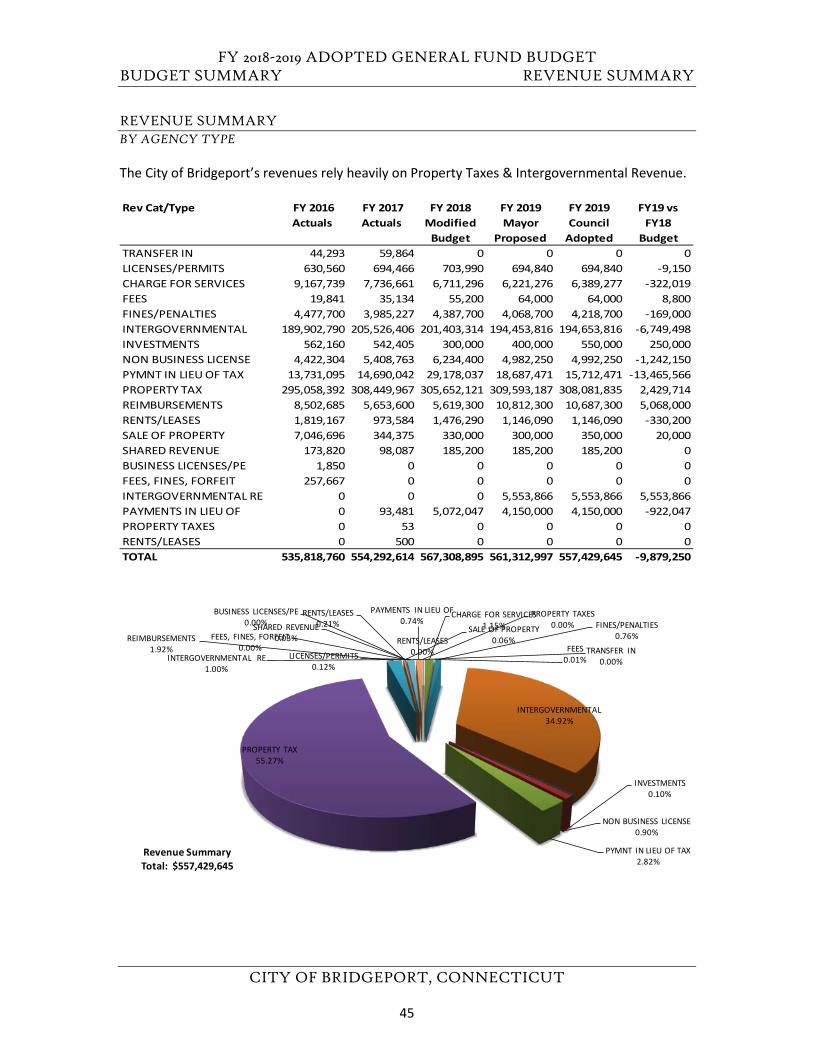
The primary source of revenues in the City of Bridgeport is property taxes (55.27%). The second largest source of revenue is Intergovernmental Revenue (34.92%)—which includes aid to public schools, Education Cost Sharing, and funding for federal school lunch programming. Education Cost Sharing funds from the state help to provide essential funding for schools in urban areas where student need is great and local funding for schools can strain local budgets.
REVENUE SUMMARY BY DEPARTMENT Org# Org Description FY 2016
Actuals FY 2017 Actuals
FY 2018 Modified
Budget
FY 2019 Mayor
Proposed
FY 2019 Council
Adopted
FY19 vs FY18 Budget
01010 COMPTROLLER'S OFFICE 6,407,043 4,080,099 2,894,278 8,369,278 8,344,278 5,450,00001030 IN-PLANT PRINTING 0 0 10,000 10,000 10,000 001040 TAX COLLECTOR 300,471,502 332,002,634 329,685,369 324,239,453 322,728,101 -6,957,26801041 TAX ASESSOR 17,292,246 16,960,997 31,520,760 20,443,252 17,443,252 -14,077,50801045 TREASURY 62,160 252,418 100,000 200,000 275,000 175,00001050 REGISTRAR OF VOTERS -27,240 325 100 100 100 001060 CITY ATTORNEY 0 0 1,000 1,000 1,000 001070 CIVIL SERVICE 60,899 2,817 1,200 7,200 25,200 24,00001090 TOWN CLERK 2,090,671 2,235,793 1,807,200 1,907,200 2,057,200 250,00001108 INFORMATION TECHNOLOGY SERVICE 862 620 250 250 250 001250 POLICE ADMINISTRATION 6,666,160 5,389,480 6,505,700 6,267,300 6,427,300 -78,40001260 FIRE DEPARTMENT ADMINISTRATION 187,131 229,822 214,050 214,050 214,050 001285 WEIGHTS & MEASURES 80,030 99,105 92,000 92,000 92,000 001290 EMERGENCY OPERATIONS CENTER 189,018 38,098 75,000 75,000 75,000 001300 PUBLIC FACILITIES ADMINISTRATI 821,474 850,559 1,084,450 785,300 785,300 -299,15001310 FACILITIES MAINTENANCE 0 500 0 0 0 001325 SANITATION & RECYCLING 11,714 11,548 15,700 11,700 11,700 -4,00001341 BEARDSLEY ZOO / CAROUSEL 310,224 203,879 285,000 203,000 203,000 -82,00001350 RECREATION 64,177 15,054 12,000 13,000 13,000 1,00001355 PARKS ADMINISTRATION 2,576,263 2,297,421 2,621,940 2,527,140 2,527,140 -94,80001375 AIRPORT 763,627 963,904 866,700 931,300 931,300 64,60001385 ENGINEERING 2,967 6,261 5,000 5,000 5,000 001450 OPED ADMINISTRATION 599,370 -106,345 523,650 128,650 128,650 -395,00001455 BUILDING DEPARTMENT 3,964,871 4,879,653 5,694,800 4,477,450 4,477,450 -1,217,35001456 ZONING, BOARD OF APPEALS 29,689 31,744 40,000 40,000 40,000 001457 ZONING COMMISSION 270,807 238,789 288,100 268,100 268,100 -20,00001552 VITAL STATISTICS 416,202 450,778 457,200 446,200 446,200 -11,00001554 COMMUNICABLE DISEASE CLINIC 29,066 28,107 25,000 25,000 25,000 001555 ENVIRONMENTAL HEALTH 307,130 353,205 334,990 334,990 334,990 001556 HOUSING CODE 19,890 66,648 46,500 46,500 46,500 001600 GENERAL PURPOSE BONDS PAYAB 2,568,708 2,286,289 1,812,047 1,825,939 2,025,939 213,89201610 OTHER FINANCING USES 6,972,624 236,211 250,000 200,000 250,000 001863 BOE ADMINISTRATION 164,349,154 164,487,712 164,299,530 168,275,890 168,275,890 3,976,36001875 TRANSPORTATION 1,412,908 0 0 0 0 001898 GENERAL FUND BOE ADMINISTRATIO 2,270,522 1,153,278 0 0 0 001900 NUTR-NUTRITION 14,576,893 14,545,212 15,739,381 18,941,755 18,941,755 3,202,374
GRAND TOTAL 535,818,760 554,292,614 567,308,895 561,312,997 557,429,645 -9,879,250
44
FY 2018-2019 ADOPTED GENERAL FUND BUDGET BUDGET SUMMARY REVENUE SUMMARY
CITY OF BRIDGEPORT, CONNECTICUT
REVENUE SUMMARY BY AGENCY TYPE
The City of Bridgeport’s revenues rely heavily on Property Taxes & Intergovernmental Revenue.
Rev Cat/Type FY 2016 Actuals
FY 2017 Actuals
FY 2018 Modified
Budget
FY 2019 Mayor
Proposed
FY 2019 Council
Adopted
FY19 vs FY18
BudgetTRANSFER IN 44,293 59,864 0 0 0 0LICENSES/PERMITS 630,560 694,466 703,990 694,840 694,840 -9,150CHARGE FOR SERVICES 9,167,739 7,736,661 6,711,296 6,221,276 6,389,277 -322,019FEES 19,841 35,134 55,200 64,000 64,000 8,800FINES/PENALTIES 4,477,700 3,985,227 4,387,700 4,068,700 4,218,700 -169,000INTERGOVERNMENTAL 189,902,790 205,526,406 201,403,314 194,453,816 194,653,816 -6,749,498INVESTMENTS 562,160 542,405 300,000 400,000 550,000 250,000NON BUSINESS LICENSE 4,422,304 5,408,763 6,234,400 4,982,250 4,992,250 -1,242,150PYMNT IN LIEU OF TAX 13,731,095 14,690,042 29,178,037 18,687,471 15,712,471 -13,465,566PROPERTY TAX 295,058,392 308,449,967 305,652,121 309,593,187 308,081,835 2,429,714REIMBURSEMENTS 8,502,685 5,653,600 5,619,300 10,812,300 10,687,300 5,068,000RENTS/LEASES 1,819,167 973,584 1,476,290 1,146,090 1,146,090 -330,200SALE OF PROPERTY 7,046,696 344,375 330,000 300,000 350,000 20,000SHARED REVENUE 173,820 98,087 185,200 185,200 185,200 0BUSINESS LICENSES/PE 1,850 0 0 0 0 0FEES, FINES, FORFEIT 257,667 0 0 0 0 0INTERGOVERNMENTAL RE 0 0 0 5,553,866 5,553,866 5,553,866PAYMENTS IN LIEU OF 0 93,481 5,072,047 4,150,000 4,150,000 -922,047PROPERTY TAXES 0 53 0 0 0 0RENTS/LEASES 0 500 0 0 0 0TOTAL 535,818,760 554,292,614 567,308,895 561,312,997 557,429,645 -9,879,250
TRANSFER IN0.00%
LICENSES/PERMITS0.12%
CHARGE FOR SERVICES1.15%
FEES0.01%
FINES/PENALTIES0.76%
INTERGOVERNMENTAL34.92%
INVESTMENTS0.10%
NON BUSINESS LICENSE0.90%
PYMNT IN LIEU OF TAX2.82%
PROPERTY TAX55.27%
REIMBURSEMENTS1.92%
RENTS/LEASES0.21% SALE OF PROPERTY
0.06%SHARED REVENUE
0.03%
BUSINESS LICENSES/PE0.00%
FEES, FINES, FORFEIT0.00%
INTERGOVERNMENTAL RE1.00%
PAYMENTS IN LIEU OF0.74%
PROPERTY TAXES0.00%
RENTS/LEASES0.00%
Revenue SummaryTotal: $557,429,645
45
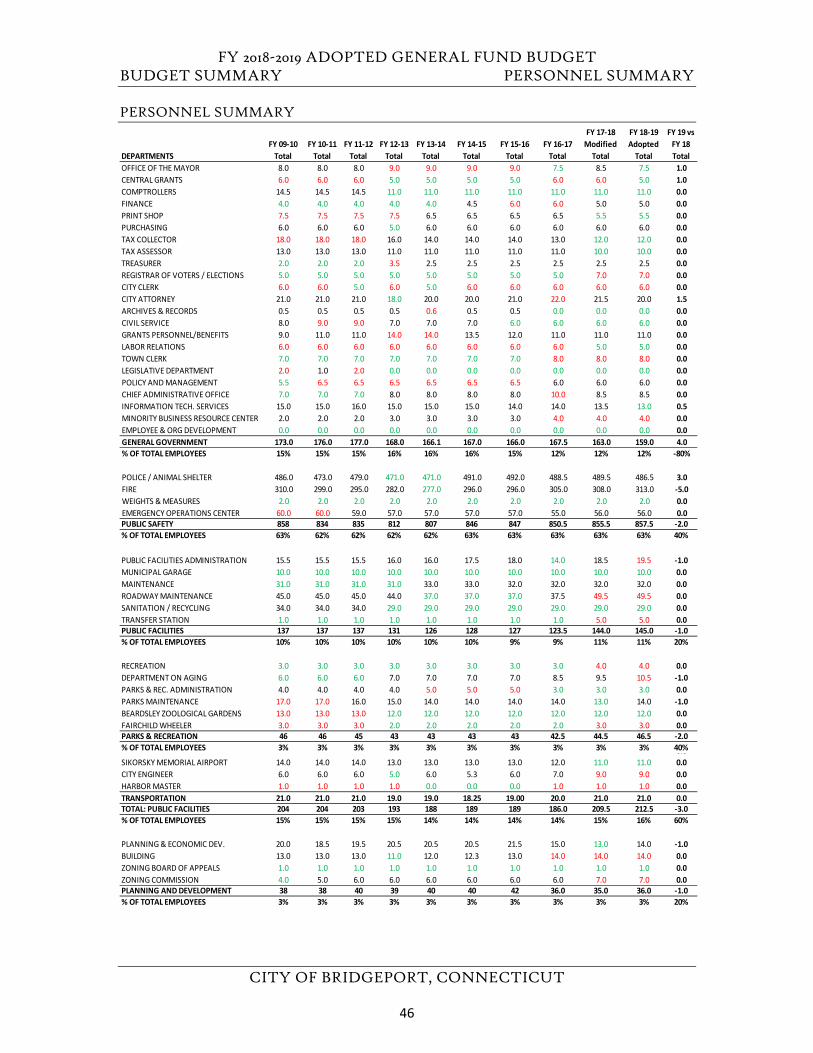
FY 2018-2019 ADOPTED GENERAL FUND BUDGET BUDGET SUMMARY PERSONNEL SUMMARY
CITY OF BRIDGEPORT, CONNECTICUT
PERSONNEL SUMMARY
FY 09-10 FY 10-11 FY 11-12 FY 12-13 FY 13-14 FY 14-15 FY 15-16 FY 16-17 FY 17-18
ModifiedFY 18-19 Adopted
FY 19 vs FY 18
DEPARTMENTS Total Total Total Total Total Total Total Total Total Total TotalOFFICE OF THE MAYOR 8.0 8.0 8.0 9.0 9.0 9.0 9.0 7.5 8.5 7.5 1.0CENTRAL GRANTS 6.0 6.0 6.0 5.0 5.0 5.0 5.0 6.0 6.0 5.0 1.0COMPTROLLERS 14.5 14.5 14.5 11.0 11.0 11.0 11.0 11.0 11.0 11.0 0.0FINANCE 4.0 4.0 4.0 4.0 4.0 4.5 6.0 6.0 5.0 5.0 0.0PRINT SHOP 7.5 7.5 7.5 7.5 6.5 6.5 6.5 6.5 5.5 5.5 0.0PURCHASING 6.0 6.0 6.0 5.0 6.0 6.0 6.0 6.0 6.0 6.0 0.0TAX COLLECTOR 18.0 18.0 18.0 16.0 14.0 14.0 14.0 13.0 12.0 12.0 0.0TAX ASSESSOR 13.0 13.0 13.0 11.0 11.0 11.0 11.0 11.0 10.0 10.0 0.0TREASURER 2.0 2.0 2.0 3.5 2.5 2.5 2.5 2.5 2.5 2.5 0.0REGISTRAR OF VOTERS / ELECTIONS 5.0 5.0 5.0 5.0 5.0 5.0 5.0 5.0 7.0 7.0 0.0CITY CLERK 6.0 6.0 5.0 6.0 5.0 6.0 6.0 6.0 6.0 6.0 0.0CITY ATTORNEY 21.0 21.0 21.0 18.0 20.0 20.0 21.0 22.0 21.5 20.0 1.5ARCHIVES & RECORDS 0.5 0.5 0.5 0.5 0.6 0.5 0.5 0.0 0.0 0.0 0.0CIVIL SERVICE 8.0 9.0 9.0 7.0 7.0 7.0 6.0 6.0 6.0 6.0 0.0GRANTS PERSONNEL/BENEFITS 9.0 11.0 11.0 14.0 14.0 13.5 12.0 11.0 11.0 11.0 0.0LABOR RELATIONS 6.0 6.0 6.0 6.0 6.0 6.0 6.0 6.0 5.0 5.0 0.0TOWN CLERK 7.0 7.0 7.0 7.0 7.0 7.0 7.0 8.0 8.0 8.0 0.0LEGISLATIVE DEPARTMENT 2.0 1.0 2.0 0.0 0.0 0.0 0.0 0.0 0.0 0.0 0.0POLICY AND MANAGEMENT 5.5 6.5 6.5 6.5 6.5 6.5 6.5 6.0 6.0 6.0 0.0CHIEF ADMINISTRATIVE OFFICE 7.0 7.0 7.0 8.0 8.0 8.0 8.0 10.0 8.5 8.5 0.0INFORMATION TECH. SERVICES 15.0 15.0 16.0 15.0 15.0 15.0 14.0 14.0 13.5 13.0 0.5MINORITY BUSINESS RESOURCE CENTER 2.0 2.0 2.0 3.0 3.0 3.0 3.0 4.0 4.0 4.0 0.0EMPLOYEE & ORG DEVELOPMENT 0.0 0.0 0.0 0.0 0.0 0.0 0.0 0.0 0.0 0.0 0.0GENERAL GOVERNMENT 173.0 176.0 177.0 168.0 166.1 167.0 166.0 167.5 163.0 159.0 4.0% OF TOTAL EMPLOYEES 15% 15% 15% 16% 16% 16% 15% 12% 12% 12% -80%
POLICE / ANIMAL SHELTER 486.0 473.0 479.0 471.0 471.0 491.0 492.0 488.5 489.5 486.5 3.0FIRE 310.0 299.0 295.0 282.0 277.0 296.0 296.0 305.0 308.0 313.0 -5.0WEIGHTS & MEASURES 2.0 2.0 2.0 2.0 2.0 2.0 2.0 2.0 2.0 2.0 0.0EMERGENCY OPERATIONS CENTER 60.0 60.0 59.0 57.0 57.0 57.0 57.0 55.0 56.0 56.0 0.0PUBLIC SAFETY 858 834 835 812 807 846 847 850.5 855.5 857.5 -2.0% OF TOTAL EMPLOYEES 63% 62% 62% 62% 62% 63% 63% 63% 63% 63% 40%
PUBLIC FACILITIES ADMINISTRATION 15.5 15.5 15.5 16.0 16.0 17.5 18.0 14.0 18.5 19.5 -1.0MUNICIPAL GARAGE 10.0 10.0 10.0 10.0 10.0 10.0 10.0 10.0 10.0 10.0 0.0MAINTENANCE 31.0 31.0 31.0 31.0 33.0 33.0 32.0 32.0 32.0 32.0 0.0ROADWAY MAINTENANCE 45.0 45.0 45.0 44.0 37.0 37.0 37.0 37.5 49.5 49.5 0.0SANITATION / RECYCLING 34.0 34.0 34.0 29.0 29.0 29.0 29.0 29.0 29.0 29.0 0.0TRANSFER STATION 1.0 1.0 1.0 1.0 1.0 1.0 1.0 1.0 5.0 5.0 0.0PUBLIC FACILITIES 137 137 137 131 126 128 127 123.5 144.0 145.0 -1.0% OF TOTAL EMPLOYEES 10% 10% 10% 10% 10% 10% 9% 9% 11% 11% 20%
RECREATION 3.0 3.0 3.0 3.0 3.0 3.0 3.0 3.0 4.0 4.0 0.0DEPARTMENT ON AGING 6.0 6.0 6.0 7.0 7.0 7.0 7.0 8.5 9.5 10.5 -1.0PARKS & REC. ADMINISTRATION 4.0 4.0 4.0 4.0 5.0 5.0 5.0 3.0 3.0 3.0 0.0PARKS MAINTENANCE 17.0 17.0 16.0 15.0 14.0 14.0 14.0 14.0 13.0 14.0 -1.0BEARDSLEY ZOOLOGICAL GARDENS 13.0 13.0 13.0 12.0 12.0 12.0 12.0 12.0 12.0 12.0 0.0FAIRCHILD WHEELER 3.0 3.0 3.0 2.0 2.0 2.0 2.0 2.0 3.0 3.0 0.0PARKS & RECREATION 46 46 45 43 43 43 43 42.5 44.5 46.5 -2.0% OF TOTAL EMPLOYEES 3% 3% 3% 3% 3% 3% 3% 3% 3% 3% 40%0.0SIKORSKY MEMORIAL AIRPORT 14.0 14.0 14.0 13.0 13.0 13.0 13.0 12.0 11.0 11.0 0.0CITY ENGINEER 6.0 6.0 6.0 5.0 6.0 5.3 6.0 7.0 9.0 9.0 0.0HARBOR MASTER 1.0 1.0 1.0 1.0 0.0 0.0 0.0 1.0 1.0 1.0 0.0TRANSPORTATION 21.0 21.0 21.0 19.0 19.0 18.25 19.00 20.0 21.0 21.0 0.0TOTAL: PUBLIC FACILITIES 204 204 203 193 188 189 189 186.0 209.5 212.5 -3.0% OF TOTAL EMPLOYEES 15% 15% 15% 15% 14% 14% 14% 14% 15% 16% 60%
PLANNING & ECONOMIC DEV. 20.0 18.5 19.5 20.5 20.5 20.5 21.5 15.0 13.0 14.0 -1.0BUILDING 13.0 13.0 13.0 11.0 12.0 12.3 13.0 14.0 14.0 14.0 0.0ZONING BOARD OF APPEALS 1.0 1.0 1.0 1.0 1.0 1.0 1.0 1.0 1.0 1.0 0.0ZONING COMMISSION 4.0 5.0 6.0 6.0 6.0 6.0 6.0 6.0 7.0 7.0 0.0PLANNING AND DEVELOPMENT 38 38 40 39 40 40 42 36.0 35.0 36.0 -1.0% OF TOTAL EMPLOYEES 3% 3% 3% 3% 3% 3% 3% 3% 3% 3% 20%
46
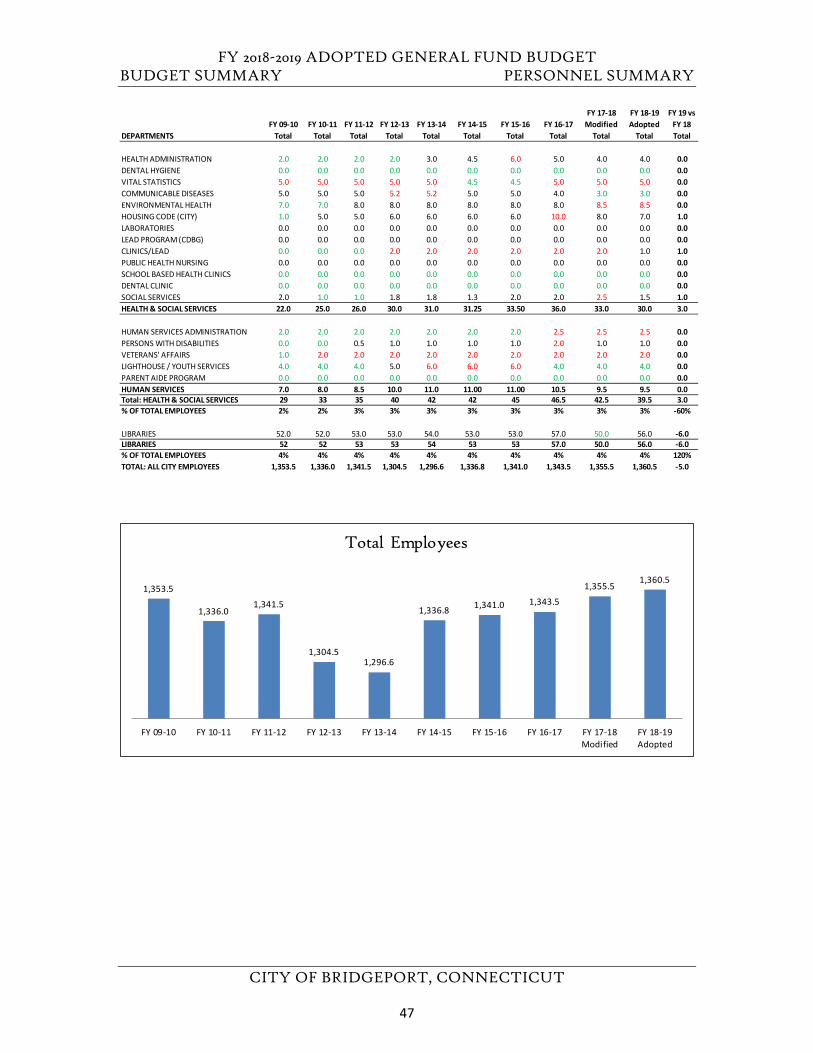
FY 2018-2019 ADOPTED GENERAL FUND BUDGET BUDGET SUMMARY PERSONNEL SUMMARY
CITY OF BRIDGEPORT, CONNECTICUT
FY 09-10 FY 10-11 FY 11-12 FY 12-13 FY 13-14 FY 14-15 FY 15-16 FY 16-17 FY 17-18
ModifiedFY 18-19 Adopted
FY 19 vs FY 18
DEPARTMENTS Total Total Total Total Total Total Total Total Total Total Total
HEALTH ADMINISTRATION 2.0 2.0 2.0 2.0 3.0 4.5 6.0 5.0 4.0 4.0 0.0DENTAL HYGIENE 0.0 0.0 0.0 0.0 0.0 0.0 0.0 0.0 0.0 0.0 0.0VITAL STATISTICS 5.0 5.0 5.0 5.0 5.0 4.5 4.5 5.0 5.0 5.0 0.0COMMUNICABLE DISEASES 5.0 5.0 5.0 5.2 5.2 5.0 5.0 4.0 3.0 3.0 0.0ENVIRONMENTAL HEALTH 7.0 7.0 8.0 8.0 8.0 8.0 8.0 8.0 8.5 8.5 0.0HOUSING CODE (CITY) 1.0 5.0 5.0 6.0 6.0 6.0 6.0 10.0 8.0 7.0 1.0LABORATORIES 0.0 0.0 0.0 0.0 0.0 0.0 0.0 0.0 0.0 0.0 0.0LEAD PROGRAM (CDBG) 0.0 0.0 0.0 0.0 0.0 0.0 0.0 0.0 0.0 0.0 0.0CLINICS/LEAD 0.0 0.0 0.0 2.0 2.0 2.0 2.0 2.0 2.0 1.0 1.0PUBLIC HEALTH NURSING 0.0 0.0 0.0 0.0 0.0 0.0 0.0 0.0 0.0 0.0 0.0SCHOOL BASED HEALTH CLINICS 0.0 0.0 0.0 0.0 0.0 0.0 0.0 0.0 0.0 0.0 0.0DENTAL CLINIC 0.0 0.0 0.0 0.0 0.0 0.0 0.0 0.0 0.0 0.0 0.0SOCIAL SERVICES 2.0 1.0 1.0 1.8 1.8 1.3 2.0 2.0 2.5 1.5 1.0HEALTH & SOCIAL SERVICES 22.0 25.0 26.0 30.0 31.0 31.25 33.50 36.0 33.0 30.0 3.0
HUMAN SERVICES ADMINISTRATION 2.0 2.0 2.0 2.0 2.0 2.0 2.0 2.5 2.5 2.5 0.0PERSONS WITH DISABILITIES 0.0 0.0 0.5 1.0 1.0 1.0 1.0 2.0 1.0 1.0 0.0VETERANS' AFFAIRS 1.0 2.0 2.0 2.0 2.0 2.0 2.0 2.0 2.0 2.0 0.0LIGHTHOUSE / YOUTH SERVICES 4.0 4.0 4.0 5.0 6.0 6.0 6.0 4.0 4.0 4.0 0.0PARENT AIDE PROGRAM 0.0 0.0 0.0 0.0 0.0 0.0 0.0 0.0 0.0 0.0 0.0HUMAN SERVICES 7.0 8.0 8.5 10.0 11.0 11.00 11.00 10.5 9.5 9.5 0.0Total: HEALTH & SOCIAL SERVICES 29 33 35 40 42 42 45 46.5 42.5 39.5 3.0% OF TOTAL EMPLOYEES 2% 2% 3% 3% 3% 3% 3% 3% 3% 3% -60%
LIBRARIES 52.0 52.0 53.0 53.0 54.0 53.0 53.0 57.0 50.0 56.0 -6.0LIBRARIES 52 52 53 53 54 53 53 57.0 50.0 56.0 -6.0% OF TOTAL EMPLOYEES 4% 4% 4% 4% 4% 4% 4% 4% 4% 4% 120%TOTAL: ALL CITY EMPLOYEES 1,353.5 1,336.0 1,341.5 1,304.5 1,296.6 1,336.8 1,341.0 1,343.5 1,355.5 1,360.5 -5.0
1,353.5
1,336.01,341.5
1,304.51,296.6
1,336.8 1,341.0 1,343.5
1,355.51,360.5
FY 09-10 FY 10-11 FY 11-12 FY 12-13 FY 13-14 FY 14-15 FY 15-16 FY 16-17 FY 17-18Modified
FY 18-19Adopted
Total Employees
47
FY 2018-2019 ADOPTED GENERAL FUND BUDGET BUDGET SUMMARY INTERNAL SERVICE FUND
CITY OF BRIDGEPORT, CONNECTICUT
INTERNAL SERVICE FUND The City, by Ordinance, established an Internal Service Fund to account for self-insured health
benefit activities of the City, Board of Education and all other departments. Governmental
Accounting Standards allow for the use of Internal Service Funds for risk financing activities. The
Internal Service Fund is a proprietary type fund, which utilizes the accrual basis of accounting. The
use of a separate fund, an Internal Service Fund for self-insured benefit activities, can help smooth
the impact of severe claims fluctuations which can now occur in the General Fund. Funding will
be provided through the annual General Fund Budget which will separately identify the City, BOE
and Nutrition portions. The amount budgeted will be the amount transferred to the Internal
Service Fund. Contributions will be also made by the WPCA and Grants. Employee contributions
will be made directly to the Internal Service Fund. Interest and investment income earned by the
fund will be used to pay expenses of the fund. Investment of available funds will be made by the
City Finance Director and Treasurer in accordance with Connecticut General Statutes.
48
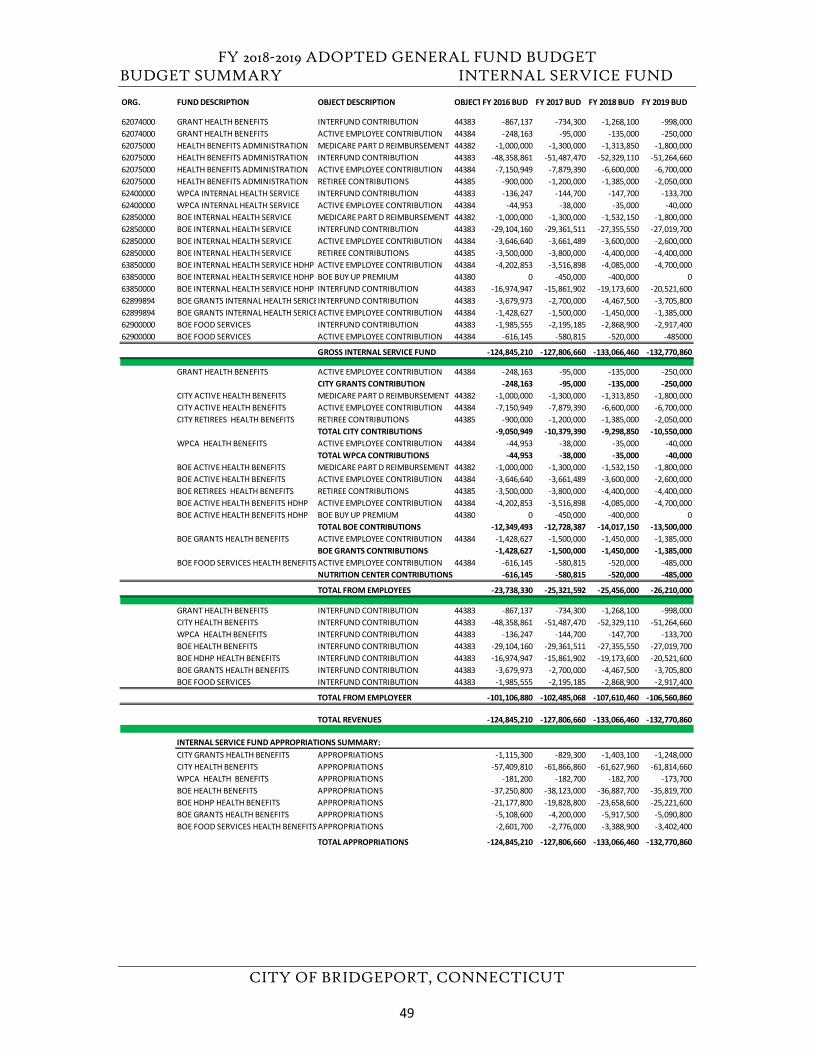
FY 2018-2019 ADOPTED GENERAL FUND BUDGET BUDGET SUMMARY INTERNAL SERVICE FUND
CITY OF BRIDGEPORT, CONNECTICUT
ORG. FUND DESCRIPTION OBJECT DESCRIPTION OBJECTFY 2016 BUD FY 2017 BUD FY 2018 BUD FY 2019 BUD
62074000 GRANT HEALTH BENEFITS INTERFUND CONTRIBUTION 44383 -867,137 -734,300 -1,268,100 -998,00062074000 GRANT HEALTH BENEFITS ACTIVE EMPLOYEE CONTRIBUTION 44384 -248,163 -95,000 -135,000 -250,00062075000 HEALTH BENEFITS ADMINISTRATION MEDICARE PART D REIMBURSEMENT 44382 -1,000,000 -1,300,000 -1,313,850 -1,800,00062075000 HEALTH BENEFITS ADMINISTRATION INTERFUND CONTRIBUTION 44383 -48,358,861 -51,487,470 -52,329,110 -51,264,66062075000 HEALTH BENEFITS ADMINISTRATION ACTIVE EMPLOYEE CONTRIBUTION 44384 -7,150,949 -7,879,390 -6,600,000 -6,700,00062075000 HEALTH BENEFITS ADMINISTRATION RETIREE CONTRIBUTIONS 44385 -900,000 -1,200,000 -1,385,000 -2,050,00062400000 WPCA INTERNAL HEALTH SERVICE INTERFUND CONTRIBUTION 44383 -136,247 -144,700 -147,700 -133,70062400000 WPCA INTERNAL HEALTH SERVICE ACTIVE EMPLOYEE CONTRIBUTION 44384 -44,953 -38,000 -35,000 -40,00062850000 BOE INTERNAL HEALTH SERVICE MEDICARE PART D REIMBURSEMENT 44382 -1,000,000 -1,300,000 -1,532,150 -1,800,00062850000 BOE INTERNAL HEALTH SERVICE INTERFUND CONTRIBUTION 44383 -29,104,160 -29,361,511 -27,355,550 -27,019,70062850000 BOE INTERNAL HEALTH SERVICE ACTIVE EMPLOYEE CONTRIBUTION 44384 -3,646,640 -3,661,489 -3,600,000 -2,600,00062850000 BOE INTERNAL HEALTH SERVICE RETIREE CONTRIBUTIONS 44385 -3,500,000 -3,800,000 -4,400,000 -4,400,00063850000 BOE INTERNAL HEALTH SERVICE HDHP ACTIVE EMPLOYEE CONTRIBUTION 44384 -4,202,853 -3,516,898 -4,085,000 -4,700,00063850000 BOE INTERNAL HEALTH SERVICE HDHP BOE BUY UP PREMIUM 44380 0 -450,000 -400,000 063850000 BOE INTERNAL HEALTH SERVICE HDHP INTERFUND CONTRIBUTION 44383 -16,974,947 -15,861,902 -19,173,600 -20,521,60062899894 BOE GRANTS INTERNAL HEALTH SERICEINTERFUND CONTRIBUTION 44383 -3,679,973 -2,700,000 -4,467,500 -3,705,80062899894 BOE GRANTS INTERNAL HEALTH SERICEACTIVE EMPLOYEE CONTRIBUTION 44384 -1,428,627 -1,500,000 -1,450,000 -1,385,00062900000 BOE FOOD SERVICES INTERFUND CONTRIBUTION 44383 -1,985,555 -2,195,185 -2,868,900 -2,917,40062900000 BOE FOOD SERVICES ACTIVE EMPLOYEE CONTRIBUTION 44384 -616,145 -580,815 -520,000 -485000
GROSS INTERNAL SERVICE FUND -124,845,210 -127,806,660 -133,066,460 -132,770,860
GRANT HEALTH BENEFITS ACTIVE EMPLOYEE CONTRIBUTION 44384 -248,163 -95,000 -135,000 -250,000CITY GRANTS CONTRIBUTION -248,163 -95,000 -135,000 -250,000
CITY ACTIVE HEALTH BENEFITS MEDICARE PART D REIMBURSEMENT 44382 -1,000,000 -1,300,000 -1,313,850 -1,800,000CITY ACTIVE HEALTH BENEFITS ACTIVE EMPLOYEE CONTRIBUTION 44384 -7,150,949 -7,879,390 -6,600,000 -6,700,000CITY RETIREES HEALTH BENEFITS RETIREE CONTRIBUTIONS 44385 -900,000 -1,200,000 -1,385,000 -2,050,000
TOTAL CITY CONTRIBUTIONS -9,050,949 -10,379,390 -9,298,850 -10,550,000WPCA HEALTH BENEFITS ACTIVE EMPLOYEE CONTRIBUTION 44384 -44,953 -38,000 -35,000 -40,000
TOTAL WPCA CONTRIBUTIONS -44,953 -38,000 -35,000 -40,000BOE ACTIVE HEALTH BENEFITS MEDICARE PART D REIMBURSEMENT 44382 -1,000,000 -1,300,000 -1,532,150 -1,800,000BOE ACTIVE HEALTH BENEFITS ACTIVE EMPLOYEE CONTRIBUTION 44384 -3,646,640 -3,661,489 -3,600,000 -2,600,000BOE RETIREES HEALTH BENEFITS RETIREE CONTRIBUTIONS 44385 -3,500,000 -3,800,000 -4,400,000 -4,400,000BOE ACTIVE HEALTH BENEFITS HDHP ACTIVE EMPLOYEE CONTRIBUTION 44384 -4,202,853 -3,516,898 -4,085,000 -4,700,000BOE ACTIVE HEALTH BENEFITS HDHP BOE BUY UP PREMIUM 44380 0 -450,000 -400,000 0
TOTAL BOE CONTRIBUTIONS -12,349,493 -12,728,387 -14,017,150 -13,500,000BOE GRANTS HEALTH BENEFITS ACTIVE EMPLOYEE CONTRIBUTION 44384 -1,428,627 -1,500,000 -1,450,000 -1,385,000
BOE GRANTS CONTRIBUTIONS -1,428,627 -1,500,000 -1,450,000 -1,385,000BOE FOOD SERVICES HEALTH BENEFITS ACTIVE EMPLOYEE CONTRIBUTION 44384 -616,145 -580,815 -520,000 -485,000
NUTRITION CENTER CONTRIBUTIONS -616,145 -580,815 -520,000 -485,000
TOTAL FROM EMPLOYEES -23,738,330 -25,321,592 -25,456,000 -26,210,000
GRANT HEALTH BENEFITS INTERFUND CONTRIBUTION 44383 -867,137 -734,300 -1,268,100 -998,000CITY HEALTH BENEFITS INTERFUND CONTRIBUTION 44383 -48,358,861 -51,487,470 -52,329,110 -51,264,660WPCA HEALTH BENEFITS INTERFUND CONTRIBUTION 44383 -136,247 -144,700 -147,700 -133,700BOE HEALTH BENEFITS INTERFUND CONTRIBUTION 44383 -29,104,160 -29,361,511 -27,355,550 -27,019,700BOE HDHP HEALTH BENEFITS INTERFUND CONTRIBUTION 44383 -16,974,947 -15,861,902 -19,173,600 -20,521,600BOE GRANTS HEALTH BENEFITS INTERFUND CONTRIBUTION 44383 -3,679,973 -2,700,000 -4,467,500 -3,705,800BOE FOOD SERVICES INTERFUND CONTRIBUTION 44383 -1,985,555 -2,195,185 -2,868,900 -2,917,400
TOTAL FROM EMPLOYEER -101,106,880 -102,485,068 -107,610,460 -106,560,860
TOTAL REVENUES -124,845,210 -127,806,660 -133,066,460 -132,770,860
INTERNAL SERVICE FUND APPROPRIATIONS SUMMARY:CITY GRANTS HEALTH BENEFITS APPROPRIATIONS -1,115,300 -829,300 -1,403,100 -1,248,000CITY HEALTH BENEFITS APPROPRIATIONS -57,409,810 -61,866,860 -61,627,960 -61,814,660WPCA HEALTH BENEFITS APPROPRIATIONS -181,200 -182,700 -182,700 -173,700BOE HEALTH BENEFITS APPROPRIATIONS -37,250,800 -38,123,000 -36,887,700 -35,819,700BOE HDHP HEALTH BENEFITS APPROPRIATIONS -21,177,800 -19,828,800 -23,658,600 -25,221,600BOE GRANTS HEALTH BENEFITS APPROPRIATIONS -5,108,600 -4,200,000 -5,917,500 -5,090,800BOE FOOD SERVICES HEALTH BENEFITS APPROPRIATIONS -2,601,700 -2,776,000 -3,388,900 -3,402,400
TOTAL APPROPRIATIONS -124,845,210 -127,806,660 -133,066,460 -132,770,860
49
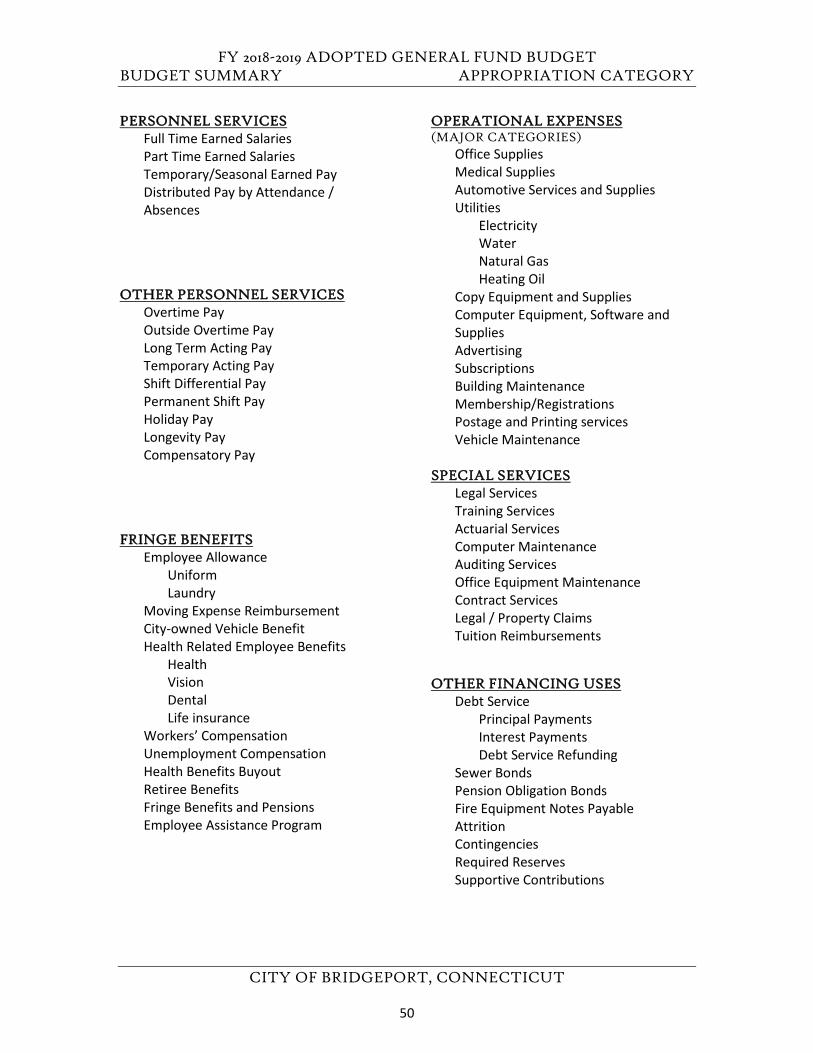
FY 2018-2019 ADOPTED GENERAL FUND BUDGET BUDGET SUMMARY APPROPRIATION CATEGORY
CITY OF BRIDGEPORT, CONNECTICUT
PERSONNEL SERVICES Full Time Earned Salaries Part Time Earned Salaries Temporary/Seasonal Earned Pay Distributed Pay by Attendance / Absences
OTHER PERSONNEL SERVICES Overtime Pay Outside Overtime Pay Long Term Acting Pay Temporary Acting Pay Shift Differential Pay Permanent Shift Pay Holiday Pay Longevity Pay Compensatory Pay
FRINGE BENEFITS Employee Allowance
Uniform Laundry
Moving Expense Reimbursement City-owned Vehicle Benefit Health Related Employee Benefits
Health Vision Dental Life insurance
Workers’ Compensation Unemployment Compensation Health Benefits Buyout Retiree Benefits Fringe Benefits and Pensions Employee Assistance Program
OPERATIONAL EXPENSES (MAJOR CATEGORIES)
Office Supplies Medical Supplies Automotive Services and Supplies Utilities
Electricity Water Natural Gas Heating Oil
Copy Equipment and Supplies Computer Equipment, Software and Supplies Advertising Subscriptions Building Maintenance Membership/Registrations Postage and Printing services Vehicle Maintenance
SPECIAL SERVICES Legal Services Training Services Actuarial Services Computer Maintenance Auditing Services Office Equipment Maintenance Contract Services Legal / Property Claims Tuition Reimbursements
OTHER FINANCING USES Debt Service
Principal Payments Interest Payments Debt Service Refunding
Sewer Bonds Pension Obligation Bonds Fire Equipment Notes Payable Attrition Contingencies Required Reserves Supportive Contributions
50
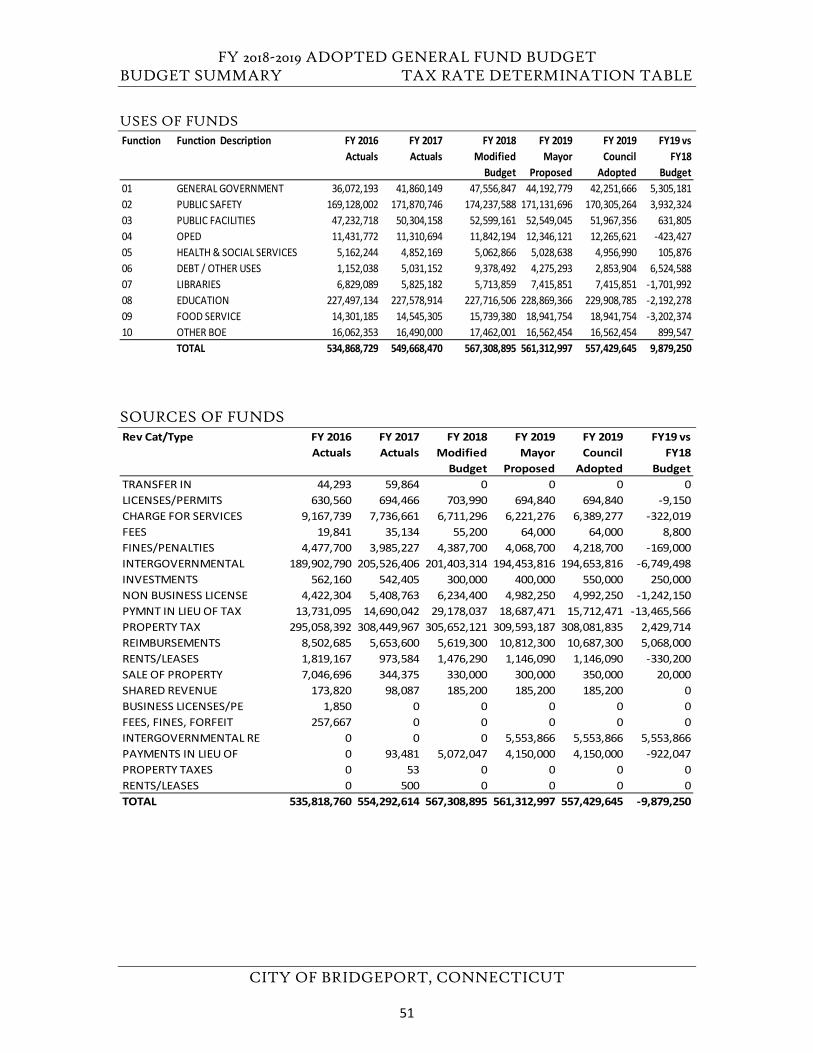
FY 2018-2019 ADOPTED GENERAL FUND BUDGET BUDGET SUMMARY TAX RATE DETERMINATION TABLE
CITY OF BRIDGEPORT, CONNECTICUT
USES OF FUNDS
SOURCES OF FUNDS
Function Function Description FY 2016Actuals
FY 2017Actuals
FY 2018 Modified
Budget
FY 2019 Mayor
Proposed
FY 2019 Council
Adopted
FY19 vs FY18
Budget01 GENERAL GOVERNMENT 36,072,193 41,860,149 47,556,847 44,192,779 42,251,666 5,305,18102 PUBLIC SAFETY 169,128,002 171,870,746 174,237,588 171,131,696 170,305,264 3,932,32403 PUBLIC FACILITIES 47,232,718 50,304,158 52,599,161 52,549,045 51,967,356 631,80504 OPED 11,431,772 11,310,694 11,842,194 12,346,121 12,265,621 -423,42705 HEALTH & SOCIAL SERVICES 5,162,244 4,852,169 5,062,866 5,028,638 4,956,990 105,87606 DEBT / OTHER USES 1,152,038 5,031,152 9,378,492 4,275,293 2,853,904 6,524,58807 LIBRARIES 6,829,089 5,825,182 5,713,859 7,415,851 7,415,851 -1,701,99208 EDUCATION 227,497,134 227,578,914 227,716,506 228,869,366 229,908,785 -2,192,27809 FOOD SERVICE 14,301,185 14,545,305 15,739,380 18,941,754 18,941,754 -3,202,37410 OTHER BOE 16,062,353 16,490,000 17,462,001 16,562,454 16,562,454 899,547
TOTAL 534,868,729 549,668,470 567,308,895 561,312,997 557,429,645 9,879,250
Rev Cat/Type FY 2016 Actuals
FY 2017 Actuals
FY 2018 Modified
Budget
FY 2019 Mayor
Proposed
FY 2019 Council
Adopted
FY19 vs FY18
BudgetTRANSFER IN 44,293 59,864 0 0 0 0LICENSES/PERMITS 630,560 694,466 703,990 694,840 694,840 -9,150CHARGE FOR SERVICES 9,167,739 7,736,661 6,711,296 6,221,276 6,389,277 -322,019FEES 19,841 35,134 55,200 64,000 64,000 8,800FINES/PENALTIES 4,477,700 3,985,227 4,387,700 4,068,700 4,218,700 -169,000INTERGOVERNMENTAL 189,902,790 205,526,406 201,403,314 194,453,816 194,653,816 -6,749,498INVESTMENTS 562,160 542,405 300,000 400,000 550,000 250,000NON BUSINESS LICENSE 4,422,304 5,408,763 6,234,400 4,982,250 4,992,250 -1,242,150PYMNT IN LIEU OF TAX 13,731,095 14,690,042 29,178,037 18,687,471 15,712,471 -13,465,566PROPERTY TAX 295,058,392 308,449,967 305,652,121 309,593,187 308,081,835 2,429,714REIMBURSEMENTS 8,502,685 5,653,600 5,619,300 10,812,300 10,687,300 5,068,000RENTS/LEASES 1,819,167 973,584 1,476,290 1,146,090 1,146,090 -330,200SALE OF PROPERTY 7,046,696 344,375 330,000 300,000 350,000 20,000SHARED REVENUE 173,820 98,087 185,200 185,200 185,200 0BUSINESS LICENSES/PE 1,850 0 0 0 0 0FEES, FINES, FORFEIT 257,667 0 0 0 0 0INTERGOVERNMENTAL RE 0 0 0 5,553,866 5,553,866 5,553,866PAYMENTS IN LIEU OF 0 93,481 5,072,047 4,150,000 4,150,000 -922,047PROPERTY TAXES 0 53 0 0 0 0RENTS/LEASES 0 500 0 0 0 0TOTAL 535,818,760 554,292,614 567,308,895 561,312,997 557,429,645 -9,879,250
51
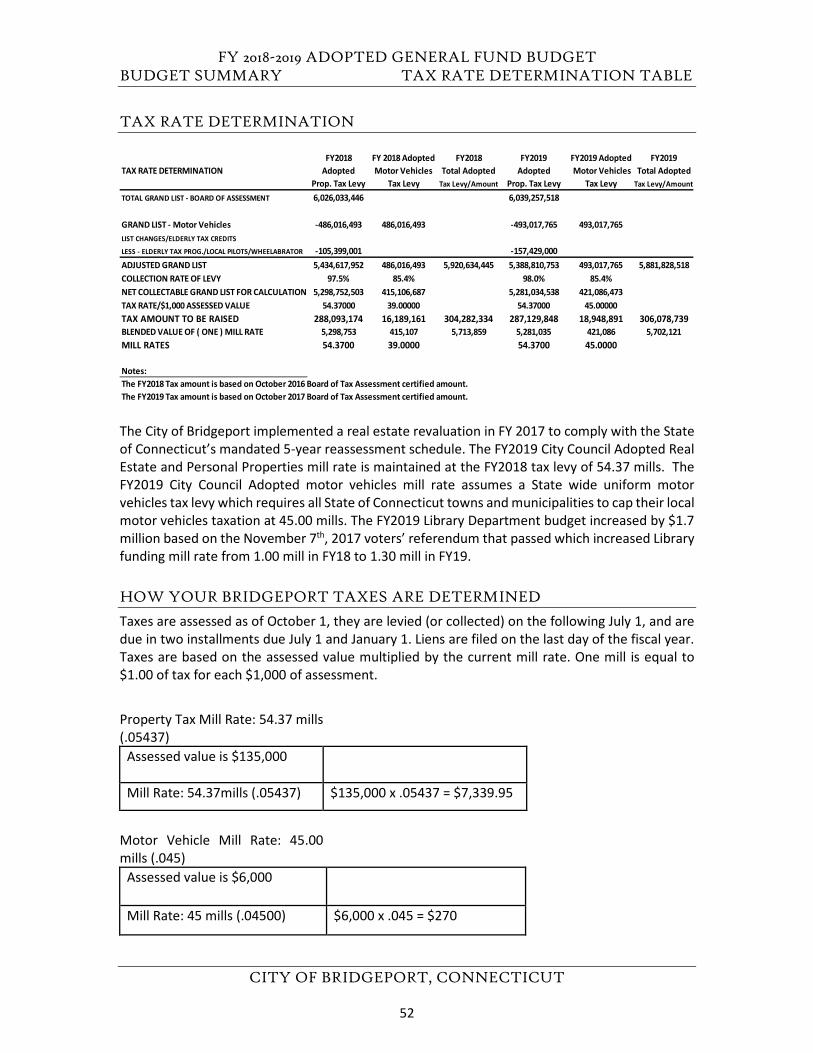
FY 2018-2019 ADOPTED GENERAL FUND BUDGET BUDGET SUMMARY TAX RATE DETERMINATION TABLE
CITY OF BRIDGEPORT, CONNECTICUT
TAX RATE DETERMINATION
The City of Bridgeport implemented a real estate revaluation in FY 2017 to comply with the State of Connecticut’s mandated 5-year reassessment schedule. The FY2019 City Council Adopted Real Estate and Personal Properties mill rate is maintained at the FY2018 tax levy of 54.37 mills. The FY2019 City Council Adopted motor vehicles mill rate assumes a State wide uniform motor vehicles tax levy which requires all State of Connecticut towns and municipalities to cap their local motor vehicles taxation at 45.00 mills. The FY2019 Library Department budget increased by $1.7 million based on the November 7th, 2017 voters’ referendum that passed which increased Library funding mill rate from 1.00 mill in FY18 to 1.30 mill in FY19.
HOW YOUR BRIDGEPORT TAXES ARE DETERMINED
Taxes are assessed as of October 1, they are levied (or collected) on the following July 1, and are due in two installments due July 1 and January 1. Liens are filed on the last day of the fiscal year. Taxes are based on the assessed value multiplied by the current mill rate. One mill is equal to $1.00 of tax for each $1,000 of assessment.
Property Tax Mill Rate: 54.37 mills (.05437)
Assessed value is $135,000
Mill Rate: 54.37mills (.05437) $135,000 x .05437 = $7,339.95
Assessed value is $6,000
Mill Rate: 45 mills (.04500) $6,000 x .045 = $270
FY2018 FY 2018 Adopted FY2018 FY2019 FY2019 Adopted FY2019TAX RATE DETERMINATION Adopted Motor Vehicles Total Adopted Adopted Motor Vehicles Total Adopted
Prop. Tax Levy Tax Levy Tax Levy/Amount Prop. Tax Levy Tax Levy Tax Levy/Amount
TOTAL GRAND LIST - BOARD OF ASSESSMENT 6,026,033,446 6,039,257,518
GRAND LIST - Motor Vehicles -486,016,493 486,016,493 -493,017,765 493,017,765LIST CHANGES/ELDERLY TAX CREDITS
LESS - ELDERLY TAX PROG./LOCAL PILOTS/WHEELABRATOR -105,399,001 -157,429,000ADJUSTED GRAND LIST 5,434,617,952 486,016,493 5,920,634,445 5,388,810,753 493,017,765 5,881,828,518COLLECTION RATE OF LEVY 97.5% 85.4% 98.0% 85.4%NET COLLECTABLE GRAND LIST FOR CALCULATIONS 5,298,752,503 415,106,687 5,281,034,538 421,086,473TAX RATE/$1,000 ASSESSED VALUE 54.37000 39.00000 54.37000 45.00000TAX AMOUNT TO BE RAISED 288,093,174 16,189,161 304,282,334 287,129,848 18,948,891 306,078,739BLENDED VALUE OF ( ONE ) MILL RATE 5,298,753 415,107 5,713,859 5,281,035 421,086 5,702,121MILL RATES 54.3700 39.0000 54.3700 45.0000
Notes:The FY2018 Tax amount is based on October 2016 Board of Tax Assessment certified amount.The FY2019 Tax amount is based on October 2017 Board of Tax Assessment certified amount.
Motor Vehicle Mill Rate: 45.00 mills (.045)
52
FY 2018-2019 ADOPTED GENERAL FUND BUDGET BUDGET SUMMARY TAX RATE DETERMINATION TABLE
CITY OF BRIDGEPORT, CONNECTICUT
Properties are assessed based on a formula that calculates 70% of their assessed fair market value. The property in Bridgeport was recently reevaluated according to the 5-year assessment schedule mandated by State of Connecticut Statutes. Revaluation is a mass appraisal of all property within an assessment jurisdiction (i.e., the City of Bridgeport) to equalize assessed values. A city-wide reassessment of real properties is conducted to assign fair market values to all properties. This assessment allows a balancing of the city’s real property tax burden among taxpayers.
MILL RATE HISTORY
Current mill rate fiscal year 2018-2019: 54.37 mills for real estate & personal property Current mill rate fiscal year 2018-2019: 45.00 mills for motor vehicles
real estate & personal property mill rate fiscal year 2017-2018: 54.37 motor vehicles mill rate fiscal year 2017-2018: 39.00
mill rate fiscal year 2016-2017: 54.37 mill rate fiscal year 2015-2016: 42.198 mill rate fiscal year 2014-2015: 42.198 mill rate fiscal year 2013-2014: 41.85 mill rate fiscal year 2012-2013: 41.11 mill rate fiscal year 2011-2012: 39.64 mill rate fiscal year 2010-2011: 39.64 mill rate fiscal year 2009-2010: 38.73 mill rate fiscal year 2008-2009: 44.58 mill rate fiscal year 2007-2008: 41.28 mill rate fiscal year 2006-2007: 42.28
53
FY 2018-2019 ADOPTED GENERAL FUND BUDGET BUDGET SUMMARY BRIDGEPORT IN CONTEXT
CITY OF BRIDGEPORT, CONNECTICUT
BRIDGEPORT AT A GLANCE FORM OF GOVERNMENT Bridgeport is governed by its City Charter which was adopted by the state legislature in 1907 and revised in 1912 and 1992. The city operates under a Mayor-City Council form of government. The Mayor serves a four-year term. The Mayor sets policy, makes nominations and appointments to boards and commissions, and presides at City Council meetings. In addition, the Mayor acts as official City representative and liaison with various governmental and private agencies and oversees the financial aspects of the City government. Mayoral authority comes from the City of Bridgeport’s charter, Municipal Code, and the State of Connecticut General Statues.
The City Council consists of 20 members elected to two-year terms. Each of the ten council districts is represented by two council members. The City Council holds regular meetings twice per month. Major responsibilities of the City Council include enacting ordinances necessary to govern the City and adopting the budget. Together the Mayor and the City Council oversee the five-line divisions: City Clerk, Water Pollution Control Authority, Libraries, Department of Education, and the Registrar of Voters.
The Chief Administrative Officer (CAO), a mayoral appointee, is responsible for coordinating the management and implementation of operational policies and practices for the Mayor. The CAO is the liaison between the Mayor and the head administrators of the City’s departments which include: The Office of Policy & Management, Civil Service, the Fire Department, the Police Department, Planning & Economic Development, Finance, Public Facilities, Health & Social Services, Labor Relations, the City Attorney, Weights & Measures, and Information Technology.
The only elected board in the City, aside from the City Council, is the Board of Education. This board consists of nine members elected to staggered four-year terms, and meets once a month. In addition, there are 18 appointed boards and commissions whose members are volunteers who have been appointed by the Mayor. These consist of the following: Board of Assessment Appeals, Board of Public Purchases, Bridgeport Redevelopment Agency, Cable Advisory Board, Civil Service Commission, Commission on Aging, Ethics Commission, Fair Housing Commission, Fair Rent Commission, Fire Commission, Harbor Management Commission, Historic Commission No. 1, Housing Authority, Housing Site Development Agency, Parks Commission, Planning & Zoning Commission, Police Commission, Port Authority Commission, Stratfield Historic District Commission, Water Pollution Control Authority Commission and the Zoning Board of Appeals. Additionally, the City appoints members to serve on the boards of regional planning agencies including the Greater Bridgeport Regional Planning Agency and the Greater Bridgeport Transit Authority.
GEOGRAPHY Bridgeport is Connecticut’s largest city with a population estimated at 146,579 residents. Located along Long Island Sound at the mouth of the Pequonnock River, the city has an area of 19.4 square miles. Bridgeport experiences warm to hot and humid summers and cold, snowy winters. These seasonal extremes are somewhat moderated by Long Island Sound. This results in a lower average temperature in summer and moderate snowfall, as compared to our neighbors inland. The city receives 41.7 inches of precipitation and around 25.6 inches of snowfall in an average year. The snowiest winter on record occurred in 1996 when Bridgeport received 76.8 inches in total
54

FY 2018-2019 ADOPTED GENERAL FUND BUDGET BUDGET SUMMARY BRIDGEPORT IN CONTEXT
CITY OF BRIDGEPORT, CONNECTICUT
accumulation. Bridgeport is located on Long Island Sound and is bordered by Fairfield, Connecticut to the West, Stratford, Connecticut to the East, and Trumbull, Connecticut to the North.
PHYSICAL DESCRIPTION Total Area: 19.4 square miles Land Area: 16 square miles
Water Area: 3.4 square miles
COMMUNITY PROFILE Bridgeport was originally a part of the township of Stratford. The first recorded settlement here was made in 1659. It was called Pequonnock until 1695, when its name was changed to Stratfield, due to its location between the already existing towns of Stratford and Fairfield. In 1800 the borough of Bridgeport was chartered and in 1821 the township was incorporated. The city was not chartered until 1836. The city's location on the deep Newfield Harbor supported shipbuilding and whaling endeavors in the mid 19th century. Later, rapid industrialization and the presence of
Residential50%
Institutional7%
Parks/Open Space 16%
Vacant12%
Commercial7%
Industrial7%
Mixed Use1% Land Use by Type
55
FY 2018-2019 ADOPTED GENERAL FUND BUDGET BUDGET SUMMARY BRIDGEPORT IN CONTEXT
CITY OF BRIDGEPORT, CONNECTICUT
the railroad made Bridgeport an ideal manufacturing center producing Bridgeport milling machines, saddles, corsets, carriages, brass fittings, sewing machines and ammunition. By 1930, Bridgeport was an industrial center with more than 500 factories and a thriving immigrant population.
In the early 21st century, Bridgeport is rebounding from a loss of jobs and population, and is transitioning into a role as both a bedroom community for New York City, and as oasis of relatively low-cost housing in the otherwise prohibitively expensive Fairfield County. Located just 60 miles from New York City and 60 miles from Hartford, CT, Bridgeport is accessible via a variety of transportation modes, it is ideally suited to families seeking a refuge from the high cost of living in lower Fairfield county.
Bridgeport supports two large hospitals—St. Vincent’s and Bridgeport Hospital. It is located on the Metro-North commuter line, which offers daily service to New York City, and regional service to the shoreline of Connecticut and to the Waterbury area. Bridgeport is also a stop on Amtrak’s train lines, including the high-speed Acela service. Ferry service to Port Jefferson, Long Island is offered from Bridgeport’s harbor, and local and interstate bus service is also available. The port of Bridgeport is one of three deep-water ports in the state. Bridgeport owns Stratford’s Sikorsky Memorial Airport. Bridgeport’s location in the middle of a confluence of highways—among them Interstate 95, the Merritt Parkway, Route 8 & Route 25, and Route 1 connect the City to many other regions. Institutions of higher learning housed in the City include The University of Bridgeport, Housatonic Community College, St. Vincent’s College, and Bridgeport Hospital School of Nursing. The Bridgeport School system educates more than 20,000 children, making it the second largest school system in the state.
The Arena at Harbor Yard and the Klein Memorial Auditorium host regional and national performances of musical acts and sporting events. Regional theater is in evidence at the Downtown Cabaret Theatre and the Bridgeport Theatre Company. Additionally, the City of Bridgeport is home to 45 parks which encompass 1,330 acres of open space.
DEMOGRAPHICS AND ECONOMICS Bridgeport is Connecticut’s largest city with a population estimated at 145,936 residents.
The Bridgeport economy, like the State economy, continues to be impacted by the effects of the national, regional, and statewide recession that started in 2003. As of June 30, 2017, Audit report the City’s annual average unemployment rate is 6.8%, down from 7.4% annual average the prior year.
Overall, the total assessed taxable grand list in Bridgeport stands at $6,039,257,518 a figure slightly higher than the total assessed taxable grand list property valuation for Bridgeport in 2016 which stood at $6,026,033,446. In raw dollars, the total assessed taxable property values in Bridgeport increased by just over $13.22 million dollars. Here is a breakdown of the new taxable grand list assessment:
56
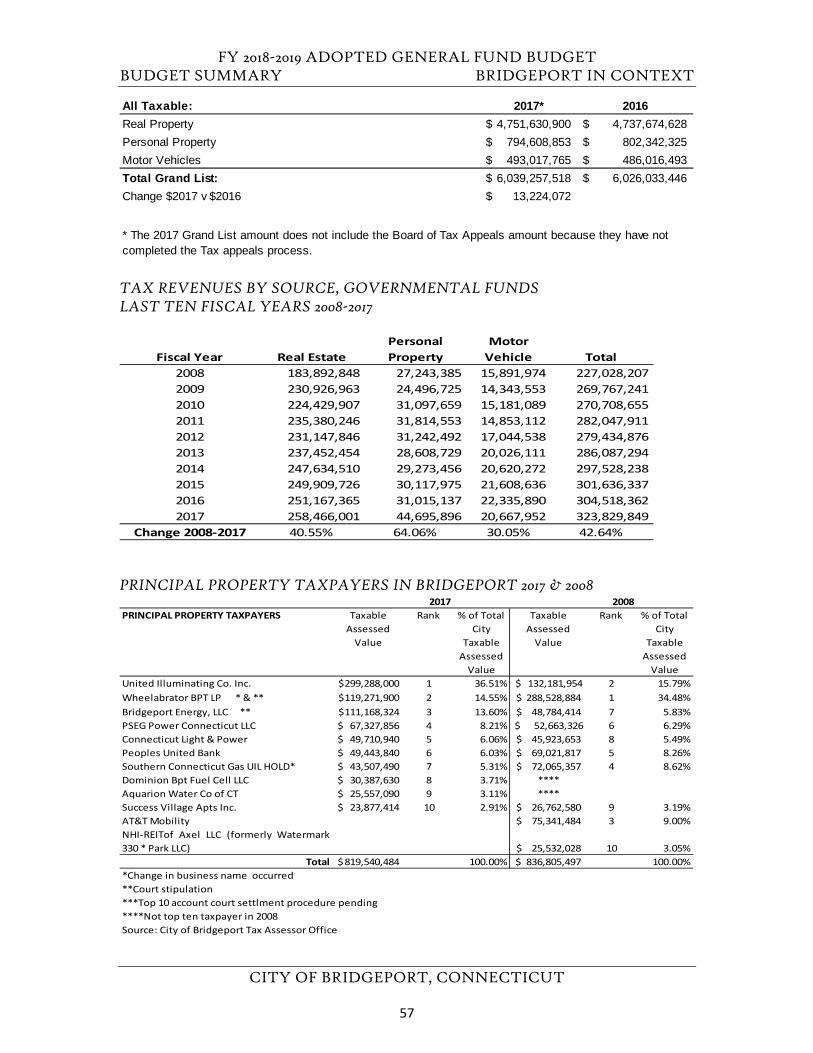
FY 2018-2019 ADOPTED GENERAL FUND BUDGET BUDGET SUMMARY BRIDGEPORT IN CONTEXT
CITY OF BRIDGEPORT, CONNECTICUT
TAX REVENUES BY SOURCE, GOVERNMENTAL FUNDS LAST TEN FISCAL YEARS 2008-2017
PRINCIPAL PROPERTY TAXPAYERS IN BRIDGEPORT 2017 & 2008
All Taxable: 2017* 2016Real Property 4,751,630,900$ 4,737,674,628$ Personal Property 794,608,853$ 802,342,325$ Motor Vehicles 493,017,765$ 486,016,493$ Total Grand List: 6,039,257,518$ 6,026,033,446$ Change $2017 v $2016 13,224,072$
* The 2017 Grand List amount does not include the Board of Tax Appeals amount because they have notcompleted the Tax appeals process.
Fiscal Year Real EstatePersonal Property
Motor Vehicle Total
2008 183,892,848 27,243,385 15,891,974 227,028,207 2009 230,926,963 24,496,725 14,343,553 269,767,241 2010 224,429,907 31,097,659 15,181,089 270,708,655 2011 235,380,246 31,814,553 14,853,112 282,047,911 2012 231,147,846 31,242,492 17,044,538 279,434,876 2013 237,452,454 28,608,729 20,026,111 286,087,294 2014 247,634,510 29,273,456 20,620,272 297,528,238 2015 249,909,726 30,117,975 21,608,636 301,636,337 2016 251,167,365 31,015,137 22,335,890 304,518,362 2017 258,466,001 44,695,896 20,667,952 323,829,849
Change 2008-2017 40.55% 64.06% 30.05% 42.64%
2017 2008PRINCIPAL PROPERTY TAXPAYERS Taxable
Assessed Value
Rank % of Total City
Taxable Assessed
Value
Taxable Assessed
Value
Rank % of Total City
Taxable Assessed
ValueUnited Illuminating Co. Inc. 299,288,000$ 1 36.51% $ 132,181,954 2 15.79%Wheelabrator BPT LP * & ** 119,271,900$ 2 14.55% 288,528,884$ 1 34.48%Bridgeport Energy, LLC ** 111,168,324$ 3 13.60% 48,784,414$ 7 5.83%PSEG Power Connecticut LLC 67,327,856$ 4 8.21% $ 52,663,326 6 6.29%Connecticut Light & Power 49,710,940$ 5 6.06% 45,923,653$ 8 5.49%Peoples United Bank 49,443,840$ 6 6.03% 69,021,817$ 5 8.26%Southern Connecticut Gas UIL HOLD* 43,507,490$ 7 5.31% 72,065,357$ 4 8.62%Dominion Bpt Fuel Cell LLC 30,387,630$ 8 3.71% ****Aquarion Water Co of CT 25,557,090$ 9 3.11% ****Success Village Apts Inc. 23,877,414$ 10 2.91% 26,762,580$ 9 3.19%AT&T Mobility 75,341,484$ 3 9.00%NHI-REITof Axel LLC (formerly Watermark330 * Park LLC) 25,532,028$ 10 3.05%
Total 819,540,484$ 100.00% 836,805,497$ 100.00%*Change in business name occurred**Court stipulation ***Top 10 account court settlment procedure pending****Not top ten taxpayer in 2008Source: City of Bridgeport Tax Assessor Office
57
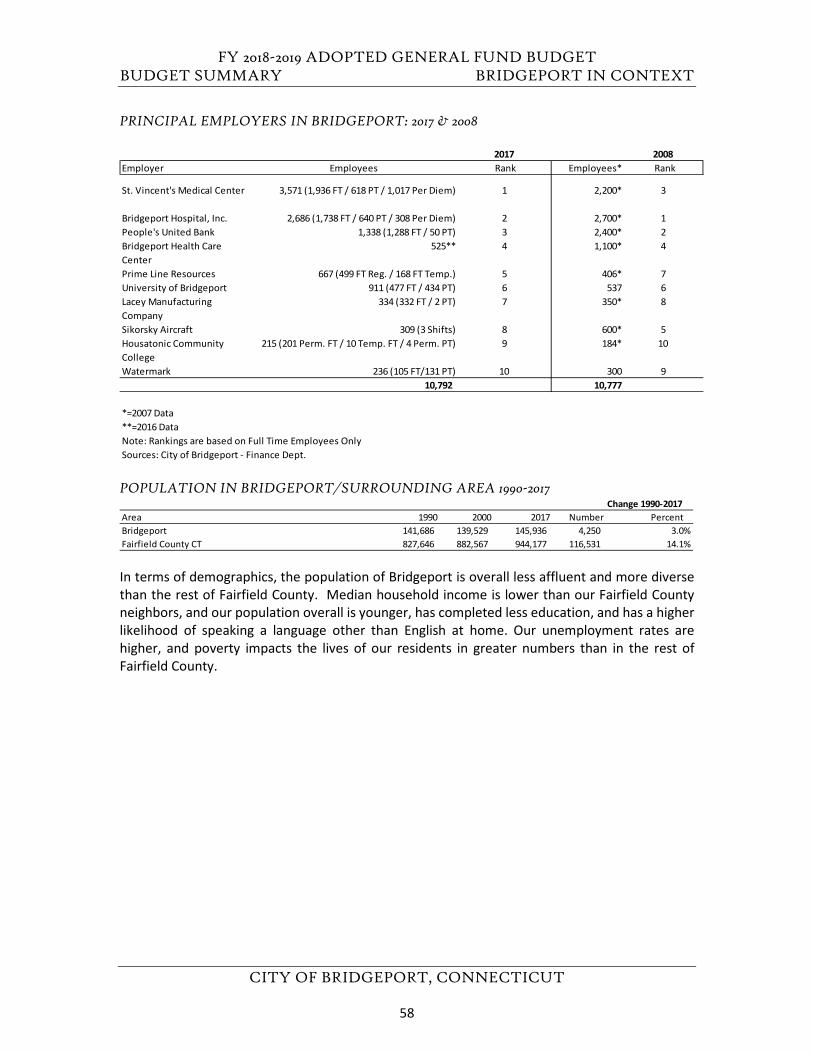
FY 2018-2019 ADOPTED GENERAL FUND BUDGET BUDGET SUMMARY BRIDGEPORT IN CONTEXT
CITY OF BRIDGEPORT, CONNECTICUT
PRINCIPAL EMPLOYERS IN BRIDGEPORT: 2017 & 2008
POPULATION IN BRIDGEPORT/SURROUNDING AREA 1990-2017
In terms of demographics, the population of Bridgeport is overall less affluent and more diverse than the rest of Fairfield County. Median household income is lower than our Fairfield County neighbors, and our population overall is younger, has completed less education, and has a higher likelihood of speaking a language other than English at home. Our unemployment rates are higher, and poverty impacts the lives of our residents in greater numbers than in the rest of Fairfield County.
2017 2008Employer Employees Rank Employees* Rank
St. Vincent's Medical Center 3,571 (1,936 FT / 618 PT / 1,017 Per Diem) 1 2,200* 3
Bridgeport Hospital, Inc. 2,686 (1,738 FT / 640 PT / 308 Per Diem) 2 2,700* 1People's United Bank 1,338 (1,288 FT / 50 PT) 3 2,400* 2Bridgeport Health Care Center
525** 4 1,100* 4
Prime Line Resources 667 (499 FT Reg. / 168 FT Temp.) 5 406* 7University of Bridgeport 911 (477 FT / 434 PT) 6 537 6Lacey Manufacturing Company
334 (332 FT / 2 PT) 7 350* 8
Sikorsky Aircraft 309 (3 Shifts) 8 600* 5Housatonic Community College
215 (201 Perm. FT / 10 Temp. FT / 4 Perm. PT) 9 184* 10
Watermark 236 (105 FT/131 PT) 10 300 910,792 10,777
*=2007 Data**=2016 DataNote: Rankings are based on Full Time Employees OnlySources: City of Bridgeport - Finance Dept.
Change 1990-2017Area 1990 2000 2017 Number PercentBridgeport 141,686 139,529 145,936 4,250 3.0%Fairfield County CT 827,646 882,567 944,177 116,531 14.1%
58
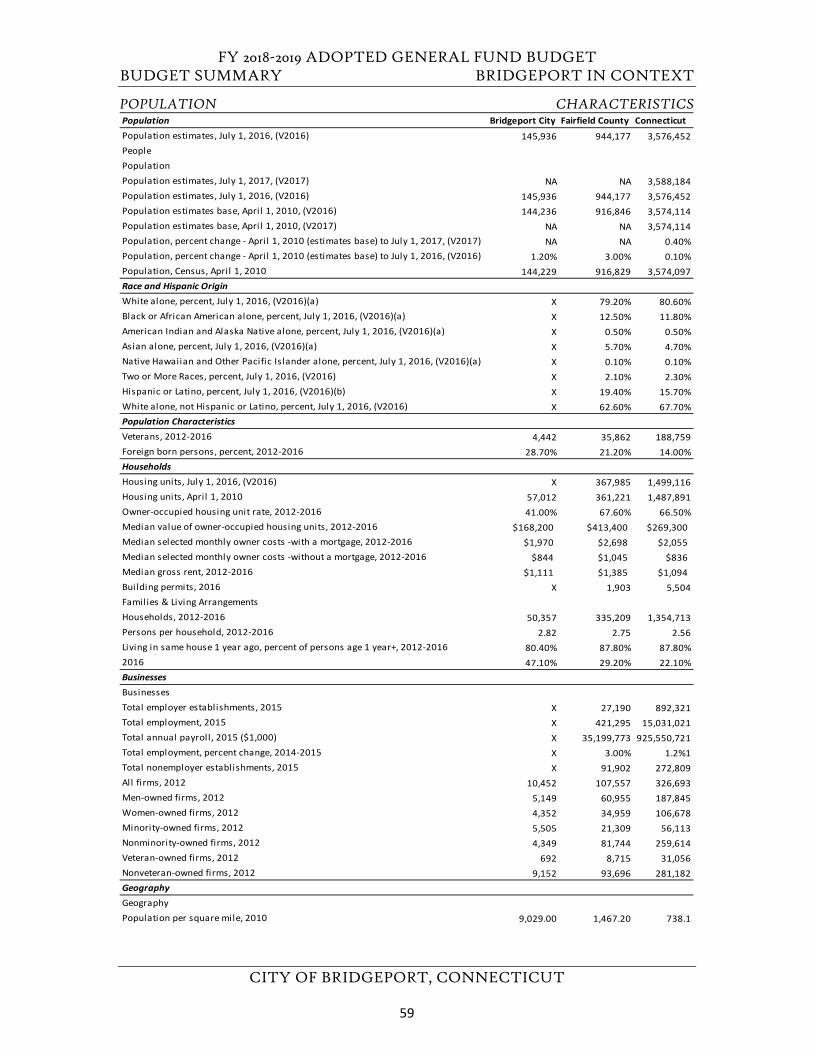
FY 2018-2019 ADOPTED GENERAL FUND BUDGET BUDGET SUMMARY BRIDGEPORT IN CONTEXT
CITY OF BRIDGEPORT, CONNECTICUT
POPULATION CHARACTERISTICSPopulation Bridgeport City Fairfield County ConnecticutPopulation estimates, July 1, 2016, (V2016) 145,936 944,177 3,576,452PeoplePopulationPopulation estimates, July 1, 2017, (V2017) NA NA 3,588,184Population estimates, July 1, 2016, (V2016) 145,936 944,177 3,576,452Population estimates base, April 1, 2010, (V2016) 144,236 916,846 3,574,114Population estimates base, April 1, 2010, (V2017) NA NA 3,574,114Population, percent change - April 1, 2010 (estimates base) to July 1, 2017, (V2017) NA NA 0.40%Population, percent change - April 1, 2010 (estimates base) to July 1, 2016, (V2016) 1.20% 3.00% 0.10%Population, Census, April 1, 2010 144,229 916,829 3,574,097Race and Hispanic OriginWhite alone, percent, July 1, 2016, (V2016)(a) X 79.20% 80.60%Black or African American alone, percent, July 1, 2016, (V2016)(a) X 12.50% 11.80%American Indian and Alaska Native alone, percent, July 1, 2016, (V2016)(a) X 0.50% 0.50%Asian alone, percent, July 1, 2016, (V2016)(a) X 5.70% 4.70%Native Hawaiian and Other Pacific Islander alone, percent, July 1, 2016, (V2016)(a) X 0.10% 0.10%Two or More Races, percent, July 1, 2016, (V2016) X 2.10% 2.30%Hispanic or Latino, percent, July 1, 2016, (V2016)(b) X 19.40% 15.70%White alone, not Hispanic or Latino, percent, July 1, 2016, (V2016) X 62.60% 67.70%Population CharacteristicsVeterans, 2012-2016 4,442 35,862 188,759Foreign born persons, percent, 2012-2016 28.70% 21.20% 14.00%HouseholdsHousing units, July 1, 2016, (V2016) X 367,985 1,499,116Housing units, April 1, 2010 57,012 361,221 1,487,891Owner-occupied housing unit rate, 2012-2016 41.00% 67.60% 66.50%Median value of owner-occupied housing units, 2012-2016 $168,200 $413,400 $269,300Median selected monthly owner costs -with a mortgage, 2012-2016 $1,970 $2,698 $2,055Median selected monthly owner costs -without a mortgage, 2012-2016 $844 $1,045 $836Median gross rent, 2012-2016 $1,111 $1,385 $1,094Building permits, 2016 X 1,903 5,504Families & Living ArrangementsHouseholds, 2012-2016 50,357 335,209 1,354,713Persons per household, 2012-2016 2.82 2.75 2.56Living in same house 1 year ago, percent of persons age 1 year+, 2012-2016 80.40% 87.80% 87.80%g g g p p p g y2016 47.10% 29.20% 22.10%BusinessesBusinessesTotal employer establishments, 2015 X 27,190 892,321Total employment, 2015 X 421,295 15,031,021Total annual payroll, 2015 ($1,000) X 35,199,773 925,550,721Total employment, percent change, 2014-2015 X 3.00% 1.2%1Total nonemployer establishments, 2015 X 91,902 272,809All firms, 2012 10,452 107,557 326,693Men-owned firms, 2012 5,149 60,955 187,845Women-owned firms, 2012 4,352 34,959 106,678Minority-owned firms, 2012 5,505 21,309 56,113Nonminority-owned firms, 2012 4,349 81,744 259,614Veteran-owned firms, 2012 692 8,715 31,056Nonveteran-owned firms, 2012 9,152 93,696 281,182GeographyGeographyPopulation per square mile, 2010 9,029.00 1,467.20 738.1
59
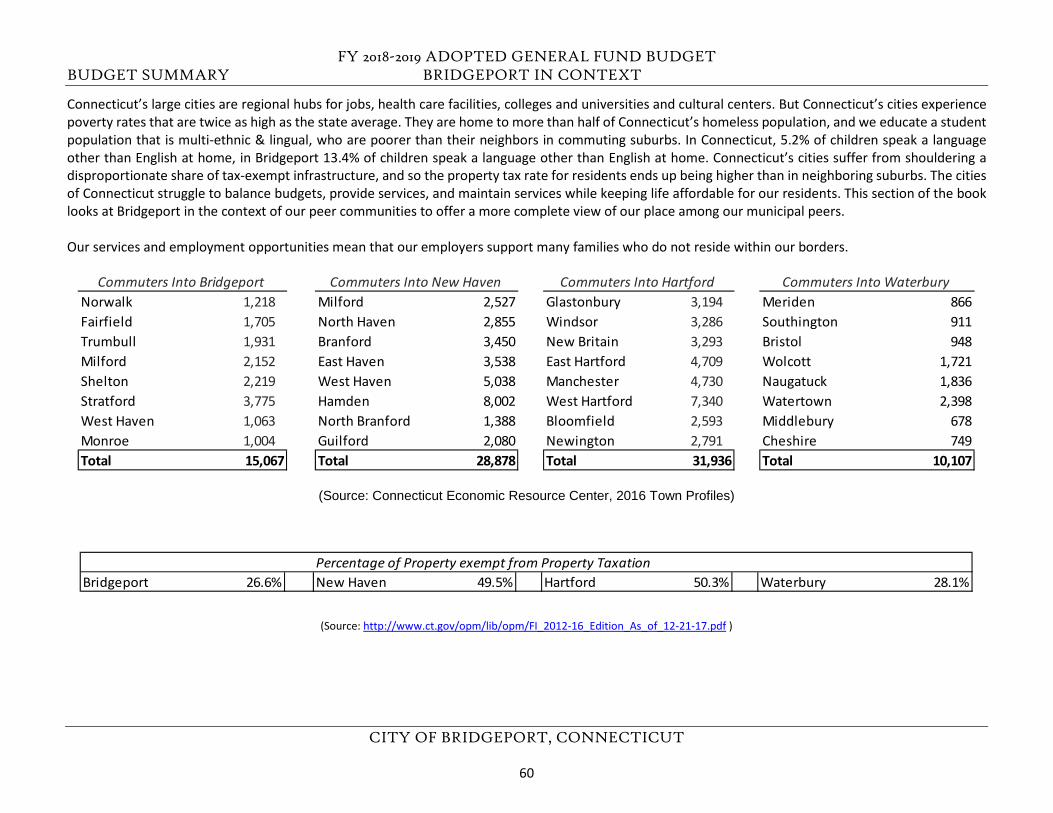
FY 2018-2019 ADOPTED GENERAL FUND BUDGET BUDGET SUMMARY BRIDGEPORT IN CONTEXT
CITY OF BRIDGEPORT, CONNECTICUT
Connecticut’s large cities are regional hubs for jobs, health care facilities, colleges and universities and cultural centers. But Connecticut’s cities experience poverty rates that are twice as high as the state average. They are home to more than half of Connecticut’s homeless population, and we educate a student population that is multi-ethnic & lingual, who are poorer than their neighbors in commuting suburbs. In Connecticut, 5.2% of children speak a language other than English at home, in Bridgeport 13.4% of children speak a language other than English at home. Connecticut’s cities suffer from shouldering a disproportionate share of tax-exempt infrastructure, and so the property tax rate for residents ends up being higher than in neighboring suburbs. The cities of Connecticut struggle to balance budgets, provide services, and maintain services while keeping life affordable for our residents. This section of the book looks at Bridgeport in the context of our peer communities to offer a more complete view of our place among our municipal peers.
Our services and employment opportunities mean that our employers support many families who do not reside within our borders.
(Source: Connecticut Economic Resource Center, 2016 Town Profiles)
(Source: http://www.ct.gov/opm/lib/opm/FI_2012-16_Edition_As_of_12-21-17.pdf )
Norwalk 1,218 Milford 2,527 Glastonbury 3,194 Meriden 866Fairfield 1,705 North Haven 2,855 Windsor 3,286 Southington 911Trumbull 1,931 Branford 3,450 New Britain 3,293 Bristol 948Milford 2,152 East Haven 3,538 East Hartford 4,709 Wolcott 1,721Shelton 2,219 West Haven 5,038 Manchester 4,730 Naugatuck 1,836Stratford 3,775 Hamden 8,002 West Hartford 7,340 Watertown 2,398West Haven 1,063 North Branford 1,388 Bloomfield 2,593 Middlebury 678Monroe 1,004 Guilford 2,080 Newington 2,791 Cheshire 749Total 15,067 Total 28,878 Total 31,936 Total 10,107
Commuters Into Bridgeport Commuters Into HartfordCommuters Into New Haven Commuters Into Waterbury
Percentage of Property exempt from Property TaxationBridgeport 26.6% New Haven 49.5% Hartford 50.3% Waterbury 28.1%
60
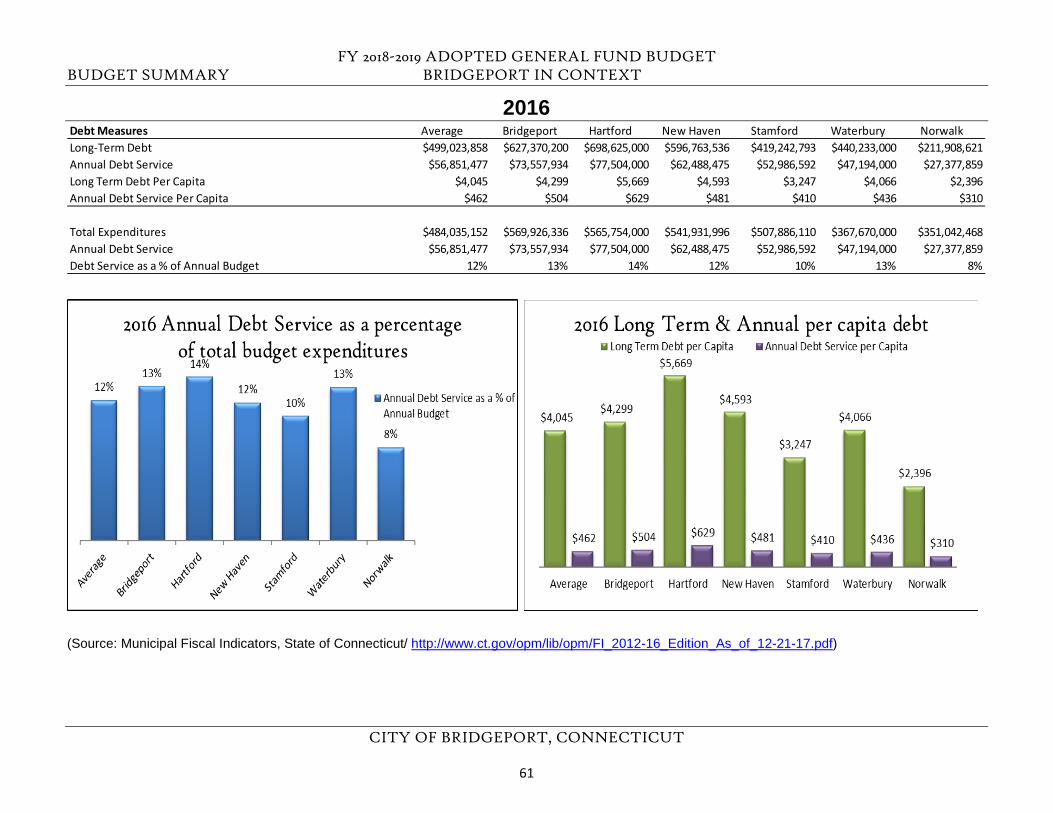
FY 2018-2019 ADOPTED GENERAL FUND BUDGET BUDGET SUMMARY BRIDGEPORT IN CONTEXT
CITY OF BRIDGEPORT, CONNECTICUT
2016
(Source: Municipal Fiscal Indicators, State of Connecticut/ http://www.ct.gov/opm/lib/opm/FI_2012-16_Edition_As_of_12-21-17.pdf)
Debt Measures Average Bridgeport Hartford New Haven Stamford Waterbury NorwalkLong-Term Debt $499,023,858 $627,370,200 $698,625,000 $596,763,536 $419,242,793 $440,233,000 $211,908,621Annual Debt Service $56,851,477 $73,557,934 $77,504,000 $62,488,475 $52,986,592 $47,194,000 $27,377,859Long Term Debt Per Capita $4,045 $4,299 $5,669 $4,593 $3,247 $4,066 $2,396Annual Debt Service Per Capita $462 $504 $629 $481 $410 $436 $310
Total Expenditures $484,035,152 $569,926,336 $565,754,000 $541,931,996 $507,886,110 $367,670,000 $351,042,468Annual Debt Service $56,851,477 $73,557,934 $77,504,000 $62,488,475 $52,986,592 $47,194,000 $27,377,859Debt Service as a % of Annual Budget 12% 13% 14% 12% 10% 13% 8%
61
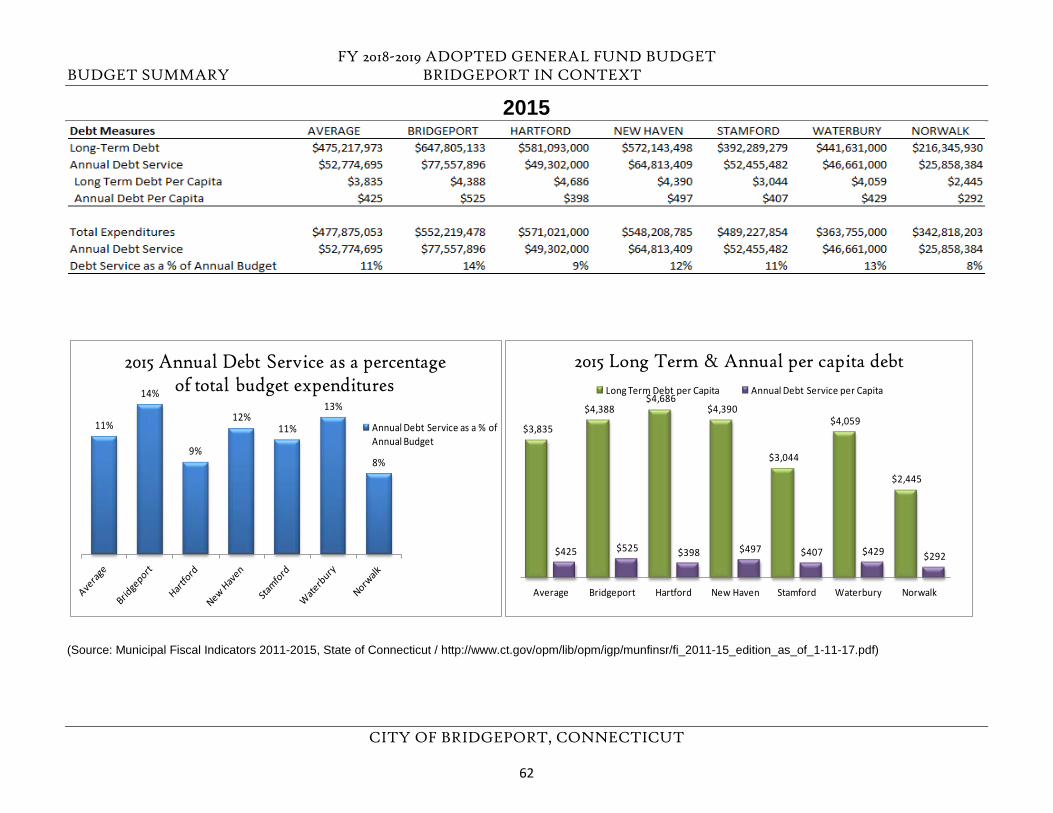
FY 2018-2019 ADOPTED GENERAL FUND BUDGET BUDGET SUMMARY BRIDGEPORT IN CONTEXT
CITY OF BRIDGEPORT, CONNECTICUT
2015
(Source: Municipal Fiscal Indicators 2011-2015, State of Connecticut / http://www.ct.gov/opm/lib/opm/igp/munfinsr/fi_2011-15_edition_as_of_1-11-17.pdf)
11%
14%
9%
12%11%
13%
8%
2015 Annual Debt Service as a percentage of total budget expenditures
Annual Debt Service as a % of Annual Budget
$3,835
$4,388 $4,686
$4,390
$3,044
$4,059
$2,445
$425 $525 $398 $497 $407 $429 $292
Average Bridgeport Hartford New Haven Stamford Waterbury Norwalk
2015 Long Term & Annual per capita debtLong Term Debt per Capita Annual Debt Service per Capita
62
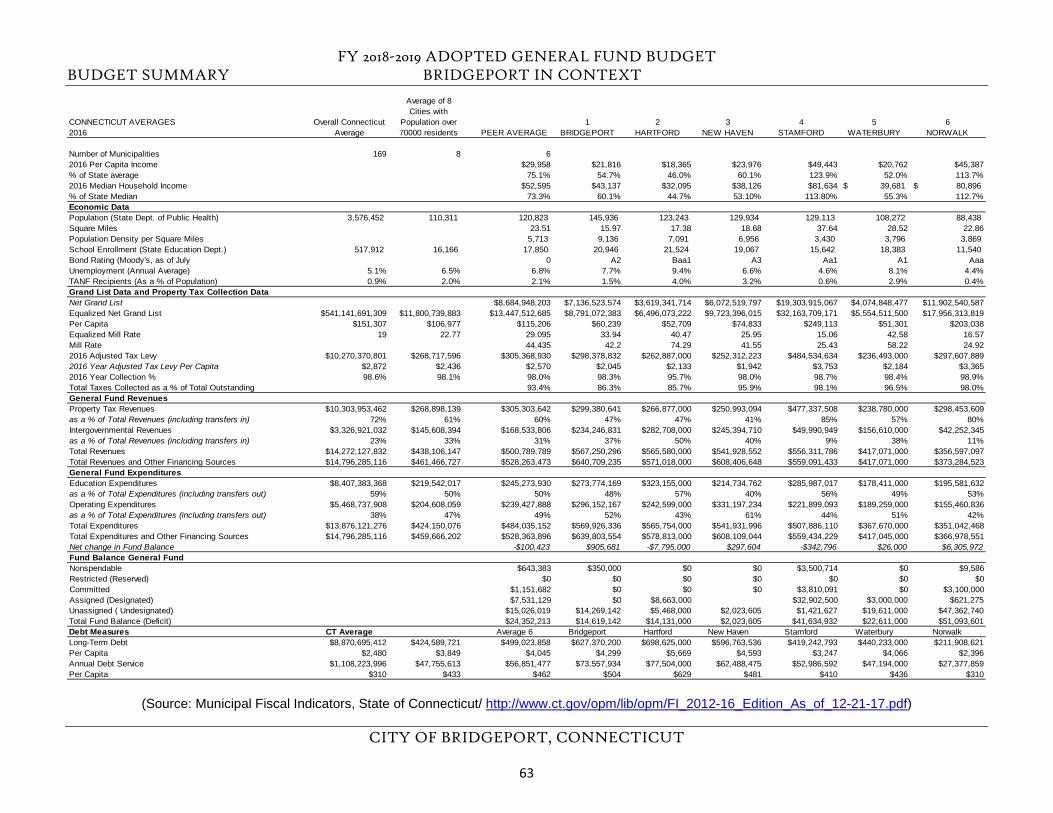
FY 2018-2019 ADOPTED GENERAL FUND BUDGET BUDGET SUMMARY BRIDGEPORT IN CONTEXT
CITY OF BRIDGEPORT, CONNECTICUT
(Source: Municipal Fiscal Indicators, State of Connecticut/ http://www.ct.gov/opm/lib/opm/FI_2012-16_Edition_As_of_12-21-17.pdf)
CONNECTICUT AVERAGES 2016
Overall Connecticut Average
Average of 8 Cities with
Population over 70000 residents PEER AVERAGE
1 BRIDGEPORT
2 HARTFORD
3 NEW HAVEN
4 STAMFORD
5 WATERBURY
6 NORWALK
Number of Municipalities 169 8 62016 Per Capita Income $29,958 $21,816 $18,365 $23,976 $49,443 $20,762 $45,387% of State average 75.1% 54.7% 46.0% 60.1% 123.9% 52.0% 113.7%2016 Median Household Income $52,595 $43,137 $32,095 $38,126 $81,634 39,681$ 80,896$ % of State Median 73.3% 60.1% 44.7% 53.10% 113.80% 55.3% 112.7%Economic DataPopulation (State Dept. of Public Health) 3,576,452 110,311 120,823 145,936 123,243 129,934 129,113 108,272 88,438 Square Miles 23.51 15.97 17.38 18.68 37.64 28.52 22.86Population Density per Square Miles 5,713 9,136 7,091 6,956 3,430 3,796 3,869 School Enrollment (State Education Dept.) 517,912 16,166 17,850 20,946 21,524 19,067 15,642 18,383 11,540 Bond Rating (Moody's, as of July 0 A2 Baa1 A3 Aa1 A1 AaaUnemployment (Annual Average) 5.1% 6.5% 6.8% 7.7% 9.4% 6.6% 4.6% 8.1% 4.4%TANF Recipients (As a % of Population) 0.9% 2.0% 2.1% 1.5% 4.0% 3.2% 0.6% 2.9% 0.4%Grand List Data and Property Tax Collection DataNet Grand List $8,684,948,203 $7,136,523,574 $3,619,341,714 $6,072,519,797 $19,303,915,067 $4,074,848,477 $11,902,540,587Equalized Net Grand List $541,141,691,309 $11,800,739,883 $13,447,512,685 $8,791,072,383 $6,496,073,222 $9,723,396,015 $32,163,709,171 $5,554,511,500 $17,956,313,819Per Capita $151,307 $106,977 $115,206 $60,239 $52,709 $74,833 $249,113 $51,301 $203,038Equalized Mill Rate 19 22.77 29.095 33.94 40.47 25.95 15.06 42.58 16.57Mill Rate 44.435 42.2 74.29 41.55 25.43 58.22 24.922016 Adjusted Tax Levy $10,270,370,801 $268,717,596 $305,368,930 $298,378,832 $262,887,000 $252,312,223 $484,534,634 $236,493,000 $297,607,8892016 Year Adjusted Tax Levy Per Capita $2,872 $2,436 $2,570 $2,045 $2,133 $1,942 $3,753 $2,184 $3,3652016 Year Collection % 98.6% 98.1% 98.0% 98.3% 95.7% 98.0% 98.7% 98.4% 98.9%Total Taxes Collected as a % of Total Outstanding 93.4% 86.3% 85.7% 95.9% 98.1% 96.5% 98.0%General Fund RevenuesProperty Tax Revenues $10,303,953,462 $268,898,139 $305,303,642 $299,380,641 $266,877,000 $250,993,094 $477,337,508 $238,780,000 $298,453,609as a % of Total Revenues (including transfers in) 72% 61% 60% 47% 47% 41% 85% 57% 80%Intergovernmental Revenues $3,326,921,032 $145,608,394 $168,533,806 $234,246,831 $282,708,000 $245,394,710 $49,990,949 $156,610,000 $42,252,345as a % of Total Revenues (including transfers in) 23% 33% 31% 37% 50% 40% 9% 38% 11%Total Revenues $14,272,127,832 $438,106,147 $500,789,789 $567,250,296 $565,580,000 $541,928,552 $556,311,786 $417,071,000 $356,597,097Total Revenues and Other Financing Sources $14,796,285,116 $461,466,727 $528,263,473 $640,709,235 $571,018,000 $608,406,648 $559,091,433 $417,071,000 $373,284,523General Fund ExpendituresEducation Expenditures $8,407,383,368 $219,542,017 $245,273,930 $273,774,169 $323,155,000 $214,734,762 $285,987,017 $178,411,000 $195,581,632as a % of Total Expenditures (including transfers out) 59% 50% 50% 48% 57% 40% 56% 49% 53%Operating Expenditures $5,468,737,908 $204,608,059 $239,427,888 $296,152,167 $242,599,000 $331,197,234 $221,899,093 $189,259,000 $155,460,836as a % of Total Expenditures (including transfers out) 38% 47% 49% 52% 43% 61% 44% 51% 42%Total Expenditures $13,876,121,276 $424,150,076 $484,035,152 $569,926,336 $565,754,000 $541,931,996 $507,886,110 $367,670,000 $351,042,468Total Expenditures and Other Financing Sources $14,796,285,116 $459,666,202 $528,363,896 $639,803,554 $578,813,000 $608,109,044 $559,434,229 $417,045,000 $366,978,551Net change in Fund Balance -$100,423 $905,681 -$7,795,000 $297,604 -$342,796 $26,000 $6,305,972Fund Balance General FundNonspendable $643,383 $350,000 $0 $0 $3,500,714 $0 $9,586Restricted (Reserved) $0 $0 $0 $0 $0 $0 $0Committed $1,151,682 $0 $0 $0 $3,810,091 $0 $3,100,000Assigned (Designated) $7,531,129 $0 $8,663,000 $32,902,500 $3,000,000 $621,275Unassigned ( Undesignated) $15,026,019 $14,269,142 $5,468,000 $2,023,605 $1,421,627 $19,611,000 $47,362,740Total Fund Balance (Deficit) $24,352,213 $14,619,142 $14,131,000 $2,023,605 $41,634,932 $22,611,000 $51,093,601Debt Measures CT Average Average 6 Bridgeport Hartford New Haven Stamford Waterbury NorwalkLong-Term Debt $8,870,695,412 $424,589,721 $499,023,858 $627,370,200 $698,625,000 $596,763,536 $419,242,793 $440,233,000 $211,908,621Per Capita $2,480 $3,849 $4,045 $4,299 $5,669 $4,593 $3,247 $4,066 $2,396Annual Debt Service $1,108,223,996 $47,755,613 $56,851,477 $73,557,934 $77,504,000 $62,488,475 $52,986,592 $47,194,000 $27,377,859Per Capita $310 $433 $462 $504 $629 $481 $410 $436 $310
63
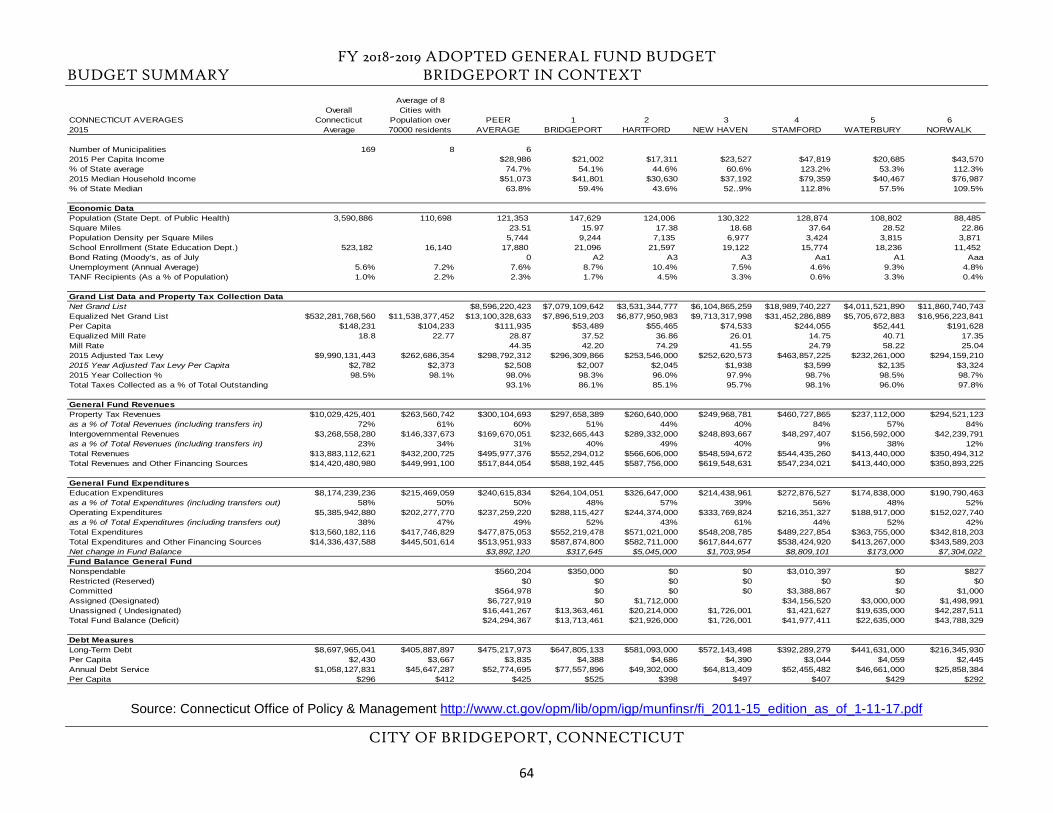
FY 2018-2019 ADOPTED GENERAL FUND BUDGET BUDGET SUMMARY BRIDGEPORT IN CONTEXT
CITY OF BRIDGEPORT, CONNECTICUT
Source: Connecticut Office of Policy & Management http://www.ct.gov/opm/lib/opm/igp/munfinsr/fi_2011-15_edition_as_of_1-11-17.pdf
CONNECTICUT AVERAGES 2015
Overall Connecticut
Average
Average of 8 Cities with
Population over 70000 residents
PEER AVERAGE
1 BRIDGEPORT
2 HARTFORD
3 NEW HAVEN
4 STAMFORD
5 WATERBURY
6 NORWALK
Number of Municipalities 169 8 62015 Per Capita Income $28,986 $21,002 $17,311 $23,527 $47,819 $20,685 $43,570% of State average 74.7% 54.1% 44.6% 60.6% 123.2% 53.3% 112.3%2015 Median Household Income $51,073 $41,801 $30,630 $37,192 $79,359 $40,467 $76,987% of State Median 63.8% 59.4% 43.6% 52..9% 112.8% 57.5% 109.5%
Economic DataPopulation (State Dept. of Public Health) 3,590,886 110,698 121,353 147,629 124,006 130,322 128,874 108,802 88,485 Square Miles 23.51 15.97 17.38 18.68 37.64 28.52 22.86Population Density per Square Miles 5,744 9,244 7,135 6,977 3,424 3,815 3,871 School Enrollment (State Education Dept.) 523,182 16,140 17,880 21,096 21,597 19,122 15,774 18,236 11,452 Bond Rating (Moody's, as of July 0 A2 A3 A3 Aa1 A1 AaaUnemployment (Annual Average) 5.6% 7.2% 7.6% 8.7% 10.4% 7.5% 4.6% 9.3% 4.8%TANF Recipients (As a % of Population) 1.0% 2.2% 2.3% 1.7% 4.5% 3.3% 0.6% 3.3% 0.4%
Grand List Data and Property Tax Collection DataNet Grand List $8,596,220,423 $7,079,109,642 $3,531,344,777 $6,104,865,259 $18,989,740,227 $4,011,521,890 $11,860,740,743Equalized Net Grand List $532,281,768,560 $11,538,377,452 $13,100,328,633 $7,896,519,203 $6,877,950,983 $9,713,317,998 $31,452,286,889 $5,705,672,883 $16,956,223,841Per Capita $148,231 $104,233 $111,935 $53,489 $55,465 $74,533 $244,055 $52,441 $191,628Equalized Mill Rate 18.8 22.77 28.87 37.52 36.86 26.01 14.75 40.71 17.35Mill Rate 44.35 42.20 74.29 41.55 24.79 58.22 25.042015 Adjusted Tax Levy $9,990,131,443 $262,686,354 $298,792,312 $296,309,866 $253,546,000 $252,620,573 $463,857,225 $232,261,000 $294,159,2102015 Year Adjusted Tax Levy Per Capita $2,782 $2,373 $2,508 $2,007 $2,045 $1,938 $3,599 $2,135 $3,3242015 Year Collection % 98.5% 98.1% 98.0% 98.3% 96.0% 97.9% 98.7% 98.5% 98.7%Total Taxes Collected as a % of Total Outstanding 93.1% 86.1% 85.1% 95.7% 98.1% 96.0% 97.8%
General Fund RevenuesProperty Tax Revenues $10,029,425,401 $263,560,742 $300,104,693 $297,658,389 $260,640,000 $249,968,781 $460,727,865 $237,112,000 $294,521,123as a % of Total Revenues (including transfers in) 72% 61% 60% 51% 44% 40% 84% 57% 84%Intergovernmental Revenues $3,268,558,280 $146,337,673 $169,670,051 $232,665,443 $289,332,000 $248,893,667 $48,297,407 $156,592,000 $42,239,791as a % of Total Revenues (including transfers in) 23% 34% 31% 40% 49% 40% 9% 38% 12%Total Revenues $13,883,112,621 $432,200,725 $495,977,376 $552,294,012 $566,606,000 $548,594,672 $544,435,260 $413,440,000 $350,494,312Total Revenues and Other Financing Sources $14,420,480,980 $449,991,100 $517,844,054 $588,192,445 $587,756,000 $619,548,631 $547,234,021 $413,440,000 $350,893,225
General Fund ExpendituresEducation Expenditures $8,174,239,236 $215,469,059 $240,615,834 $264,104,051 $326,647,000 $214,438,961 $272,876,527 $174,838,000 $190,790,463as a % of Total Expenditures (including transfers out) 58% 50% 50% 48% 57% 39% 56% 48% 52%Operating Expenditures $5,385,942,880 $202,277,770 $237,259,220 $288,115,427 $244,374,000 $333,769,824 $216,351,327 $188,917,000 $152,027,740as a % of Total Expenditures (including transfers out) 38% 47% 49% 52% 43% 61% 44% 52% 42%Total Expenditures $13,560,182,116 $417,746,829 $477,875,053 $552,219,478 $571,021,000 $548,208,785 $489,227,854 $363,755,000 $342,818,203Total Expenditures and Other Financing Sources $14,336,437,588 $445,501,614 $513,951,933 $587,874,800 $582,711,000 $617,844,677 $538,424,920 $413,267,000 $343,589,203Net change in Fund Balance $3,892,120 $317,645 $5,045,000 $1,703,954 $8,809,101 $173,000 $7,304,022Fund Balance General FundNonspendable $560,204 $350,000 $0 $0 $3,010,397 $0 $827Restricted (Reserved) $0 $0 $0 $0 $0 $0 $0Committed $564,978 $0 $0 $0 $3,388,867 $0 $1,000Assigned (Designated) $6,727,919 $0 $1,712,000 $34,156,520 $3,000,000 $1,498,991Unassigned ( Undesignated) $16,441,267 $13,363,461 $20,214,000 $1,726,001 $1,421,627 $19,635,000 $42,287,511Total Fund Balance (Deficit) $24,294,367 $13,713,461 $21,926,000 $1,726,001 $41,977,411 $22,635,000 $43,788,329
Debt MeasuresLong-Term Debt $8,697,965,041 $405,887,897 $475,217,973 $647,805,133 $581,093,000 $572,143,498 $392,289,279 $441,631,000 $216,345,930Per Capita $2,430 $3,667 $3,835 $4,388 $4,686 $4,390 $3,044 $4,059 $2,445Annual Debt Service $1,058,127,831 $45,647,287 $52,774,695 $77,557,896 $49,302,000 $64,813,409 $52,455,482 $46,661,000 $25,858,384Per Capita $296 $412 $425 $525 $398 $497 $407 $429 $292
64
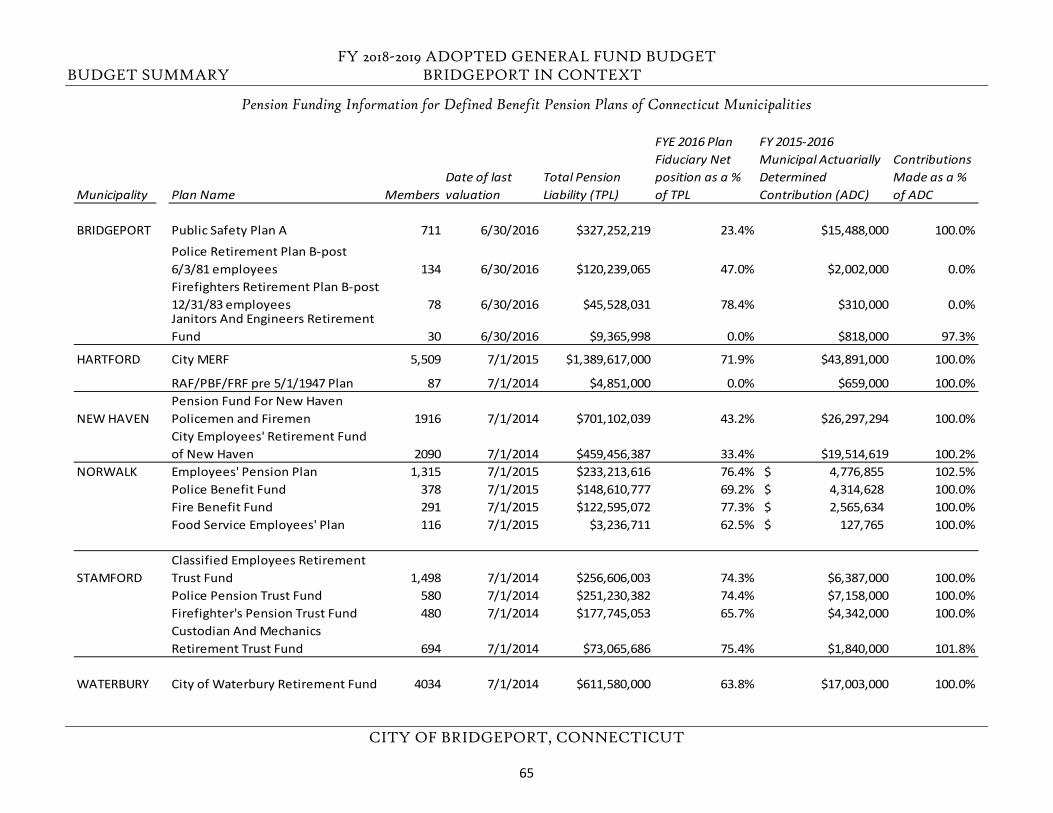
FY 2018-2019 ADOPTED GENERAL FUND BUDGET BUDGET SUMMARY BRIDGEPORT IN CONTEXT
CITY OF BRIDGEPORT, CONNECTICUT
Pension Funding Information for Defined Benefit Pension Plans of Connecticut Municipalities
Municipality Plan Name MembersDate of last valuation
Total Pension Liability (TPL)
FYE 2016 Plan Fiduciary Net position as a % of TPL
FY 2015-2016 Municipal Actuarially Determined Contribution (ADC)
Contributions Made as a % of ADC
BRIDGEPORT Public Safety Plan A 711 6/30/2016 $327,252,219 23.4% $15,488,000 100.0%
Police Retirement Plan B-post 6/3/81 employees 134 6/30/2016 $120,239,065 47.0% $2,002,000 0.0%Firefighters Retirement Plan B-post 12/31/83 employees 78 6/30/2016 $45,528,031 78.4% $310,000 0.0%Janitors And Engineers Retirement Fund 30 6/30/2016 $9,365,998 0.0% $818,000 97.3%
HARTFORD City MERF 5,509 7/1/2015 $1,389,617,000 71.9% $43,891,000 100.0%
RAF/PBF/FRF pre 5/1/1947 Plan 87 7/1/2014 $4,851,000 0.0% $659,000 100.0%
NEW HAVENPension Fund For New Haven Policemen and Firemen 1916 7/1/2014 $701,102,039 43.2% $26,297,294 100.0%City Employees' Retirement Fund of New Haven 2090 7/1/2014 $459,456,387 33.4% $19,514,619 100.2%
NORWALK Employees' Pension Plan 1,315 7/1/2015 $233,213,616 76.4% 4,776,855$ 102.5%Police Benefit Fund 378 7/1/2015 $148,610,777 69.2% 4,314,628$ 100.0%Fire Benefit Fund 291 7/1/2015 $122,595,072 77.3% 2,565,634$ 100.0%Food Service Employees' Plan 116 7/1/2015 $3,236,711 62.5% 127,765$ 100.0%
STAMFORDClassified Employees Retirement Trust Fund 1,498 7/1/2014 $256,606,003 74.3% $6,387,000 100.0%Police Pension Trust Fund 580 7/1/2014 $251,230,382 74.4% $7,158,000 100.0%Firefighter's Pension Trust Fund 480 7/1/2014 $177,745,053 65.7% $4,342,000 100.0%Custodian And Mechanics Retirement Trust Fund 694 7/1/2014 $73,065,686 75.4% $1,840,000 101.8%
WATERBURY City of Waterbury Retirement Fund 4034 7/1/2014 $611,580,000 63.8% $17,003,000 100.0%
65
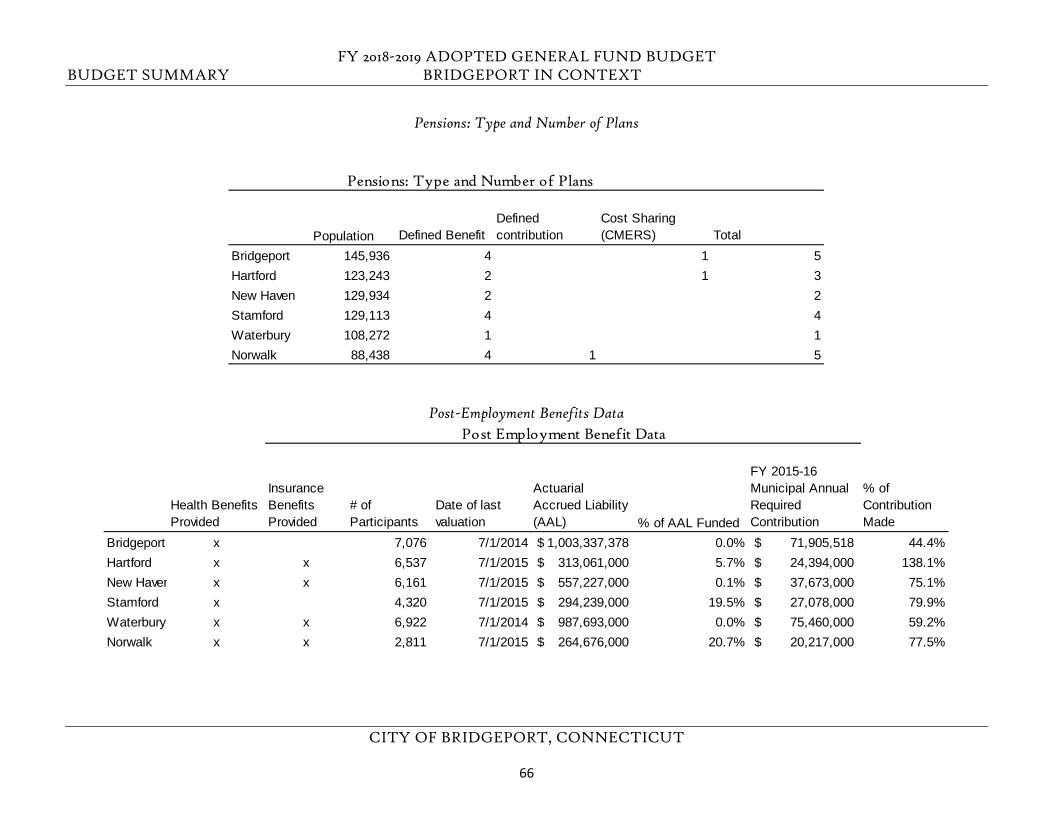
FY 2018-2019 ADOPTED GENERAL FUND BUDGET BUDGET SUMMARY BRIDGEPORT IN CONTEXT
CITY OF BRIDGEPORT, CONNECTICUT
Pensions: Type and Number of Plans
Post-Employment Benefits Data
Population Defined BenefitDefined contribution
Cost Sharing (CMERS) Total
Bridgeport 145,936 4 1 5Hartford 123,243 2 1 3New Haven 129,934 2 2Stamford 129,113 4 4Waterbury 108,272 1 1Norwalk 88,438 4 1 5
Pensions: Type and Number of Plans
Health Benefits Provided
Insurance Benefits Provided
# of Participants
Date of last valuation
Actuarial Accrued Liability (AAL) % of AAL Funded
FY 2015-16 Municipal Annual Required Contribution
% of Contribution Made
Bridgeport x 7,076 7/1/2014 1,003,337,378$ 0.0% 71,905,518$ 44.4%Hartford x x 6,537 7/1/2015 313,061,000$ 5.7% 24,394,000$ 138.1%New Haven x x 6,161 7/1/2015 557,227,000$ 0.1% 37,673,000$ 75.1%Stamford x 4,320 7/1/2015 294,239,000$ 19.5% 27,078,000$ 79.9%Waterbury x x 6,922 7/1/2014 987,693,000$ 0.0% 75,460,000$ 59.2%Norwalk x x 2,811 7/1/2015 264,676,000$ 20.7% 20,217,000$ 77.5%
Post Employment Benefit Data
66
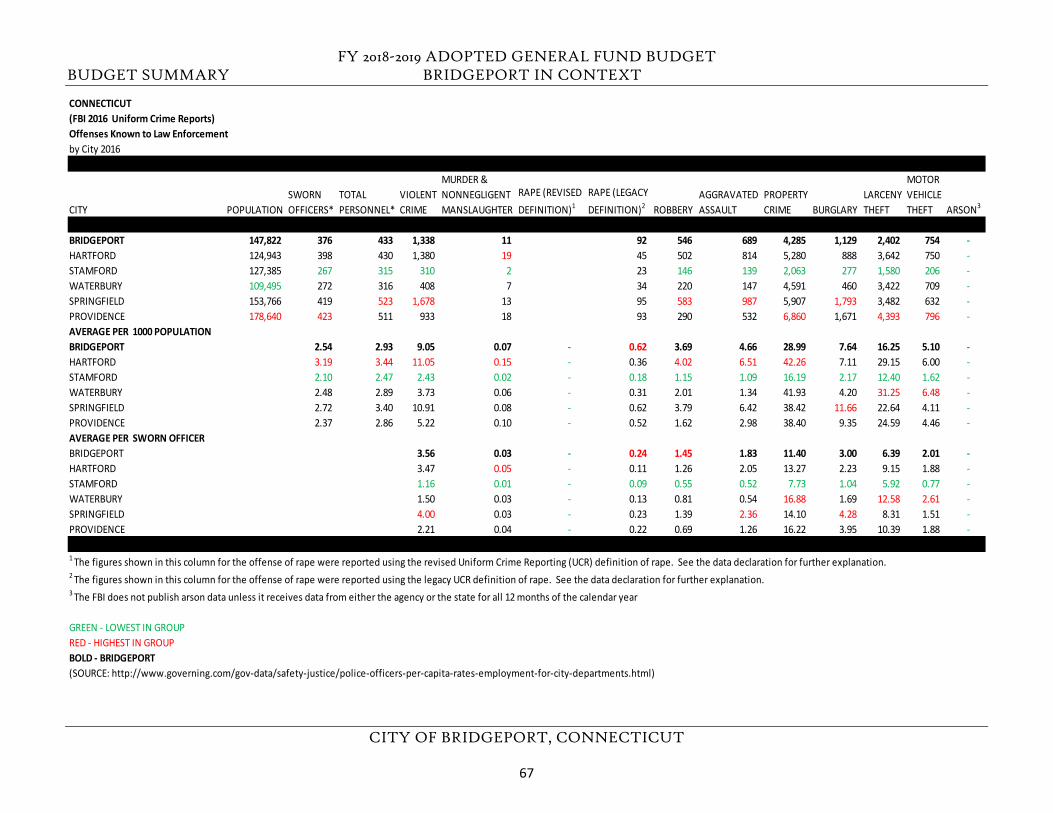
FY 2018-2019 ADOPTED GENERAL FUND BUDGET BUDGET SUMMARY BRIDGEPORT IN CONTEXT
CITY OF BRIDGEPORT, CONNECTICUT
CONNECTICUT(FBI 2016 Uniform Crime Reports)Offenses Known to Law Enforcement by City 2016
CITY POPULATIONSWORN OFFICERS*
TOTAL PERSONNEL*
VIOLENT CRIME
MURDER & NONNEGLIGENT MANSLAUGHTER
RAPE (REVISED DEFINITION)1
RAPE (LEGACY DEFINITION)2 ROBBERY
AGGRAVATED ASSAULT
PROPERTY CRIME BURGLARY
LARCENY THEFT
MOTOR VEHICLE THEFT ARSON3
BRIDGEPORT 147,822 376 433 1,338 11 92 546 689 4,285 1,129 2,402 754 - HARTFORD 124,943 398 430 1,380 19 45 502 814 5,280 888 3,642 750 - STAMFORD 127,385 267 315 310 2 23 146 139 2,063 277 1,580 206 - WATERBURY 109,495 272 316 408 7 34 220 147 4,591 460 3,422 709 - SPRINGFIELD 153,766 419 523 1,678 13 95 583 987 5,907 1,793 3,482 632 - PROVIDENCE 178,640 423 511 933 18 93 290 532 6,860 1,671 4,393 796 - AVERAGE PER 1000 POPULATIONBRIDGEPORT 2.54 2.93 9.05 0.07 - 0.62 3.69 4.66 28.99 7.64 16.25 5.10 - HARTFORD 3.19 3.44 11.05 0.15 - 0.36 4.02 6.51 42.26 7.11 29.15 6.00 - STAMFORD 2.10 2.47 2.43 0.02 - 0.18 1.15 1.09 16.19 2.17 12.40 1.62 - WATERBURY 2.48 2.89 3.73 0.06 - 0.31 2.01 1.34 41.93 4.20 31.25 6.48 - SPRINGFIELD 2.72 3.40 10.91 0.08 - 0.62 3.79 6.42 38.42 11.66 22.64 4.11 - PROVIDENCE 2.37 2.86 5.22 0.10 - 0.52 1.62 2.98 38.40 9.35 24.59 4.46 - AVERAGE PER SWORN OFFICERBRIDGEPORT 3.56 0.03 - 0.24 1.45 1.83 11.40 3.00 6.39 2.01 - HARTFORD 3.47 0.05 - 0.11 1.26 2.05 13.27 2.23 9.15 1.88 - STAMFORD 1.16 0.01 - 0.09 0.55 0.52 7.73 1.04 5.92 0.77 - WATERBURY 1.50 0.03 - 0.13 0.81 0.54 16.88 1.69 12.58 2.61 - SPRINGFIELD 4.00 0.03 - 0.23 1.39 2.36 14.10 4.28 8.31 1.51 - PROVIDENCE 2.21 0.04 - 0.22 0.69 1.26 16.22 3.95 10.39 1.88 -
1 The figures shown in this column for the offense of rape were reported using the revised Uniform Crime Reporting (UCR) definition of rape. See the data declaration for further explanation.2 The figures shown in this column for the offense of rape were reported using the legacy UCR definition of rape. See the data declaration for further explanation.3 The FBI does not publish arson data unless it receives data from either the agency or the state for all 12 months of the calendar year
GREEN - LOWEST IN GROUPRED - HIGHEST IN GROUPBOLD - BRIDGEPORT(SOURCE: http://www.governing.com/gov-data/safety-justice/police-officers-per-capita-rates-employment-for-city-departments.html)
67
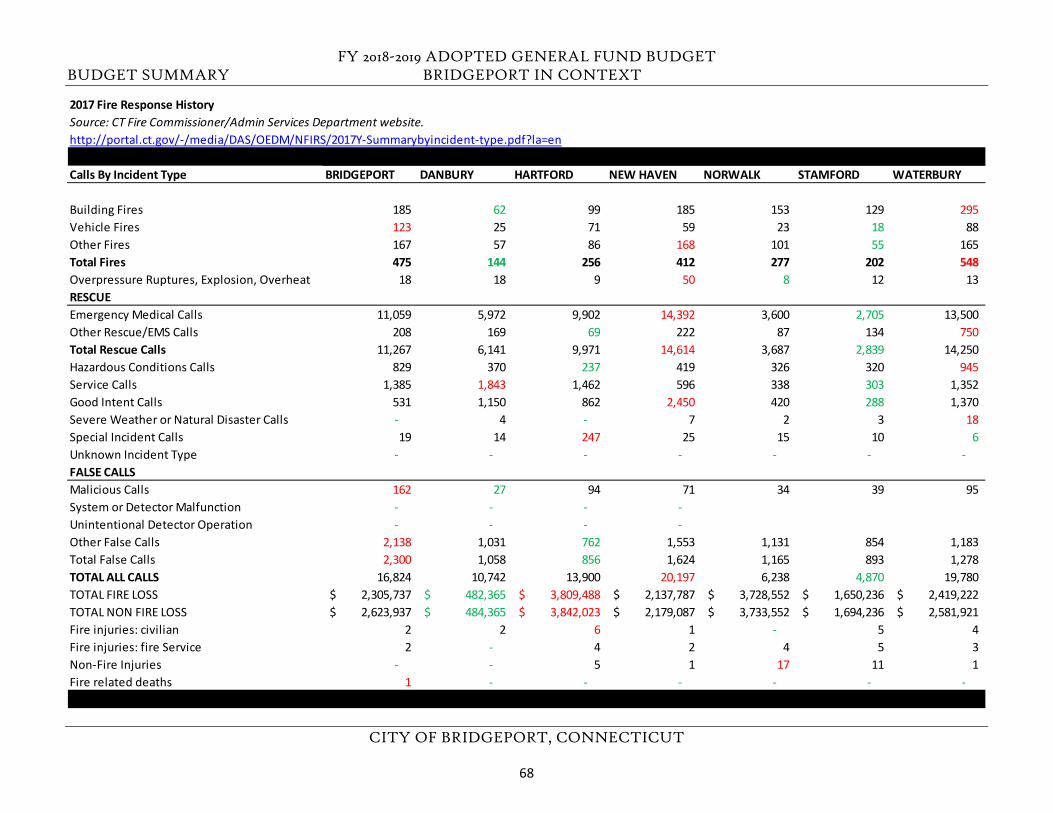
FY 2018-2019 ADOPTED GENERAL FUND BUDGET BUDGET SUMMARY BRIDGEPORT IN CONTEXT
CITY OF BRIDGEPORT, CONNECTICUT
2017 Fire Response History Source: CT Fire Commissioner/Admin Services Department website.http://portal.ct.gov/-/media/DAS/OEDM/NFIRS/2017Y-Summarybyincident-type.pdf?la=en
Calls By Incident Type BRIDGEPORT DANBURY HARTFORD NEW HAVEN NORWALK STAMFORD WATERBURY
Building Fires 185 62 99 185 153 129 295 Vehicle Fires 123 25 71 59 23 18 88 Other Fires 167 57 86 168 101 55 165 Total Fires 475 144 256 412 277 202 548 Overpressure Ruptures, Explosion, Overheat 18 18 9 50 8 12 13 RESCUEEmergency Medical Calls 11,059 5,972 9,902 14,392 3,600 2,705 13,500 Other Rescue/EMS Calls 208 169 69 222 87 134 750 Total Rescue Calls 11,267 6,141 9,971 14,614 3,687 2,839 14,250 Hazardous Conditions Calls 829 370 237 419 326 320 945 Service Calls 1,385 1,843 1,462 596 338 303 1,352 Good Intent Calls 531 1,150 862 2,450 420 288 1,370 Severe Weather or Natural Disaster Calls - 4 - 7 2 3 18 Special Incident Calls 19 14 247 25 15 10 6 Unknown Incident Type - - - - - - - FALSE CALLSMalicious Calls 162 27 94 71 34 39 95 System or Detector Malfunction - - - - Unintentional Detector Operation - - - - Other False Calls 2,138 1,031 762 1,553 1,131 854 1,183 Total False Calls 2,300 1,058 856 1,624 1,165 893 1,278 TOTAL ALL CALLS 16,824 10,742 13,900 20,197 6,238 4,870 19,780 TOTAL FIRE LOSS 2,305,737$ 482,365$ 3,809,488$ 2,137,787$ 3,728,552$ 1,650,236$ 2,419,222$ TOTAL NON FIRE LOSS 2,623,937$ 484,365$ 3,842,023$ 2,179,087$ 3,733,552$ 1,694,236$ 2,581,921$ Fire injuries: civilian 2 2 6 1 - 5 4 Fire injuries: fire Service 2 - 4 2 4 5 3 Non-Fire Injuries - - 5 1 17 11 1 Fire related deaths 1 - - - - - -
68
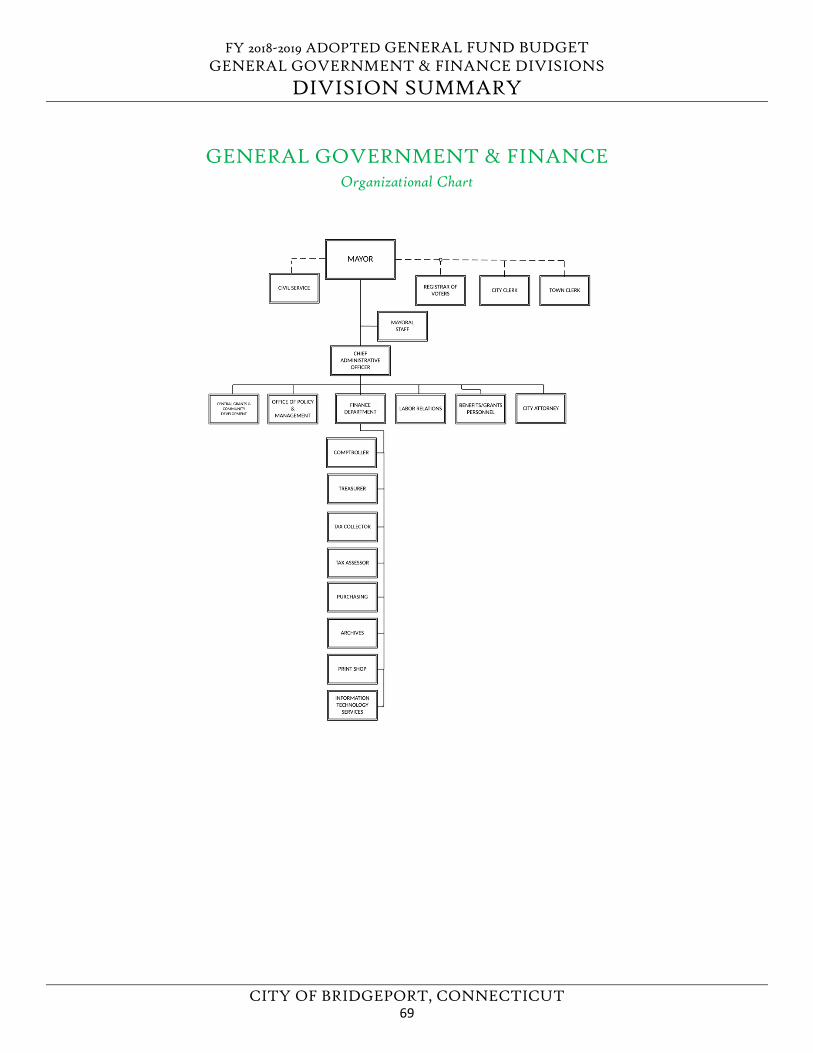
FY 2018-2019 ADOPTED GENERAL FUND BUDGET GENERAL GOVERNMENT & FINANCE DIVISIONS
DIVISION SUMMARY
CITY OF BRIDGEPORT, CONNECTICUT
GENERAL GOVERNMENT & FINANCE Organizational Chart
69
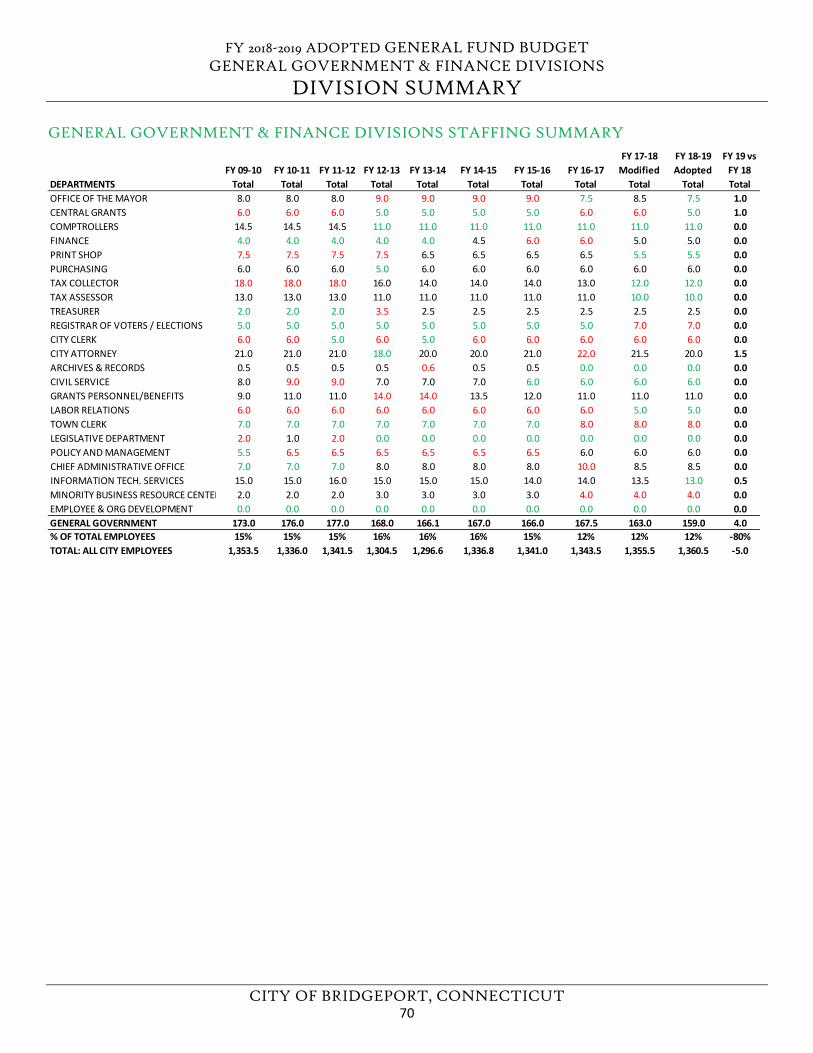
FY 2018-2019 ADOPTED GENERAL FUND BUDGET GENERAL GOVERNMENT & FINANCE DIVISIONS
DIVISION SUMMARY
CITY OF BRIDGEPORT, CONNECTICUT
GENERAL GOVERNMENT & FINANCE DIVISIONS STAFFING SUMMARY
FY 09-10 FY 10-11 FY 11-12 FY 12-13 FY 13-14 FY 14-15 FY 15-16 FY 16-17 FY 17-18
ModifiedFY 18-19 Adopted
FY 19 vs FY 18
DEPARTMENTS Total Total Total Total Total Total Total Total Total Total TotalOFFICE OF THE MAYOR 8.0 8.0 8.0 9.0 9.0 9.0 9.0 7.5 8.5 7.5 1.0CENTRAL GRANTS 6.0 6.0 6.0 5.0 5.0 5.0 5.0 6.0 6.0 5.0 1.0COMPTROLLERS 14.5 14.5 14.5 11.0 11.0 11.0 11.0 11.0 11.0 11.0 0.0FINANCE 4.0 4.0 4.0 4.0 4.0 4.5 6.0 6.0 5.0 5.0 0.0PRINT SHOP 7.5 7.5 7.5 7.5 6.5 6.5 6.5 6.5 5.5 5.5 0.0PURCHASING 6.0 6.0 6.0 5.0 6.0 6.0 6.0 6.0 6.0 6.0 0.0TAX COLLECTOR 18.0 18.0 18.0 16.0 14.0 14.0 14.0 13.0 12.0 12.0 0.0TAX ASSESSOR 13.0 13.0 13.0 11.0 11.0 11.0 11.0 11.0 10.0 10.0 0.0TREASURER 2.0 2.0 2.0 3.5 2.5 2.5 2.5 2.5 2.5 2.5 0.0REGISTRAR OF VOTERS / ELECTIONS 5.0 5.0 5.0 5.0 5.0 5.0 5.0 5.0 7.0 7.0 0.0CITY CLERK 6.0 6.0 5.0 6.0 5.0 6.0 6.0 6.0 6.0 6.0 0.0CITY ATTORNEY 21.0 21.0 21.0 18.0 20.0 20.0 21.0 22.0 21.5 20.0 1.5ARCHIVES & RECORDS 0.5 0.5 0.5 0.5 0.6 0.5 0.5 0.0 0.0 0.0 0.0CIVIL SERVICE 8.0 9.0 9.0 7.0 7.0 7.0 6.0 6.0 6.0 6.0 0.0GRANTS PERSONNEL/BENEFITS 9.0 11.0 11.0 14.0 14.0 13.5 12.0 11.0 11.0 11.0 0.0LABOR RELATIONS 6.0 6.0 6.0 6.0 6.0 6.0 6.0 6.0 5.0 5.0 0.0TOWN CLERK 7.0 7.0 7.0 7.0 7.0 7.0 7.0 8.0 8.0 8.0 0.0LEGISLATIVE DEPARTMENT 2.0 1.0 2.0 0.0 0.0 0.0 0.0 0.0 0.0 0.0 0.0POLICY AND MANAGEMENT 5.5 6.5 6.5 6.5 6.5 6.5 6.5 6.0 6.0 6.0 0.0CHIEF ADMINISTRATIVE OFFICE 7.0 7.0 7.0 8.0 8.0 8.0 8.0 10.0 8.5 8.5 0.0INFORMATION TECH. SERVICES 15.0 15.0 16.0 15.0 15.0 15.0 14.0 14.0 13.5 13.0 0.5MINORITY BUSINESS RESOURCE CENTER 2.0 2.0 2.0 3.0 3.0 3.0 3.0 4.0 4.0 4.0 0.0EMPLOYEE & ORG DEVELOPMENT 0.0 0.0 0.0 0.0 0.0 0.0 0.0 0.0 0.0 0.0 0.0GENERAL GOVERNMENT 173.0 176.0 177.0 168.0 166.1 167.0 166.0 167.5 163.0 159.0 4.0% OF TOTAL EMPLOYEES 15% 15% 15% 16% 16% 16% 15% 12% 12% 12% -80%TOTAL: ALL CITY EMPLOYEES 1,353.5 1,336.0 1,341.5 1,304.5 1,296.6 1,336.8 1,341.0 1,343.5 1,355.5 1,360.5 -5.0
70
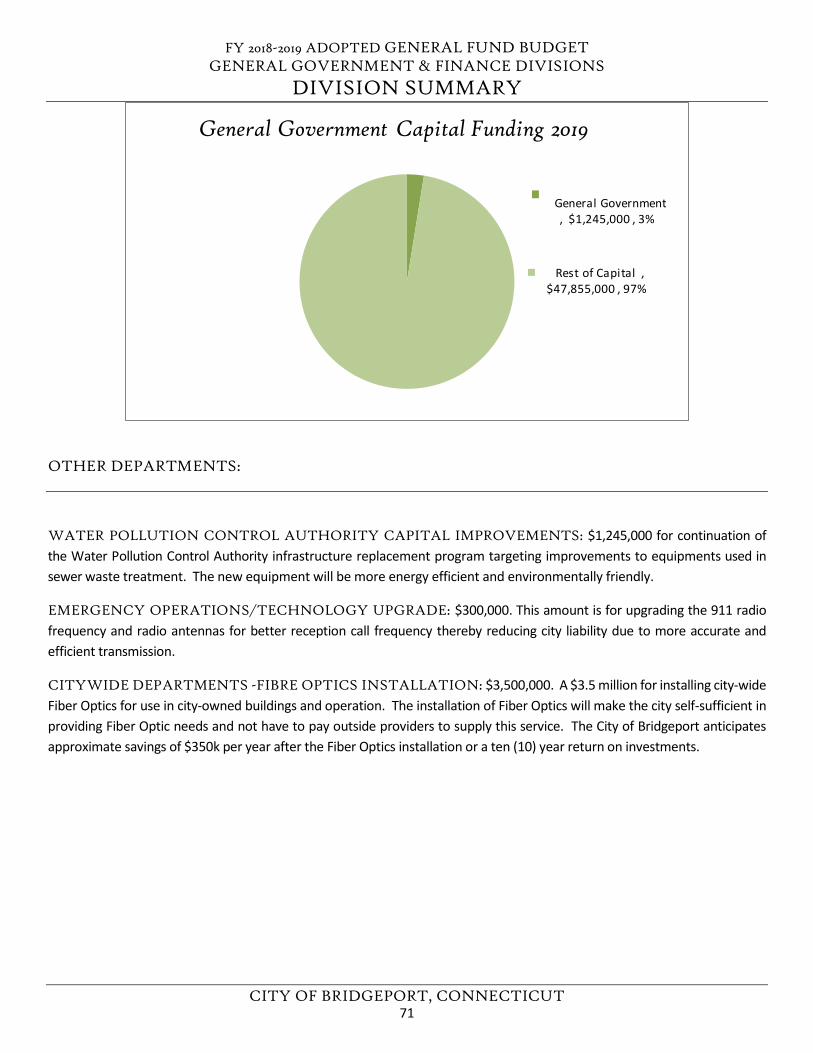
FY 2018-2019 ADOPTED GENERAL FUND BUDGET GENERAL GOVERNMENT & FINANCE DIVISIONS
DIVISION SUMMARY
CITY OF BRIDGEPORT, CONNECTICUT
OTHER DEPARTMENTS:
WATER POLLUTION CONTROL AUTHORITY CAPITAL IMPROVEMENTS: $1,245,000 for continuation of the Water Pollution Control Authority infrastructure replacement program targeting improvements to equipments used in sewer waste treatment. The new equipment will be more energy efficient and environmentally friendly.
EMERGENCY OPERATIONS/TECHNOLOGY UPGRADE: $300,000. This amount is for upgrading the 911 radio frequency and radio antennas for better reception call frequency thereby reducing city liability due to more accurate and efficient transmission.
CITYWIDE DEPARTMENTS -FIBRE OPTICS INSTALLATION: $3,500,000. A $3.5 million for installing city-wide Fiber Optics for use in city-owned buildings and operation. The installation of Fiber Optics will make the city self-sufficient in providing Fiber Optic needs and not have to pay outside providers to supply this service. The City of Bridgeport anticipates approximate savings of $350k per year after the Fiber Optics installation or a ten (10) year return on investments.
General Government , $1,245,000 , 3%
Rest of Capital , $47,855,000 , 97%
General Government Capital Funding 2019
71
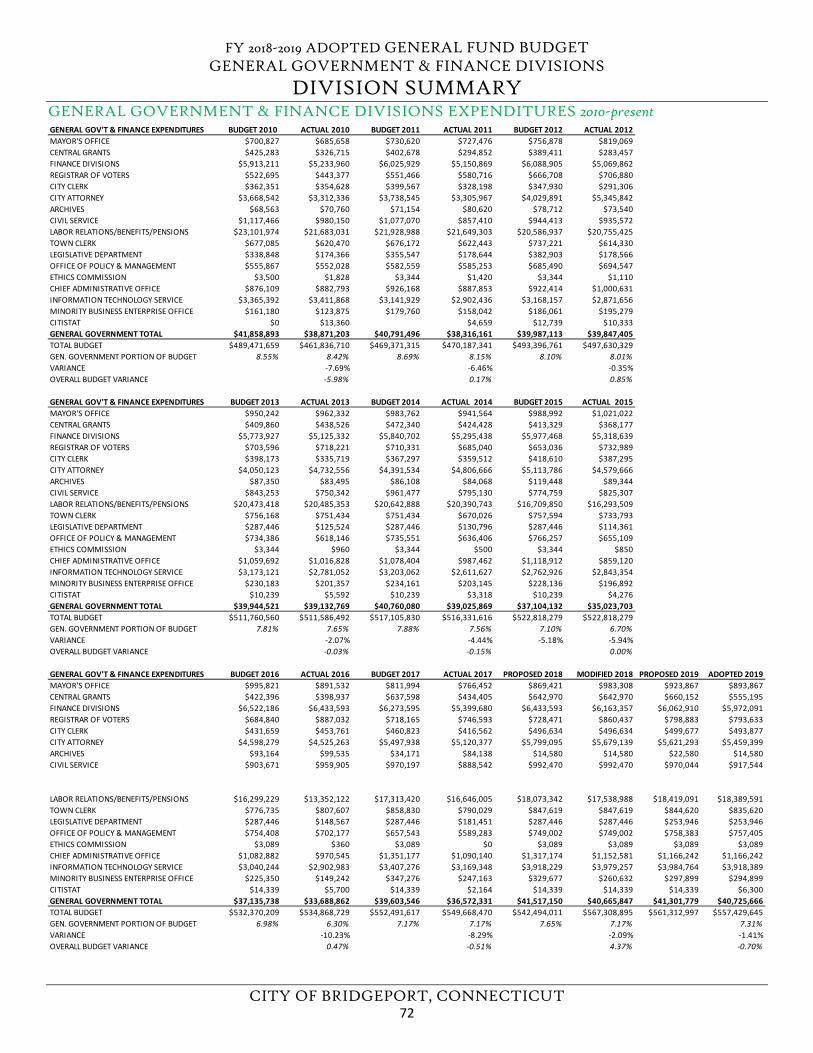
FY 2018-2019 ADOPTED GENERAL FUND BUDGET GENERAL GOVERNMENT & FINANCE DIVISIONS
DIVISION SUMMARY
CITY OF BRIDGEPORT, CONNECTICUT
GENERAL GOVERNMENT & FINANCE DIVISIONS EXPENDITURES 2010-present
GENERAL GOV'T & FINANCE EXPENDITURES BUDGET 2010 ACTUAL 2010 BUDGET 2011 ACTUAL 2011 BUDGET 2012 ACTUAL 2012MAYOR'S OFFICE $700,827 $685,658 $730,620 $727,476 $756,878 $819,069CENTRAL GRANTS $425,283 $326,715 $402,678 $294,852 $389,411 $283,457FINANCE DIVISIONS $5,913,211 $5,233,960 $6,025,929 $5,150,869 $6,088,905 $5,069,862REGISTRAR OF VOTERS $522,695 $443,377 $551,466 $580,716 $666,708 $706,880CITY CLERK $362,351 $354,628 $399,567 $328,198 $347,930 $291,306CITY ATTORNEY $3,668,542 $3,312,336 $3,738,545 $3,305,967 $4,029,891 $5,345,842ARCHIVES $68,563 $70,760 $71,154 $80,620 $78,712 $73,540CIVIL SERVICE $1,117,466 $980,150 $1,077,070 $857,410 $944,413 $935,572LABOR RELATIONS/BENEFITS/PENSIONS $23,101,974 $21,683,031 $21,928,988 $21,649,303 $20,586,937 $20,755,425TOWN CLERK $677,085 $620,470 $676,172 $622,443 $737,221 $614,330LEGISLATIVE DEPARTMENT $338,848 $174,366 $355,547 $178,644 $382,903 $178,566OFFICE OF POLICY & MANAGEMENT $555,867 $552,028 $582,559 $585,253 $685,490 $694,547ETHICS COMMISSION $3,500 $1,828 $3,344 $1,420 $3,344 $1,110CHIEF ADMINISTRATIVE OFFICE $876,109 $882,793 $926,168 $887,853 $922,414 $1,000,631INFORMATION TECHNOLOGY SERVICE $3,365,392 $3,411,868 $3,141,929 $2,902,436 $3,168,157 $2,871,656MINORITY BUSINESS ENTERPRISE OFFICE $161,180 $123,875 $179,760 $158,042 $186,061 $195,279CITISTAT $0 $13,360 $4,659 $12,739 $10,333GENERAL GOVERNMENT TOTAL $41,858,893 $38,871,203 $40,791,496 $38,316,161 $39,987,113 $39,847,405TOTAL BUDGET $489,471,659 $461,836,710 $469,371,315 $470,187,341 $493,396,761 $497,630,329GEN. GOVERNMENT PORTION OF BUDGET 8.55% 8.42% 8.69% 8.15% 8.10% 8.01%VARIANCE -7.69% -6.46% -0.35%OVERALL BUDGET VARIANCE -5.98% 0.17% 0.85%
GENERAL GOV'T & FINANCE EXPENDITURES BUDGET 2013 ACTUAL 2013 BUDGET 2014 ACTUAL 2014 BUDGET 2015 ACTUAL 2015MAYOR'S OFFICE $950,242 $962,332 $983,762 $941,564 $988,992 $1,021,022CENTRAL GRANTS $409,860 $438,526 $472,340 $424,428 $413,329 $368,177FINANCE DIVISIONS $5,773,927 $5,125,332 $5,840,702 $5,295,438 $5,977,468 $5,318,639REGISTRAR OF VOTERS $703,596 $718,221 $710,331 $685,040 $653,036 $732,989CITY CLERK $398,173 $335,719 $367,297 $359,512 $418,610 $387,295CITY ATTORNEY $4,050,123 $4,732,556 $4,391,534 $4,806,666 $5,113,786 $4,579,666ARCHIVES $87,350 $83,495 $86,108 $84,068 $119,448 $89,344CIVIL SERVICE $843,253 $750,342 $961,477 $795,130 $774,759 $825,307LABOR RELATIONS/BENEFITS/PENSIONS $20,473,418 $20,485,353 $20,642,888 $20,390,743 $16,709,850 $16,293,509TOWN CLERK $756,168 $751,434 $751,434 $670,026 $757,594 $733,793LEGISLATIVE DEPARTMENT $287,446 $125,524 $287,446 $130,796 $287,446 $114,361OFFICE OF POLICY & MANAGEMENT $734,386 $618,146 $735,551 $636,406 $766,257 $655,109ETHICS COMMISSION $3,344 $960 $3,344 $500 $3,344 $850CHIEF ADMINISTRATIVE OFFICE $1,059,692 $1,016,828 $1,078,404 $987,462 $1,118,912 $859,120INFORMATION TECHNOLOGY SERVICE $3,173,121 $2,781,052 $3,203,062 $2,611,627 $2,762,926 $2,843,354MINORITY BUSINESS ENTERPRISE OFFICE $230,183 $201,357 $234,161 $203,145 $228,136 $196,892CITISTAT $10,239 $5,592 $10,239 $3,318 $10,239 $4,276GENERAL GOVERNMENT TOTAL $39,944,521 $39,132,769 $40,760,080 $39,025,869 $37,104,132 $35,023,703TOTAL BUDGET $511,760,560 $511,586,492 $517,105,830 $516,331,616 $522,818,279 $522,818,279GEN. GOVERNMENT PORTION OF BUDGET 7.81% 7.65% 7.88% 7.56% 7.10% 6.70%VARIANCE -2.07% -4.44% -5.18% -5.94%OVERALL BUDGET VARIANCE -0.03% -0.15% 0.00%
GENERAL GOV'T & FINANCE EXPENDITURES BUDGET 2016 ACTUAL 2016 BUDGET 2017 ACTUAL 2017 PROPOSED 2018 MODIFIED 2018 PROPOSED 2019 ADOPTED 2019MAYOR'S OFFICE $995,821 $891,532 $811,994 $766,452 $869,421 $983,308 $923,867 $893,867CENTRAL GRANTS $422,396 $398,937 $637,598 $434,405 $642,970 $642,970 $660,152 $555,195FINANCE DIVISIONS $6,522,186 $6,433,593 $6,273,595 $5,399,680 $6,433,593 $6,163,357 $6,062,910 $5,972,091REGISTRAR OF VOTERS $684,840 $887,032 $718,165 $746,593 $728,471 $860,437 $798,883 $793,633CITY CLERK $431,659 $453,761 $460,823 $416,562 $496,634 $496,634 $499,677 $493,877CITY ATTORNEY $4,598,279 $4,525,263 $5,497,938 $5,120,377 $5,799,095 $5,679,139 $5,621,293 $5,459,399ARCHIVES $93,164 $99,535 $34,171 $84,138 $14,580 $14,580 $22,580 $14,580CIVIL SERVICE $903,671 $959,905 $970,197 $888,542 $992,470 $992,470 $970,044 $917,544
LABOR RELATIONS/BENEFITS/PENSIONS $16,299,229 $13,352,122 $17,313,420 $16,646,005 $18,073,342 $17,538,988 $18,419,091 $18,389,591TOWN CLERK $776,735 $807,607 $858,830 $790,029 $847,619 $847,619 $844,620 $835,620LEGISLATIVE DEPARTMENT $287,446 $148,567 $287,446 $181,451 $287,446 $287,446 $253,946 $253,946OFFICE OF POLICY & MANAGEMENT $754,408 $702,177 $657,543 $589,283 $749,002 $749,002 $758,383 $757,405ETHICS COMMISSION $3,089 $360 $3,089 $0 $3,089 $3,089 $3,089 $3,089CHIEF ADMINISTRATIVE OFFICE $1,082,882 $970,545 $1,351,177 $1,090,140 $1,317,174 $1,152,581 $1,166,242 $1,166,242INFORMATION TECHNOLOGY SERVICE $3,040,244 $2,902,983 $3,407,276 $3,169,348 $3,918,229 $3,979,257 $3,984,764 $3,918,389MINORITY BUSINESS ENTERPRISE OFFICE $225,350 $149,242 $347,276 $247,163 $329,677 $260,632 $297,899 $294,899CITISTAT $14,339 $5,700 $14,339 $2,164 $14,339 $14,339 $14,339 $6,300GENERAL GOVERNMENT TOTAL $37,135,738 $33,688,862 $39,603,546 $36,572,331 $41,517,150 $40,665,847 $41,301,779 $40,725,666TOTAL BUDGET $532,370,209 $534,868,729 $552,491,617 $549,668,470 $542,494,011 $567,308,895 $561,312,997 $557,429,645GEN. GOVERNMENT PORTION OF BUDGET 6.98% 6.30% 7.17% 7.17% 7.65% 7.17% 7.31%VARIANCE -10.23% -8.29% -2.09% -1.41%OVERALL BUDGET VARIANCE 0.47% -0.51% 4.37% -0.70%
72
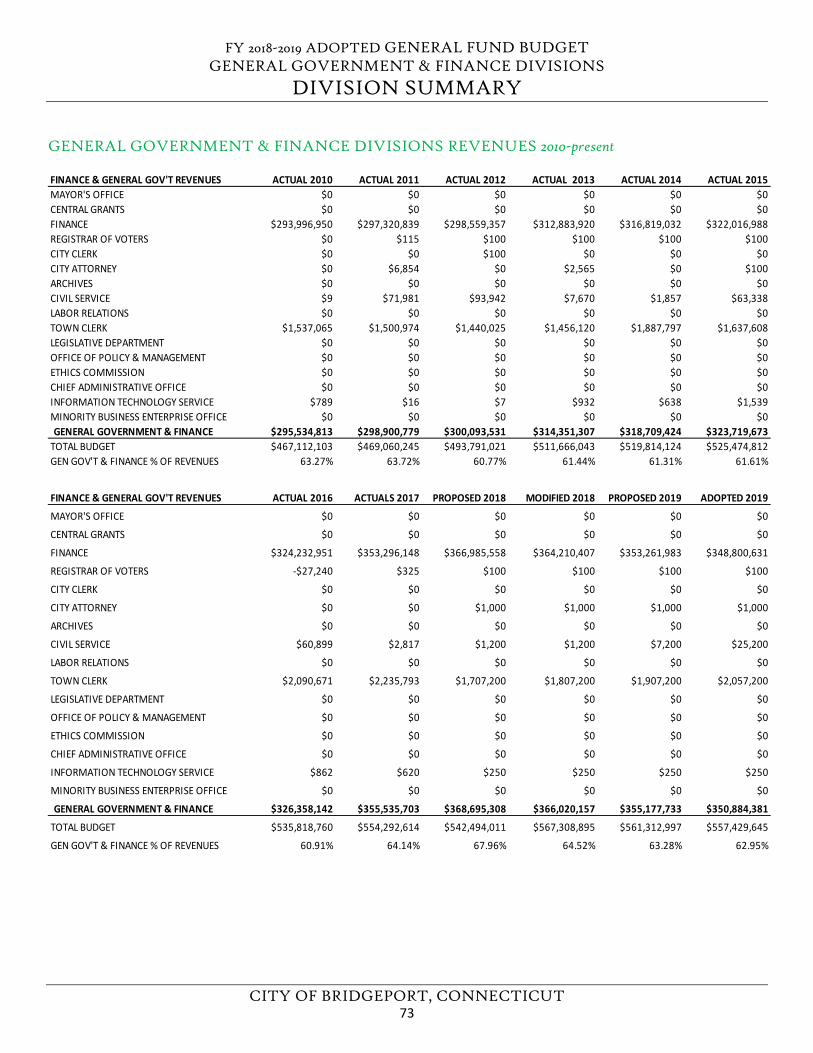
FY 2018-2019 ADOPTED GENERAL FUND BUDGET GENERAL GOVERNMENT & FINANCE DIVISIONS
DIVISION SUMMARY
CITY OF BRIDGEPORT, CONNECTICUT
GENERAL GOVERNMENT & FINANCE DIVISIONS REVENUES 2010-present
FINANCE & GENERAL GOV'T REVENUES ACTUAL 2010 ACTUAL 2011 ACTUAL 2012 ACTUAL 2013 ACTUAL 2014 ACTUAL 2015MAYOR'S OFFICE $0 $0 $0 $0 $0 $0CENTRAL GRANTS $0 $0 $0 $0 $0 $0FINANCE $293,996,950 $297,320,839 $298,559,357 $312,883,920 $316,819,032 $322,016,988REGISTRAR OF VOTERS $0 $115 $100 $100 $100 $100CITY CLERK $0 $0 $100 $0 $0 $0CITY ATTORNEY $0 $6,854 $0 $2,565 $0 $100ARCHIVES $0 $0 $0 $0 $0 $0CIVIL SERVICE $9 $71,981 $93,942 $7,670 $1,857 $63,338LABOR RELATIONS $0 $0 $0 $0 $0 $0TOWN CLERK $1,537,065 $1,500,974 $1,440,025 $1,456,120 $1,887,797 $1,637,608LEGISLATIVE DEPARTMENT $0 $0 $0 $0 $0 $0OFFICE OF POLICY & MANAGEMENT $0 $0 $0 $0 $0 $0ETHICS COMMISSION $0 $0 $0 $0 $0 $0CHIEF ADMINISTRATIVE OFFICE $0 $0 $0 $0 $0 $0INFORMATION TECHNOLOGY SERVICE $789 $16 $7 $932 $638 $1,539MINORITY BUSINESS ENTERPRISE OFFICE $0 $0 $0 $0 $0 $0GENERAL GOVERNMENT & FINANCE $295,534,813 $298,900,779 $300,093,531 $314,351,307 $318,709,424 $323,719,673
TOTAL BUDGET $467,112,103 $469,060,245 $493,791,021 $511,666,043 $519,814,124 $525,474,812GEN GOV'T & FINANCE % OF REVENUES 63.27% 63.72% 60.77% 61.44% 61.31% 61.61%
FINANCE & GENERAL GOV'T REVENUES ACTUAL 2016 ACTUALS 2017 PROPOSED 2018 MODIFIED 2018 PROPOSED 2019 ADOPTED 2019
MAYOR'S OFFICE $0 $0 $0 $0 $0 $0
CENTRAL GRANTS $0 $0 $0 $0 $0 $0
FINANCE $324,232,951 $353,296,148 $366,985,558 $364,210,407 $353,261,983 $348,800,631
REGISTRAR OF VOTERS -$27,240 $325 $100 $100 $100 $100
CITY CLERK $0 $0 $0 $0 $0 $0
CITY ATTORNEY $0 $0 $1,000 $1,000 $1,000 $1,000
ARCHIVES $0 $0 $0 $0 $0 $0
CIVIL SERVICE $60,899 $2,817 $1,200 $1,200 $7,200 $25,200
LABOR RELATIONS $0 $0 $0 $0 $0 $0
TOWN CLERK $2,090,671 $2,235,793 $1,707,200 $1,807,200 $1,907,200 $2,057,200
LEGISLATIVE DEPARTMENT $0 $0 $0 $0 $0 $0
OFFICE OF POLICY & MANAGEMENT $0 $0 $0 $0 $0 $0
ETHICS COMMISSION $0 $0 $0 $0 $0 $0
CHIEF ADMINISTRATIVE OFFICE $0 $0 $0 $0 $0 $0
INFORMATION TECHNOLOGY SERVICE $862 $620 $250 $250 $250 $250
MINORITY BUSINESS ENTERPRISE OFFICE $0 $0 $0 $0 $0 $0
GENERAL GOVERNMENT & FINANCE $326,358,142 $355,535,703 $368,695,308 $366,020,157 $355,177,733 $350,884,381
TOTAL BUDGET $535,818,760 $554,292,614 $542,494,011 $567,308,895 $561,312,997 $557,429,645
GEN GOV'T & FINANCE % OF REVENUES 60.91% 64.14% 67.96% 64.52% 63.28% 62.95%
73
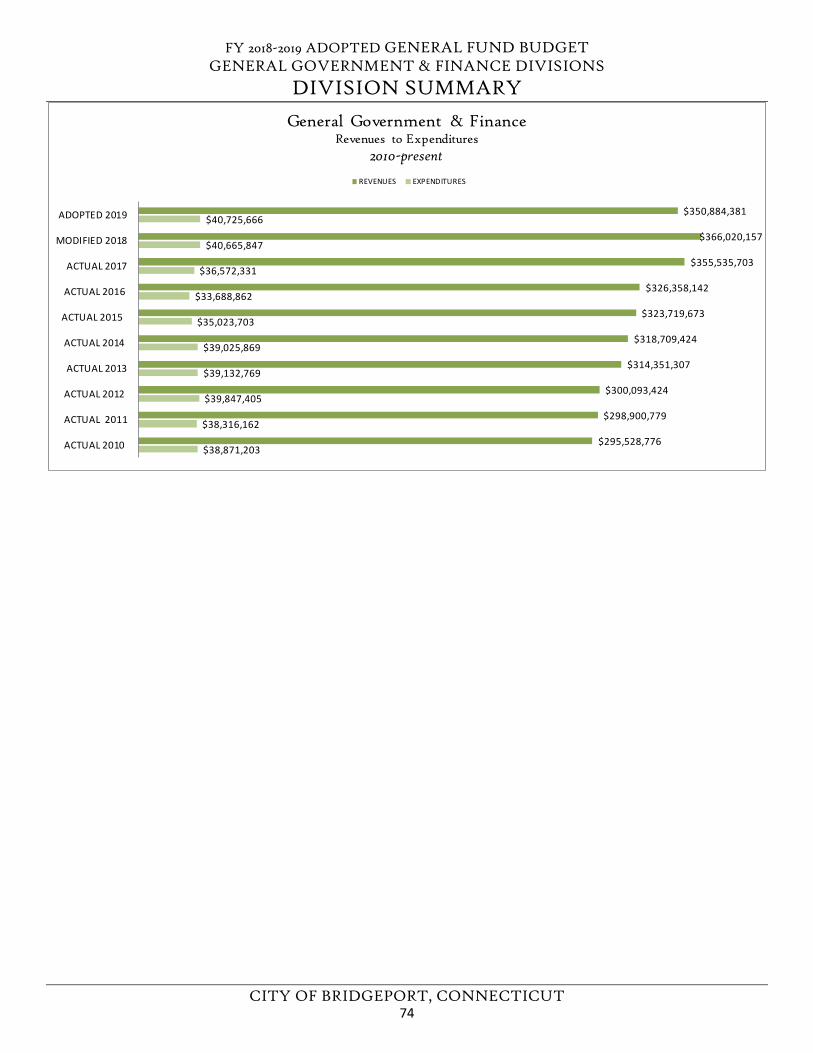
FY 2018-2019 ADOPTED GENERAL FUND BUDGET GENERAL GOVERNMENT & FINANCE DIVISIONS
DIVISION SUMMARY
CITY OF BRIDGEPORT, CONNECTICUT
$38,871,203
$38,316,162
$39,847,405
$39,132,769
$39,025,869
$35,023,703
$33,688,862
$36,572,331
$40,665,847
$40,725,666
$295,528,776
$298,900,779
$300,093,424
$314,351,307
$318,709,424
$323,719,673
$326,358,142
$355,535,703
$366,020,157
$350,884,381
ACTUAL 2010
ACTUAL 2011
ACTUAL 2012
ACTUAL 2013
ACTUAL 2014
ACTUAL 2015
ACTUAL 2016
ACTUAL 2017
MODIFIED 2018
ADOPTED 2019
General Government & Finance Revenues to Expenditures
2010-present
REVENUES EXPENDITURES
74
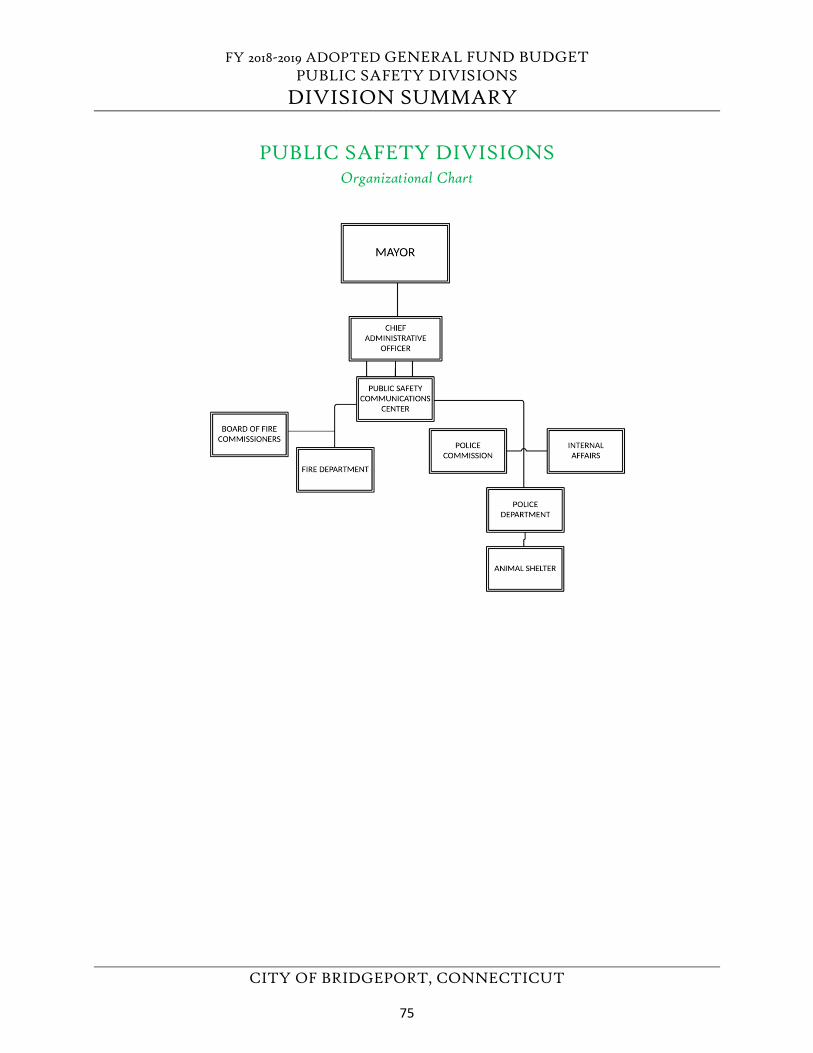
FY 2018-2019 ADOPTED GENERAL FUND BUDGET PUBLIC SAFETY DIVISIONS
DIVISION SUMMARY
CITY OF BRIDGEPORT, CONNECTICUT
PUBLIC SAFETY DIVISIONS Organizational Chart
75
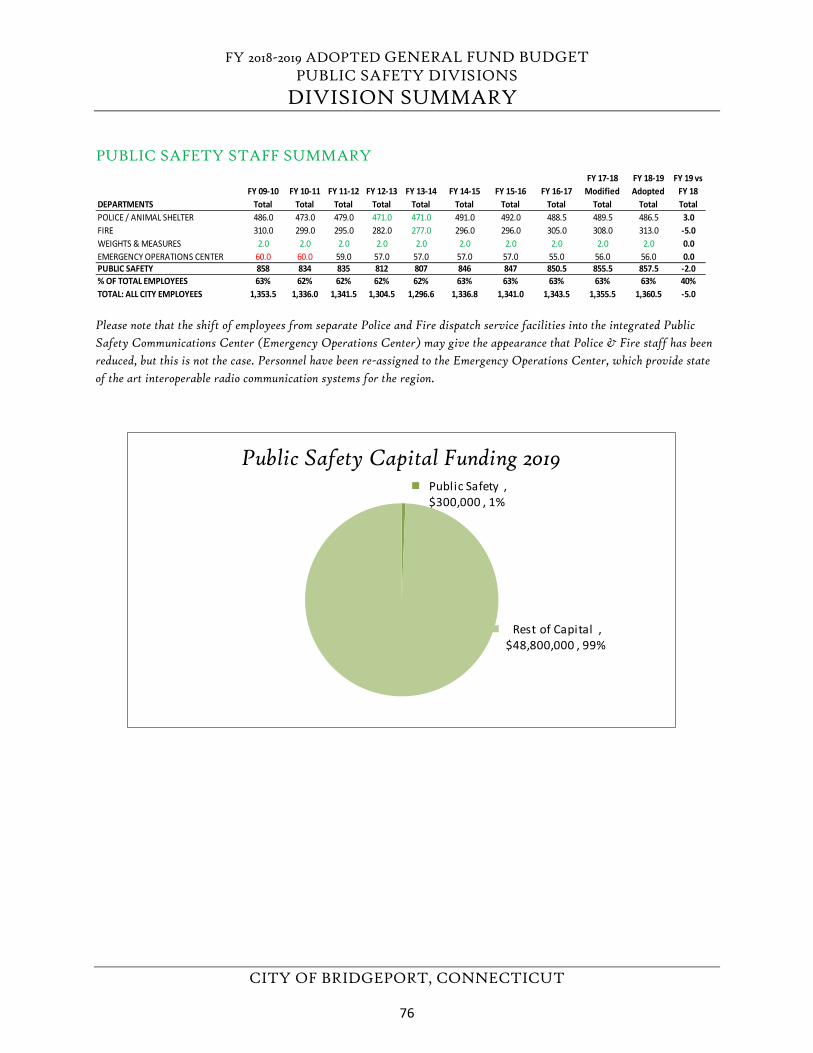
FY 2018-2019 ADOPTED GENERAL FUND BUDGET PUBLIC SAFETY DIVISIONS
DIVISION SUMMARY
CITY OF BRIDGEPORT, CONNECTICUT
PUBLIC SAFETY STAFF SUMMARY
Please note that the shift of employees from separate Police and Fire dispatch service facilities into the integrated Public Safety Communications Center (Emergency Operations Center) may give the appearance that Police & Fire staff has been reduced, but this is not the case. Personnel have been re-assigned to the Emergency Operations Center, which provide state of the art interoperable radio communication systems for the region.
FY 09-10 FY 10-11 FY 11-12 FY 12-13 FY 13-14 FY 14-15 FY 15-16 FY 16-17 FY 17-18
ModifiedFY 18-19 Adopted
FY 19 vs FY 18
DEPARTMENTS Total Total Total Total Total Total Total Total Total Total TotalPOLICE / ANIMAL SHELTER 486.0 473.0 479.0 471.0 471.0 491.0 492.0 488.5 489.5 486.5 3.0FIRE 310.0 299.0 295.0 282.0 277.0 296.0 296.0 305.0 308.0 313.0 -5.0WEIGHTS & MEASURES 2.0 2.0 2.0 2.0 2.0 2.0 2.0 2.0 2.0 2.0 0.0EMERGENCY OPERATIONS CENTER 60.0 60.0 59.0 57.0 57.0 57.0 57.0 55.0 56.0 56.0 0.0PUBLIC SAFETY 858 834 835 812 807 846 847 850.5 855.5 857.5 -2.0% OF TOTAL EMPLOYEES 63% 62% 62% 62% 62% 63% 63% 63% 63% 63% 40%TOTAL: ALL CITY EMPLOYEES 1,353.5 1,336.0 1,341.5 1,304.5 1,296.6 1,336.8 1,341.0 1,343.5 1,355.5 1,360.5 -5.0
Public Safety , $300,000 , 1%
Rest of Capital , $48,800,000 , 99%
Public Safety Capital Funding 2019
76
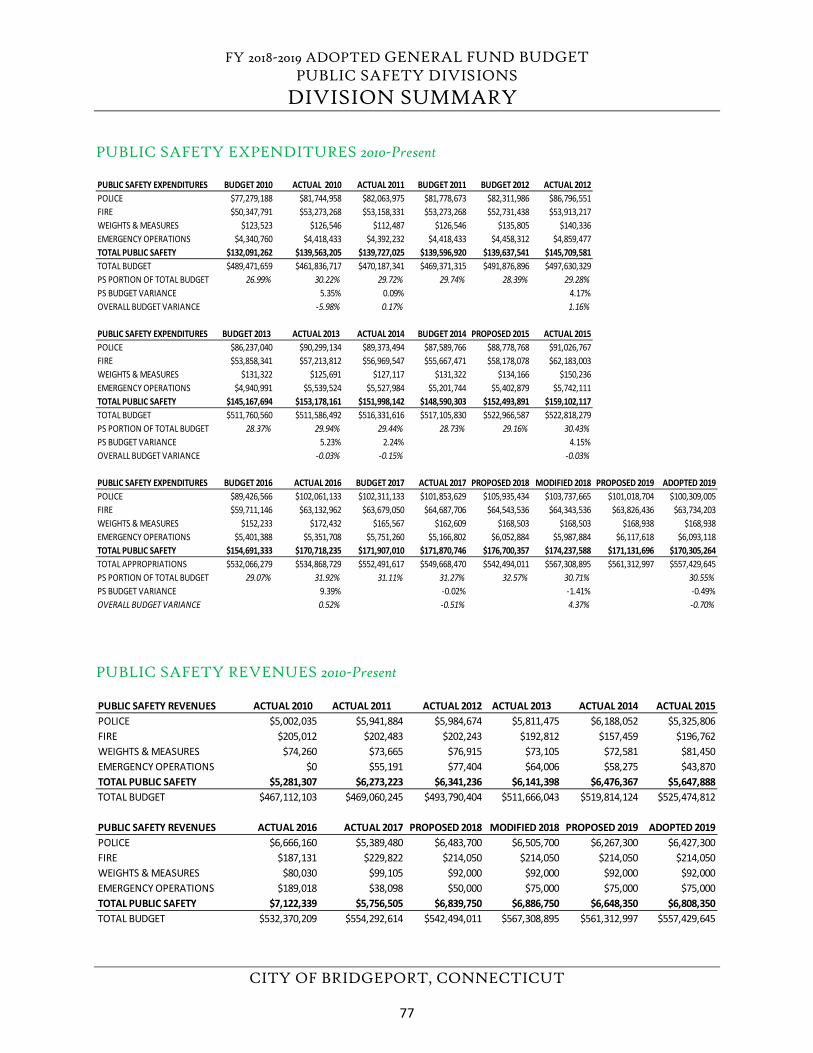
FY 2018-2019 ADOPTED GENERAL FUND BUDGET PUBLIC SAFETY DIVISIONS
DIVISION SUMMARY
CITY OF BRIDGEPORT, CONNECTICUT
PUBLIC SAFETY EXPENDITURES 2010-Present
PUBLIC SAFETY REVENUES 2010-Present
PUBLIC SAFETY EXPENDITURES BUDGET 2010 ACTUAL 2010 ACTUAL 2011 BUDGET 2011 BUDGET 2012 ACTUAL 2012POLICE $77,279,188 $81,744,958 $82,063,975 $81,778,673 $82,311,986 $86,796,551FIRE $50,347,791 $53,273,268 $53,158,331 $53,273,268 $52,731,438 $53,913,217WEIGHTS & MEASURES $123,523 $126,546 $112,487 $126,546 $135,805 $140,336EMERGENCY OPERATIONS $4,340,760 $4,418,433 $4,392,232 $4,418,433 $4,458,312 $4,859,477TOTAL PUBLIC SAFETY $132,091,262 $139,563,205 $139,727,025 $139,596,920 $139,637,541 $145,709,581TOTAL BUDGET $489,471,659 $461,836,717 $470,187,341 $469,371,315 $491,876,896 $497,630,329PS PORTION OF TOTAL BUDGET 26.99% 30.22% 29.72% 29.74% 28.39% 29.28%PS BUDGET VARIANCE 5.35% 0.09% 4.17%OVERALL BUDGET VARIANCE -5.98% 0.17% 1.16%
PUBLIC SAFETY EXPENDITURES BUDGET 2013 ACTUAL 2013 ACTUAL 2014 BUDGET 2014 PROPOSED 2015 ACTUAL 2015POLICE $86,237,040 $90,299,134 $89,373,494 $87,589,766 $88,778,768 $91,026,767FIRE $53,858,341 $57,213,812 $56,969,547 $55,667,471 $58,178,078 $62,183,003WEIGHTS & MEASURES $131,322 $125,691 $127,117 $131,322 $134,166 $150,236EMERGENCY OPERATIONS $4,940,991 $5,539,524 $5,527,984 $5,201,744 $5,402,879 $5,742,111TOTAL PUBLIC SAFETY $145,167,694 $153,178,161 $151,998,142 $148,590,303 $152,493,891 $159,102,117TOTAL BUDGET $511,760,560 $511,586,492 $516,331,616 $517,105,830 $522,966,587 $522,818,279PS PORTION OF TOTAL BUDGET 28.37% 29.94% 29.44% 28.73% 29.16% 30.43%PS BUDGET VARIANCE 5.23% 2.24% 4.15%OVERALL BUDGET VARIANCE -0.03% -0.15% -0.03%
PUBLIC SAFETY EXPENDITURES BUDGET 2016 ACTUAL 2016 BUDGET 2017 ACTUAL 2017 PROPOSED 2018 MODIFIED 2018 PROPOSED 2019 ADOPTED 2019POLICE $89,426,566 $102,061,133 $102,311,133 $101,853,629 $105,935,434 $103,737,665 $101,018,704 $100,309,005FIRE $59,711,146 $63,132,962 $63,679,050 $64,687,706 $64,543,536 $64,343,536 $63,826,436 $63,734,203WEIGHTS & MEASURES $152,233 $172,432 $165,567 $162,609 $168,503 $168,503 $168,938 $168,938EMERGENCY OPERATIONS $5,401,388 $5,351,708 $5,751,260 $5,166,802 $6,052,884 $5,987,884 $6,117,618 $6,093,118TOTAL PUBLIC SAFETY $154,691,333 $170,718,235 $171,907,010 $171,870,746 $176,700,357 $174,237,588 $171,131,696 $170,305,264TOTAL APPROPRIATIONS $532,066,279 $534,868,729 $552,491,617 $549,668,470 $542,494,011 $567,308,895 $561,312,997 $557,429,645PS PORTION OF TOTAL BUDGET 29.07% 31.92% 31.11% 31.27% 32.57% 30.71% 30.55%PS BUDGET VARIANCE 9.39% -0.02% -1.41% -0.49%OVERALL BUDGET VARIANCE 0.52% -0.51% 4.37% -0.70%
PUBLIC SAFETY REVENUES ACTUAL 2010 ACTUAL 2011 ACTUAL 2012 ACTUAL 2013 ACTUAL 2014 ACTUAL 2015POLICE $5,002,035 $5,941,884 $5,984,674 $5,811,475 $6,188,052 $5,325,806FIRE $205,012 $202,483 $202,243 $192,812 $157,459 $196,762WEIGHTS & MEASURES $74,260 $73,665 $76,915 $73,105 $72,581 $81,450EMERGENCY OPERATIONS $0 $55,191 $77,404 $64,006 $58,275 $43,870TOTAL PUBLIC SAFETY $5,281,307 $6,273,223 $6,341,236 $6,141,398 $6,476,367 $5,647,888TOTAL BUDGET $467,112,103 $469,060,245 $493,790,404 $511,666,043 $519,814,124 $525,474,812
PUBLIC SAFETY REVENUES ACTUAL 2016 ACTUAL 2017 PROPOSED 2018 MODIFIED 2018 PROPOSED 2019 ADOPTED 2019POLICE $6,666,160 $5,389,480 $6,483,700 $6,505,700 $6,267,300 $6,427,300FIRE $187,131 $229,822 $214,050 $214,050 $214,050 $214,050WEIGHTS & MEASURES $80,030 $99,105 $92,000 $92,000 $92,000 $92,000EMERGENCY OPERATIONS $189,018 $38,098 $50,000 $75,000 $75,000 $75,000TOTAL PUBLIC SAFETY $7,122,339 $5,756,505 $6,839,750 $6,886,750 $6,648,350 $6,808,350TOTAL BUDGET $532,370,209 $554,292,614 $542,494,011 $567,308,895 $561,312,997 $557,429,645
77
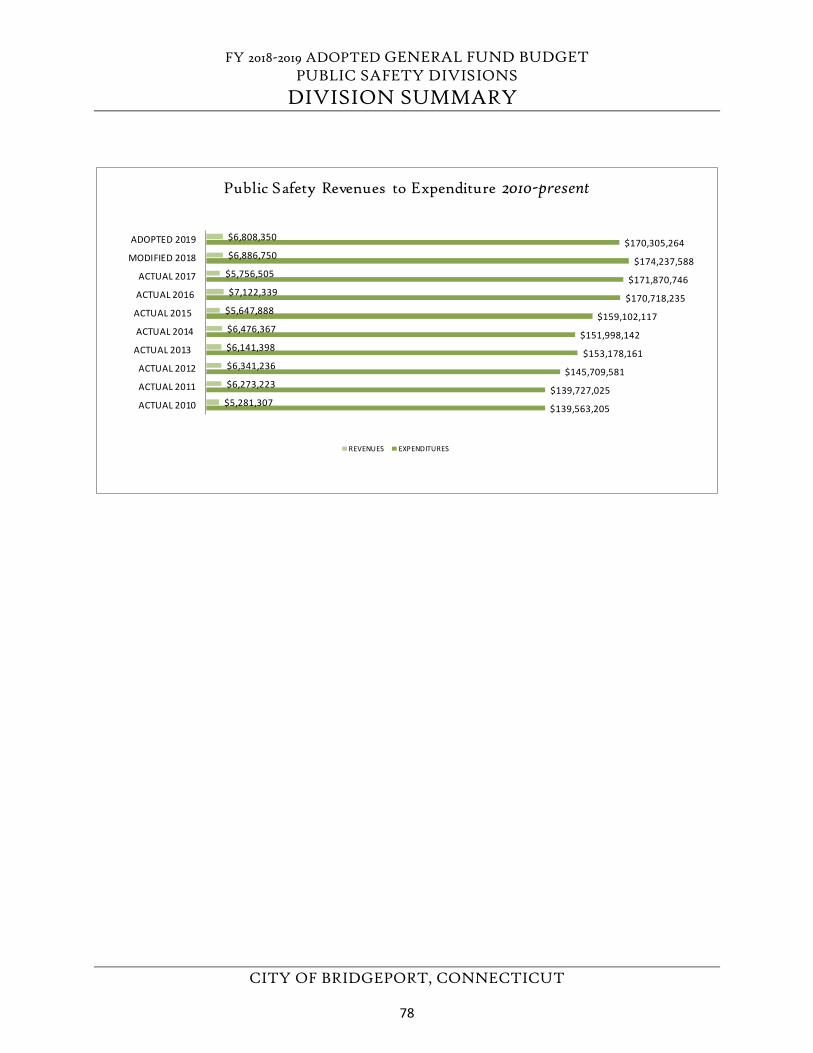
FY 2018-2019 ADOPTED GENERAL FUND BUDGET PUBLIC SAFETY DIVISIONS
DIVISION SUMMARY
CITY OF BRIDGEPORT, CONNECTICUT
$139,563,205
$139,727,025
$145,709,581
$153,178,161
$151,998,142
$159,102,117
$170,718,235
$171,870,746
$174,237,588
$170,305,264
$5,281,307
$6,273,223
$6,341,236
$6,141,398
$6,476,367
$5,647,888
$7,122,339
$5,756,505
$6,886,750
$6,808,350
ACTUAL 2010
ACTUAL 2011
ACTUAL 2012
ACTUAL 2013
ACTUAL 2014
ACTUAL 2015
ACTUAL 2016
ACTUAL 2017
MODIFIED 2018
ADOPTED 2019
Public Safety Revenues to Expenditure 2010-present
REVENUES EXPENDITURES
78
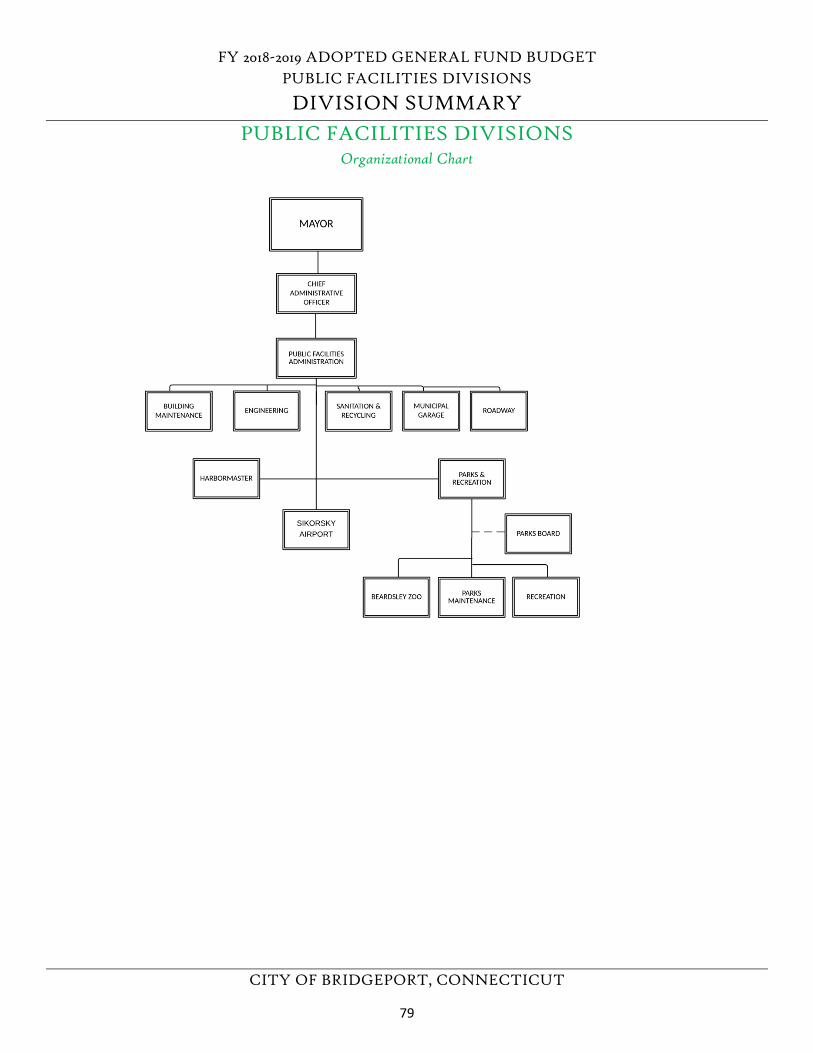
FY 2018-2019 ADOPTED GENERAL FUND BUDGET PUBLIC FACILITIES DIVISIONS
DIVISION SUMMARY
CITY OF BRIDGEPORT, CONNECTICUT
PUBLIC FACILITIES DIVISIONS Organizational Chart
79
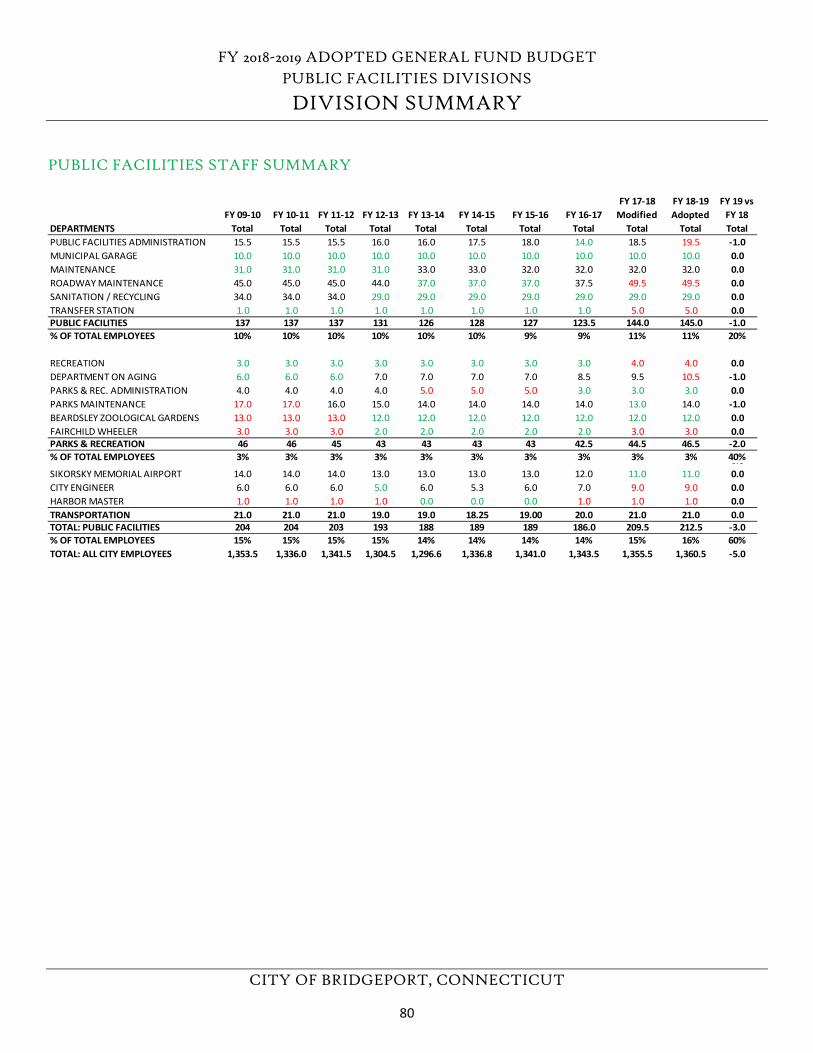
FY 2018-2019 ADOPTED GENERAL FUND BUDGET PUBLIC FACILITIES DIVISIONS
DIVISION SUMMARY
CITY OF BRIDGEPORT, CONNECTICUT
PUBLIC FACILITIES STAFF SUMMARY
FY 09-10 FY 10-11 FY 11-12 FY 12-13 FY 13-14 FY 14-15 FY 15-16 FY 16-17 FY 17-18
ModifiedFY 18-19 Adopted
FY 19 vs FY 18
DEPARTMENTS Total Total Total Total Total Total Total Total Total Total TotalPUBLIC FACILITIES ADMINISTRATION 15.5 15.5 15.5 16.0 16.0 17.5 18.0 14.0 18.5 19.5 -1.0MUNICIPAL GARAGE 10.0 10.0 10.0 10.0 10.0 10.0 10.0 10.0 10.0 10.0 0.0MAINTENANCE 31.0 31.0 31.0 31.0 33.0 33.0 32.0 32.0 32.0 32.0 0.0ROADWAY MAINTENANCE 45.0 45.0 45.0 44.0 37.0 37.0 37.0 37.5 49.5 49.5 0.0SANITATION / RECYCLING 34.0 34.0 34.0 29.0 29.0 29.0 29.0 29.0 29.0 29.0 0.0TRANSFER STATION 1.0 1.0 1.0 1.0 1.0 1.0 1.0 1.0 5.0 5.0 0.0PUBLIC FACILITIES 137 137 137 131 126 128 127 123.5 144.0 145.0 -1.0% OF TOTAL EMPLOYEES 10% 10% 10% 10% 10% 10% 9% 9% 11% 11% 20%
RECREATION 3.0 3.0 3.0 3.0 3.0 3.0 3.0 3.0 4.0 4.0 0.0DEPARTMENT ON AGING 6.0 6.0 6.0 7.0 7.0 7.0 7.0 8.5 9.5 10.5 -1.0PARKS & REC. ADMINISTRATION 4.0 4.0 4.0 4.0 5.0 5.0 5.0 3.0 3.0 3.0 0.0PARKS MAINTENANCE 17.0 17.0 16.0 15.0 14.0 14.0 14.0 14.0 13.0 14.0 -1.0BEARDSLEY ZOOLOGICAL GARDENS 13.0 13.0 13.0 12.0 12.0 12.0 12.0 12.0 12.0 12.0 0.0FAIRCHILD WHEELER 3.0 3.0 3.0 2.0 2.0 2.0 2.0 2.0 3.0 3.0 0.0PARKS & RECREATION 46 46 45 43 43 43 43 42.5 44.5 46.5 -2.0% OF TOTAL EMPLOYEES 3% 3% 3% 3% 3% 3% 3% 3% 3% 3% 40%0.0SIKORSKY MEMORIAL AIRPORT 14.0 14.0 14.0 13.0 13.0 13.0 13.0 12.0 11.0 11.0 0.0CITY ENGINEER 6.0 6.0 6.0 5.0 6.0 5.3 6.0 7.0 9.0 9.0 0.0HARBOR MASTER 1.0 1.0 1.0 1.0 0.0 0.0 0.0 1.0 1.0 1.0 0.0TRANSPORTATION 21.0 21.0 21.0 19.0 19.0 18.25 19.00 20.0 21.0 21.0 0.0TOTAL: PUBLIC FACILITIES 204 204 203 193 188 189 189 186.0 209.5 212.5 -3.0% OF TOTAL EMPLOYEES 15% 15% 15% 15% 14% 14% 14% 14% 15% 16% 60%TOTAL: ALL CITY EMPLOYEES 1,353.5 1,336.0 1,341.5 1,304.5 1,296.6 1,336.8 1,341.0 1,343.5 1,355.5 1,360.5 -5.0
80
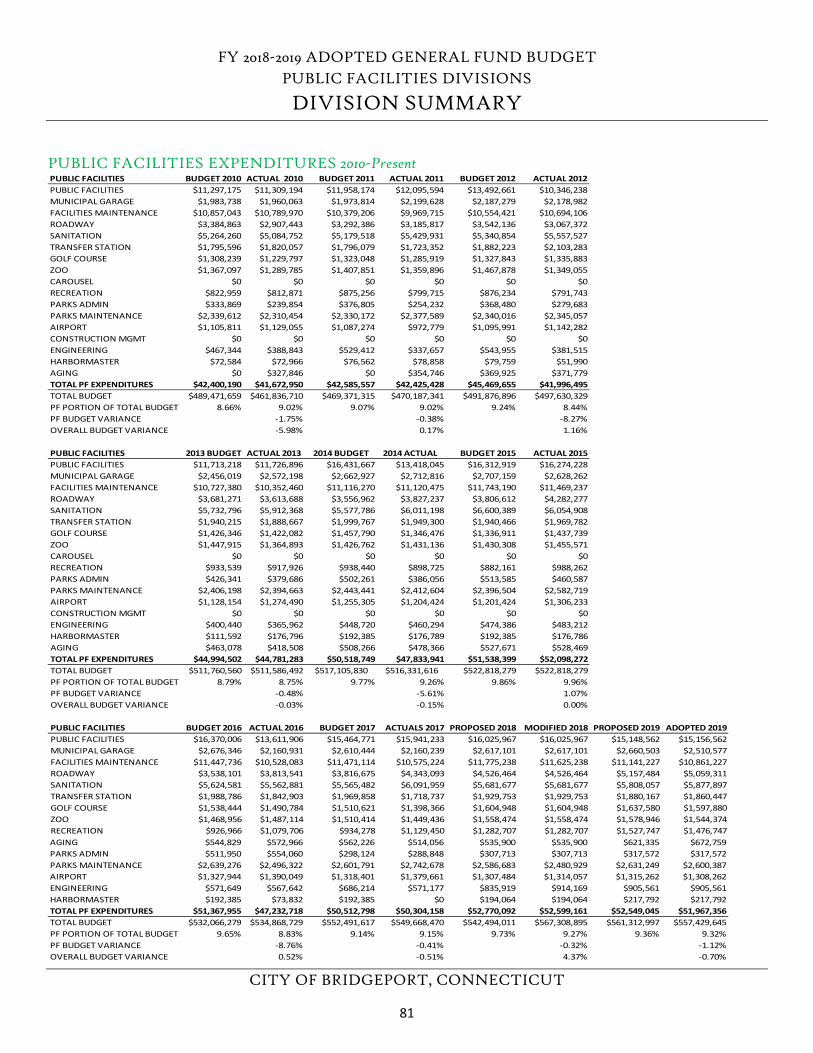
FY 2018-2019 ADOPTED GENERAL FUND BUDGET PUBLIC FACILITIES DIVISIONS
DIVISION SUMMARY
CITY OF BRIDGEPORT, CONNECTICUT
PUBLIC FACILITIES EXPENDITURES 2010-Present
PUBLIC FACILITIES BUDGET 2010 ACTUAL 2010 BUDGET 2011 ACTUAL 2011 BUDGET 2012 ACTUAL 2012PUBLIC FACILITIES $11,297,175 $11,309,194 $11,958,174 $12,095,594 $13,492,661 $10,346,238MUNICIPAL GARAGE $1,983,738 $1,960,063 $1,973,814 $2,199,628 $2,187,279 $2,178,982FACILITIES MAINTENANCE $10,857,043 $10,789,970 $10,379,206 $9,969,715 $10,554,421 $10,694,106ROADWAY $3,384,863 $2,907,443 $3,292,386 $3,185,817 $3,542,136 $3,067,372SANITATION $5,264,260 $5,084,752 $5,179,518 $5,429,931 $5,340,854 $5,557,527TRANSFER STATION $1,795,596 $1,820,057 $1,796,079 $1,723,352 $1,882,223 $2,103,283GOLF COURSE $1,308,239 $1,229,797 $1,323,048 $1,285,919 $1,327,843 $1,335,883ZOO $1,367,097 $1,289,785 $1,407,851 $1,359,896 $1,467,878 $1,349,055CAROUSEL $0 $0 $0 $0 $0 $0RECREATION $822,959 $812,871 $875,256 $799,715 $876,234 $791,743PARKS ADMIN $333,869 $239,854 $376,805 $254,232 $368,480 $279,683PARKS MAINTENANCE $2,339,612 $2,310,454 $2,330,172 $2,377,589 $2,340,016 $2,345,057AIRPORT $1,105,811 $1,129,055 $1,087,274 $972,779 $1,095,991 $1,142,282CONSTRUCTION MGMT $0 $0 $0 $0 $0 $0ENGINEERING $467,344 $388,843 $529,412 $337,657 $543,955 $381,515HARBORMASTER $72,584 $72,966 $76,562 $78,858 $79,759 $51,990AGING $0 $327,846 $0 $354,746 $369,925 $371,779TOTAL PF EXPENDITURES $42,400,190 $41,672,950 $42,585,557 $42,425,428 $45,469,655 $41,996,495TOTAL BUDGET $489,471,659 $461,836,710 $469,371,315 $470,187,341 $491,876,896 $497,630,329PF PORTION OF TOTAL BUDGET 8.66% 9.02% 9.07% 9.02% 9.24% 8.44%PF BUDGET VARIANCE -1.75% -0.38% -8.27%OVERALL BUDGET VARIANCE -5.98% 0.17% 1.16%
PUBLIC FACILITIES 2013 BUDGET ACTUAL 2013 2014 BUDGET 2014 ACTUAL BUDGET 2015 ACTUAL 2015PUBLIC FACILITIES $11,713,218 $11,726,896 $16,431,667 $13,418,045 $16,312,919 $16,274,228MUNICIPAL GARAGE $2,456,019 $2,572,198 $2,662,927 $2,712,816 $2,707,159 $2,628,262FACILITIES MAINTENANCE $10,727,380 $10,352,460 $11,116,270 $11,120,475 $11,743,190 $11,469,237ROADWAY $3,681,271 $3,613,688 $3,556,962 $3,827,237 $3,806,612 $4,282,277SANITATION $5,732,796 $5,912,368 $5,577,786 $6,011,198 $6,600,389 $6,054,908TRANSFER STATION $1,940,215 $1,888,667 $1,999,767 $1,949,300 $1,940,466 $1,969,782GOLF COURSE $1,426,346 $1,422,082 $1,457,790 $1,346,476 $1,336,911 $1,437,739ZOO $1,447,915 $1,364,893 $1,426,762 $1,431,136 $1,430,308 $1,455,571CAROUSEL $0 $0 $0 $0 $0 $0RECREATION $933,539 $917,926 $938,440 $898,725 $882,161 $988,262PARKS ADMIN $426,341 $379,686 $502,261 $386,056 $513,585 $460,587PARKS MAINTENANCE $2,406,198 $2,394,663 $2,443,441 $2,412,604 $2,396,504 $2,582,719AIRPORT $1,128,154 $1,274,490 $1,255,305 $1,204,424 $1,201,424 $1,306,233CONSTRUCTION MGMT $0 $0 $0 $0 $0 $0ENGINEERING $400,440 $365,962 $448,720 $460,294 $474,386 $483,212HARBORMASTER $111,592 $176,796 $192,385 $176,789 $192,385 $176,786AGING $463,078 $418,508 $508,266 $478,366 $527,671 $528,469TOTAL PF EXPENDITURES $44,994,502 $44,781,283 $50,518,749 $47,833,941 $51,538,399 $52,098,272TOTAL BUDGET $511,760,560 $511,586,492 $517,105,830 $516,331,616 $522,818,279 $522,818,279PF PORTION OF TOTAL BUDGET 8.79% 8.75% 9.77% 9.26% 9.86% 9.96%PF BUDGET VARIANCE -0.48% -5.61% 1.07%OVERALL BUDGET VARIANCE -0.03% -0.15% 0.00%
PUBLIC FACILITIES BUDGET 2016 ACTUAL 2016 BUDGET 2017 ACTUALS 2017 PROPOSED 2018 MODIFIED 2018 PROPOSED 2019 ADOPTED 2019PUBLIC FACILITIES $16,370,006 $13,611,906 $15,464,771 $15,941,233 $16,025,967 $16,025,967 $15,148,562 $15,156,562MUNICIPAL GARAGE $2,676,346 $2,160,931 $2,610,444 $2,160,239 $2,617,101 $2,617,101 $2,660,503 $2,510,577FACILITIES MAINTENANCE $11,447,736 $10,528,083 $11,471,114 $10,575,224 $11,775,238 $11,625,238 $11,141,227 $10,861,227ROADWAY $3,538,101 $3,813,541 $3,816,675 $4,343,093 $4,526,464 $4,526,464 $5,157,484 $5,059,311SANITATION $5,624,581 $5,562,881 $5,565,482 $6,091,959 $5,681,677 $5,681,677 $5,808,057 $5,877,897TRANSFER STATION $1,988,786 $1,842,903 $1,969,858 $1,718,737 $1,929,753 $1,929,753 $1,880,167 $1,860,447GOLF COURSE $1,538,444 $1,490,784 $1,510,621 $1,398,366 $1,604,948 $1,604,948 $1,637,580 $1,597,880ZOO $1,468,956 $1,487,114 $1,510,414 $1,449,436 $1,558,474 $1,558,474 $1,578,946 $1,544,374RECREATION $926,966 $1,079,706 $934,278 $1,129,450 $1,282,707 $1,282,707 $1,527,747 $1,476,747AGING $544,829 $572,966 $562,226 $514,056 $535,900 $535,900 $621,335 $672,759PARKS ADMIN $511,950 $554,060 $298,124 $288,848 $307,713 $307,713 $317,572 $317,572PARKS MAINTENANCE $2,639,276 $2,496,322 $2,601,791 $2,742,678 $2,586,683 $2,480,929 $2,631,249 $2,600,387AIRPORT $1,327,944 $1,390,049 $1,318,401 $1,379,661 $1,307,484 $1,314,057 $1,315,262 $1,308,262ENGINEERING $571,649 $567,642 $686,214 $571,177 $835,919 $914,169 $905,561 $905,561HARBORMASTER $192,385 $73,832 $192,385 $0 $194,064 $194,064 $217,792 $217,792TOTAL PF EXPENDITURES $51,367,955 $47,232,718 $50,512,798 $50,304,158 $52,770,092 $52,599,161 $52,549,045 $51,967,356TOTAL BUDGET $532,066,279 $534,868,729 $552,491,617 $549,668,470 $542,494,011 $567,308,895 $561,312,997 $557,429,645PF PORTION OF TOTAL BUDGET 9.65% 8.83% 9.14% 9.15% 9.73% 9.27% 9.36% 9.32%PF BUDGET VARIANCE -8.76% -0.41% -0.32% -1.12%OVERALL BUDGET VARIANCE 0.52% -0.51% 4.37% -0.70%
81
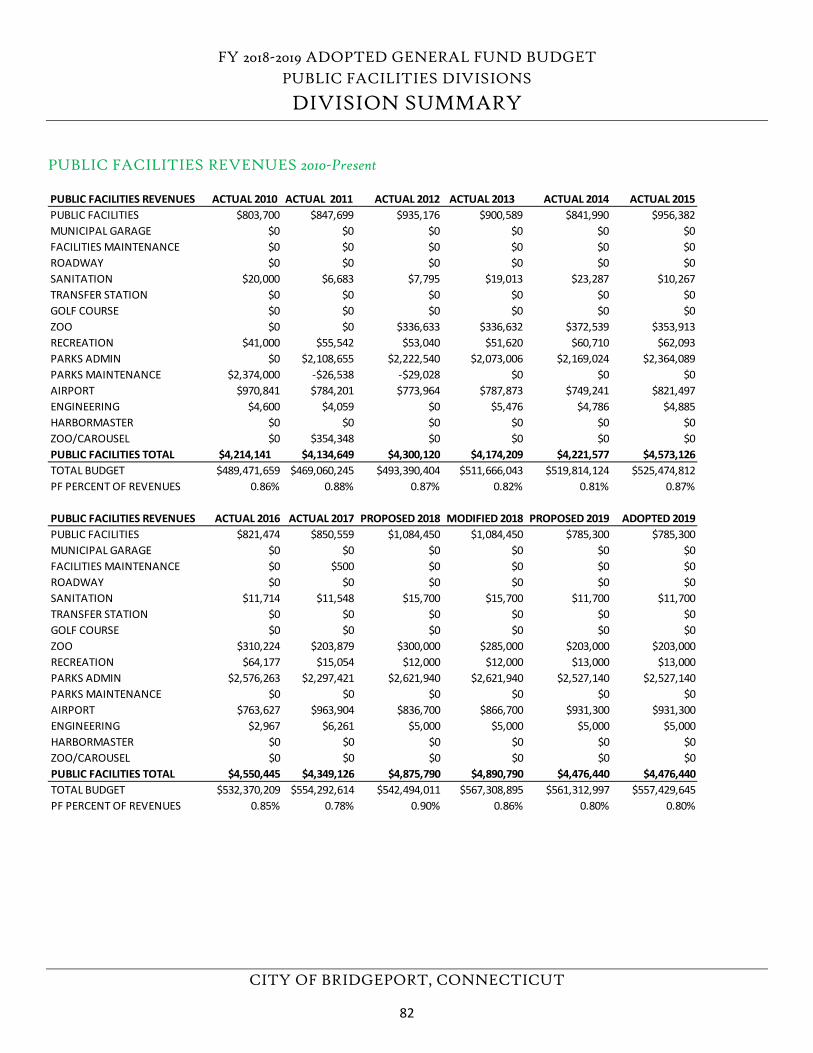
FY 2018-2019 ADOPTED GENERAL FUND BUDGET PUBLIC FACILITIES DIVISIONS
DIVISION SUMMARY
CITY OF BRIDGEPORT, CONNECTICUT
PUBLIC FACILITIES REVENUES 2010-Present
PUBLIC FACILITIES REVENUES ACTUAL 2010 ACTUAL 2011 ACTUAL 2012 ACTUAL 2013 ACTUAL 2014 ACTUAL 2015PUBLIC FACILITIES $803,700 $847,699 $935,176 $900,589 $841,990 $956,382MUNICIPAL GARAGE $0 $0 $0 $0 $0 $0FACILITIES MAINTENANCE $0 $0 $0 $0 $0 $0ROADWAY $0 $0 $0 $0 $0 $0SANITATION $20,000 $6,683 $7,795 $19,013 $23,287 $10,267TRANSFER STATION $0 $0 $0 $0 $0 $0GOLF COURSE $0 $0 $0 $0 $0 $0ZOO $0 $0 $336,633 $336,632 $372,539 $353,913RECREATION $41,000 $55,542 $53,040 $51,620 $60,710 $62,093PARKS ADMIN $0 $2,108,655 $2,222,540 $2,073,006 $2,169,024 $2,364,089PARKS MAINTENANCE $2,374,000 -$26,538 -$29,028 $0 $0 $0AIRPORT $970,841 $784,201 $773,964 $787,873 $749,241 $821,497ENGINEERING $4,600 $4,059 $0 $5,476 $4,786 $4,885HARBORMASTER $0 $0 $0 $0 $0 $0ZOO/CAROUSEL $0 $354,348 $0 $0 $0 $0PUBLIC FACILITIES TOTAL $4,214,141 $4,134,649 $4,300,120 $4,174,209 $4,221,577 $4,573,126TOTAL BUDGET $489,471,659 $469,060,245 $493,390,404 $511,666,043 $519,814,124 $525,474,812PF PERCENT OF REVENUES 0.86% 0.88% 0.87% 0.82% 0.81% 0.87%
PUBLIC FACILITIES REVENUES ACTUAL 2016 ACTUAL 2017 PROPOSED 2018 MODIFIED 2018 PROPOSED 2019 ADOPTED 2019PUBLIC FACILITIES $821,474 $850,559 $1,084,450 $1,084,450 $785,300 $785,300MUNICIPAL GARAGE $0 $0 $0 $0 $0 $0FACILITIES MAINTENANCE $0 $500 $0 $0 $0 $0ROADWAY $0 $0 $0 $0 $0 $0SANITATION $11,714 $11,548 $15,700 $15,700 $11,700 $11,700TRANSFER STATION $0 $0 $0 $0 $0 $0GOLF COURSE $0 $0 $0 $0 $0 $0ZOO $310,224 $203,879 $300,000 $285,000 $203,000 $203,000RECREATION $64,177 $15,054 $12,000 $12,000 $13,000 $13,000PARKS ADMIN $2,576,263 $2,297,421 $2,621,940 $2,621,940 $2,527,140 $2,527,140PARKS MAINTENANCE $0 $0 $0 $0 $0 $0AIRPORT $763,627 $963,904 $836,700 $866,700 $931,300 $931,300ENGINEERING $2,967 $6,261 $5,000 $5,000 $5,000 $5,000HARBORMASTER $0 $0 $0 $0 $0 $0ZOO/CAROUSEL $0 $0 $0 $0 $0 $0PUBLIC FACILITIES TOTAL $4,550,445 $4,349,126 $4,875,790 $4,890,790 $4,476,440 $4,476,440TOTAL BUDGET $532,370,209 $554,292,614 $542,494,011 $567,308,895 $561,312,997 $557,429,645PF PERCENT OF REVENUES 0.85% 0.78% 0.90% 0.86% 0.80% 0.80%
82
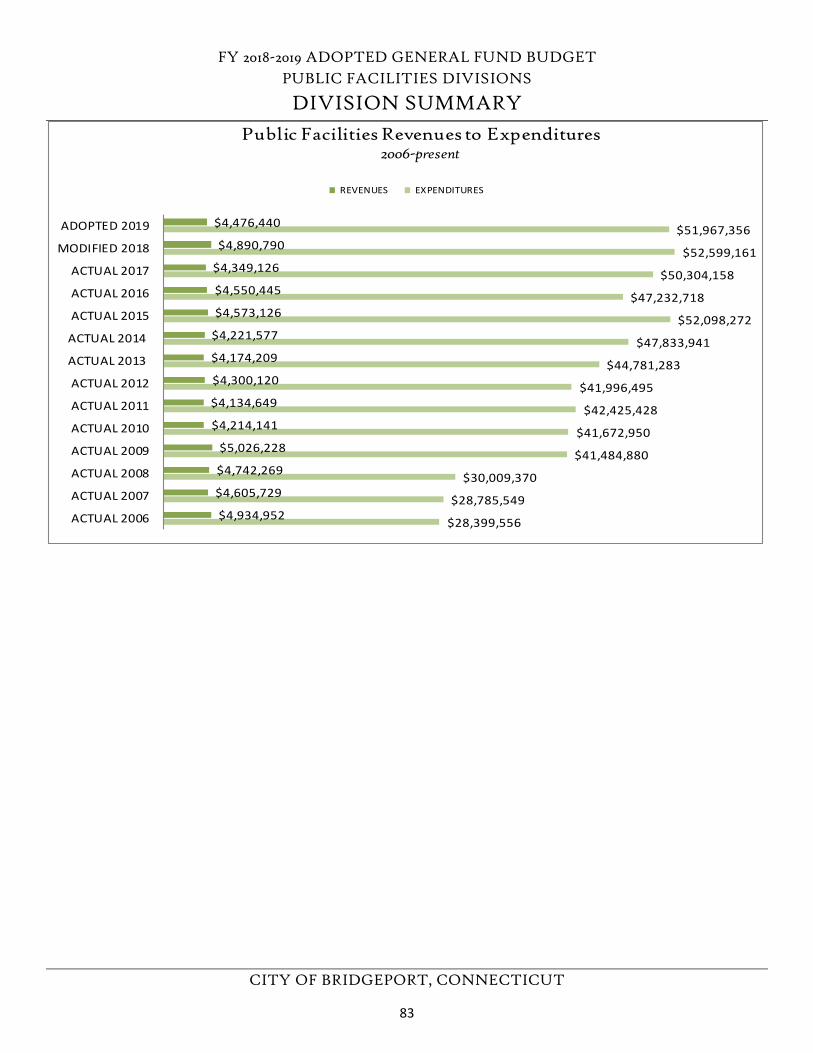
FY 2018-2019 ADOPTED GENERAL FUND BUDGET PUBLIC FACILITIES DIVISIONS
DIVISION SUMMARY
CITY OF BRIDGEPORT, CONNECTICUT
$28,399,556
$28,785,549
$30,009,370
$41,484,880
$41,672,950
$42,425,428
$41,996,495
$44,781,283
$47,833,941
$52,098,272
$47,232,718
$50,304,158
$52,599,161
$51,967,356
$4,934,952
$4,605,729
$4,742,269
$5,026,228
$4,214,141
$4,134,649
$4,300,120
$4,174,209
$4,221,577
$4,573,126
$4,550,445
$4,349,126
$4,890,790
$4,476,440
ACTUAL 2006
ACTUAL 2007
ACTUAL 2008
ACTUAL 2009
ACTUAL 2010
ACTUAL 2011
ACTUAL 2012
ACTUAL 2013
ACTUAL 2014
ACTUAL 2015
ACTUAL 2016
ACTUAL 2017
MODIFIED 2018
ADOPTED 2019
Public Facilities Revenues to Expenditures 2006-present
REVENUES EXPENDITURES
83
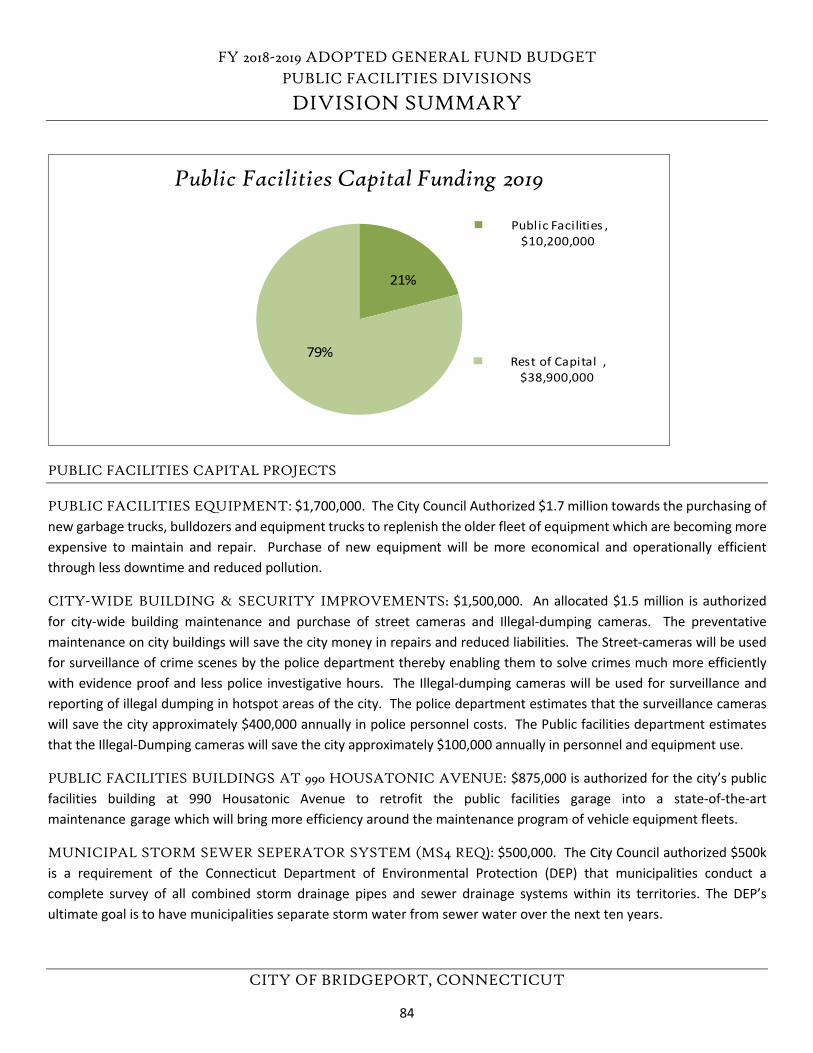
FY 2018-2019 ADOPTED GENERAL FUND BUDGET PUBLIC FACILITIES DIVISIONS
DIVISION SUMMARY
CITY OF BRIDGEPORT, CONNECTICUT
PUBLIC FACILITIES CAPITAL PROJECTS
PUBLIC FACILITIES EQUIPMENT: $1,700,000. The City Council Authorized $1.7 million towards the purchasing of new garbage trucks, bulldozers and equipment trucks to replenish the older fleet of equipment which are becoming more expensive to maintain and repair. Purchase of new equipment will be more economical and operationally efficient through less downtime and reduced pollution.
CITY-WIDE BUILDING & SECURITY IMPROVEMENTS: $1,500,000. An allocated $1.5 million is authorized for city-wide building maintenance and purchase of street cameras and Illegal-dumping cameras. The preventative maintenance on city buildings will save the city money in repairs and reduced liabilities. The Street-cameras will be used for surveillance of crime scenes by the police department thereby enabling them to solve crimes much more efficiently with evidence proof and less police investigative hours. The Illegal-dumping cameras will be used for surveillance and reporting of illegal dumping in hotspot areas of the city. The police department estimates that the surveillance cameras will save the city approximately $400,000 annually in police personnel costs. The Public facilities department estimates that the Illegal-Dumping cameras will save the city approximately $100,000 annually in personnel and equipment use.
PUBLIC FACILITIES BUILDINGS AT 990 HOUSATONIC AVENUE: $875,000 is authorized for the city’s public facilities building at 990 Housatonic Avenue to retrofit the public facilities garage into a state-of-the-art maintenance garage which will bring more efficiency around the maintenance program of vehicle equipment fleets.
MUNICIPAL STORM SEWER SEPERATOR SYSTEM (MS4 REQ): $500,000. The City Council authorized $500k is a requirement of the Connecticut Department of Environmental Protection (DEP) that municipalities conduct a complete survey of all combined storm drainage pipes and sewer drainage systems within its territories. The DEP’s ultimate goal is to have municipalities separate storm water from sewer water over the next ten years.
Public Facilities , $10,200,000
Rest of Capital , $38,900,000
Public Facilities Capital Funding 2019
79%
21%
84
FY 2018-2019 ADOPTED GENERAL FUND BUDGET PUBLIC FACILITIES DIVISIONS
DIVISION SUMMARY
CITY OF BRIDGEPORT, CONNECTICUT
NEW EAST SIDE SENIOR CENTER-OLD ENGINE 10/PUTNAM STREET: $500,000. The $500k is allocated for converting and retrofitting the old Engine 10 firehouse into a state-of-the-art recreational senior center which is intended for improved social conditions and well-living of seniors in the City of Bridgeport.
PARKS MAINTENANCE EQUIP (INCLUDE GOLF COURSE): $200,000. The City of Bridgeport owns and operates the Fairchild Wheeler Golf Course. The $200k capital allocation is to purchase new electric golf carts which are environmentally friendly and do not produce air pollution. Some of the funds will be used to purchase new lawn mowing equipment. The new lawn mowing equipment will have less maintenance costs, less downtime and less repairs. The ultimate goal is to improve overall golf course playing experience which will also increase revenue due to increased attendance.
VARIOUS PARK IMPROVEMENT PROJECTS: $450,000. The City of Bridgeport has a total 44 parks within its territory hence its name “The Park City”. The City Council has allocated $450,000 for the improvement of these parks located in different neighborhoods. The City Council’s ultimate intent is to make most of these parks family friendly for leisure activities, exercise, picnics and other activities for the residents of Bridgeport.
BLOOM BULKHEAD: $2,500,000. The City Council allocated $2.5 million for construction of a water-barrier piling in the Bloom shellfish fishing area located in the fishing arena of the City of Bridgeport. The reinforcement of the barrier piling/bulkhead will eliminate the city’s potential liability as well as bring fishing economic value in Bridgeport. The construction of the Bloom bulkhead will expand and sustain the fishing industries in the winters of Bridgeport as well as retention of restaurants in the Bridgeport area.
LANDFILL CLOSURE-STEWARDSHIP: $1,000,000. The allocated amount of $1 million dollars is to permanently close and cap an old landfill site located at Seaside Park Bridgeport due to environmental reasons as per state DEP requirements. The permanent closure/cap will make land usable for other developmental purposes by investors, i.e. mass installation of solar panels on site for energy generation.
FERRY TERMINAL RAMP/LOADING DOCK (20% CITY MATCH): $250,000. The Ferry Terminal Ramp and Loading Dock is located downtown within the commercial fishing area of Bridgeport. The city is required to provide a twenty percent (20%) match towards the rebuilding of the Ferry Dock Terminal which will result in more commercial boats using this dock. These increased activities will be good for overall Bridgeport commercial fishing.
CITY-WIDE SIGNAGE: $125,000. The allocated amounts of $125k by the City Council is for the replacement of worn-out directory signs within the City of Bridgeport. The intention is to provide ease in locating streets and directories within the Bridgeport metropolitan area.
PERRY MEMORIAL ARCH: $250,000. This historic gate is the leading entrance to the Bridgeport Seaside Park. The allocated dollars are for the historical restoration of this arch thereby restoring and preserving the original beauty of the gate and part of Bridgeport’s rich history.
85
FY 2018-2019 ADOPTED GENERAL FUND BUDGET PUBLIC FACILITIES DIVISIONS
DIVISION SUMMARY
CITY OF BRIDGEPORT, CONNECTICUT
TENNIS COURTS IMPROVEMENT: $100,000. The amount allocated of $100k is geared towards the improvement of city owned tennis courts within the South and East end of Bridgeport. The improvement is intended to encourage and promote residents exercising and engaging in more productive social and sporting activities which will ultimately increase Bridgeport residency, and provide economic boost to the city.
PARK RESTROOMS: $100,000. The allocated amount of $100k is intended for the remodeling of the five restrooms at Seaside Park of Bridgeport into more modern and efficient bathrooms for residence use.
GOLF COURSE IMPROVEMENTS: $150,000. The $150k is allocated for the improvement of irrigation and lawn maintenance for a better golf course and golfing experience at the Fairchild Wheeler Golf Course. The anticipation is to have improved revenue through increased attendance and more golf round plays.
86
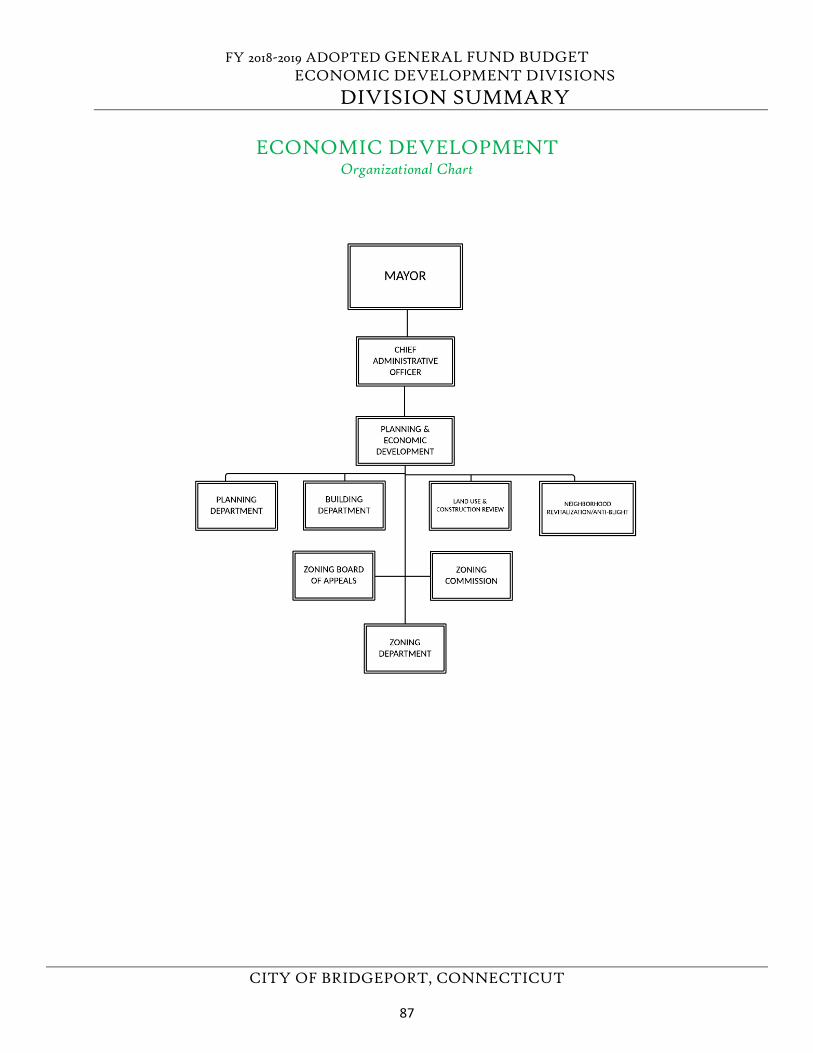
FY 2018-2019 ADOPTED GENERAL FUND BUDGET ECONOMIC DEVELOPMENT DIVISIONS
DIVISION SUMMARY
CITY OF BRIDGEPORT, CONNECTICUT
ECONOMIC DEVELOPMENT
Organizational Chart
87
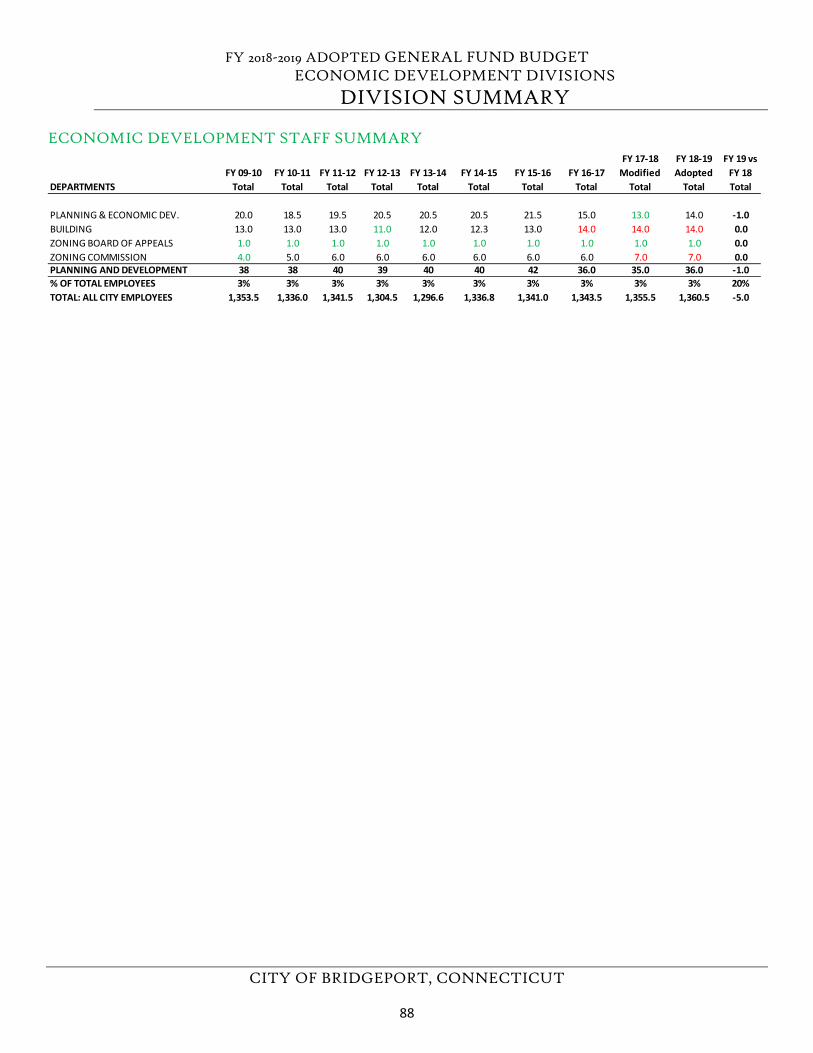
FY 2018-2019 ADOPTED GENERAL FUND BUDGET ECONOMIC DEVELOPMENT DIVISIONS
DIVISION SUMMARY
CITY OF BRIDGEPORT, CONNECTICUT
ECONOMIC DEVELOPMENT STAFF SUMMARY
FY 09-10 FY 10-11 FY 11-12 FY 12-13 FY 13-14 FY 14-15 FY 15-16 FY 16-17 FY 17-18
ModifiedFY 18-19 Adopted
FY 19 vs FY 18
DEPARTMENTS Total Total Total Total Total Total Total Total Total Total Total
PLANNING & ECONOMIC DEV. 20.0 18.5 19.5 20.5 20.5 20.5 21.5 15.0 13.0 14.0 -1.0BUILDING 13.0 13.0 13.0 11.0 12.0 12.3 13.0 14.0 14.0 14.0 0.0ZONING BOARD OF APPEALS 1.0 1.0 1.0 1.0 1.0 1.0 1.0 1.0 1.0 1.0 0.0ZONING COMMISSION 4.0 5.0 6.0 6.0 6.0 6.0 6.0 6.0 7.0 7.0 0.0PLANNING AND DEVELOPMENT 38 38 40 39 40 40 42 36.0 35.0 36.0 -1.0% OF TOTAL EMPLOYEES 3% 3% 3% 3% 3% 3% 3% 3% 3% 3% 20%TOTAL: ALL CITY EMPLOYEES 1,353.5 1,336.0 1,341.5 1,304.5 1,296.6 1,336.8 1,341.0 1,343.5 1,355.5 1,360.5 -5.0
88
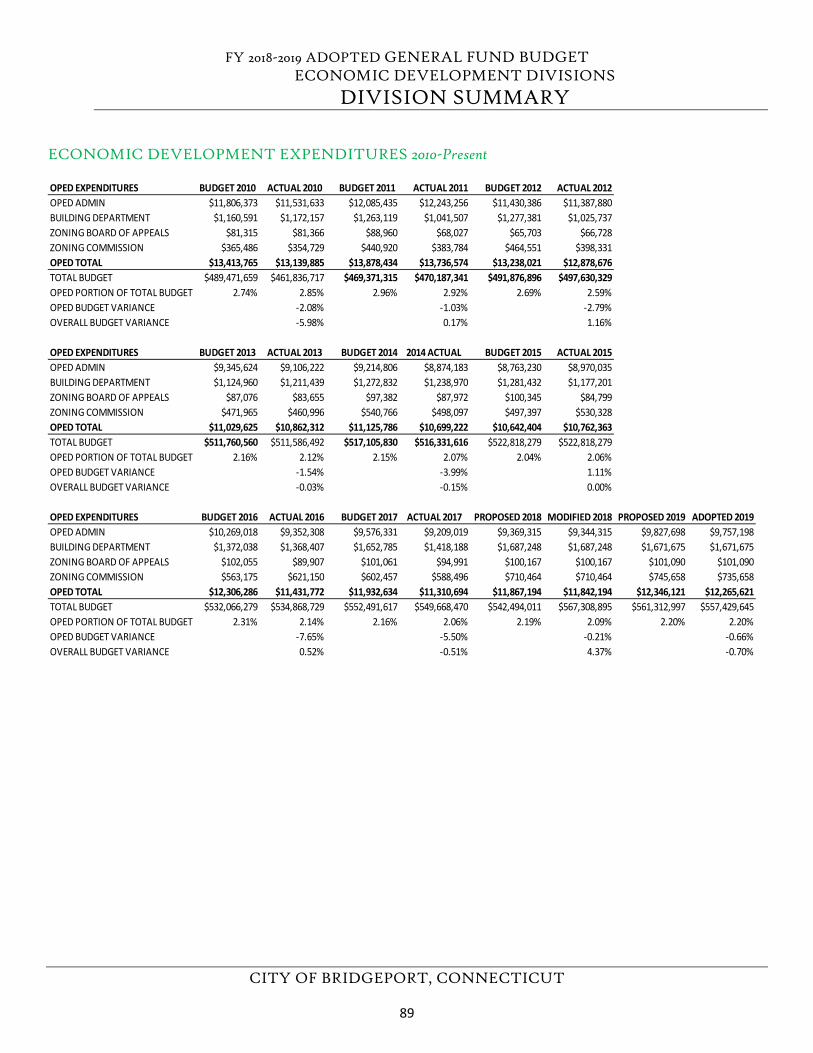
FY 2018-2019 ADOPTED GENERAL FUND BUDGET ECONOMIC DEVELOPMENT DIVISIONS
DIVISION SUMMARY
CITY OF BRIDGEPORT, CONNECTICUT
ECONOMIC DEVELOPMENT EXPENDITURES 2010-Present
OPED EXPENDITURES BUDGET 2010 ACTUAL 2010 BUDGET 2011 ACTUAL 2011 BUDGET 2012 ACTUAL 2012OPED ADMIN $11,806,373 $11,531,633 $12,085,435 $12,243,256 $11,430,386 $11,387,880BUILDING DEPARTMENT $1,160,591 $1,172,157 $1,263,119 $1,041,507 $1,277,381 $1,025,737ZONING BOARD OF APPEALS $81,315 $81,366 $88,960 $68,027 $65,703 $66,728ZONING COMMISSION $365,486 $354,729 $440,920 $383,784 $464,551 $398,331OPED TOTAL $13,413,765 $13,139,885 $13,878,434 $13,736,574 $13,238,021 $12,878,676TOTAL BUDGET $489,471,659 $461,836,717 $469,371,315 $470,187,341 $491,876,896 $497,630,329OPED PORTION OF TOTAL BUDGET 2.74% 2.85% 2.96% 2.92% 2.69% 2.59%OPED BUDGET VARIANCE -2.08% -1.03% -2.79%OVERALL BUDGET VARIANCE -5.98% 0.17% 1.16%
OPED EXPENDITURES BUDGET 2013 ACTUAL 2013 BUDGET 2014 2014 ACTUAL BUDGET 2015 ACTUAL 2015OPED ADMIN $9,345,624 $9,106,222 $9,214,806 $8,874,183 $8,763,230 $8,970,035BUILDING DEPARTMENT $1,124,960 $1,211,439 $1,272,832 $1,238,970 $1,281,432 $1,177,201ZONING BOARD OF APPEALS $87,076 $83,655 $97,382 $87,972 $100,345 $84,799ZONING COMMISSION $471,965 $460,996 $540,766 $498,097 $497,397 $530,328OPED TOTAL $11,029,625 $10,862,312 $11,125,786 $10,699,222 $10,642,404 $10,762,363TOTAL BUDGET $511,760,560 $511,586,492 $517,105,830 $516,331,616 $522,818,279 $522,818,279OPED PORTION OF TOTAL BUDGET 2.16% 2.12% 2.15% 2.07% 2.04% 2.06%OPED BUDGET VARIANCE -1.54% -3.99% 1.11%OVERALL BUDGET VARIANCE -0.03% -0.15% 0.00%
OPED EXPENDITURES BUDGET 2016 ACTUAL 2016 BUDGET 2017 ACTUAL 2017 PROPOSED 2018 MODIFIED 2018 PROPOSED 2019 ADOPTED 2019OPED ADMIN $10,269,018 $9,352,308 $9,576,331 $9,209,019 $9,369,315 $9,344,315 $9,827,698 $9,757,198BUILDING DEPARTMENT $1,372,038 $1,368,407 $1,652,785 $1,418,188 $1,687,248 $1,687,248 $1,671,675 $1,671,675ZONING BOARD OF APPEALS $102,055 $89,907 $101,061 $94,991 $100,167 $100,167 $101,090 $101,090ZONING COMMISSION $563,175 $621,150 $602,457 $588,496 $710,464 $710,464 $745,658 $735,658OPED TOTAL $12,306,286 $11,431,772 $11,932,634 $11,310,694 $11,867,194 $11,842,194 $12,346,121 $12,265,621TOTAL BUDGET $532,066,279 $534,868,729 $552,491,617 $549,668,470 $542,494,011 $567,308,895 $561,312,997 $557,429,645OPED PORTION OF TOTAL BUDGET 2.31% 2.14% 2.16% 2.06% 2.19% 2.09% 2.20% 2.20%OPED BUDGET VARIANCE -7.65% -5.50% -0.21% -0.66%OVERALL BUDGET VARIANCE 0.52% -0.51% 4.37% -0.70%
89
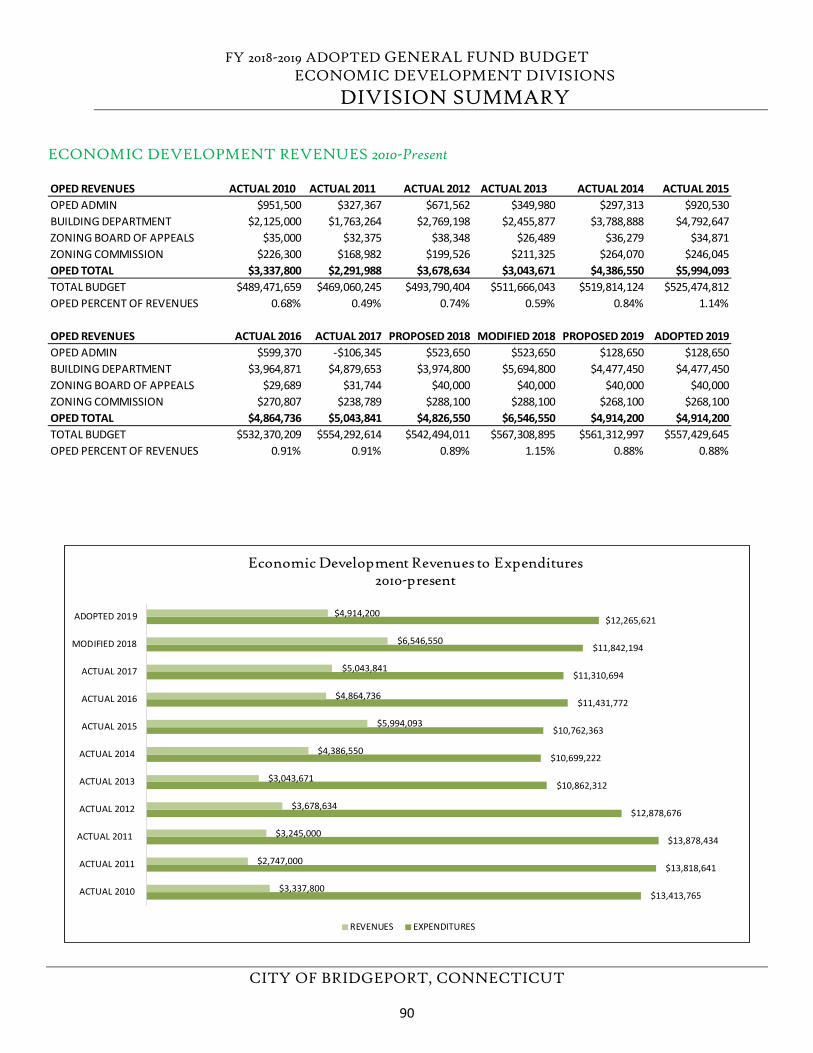
FY 2018-2019 ADOPTED GENERAL FUND BUDGET ECONOMIC DEVELOPMENT DIVISIONS
DIVISION SUMMARY
CITY OF BRIDGEPORT, CONNECTICUT
ECONOMIC DEVELOPMENT REVENUES 2010-Present
OPED REVENUES ACTUAL 2010 ACTUAL 2011 ACTUAL 2012 ACTUAL 2013 ACTUAL 2014 ACTUAL 2015OPED ADMIN $951,500 $327,367 $671,562 $349,980 $297,313 $920,530BUILDING DEPARTMENT $2,125,000 $1,763,264 $2,769,198 $2,455,877 $3,788,888 $4,792,647ZONING BOARD OF APPEALS $35,000 $32,375 $38,348 $26,489 $36,279 $34,871ZONING COMMISSION $226,300 $168,982 $199,526 $211,325 $264,070 $246,045OPED TOTAL $3,337,800 $2,291,988 $3,678,634 $3,043,671 $4,386,550 $5,994,093TOTAL BUDGET $489,471,659 $469,060,245 $493,790,404 $511,666,043 $519,814,124 $525,474,812OPED PERCENT OF REVENUES 0.68% 0.49% 0.74% 0.59% 0.84% 1.14%
OPED REVENUES ACTUAL 2016 ACTUAL 2017 PROPOSED 2018 MODIFIED 2018 PROPOSED 2019 ADOPTED 2019OPED ADMIN $599,370 -$106,345 $523,650 $523,650 $128,650 $128,650BUILDING DEPARTMENT $3,964,871 $4,879,653 $3,974,800 $5,694,800 $4,477,450 $4,477,450ZONING BOARD OF APPEALS $29,689 $31,744 $40,000 $40,000 $40,000 $40,000ZONING COMMISSION $270,807 $238,789 $288,100 $288,100 $268,100 $268,100OPED TOTAL $4,864,736 $5,043,841 $4,826,550 $6,546,550 $4,914,200 $4,914,200TOTAL BUDGET $532,370,209 $554,292,614 $542,494,011 $567,308,895 $561,312,997 $557,429,645OPED PERCENT OF REVENUES 0.91% 0.91% 0.89% 1.15% 0.88% 0.88%
$13,413,765
$13,818,641
$13,878,434
$12,878,676
$10,862,312
$10,699,222
$10,762,363
$11,431,772
$11,310,694
$11,842,194
$12,265,621
$3,337,800
$2,747,000
$3,245,000
$3,678,634
$3,043,671
$4,386,550
$5,994,093
$4,864,736
$5,043,841
$6,546,550
$4,914,200
ACTUAL 2010
ACTUAL 2011
ACTUAL 2011
ACTUAL 2012
ACTUAL 2013
ACTUAL 2014
ACTUAL 2015
ACTUAL 2016
ACTUAL 2017
MODIFIED 2018
ADOPTED 2019
Economic Development Revenues to Expenditures 2010-present
REVENUES EXPENDITURES
90
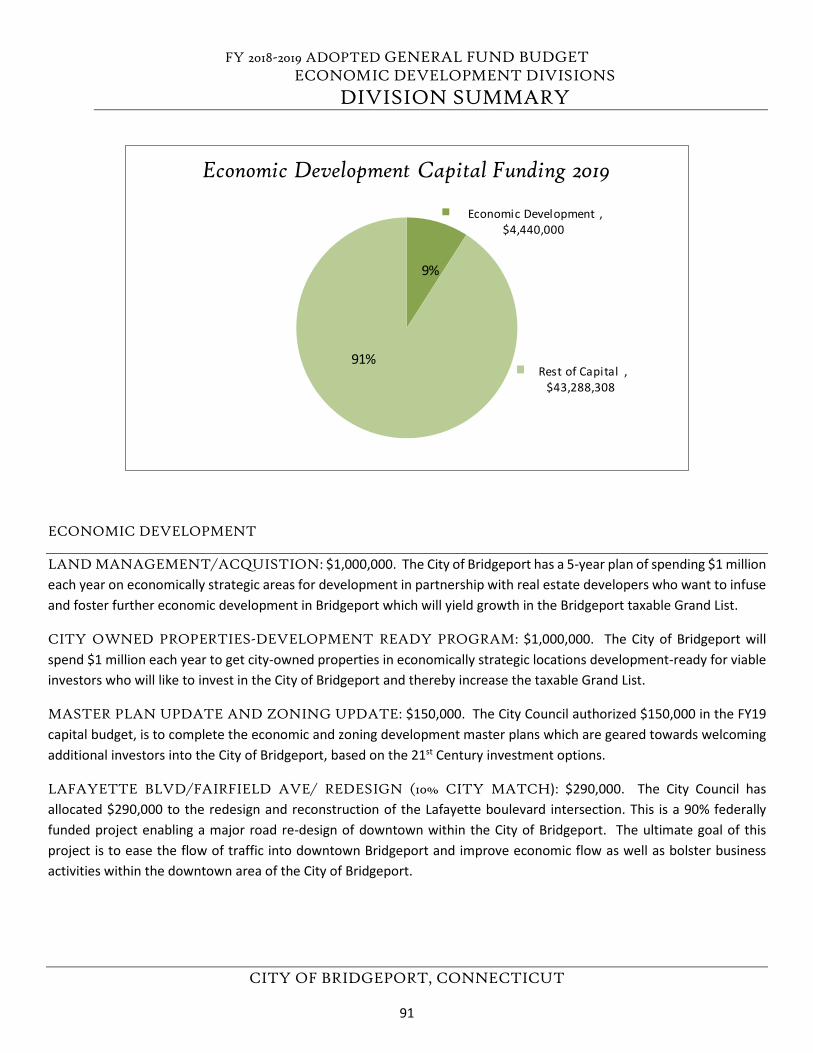
FY 2018-2019 ADOPTED GENERAL FUND BUDGET ECONOMIC DEVELOPMENT DIVISIONS
DIVISION SUMMARY
CITY OF BRIDGEPORT, CONNECTICUT
ECONOMIC DEVELOPMENT
LAND MANAGEMENT/ACQUISTION: $1,000,000. The City of Bridgeport has a 5-year plan of spending $1 million each year on economically strategic areas for development in partnership with real estate developers who want to infuse and foster further economic development in Bridgeport which will yield growth in the Bridgeport taxable Grand List.
CITY OWNED PROPERTIES-DEVELOPMENT READY PROGRAM: $1,000,000. The City of Bridgeport will spend $1 million each year to get city-owned properties in economically strategic locations development-ready for viable investors who will like to invest in the City of Bridgeport and thereby increase the taxable Grand List.
MASTER PLAN UPDATE AND ZONING UPDATE: $150,000. The City Council authorized $150,000 in the FY19 capital budget, is to complete the economic and zoning development master plans which are geared towards welcoming additional investors into the City of Bridgeport, based on the 21st Century investment options.
LAFAYETTE BLVD/FAIRFIELD AVE/ REDESIGN (10% CITY MATCH): $290,000. The City Council has allocated $290,000 to the redesign and reconstruction of the Lafayette boulevard intersection. This is a 90% federally funded project enabling a major road re-design of downtown within the City of Bridgeport. The ultimate goal of this project is to ease the flow of traffic into downtown Bridgeport and improve economic flow as well as bolster business activities within the downtown area of the City of Bridgeport.
Economic Development , $4,440,000
Rest of Capital , $43,288,308
Economic Development Capital Funding 2019
91%
9%
91
FY 2018-2019 ADOPTED GENERAL FUND BUDGET ECONOMIC DEVELOPMENT DIVISIONS
DIVISION SUMMARY
CITY OF BRIDGEPORT, CONNECTICUT
GATEWAY TO SOUTH END/CITYWIDE STRATEGIC ACQUISITION: $1,000,000. An authorized amount of $1 million each year for the next 5 years by the City Council is aimed at economic development and business partnerships with investors in the south-end area of Bridgeport and is ultimately geared towards attracting business activities thereby increasing economic development and taxable Grand List growth within the south-end area of Bridgeport.
BLIGHT /DEMOLITION CLEANUP/PROPERTY MANAGEMENT: $1,000,000. The Blight Demolition capital allocation is for cleanup of large abandoned non-revenue generating land areas in partnership with major development companies from various industries with the goal of achieving increased employment, real estate building, commercial and manufacturing companies amongst targeted areas within Bridgeport. The ultimate goal is to sustain and increase the taxable Grand List base within the City of Bridgeport.
92
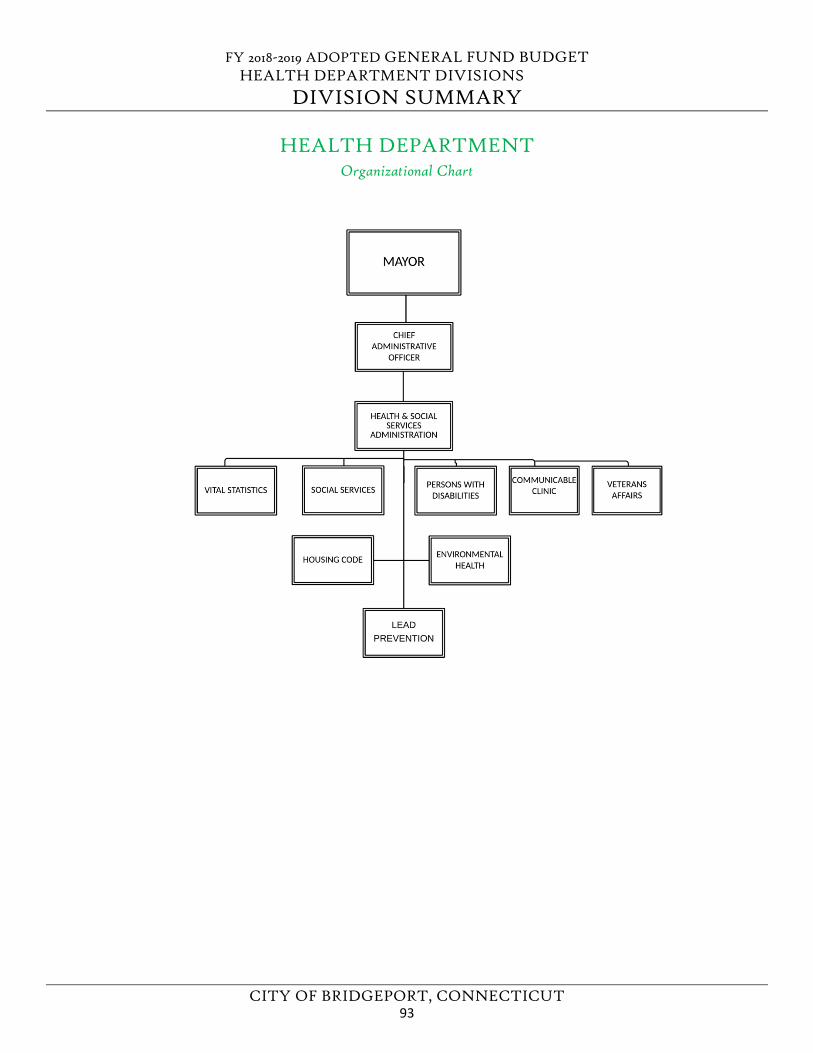
FY 2018-2019 ADOPTED GENERAL FUND BUDGET HEALTH DEPARTMENT DIVISIONS
DIVISION SUMMARY
CITY OF BRIDGEPORT, CONNECTICUT
HEALTH DEPARTMENT Organizational Chart
93
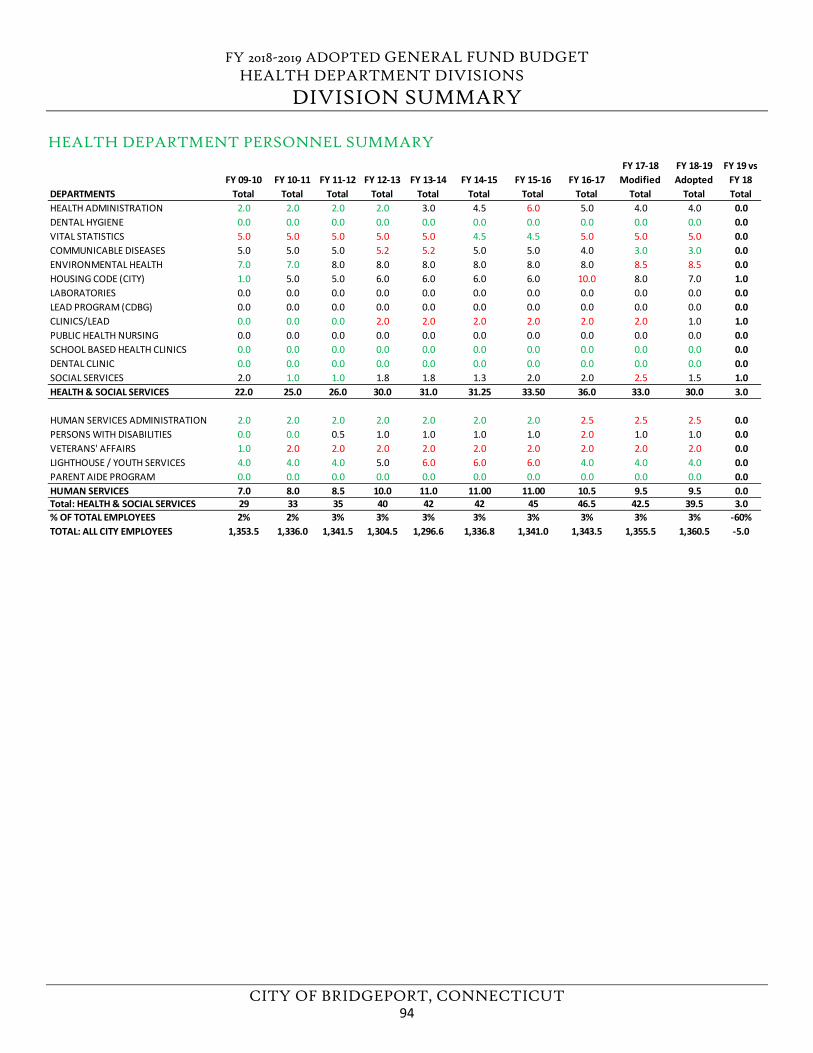
FY 2018-2019 ADOPTED GENERAL FUND BUDGET HEALTH DEPARTMENT DIVISIONS
DIVISION SUMMARY
CITY OF BRIDGEPORT, CONNECTICUT
HEALTH DEPARTMENT PERSONNEL SUMMARY
FY 09-10 FY 10-11 FY 11-12 FY 12-13 FY 13-14 FY 14-15 FY 15-16 FY 16-17 FY 17-18
ModifiedFY 18-19 Adopted
FY 19 vs FY 18
DEPARTMENTS Total Total Total Total Total Total Total Total Total Total TotalHEALTH ADMINISTRATION 2.0 2.0 2.0 2.0 3.0 4.5 6.0 5.0 4.0 4.0 0.0DENTAL HYGIENE 0.0 0.0 0.0 0.0 0.0 0.0 0.0 0.0 0.0 0.0 0.0VITAL STATISTICS 5.0 5.0 5.0 5.0 5.0 4.5 4.5 5.0 5.0 5.0 0.0COMMUNICABLE DISEASES 5.0 5.0 5.0 5.2 5.2 5.0 5.0 4.0 3.0 3.0 0.0ENVIRONMENTAL HEALTH 7.0 7.0 8.0 8.0 8.0 8.0 8.0 8.0 8.5 8.5 0.0HOUSING CODE (CITY) 1.0 5.0 5.0 6.0 6.0 6.0 6.0 10.0 8.0 7.0 1.0LABORATORIES 0.0 0.0 0.0 0.0 0.0 0.0 0.0 0.0 0.0 0.0 0.0LEAD PROGRAM (CDBG) 0.0 0.0 0.0 0.0 0.0 0.0 0.0 0.0 0.0 0.0 0.0CLINICS/LEAD 0.0 0.0 0.0 2.0 2.0 2.0 2.0 2.0 2.0 1.0 1.0PUBLIC HEALTH NURSING 0.0 0.0 0.0 0.0 0.0 0.0 0.0 0.0 0.0 0.0 0.0SCHOOL BASED HEALTH CLINICS 0.0 0.0 0.0 0.0 0.0 0.0 0.0 0.0 0.0 0.0 0.0DENTAL CLINIC 0.0 0.0 0.0 0.0 0.0 0.0 0.0 0.0 0.0 0.0 0.0SOCIAL SERVICES 2.0 1.0 1.0 1.8 1.8 1.3 2.0 2.0 2.5 1.5 1.0HEALTH & SOCIAL SERVICES 22.0 25.0 26.0 30.0 31.0 31.25 33.50 36.0 33.0 30.0 3.0
HUMAN SERVICES ADMINISTRATION 2.0 2.0 2.0 2.0 2.0 2.0 2.0 2.5 2.5 2.5 0.0PERSONS WITH DISABILITIES 0.0 0.0 0.5 1.0 1.0 1.0 1.0 2.0 1.0 1.0 0.0VETERANS' AFFAIRS 1.0 2.0 2.0 2.0 2.0 2.0 2.0 2.0 2.0 2.0 0.0LIGHTHOUSE / YOUTH SERVICES 4.0 4.0 4.0 5.0 6.0 6.0 6.0 4.0 4.0 4.0 0.0PARENT AIDE PROGRAM 0.0 0.0 0.0 0.0 0.0 0.0 0.0 0.0 0.0 0.0 0.0HUMAN SERVICES 7.0 8.0 8.5 10.0 11.0 11.00 11.00 10.5 9.5 9.5 0.0Total: HEALTH & SOCIAL SERVICES 29 33 35 40 42 42 45 46.5 42.5 39.5 3.0% OF TOTAL EMPLOYEES 2% 2% 3% 3% 3% 3% 3% 3% 3% 3% -60%TOTAL: ALL CITY EMPLOYEES 1,353.5 1,336.0 1,341.5 1,304.5 1,296.6 1,336.8 1,341.0 1,343.5 1,355.5 1,360.5 -5.0
94
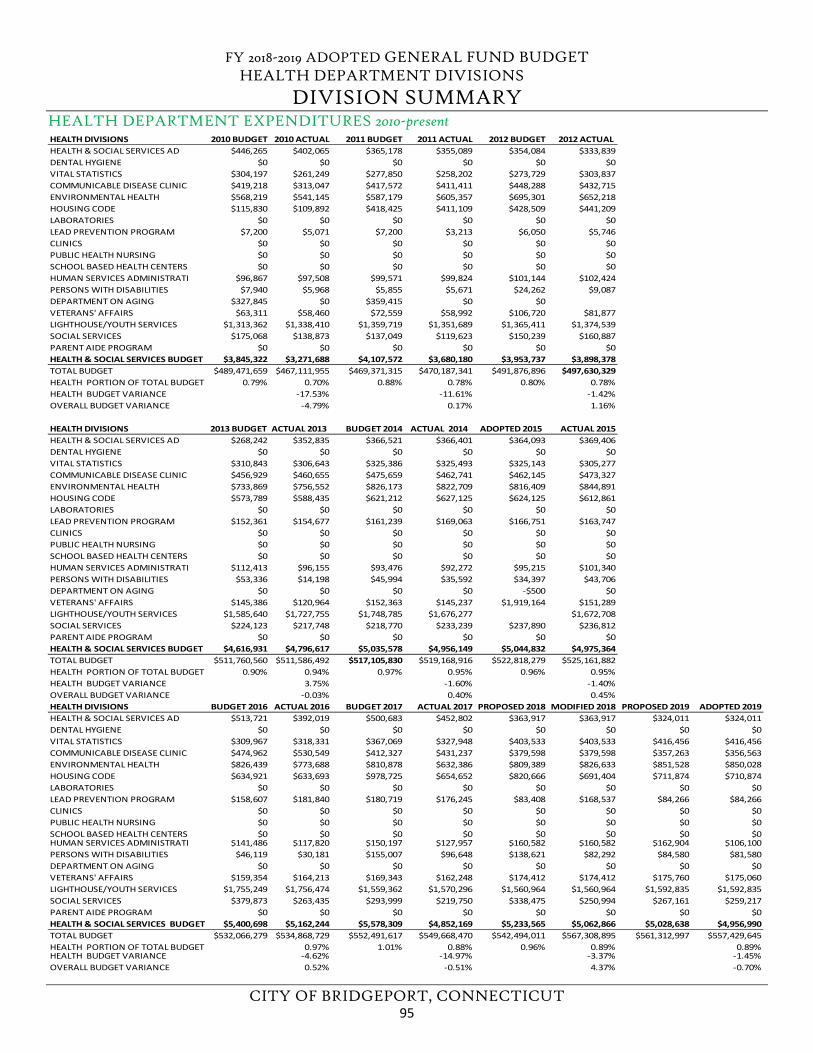
FY 2018-2019 ADOPTED GENERAL FUND BUDGET HEALTH DEPARTMENT DIVISIONS
DIVISION SUMMARY
CITY OF BRIDGEPORT, CONNECTICUT
HEALTH DEPARTMENT EXPENDITURES 2010-present HEALTH DIVISIONS 2010 BUDGET 2010 ACTUAL 2011 BUDGET 2011 ACTUAL 2012 BUDGET 2012 ACTUAL HEALTH & SOCIAL SERVICES AD $446,265 $402,065 $365,178 $355,089 $354,084 $333,839DENTAL HYGIENE $0 $0 $0 $0 $0 $0VITAL STATISTICS $304,197 $261,249 $277,850 $258,202 $273,729 $303,837COMMUNICABLE DISEASE CLINIC $419,218 $313,047 $417,572 $411,411 $448,288 $432,715ENVIRONMENTAL HEALTH $568,219 $541,145 $587,179 $605,357 $695,301 $652,218HOUSING CODE $115,830 $109,892 $418,425 $411,109 $428,509 $441,209LABORATORIES $0 $0 $0 $0 $0 $0LEAD PREVENTION PROGRAM $7,200 $5,071 $7,200 $3,213 $6,050 $5,746CLINICS $0 $0 $0 $0 $0 $0PUBLIC HEALTH NURSING $0 $0 $0 $0 $0 $0SCHOOL BASED HEALTH CENTERS $0 $0 $0 $0 $0 $0HUMAN SERVICES ADMINISTRATI $96,867 $97,508 $99,571 $99,824 $101,144 $102,424PERSONS WITH DISABILITIES $7,940 $5,968 $5,855 $5,671 $24,262 $9,087DEPARTMENT ON AGING $327,845 $0 $359,415 $0 $0VETERANS' AFFAIRS $63,311 $58,460 $72,559 $58,992 $106,720 $81,877LIGHTHOUSE/YOUTH SERVICES $1,313,362 $1,338,410 $1,359,719 $1,351,689 $1,365,411 $1,374,539SOCIAL SERVICES $175,068 $138,873 $137,049 $119,623 $150,239 $160,887PARENT AIDE PROGRAM $0 $0 $0 $0 $0 $0HEALTH & SOCIAL SERVICES BUDGET $3,845,322 $3,271,688 $4,107,572 $3,680,180 $3,953,737 $3,898,378TOTAL BUDGET $489,471,659 $467,111,955 $469,371,315 $470,187,341 $491,876,896 $497,630,329HEALTH PORTION OF TOTAL BUDGET 0.79% 0.70% 0.88% 0.78% 0.80% 0.78%HEALTH BUDGET VARIANCE -17.53% -11.61% -1.42%OVERALL BUDGET VARIANCE -4.79% 0.17% 1.16%
HEALTH DIVISIONS 2013 BUDGET ACTUAL 2013 BUDGET 2014 ACTUAL 2014 ADOPTED 2015 ACTUAL 2015HEALTH & SOCIAL SERVICES AD $268,242 $352,835 $366,521 $366,401 $364,093 $369,406DENTAL HYGIENE $0 $0 $0 $0 $0 $0VITAL STATISTICS $310,843 $306,643 $325,386 $325,493 $325,143 $305,277COMMUNICABLE DISEASE CLINIC $456,929 $460,655 $475,659 $462,741 $462,145 $473,327ENVIRONMENTAL HEALTH $733,869 $756,552 $826,173 $822,709 $816,409 $844,891HOUSING CODE $573,789 $588,435 $621,212 $627,125 $624,125 $612,861LABORATORIES $0 $0 $0 $0 $0 $0LEAD PREVENTION PROGRAM $152,361 $154,677 $161,239 $169,063 $166,751 $163,747CLINICS $0 $0 $0 $0 $0 $0PUBLIC HEALTH NURSING $0 $0 $0 $0 $0 $0SCHOOL BASED HEALTH CENTERS $0 $0 $0 $0 $0 $0HUMAN SERVICES ADMINISTRATI $112,413 $96,155 $93,476 $92,272 $95,215 $101,340PERSONS WITH DISABILITIES $53,336 $14,198 $45,994 $35,592 $34,397 $43,706DEPARTMENT ON AGING $0 $0 $0 $0 -$500 $0VETERANS' AFFAIRS $145,386 $120,964 $152,363 $145,237 $1,919,164 $151,289LIGHTHOUSE/YOUTH SERVICES $1,585,640 $1,727,755 $1,748,785 $1,676,277 $1,672,708SOCIAL SERVICES $224,123 $217,748 $218,770 $233,239 $237,890 $236,812PARENT AIDE PROGRAM $0 $0 $0 $0 $0 $0HEALTH & SOCIAL SERVICES BUDGET $4,616,931 $4,796,617 $5,035,578 $4,956,149 $5,044,832 $4,975,364TOTAL BUDGET $511,760,560 $511,586,492 $517,105,830 $519,168,916 $522,818,279 $525,161,882HEALTH PORTION OF TOTAL BUDGET 0.90% 0.94% 0.97% 0.95% 0.96% 0.95%HEALTH BUDGET VARIANCE 3.75% -1.60% -1.40%OVERALL BUDGET VARIANCE -0.03% 0.40% 0.45%HEALTH DIVISIONS BUDGET 2016 ACTUAL 2016 BUDGET 2017 ACTUAL 2017 PROPOSED 2018 MODIFIED 2018 PROPOSED 2019 ADOPTED 2019HEALTH & SOCIAL SERVICES AD $513,721 $392,019 $500,683 $452,802 $363,917 $363,917 $324,011 $324,011DENTAL HYGIENE $0 $0 $0 $0 $0 $0 $0 $0VITAL STATISTICS $309,967 $318,331 $367,069 $327,948 $403,533 $403,533 $416,456 $416,456COMMUNICABLE DISEASE CLINIC $474,962 $530,549 $412,327 $431,237 $379,598 $379,598 $357,263 $356,563ENVIRONMENTAL HEALTH $826,439 $773,688 $810,878 $632,386 $809,389 $826,633 $851,528 $850,028HOUSING CODE $634,921 $633,693 $978,725 $654,652 $820,666 $691,404 $711,874 $710,874LABORATORIES $0 $0 $0 $0 $0 $0 $0 $0LEAD PREVENTION PROGRAM $158,607 $181,840 $180,719 $176,245 $83,408 $168,537 $84,266 $84,266CLINICS $0 $0 $0 $0 $0 $0 $0 $0PUBLIC HEALTH NURSING $0 $0 $0 $0 $0 $0 $0 $0SCHOOL BASED HEALTH CENTERS $0 $0 $0 $0 $0 $0 $0 $0HUMAN SERVICES ADMINISTRATI $141,486 $117,820 $150,197 $127,957 $160,582 $160,582 $162,904 $106,100PERSONS WITH DISABILITIES $46,119 $30,181 $155,007 $96,648 $138,621 $82,292 $84,580 $81,580DEPARTMENT ON AGING $0 $0 $0 $0 $0 $0 $0 $0VETERANS' AFFAIRS $159,354 $164,213 $169,343 $162,248 $174,412 $174,412 $175,760 $175,060LIGHTHOUSE/YOUTH SERVICES $1,755,249 $1,756,474 $1,559,362 $1,570,296 $1,560,964 $1,560,964 $1,592,835 $1,592,835SOCIAL SERVICES $379,873 $263,435 $293,999 $219,750 $338,475 $250,994 $267,161 $259,217PARENT AIDE PROGRAM $0 $0 $0 $0 $0 $0 $0 $0HEALTH & SOCIAL SERVICES BUDGET $5,400,698 $5,162,244 $5,578,309 $4,852,169 $5,233,565 $5,062,866 $5,028,638 $4,956,990TOTAL BUDGET $532,066,279 $534,868,729 $552,491,617 $549,668,470 $542,494,011 $567,308,895 $561,312,997 $557,429,645HEALTH PORTION OF TOTAL BUDGET 0.97% 1.01% 0.88% 0.96% 0.89% 0.89%HEALTH BUDGET VARIANCE -4.62% -14.97% -3.37% -1.45%OVERALL BUDGET VARIANCE 0.52% -0.51% 4.37% -0.70%
95
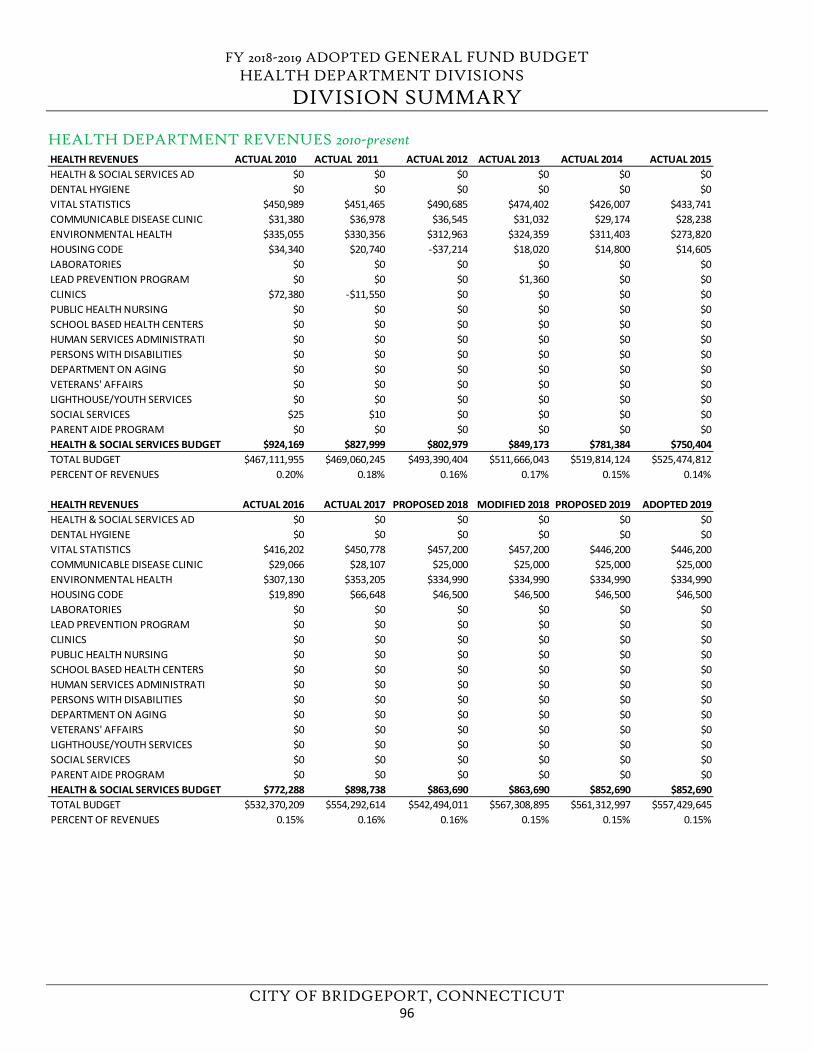
FY 2018-2019 ADOPTED GENERAL FUND BUDGET HEALTH DEPARTMENT DIVISIONS
DIVISION SUMMARY
CITY OF BRIDGEPORT, CONNECTICUT
HEALTH DEPARTMENT REVENUES 2010-present HEALTH REVENUES ACTUAL 2010 ACTUAL 2011 ACTUAL 2012 ACTUAL 2013 ACTUAL 2014 ACTUAL 2015HEALTH & SOCIAL SERVICES AD $0 $0 $0 $0 $0 $0DENTAL HYGIENE $0 $0 $0 $0 $0 $0VITAL STATISTICS $450,989 $451,465 $490,685 $474,402 $426,007 $433,741COMMUNICABLE DISEASE CLINIC $31,380 $36,978 $36,545 $31,032 $29,174 $28,238ENVIRONMENTAL HEALTH $335,055 $330,356 $312,963 $324,359 $311,403 $273,820HOUSING CODE $34,340 $20,740 -$37,214 $18,020 $14,800 $14,605LABORATORIES $0 $0 $0 $0 $0 $0LEAD PREVENTION PROGRAM $0 $0 $0 $1,360 $0 $0CLINICS $72,380 -$11,550 $0 $0 $0 $0PUBLIC HEALTH NURSING $0 $0 $0 $0 $0 $0SCHOOL BASED HEALTH CENTERS $0 $0 $0 $0 $0 $0HUMAN SERVICES ADMINISTRATI $0 $0 $0 $0 $0 $0PERSONS WITH DISABILITIES $0 $0 $0 $0 $0 $0DEPARTMENT ON AGING $0 $0 $0 $0 $0 $0VETERANS' AFFAIRS $0 $0 $0 $0 $0 $0LIGHTHOUSE/YOUTH SERVICES $0 $0 $0 $0 $0 $0SOCIAL SERVICES $25 $10 $0 $0 $0 $0PARENT AIDE PROGRAM $0 $0 $0 $0 $0 $0HEALTH & SOCIAL SERVICES BUDGET $924,169 $827,999 $802,979 $849,173 $781,384 $750,404TOTAL BUDGET $467,111,955 $469,060,245 $493,390,404 $511,666,043 $519,814,124 $525,474,812PERCENT OF REVENUES 0.20% 0.18% 0.16% 0.17% 0.15% 0.14%
HEALTH REVENUES ACTUAL 2016 ACTUAL 2017 PROPOSED 2018 MODIFIED 2018 PROPOSED 2019 ADOPTED 2019HEALTH & SOCIAL SERVICES AD $0 $0 $0 $0 $0 $0DENTAL HYGIENE $0 $0 $0 $0 $0 $0VITAL STATISTICS $416,202 $450,778 $457,200 $457,200 $446,200 $446,200COMMUNICABLE DISEASE CLINIC $29,066 $28,107 $25,000 $25,000 $25,000 $25,000ENVIRONMENTAL HEALTH $307,130 $353,205 $334,990 $334,990 $334,990 $334,990HOUSING CODE $19,890 $66,648 $46,500 $46,500 $46,500 $46,500LABORATORIES $0 $0 $0 $0 $0 $0LEAD PREVENTION PROGRAM $0 $0 $0 $0 $0 $0CLINICS $0 $0 $0 $0 $0 $0PUBLIC HEALTH NURSING $0 $0 $0 $0 $0 $0SCHOOL BASED HEALTH CENTERS $0 $0 $0 $0 $0 $0HUMAN SERVICES ADMINISTRATI $0 $0 $0 $0 $0 $0PERSONS WITH DISABILITIES $0 $0 $0 $0 $0 $0DEPARTMENT ON AGING $0 $0 $0 $0 $0 $0VETERANS' AFFAIRS $0 $0 $0 $0 $0 $0LIGHTHOUSE/YOUTH SERVICES $0 $0 $0 $0 $0 $0SOCIAL SERVICES $0 $0 $0 $0 $0 $0PARENT AIDE PROGRAM $0 $0 $0 $0 $0 $0HEALTH & SOCIAL SERVICES BUDGET $772,288 $898,738 $863,690 $863,690 $852,690 $852,690TOTAL BUDGET $532,370,209 $554,292,614 $542,494,011 $567,308,895 $561,312,997 $557,429,645PERCENT OF REVENUES 0.15% 0.16% 0.16% 0.15% 0.15% 0.15%
96
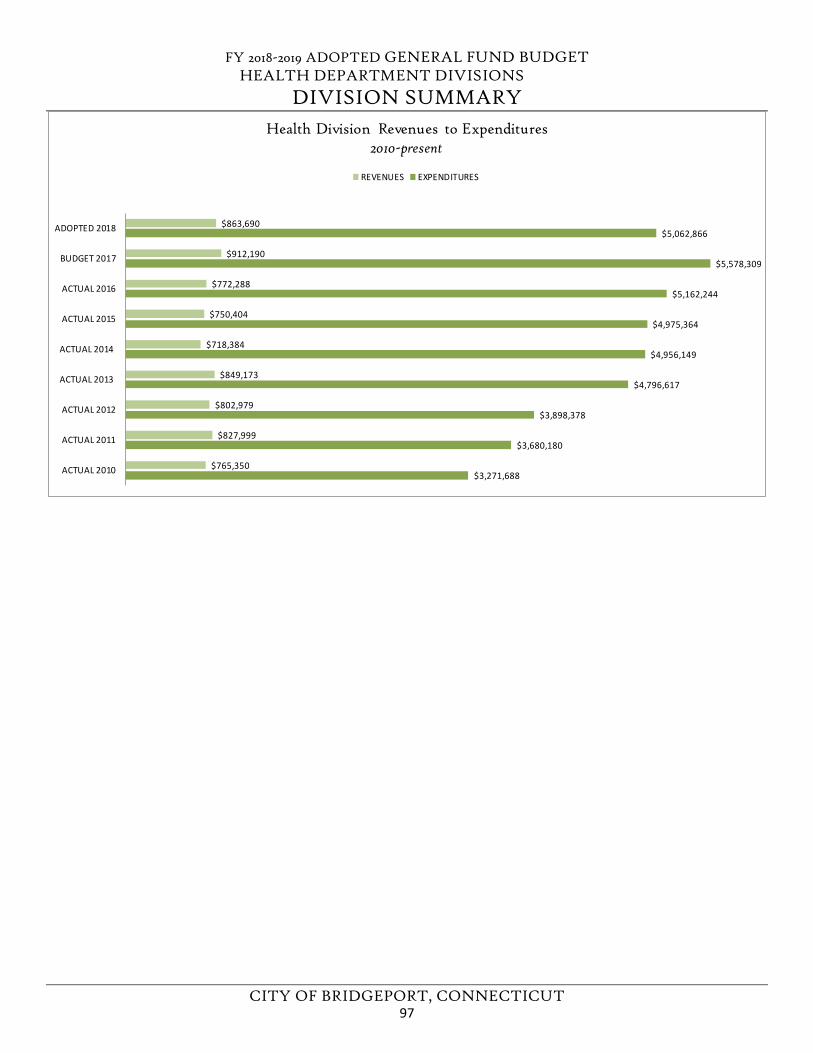
FY 2018-2019 ADOPTED GENERAL FUND BUDGET HEALTH DEPARTMENT DIVISIONS
DIVISION SUMMARY
CITY OF BRIDGEPORT, CONNECTICUT
$3,271,688
$3,680,180
$3,898,378
$4,796,617
$4,956,149
$4,975,364
$5,162,244
$5,578,309
$5,062,866
$765,350
$827,999
$802,979
$849,173
$718,384
$750,404
$772,288
$912,190
$863,690
ACTUAL 2010
ACTUAL 2011
ACTUAL 2012
ACTUAL 2013
ACTUAL 2014
ACTUAL 2015
ACTUAL 2016
BUDGET 2017
ADOPTED 2018
Health Division Revenues to Expenditures 2010-present
REVENUES EXPENDITURES
97

FY 2018-2019 ADOPTED GENERAL FUND BUDGET
CITY OF BRIDGEPORT, CONNECTICUT
This page left blank intentionally.
98
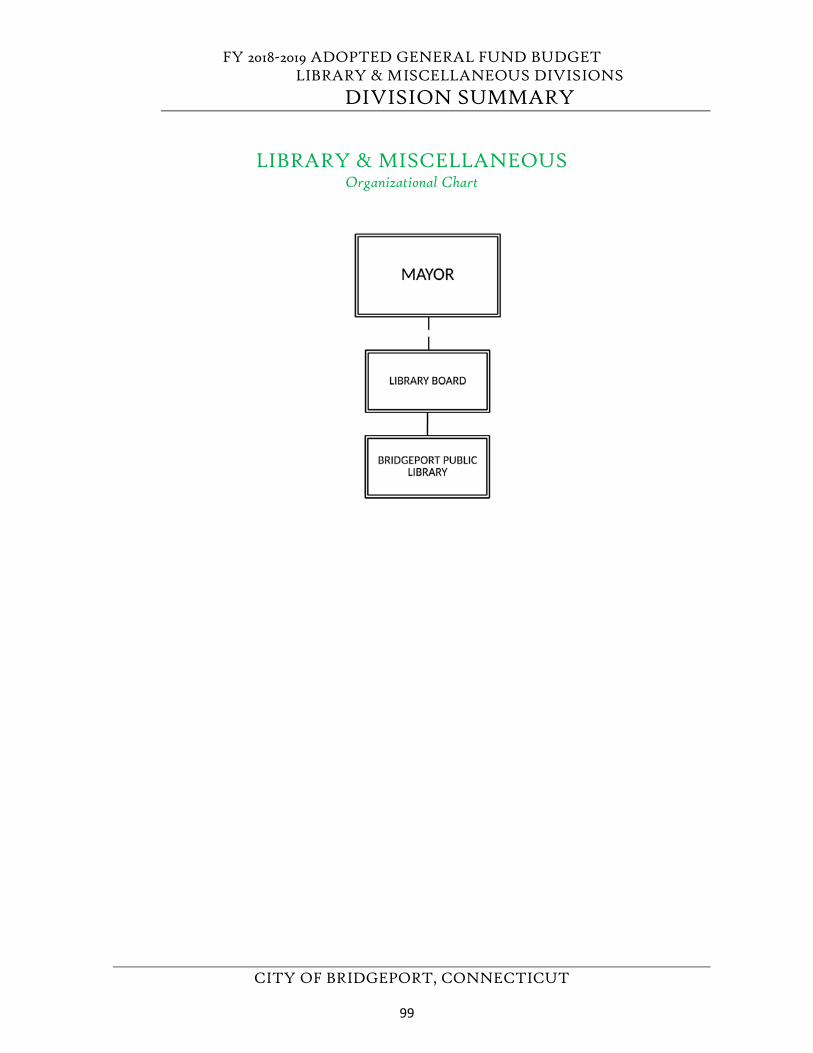
FY 2018-2019 ADOPTED GENERAL FUND BUDGET LIBRARY & MISCELLANEOUS DIVISIONS
DIVISION SUMMARY
CITY OF BRIDGEPORT, CONNECTICUT
LIBRARY & MISCELLANEOUS Organizational Chart
99
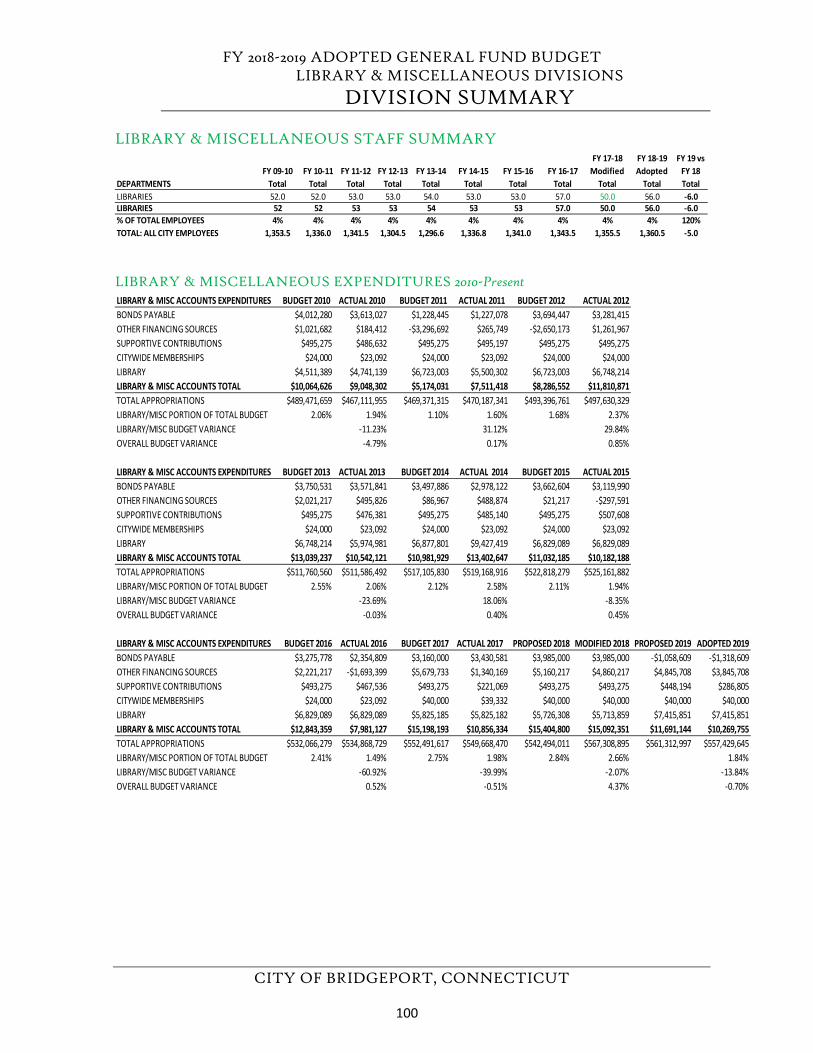
FY 2018-2019 ADOPTED GENERAL FUND BUDGET LIBRARY & MISCELLANEOUS DIVISIONS
DIVISION SUMMARY
CITY OF BRIDGEPORT, CONNECTICUT
LIBRARY & MISCELLANEOUS STAFF SUMMARY
LIBRARY & MISCELLANEOUS EXPENDITURES 2010-Present
FY 09-10 FY 10-11 FY 11-12 FY 12-13 FY 13-14 FY 14-15 FY 15-16 FY 16-17 FY 17-18
ModifiedFY 18-19 Adopted
FY 19 vs FY 18
DEPARTMENTS Total Total Total Total Total Total Total Total Total Total TotalLIBRARIES 52.0 52.0 53.0 53.0 54.0 53.0 53.0 57.0 50.0 56.0 -6.0LIBRARIES 52 52 53 53 54 53 53 57.0 50.0 56.0 -6.0% OF TOTAL EMPLOYEES 4% 4% 4% 4% 4% 4% 4% 4% 4% 4% 120%TOTAL: ALL CITY EMPLOYEES 1,353.5 1,336.0 1,341.5 1,304.5 1,296.6 1,336.8 1,341.0 1,343.5 1,355.5 1,360.5 -5.0
LIBRARY & MISC ACCOUNTS EXPENDITURES BUDGET 2010 ACTUAL 2010 BUDGET 2011 ACTUAL 2011 BUDGET 2012 ACTUAL 2012BONDS PAYABLE $4,012,280 $3,613,027 $1,228,445 $1,227,078 $3,694,447 $3,281,415OTHER FINANCING SOURCES $1,021,682 $184,412 -$3,296,692 $265,749 -$2,650,173 $1,261,967SUPPORTIVE CONTRIBUTIONS $495,275 $486,632 $495,275 $495,197 $495,275 $495,275CITYWIDE MEMBERSHIPS $24,000 $23,092 $24,000 $23,092 $24,000 $24,000LIBRARY $4,511,389 $4,741,139 $6,723,003 $5,500,302 $6,723,003 $6,748,214LIBRARY & MISC ACCOUNTS TOTAL $10,064,626 $9,048,302 $5,174,031 $7,511,418 $8,286,552 $11,810,871TOTAL APPROPRIATIONS $489,471,659 $467,111,955 $469,371,315 $470,187,341 $493,396,761 $497,630,329LIBRARY/MISC PORTION OF TOTAL BUDGET 2.06% 1.94% 1.10% 1.60% 1.68% 2.37%LIBRARY/MISC BUDGET VARIANCE -11.23% 31.12% 29.84%OVERALL BUDGET VARIANCE -4.79% 0.17% 0.85%
LIBRARY & MISC ACCOUNTS EXPENDITURES BUDGET 2013 ACTUAL 2013 BUDGET 2014 ACTUAL 2014 BUDGET 2015 ACTUAL 2015BONDS PAYABLE $3,750,531 $3,571,841 $3,497,886 $2,978,122 $3,662,604 $3,119,990OTHER FINANCING SOURCES $2,021,217 $495,826 $86,967 $488,874 $21,217 -$297,591SUPPORTIVE CONTRIBUTIONS $495,275 $476,381 $495,275 $485,140 $495,275 $507,608CITYWIDE MEMBERSHIPS $24,000 $23,092 $24,000 $23,092 $24,000 $23,092LIBRARY $6,748,214 $5,974,981 $6,877,801 $9,427,419 $6,829,089 $6,829,089LIBRARY & MISC ACCOUNTS TOTAL $13,039,237 $10,542,121 $10,981,929 $13,402,647 $11,032,185 $10,182,188TOTAL APPROPRIATIONS $511,760,560 $511,586,492 $517,105,830 $519,168,916 $522,818,279 $525,161,882LIBRARY/MISC PORTION OF TOTAL BUDGET 2.55% 2.06% 2.12% 2.58% 2.11% 1.94%LIBRARY/MISC BUDGET VARIANCE -23.69% 18.06% -8.35%OVERALL BUDGET VARIANCE -0.03% 0.40% 0.45%
LIBRARY & MISC ACCOUNTS EXPENDITURES BUDGET 2016 ACTUAL 2016 BUDGET 2017 ACTUAL 2017 PROPOSED 2018 MODIFIED 2018 PROPOSED 2019 ADOPTED 2019BONDS PAYABLE $3,275,778 $2,354,809 $3,160,000 $3,430,581 $3,985,000 $3,985,000 -$1,058,609 -$1,318,609OTHER FINANCING SOURCES $2,221,217 -$1,693,399 $5,679,733 $1,340,169 $5,160,217 $4,860,217 $4,845,708 $3,845,708SUPPORTIVE CONTRIBUTIONS $493,275 $467,536 $493,275 $221,069 $493,275 $493,275 $448,194 $286,805CITYWIDE MEMBERSHIPS $24,000 $23,092 $40,000 $39,332 $40,000 $40,000 $40,000 $40,000LIBRARY $6,829,089 $6,829,089 $5,825,185 $5,825,182 $5,726,308 $5,713,859 $7,415,851 $7,415,851LIBRARY & MISC ACCOUNTS TOTAL $12,843,359 $7,981,127 $15,198,193 $10,856,334 $15,404,800 $15,092,351 $11,691,144 $10,269,755TOTAL APPROPRIATIONS $532,066,279 $534,868,729 $552,491,617 $549,668,470 $542,494,011 $567,308,895 $561,312,997 $557,429,645LIBRARY/MISC PORTION OF TOTAL BUDGET 2.41% 1.49% 2.75% 1.98% 2.84% 2.66% 1.84%LIBRARY/MISC BUDGET VARIANCE -60.92% -39.99% -2.07% -13.84%OVERALL BUDGET VARIANCE 0.52% -0.51% 4.37% -0.70%
100
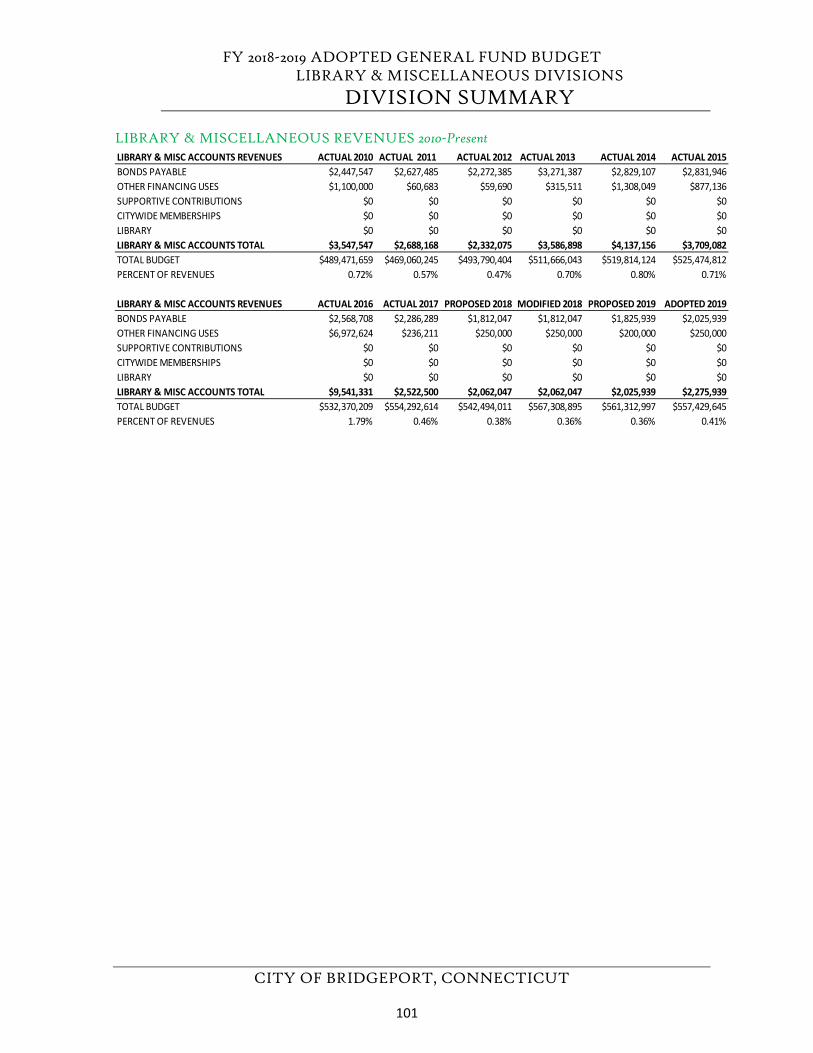
FY 2018-2019 ADOPTED GENERAL FUND BUDGET LIBRARY & MISCELLANEOUS DIVISIONS
DIVISION SUMMARY
CITY OF BRIDGEPORT, CONNECTICUT
LIBRARY & MISCELLANEOUS REVENUES 2010-PresentLIBRARY & MISC ACCOUNTS REVENUES ACTUAL 2010 ACTUAL 2011 ACTUAL 2012 ACTUAL 2013 ACTUAL 2014 ACTUAL 2015BONDS PAYABLE $2,447,547 $2,627,485 $2,272,385 $3,271,387 $2,829,107 $2,831,946OTHER FINANCING USES $1,100,000 $60,683 $59,690 $315,511 $1,308,049 $877,136SUPPORTIVE CONTRIBUTIONS $0 $0 $0 $0 $0 $0CITYWIDE MEMBERSHIPS $0 $0 $0 $0 $0 $0LIBRARY $0 $0 $0 $0 $0 $0LIBRARY & MISC ACCOUNTS TOTAL $3,547,547 $2,688,168 $2,332,075 $3,586,898 $4,137,156 $3,709,082TOTAL BUDGET $489,471,659 $469,060,245 $493,790,404 $511,666,043 $519,814,124 $525,474,812PERCENT OF REVENUES 0.72% 0.57% 0.47% 0.70% 0.80% 0.71%
LIBRARY & MISC ACCOUNTS REVENUES ACTUAL 2016 ACTUAL 2017 PROPOSED 2018 MODIFIED 2018 PROPOSED 2019 ADOPTED 2019BONDS PAYABLE $2,568,708 $2,286,289 $1,812,047 $1,812,047 $1,825,939 $2,025,939OTHER FINANCING USES $6,972,624 $236,211 $250,000 $250,000 $200,000 $250,000SUPPORTIVE CONTRIBUTIONS $0 $0 $0 $0 $0 $0CITYWIDE MEMBERSHIPS $0 $0 $0 $0 $0 $0LIBRARY $0 $0 $0 $0 $0 $0LIBRARY & MISC ACCOUNTS TOTAL $9,541,331 $2,522,500 $2,062,047 $2,062,047 $2,025,939 $2,275,939TOTAL BUDGET $532,370,209 $554,292,614 $542,494,011 $567,308,895 $561,312,997 $557,429,645PERCENT OF REVENUES 1.79% 0.46% 0.38% 0.36% 0.36% 0.41%
101
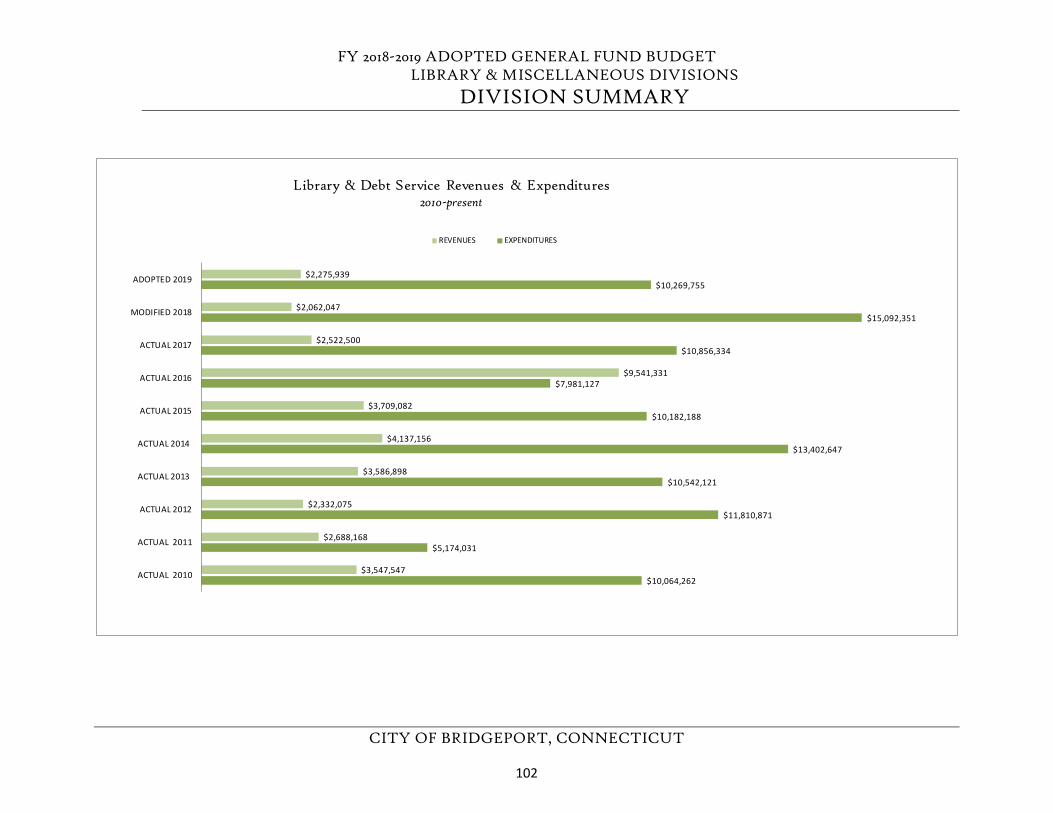
FY 2018-2019 ADOPTED GENERAL FUND BUDGET LIBRARY & MISCELLANEOUS DIVISIONS
DIVISION SUMMARY
CITY OF BRIDGEPORT, CONNECTICUT
$10,064,262
$5,174,031
$11,810,871
$10,542,121
$13,402,647
$10,182,188
$7,981,127
$10,856,334
$15,092,351
$10,269,755
$3,547,547
$2,688,168
$2,332,075
$3,586,898
$4,137,156
$3,709,082
$9,541,331
$2,522,500
$2,062,047
$2,275,939
ACTUAL 2010
ACTUAL 2011
ACTUAL 2012
ACTUAL 2013
ACTUAL 2014
ACTUAL 2015
ACTUAL 2016
ACTUAL 2017
MODIFIED 2018
ADOPTED 2019
Library & Debt Service Revenues & Expenditures 2010-present
REVENUES EXPENDITURES
102
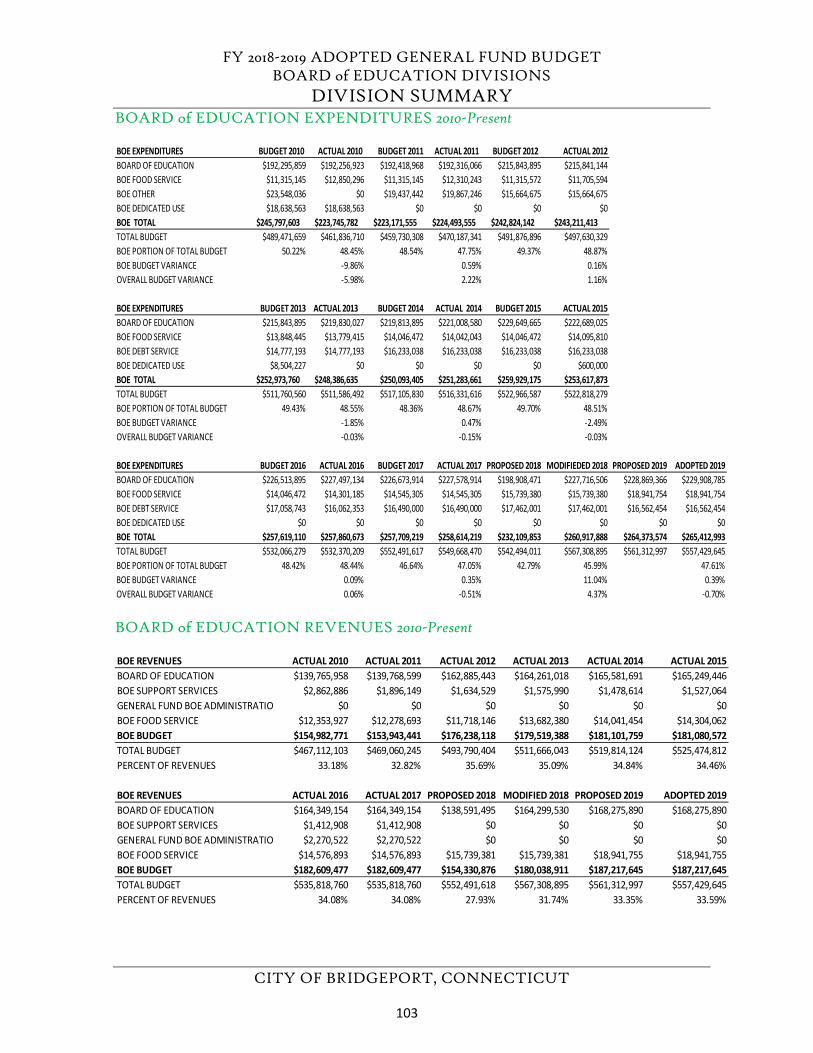
FY 2018-2019 ADOPTED GENERAL FUND BUDGET BOARD of EDUCATION DIVISIONS
DIVISION SUMMARY
CITY OF BRIDGEPORT, CONNECTICUT
BOARD of EDUCATION EXPENDITURES 2010-Present
BOARD of EDUCATION REVENUES 2010-Present
BOE EXPENDITURES BUDGET 2010 ACTUAL 2010 BUDGET 2011 ACTUAL 2011 BUDGET 2012 ACTUAL 2012BOARD OF EDUCATION $192,295,859 $192,256,923 $192,418,968 $192,316,066 $215,843,895 $215,841,144BOE FOOD SERVICE $11,315,145 $12,850,296 $11,315,145 $12,310,243 $11,315,572 $11,705,594BOE OTHER $23,548,036 $0 $19,437,442 $19,867,246 $15,664,675 $15,664,675BOE DEDICATED USE $18,638,563 $18,638,563 $0 $0 $0 $0BOE TOTAL $245,797,603 $223,745,782 $223,171,555 $224,493,555 $242,824,142 $243,211,413TOTAL BUDGET $489,471,659 $461,836,710 $459,730,308 $470,187,341 $491,876,896 $497,630,329BOE PORTION OF TOTAL BUDGET 50.22% 48.45% 48.54% 47.75% 49.37% 48.87%BOE BUDGET VARIANCE -9.86% 0.59% 0.16%OVERALL BUDGET VARIANCE -5.98% 2.22% 1.16%
BOE EXPENDITURES BUDGET 2013 ACTUAL 2013 BUDGET 2014 ACTUAL 2014 BUDGET 2015 ACTUAL 2015BOARD OF EDUCATION $215,843,895 $219,830,027 $219,813,895 $221,008,580 $229,649,665 $222,689,025BOE FOOD SERVICE $13,848,445 $13,779,415 $14,046,472 $14,042,043 $14,046,472 $14,095,810BOE DEBT SERVICE $14,777,193 $14,777,193 $16,233,038 $16,233,038 $16,233,038 $16,233,038BOE DEDICATED USE $8,504,227 $0 $0 $0 $0 $600,000BOE TOTAL $252,973,760 $248,386,635 $250,093,405 $251,283,661 $259,929,175 $253,617,873TOTAL BUDGET $511,760,560 $511,586,492 $517,105,830 $516,331,616 $522,966,587 $522,818,279BOE PORTION OF TOTAL BUDGET 49.43% 48.55% 48.36% 48.67% 49.70% 48.51%BOE BUDGET VARIANCE -1.85% 0.47% -2.49%OVERALL BUDGET VARIANCE -0.03% -0.15% -0.03%
BOE EXPENDITURES BUDGET 2016 ACTUAL 2016 BUDGET 2017 ACTUAL 2017 PROPOSED 2018 MODIFIEDED 2018 PROPOSED 2019 ADOPTED 2019BOARD OF EDUCATION $226,513,895 $227,497,134 $226,673,914 $227,578,914 $198,908,471 $227,716,506 $228,869,366 $229,908,785BOE FOOD SERVICE $14,046,472 $14,301,185 $14,545,305 $14,545,305 $15,739,380 $15,739,380 $18,941,754 $18,941,754BOE DEBT SERVICE $17,058,743 $16,062,353 $16,490,000 $16,490,000 $17,462,001 $17,462,001 $16,562,454 $16,562,454BOE DEDICATED USE $0 $0 $0 $0 $0 $0 $0 $0BOE TOTAL $257,619,110 $257,860,673 $257,709,219 $258,614,219 $232,109,853 $260,917,888 $264,373,574 $265,412,993TOTAL BUDGET $532,066,279 $532,370,209 $552,491,617 $549,668,470 $542,494,011 $567,308,895 $561,312,997 $557,429,645BOE PORTION OF TOTAL BUDGET 48.42% 48.44% 46.64% 47.05% 42.79% 45.99% 47.61%BOE BUDGET VARIANCE 0.09% 0.35% 11.04% 0.39%OVERALL BUDGET VARIANCE 0.06% -0.51% 4.37% -0.70%
BOE REVENUES ACTUAL 2010 ACTUAL 2011 ACTUAL 2012 ACTUAL 2013 ACTUAL 2014 ACTUAL 2015BOARD OF EDUCATION $139,765,958 $139,768,599 $162,885,443 $164,261,018 $165,581,691 $165,249,446BOE SUPPORT SERVICES $2,862,886 $1,896,149 $1,634,529 $1,575,990 $1,478,614 $1,527,064GENERAL FUND BOE ADMINISTRATIO $0 $0 $0 $0 $0 $0BOE FOOD SERVICE $12,353,927 $12,278,693 $11,718,146 $13,682,380 $14,041,454 $14,304,062BOE BUDGET $154,982,771 $153,943,441 $176,238,118 $179,519,388 $181,101,759 $181,080,572TOTAL BUDGET $467,112,103 $469,060,245 $493,790,404 $511,666,043 $519,814,124 $525,474,812PERCENT OF REVENUES 33.18% 32.82% 35.69% 35.09% 34.84% 34.46%
BOE REVENUES ACTUAL 2016 ACTUAL 2017 PROPOSED 2018 MODIFIED 2018 PROPOSED 2019 ADOPTED 2019BOARD OF EDUCATION $164,349,154 $164,349,154 $138,591,495 $164,299,530 $168,275,890 $168,275,890BOE SUPPORT SERVICES $1,412,908 $1,412,908 $0 $0 $0 $0GENERAL FUND BOE ADMINISTRATIO $2,270,522 $2,270,522 $0 $0 $0 $0BOE FOOD SERVICE $14,576,893 $14,576,893 $15,739,381 $15,739,381 $18,941,755 $18,941,755BOE BUDGET $182,609,477 $182,609,477 $154,330,876 $180,038,911 $187,217,645 $187,217,645TOTAL BUDGET $535,818,760 $535,818,760 $552,491,618 $567,308,895 $561,312,997 $557,429,645PERCENT OF REVENUES 34.08% 34.08% 27.93% 31.74% 33.35% 33.59%
103
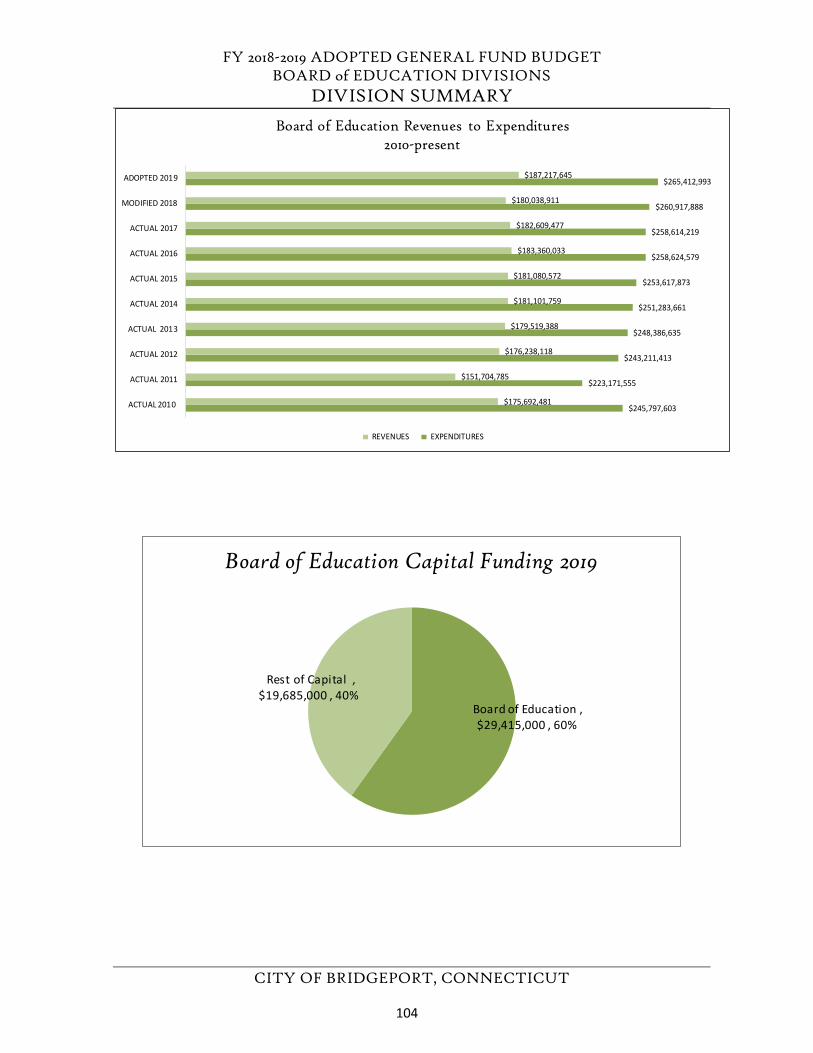
FY 2018-2019 ADOPTED GENERAL FUND BUDGET BOARD of EDUCATION DIVISIONS
DIVISION SUMMARY
CITY OF BRIDGEPORT, CONNECTICUT
$245,797,603
$223,171,555
$243,211,413
$248,386,635
$251,283,661
$253,617,873
$258,624,579
$258,614,219
$260,917,888
$265,412,993
$175,692,481
$151,704,785
$176,238,118
$179,519,388
$181,101,759
$181,080,572
$183,360,033
$182,609,477
$180,038,911
$187,217,645
ACTUAL 2010
ACTUAL 2011
ACTUAL 2012
ACTUAL 2013
ACTUAL 2014
ACTUAL 2015
ACTUAL 2016
ACTUAL 2017
MODIFIED 2018
ADOPTED 2019
Board of Education Revenues to Expenditures 2010-present
REVENUES EXPENDITURES
Board of Education , $29,415,000 , 60%
Rest of Capital , $19,685,000 , 40%
Board of Education Capital Funding 2019
104
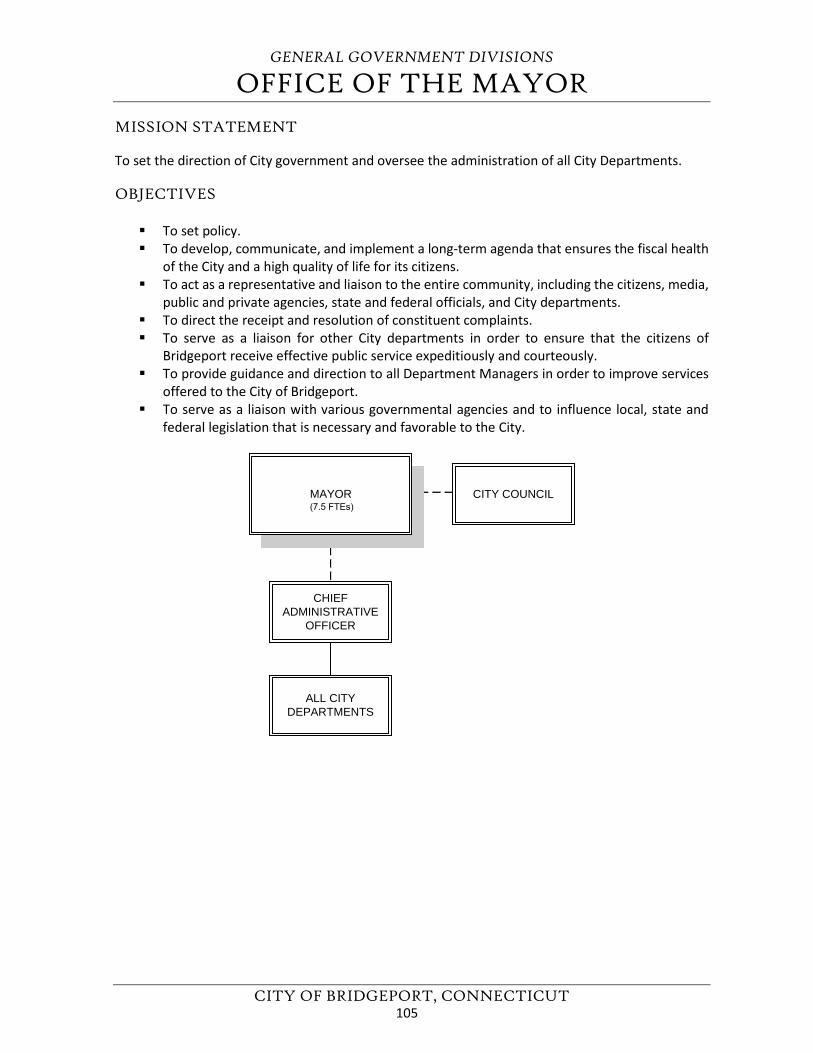
GENERAL GOVERNMENT DIVISIONS
OFFICE OF THE MAYOR
CITY OF BRIDGEPORT, CONNECTICUT
MISSION STATEMENT
To set the direction of City government and oversee the administration of all City Departments.
OBJECTIVES
To set policy. To develop, communicate, and implement a long-term agenda that ensures the fiscal health
of the City and a high quality of life for its citizens. To act as a representative and liaison to the entire community, including the citizens, media,
public and private agencies, state and federal officials, and City departments. To direct the receipt and resolution of constituent complaints. To serve as a liaison for other City departments in order to ensure that the citizens of
Bridgeport receive effective public service expeditiously and courteously. To provide guidance and direction to all Department Managers in order to improve services
offered to the City of Bridgeport. To serve as a liaison with various governmental agencies and to influence local, state and
federal legislation that is necessary and favorable to the City.
CHIEFADMINISTRATIVE
OFFICER
CITY COUNCILMAYOR(7.5 FTEs)
ALL CITYDEPARTMENTS
105
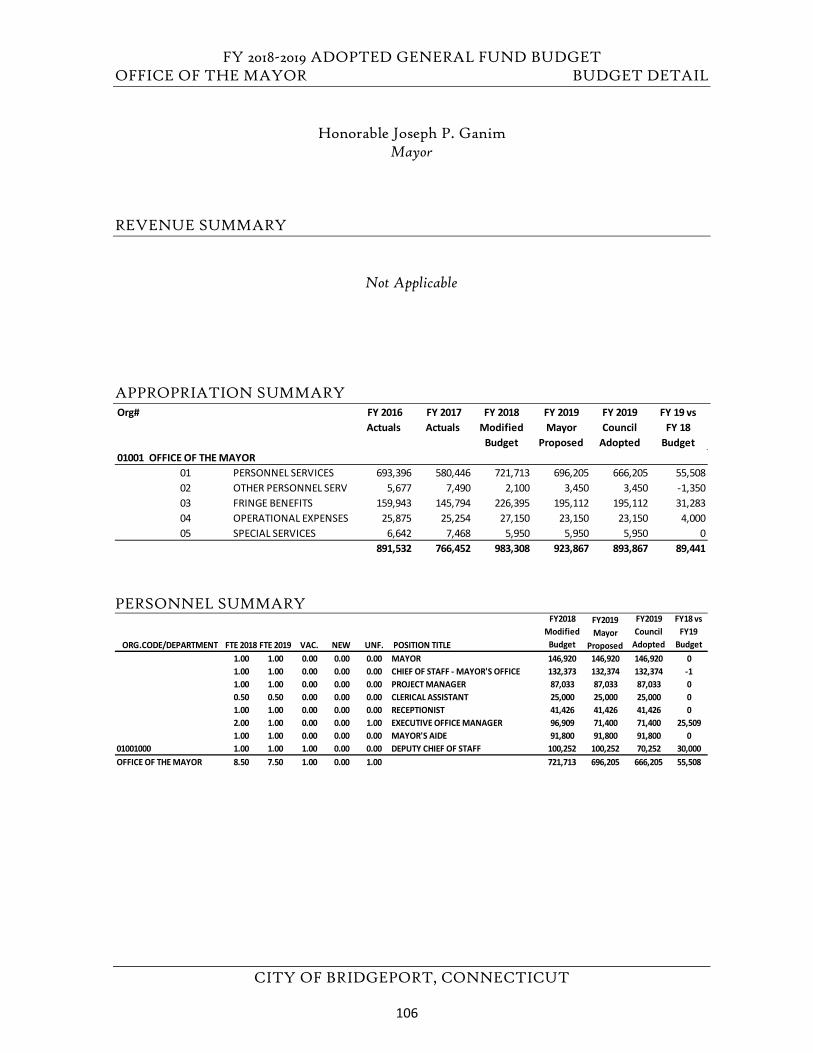
FY 2018-2019 ADOPTED GENERAL FUND BUDGET OFFICE OF THE MAYOR BUDGET DETAIL
CITY OF BRIDGEPORT, CONNECTICUT
Honorable Joseph P. Ganim Mayor
REVENUE SUMMARY
Not Applicable
APPROPRIATION SUMMARY
PERSONNEL SUMMARY
Org# FY 2016 Actuals
FY 2017 Actuals
FY 2018 Modified
Budget
FY 2019 Mayor
Proposed
FY 2019 Council
Adopted
FY 19 vs FY 18
Budget01001 OFFICE OF THE MAYOR
01 PERSONNEL SERVICES 693,396 580,446 721,713 696,205 666,205 55,50802 OTHER PERSONNEL SERV 5,677 7,490 2,100 3,450 3,450 -1,35003 FRINGE BENEFITS 159,943 145,794 226,395 195,112 195,112 31,28304 OPERATIONAL EXPENSES 25,875 25,254 27,150 23,150 23,150 4,00005 SPECIAL SERVICES 6,642 7,468 5,950 5,950 5,950 0
891,532 766,452 983,308 923,867 893,867 89,441
ORG.CODE/DEPARTMENT FTE 2018 FTE 2019 VAC. NEW UNF. POSITION TITLE
FY2018 Modified
Budget
FY2019 Mayor
Proposed
FY2019 Council
Adopted
FY18 vs FY19
Budget 1.00 1.00 0.00 0.00 0.00 MAYOR 146,920 146,920 146,920 01.00 1.00 0.00 0.00 0.00 CHIEF OF STAFF - MAYOR'S OFFICE 132,373 132,374 132,374 -11.00 1.00 0.00 0.00 0.00 PROJECT MANAGER 87,033 87,033 87,033 00.50 0.50 0.00 0.00 0.00 CLERICAL ASSISTANT 25,000 25,000 25,000 01.00 1.00 0.00 0.00 0.00 RECEPTIONIST 41,426 41,426 41,426 02.00 1.00 0.00 0.00 1.00 EXECUTIVE OFFICE MANAGER 96,909 71,400 71,400 25,5091.00 1.00 0.00 0.00 0.00 MAYOR'S AIDE 91,800 91,800 91,800 0
01001000 1.00 1.00 1.00 0.00 0.00 DEPUTY CHIEF OF STAFF 100,252 100,252 70,252 30,000OFFICE OF THE MAYOR 8.50 7.50 1.00 0.00 1.00 721,713 696,205 666,205 55,508
106
FY 2018-2019 ADOPTED GENERAL FUND BUDGET OFFICE OF THE MAYOR PROGRAM HIGHLIGHTS
CITY OF BRIDGEPORT, CONNECTICUT
FY 2018 – 2019 GOALS
1. Continue to make economic development in the City of Bridgeport a top priority and work towardsgrowing the tax base. This includes working with OPED and developers to move projects alongincluding, but not limited to:
a. The new state-of-the-art gas power plant by PSEG;b. The Madison Avenue Boys and Girls Club;c. The Jayson Newfield redevelopment project;d. The McLevy Square project by Forstone;e. The Civic Block on Stratford Avenue;f. The Steel Pointe and Seaview Avenue redevelopment;g. The Cherry Street Lofts redevelopment project;h. The Windward Apartments and the demolition of Marina Villagei. The Poli/Majestic redevelopment project by Exact Capital, LLC.j. The new amphitheater at Harbor Yard.k. The newly proposed MGM Bridgeport resort.
2. Implement fiscal controls that maintain a balanced budget, despite reductions in state aid.
3. Focus on improving the cleanliness of the city, including remediating blight, illegal dumping, andlitter.
4. Continue to improve public safety in the City of Bridgeport by graduating additional police and fireclasses.
5. Work with the leadership of the Bridgeport Police Department to modernize its operations,including the implementation of NexGen, Kronos, and body and dash cameras.
6. Continue to make improvements to the Bridgeport 311 CRM system to foster more efficientresponses to citizen issues.
7. Work with the Small and Minority Business Office to improve and enforce the City’s MBEordinance.
FY 2017 – 2018 GOAL STATUS
1) 1. Eliminate the city’s financial deficit through short and long-term cost saving measures andincreased revenues.
6 MONTH STATUS: Last year due to budget cuts and Council actions, the City was able to closethe budget deficit and end FY16-17 with a $4.5 million-dollar surplus. That money went a longway towards increasing the City’s Fund Balance to a more appropriate level for a city our size.However, the current FY 17-18 budget and next year’s FY 18-19 budget are not as easy to managedue to some cost increases and cuts in state aid.
107
FY 2018-2019 ADOPTED GENERAL FUND BUDGET OFFICE OF THE MAYOR PROGRAM HIGHLIGHTS
CITY OF BRIDGEPORT, CONNECTICUT
Because the amount of state aid expected under the Governor’s Proposed Budget did not materialize as part of the Bi-Partisan budget that ultimately passed in the General Assembly, the Mayor and city departments were forced to take actions to close the operational budget deficit for FY17-18. To date, this has primarily been accomplished through operational spending controls and freezes across various departmental budgets, as well as holding up on filling vacant positions throughout the City that arose during the year. While many of these vacancies are in critical areas and cannot be held indefinitely, we were able to offset much of our revenue shortfalls through such action.
We are currently working with the members of the Bridgeport legislative delegation to ensure that Bridgeport receives the supplemental motor vehicle tax money that was appropriated in the Bi-Partisan Budget, but has not yet been given to the City by State OPM. This will be critical for the City as it seeks to close the current fiscal year in the black. We are also working closely with the members of our legislative delegation to ask for additional state aid as part of a package that would help all cities in Connecticut.
2) Significantly increase government transparency through the creation and launch of OpenBridgeport and the creation of an Office of Governmental Accountability.
6 MONTH STATUS: Open Bridgeport has been successfully launched and functional for well overa year now. Open Bridgeport is setup to provide the public with access to the City of Bridgeport’sfinancial information, and encompasses two websites. One of the sites is Open Budget(openbudget.bridgeportct.gov) which shows all General Fund budget revenues and expenditures,broken down by object code. These numbers are directly exported from MUNIS to Open Budgeton a monthly basis. The other site is Open Checkbook (opencheckbook.bridgeportct.gov) whichallows users to view all expenditures with outside vendors. This information is also exported fromMUNIS monthly, and allows for users to see when a check was cut, for what vendor, for howmuch, on what day.
3) Continue to grow the city’s tax base by increasing the city’s ability to attract and retainsustainable economic and community development.
6 MONTH STATUS: The Mayor’s Office has been working on a daily basis with OPED to ensurethat economic development is a priority for the City. The following are some of the projects thatare being closely tracked: The new state-of-the-art gas power plant by PSEG; The Madison Avenue Boys and Girls Club; The Windward Apartments and the demolition of Marina Village; The JaysonNewfield redevelopment project; The McLevy Square project by Forstone; The Civic Block onStratford Avenue; The Steel Pointe and Seaview Avenue redevelopment; The Cherry Street Loftsredevelopment project; The Poli/Majestic
108
FY 2018-2019 ADOPTED GENERAL FUND BUDGET OFFICE OF THE MAYOR PROGRAM HIGHLIGHTS
CITY OF BRIDGEPORT, CONNECTICUT
redevelopment project by Exact Capital, LLC.; The new amphitheater at Harbor Yard; and, the newly proposed MGM Bridgeport resort.
4) Continue to promote efficiency and accountability throughout city government through theCitiStat program, the City’s online citizen service request system, TQM (Total QualityManagement) system, and employee training.
6 MONTH STATUS: The City has fully implemented its new “Bridgeport 311” citizen responsemanagement system, and has continued to make improvements to it over the past few monthsto meet the needs of departments and citizens. As of March, over 9,000 issues have gone throughthe entire process and have been closed since the system’s inception.
Additionally, the City has worked to improve morale and training among city staff through thecreation of a TQM program, as well as through various trainings on MUNIS, Microsoft products,etc.
5) Continue to work together with the Board of Education to improve Bridgeport schools bycontinuing our investment in building new state-of-the-art schools, including the capitalimprovements being made to Central, Harding, and Bassick high schools.
6 MONTH STATUS: The renovations of Central High School are nearly complete. The constructionof the new Harding High School on the East End has made substantial progress. And, the Mayorhas proposed an additional $28 million in the Capital Plan for Bassick High School.
6) Strengthen alliances with community groups and support initiatives that will benefit the City’squality of life.
6 MONTH STATUS: Over the last year, the City has successfully partnered with many of the NRZ’son neighborhood revitalization, including the fixing of sidewalks through the sidewalk renewalproject and neighborhood cleanups. The Mayor’s Office has also partnered over the last year with “Working For A Better Bridgeport” to foster a conversation about better community policing andpublic safety in the city.
7) Support diversity at all levels in government through progressive hiring practices, humanresources and labor relations, and by supporting our Small and Minority Business Resource Office which provides resources and support for local minority contractors, develops best practices,policies and procedures to ensure that the City’s Minority Contracting Business Enterprise Goalsare achieved.
109
FY 2018-2019 ADOPTED GENERAL FUND BUDGET OFFICE OF THE MAYOR PROGRAM HIGHLIGHTS
CITY OF BRIDGEPORT, CONNECTICUT
6 MONTH STATUS: Improving the Small and Minority Business Office and the MBE ordinance have become a top priority for the Mayor’s Office. Several city departments have worked in collaboration with community leaders to discuss challenges with our existing MBE program, how our MBE ordinance can be improved, and what the City can do to ensure effective enforcement of such rules. In collaboration with several Council members, the City will be seeking Council approval of new proposed MBE ordinance language, which will include a new program for local vendors. Concurrently, the city is working on better enforcement of our MBE rules and rebranding the MBE office.
8) Focus efforts to combat blight and strengthen neighborhoods through a comprehensive cityprogram of neighborhood stabilization.
6 MONTH STATUS: Through the city’s Bridgeport 311 CRM system, the Health and Public FacilitiesDepartments have been working diligently to address issues that have been reported throughoutthe city with respect to blight and illegal dumping. Furthermore, Public Facilities and OPED havemade demolitions of blighted buildings around the city a top priority. The goal is to clear andremediate blight in order to foster opportunities for economic development.
9) In partnership with the Police Chief, work together to formulate strategic initiatives that combatcrime and support successful neighborhood policing.
6 MONTH STATUS: In addition to the two classes that have already graduated, the city has added17 new police recruits to the academy. With the increase of police officers, the department willbe better positioned to engage in community policing and to staff its police substations.Also, at the urging of and in partnership with community leaders, the Police Department hasbegun a pilot of body cams and dash cams which will increase the transparency of the department and keep both officers and the community safer.
Finally, the Police Department is undergoing a period of transition into the 21st Century with the addition of NexGen and Kronos, which will greatly improve the efficiency and effectiveness of the department.
110
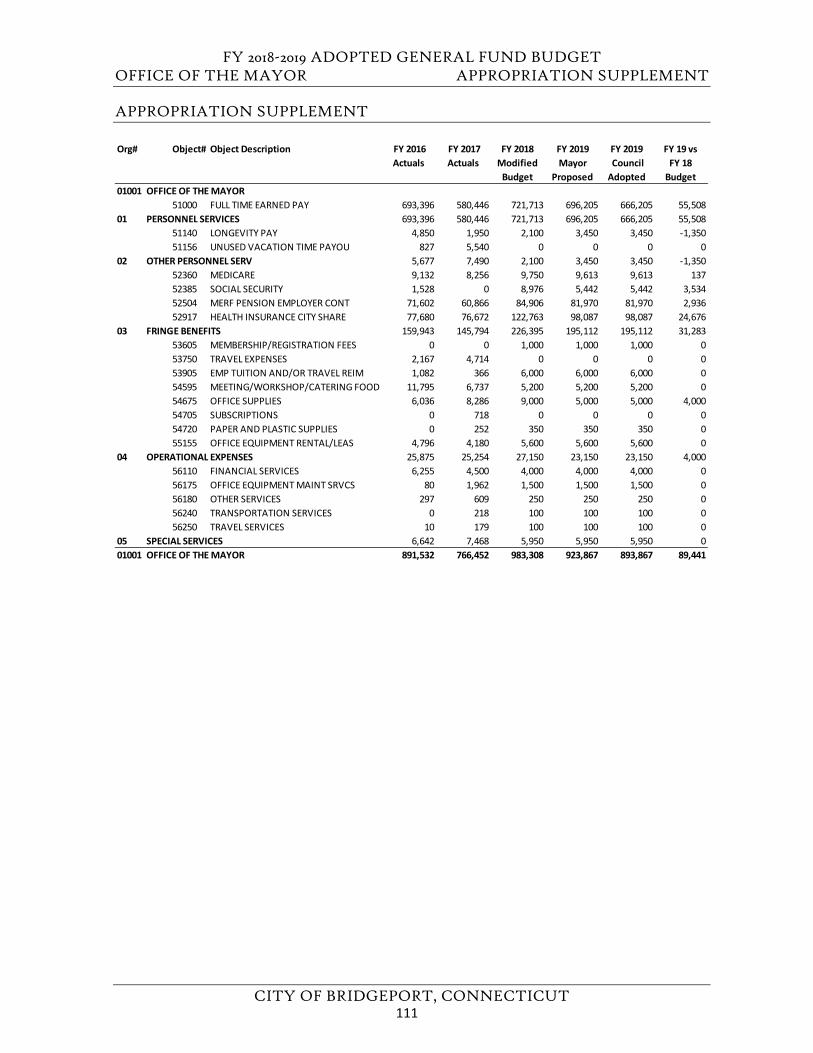
FY 2018-2019 ADOPTED GENERAL FUND BUDGET OFFICE OF THE MAYOR APPROPRIATION SUPPLEMENT
CITY OF BRIDGEPORT, CONNECTICUT
APPROPRIATION SUPPLEMENT
Org# Object# Object Description FY 2016 Actuals
FY 2017 Actuals
FY 2018 Modified
Budget
FY 2019Mayor
Proposed
FY 2019 Council Adopted
FY 19 vs FY 18
Budget01001 OFFICE OF THE MAYOR
51000 FULL TIME EARNED PAY 693,396 580,446 721,713 696,205 666,205 55,50801 PERSONNEL SERVICES 693,396 580,446 721,713 696,205 666,205 55,508
51140 LONGEVITY PAY 4,850 1,950 2,100 3,450 3,450 -1,35051156 UNUSED VACATION TIME PAYOU 827 5,540 0 0 0 0
02 OTHER PERSONNEL SERV 5,677 7,490 2,100 3,450 3,450 -1,35052360 MEDICARE 9,132 8,256 9,750 9,613 9,613 13752385 SOCIAL SECURITY 1,528 0 8,976 5,442 5,442 3,53452504 MERF PENSION EMPLOYER CONT 71,602 60,866 84,906 81,970 81,970 2,93652917 HEALTH INSURANCE CITY SHARE 77,680 76,672 122,763 98,087 98,087 24,676
03 FRINGE BENEFITS 159,943 145,794 226,395 195,112 195,112 31,28353605 MEMBERSHIP/REGISTRATION FEES 0 0 1,000 1,000 1,000 053750 TRAVEL EXPENSES 2,167 4,714 0 0 0 053905 EMP TUITION AND/OR TRAVEL REIM 1,082 366 6,000 6,000 6,000 054595 MEETING/WORKSHOP/CATERING FOOD 11,795 6,737 5,200 5,200 5,200 054675 OFFICE SUPPLIES 6,036 8,286 9,000 5,000 5,000 4,00054705 SUBSCRIPTIONS 0 718 0 0 0 054720 PAPER AND PLASTIC SUPPLIES 0 252 350 350 350 055155 OFFICE EQUIPMENT RENTAL/LEAS 4,796 4,180 5,600 5,600 5,600 0
04 OPERATIONAL EXPENSES 25,875 25,254 27,150 23,150 23,150 4,00056110 FINANCIAL SERVICES 6,255 4,500 4,000 4,000 4,000 056175 OFFICE EQUIPMENT MAINT SRVCS 80 1,962 1,500 1,500 1,500 056180 OTHER SERVICES 297 609 250 250 250 056240 TRANSPORTATION SERVICES 0 218 100 100 100 056250 TRAVEL SERVICES 10 179 100 100 100 0
05 SPECIAL SERVICES 6,642 7,468 5,950 5,950 5,950 001001 OFFICE OF THE MAYOR 891,532 766,452 983,308 923,867 893,867 89,441
111

FY 2018-2019 ADOPTED GENERAL FUND BUDGET
CITY OF BRIDGEPORT, CONNECTICUT
This page left blank intentionally.
112
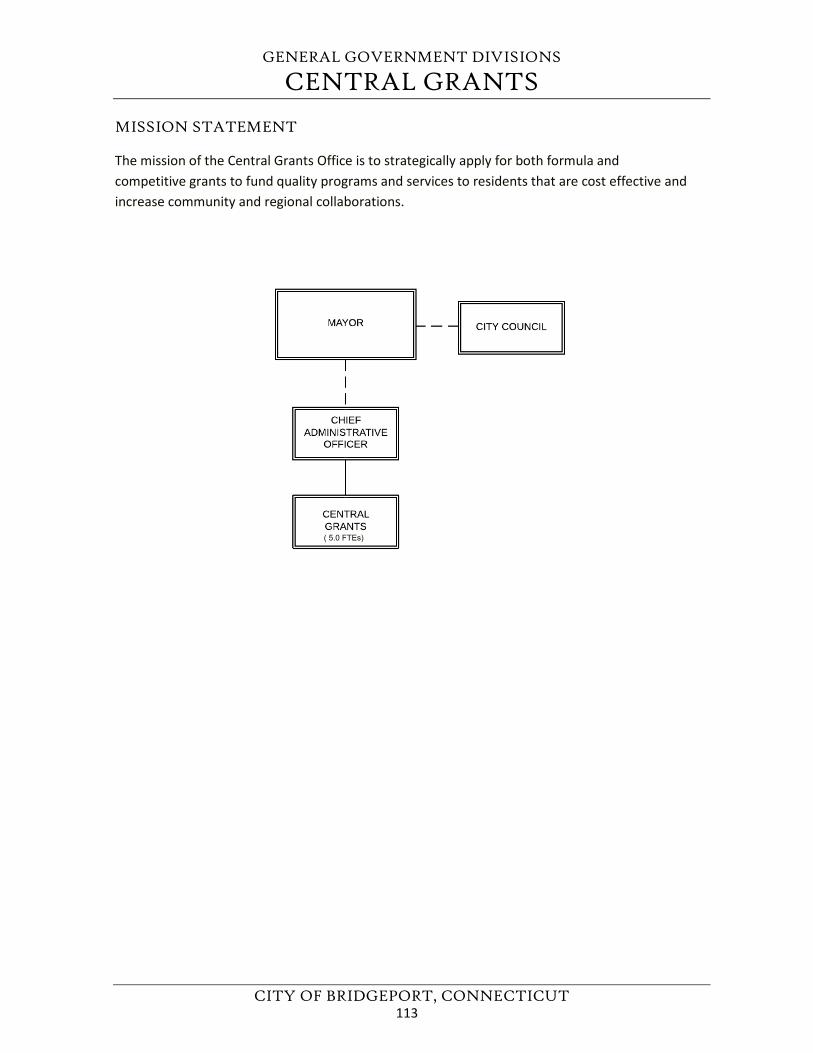
GENERAL GOVERNMENT DIVISIONS
CENTRAL GRANTS
CITY OF BRIDGEPORT, CONNECTICUT
MISSION STATEMENT
The mission of the Central Grants Office is to strategically apply for both formula and competitive grants to fund quality programs and services to residents that are cost effective and increase community and regional collaborations.
( 5.0 FTEs)
113
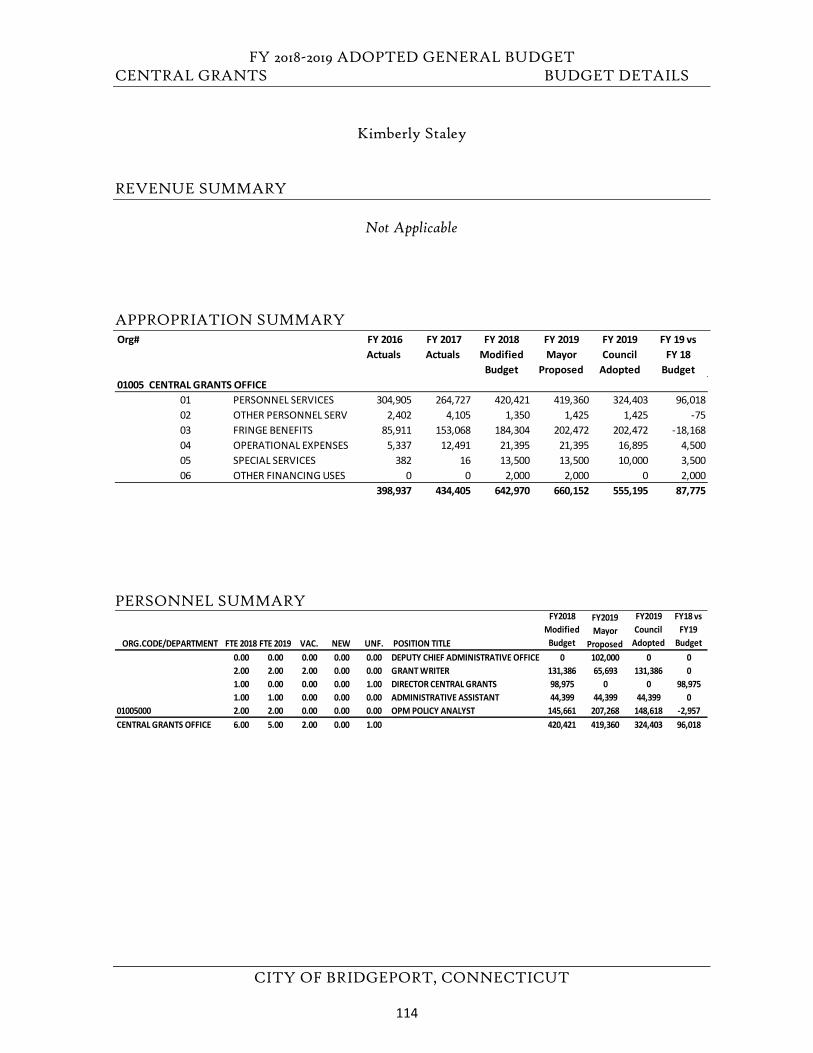
FY 2018-2019 ADOPTED GENERAL BUDGET CENTRAL GRANTS BUDGET DETAILS
CITY OF BRIDGEPORT, CONNECTICUT
Kimberly Staley
REVENUE SUMMARY
Not Applicable
APPROPRIATION SUMMARY
PERSONNEL SUMMARY
Org# FY 2016 Actuals
FY 2017 Actuals
FY 2018 Modified
Budget
FY 2019 Mayor
Proposed
FY 2019 Council
Adopted
FY 19 vs FY 18
Budget01005 CENTRAL GRANTS OFFICE
01 PERSONNEL SERVICES 304,905 264,727 420,421 419,360 324,403 96,01802 OTHER PERSONNEL SERV 2,402 4,105 1,350 1,425 1,425 -7503 FRINGE BENEFITS 85,911 153,068 184,304 202,472 202,472 -18,16804 OPERATIONAL EXPENSES 5,337 12,491 21,395 21,395 16,895 4,50005 SPECIAL SERVICES 382 16 13,500 13,500 10,000 3,50006 OTHER FINANCING USES 0 0 2,000 2,000 0 2,000
398,937 434,405 642,970 660,152 555,195 87,775
ORG.CODE/DEPARTMENT FTE 2018 FTE 2019 VAC. NEW UNF. POSITION TITLE
FY2018 Modified
Budget
FY2019 Mayor
Proposed
FY2019 Council
Adopted
FY18 vs FY19
Budget 0.00 0.00 0.00 0.00 0.00 DEPUTY CHIEF ADMINISTRATIVE OFFICE 0 102,000 0 02.00 2.00 2.00 0.00 0.00 GRANT WRITER 131,386 65,693 131,386 01.00 0.00 0.00 0.00 1.00 DIRECTOR CENTRAL GRANTS 98,975 0 0 98,9751.00 1.00 0.00 0.00 0.00 ADMINISTRATIVE ASSISTANT 44,399 44,399 44,399 0
01005000 2.00 2.00 0.00 0.00 0.00 OPM POLICY ANALYST 145,661 207,268 148,618 -2,957CENTRAL GRANTS OFFICE 6.00 5.00 2.00 0.00 1.00 420,421 419,360 324,403 96,018
114
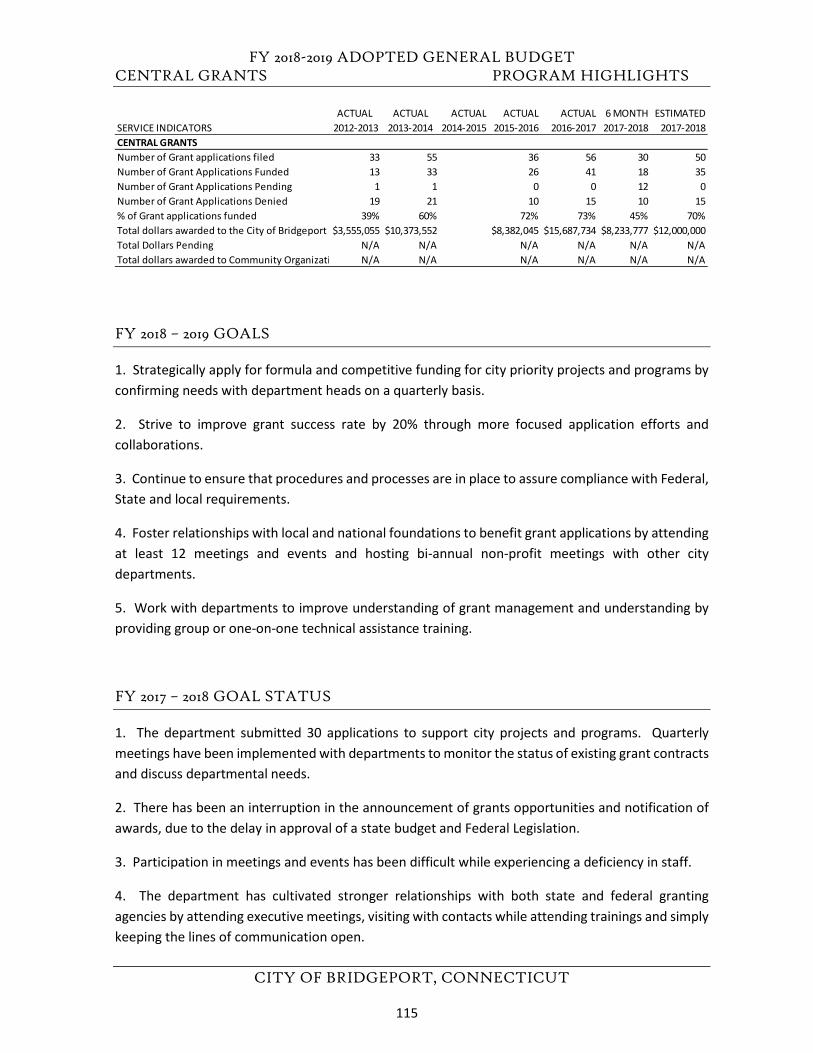
FY 2018-2019 ADOPTED GENERAL BUDGET CENTRAL GRANTS PROGRAM HIGHLIGHTS
CITY OF BRIDGEPORT, CONNECTICUT
FY 2018 – 2019 GOALS
1. Strategically apply for formula and competitive funding for city priority projects and programs byconfirming needs with department heads on a quarterly basis.
2. Strive to improve grant success rate by 20% through more focused application efforts andcollaborations.
3. Continue to ensure that procedures and processes are in place to assure compliance with Federal,State and local requirements.
4. Foster relationships with local and national foundations to benefit grant applications by attendingat least 12 meetings and events and hosting bi-annual non-profit meetings with other citydepartments.
5. Work with departments to improve understanding of grant management and understanding byproviding group or one-on-one technical assistance training.
FY 2017 – 2018 GOAL STATUS
1. The department submitted 30 applications to support city projects and programs. Quarterlymeetings have been implemented with departments to monitor the status of existing grant contracts and discuss departmental needs.
2. There has been an interruption in the announcement of grants opportunities and notification ofawards, due to the delay in approval of a state budget and Federal Legislation.
3. Participation in meetings and events has been difficult while experiencing a deficiency in staff.
4. The department has cultivated stronger relationships with both state and federal grantingagencies by attending executive meetings, visiting with contacts while attending trainings and simplykeeping the lines of communication open.
ACTUAL ACTUAL ACTUAL ACTUAL ACTUAL 6 MONTH ESTIMATEDSERVICE INDICATORS 2012-2013 2013-2014 2014-2015 2015-2016 2016-2017 2017-2018 2017-2018CENTRAL GRANTS Number of Grant applications filed 33 55 36 56 30 50Number of Grant Applications Funded 13 33 26 41 18 35Number of Grant Applications Pending 1 1 0 0 12 0Number of Grant Applications Denied 19 21 10 15 10 15% of Grant applications funded 39% 60% 72% 73% 45% 70%Total dollars awarded to the City of Bridgeport $3,555,055 $10,373,552 $8,382,045 $15,687,734 $8,233,777 $12,000,000Total Dollars Pending N/A N/A N/A N/A N/A N/ATotal dollars awarded to Community Organizati N/A N/A N/A N/A N/A N/A
115
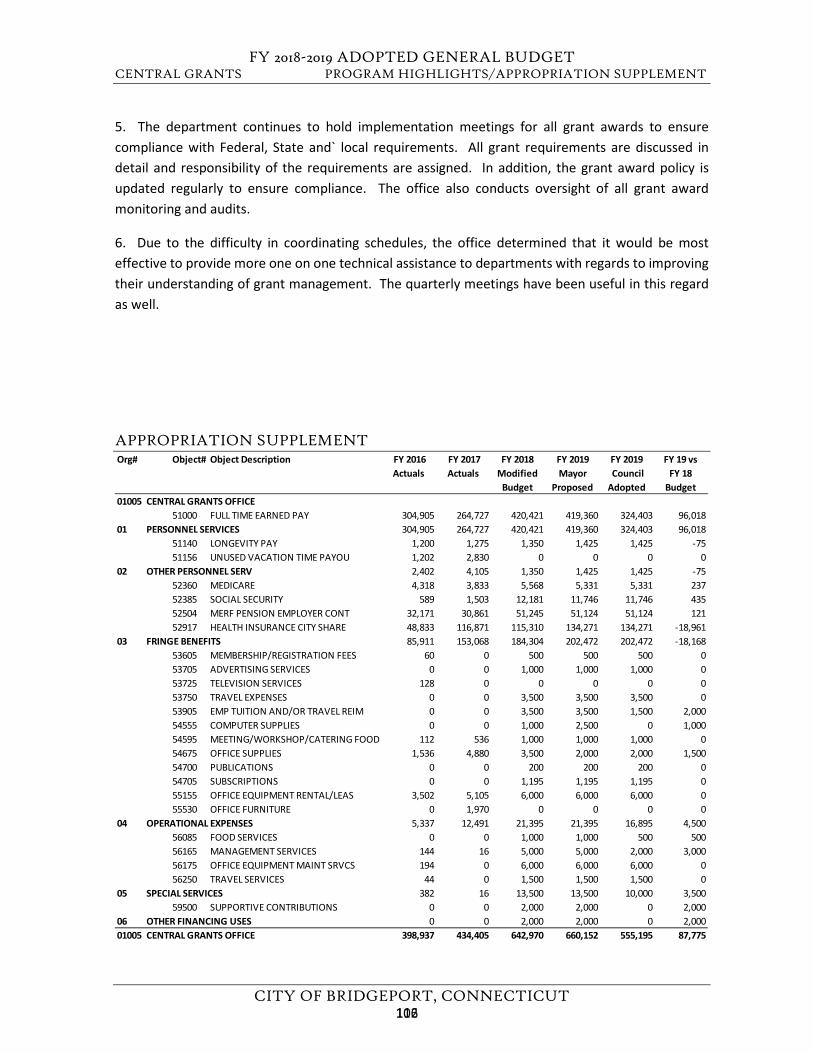
FY 2018-2019 ADOPTED GENERAL BUDGET CENTRAL GRANTS PROGRAM HIGHLIGHTS/APPROPRIATION SUPPLEMENT
CITY OF BRIDGEPORT, CONNECTICUT
5. The department continues to hold implementation meetings for all grant awards to ensurecompliance with Federal, State and` local requirements. All grant requirements are discussed indetail and responsibility of the requirements are assigned. In addition, the grant award policy isupdated regularly to ensure compliance. The office also conducts oversight of all grant awardmonitoring and audits.
6. Due to the difficulty in coordinating schedules, the office determined that it would be mosteffective to provide more one on one technical assistance to departments with regards to improvingtheir understanding of grant management. The quarterly meetings have been useful in this regardas well.
APPROPRIATION SUPPLEMENT Org# Object# Object Description FY 2016
Actuals FY 2017 Actuals
FY 2018 Modified
Budget
FY 2019Mayor
Proposed
FY 2019 Council Adopted
FY 19 vs FY 18
Budget01005 CENTRAL GRANTS OFFICE
51000 FULL TIME EARNED PAY 304,905 264,727 420,421 419,360 324,403 96,01801 PERSONNEL SERVICES 304,905 264,727 420,421 419,360 324,403 96,018
51140 LONGEVITY PAY 1,200 1,275 1,350 1,425 1,425 -7551156 UNUSED VACATION TIME PAYOU 1,202 2,830 0 0 0 0
02 OTHER PERSONNEL SERV 2,402 4,105 1,350 1,425 1,425 -7552360 MEDICARE 4,318 3,833 5,568 5,331 5,331 23752385 SOCIAL SECURITY 589 1,503 12,181 11,746 11,746 43552504 MERF PENSION EMPLOYER CONT 32,171 30,861 51,245 51,124 51,124 12152917 HEALTH INSURANCE CITY SHARE 48,833 116,871 115,310 134,271 134,271 -18,961
03 FRINGE BENEFITS 85,911 153,068 184,304 202,472 202,472 -18,16853605 MEMBERSHIP/REGISTRATION FEES 60 0 500 500 500 053705 ADVERTISING SERVICES 0 0 1,000 1,000 1,000 053725 TELEVISION SERVICES 128 0 0 0 0 053750 TRAVEL EXPENSES 0 0 3,500 3,500 3,500 053905 EMP TUITION AND/OR TRAVEL REIM 0 0 3,500 3,500 1,500 2,00054555 COMPUTER SUPPLIES 0 0 1,000 2,500 0 1,00054595 MEETING/WORKSHOP/CATERING FOOD 112 536 1,000 1,000 1,000 054675 OFFICE SUPPLIES 1,536 4,880 3,500 2,000 2,000 1,50054700 PUBLICATIONS 0 0 200 200 200 054705 SUBSCRIPTIONS 0 0 1,195 1,195 1,195 055155 OFFICE EQUIPMENT RENTAL/LEAS 3,502 5,105 6,000 6,000 6,000 055530 OFFICE FURNITURE 0 1,970 0 0 0 0
04 OPERATIONAL EXPENSES 5,337 12,491 21,395 21,395 16,895 4,50056085 FOOD SERVICES 0 0 1,000 1,000 500 50056165 MANAGEMENT SERVICES 144 16 5,000 5,000 2,000 3,00056175 OFFICE EQUIPMENT MAINT SRVCS 194 0 6,000 6,000 6,000 056250 TRAVEL SERVICES 44 0 1,500 1,500 1,500 0
05 SPECIAL SERVICES 382 16 13,500 13,500 10,000 3,50059500 SUPPORTIVE CONTRIBUTIONS 0 0 2,000 2,000 0 2,000
06 OTHER FINANCING USES 0 0 2,000 2,000 0 2,00001005 CENTRAL GRANTS OFFICE 398,937 434,405 642,970 660,152 555,195 87,775
102116
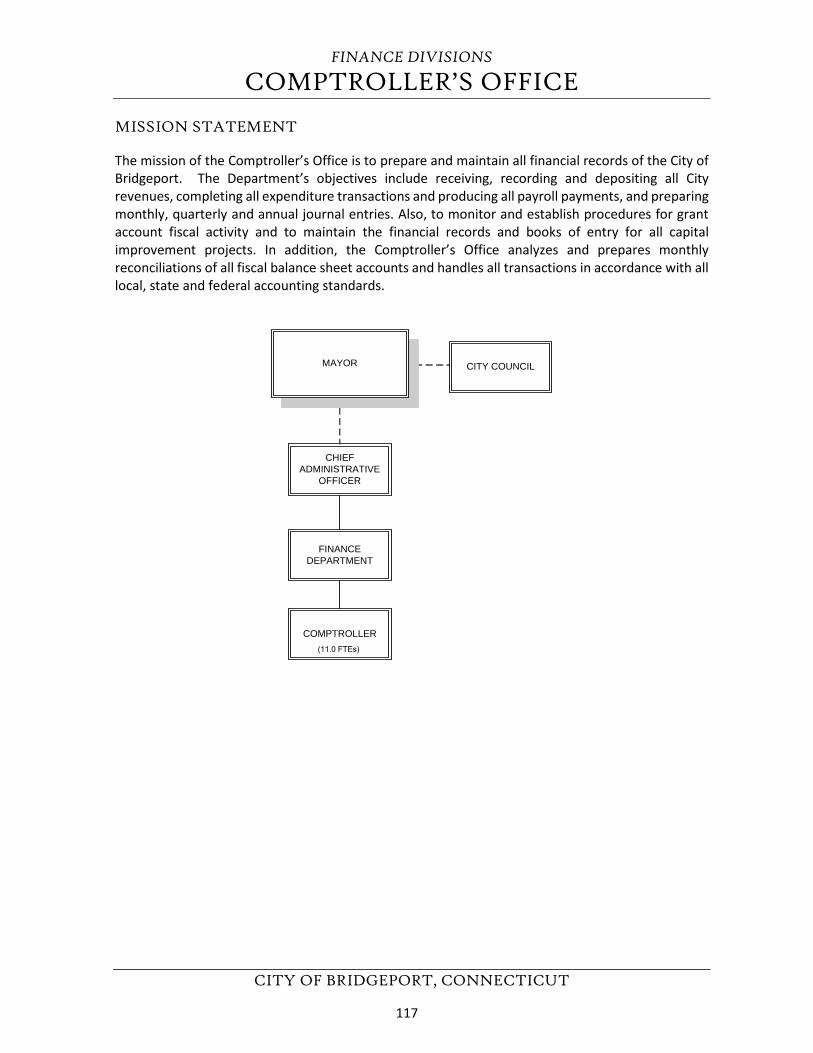
FINANCE DIVISIONS
COMPTROLLER’S OFFICE
CITY OF BRIDGEPORT, CONNECTICUT
MISSION STATEMENT
The mission of the Comptroller’s Office is to prepare and maintain all financial records of the City of Bridgeport. The Department’s objectives include receiving, recording and depositing all City revenues, completing all expenditure transactions and producing all payroll payments, and preparing monthly, quarterly and annual journal entries. Also, to monitor and establish procedures for grant account fiscal activity and to maintain the financial records and books of entry for all capital improvement projects. In addition, the Comptroller’s Office analyzes and prepares monthly reconciliations of all fiscal balance sheet accounts and handles all transactions in accordance with all local, state and federal accounting standards.
CHIEFADMINISTRATIVE
OFFICER
FINANCEDEPARTMENT
MAYOR CITY COUNCIL
COMPTROLLER(11.0 FTEs)
117
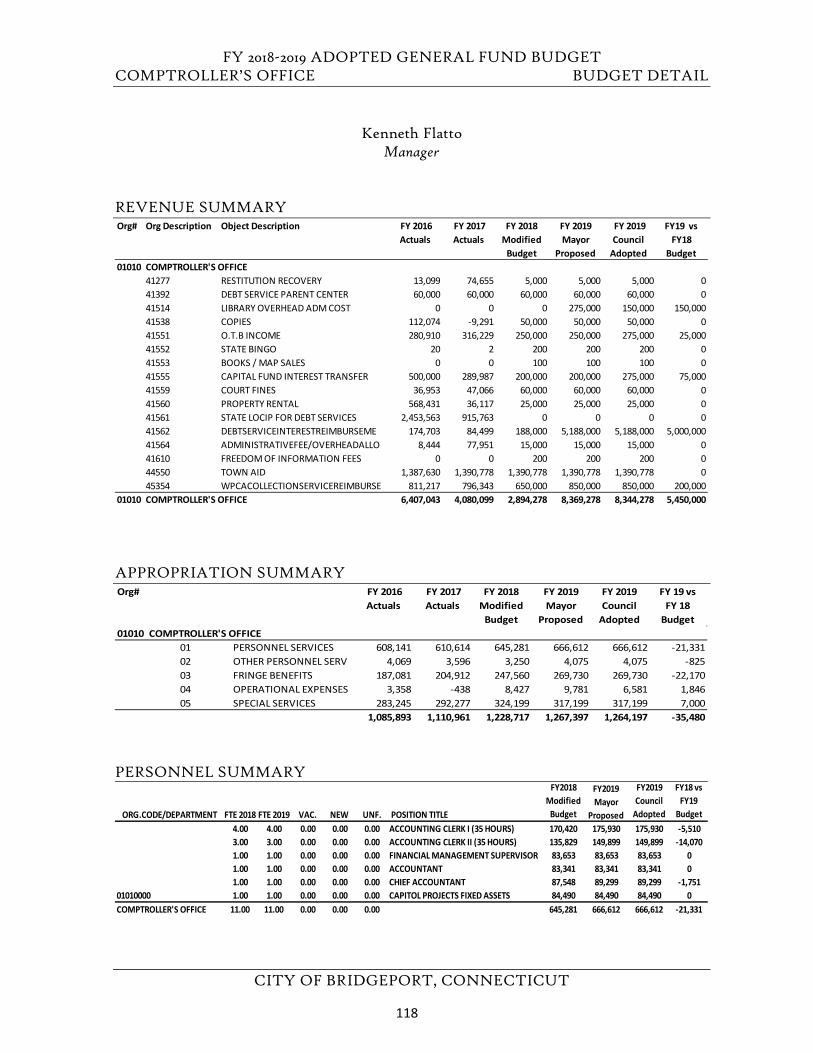
FY 2018-2019 ADOPTED GENERAL FUND BUDGET COMPTROLLER’S OFFICE BUDGET DETAIL
CITY OF BRIDGEPORT, CONNECTICUT
Kenneth Flatto Manager
REVENUE SUMMARY
APPROPRIATION SUMMARY
PERSONNEL SUMMARY
Org# Org Description Object Description FY 2016 Actuals
FY 2017 Actuals
FY 2018 Modified
Budget
FY 2019 Mayor
Proposed
FY 2019 Council
Adopted
FY19 vs FY18
Budget01010 COMPTROLLER'S OFFICE
41277 RESTITUTION RECOVERY 13,099 74,655 5,000 5,000 5,000 041392 DEBT SERVICE PARENT CENTER 60,000 60,000 60,000 60,000 60,000 041514 LIBRARY OVERHEAD ADM COST 0 0 0 275,000 150,000 150,00041538 COPIES 112,074 -9,291 50,000 50,000 50,000 041551 O.T.B INCOME 280,910 316,229 250,000 250,000 275,000 25,00041552 STATE BINGO 20 2 200 200 200 041553 BOOKS / MAP SALES 0 0 100 100 100 041555 CAPITAL FUND INTEREST TRANSFER 500,000 289,987 200,000 200,000 275,000 75,00041559 COURT FINES 36,953 47,066 60,000 60,000 60,000 041560 PROPERTY RENTAL 568,431 36,117 25,000 25,000 25,000 041561 STATE LOCIP FOR DEBT SERVICES 2,453,563 915,763 0 0 0 041562 DEBTSERVICEINTERESTREIMBURSEME 174,703 84,499 188,000 5,188,000 5,188,000 5,000,00041564 ADMINISTRATIVEFEE/OVERHEADALLO 8,444 77,951 15,000 15,000 15,000 041610 FREEDOM OF INFORMATION FEES 0 0 200 200 200 044550 TOWN AID 1,387,630 1,390,778 1,390,778 1,390,778 1,390,778 045354 WPCACOLLECTIONSERVICEREIMBURSE 811,217 796,343 650,000 850,000 850,000 200,000
01010 COMPTROLLER'S OFFICE 6,407,043 4,080,099 2,894,278 8,369,278 8,344,278 5,450,000
Org# FY 2016 Actuals
FY 2017 Actuals
FY 2018 Modified
Budget
FY 2019 Mayor
Proposed
FY 2019 Council
Adopted
FY 19 vs FY 18
Budget01010 COMPTROLLER'S OFFICE
01 PERSONNEL SERVICES 608,141 610,614 645,281 666,612 666,612 -21,33102 OTHER PERSONNEL SERV 4,069 3,596 3,250 4,075 4,075 -82503 FRINGE BENEFITS 187,081 204,912 247,560 269,730 269,730 -22,17004 OPERATIONAL EXPENSES 3,358 -438 8,427 9,781 6,581 1,84605 SPECIAL SERVICES 283,245 292,277 324,199 317,199 317,199 7,000
1,085,893 1,110,961 1,228,717 1,267,397 1,264,197 -35,480
ORG.CODE/DEPARTMENT FTE 2018 FTE 2019 VAC. NEW UNF. POSITION TITLE
FY2018 Modified
Budget
FY2019 Mayor
Proposed
FY2019 Council
Adopted
FY18 vs FY19
Budget 4.00 4.00 0.00 0.00 0.00 ACCOUNTING CLERK I (35 HOURS) 170,420 175,930 175,930 -5,5103.00 3.00 0.00 0.00 0.00 ACCOUNTING CLERK II (35 HOURS) 135,829 149,899 149,899 -14,0701.00 1.00 0.00 0.00 0.00 FINANCIAL MANAGEMENT SUPERVISOR 83,653 83,653 83,653 01.00 1.00 0.00 0.00 0.00 ACCOUNTANT 83,341 83,341 83,341 01.00 1.00 0.00 0.00 0.00 CHIEF ACCOUNTANT 87,548 89,299 89,299 -1,751
01010000 1.00 1.00 0.00 0.00 0.00 CAPITOL PROJECTS FIXED ASSETS 84,490 84,490 84,490 0COMPTROLLER'S OFFICE 11.00 11.00 0.00 0.00 0.00 645,281 666,612 666,612 -21,331
118
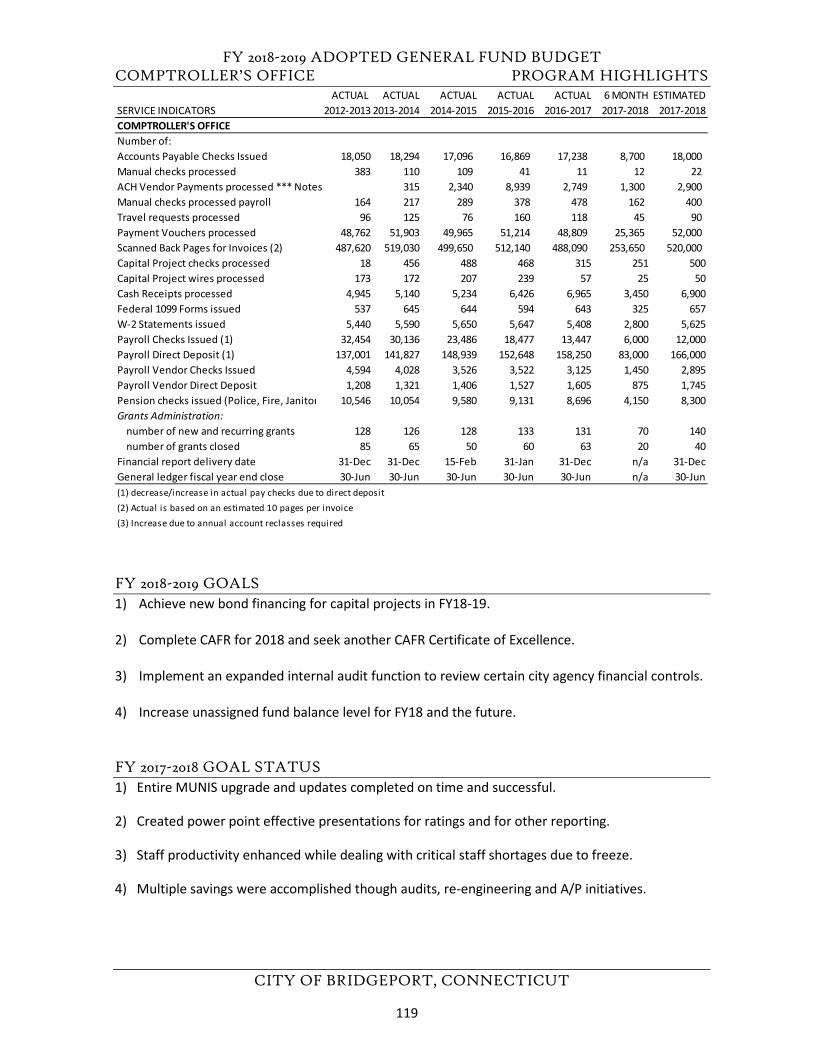
FY 2018-2019 ADOPTED GENERAL FUND BUDGET COMPTROLLER’S OFFICE PROGRAM HIGHLIGHTS
CITY OF BRIDGEPORT, CONNECTICUT
FY 2018-2019 GOALS 1) Achieve new bond financing for capital projects in FY18-19.
2) Complete CAFR for 2018 and seek another CAFR Certificate of Excellence.
3) Implement an expanded internal audit function to review certain city agency financial controls.
4) Increase unassigned fund balance level for FY18 and the future.
FY 2017-2018 GOAL STATUS 1) Entire MUNIS upgrade and updates completed on time and successful.
2) Created power point effective presentations for ratings and for other reporting.
3) Staff productivity enhanced while dealing with critical staff shortages due to freeze.
4) Multiple savings were accomplished though audits, re-engineering and A/P initiatives.
ACTUAL ACTUAL ACTUAL ACTUAL ACTUAL 6 MONTH ESTIMATEDSERVICE INDICATORS 2012-2013 2013-2014 2014-2015 2015-2016 2016-2017 2017-2018 2017-2018COMPTROLLER'S OFFICENumber of:Accounts Payable Checks Issued 18,050 18,294 17,096 16,869 17,238 8,700 18,000 Manual checks processed 383 110 109 41 11 12 22 ACH Vendor Payments processed *** Notes 315 2,340 8,939 2,749 1,300 2,900 Manual checks processed payroll 164 217 289 378 478 162 400 Travel requests processed 96 125 76 160 118 45 90 Payment Vouchers processed 48,762 51,903 49,965 51,214 48,809 25,365 52,000 Scanned Back Pages for Invoices (2) 487,620 519,030 499,650 512,140 488,090 253,650 520,000 Capital Project checks processed 18 456 488 468 315 251 500Capital Project wires processed 173 172 207 239 57 25 50Cash Receipts processed 4,945 5,140 5,234 6,426 6,965 3,450 6,900Federal 1099 Forms issued 537 645 644 594 643 325 657W-2 Statements issued 5,440 5,590 5,650 5,647 5,408 2,800 5,625Payroll Checks Issued (1) 32,454 30,136 23,486 18,477 13,447 6,000 12,000Payroll Direct Deposit (1) 137,001 141,827 148,939 152,648 158,250 83,000 166,000Payroll Vendor Checks Issued 4,594 4,028 3,526 3,522 3,125 1,450 2,895Payroll Vendor Direct Deposit 1,208 1,321 1,406 1,527 1,605 875 1,745Pension checks issued (Police, Fire, Janitor 10,546 10,054 9,580 9,131 8,696 4,150 8,300Grants Administration:
number of new and recurring grants 128 126 128 133 131 70 140number of grants closed 85 65 50 60 63 20 40
Financial report delivery date 31-Dec 31-Dec 15-Feb 31-Jan 31-Dec n/a 31-DecGeneral ledger fiscal year end close 30-Jun 30-Jun 30-Jun 30-Jun 30-Jun n/a 30-Jun(1) decrease/increase in actual pay checks due to direct deposit(2) Actual is based on an estimated 10 pages per invoice(3) Increase due to annual account reclasses required
119
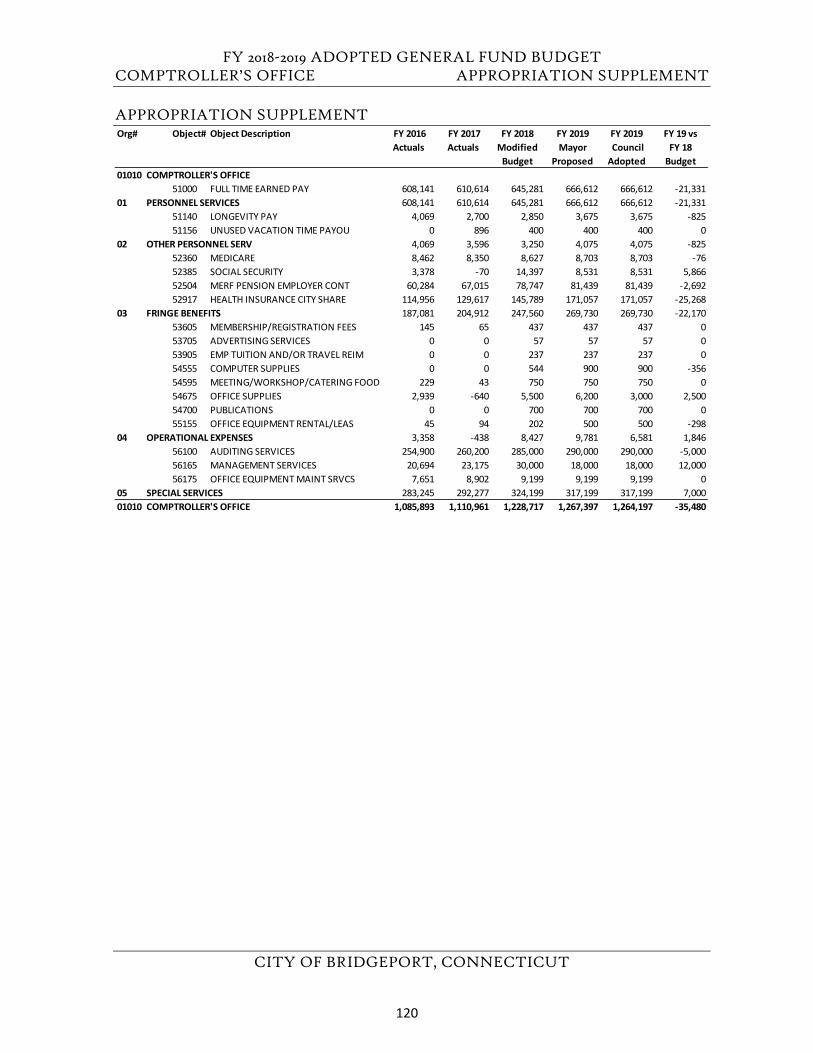
FY 2018-2019 ADOPTED GENERAL FUND BUDGET COMPTROLLER’S OFFICE APPROPRIATION SUPPLEMENT
CITY OF BRIDGEPORT, CONNECTICUT
APPROPRIATION SUPPLEMENT Org# Object# Object Description FY 2016
Actuals FY 2017 Actuals
FY 2018 Modified
Budget
FY 2019Mayor
Proposed
FY 2019 Council Adopted
FY 19 vs FY 18
Budget01010 COMPTROLLER'S OFFICE
51000 FULL TIME EARNED PAY 608,141 610,614 645,281 666,612 666,612 -21,33101 PERSONNEL SERVICES 608,141 610,614 645,281 666,612 666,612 -21,331
51140 LONGEVITY PAY 4,069 2,700 2,850 3,675 3,675 -82551156 UNUSED VACATION TIME PAYOU 0 896 400 400 400 0
02 OTHER PERSONNEL SERV 4,069 3,596 3,250 4,075 4,075 -82552360 MEDICARE 8,462 8,350 8,627 8,703 8,703 -7652385 SOCIAL SECURITY 3,378 -70 14,397 8,531 8,531 5,86652504 MERF PENSION EMPLOYER CONT 60,284 67,015 78,747 81,439 81,439 -2,69252917 HEALTH INSURANCE CITY SHARE 114,956 129,617 145,789 171,057 171,057 -25,268
03 FRINGE BENEFITS 187,081 204,912 247,560 269,730 269,730 -22,17053605 MEMBERSHIP/REGISTRATION FEES 145 65 437 437 437 053705 ADVERTISING SERVICES 0 0 57 57 57 053905 EMP TUITION AND/OR TRAVEL REIM 0 0 237 237 237 054555 COMPUTER SUPPLIES 0 0 544 900 900 -35654595 MEETING/WORKSHOP/CATERING FOOD 229 43 750 750 750 054675 OFFICE SUPPLIES 2,939 -640 5,500 6,200 3,000 2,50054700 PUBLICATIONS 0 0 700 700 700 055155 OFFICE EQUIPMENT RENTAL/LEAS 45 94 202 500 500 -298
04 OPERATIONAL EXPENSES 3,358 -438 8,427 9,781 6,581 1,84656100 AUDITING SERVICES 254,900 260,200 285,000 290,000 290,000 -5,00056165 MANAGEMENT SERVICES 20,694 23,175 30,000 18,000 18,000 12,00056175 OFFICE EQUIPMENT MAINT SRVCS 7,651 8,902 9,199 9,199 9,199 0
05 SPECIAL SERVICES 283,245 292,277 324,199 317,199 317,199 7,00001010 COMPTROLLER'S OFFICE 1,085,893 1,110,961 1,228,717 1,267,397 1,264,197 -35,480
120
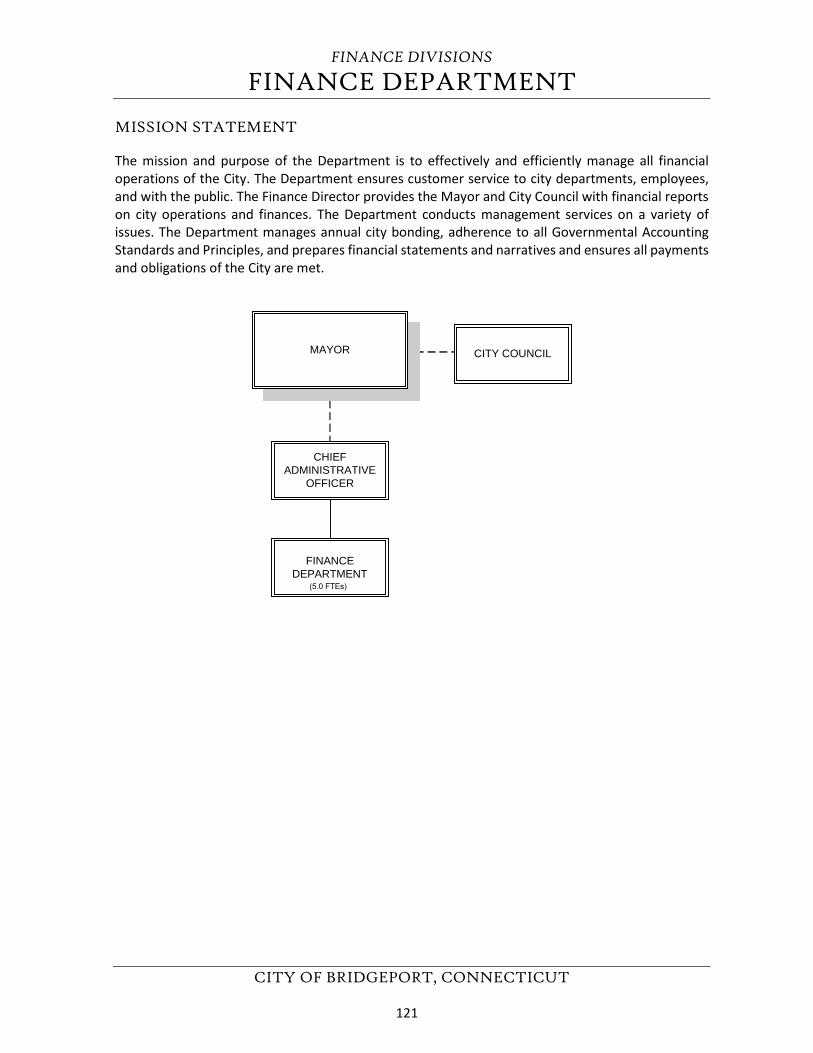
FINANCE DIVISIONS
FINANCE DEPARTMENT
CITY OF BRIDGEPORT, CONNECTICUT
MISSION STATEMENT
The mission and purpose of the Department is to effectively and efficiently manage all financial operations of the City. The Department ensures customer service to city departments, employees, and with the public. The Finance Director provides the Mayor and City Council with financial reports on city operations and finances. The Department conducts management services on a variety of issues. The Department manages annual city bonding, adherence to all Governmental Accounting Standards and Principles, and prepares financial statements and narratives and ensures all payments and obligations of the City are met.
CHIEFADMINISTRATIVE
OFFICER
FINANCEDEPARTMENT
MAYOR CITY COUNCIL
(5.0 FTEs)
121
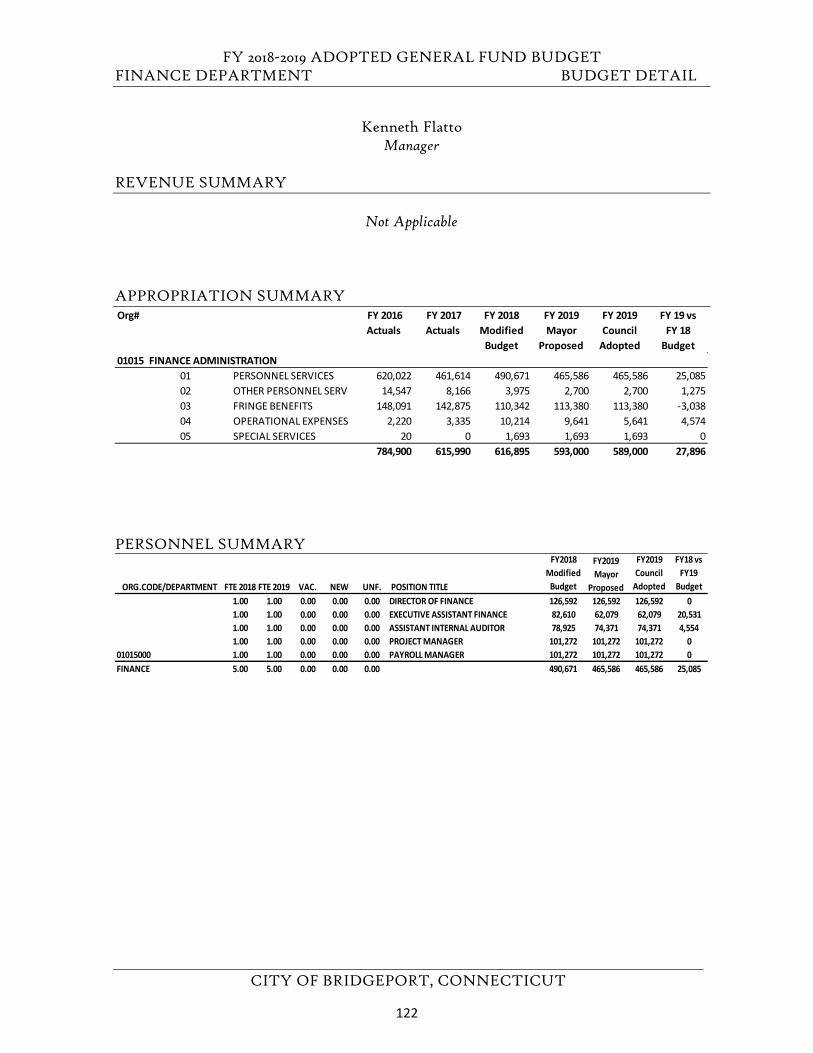
FY 2018-2019 ADOPTED GENERAL FUND BUDGET FINANCE DEPARTMENT BUDGET DETAIL
CITY OF BRIDGEPORT, CONNECTICUT
Kenneth Flatto Manager
REVENUE SUMMARY
Not Applicable
APPROPRIATION SUMMARY
PERSONNEL SUMMARY
Org# FY 2016 Actuals
FY 2017 Actuals
FY 2018 Modified
Budget
FY 2019 Mayor
Proposed
FY 2019 Council
Adopted
FY 19 vs FY 18
Budget01015 FINANCE ADMINISTRATION
01 PERSONNEL SERVICES 620,022 461,614 490,671 465,586 465,586 25,08502 OTHER PERSONNEL SERV 14,547 8,166 3,975 2,700 2,700 1,27503 FRINGE BENEFITS 148,091 142,875 110,342 113,380 113,380 -3,03804 OPERATIONAL EXPENSES 2,220 3,335 10,214 9,641 5,641 4,57405 SPECIAL SERVICES 20 0 1,693 1,693 1,693 0
784,900 615,990 616,895 593,000 589,000 27,896
ORG.CODE/DEPARTMENT FTE 2018 FTE 2019 VAC. NEW UNF. POSITION TITLE
FY2018 Modified
Budget
FY2019 Mayor
Proposed
FY2019 Council
Adopted
FY18 vs FY19
Budget 1.00 1.00 0.00 0.00 0.00 DIRECTOR OF FINANCE 126,592 126,592 126,592 01.00 1.00 0.00 0.00 0.00 EXECUTIVE ASSISTANT FINANCE 82,610 62,079 62,079 20,5311.00 1.00 0.00 0.00 0.00 ASSISTANT INTERNAL AUDITOR 78,925 74,371 74,371 4,5541.00 1.00 0.00 0.00 0.00 PROJECT MANAGER 101,272 101,272 101,272 0
01015000 1.00 1.00 0.00 0.00 0.00 PAYROLL MANAGER 101,272 101,272 101,272 0FINANCE 5.00 5.00 0.00 0.00 0.00 490,671 465,586 465,586 25,085
122
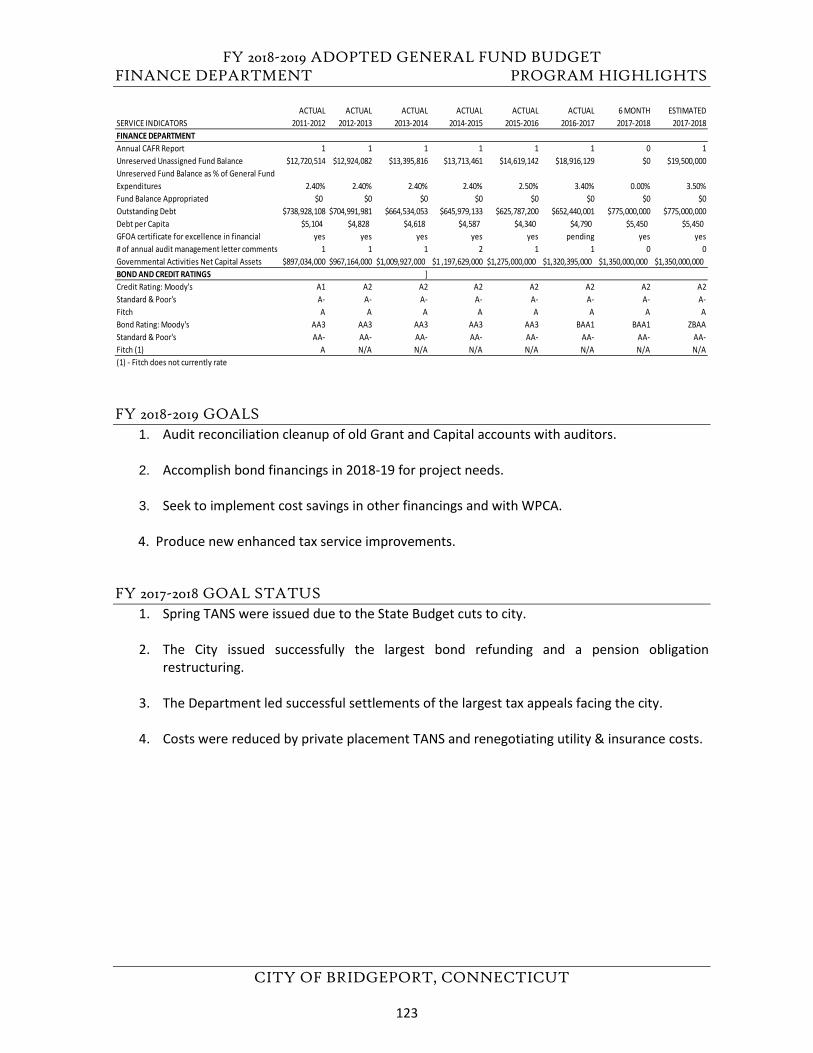
FY 2018-2019 ADOPTED GENERAL FUND BUDGET FINANCE DEPARTMENT PROGRAM HIGHLIGHTS
CITY OF BRIDGEPORT, CONNECTICUT
FY 2018-2019 GOALS 1. Audit reconciliation cleanup of old Grant and Capital accounts with auditors.
2. Accomplish bond financings in 2018-19 for project needs.
3. Seek to implement cost savings in other financings and with WPCA.
4. Produce new enhanced tax service improvements.
FY 2017-2018 GOAL STATUS 1. Spring TANS were issued due to the State Budget cuts to city.
2. The City issued successfully the largest bond refunding and a pension obligationrestructuring.
3. The Department led successful settlements of the largest tax appeals facing the city.
4. Costs were reduced by private placement TANS and renegotiating utility & insurance costs.
ACTUAL ACTUAL ACTUAL ACTUAL ACTUAL ACTUAL 6 MONTH ESTIMATEDSERVICE INDICATORS 2011-2012 2012-2013 2013-2014 2014-2015 2015-2016 2016-2017 2017-2018 2017-2018FINANCE DEPARTMENTAnnual CAFR Report 1 1 1 1 1 1 0 1Unreserved Unassigned Fund Balance $12,720,514 $12,924,082 $13,395,816 $13,713,461 $14,619,142 $18,916,129 $0 $19,500,000Unreserved Fund Balance as % of General Fund Expenditures 2.40% 2.40% 2.40% 2.40% 2.50% 3.40% 0.00% 3.50%Fund Balance Appropriated $0 $0 $0 $0 $0 $0 $0 $0Outstanding Debt $738,928,108 $704,991,981 $664,534,053 $645,979,133 $625,787,200 $652,440,001 $775,000,000 $775,000,000Debt per Capita $5,104 $4,828 $4,618 $4,587 $4,340 $4,790 $5,450 $5,450GFOA certificate for excellence in financial yes yes yes yes yes pending yes yes# of annual audit management letter comments 1 1 1 2 1 1 0 0Governmental Activities Net Capital Assets $897,034,000 $967,164,000 $1,009,927,000 $1 ,197,629,000 $1,275,000,000 $1,320,395,000 $1,350,000,000 $1,350,000,000BOND AND CREDIT RATINGS ]Credit Rating: Moody's A1 A2 A2 A2 A2 A2 A2 A2Standard & Poor's A- A- A- A- A- A- A- A-Fitch A A A A A A A ABond Rating: Moody's AA3 AA3 AA3 AA3 AA3 BAA1 BAA1 ZBAAStandard & Poor's AA- AA- AA- AA- AA- AA- AA- AA-Fitch (1) A N/A N/A N/A N/A N/A N/A N/A(1) - Fitch does not currently rate
123
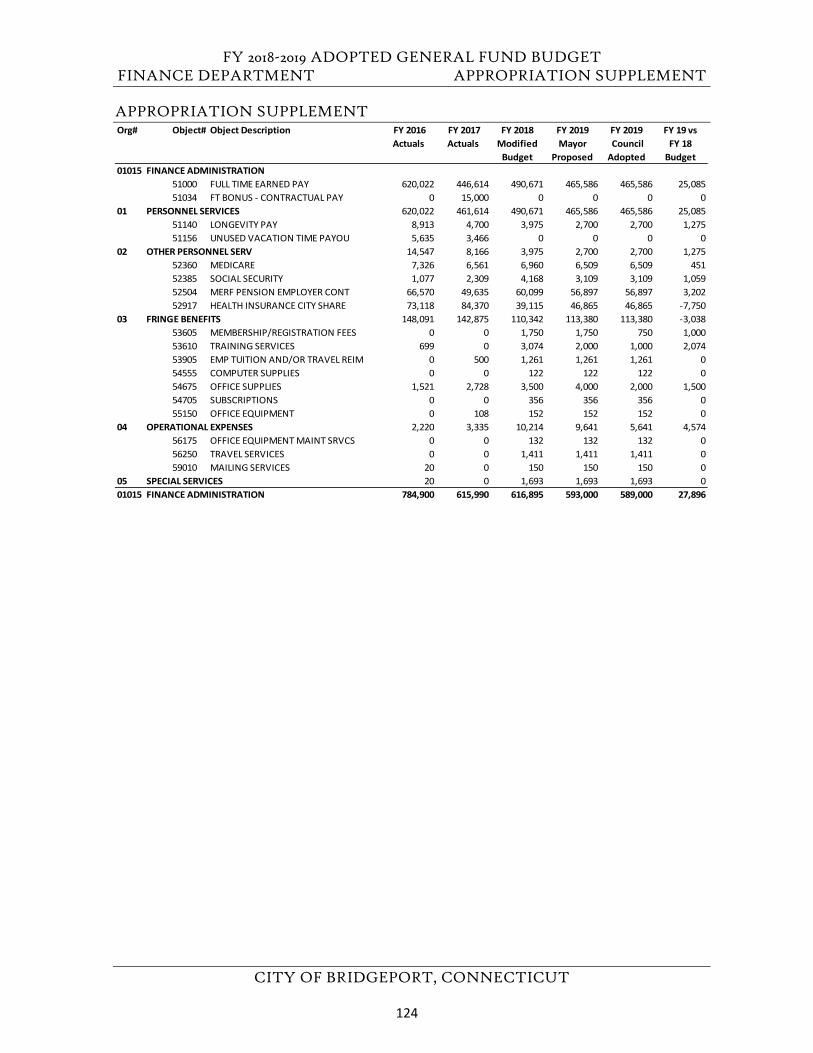
FY 2018-2019 ADOPTED GENERAL FUND BUDGET FINANCE DEPARTMENT APPROPRIATION SUPPLEMENT
CITY OF BRIDGEPORT, CONNECTICUT
APPROPRIATION SUPPLEMENT Org# Object# Object Description FY 2016
Actuals FY 2017 Actuals
FY 2018 Modified
Budget
FY 2019Mayor
Proposed
FY 2019 Council Adopted
FY 19 vs FY 18
Budget01015 FINANCE ADMINISTRATION
51000 FULL TIME EARNED PAY 620,022 446,614 490,671 465,586 465,586 25,08551034 FT BONUS - CONTRACTUAL PAY 0 15,000 0 0 0 0
01 PERSONNEL SERVICES 620,022 461,614 490,671 465,586 465,586 25,08551140 LONGEVITY PAY 8,913 4,700 3,975 2,700 2,700 1,27551156 UNUSED VACATION TIME PAYOU 5,635 3,466 0 0 0 0
02 OTHER PERSONNEL SERV 14,547 8,166 3,975 2,700 2,700 1,27552360 MEDICARE 7,326 6,561 6,960 6,509 6,509 45152385 SOCIAL SECURITY 1,077 2,309 4,168 3,109 3,109 1,05952504 MERF PENSION EMPLOYER CONT 66,570 49,635 60,099 56,897 56,897 3,20252917 HEALTH INSURANCE CITY SHARE 73,118 84,370 39,115 46,865 46,865 -7,750
03 FRINGE BENEFITS 148,091 142,875 110,342 113,380 113,380 -3,03853605 MEMBERSHIP/REGISTRATION FEES 0 0 1,750 1,750 750 1,00053610 TRAINING SERVICES 699 0 3,074 2,000 1,000 2,07453905 EMP TUITION AND/OR TRAVEL REIM 0 500 1,261 1,261 1,261 054555 COMPUTER SUPPLIES 0 0 122 122 122 054675 OFFICE SUPPLIES 1,521 2,728 3,500 4,000 2,000 1,50054705 SUBSCRIPTIONS 0 0 356 356 356 055150 OFFICE EQUIPMENT 0 108 152 152 152 0
04 OPERATIONAL EXPENSES 2,220 3,335 10,214 9,641 5,641 4,57456175 OFFICE EQUIPMENT MAINT SRVCS 0 0 132 132 132 056250 TRAVEL SERVICES 0 0 1,411 1,411 1,411 059010 MAILING SERVICES 20 0 150 150 150 0
05 SPECIAL SERVICES 20 0 1,693 1,693 1,693 001015 FINANCE ADMINISTRATION 784,900 615,990 616,895 593,000 589,000 27,896
124
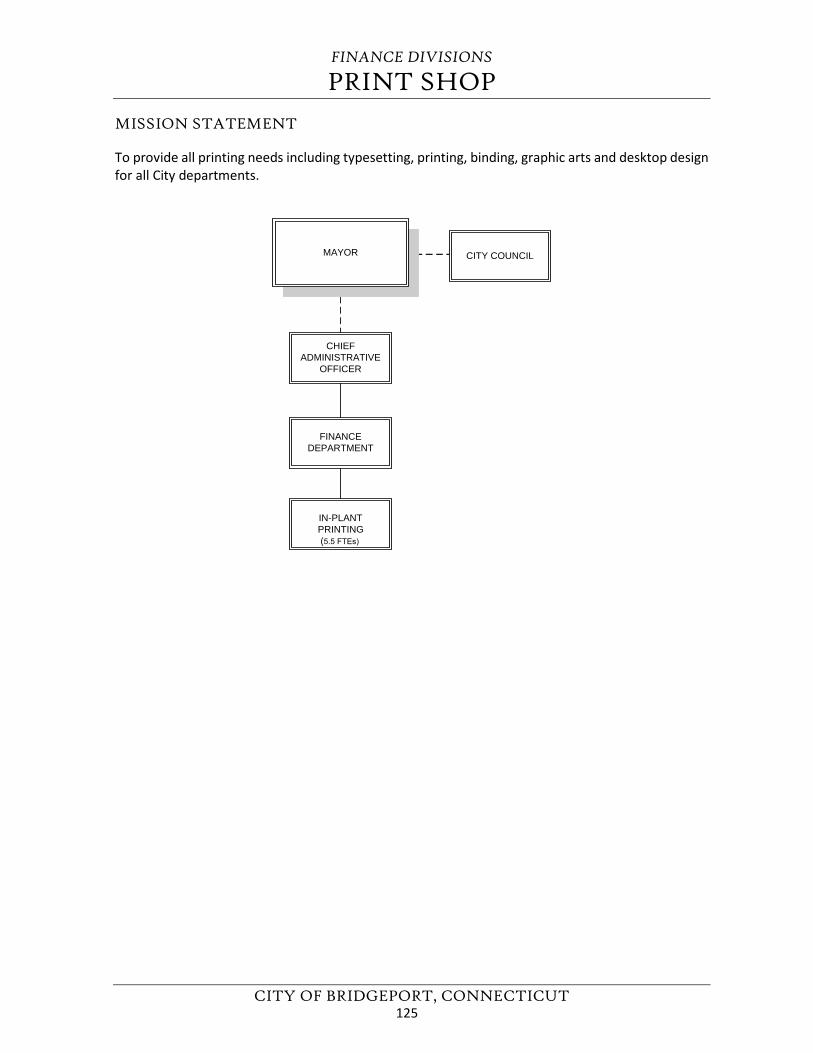
FINANCE DIVISIONS
PRINT SHOP
CITY OF BRIDGEPORT, CONNECTICUT
MISSION STATEMENT
To provide all printing needs including typesetting, printing, binding, graphic arts and desktop design for all City departments.
CHIEFADMINISTRATIVE
OFFICER
FINANCEDEPARTMENT
IN-PLANTPRINTING (5.5 FTEs)
MAYOR CITY COUNCIL
125
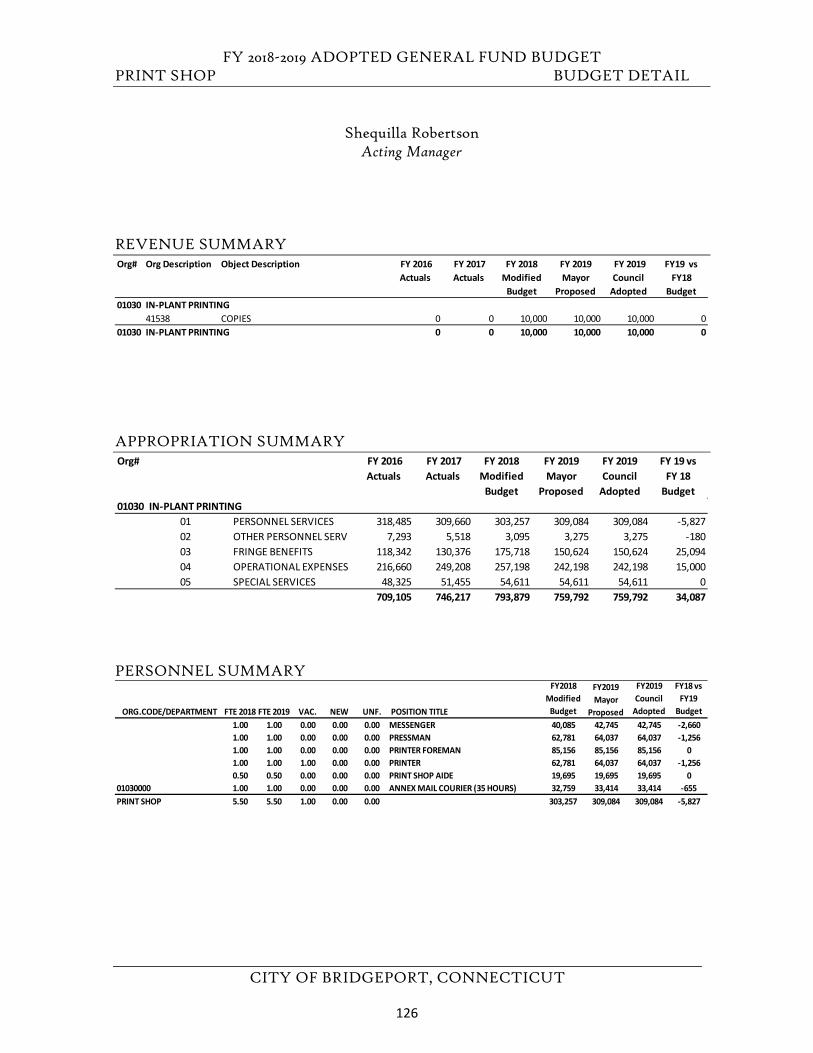
FY 2018-2019 ADOPTED GENERAL FUND BUDGET PRINT SHOP BUDGET DETAIL
CITY OF BRIDGEPORT, CONNECTICUT
Shequilla Robertson Acting Manager
REVENUE SUMMARY
APPROPRIATION SUMMARY
PERSONNEL SUMMARY
Org# Org Description Object Description FY 2016 Actuals
FY 2017 Actuals
FY 2018 Modified
Budget
FY 2019 Mayor
Proposed
FY 2019 Council
Adopted
FY19 vs FY18
Budget01030 IN-PLANT PRINTING
41538 COPIES 0 0 10,000 10,000 10,000 001030 IN-PLANT PRINTING 0 0 10,000 10,000 10,000 0
Org# FY 2016 Actuals
FY 2017 Actuals
FY 2018 Modified
Budget
FY 2019 Mayor
Proposed
FY 2019 Council
Adopted
FY 19 vs FY 18
Budget01030 IN-PLANT PRINTING
01 PERSONNEL SERVICES 318,485 309,660 303,257 309,084 309,084 -5,82702 OTHER PERSONNEL SERV 7,293 5,518 3,095 3,275 3,275 -18003 FRINGE BENEFITS 118,342 130,376 175,718 150,624 150,624 25,09404 OPERATIONAL EXPENSES 216,660 249,208 257,198 242,198 242,198 15,00005 SPECIAL SERVICES 48,325 51,455 54,611 54,611 54,611 0
709,105 746,217 793,879 759,792 759,792 34,087
ORG.CODE/DEPARTMENT FTE 2018 FTE 2019 VAC. NEW UNF. POSITION TITLE
FY2018 Modified
Budget
FY2019 Mayor
Proposed
FY2019 Council
Adopted
FY18 vs FY19
Budget 1.00 1.00 0.00 0.00 0.00 MESSENGER 40,085 42,745 42,745 -2,6601.00 1.00 0.00 0.00 0.00 PRESSMAN 62,781 64,037 64,037 -1,2561.00 1.00 0.00 0.00 0.00 PRINTER FOREMAN 85,156 85,156 85,156 01.00 1.00 1.00 0.00 0.00 PRINTER 62,781 64,037 64,037 -1,2560.50 0.50 0.00 0.00 0.00 PRINT SHOP AIDE 19,695 19,695 19,695 0
01030000 1.00 1.00 0.00 0.00 0.00 ANNEX MAIL COURIER (35 HOURS) 32,759 33,414 33,414 -655PRINT SHOP 5.50 5.50 1.00 0.00 0.00 303,257 309,084 309,084 -5,827
126
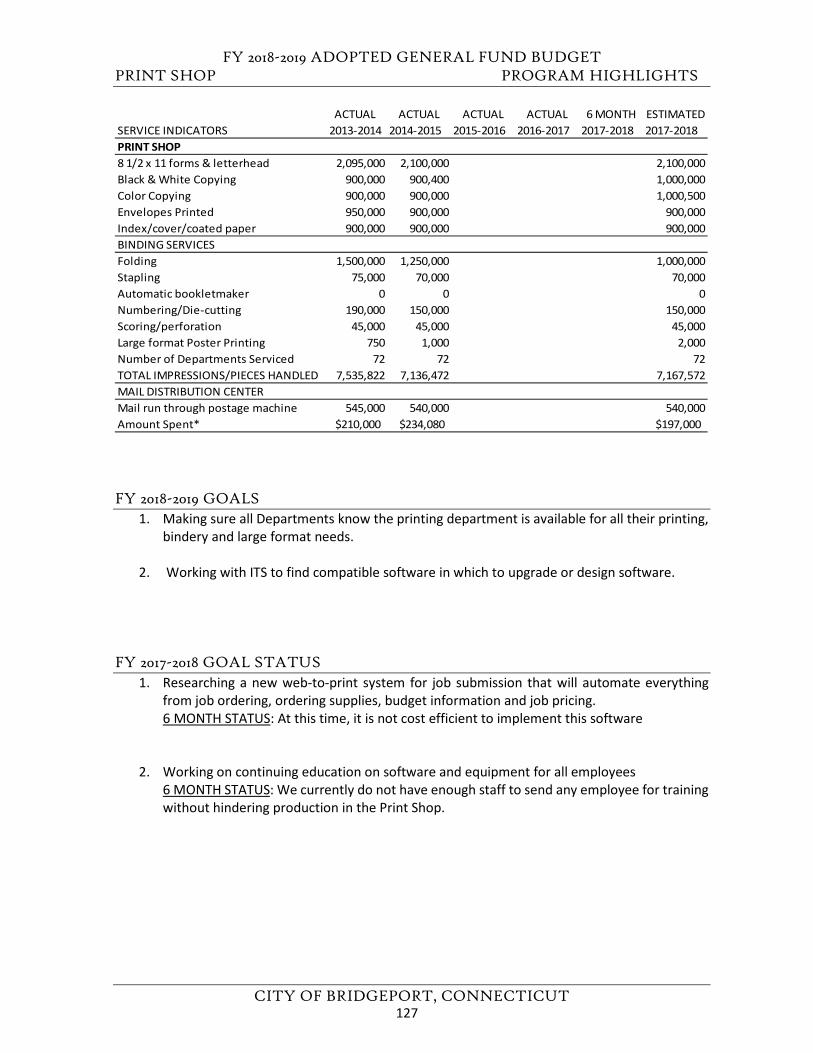
FY 2018-2019 ADOPTED GENERAL FUND BUDGET PRINT SHOP PROGRAM HIGHLIGHTS
CITY OF BRIDGEPORT, CONNECTICUT
FY 2018-2019 GOALS
1. Making sure all Departments know the printing department is available for all their printing, bindery and large format needs.
2. Working with ITS to find compatible software in which to upgrade or design software.
FY 2017-2018 GOAL STATUS
1. Researching a new web-to-print system for job submission that will automate everything from job ordering, ordering supplies, budget information and job pricing. 6 MONTH STATUS: At this time, it is not cost efficient to implement this software
2. Working on continuing education on software and equipment for all employees 6 MONTH STATUS: We currently do not have enough staff to send any employee for training without hindering production in the Print Shop.
ACTUAL ACTUAL ACTUAL ACTUAL 6 MONTH ESTIMATEDSERVICE INDICATORS 2013-2014 2014-2015 2015-2016 2016-2017 2017-2018 2017-2018PRINT SHOP8 1/2 x 11 forms & letterhead 2,095,000 2,100,000 2,100,000Black & White Copying 900,000 900,400 1,000,000Color Copying 900,000 900,000 1,000,500Envelopes Printed 950,000 900,000 900,000Index/cover/coated paper 900,000 900,000 900,000BINDING SERVICESFolding 1,500,000 1,250,000 1,000,000Stapling 75,000 70,000 70,000Automatic bookletmaker 0 0 0Numbering/Die-cutting 190,000 150,000 150,000Scoring/perforation 45,000 45,000 45,000Large format Poster Printing 750 1,000 2,000Number of Departments Serviced 72 72 72TOTAL IMPRESSIONS/PIECES HANDLED 7,535,822 7,136,472 7,167,572MAIL DISTRIBUTION CENTERMail run through postage machine 545,000 540,000 540,000Amount Spent* $210,000 $234,080 $197,000
127
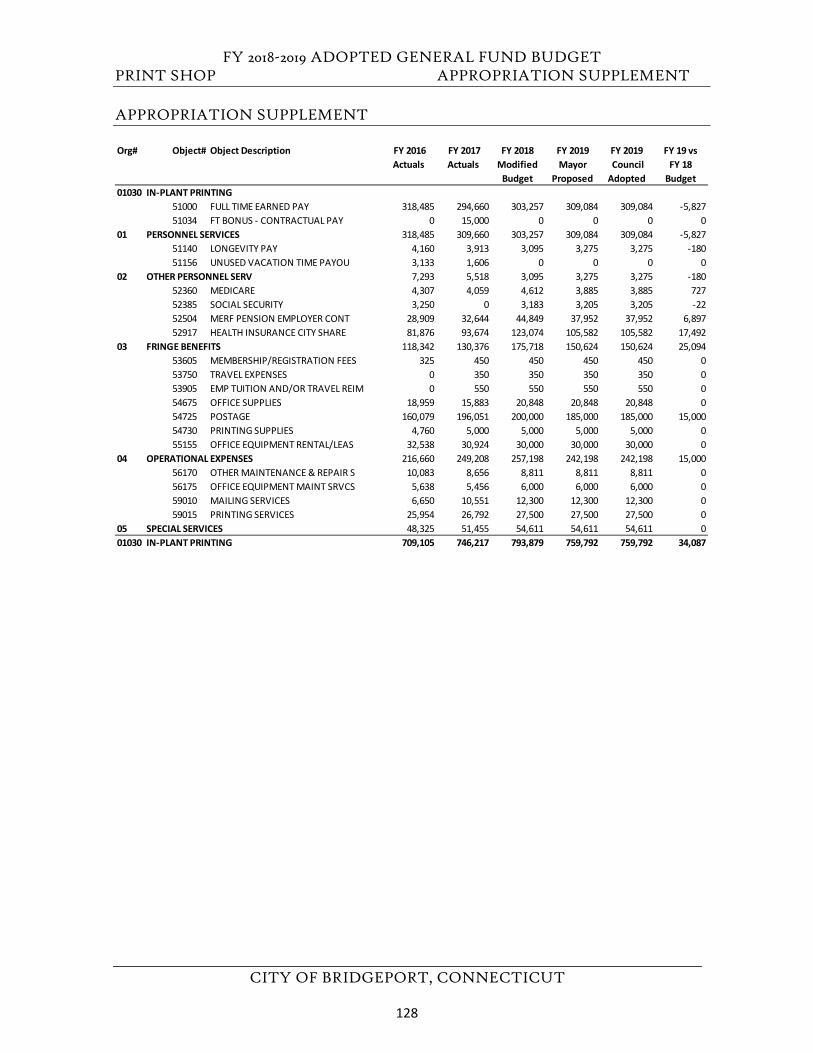
FY 2018-2019 ADOPTED GENERAL FUND BUDGET PRINT SHOP APPROPRIATION SUPPLEMENT
CITY OF BRIDGEPORT, CONNECTICUT
APPROPRIATION SUPPLEMENT
Org# Object# Object Description FY 2016 Actuals
FY 2017 Actuals
FY 2018 Modified
Budget
FY 2019Mayor
Proposed
FY 2019 Council Adopted
FY 19 vs FY 18
Budget01030 IN-PLANT PRINTING
51000 FULL TIME EARNED PAY 318,485 294,660 303,257 309,084 309,084 -5,82751034 FT BONUS - CONTRACTUAL PAY 0 15,000 0 0 0 0
01 PERSONNEL SERVICES 318,485 309,660 303,257 309,084 309,084 -5,82751140 LONGEVITY PAY 4,160 3,913 3,095 3,275 3,275 -18051156 UNUSED VACATION TIME PAYOU 3,133 1,606 0 0 0 0
02 OTHER PERSONNEL SERV 7,293 5,518 3,095 3,275 3,275 -18052360 MEDICARE 4,307 4,059 4,612 3,885 3,885 72752385 SOCIAL SECURITY 3,250 0 3,183 3,205 3,205 -2252504 MERF PENSION EMPLOYER CONT 28,909 32,644 44,849 37,952 37,952 6,89752917 HEALTH INSURANCE CITY SHARE 81,876 93,674 123,074 105,582 105,582 17,492
03 FRINGE BENEFITS 118,342 130,376 175,718 150,624 150,624 25,09453605 MEMBERSHIP/REGISTRATION FEES 325 450 450 450 450 053750 TRAVEL EXPENSES 0 350 350 350 350 053905 EMP TUITION AND/OR TRAVEL REIM 0 550 550 550 550 054675 OFFICE SUPPLIES 18,959 15,883 20,848 20,848 20,848 054725 POSTAGE 160,079 196,051 200,000 185,000 185,000 15,00054730 PRINTING SUPPLIES 4,760 5,000 5,000 5,000 5,000 055155 OFFICE EQUIPMENT RENTAL/LEAS 32,538 30,924 30,000 30,000 30,000 0
04 OPERATIONAL EXPENSES 216,660 249,208 257,198 242,198 242,198 15,00056170 OTHER MAINTENANCE & REPAIR S 10,083 8,656 8,811 8,811 8,811 056175 OFFICE EQUIPMENT MAINT SRVCS 5,638 5,456 6,000 6,000 6,000 059010 MAILING SERVICES 6,650 10,551 12,300 12,300 12,300 059015 PRINTING SERVICES 25,954 26,792 27,500 27,500 27,500 0
05 SPECIAL SERVICES 48,325 51,455 54,611 54,611 54,611 001030 IN-PLANT PRINTING 709,105 746,217 793,879 759,792 759,792 34,087
128
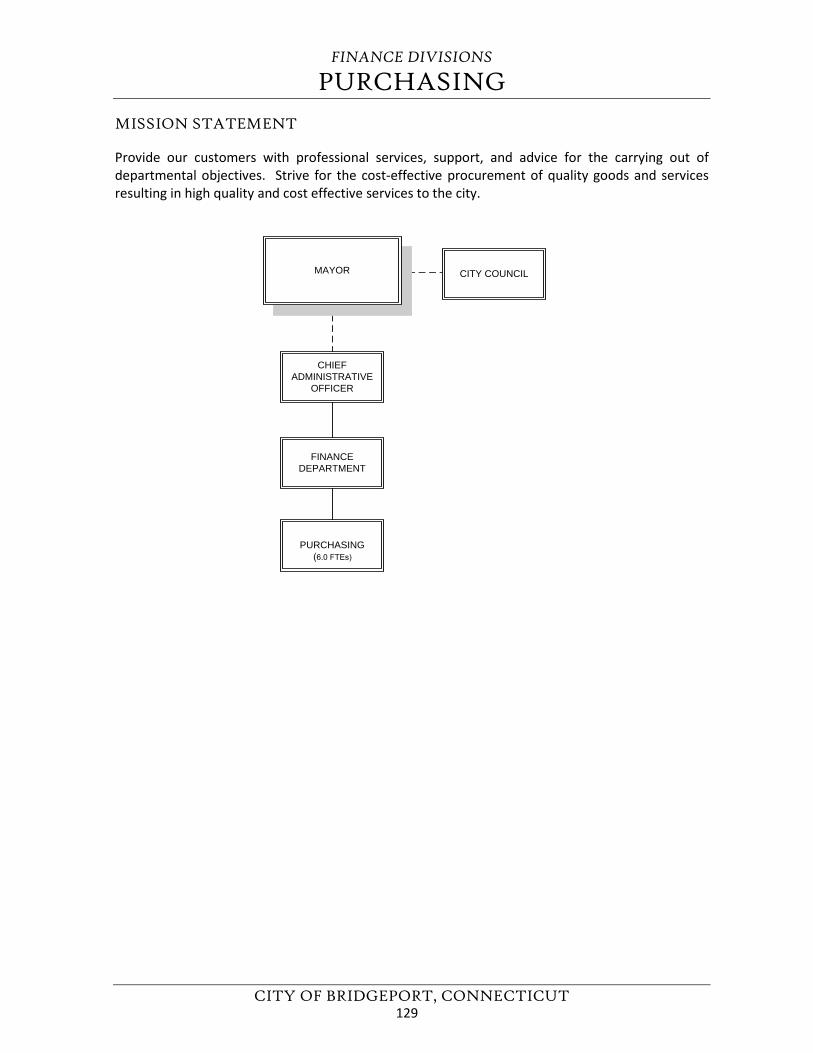
FINANCE DIVISIONS
PURCHASING
CITY OF BRIDGEPORT, CONNECTICUT
MISSION STATEMENT
Provide our customers with professional services, support, and advice for the carrying out of departmental objectives. Strive for the cost-effective procurement of quality goods and services resulting in high quality and cost effective services to the city.
CHIEFADMINISTRATIVE
OFFICER
FINANCEDEPARTMENT
PURCHASING (6.0 FTEs)
MAYOR CITY COUNCIL
129
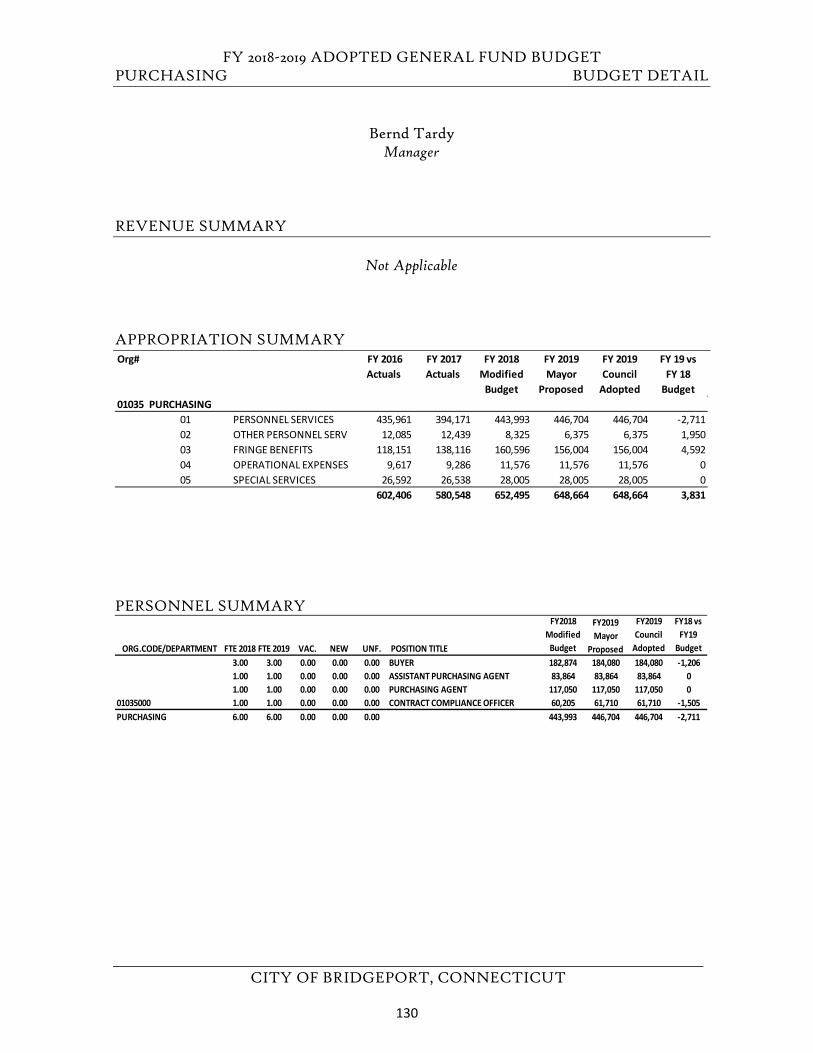
FY 2018-2019 ADOPTED GENERAL FUND BUDGET PURCHASING BUDGET DETAIL
CITY OF BRIDGEPORT, CONNECTICUT
Bernd Tardy Manager
REVENUE SUMMARY
Not Applicable
APPROPRIATION SUMMARY
PERSONNEL SUMMARY
Org# FY 2016 Actuals
FY 2017 Actuals
FY 2018 Modified
Budget
FY 2019 Mayor
Proposed
FY 2019 Council
Adopted
FY 19 vs FY 18
Budget01035 PURCHASING
01 PERSONNEL SERVICES 435,961 394,171 443,993 446,704 446,704 -2,71102 OTHER PERSONNEL SERV 12,085 12,439 8,325 6,375 6,375 1,95003 FRINGE BENEFITS 118,151 138,116 160,596 156,004 156,004 4,59204 OPERATIONAL EXPENSES 9,617 9,286 11,576 11,576 11,576 005 SPECIAL SERVICES 26,592 26,538 28,005 28,005 28,005 0
602,406 580,548 652,495 648,664 648,664 3,831
ORG.CODE/DEPARTMENT FTE 2018 FTE 2019 VAC. NEW UNF. POSITION TITLE
FY2018 Modified
Budget
FY2019 Mayor
Proposed
FY2019 Council
Adopted
FY18 vs FY19
Budget 3.00 3.00 0.00 0.00 0.00 BUYER 182,874 184,080 184,080 -1,2061.00 1.00 0.00 0.00 0.00 ASSISTANT PURCHASING AGENT 83,864 83,864 83,864 01.00 1.00 0.00 0.00 0.00 PURCHASING AGENT 117,050 117,050 117,050 0
01035000 1.00 1.00 0.00 0.00 0.00 CONTRACT COMPLIANCE OFFICER 60,205 61,710 61,710 -1,505PURCHASING 6.00 6.00 0.00 0.00 0.00 443,993 446,704 446,704 -2,711
130
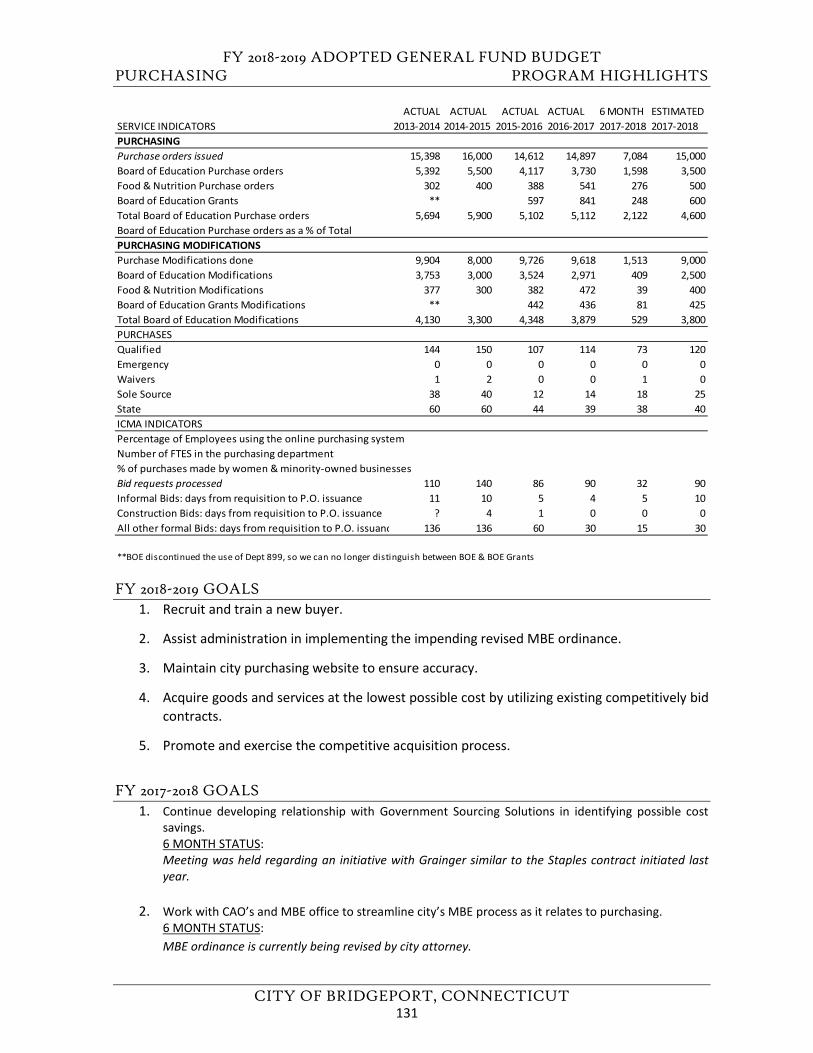
FY 2018-2019 ADOPTED GENERAL FUND BUDGET PURCHASING PROGRAM HIGHLIGHTS
CITY OF BRIDGEPORT, CONNECTICUT
FY 2018-2019 GOALS 1. Recruit and train a new buyer.
2. Assist administration in implementing the impending revised MBE ordinance.
3. Maintain city purchasing website to ensure accuracy.
4. Acquire goods and services at the lowest possible cost by utilizing existing competitively bidcontracts.
5. Promote and exercise the competitive acquisition process.
FY 2017-2018 GOALS 1. Continue developing relationship with Government Sourcing Solutions in identifying possible cost
savings.6 MONTH STATUS:Meeting was held regarding an initiative with Grainger similar to the Staples contract initiated lastyear.
2. Work with CAO’s and MBE office to streamline city’s MBE process as it relates to purchasing.6 MONTH STATUS:MBE ordinance is currently being revised by city attorney.
ACTUAL ACTUAL ACTUAL ACTUAL 6 MONTH ESTIMATEDSERVICE INDICATORS 2013-2014 2014-2015 2015-2016 2016-2017 2017-2018 2017-2018PURCHASING Purchase orders issued 15,398 16,000 14,612 14,897 7,084 15,000Board of Education Purchase orders 5,392 5,500 4,117 3,730 1,598 3,500Food & Nutrition Purchase orders 302 400 388 541 276 500Board of Education Grants ** 597 841 248 600Total Board of Education Purchase orders 5,694 5,900 5,102 5,112 2,122 4,600Board of Education Purchase orders as a % of Total PURCHASING MODIFICATIONSPurchase Modifications done 9,904 8,000 9,726 9,618 1,513 9,000Board of Education Modifications 3,753 3,000 3,524 2,971 409 2,500Food & Nutrition Modifications 377 300 382 472 39 400Board of Education Grants Modifications ** 442 436 81 425Total Board of Education Modifications 4,130 3,300 4,348 3,879 529 3,800PURCHASESQualified 144 150 107 114 73 120Emergency 0 0 0 0 0 0Waivers 1 2 0 0 1 0Sole Source 38 40 12 14 18 25State 60 60 44 39 38 40ICMA INDICATORSPercentage of Employees using the online purchasing systemNumber of FTES in the purchasing department% of purchases made by women & minority-owned businessesBid requests processed 110 140 86 90 32 90Informal Bids: days from requisition to P.O. issuance 11 10 5 4 5 10Construction Bids: days from requisition to P.O. issuance ? 4 1 0 0 0All other formal Bids: days from requisition to P.O. issuanc 136 136 60 30 15 30
**BOE discontinued the use of Dept 899, so we can no longer distinguish between BOE & BOE Grants
131
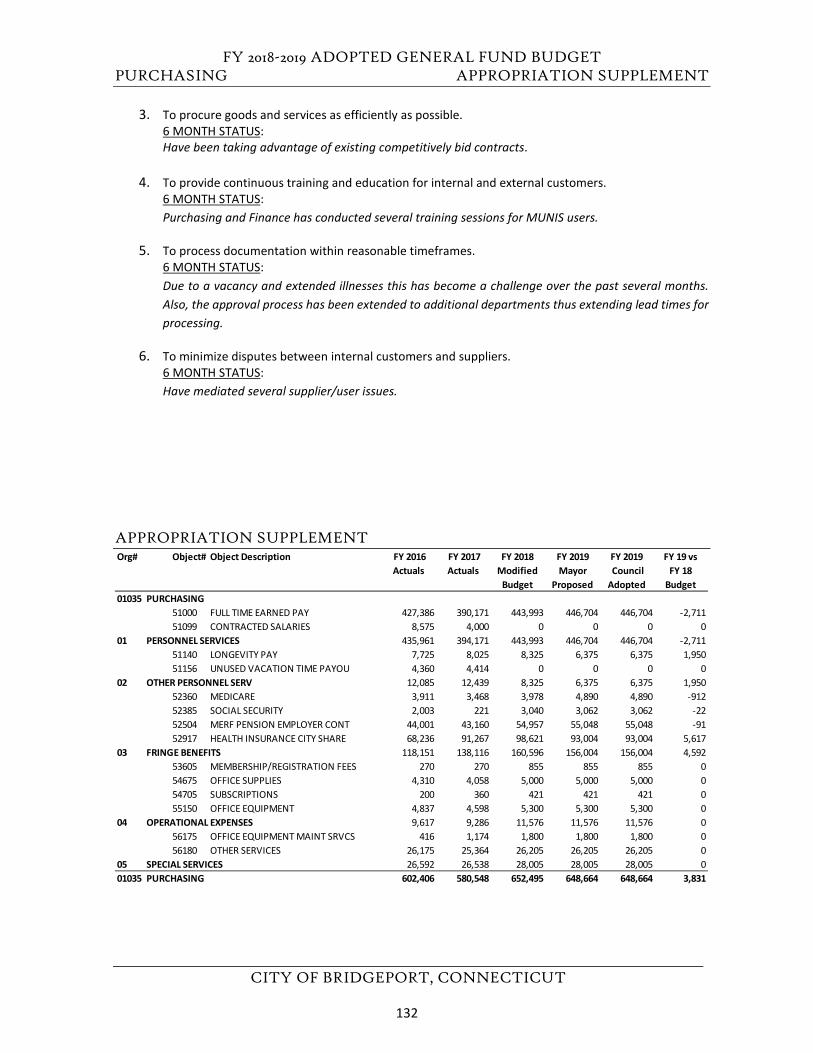
FY 2018-2019 ADOPTED GENERAL FUND BUDGET PURCHASING APPROPRIATION SUPPLEMENT
CITY OF BRIDGEPORT, CONNECTICUT
3. To procure goods and services as efficiently as possible.6 MONTH STATUS:Have been taking advantage of existing competitively bid contracts.
4. To provide continuous training and education for internal and external customers.6 MONTH STATUS:Purchasing and Finance has conducted several training sessions for MUNIS users.
5. To process documentation within reasonable timeframes.6 MONTH STATUS:Due to a vacancy and extended illnesses this has become a challenge over the past several months.Also, the approval process has been extended to additional departments thus extending lead times for processing.
6. To minimize disputes between internal customers and suppliers.6 MONTH STATUS:Have mediated several supplier/user issues.
APPROPRIATION SUPPLEMENT Org# Object# Object Description FY 2016
Actuals FY 2017 Actuals
FY 2018 Modified
Budget
FY 2019Mayor
Proposed
FY 2019 Council Adopted
FY 19 vs FY 18
Budget01035 PURCHASING
51000 FULL TIME EARNED PAY 427,386 390,171 443,993 446,704 446,704 -2,71151099 CONTRACTED SALARIES 8,575 4,000 0 0 0 0
01 PERSONNEL SERVICES 435,961 394,171 443,993 446,704 446,704 -2,71151140 LONGEVITY PAY 7,725 8,025 8,325 6,375 6,375 1,95051156 UNUSED VACATION TIME PAYOU 4,360 4,414 0 0 0 0
02 OTHER PERSONNEL SERV 12,085 12,439 8,325 6,375 6,375 1,95052360 MEDICARE 3,911 3,468 3,978 4,890 4,890 -91252385 SOCIAL SECURITY 2,003 221 3,040 3,062 3,062 -2252504 MERF PENSION EMPLOYER CONT 44,001 43,160 54,957 55,048 55,048 -9152917 HEALTH INSURANCE CITY SHARE 68,236 91,267 98,621 93,004 93,004 5,617
03 FRINGE BENEFITS 118,151 138,116 160,596 156,004 156,004 4,59253605 MEMBERSHIP/REGISTRATION FEES 270 270 855 855 855 054675 OFFICE SUPPLIES 4,310 4,058 5,000 5,000 5,000 054705 SUBSCRIPTIONS 200 360 421 421 421 055150 OFFICE EQUIPMENT 4,837 4,598 5,300 5,300 5,300 0
04 OPERATIONAL EXPENSES 9,617 9,286 11,576 11,576 11,576 056175 OFFICE EQUIPMENT MAINT SRVCS 416 1,174 1,800 1,800 1,800 056180 OTHER SERVICES 26,175 25,364 26,205 26,205 26,205 0
05 SPECIAL SERVICES 26,592 26,538 28,005 28,005 28,005 001035 PURCHASING 602,406 580,548 652,495 648,664 648,664 3,831
132
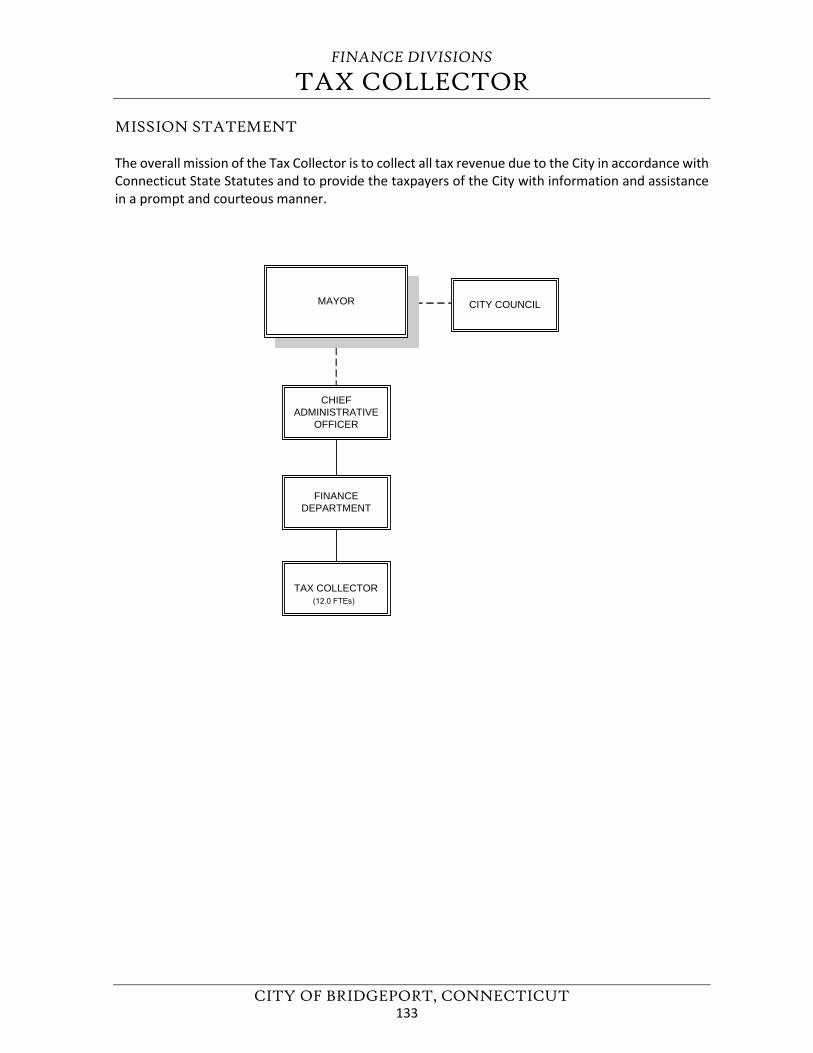
FINANCE DIVISIONS
TAX COLLECTOR
CITY OF BRIDGEPORT, CONNECTICUT
MISSION STATEMENT
The overall mission of the Tax Collector is to collect all tax revenue due to the City in accordance with Connecticut State Statutes and to provide the taxpayers of the City with information and assistance in a prompt and courteous manner.
CHIEFADMINISTRATIVE
OFFICER
FINANCEDEPARTMENT
TAX COLLECTOR (12.0 FTEs)
MAYOR CITY COUNCIL
133
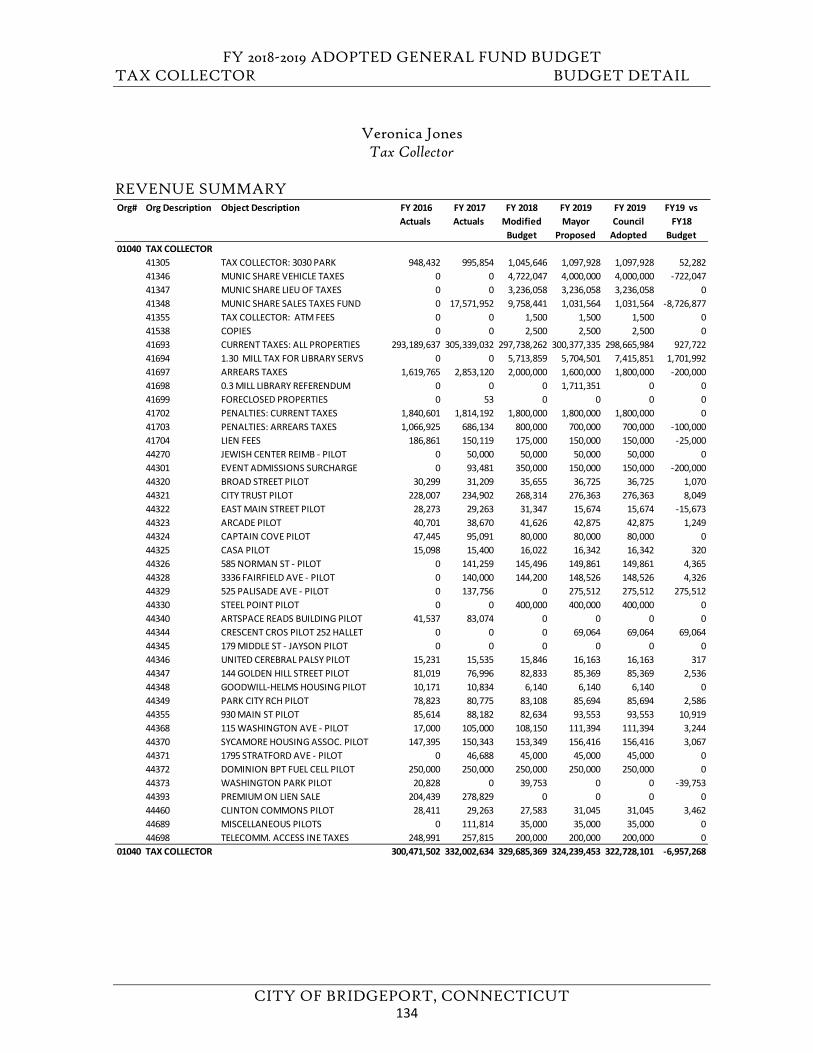
FY 2018-2019 ADOPTED GENERAL FUND BUDGET TAX COLLECTOR BUDGET DETAIL
CITY OF BRIDGEPORT, CONNECTICUT
Veronica Jones Tax Collector
REVENUE SUMMARY Org# Org Description Object Description FY 2016
Actuals FY 2017 Actuals
FY 2018 Modified
Budget
FY 2019 Mayor
Proposed
FY 2019 Council
Adopted
FY19 vs FY18
Budget01040 TAX COLLECTOR
41305 TAX COLLECTOR: 3030 PARK 948,432 995,854 1,045,646 1,097,928 1,097,928 52,28241346 MUNIC SHARE VEHICLE TAXES 0 0 4,722,047 4,000,000 4,000,000 -722,04741347 MUNIC SHARE LIEU OF TAXES 0 0 3,236,058 3,236,058 3,236,058 041348 MUNIC SHARE SALES TAXES FUND 0 17,571,952 9,758,441 1,031,564 1,031,564 -8,726,87741355 TAX COLLECTOR: ATM FEES 0 0 1,500 1,500 1,500 041538 COPIES 0 0 2,500 2,500 2,500 041693 CURRENT TAXES: ALL PROPERTIES 293,189,637 305,339,032 297,738,262 300,377,335 298,665,984 927,72241694 1.30 MILL TAX FOR LIBRARY SERVS 0 0 5,713,859 5,704,501 7,415,851 1,701,99241697 ARREARS TAXES 1,619,765 2,853,120 2,000,000 1,600,000 1,800,000 -200,00041698 0.3 MILL LIBRARY REFERENDUM 0 0 0 1,711,351 0 041699 FORECLOSED PROPERTIES 0 53 0 0 0 041702 PENALTIES: CURRENT TAXES 1,840,601 1,814,192 1,800,000 1,800,000 1,800,000 041703 PENALTIES: ARREARS TAXES 1,066,925 686,134 800,000 700,000 700,000 -100,00041704 LIEN FEES 186,861 150,119 175,000 150,000 150,000 -25,00044270 JEWISH CENTER REIMB - PILOT 0 50,000 50,000 50,000 50,000 044301 EVENT ADMISSIONS SURCHARGE 0 93,481 350,000 150,000 150,000 -200,00044320 BROAD STREET PILOT 30,299 31,209 35,655 36,725 36,725 1,07044321 CITY TRUST PILOT 228,007 234,902 268,314 276,363 276,363 8,04944322 EAST MAIN STREET PILOT 28,273 29,263 31,347 15,674 15,674 -15,67344323 ARCADE PILOT 40,701 38,670 41,626 42,875 42,875 1,24944324 CAPTAIN COVE PILOT 47,445 95,091 80,000 80,000 80,000 044325 CASA PILOT 15,098 15,400 16,022 16,342 16,342 32044326 585 NORMAN ST - PILOT 0 141,259 145,496 149,861 149,861 4,36544328 3336 FAIRFIELD AVE - PILOT 0 140,000 144,200 148,526 148,526 4,32644329 525 PALISADE AVE - PILOT 0 137,756 0 275,512 275,512 275,51244330 STEEL POINT PILOT 0 0 400,000 400,000 400,000 044340 ARTSPACE READS BUILDING PILOT 41,537 83,074 0 0 0 044344 CRESCENT CROS PILOT 252 HALLET 0 0 0 69,064 69,064 69,06444345 179 MIDDLE ST - JAYSON PILOT 0 0 0 0 0 044346 UNITED CEREBRAL PALSY PILOT 15,231 15,535 15,846 16,163 16,163 31744347 144 GOLDEN HILL STREET PILOT 81,019 76,996 82,833 85,369 85,369 2,53644348 GOODWILL-HELMS HOUSING PILOT 10,171 10,834 6,140 6,140 6,140 044349 PARK CITY RCH PILOT 78,823 80,775 83,108 85,694 85,694 2,58644355 930 MAIN ST PILOT 85,614 88,182 82,634 93,553 93,553 10,91944368 115 WASHINGTON AVE - PILOT 17,000 105,000 108,150 111,394 111,394 3,24444370 SYCAMORE HOUSING ASSOC. PILOT 147,395 150,343 153,349 156,416 156,416 3,06744371 1795 STRATFORD AVE - PILOT 0 46,688 45,000 45,000 45,000 044372 DOMINION BPT FUEL CELL PILOT 250,000 250,000 250,000 250,000 250,000 044373 WASHINGTON PARK PILOT 20,828 0 39,753 0 0 -39,75344393 PREMIUM ON LIEN SALE 204,439 278,829 0 0 0 044460 CLINTON COMMONS PILOT 28,411 29,263 27,583 31,045 31,045 3,46244689 MISCELLANEOUS PILOTS 0 111,814 35,000 35,000 35,000 044698 TELECOMM. ACCESS INE TAXES 248,991 257,815 200,000 200,000 200,000 0
01040 TAX COLLECTOR 300,471,502 332,002,634 329,685,369 324,239,453 322,728,101 -6,957,268
134
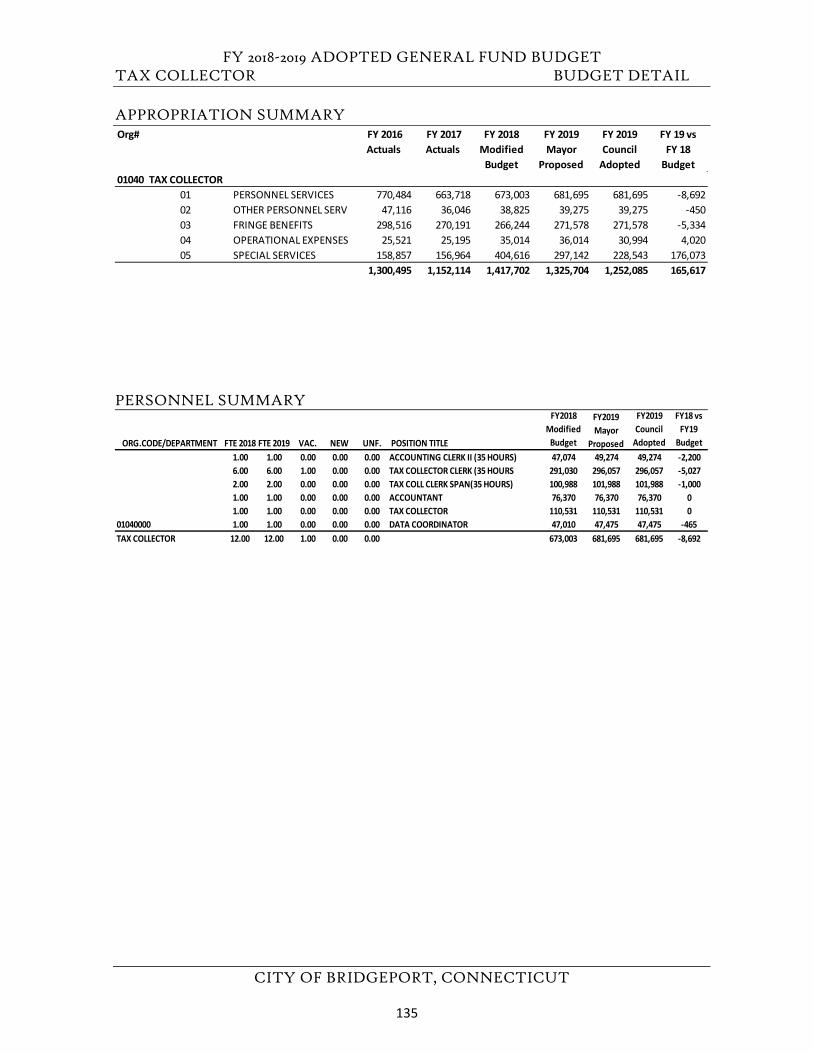
FY 2018-2019 ADOPTED GENERAL FUND BUDGET TAX COLLECTOR BUDGET DETAIL
CITY OF BRIDGEPORT, CONNECTICUT
APPROPRIATION SUMMARY
PERSONNEL SUMMARY
Org# FY 2016 Actuals
FY 2017 Actuals
FY 2018 Modified
Budget
FY 2019 Mayor
Proposed
FY 2019 Council
Adopted
FY 19 vs FY 18
Budget01040 TAX COLLECTOR
01 PERSONNEL SERVICES 770,484 663,718 673,003 681,695 681,695 -8,69202 OTHER PERSONNEL SERV 47,116 36,046 38,825 39,275 39,275 -45003 FRINGE BENEFITS 298,516 270,191 266,244 271,578 271,578 -5,33404 OPERATIONAL EXPENSES 25,521 25,195 35,014 36,014 30,994 4,02005 SPECIAL SERVICES 158,857 156,964 404,616 297,142 228,543 176,073
1,300,495 1,152,114 1,417,702 1,325,704 1,252,085 165,617
ORG.CODE/DEPARTMENT FTE 2018 FTE 2019 VAC. NEW UNF. POSITION TITLE
FY2018 Modified
Budget
FY2019 Mayor
Proposed
FY2019 Council
Adopted
FY18 vs FY19
Budget 1.00 1.00 0.00 0.00 0.00 ACCOUNTING CLERK II (35 HOURS) 47,074 49,274 49,274 -2,2006.00 6.00 1.00 0.00 0.00 TAX COLLECTOR CLERK (35 HOURS 291,030 296,057 296,057 -5,0272.00 2.00 0.00 0.00 0.00 TAX COLL CLERK SPAN(35 HOURS) 100,988 101,988 101,988 -1,0001.00 1.00 0.00 0.00 0.00 ACCOUNTANT 76,370 76,370 76,370 01.00 1.00 0.00 0.00 0.00 TAX COLLECTOR 110,531 110,531 110,531 0
01040000 1.00 1.00 0.00 0.00 0.00 DATA COORDINATOR 47,010 47,475 47,475 -465TAX COLLECTOR 12.00 12.00 1.00 0.00 0.00 673,003 681,695 681,695 -8,692
135
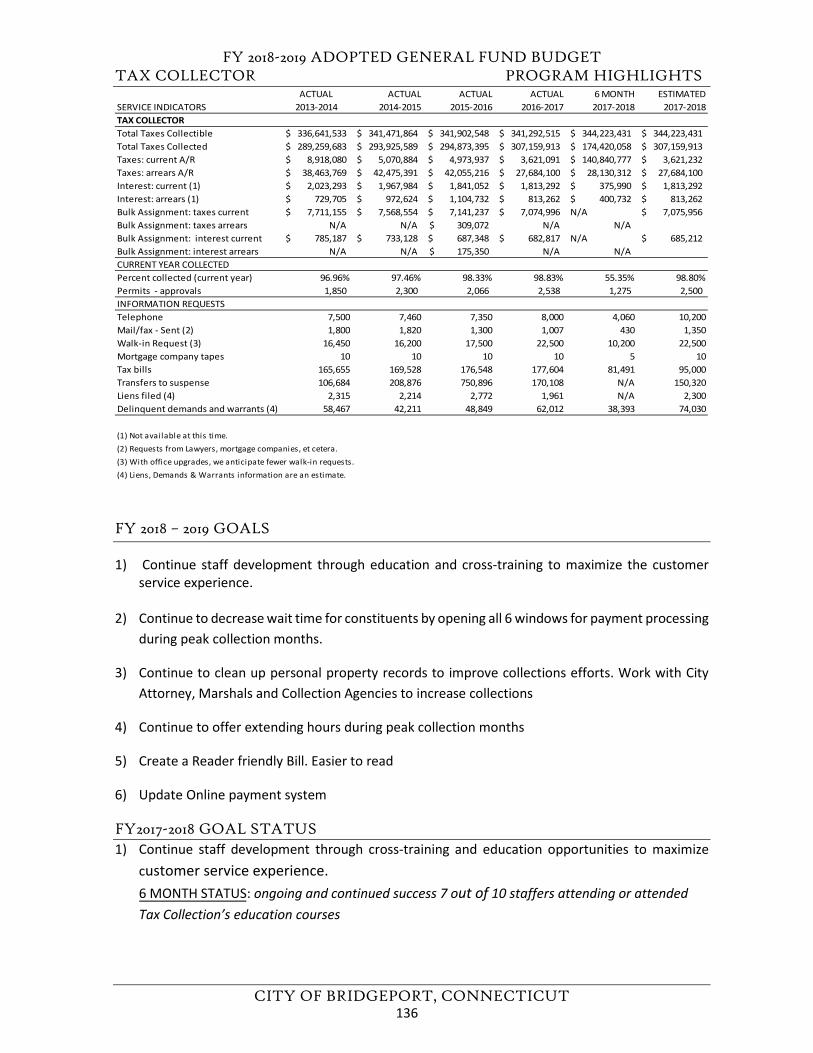
FY 2018-2019 ADOPTED GENERAL FUND BUDGET TAX COLLECTOR PROGRAM HIGHLIGHTS
CITY OF BRIDGEPORT, CONNECTICUT
FY 2018 – 2019 GOALS
1) Continue staff development through education and cross-training to maximize the customerservice experience.
2) Continue to decrease wait time for constituents by opening all 6 windows for payment processing during peak collection months.
3) Continue to clean up personal property records to improve collections efforts. Work with CityAttorney, Marshals and Collection Agencies to increase collections
4) Continue to offer extending hours during peak collection months
5) Create a Reader friendly Bill. Easier to read
6) Update Online payment system
FY2017-2018 GOAL STATUS 1) Continue staff development through cross-training and education opportunities to maximize
customer service experience.6 MONTH STATUS: ongoing and continued success 7 out of 10 staffers attending or attended Tax Collection’s education courses
ACTUAL ACTUAL ACTUAL ACTUAL 6 MONTH ESTIMATEDSERVICE INDICATORS 2013-2014 2014-2015 2015-2016 2016-2017 2017-2018 2017-2018TAX COLLECTORTotal Taxes Collectible 336,641,533$ 341,471,864$ 341,902,548$ 341,292,515$ 344,223,431$ 344,223,431$ Total Taxes Collected 289,259,683$ 293,925,589$ 294,873,395$ 307,159,913$ 174,420,058$ 307,159,913$ Taxes: current A/R 8,918,080$ 5,070,884$ 4,973,937$ 3,621,091$ 140,840,777$ 3,621,232$ Taxes: arrears A/R 38,463,769$ 42,475,391$ 42,055,216$ 27,684,100$ 28,130,312$ 27,684,100$ Interest: current (1) 2,023,293$ 1,967,984$ 1,841,052$ 1,813,292$ 375,990$ 1,813,292$ Interest: arrears (1) 729,705$ 972,624$ 1,104,732$ 813,262$ 400,732$ 813,262$ Bulk Assignment: taxes current 7,711,155$ 7,568,554$ 7,141,237$ 7,074,996$ N/A 7,075,956$ Bulk Assignment: taxes arrears N/A N/A 309,072$ N/A N/ABulk Assignment: interest current 785,187$ 733,128$ 687,348$ 682,817$ N/A 685,212$ Bulk Assignment: interest arrears N/A N/A 175,350$ N/A N/ACURRENT YEAR COLLECTEDPercent collected (current year) 96.96% 97.46% 98.33% 98.83% 55.35% 98.80%Permits - approvals 1,850 2,300 2,066 2,538 1,275 2,500 INFORMATION REQUESTSTelephone 7,500 7,460 7,350 8,000 4,060 10,200Mail/fax - Sent (2) 1,800 1,820 1,300 1,007 430 1,350Walk-in Request (3) 16,450 16,200 17,500 22,500 10,200 22,500Mortgage company tapes 10 10 10 10 5 10Tax bills 165,655 169,528 176,548 177,604 81,491 95,000Transfers to suspense 106,684 208,876 750,896 170,108 N/A 150,320Liens filed (4) 2,315 2,214 2,772 1,961 N/A 2,300Delinquent demands and warrants (4) 58,467 42,211 48,849 62,012 38,393 74,030
(1) Not available at this time.(2) Requests from Lawyers, mortgage companies, et cetera.(3) With office upgrades, we anticipate fewer walk-in requests.(4) Liens, Demands & Warrants information are an estimate.
136
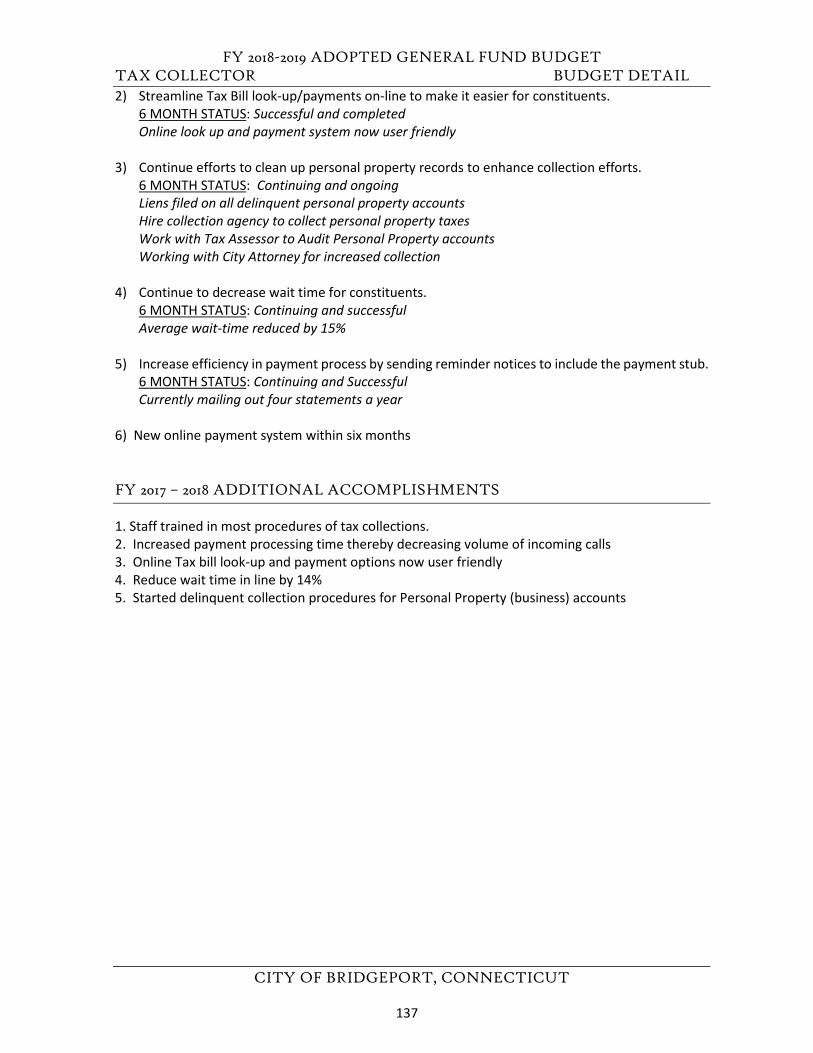
FY 2018-2019 ADOPTED GENERAL FUND BUDGET TAX COLLECTOR BUDGET DETAIL
CITY OF BRIDGEPORT, CONNECTICUT
2) Streamline Tax Bill look-up/payments on-line to make it easier for constituents. 6 MONTH STATUS: Successful and completed Online look up and payment system now user friendly
3) Continue efforts to clean up personal property records to enhance collection efforts.
6 MONTH STATUS: Continuing and ongoing Liens filed on all delinquent personal property accounts Hire collection agency to collect personal property taxes Work with Tax Assessor to Audit Personal Property accounts Working with City Attorney for increased collection
4) Continue to decrease wait time for constituents.
6 MONTH STATUS: Continuing and successful Average wait-time reduced by 15%
5) Increase efficiency in payment process by sending reminder notices to include the payment stub.
6 MONTH STATUS: Continuing and Successful Currently mailing out four statements a year
6) New online payment system within six months
FY 2017 – 2018 ADDITIONAL ACCOMPLISHMENTS
1. Staff trained in most procedures of tax collections. 2. Increased payment processing time thereby decreasing volume of incoming calls 3. Online Tax bill look-up and payment options now user friendly 4. Reduce wait time in line by 14% 5. Started delinquent collection procedures for Personal Property (business) accounts
137
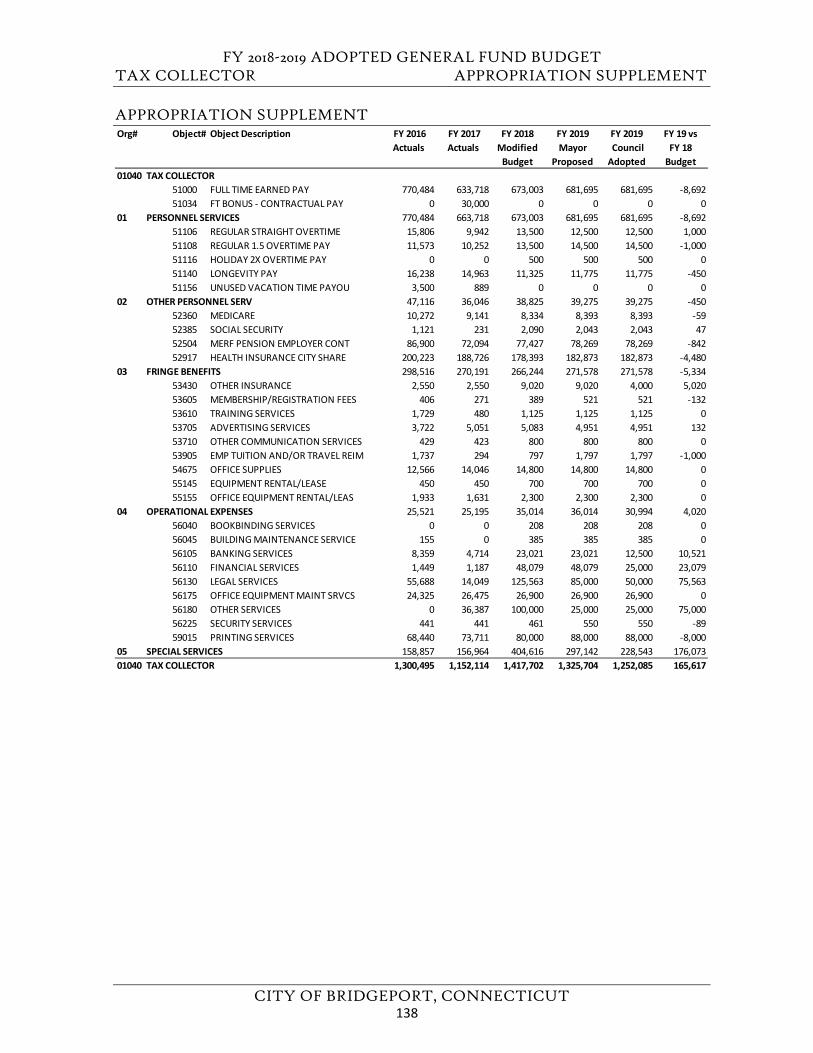
FY 2018-2019 ADOPTED GENERAL FUND BUDGET TAX COLLECTOR APPROPRIATION SUPPLEMENT
CITY OF BRIDGEPORT, CONNECTICUT
APPROPRIATION SUPPLEMENT Org# Object# Object Description FY 2016
Actuals FY 2017 Actuals
FY 2018 Modified
Budget
FY 2019Mayor
Proposed
FY 2019 Council Adopted
FY 19 vs FY 18
Budget01040 TAX COLLECTOR
51000 FULL TIME EARNED PAY 770,484 633,718 673,003 681,695 681,695 -8,69251034 FT BONUS - CONTRACTUAL PAY 0 30,000 0 0 0 0
01 PERSONNEL SERVICES 770,484 663,718 673,003 681,695 681,695 -8,69251106 REGULAR STRAIGHT OVERTIME 15,806 9,942 13,500 12,500 12,500 1,00051108 REGULAR 1.5 OVERTIME PAY 11,573 10,252 13,500 14,500 14,500 -1,00051116 HOLIDAY 2X OVERTIME PAY 0 0 500 500 500 051140 LONGEVITY PAY 16,238 14,963 11,325 11,775 11,775 -45051156 UNUSED VACATION TIME PAYOU 3,500 889 0 0 0 0
02 OTHER PERSONNEL SERV 47,116 36,046 38,825 39,275 39,275 -45052360 MEDICARE 10,272 9,141 8,334 8,393 8,393 -5952385 SOCIAL SECURITY 1,121 231 2,090 2,043 2,043 4752504 MERF PENSION EMPLOYER CONT 86,900 72,094 77,427 78,269 78,269 -84252917 HEALTH INSURANCE CITY SHARE 200,223 188,726 178,393 182,873 182,873 -4,480
03 FRINGE BENEFITS 298,516 270,191 266,244 271,578 271,578 -5,33453430 OTHER INSURANCE 2,550 2,550 9,020 9,020 4,000 5,02053605 MEMBERSHIP/REGISTRATION FEES 406 271 389 521 521 -13253610 TRAINING SERVICES 1,729 480 1,125 1,125 1,125 053705 ADVERTISING SERVICES 3,722 5,051 5,083 4,951 4,951 13253710 OTHER COMMUNICATION SERVICES 429 423 800 800 800 053905 EMP TUITION AND/OR TRAVEL REIM 1,737 294 797 1,797 1,797 -1,00054675 OFFICE SUPPLIES 12,566 14,046 14,800 14,800 14,800 055145 EQUIPMENT RENTAL/LEASE 450 450 700 700 700 055155 OFFICE EQUIPMENT RENTAL/LEAS 1,933 1,631 2,300 2,300 2,300 0
04 OPERATIONAL EXPENSES 25,521 25,195 35,014 36,014 30,994 4,02056040 BOOKBINDING SERVICES 0 0 208 208 208 056045 BUILDING MAINTENANCE SERVICE 155 0 385 385 385 056105 BANKING SERVICES 8,359 4,714 23,021 23,021 12,500 10,52156110 FINANCIAL SERVICES 1,449 1,187 48,079 48,079 25,000 23,07956130 LEGAL SERVICES 55,688 14,049 125,563 85,000 50,000 75,56356175 OFFICE EQUIPMENT MAINT SRVCS 24,325 26,475 26,900 26,900 26,900 056180 OTHER SERVICES 0 36,387 100,000 25,000 25,000 75,00056225 SECURITY SERVICES 441 441 461 550 550 -8959015 PRINTING SERVICES 68,440 73,711 80,000 88,000 88,000 -8,000
05 SPECIAL SERVICES 158,857 156,964 404,616 297,142 228,543 176,07301040 TAX COLLECTOR 1,300,495 1,152,114 1,417,702 1,325,704 1,252,085 165,617
138
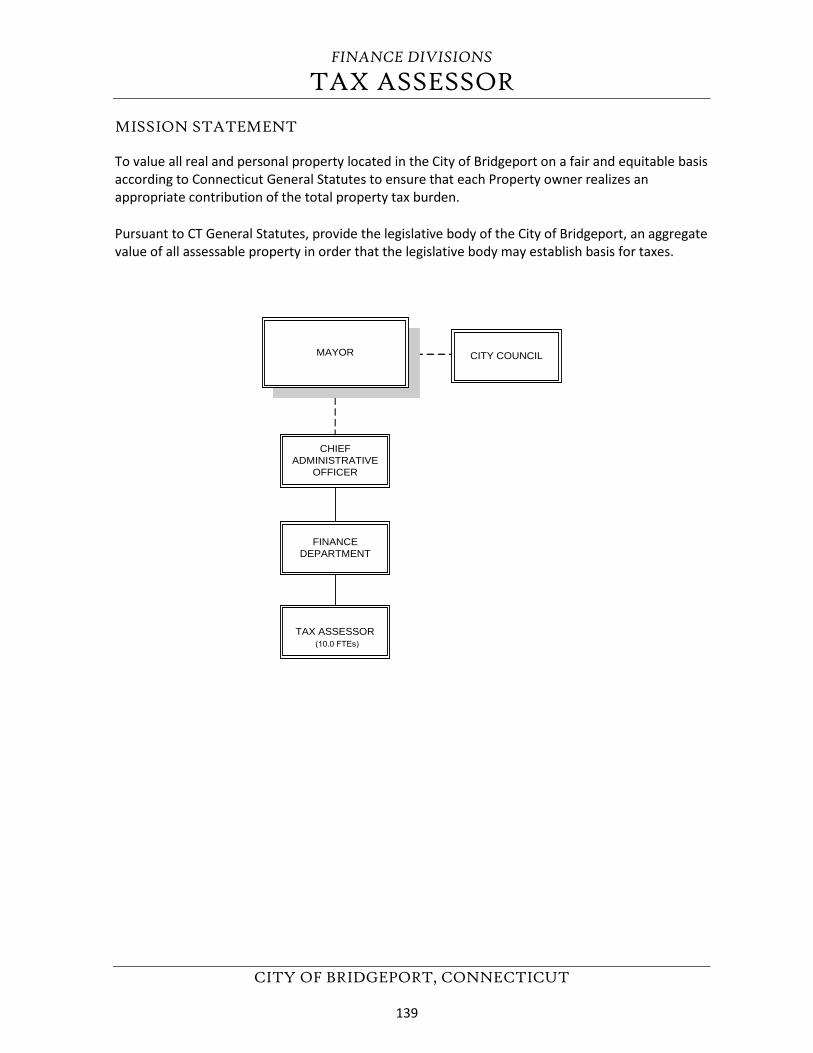
FINANCE DIVISIONS
TAX ASSESSOR
CITY OF BRIDGEPORT, CONNECTICUT
MISSION STATEMENT
To value all real and personal property located in the City of Bridgeport on a fair and equitable basis according to Connecticut General Statutes to ensure that each Property owner realizes an appropriate contribution of the total property tax burden.
Pursuant to CT General Statutes, provide the legislative body of the City of Bridgeport, an aggregate value of all assessable property in order that the legislative body may establish basis for taxes.
CHIEFADMINISTRATIVE
OFFICER
FINANCEDEPARTMENT
TAX ASSESSOR (10.0 FTEs)
MAYOR CITY COUNCIL
139
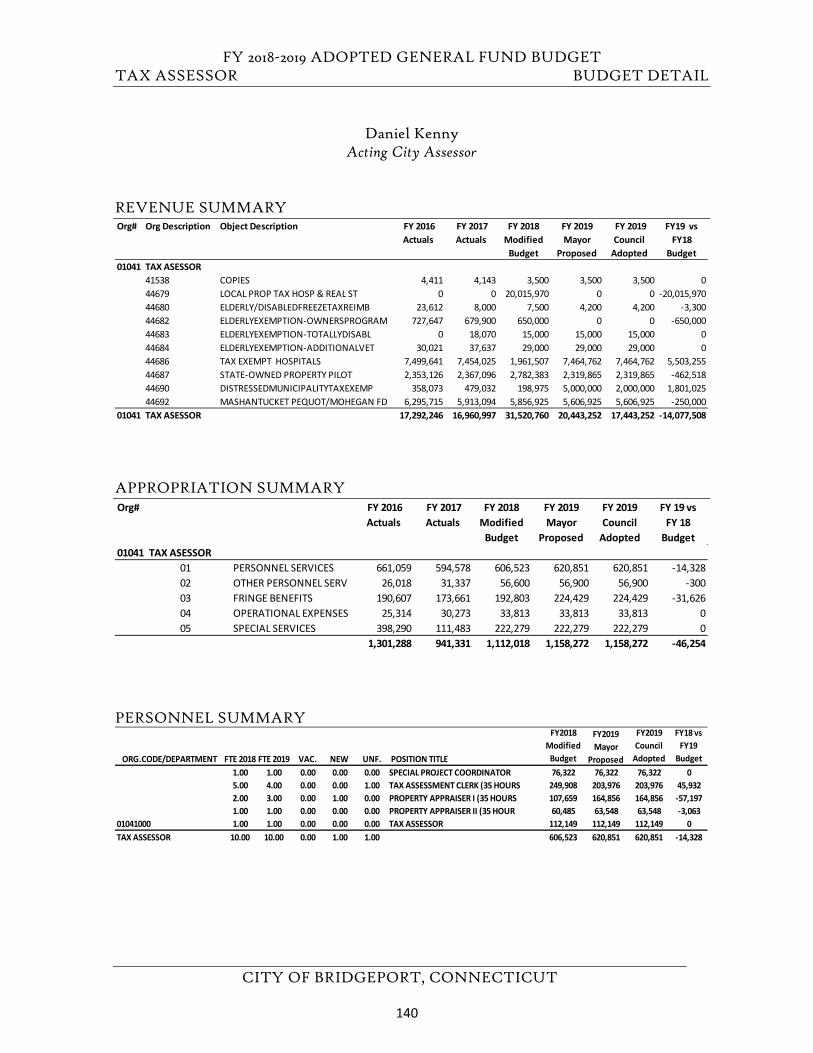
FY 2018-2019 ADOPTED GENERAL FUND BUDGET TAX ASSESSOR BUDGET DETAIL
CITY OF BRIDGEPORT, CONNECTICUT
Daniel Kenny Acting City Assessor
REVENUE SUMMARY
APPROPRIATION SUMMARY
PERSONNEL SUMMARY
Org# Org Description Object Description FY 2016 Actuals
FY 2017 Actuals
FY 2018 Modified
Budget
FY 2019 Mayor
Proposed
FY 2019 Council
Adopted
FY19 vs FY18
Budget01041 TAX ASESSOR
41538 COPIES 4,411 4,143 3,500 3,500 3,500 044679 LOCAL PROP TAX HOSP & REAL ST 0 0 20,015,970 0 0 -20,015,97044680 ELDERLY/DISABLEDFREEZETAXREIMB 23,612 8,000 7,500 4,200 4,200 -3,30044682 ELDERLYEXEMPTION-OWNERSPROGRAM 727,647 679,900 650,000 0 0 -650,00044683 ELDERLYEXEMPTION-TOTALLYDISABL 0 18,070 15,000 15,000 15,000 044684 ELDERLYEXEMPTION-ADDITIONALVET 30,021 37,637 29,000 29,000 29,000 044686 TAX EXEMPT HOSPITALS 7,499,641 7,454,025 1,961,507 7,464,762 7,464,762 5,503,25544687 STATE-OWNED PROPERTY PILOT 2,353,126 2,367,096 2,782,383 2,319,865 2,319,865 -462,51844690 DISTRESSEDMUNICIPALITYTAXEXEMP 358,073 479,032 198,975 5,000,000 2,000,000 1,801,02544692 MASHANTUCKET PEQUOT/MOHEGAN FD 6,295,715 5,913,094 5,856,925 5,606,925 5,606,925 -250,000
01041 TAX ASESSOR 17,292,246 16,960,997 31,520,760 20,443,252 17,443,252 -14,077,508
Org# FY 2016 Actuals
FY 2017 Actuals
FY 2018 Modified
Budget
FY 2019 Mayor
Proposed
FY 2019 Council
Adopted
FY 19 vs FY 18
Budget01041 TAX ASESSOR
01 PERSONNEL SERVICES 661,059 594,578 606,523 620,851 620,851 -14,32802 OTHER PERSONNEL SERV 26,018 31,337 56,600 56,900 56,900 -30003 FRINGE BENEFITS 190,607 173,661 192,803 224,429 224,429 -31,62604 OPERATIONAL EXPENSES 25,314 30,273 33,813 33,813 33,813 005 SPECIAL SERVICES 398,290 111,483 222,279 222,279 222,279 0
1,301,288 941,331 1,112,018 1,158,272 1,158,272 -46,254
ORG.CODE/DEPARTMENT FTE 2018 FTE 2019 VAC. NEW UNF. POSITION TITLE
FY2018 Modified
Budget
FY2019 Mayor
Proposed
FY2019 Council
Adopted
FY18 vs FY19
Budget 1.00 1.00 0.00 0.00 0.00 SPECIAL PROJECT COORDINATOR 76,322 76,322 76,322 05.00 4.00 0.00 0.00 1.00 TAX ASSESSMENT CLERK (35 HOURS 249,908 203,976 203,976 45,9322.00 3.00 0.00 1.00 0.00 PROPERTY APPRAISER I (35 HOURS 107,659 164,856 164,856 -57,1971.00 1.00 0.00 0.00 0.00 PROPERTY APPRAISER II (35 HOUR 60,485 63,548 63,548 -3,063
01041000 1.00 1.00 0.00 0.00 0.00 TAX ASSESSOR 112,149 112,149 112,149 0TAX ASSESSOR 10.00 10.00 0.00 1.00 1.00 606,523 620,851 620,851 -14,328
140
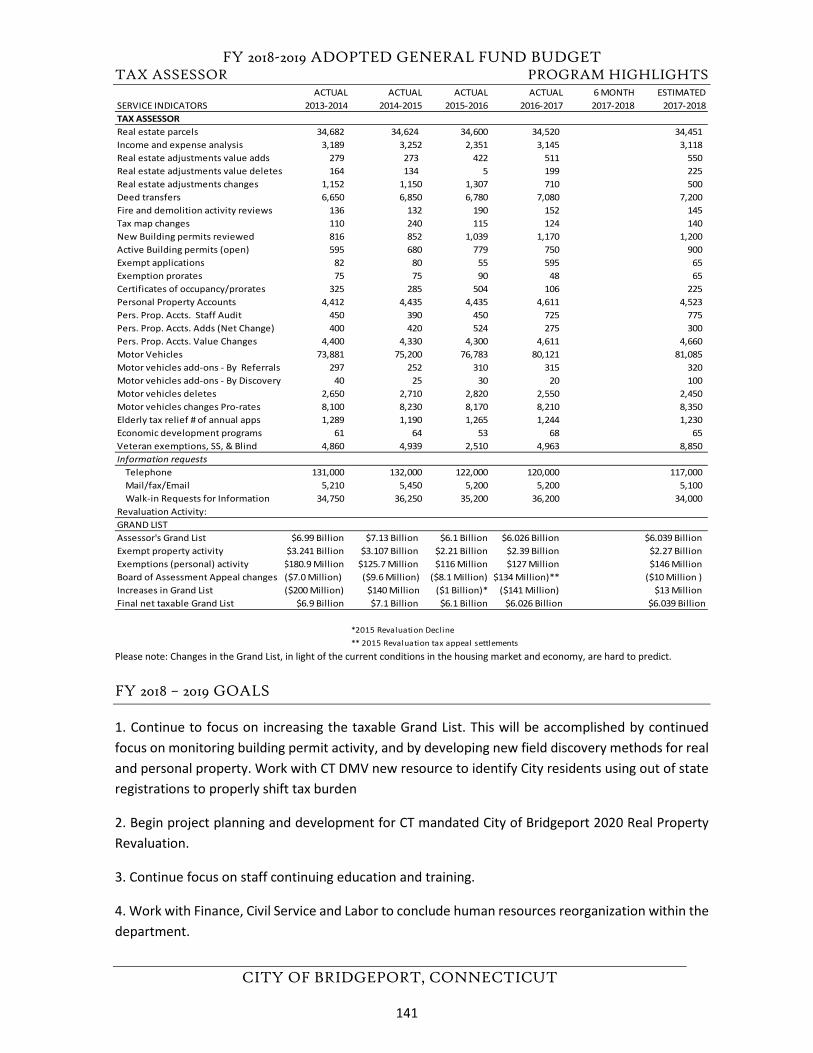
FY 2018-2019 ADOPTED GENERAL FUND BUDGET TAX ASSESSOR PROGRAM HIGHLIGHTS
CITY OF BRIDGEPORT, CONNECTICUT
Please note: Changes in the Grand List, in light of the current conditions in the housing market and economy, are hard to predict.
FY 2018 – 2019 GOALS
1. Continue to focus on increasing the taxable Grand List. This will be accomplished by continuedfocus on monitoring building permit activity, and by developing new field discovery methods for realand personal property. Work with CT DMV new resource to identify City residents using out of stateregistrations to properly shift tax burden
2. Begin project planning and development for CT mandated City of Bridgeport 2020 Real PropertyRevaluation.
3. Continue focus on staff continuing education and training.
4. Work with Finance, Civil Service and Labor to conclude human resources reorganization within thedepartment.
ACTUAL ACTUAL ACTUAL ACTUAL 6 MONTH ESTIMATEDSERVICE INDICATORS 2013-2014 2014-2015 2015-2016 2016-2017 2017-2018 2017-2018TAX ASSESSORReal estate parcels 34,682 34,624 34,600 34,520 34,451 Income and expense analysis 3,189 3,252 2,351 3,145 3,118 Real estate adjustments value adds 279 273 422 511 550 Real estate adjustments value deletes 164 134 5 199 225 Real estate adjustments changes 1,152 1,150 1,307 710 500 Deed transfers 6,650 6,850 6,780 7,080 7,200 Fire and demolition activity reviews 136 132 190 152 145 Tax map changes 110 240 115 124 140 New Building permits reviewed 816 852 1,039 1,170 1,200 Active Building permits (open) 595 680 779 750 900 Exempt applications 82 80 55 595 65 Exemption prorates 75 75 90 48 65 Certificates of occupancy/prorates 325 285 504 106 225 Personal Property Accounts 4,412 4,435 4,435 4,611 4,523 Pers. Prop. Accts. Staff Audit 450 390 450 725 775 Pers. Prop. Accts. Adds (Net Change) 400 420 524 275 300 Pers. Prop. Accts. Value Changes 4,400 4,330 4,300 4,611 4,660 Motor Vehicles 73,881 75,200 76,783 80,121 81,085 Motor vehicles add-ons - By Referrals 297 252 310 315 320 Motor vehicles add-ons - By Discovery 40 25 30 20 100 Motor vehicles deletes 2,650 2,710 2,820 2,550 2,450 Motor vehicles changes Pro-rates 8,100 8,230 8,170 8,210 8,350 Elderly tax relief # of annual apps 1,289 1,190 1,265 1,244 1,230 Economic development programs 61 64 53 68 65 Veteran exemptions, SS, & Blind 4,860 4,939 2,510 4,963 8,850 Information requests
Telephone 131,000 132,000 122,000 120,000 117,000 Mail/fax/Email 5,210 5,450 5,200 5,200 5,100 Walk-in Requests for Information 34,750 36,250 35,200 36,200 34,000
Revaluation Activity:GRAND LISTAssessor's Grand List $6.99 Billion $7.13 Billion $6.1 Billion $6.026 Billion $6.039 BillionExempt property activity $3.241 Billion $3.107 Billion $2.21 Billion $2.39 Billion $2.27 BillionExemptions (personal) activity $180.9 Million $125.7 Million $116 Million $127 Million $146 MillionBoard of Assessment Appeal changes ($7.0 Million) ($9.6 Million) ($8.1 Million) $134 Million)** ($10 Million )Increases in Grand List ($200 Million) $140 Million ($1 Billion)* ($141 Million) $13 MillionFinal net taxable Grand List $6.9 Billion $7.1 Billion $6.1 Billion $6.026 Billion $6.039 Billion
*2015 Revaluation Decline** 2015 Revaluation tax appeal settlements
141
FY 2018-2019 ADOPTED GENERAL FUND BUDGET TAX ASSESSOR PROGRAM HIGHLIGHTS
CITY OF BRIDGEPORT, CONNECTICUT
FY 2017 – 2018 GOAL STATUS
1. Staff members attended CAAO (Connecticut Association of Assessing Officers) completedappraisal course offerings at the annual CT Assessor’s School at UCONN, Storrs, CT. Continued weekly staff meetings, except during 2017 Grand List compilation months of December and January. Themeetings enable staff to focus on CT assessment deadline(s) process compliance and foster a teamapproach to achieve those goals.
2. Continued to be an administrative and data resource to the Board of Assessment Appeals duringtheir February to April and September 2018 schedule.
3. Completed all 2016 personal property audit work. Findings resulted in $344,000 of additionalcollectable tax revenues on 23 business audited accounts. On October 1, 2017 initiated 46 new auditreviews to conclude in FY 2017-2018.
4. Initiated bar coding registry of CT mandated annual filings of personal property declarations andincome and expense forms. This automates verification of filing date verification, documents thedelinquent and non-compliant filings to impose CT mandated assessment penalty taxes.
FY 2017 – 2018 ADDITIONAL ACCOMPLISHMENTS
1. Worked with City Attorney Office to settle 80% of the assessment tax appeals pursuant to the 2008and 2015 Grand List revaluations.
2. Completed and certified the 2017 Grand List and the review of 2017 quadrennial exemptproperties on January 31, 2018, as required by CT General Statutes.
3. Despite 2017 staff reduction maintained taxpayer service and property assessment goals.
4. Identified personal property accounts that were no longer active based on site inspections.
142
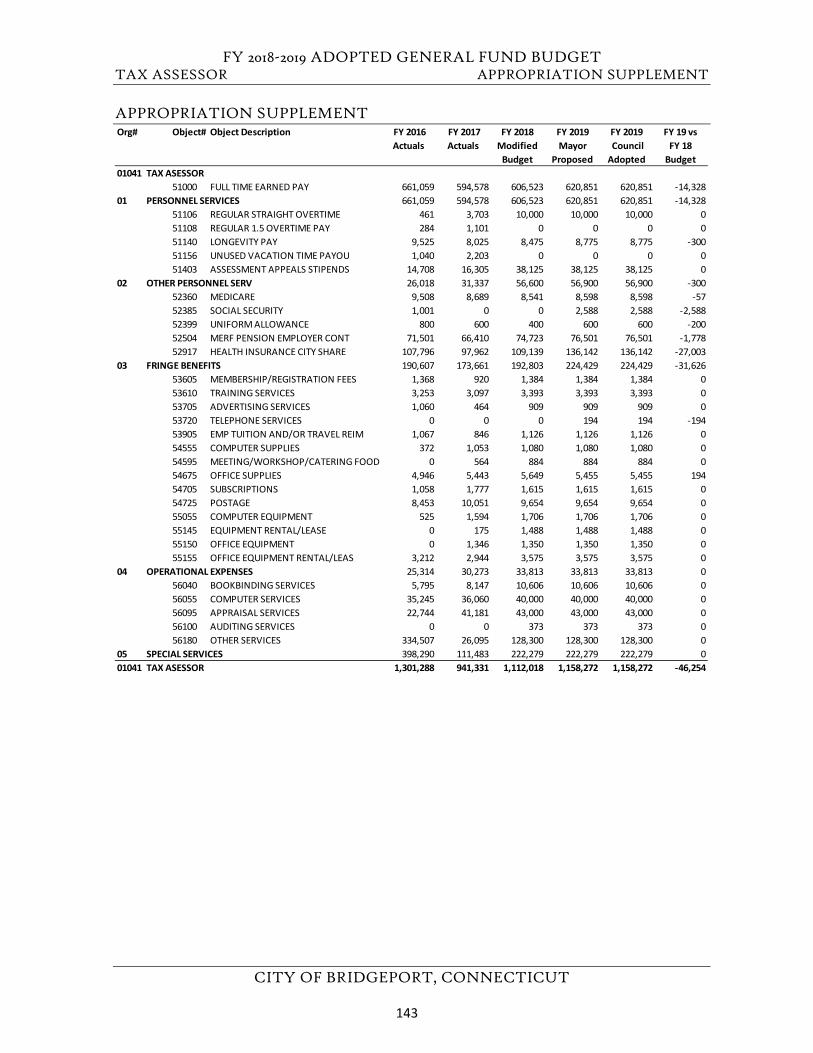
FY 2018-2019 ADOPTED GENERAL FUND BUDGET TAX ASSESSOR APPROPRIATION SUPPLEMENT
CITY OF BRIDGEPORT, CONNECTICUT
APPROPRIATION SUPPLEMENT Org# Object# Object Description FY 2016
Actuals FY 2017 Actuals
FY 2018 Modified
Budget
FY 2019Mayor
Proposed
FY 2019 Council Adopted
FY 19 vs FY 18
Budget01041 TAX ASESSOR
51000 FULL TIME EARNED PAY 661,059 594,578 606,523 620,851 620,851 -14,32801 PERSONNEL SERVICES 661,059 594,578 606,523 620,851 620,851 -14,328
51106 REGULAR STRAIGHT OVERTIME 461 3,703 10,000 10,000 10,000 051108 REGULAR 1.5 OVERTIME PAY 284 1,101 0 0 0 051140 LONGEVITY PAY 9,525 8,025 8,475 8,775 8,775 -30051156 UNUSED VACATION TIME PAYOU 1,040 2,203 0 0 0 051403 ASSESSMENT APPEALS STIPENDS 14,708 16,305 38,125 38,125 38,125 0
02 OTHER PERSONNEL SERV 26,018 31,337 56,600 56,900 56,900 -30052360 MEDICARE 9,508 8,689 8,541 8,598 8,598 -5752385 SOCIAL SECURITY 1,001 0 0 2,588 2,588 -2,58852399 UNIFORM ALLOWANCE 800 600 400 600 600 -20052504 MERF PENSION EMPLOYER CONT 71,501 66,410 74,723 76,501 76,501 -1,77852917 HEALTH INSURANCE CITY SHARE 107,796 97,962 109,139 136,142 136,142 -27,003
03 FRINGE BENEFITS 190,607 173,661 192,803 224,429 224,429 -31,62653605 MEMBERSHIP/REGISTRATION FEES 1,368 920 1,384 1,384 1,384 053610 TRAINING SERVICES 3,253 3,097 3,393 3,393 3,393 053705 ADVERTISING SERVICES 1,060 464 909 909 909 053720 TELEPHONE SERVICES 0 0 0 194 194 -19453905 EMP TUITION AND/OR TRAVEL REIM 1,067 846 1,126 1,126 1,126 054555 COMPUTER SUPPLIES 372 1,053 1,080 1,080 1,080 054595 MEETING/WORKSHOP/CATERING FOOD 0 564 884 884 884 054675 OFFICE SUPPLIES 4,946 5,443 5,649 5,455 5,455 19454705 SUBSCRIPTIONS 1,058 1,777 1,615 1,615 1,615 054725 POSTAGE 8,453 10,051 9,654 9,654 9,654 055055 COMPUTER EQUIPMENT 525 1,594 1,706 1,706 1,706 055145 EQUIPMENT RENTAL/LEASE 0 175 1,488 1,488 1,488 055150 OFFICE EQUIPMENT 0 1,346 1,350 1,350 1,350 055155 OFFICE EQUIPMENT RENTAL/LEAS 3,212 2,944 3,575 3,575 3,575 0
04 OPERATIONAL EXPENSES 25,314 30,273 33,813 33,813 33,813 056040 BOOKBINDING SERVICES 5,795 8,147 10,606 10,606 10,606 056055 COMPUTER SERVICES 35,245 36,060 40,000 40,000 40,000 056095 APPRAISAL SERVICES 22,744 41,181 43,000 43,000 43,000 056100 AUDITING SERVICES 0 0 373 373 373 056180 OTHER SERVICES 334,507 26,095 128,300 128,300 128,300 0
05 SPECIAL SERVICES 398,290 111,483 222,279 222,279 222,279 001041 TAX ASESSOR 1,301,288 941,331 1,112,018 1,158,272 1,158,272 -46,254
143

FY 2018-2019 ADOPTED GENERAL FUND BUDGET
CITY OF BRIDGEPORT, CONNECTICUT
This page left blank intentionally.
144
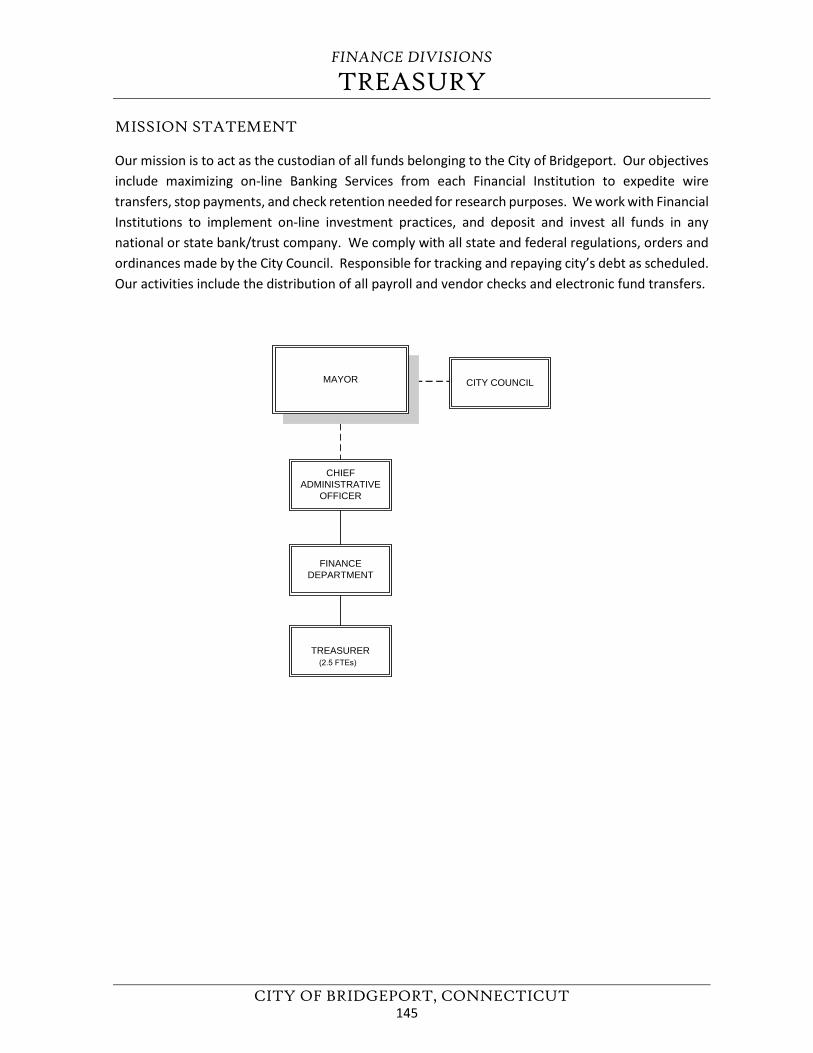
FINANCE DIVISIONS
TREASURY
CITY OF BRIDGEPORT, CONNECTICUT
MISSION STATEMENT
Our mission is to act as the custodian of all funds belonging to the City of Bridgeport. Our objectives include maximizing on-line Banking Services from each Financial Institution to expedite wire transfers, stop payments, and check retention needed for research purposes. We work with Financial Institutions to implement on-line investment practices, and deposit and invest all funds in any national or state bank/trust company. We comply with all state and federal regulations, orders and ordinances made by the City Council. Responsible for tracking and repaying city’s debt as scheduled. Our activities include the distribution of all payroll and vendor checks and electronic fund transfers.
CHIEFADMINISTRATIVE
OFFICER
FINANCEDEPARTMENT
TREASURER (2.5 FTEs)
MAYOR CITY COUNCIL
145
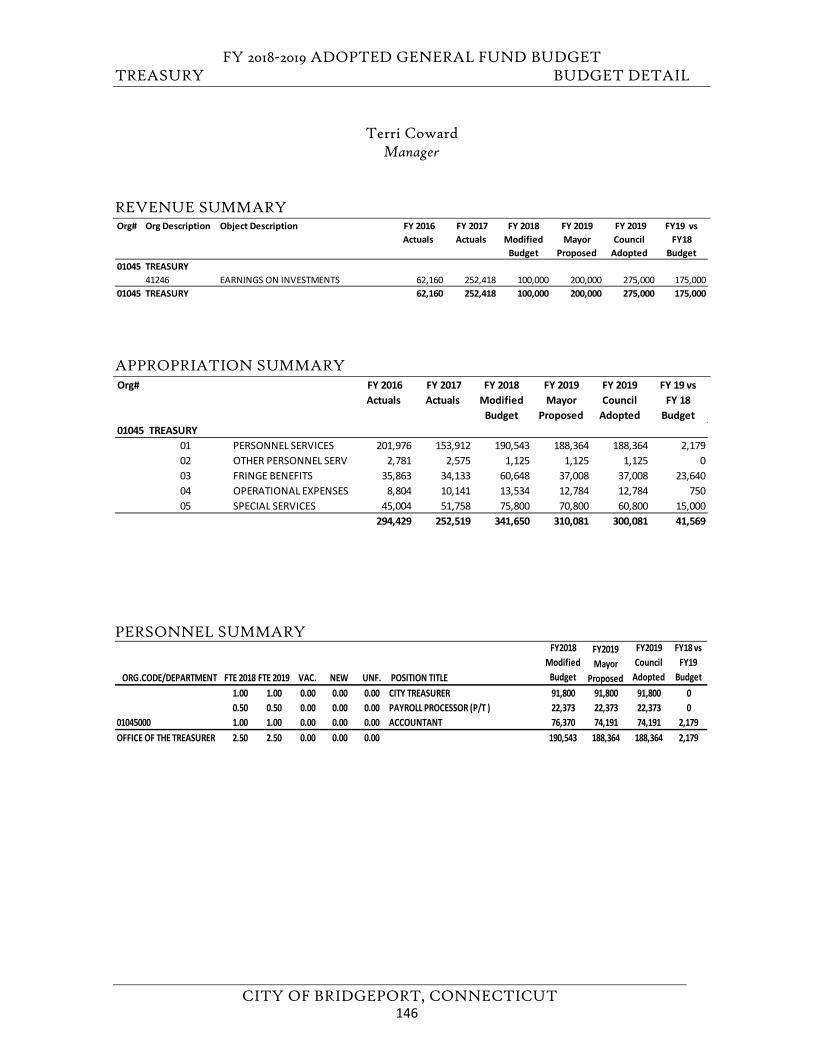
FY 2018-2019 ADOPTED GENERAL FUND BUDGET TREASURY BUDGET DETAIL
CITY OF BRIDGEPORT, CONNECTICUT
Terri Coward Manager
REVENUE SUMMARY
APPROPRIATION SUMMARY
PERSONNEL SUMMARY
Org# Org Description Object Description FY 2016 Actuals
FY 2017 Actuals
FY 2018 Modified
Budget
FY 2019 Mayor
Proposed
FY 2019 Council
Adopted
FY19 vs FY18
Budget01045 TREASURY
41246 EARNINGS ON INVESTMENTS 62,160 252,418 100,000 200,000 275,000 175,00001045 TREASURY 62,160 252,418 100,000 200,000 275,000 175,000
Org# FY 2016 Actuals
FY 2017 Actuals
FY 2018 Modified
Budget
FY 2019 Mayor
Proposed
FY 2019 Council
Adopted
FY 19 vs FY 18
Budget01045 TREASURY
01 PERSONNEL SERVICES 201,976 153,912 190,543 188,364 188,364 2,17902 OTHER PERSONNEL SERV 2,781 2,575 1,125 1,125 1,125 003 FRINGE BENEFITS 35,863 34,133 60,648 37,008 37,008 23,64004 OPERATIONAL EXPENSES 8,804 10,141 13,534 12,784 12,784 75005 SPECIAL SERVICES 45,004 51,758 75,800 70,800 60,800 15,000
294,429 252,519 341,650 310,081 300,081 41,569
ORG.CODE/DEPARTMENT FTE 2018 FTE 2019 VAC. NEW UNF. POSITION TITLE
FY2018 Modified
Budget
FY2019 Mayor
Proposed
FY2019 Council
Adopted
FY18 vs FY19
Budget 1.00 1.00 0.00 0.00 0.00 CITY TREASURER 91,800 91,800 91,800 00.50 0.50 0.00 0.00 0.00 PAYROLL PROCESSOR (P/T ) 22,373 22,373 22,373 0
01045000 1.00 1.00 0.00 0.00 0.00 ACCOUNTANT 76,370 74,191 74,191 2,179OFFICE OF THE TREASURER 2.50 2.50 0.00 0.00 0.00 190,543 188,364 188,364 2,179
146
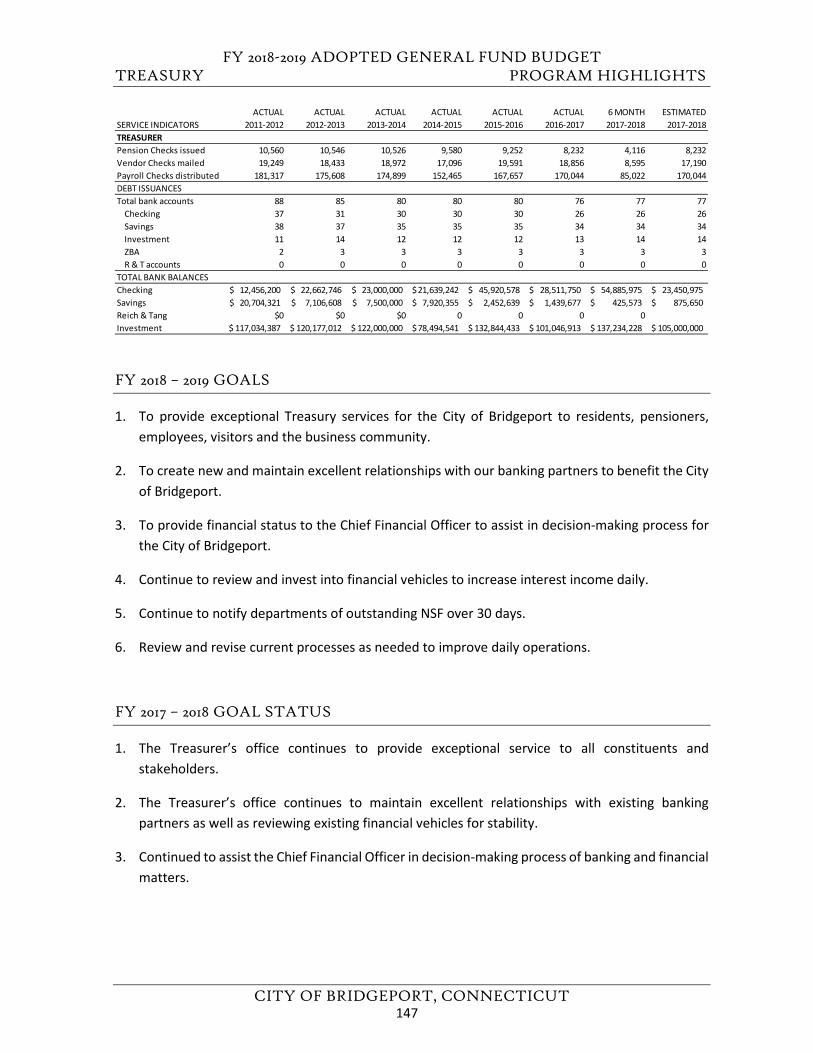
FY 2018-2019 ADOPTED GENERAL FUND BUDGET TREASURY PROGRAM HIGHLIGHTS
CITY OF BRIDGEPORT, CONNECTICUT
FY 2018 – 2019 GOALS
1. To provide exceptional Treasury services for the City of Bridgeport to residents, pensioners,employees, visitors and the business community.
2. To create new and maintain excellent relationships with our banking partners to benefit the Cityof Bridgeport.
3. To provide financial status to the Chief Financial Officer to assist in decision-making process forthe City of Bridgeport.
4. Continue to review and invest into financial vehicles to increase interest income daily.
5. Continue to notify departments of outstanding NSF over 30 days.
6. Review and revise current processes as needed to improve daily operations.
FY 2017 – 2018 GOAL STATUS
1. The Treasurer’s office continues to provide exceptional service to all constituents andstakeholders.
2. The Treasurer’s office continues to maintain excellent relationships with existing bankingpartners as well as reviewing existing financial vehicles for stability.
3. Continued to assist the Chief Financial Officer in decision-making process of banking and financialmatters.
ACTUAL ACTUAL ACTUAL ACTUAL ACTUAL ACTUAL 6 MONTH ESTIMATEDSERVICE INDICATORS 2011-2012 2012-2013 2013-2014 2014-2015 2015-2016 2016-2017 2017-2018 2017-2018TREASURERPension Checks issued 10,560 10,546 10,526 9,580 9,252 8,232 4,116 8,232Vendor Checks mailed 19,249 18,433 18,972 17,096 19,591 18,856 8,595 17,190Payroll Checks distributed 181,317 175,608 174,899 152,465 167,657 170,044 85,022 170,044DEBT ISSUANCESTotal bank accounts 88 85 80 80 80 76 77 77
Checking 37 31 30 30 30 26 26 26Savings 38 37 35 35 35 34 34 34Investment 11 14 12 12 12 13 14 14ZBA 2 3 3 3 3 3 3 3R & T accounts 0 0 0 0 0 0 0 0
TOTAL BANK BALANCESChecking 12,456,200$ 22,662,746$ 23,000,000$ 21,639,242$ 45,920,578$ 28,511,750$ 54,885,975$ 23,450,975$ Savings 20,704,321$ 7,106,608$ 7,500,000$ 7,920,355$ 2,452,639$ 1,439,677$ 425,573$ 875,650$ Reich & Tang $0 $0 $0 0 0 0 0Investment 117,034,387$ 120,177,012$ 122,000,000$ 78,494,541$ 132,844,433$ 101,046,913$ 137,234,228$ 105,000,000$
147
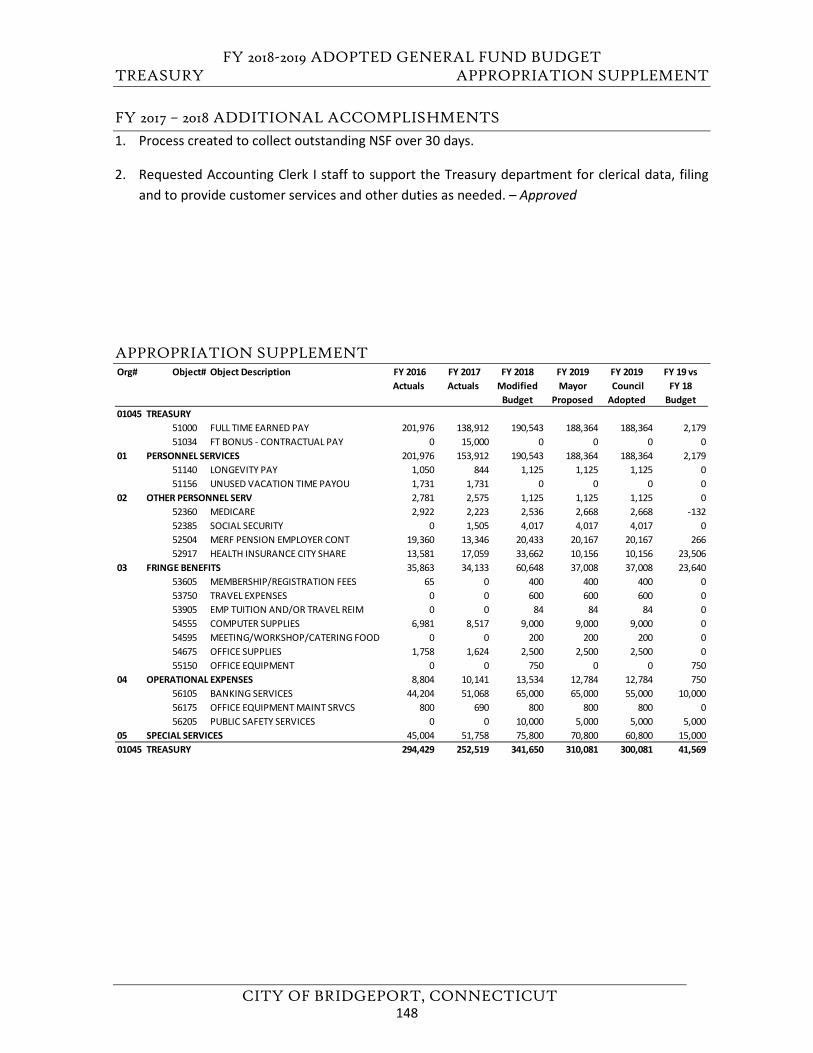
FY 2018-2019 ADOPTED GENERAL FUND BUDGET TREASURY APPROPRIATION SUPPLEMENT
CITY OF BRIDGEPORT, CONNECTICUT
FY 2017 – 2018 ADDITIONAL ACCOMPLISHMENTS 1. Process created to collect outstanding NSF over 30 days.
2. Requested Accounting Clerk I staff to support the Treasury department for clerical data, filingand to provide customer services and other duties as needed. – Approved
APPROPRIATION SUPPLEMENT Org# Object# Object Description FY 2016
Actuals FY 2017 Actuals
FY 2018 Modified
Budget
FY 2019Mayor
Proposed
FY 2019 Council Adopted
FY 19 vs FY 18
Budget01045 TREASURY
51000 FULL TIME EARNED PAY 201,976 138,912 190,543 188,364 188,364 2,17951034 FT BONUS - CONTRACTUAL PAY 0 15,000 0 0 0 0
01 PERSONNEL SERVICES 201,976 153,912 190,543 188,364 188,364 2,17951140 LONGEVITY PAY 1,050 844 1,125 1,125 1,125 051156 UNUSED VACATION TIME PAYOU 1,731 1,731 0 0 0 0
02 OTHER PERSONNEL SERV 2,781 2,575 1,125 1,125 1,125 052360 MEDICARE 2,922 2,223 2,536 2,668 2,668 -13252385 SOCIAL SECURITY 0 1,505 4,017 4,017 4,017 052504 MERF PENSION EMPLOYER CONT 19,360 13,346 20,433 20,167 20,167 26652917 HEALTH INSURANCE CITY SHARE 13,581 17,059 33,662 10,156 10,156 23,506
03 FRINGE BENEFITS 35,863 34,133 60,648 37,008 37,008 23,64053605 MEMBERSHIP/REGISTRATION FEES 65 0 400 400 400 053750 TRAVEL EXPENSES 0 0 600 600 600 053905 EMP TUITION AND/OR TRAVEL REIM 0 0 84 84 84 054555 COMPUTER SUPPLIES 6,981 8,517 9,000 9,000 9,000 054595 MEETING/WORKSHOP/CATERING FOOD 0 0 200 200 200 054675 OFFICE SUPPLIES 1,758 1,624 2,500 2,500 2,500 055150 OFFICE EQUIPMENT 0 0 750 0 0 750
04 OPERATIONAL EXPENSES 8,804 10,141 13,534 12,784 12,784 75056105 BANKING SERVICES 44,204 51,068 65,000 65,000 55,000 10,00056175 OFFICE EQUIPMENT MAINT SRVCS 800 690 800 800 800 056205 PUBLIC SAFETY SERVICES 0 0 10,000 5,000 5,000 5,000
05 SPECIAL SERVICES 45,004 51,758 75,800 70,800 60,800 15,00001045 TREASURY 294,429 252,519 341,650 310,081 300,081 41,569
148
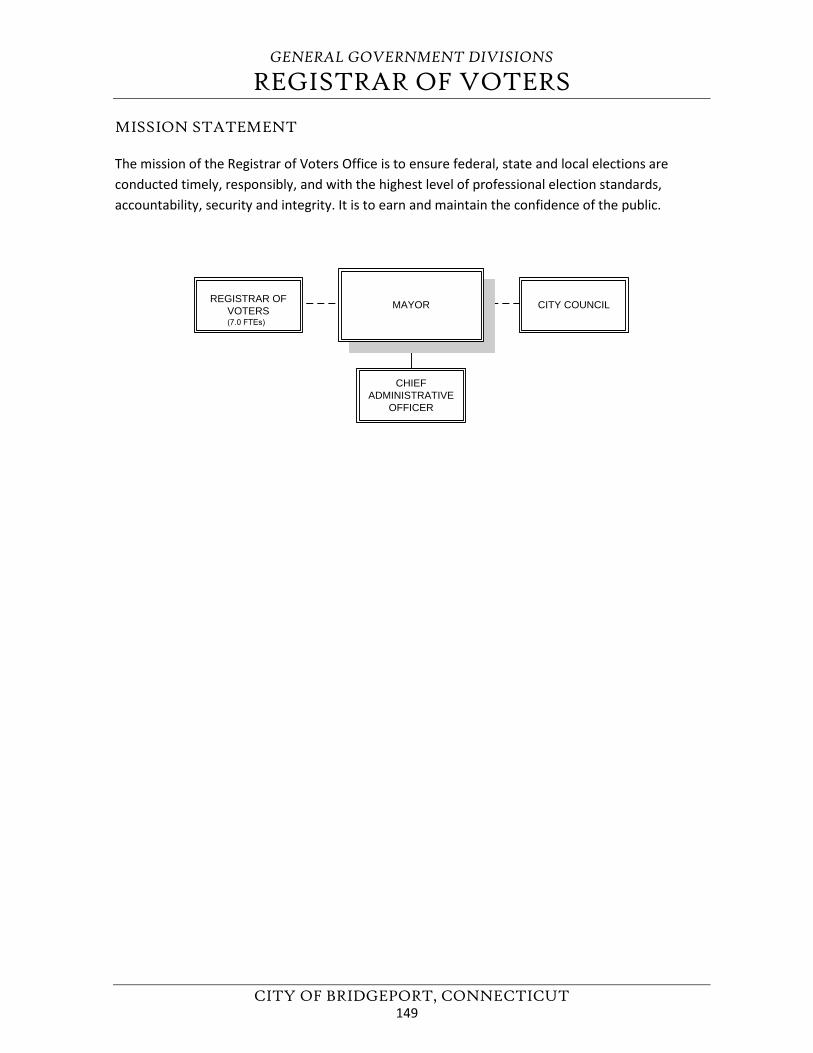
GENERAL GOVERNMENT DIVISIONS
REGISTRAR OF VOTERS
CITY OF BRIDGEPORT, CONNECTICUT
MISSION STATEMENT
The mission of the Registrar of Voters Office is to ensure federal, state and local elections are conducted timely, responsibly, and with the highest level of professional election standards, accountability, security and integrity. It is to earn and maintain the confidence of the public.
CHIEFADMINISTRATIVE
OFFICER
CITY COUNCILREGISTRAR OFVOTERS(7.0 FTEs)
MAYOR
149
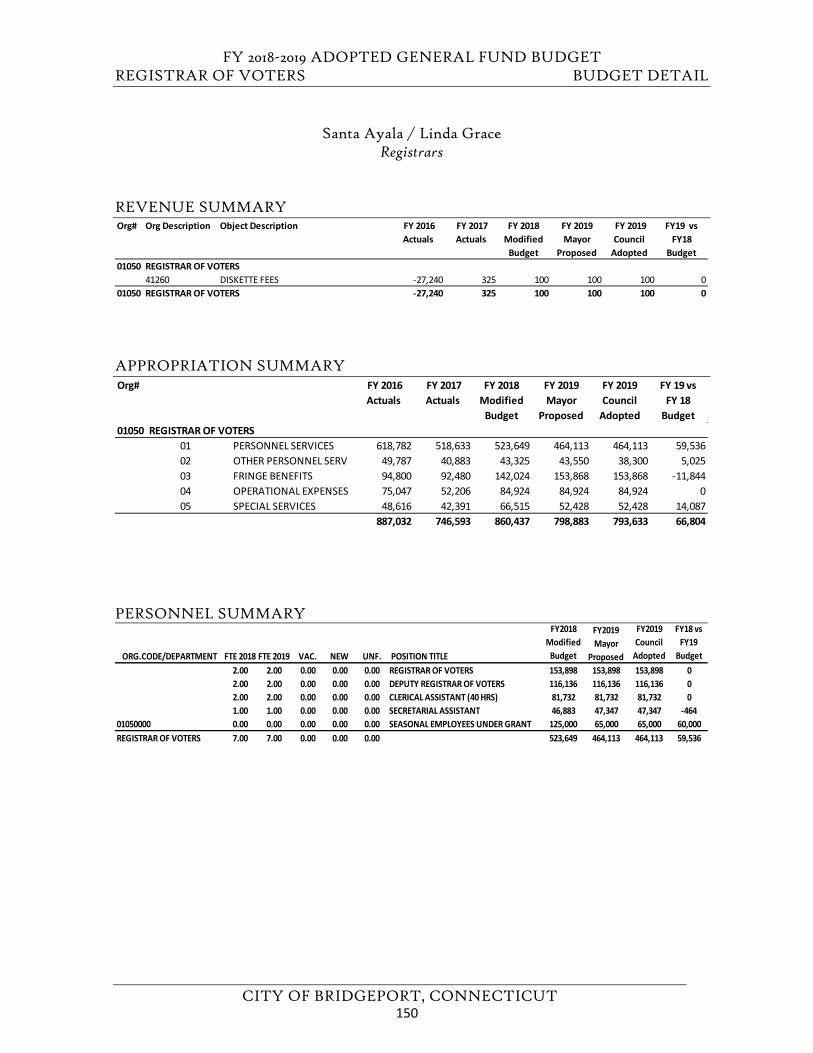
FY 2018-2019 ADOPTED GENERAL FUND BUDGET REGISTRAR OF VOTERS BUDGET DETAIL
CITY OF BRIDGEPORT, CONNECTICUT
Santa Ayala / Linda Grace Registrars
REVENUE SUMMARY
APPROPRIATION SUMMARY
PERSONNEL SUMMARY
Org# Org Description Object Description FY 2016 Actuals
FY 2017 Actuals
FY 2018 Modified
Budget
FY 2019 Mayor
Proposed
FY 2019 Council
Adopted
FY19 vs FY18
Budget01050 REGISTRAR OF VOTERS
41260 DISKETTE FEES -27,240 325 100 100 100 001050 REGISTRAR OF VOTERS -27,240 325 100 100 100 0
Org# FY 2016 Actuals
FY 2017 Actuals
FY 2018 Modified
Budget
FY 2019 Mayor
Proposed
FY 2019 Council
Adopted
FY 19 vs FY 18
Budget01050 REGISTRAR OF VOTERS
01 PERSONNEL SERVICES 618,782 518,633 523,649 464,113 464,113 59,53602 OTHER PERSONNEL SERV 49,787 40,883 43,325 43,550 38,300 5,02503 FRINGE BENEFITS 94,800 92,480 142,024 153,868 153,868 -11,84404 OPERATIONAL EXPENSES 75,047 52,206 84,924 84,924 84,924 005 SPECIAL SERVICES 48,616 42,391 66,515 52,428 52,428 14,087
887,032 746,593 860,437 798,883 793,633 66,804
ORG.CODE/DEPARTMENT FTE 2018 FTE 2019 VAC. NEW UNF. POSITION TITLE
FY2018 Modified
Budget
FY2019 Mayor
Proposed
FY2019 Council
Adopted
FY18 vs FY19
Budget 2.00 2.00 0.00 0.00 0.00 REGISTRAR OF VOTERS 153,898 153,898 153,898 02.00 2.00 0.00 0.00 0.00 DEPUTY REGISTRAR OF VOTERS 116,136 116,136 116,136 02.00 2.00 0.00 0.00 0.00 CLERICAL ASSISTANT (40 HRS) 81,732 81,732 81,732 01.00 1.00 0.00 0.00 0.00 SECRETARIAL ASSISTANT 46,883 47,347 47,347 -464
01050000 0.00 0.00 0.00 0.00 0.00 SEASONAL EMPLOYEES UNDER GRANT 125,000 65,000 65,000 60,000REGISTRAR OF VOTERS 7.00 7.00 0.00 0.00 0.00 523,649 464,113 464,113 59,536
150
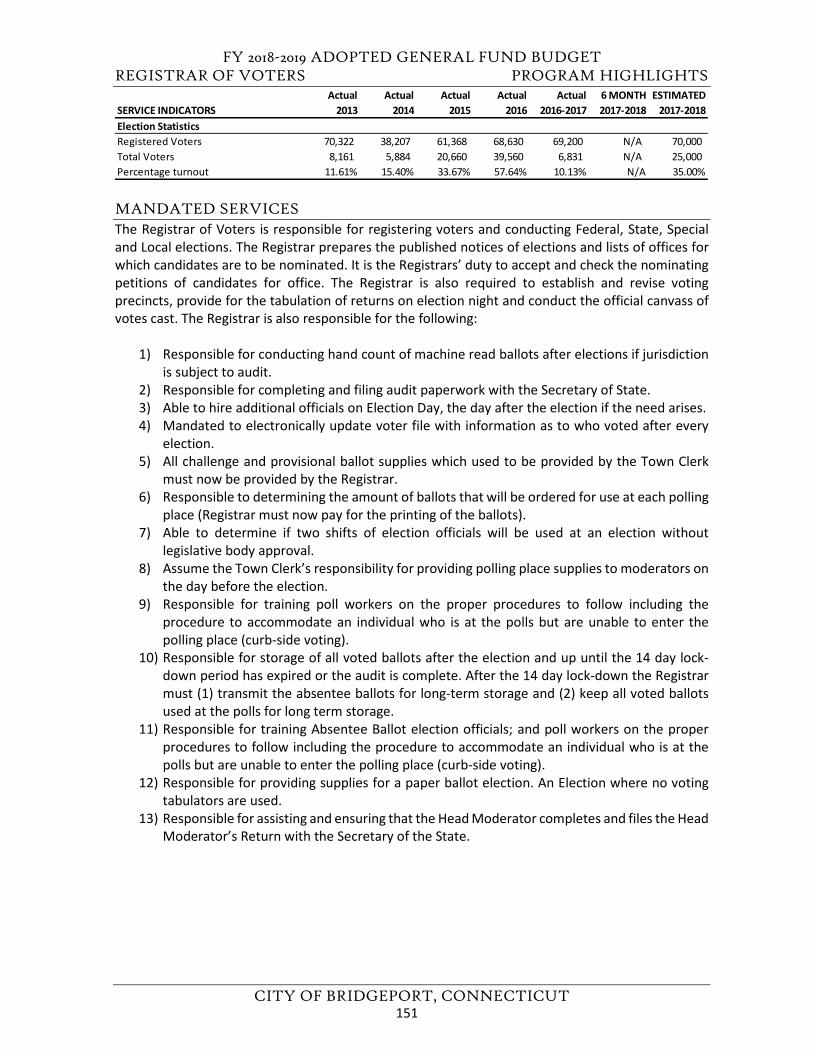
FY 2018-2019 ADOPTED GENERAL FUND BUDGET REGISTRAR OF VOTERS PROGRAM HIGHLIGHTS
CITY OF BRIDGEPORT, CONNECTICUT
MANDATED SERVICES The Registrar of Voters is responsible for registering voters and conducting Federal, State, Special and Local elections. The Registrar prepares the published notices of elections and lists of offices for which candidates are to be nominated. It is the Registrars’ duty to accept and check the nominating petitions of candidates for office. The Registrar is also required to establish and revise voting precincts, provide for the tabulation of returns on election night and conduct the official canvass of votes cast. The Registrar is also responsible for the following:
1) Responsible for conducting hand count of machine read ballots after elections if jurisdictionis subject to audit.
2) Responsible for completing and filing audit paperwork with the Secretary of State.3) Able to hire additional officials on Election Day, the day after the election if the need arises.4) Mandated to electronically update voter file with information as to who voted after every
election.5) All challenge and provisional ballot supplies which used to be provided by the Town Clerk
must now be provided by the Registrar.6) Responsible to determining the amount of ballots that will be ordered for use at each polling
place (Registrar must now pay for the printing of the ballots).7) Able to determine if two shifts of election officials will be used at an election without
legislative body approval.8) Assume the Town Clerk’s responsibility for providing polling place supplies to moderators on
the day before the election.9) Responsible for training poll workers on the proper procedures to follow including the
procedure to accommodate an individual who is at the polls but are unable to enter thepolling place (curb-side voting).
10) Responsible for storage of all voted ballots after the election and up until the 14 day lock-down period has expired or the audit is complete. After the 14 day lock-down the Registrarmust (1) transmit the absentee ballots for long-term storage and (2) keep all voted ballotsused at the polls for long term storage.
11) Responsible for training Absentee Ballot election officials; and poll workers on the properprocedures to follow including the procedure to accommodate an individual who is at thepolls but are unable to enter the polling place (curb-side voting).
12) Responsible for providing supplies for a paper ballot election. An Election where no votingtabulators are used.
13) Responsible for assisting and ensuring that the Head Moderator completes and files the Head Moderator’s Return with the Secretary of the State.
Actual Actual Actual Actual Actual 6 MONTH ESTIMATEDSERVICE INDICATORS 2013 2014 2015 2016 2016-2017 2017-2018 2017-2018Election StatisticsRegistered Voters 70,322 38,207 61,368 68,630 69,200 N/A 70,000 Total Voters 8,161 5,884 20,660 39,560 6,831 N/A 25,000 Percentage turnout 11.61% 15.40% 33.67% 57.64% 10.13% N/A 35.00%
151
FY 2018-2019 ADOPTED GENERAL FUND BUDGET REGISTRAR OF VOTERS PROGRAM HIGHLIGHTS
CITY OF BRIDGEPORT, CONNECTICUT
FY 2018 – 2019 GOALS
1. Successful implementation of the multiple new election laws that have been passed over the past4 years.
2. Strive to listen to and meet the needs of the voters
3. Complete certification of new moderators and recertify existing moderators
4. Maintenance of voter files and tabulators in preparation for the upcoming elections.
FY 2017 – 2018 GOAL STATUS
1. The registrars completed a certification process administered by the SOTS
2. Our office certified 5 New Moderators and recertified 12 existing.
3. Our office is still completing the maintenance on existing voter files.
152
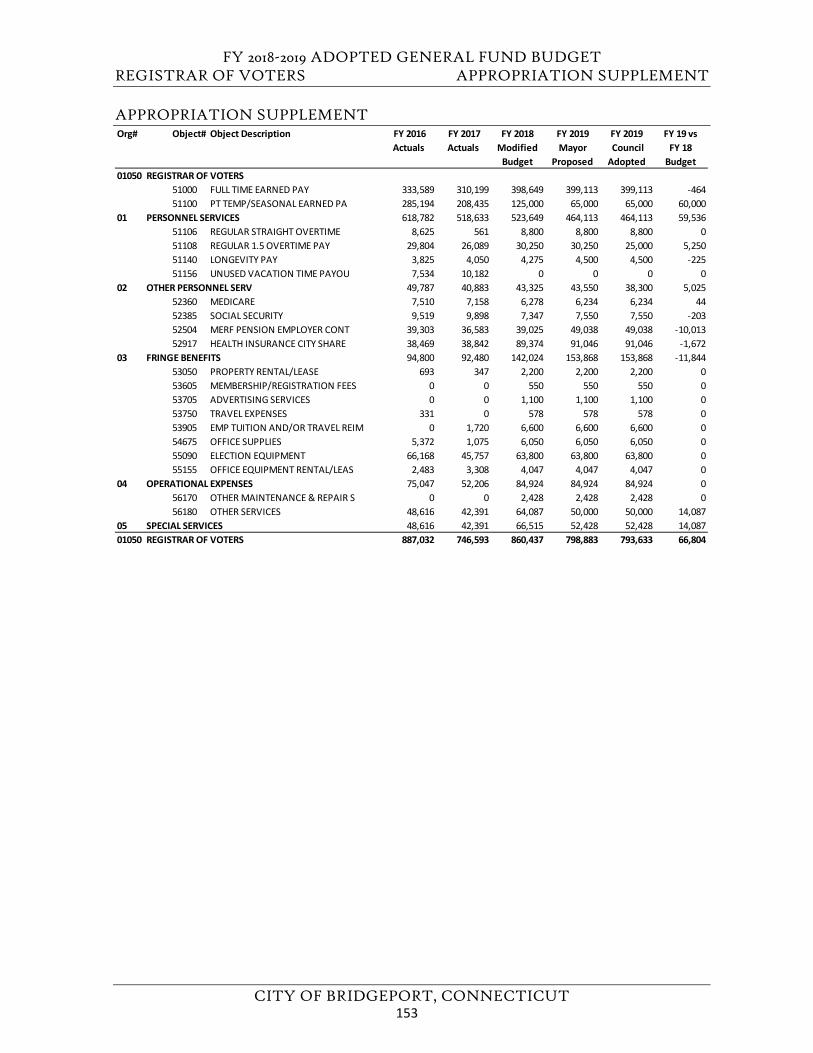
FY 2018-2019 ADOPTED GENERAL FUND BUDGET REGISTRAR OF VOTERS APPROPRIATION SUPPLEMENT
CITY OF BRIDGEPORT, CONNECTICUT
APPROPRIATION SUPPLEMENT Org# Object# Object Description FY 2016
Actuals FY 2017 Actuals
FY 2018 Modified
Budget
FY 2019Mayor
Proposed
FY 2019 Council Adopted
FY 19 vs FY 18
Budget01050 REGISTRAR OF VOTERS
51000 FULL TIME EARNED PAY 333,589 310,199 398,649 399,113 399,113 -46451100 PT TEMP/SEASONAL EARNED PA 285,194 208,435 125,000 65,000 65,000 60,000
01 PERSONNEL SERVICES 618,782 518,633 523,649 464,113 464,113 59,53651106 REGULAR STRAIGHT OVERTIME 8,625 561 8,800 8,800 8,800 051108 REGULAR 1.5 OVERTIME PAY 29,804 26,089 30,250 30,250 25,000 5,25051140 LONGEVITY PAY 3,825 4,050 4,275 4,500 4,500 -22551156 UNUSED VACATION TIME PAYOU 7,534 10,182 0 0 0 0
02 OTHER PERSONNEL SERV 49,787 40,883 43,325 43,550 38,300 5,02552360 MEDICARE 7,510 7,158 6,278 6,234 6,234 4452385 SOCIAL SECURITY 9,519 9,898 7,347 7,550 7,550 -20352504 MERF PENSION EMPLOYER CONT 39,303 36,583 39,025 49,038 49,038 -10,01352917 HEALTH INSURANCE CITY SHARE 38,469 38,842 89,374 91,046 91,046 -1,672
03 FRINGE BENEFITS 94,800 92,480 142,024 153,868 153,868 -11,84453050 PROPERTY RENTAL/LEASE 693 347 2,200 2,200 2,200 053605 MEMBERSHIP/REGISTRATION FEES 0 0 550 550 550 053705 ADVERTISING SERVICES 0 0 1,100 1,100 1,100 053750 TRAVEL EXPENSES 331 0 578 578 578 053905 EMP TUITION AND/OR TRAVEL REIM 0 1,720 6,600 6,600 6,600 054675 OFFICE SUPPLIES 5,372 1,075 6,050 6,050 6,050 055090 ELECTION EQUIPMENT 66,168 45,757 63,800 63,800 63,800 055155 OFFICE EQUIPMENT RENTAL/LEAS 2,483 3,308 4,047 4,047 4,047 0
04 OPERATIONAL EXPENSES 75,047 52,206 84,924 84,924 84,924 056170 OTHER MAINTENANCE & REPAIR S 0 0 2,428 2,428 2,428 056180 OTHER SERVICES 48,616 42,391 64,087 50,000 50,000 14,087
05 SPECIAL SERVICES 48,616 42,391 66,515 52,428 52,428 14,08701050 REGISTRAR OF VOTERS 887,032 746,593 860,437 798,883 793,633 66,804
153

FY 2018-2019 ADOPTED GENERAL FUND BUDGET
CITY OF BRIDGEPORT, CONNECTICUT
This page left blank intentionally.
154
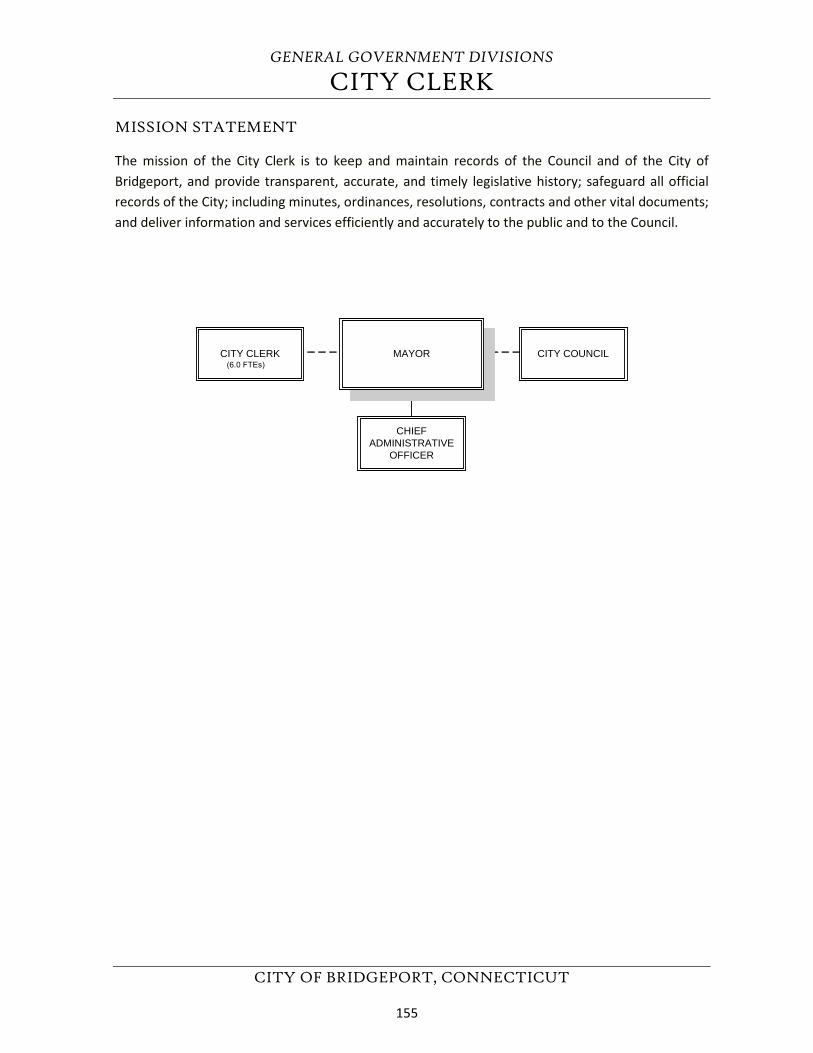
GENERAL GOVERNMENT DIVISIONS
CITY CLERK
CITY OF BRIDGEPORT, CONNECTICUT
MISSION STATEMENT
The mission of the City Clerk is to keep and maintain records of the Council and of the City of Bridgeport, and provide transparent, accurate, and timely legislative history; safeguard all official records of the City; including minutes, ordinances, resolutions, contracts and other vital documents; and deliver information and services efficiently and accurately to the public and to the Council.
CHIEFADMINISTRATIVE
OFFICER
CITY COUNCILCITY CLERK (6.0 FTEs)
MAYOR
155
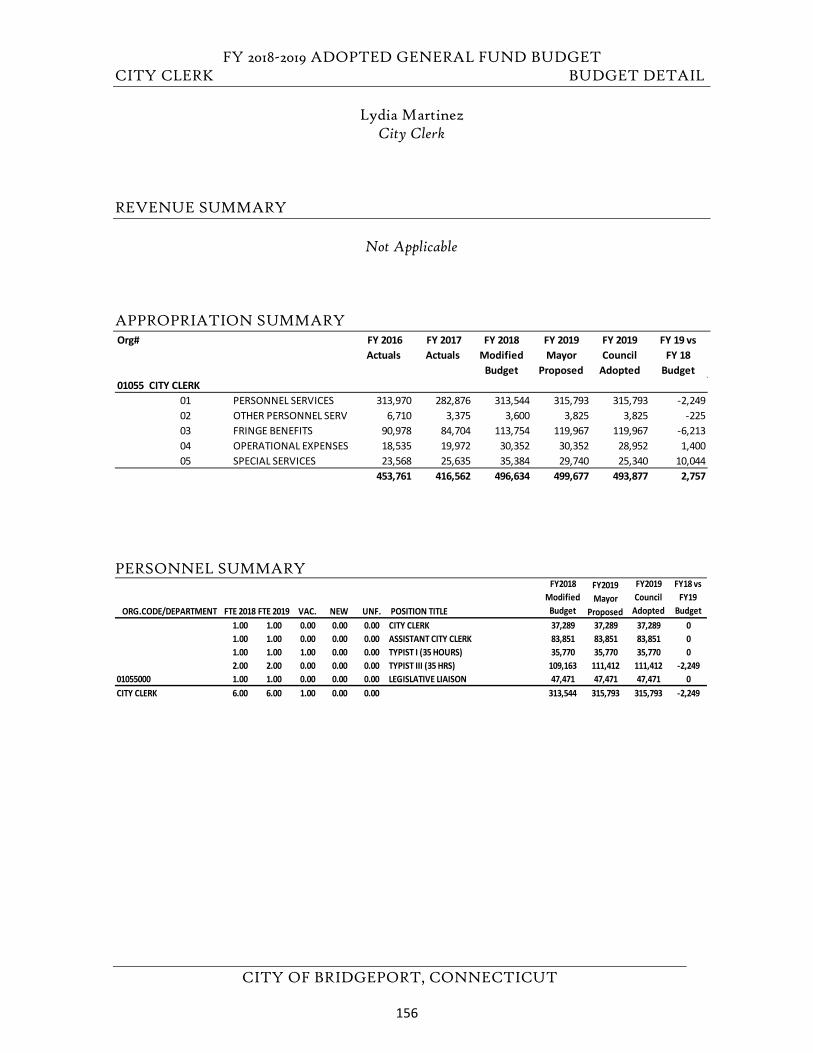
FY 2018-2019 ADOPTED GENERAL FUND BUDGET CITY CLERK BUDGET DETAIL
CITY OF BRIDGEPORT, CONNECTICUT
Lydia Martinez City Clerk
REVENUE SUMMARY
Not Applicable
APPROPRIATION SUMMARY
PERSONNEL SUMMARY
Org# FY 2016 Actuals
FY 2017 Actuals
FY 2018 Modified
Budget
FY 2019 Mayor
Proposed
FY 2019 Council
Adopted
FY 19 vs FY 18
Budget01055 CITY CLERK
01 PERSONNEL SERVICES 313,970 282,876 313,544 315,793 315,793 -2,24902 OTHER PERSONNEL SERV 6,710 3,375 3,600 3,825 3,825 -22503 FRINGE BENEFITS 90,978 84,704 113,754 119,967 119,967 -6,21304 OPERATIONAL EXPENSES 18,535 19,972 30,352 30,352 28,952 1,40005 SPECIAL SERVICES 23,568 25,635 35,384 29,740 25,340 10,044
453,761 416,562 496,634 499,677 493,877 2,757
ORG.CODE/DEPARTMENT FTE 2018 FTE 2019 VAC. NEW UNF. POSITION TITLE
FY2018 Modified
Budget
FY2019 Mayor
Proposed
FY2019 Council
Adopted
FY18 vs FY19
Budget 1.00 1.00 0.00 0.00 0.00 CITY CLERK 37,289 37,289 37,289 01.00 1.00 0.00 0.00 0.00 ASSISTANT CITY CLERK 83,851 83,851 83,851 01.00 1.00 1.00 0.00 0.00 TYPIST I (35 HOURS) 35,770 35,770 35,770 02.00 2.00 0.00 0.00 0.00 TYPIST III (35 HRS) 109,163 111,412 111,412 -2,249
01055000 1.00 1.00 0.00 0.00 0.00 LEGISLATIVE LIAISON 47,471 47,471 47,471 0CITY CLERK 6.00 6.00 1.00 0.00 0.00 313,544 315,793 315,793 -2,249
156
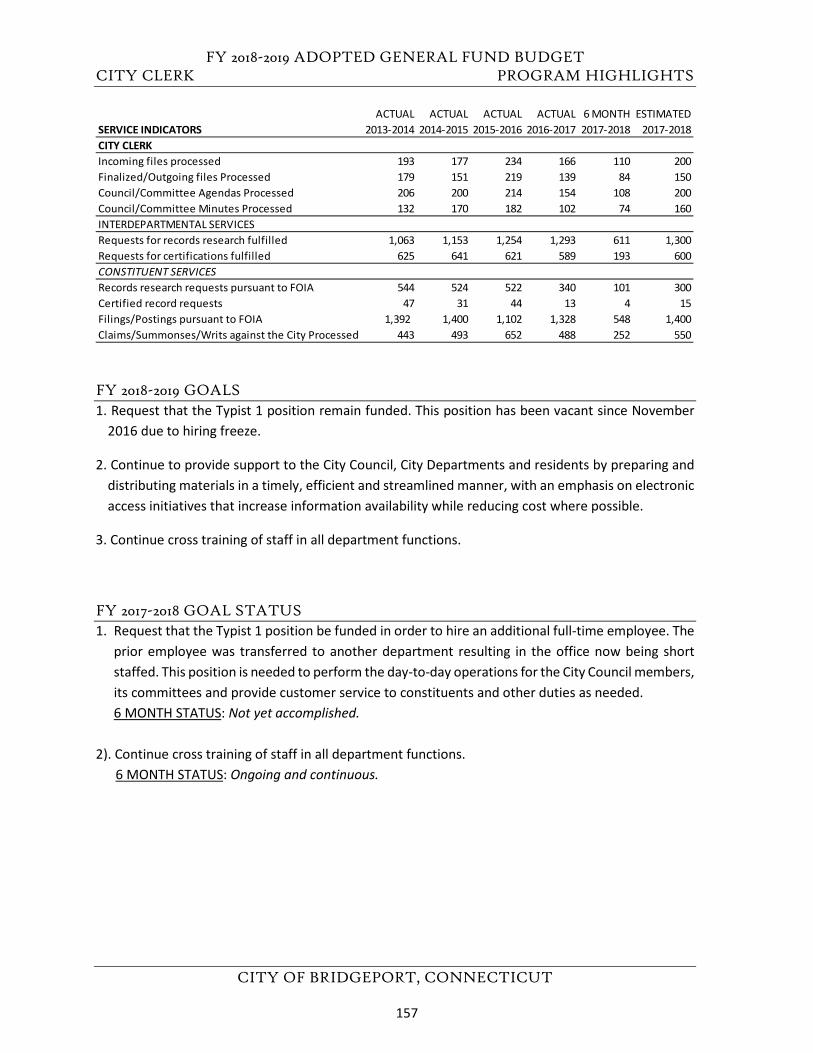
FY 2018-2019 ADOPTED GENERAL FUND BUDGET CITY CLERK PROGRAM HIGHLIGHTS
CITY OF BRIDGEPORT, CONNECTICUT
FY 2018-2019 GOALS 1. Request that the Typist 1 position remain funded. This position has been vacant since November
2016 due to hiring freeze.
2. Continue to provide support to the City Council, City Departments and residents by preparing anddistributing materials in a timely, efficient and streamlined manner, with an emphasis on electronicaccess initiatives that increase information availability while reducing cost where possible.
3. Continue cross training of staff in all department functions.
FY 2017-2018 GOAL STATUS 1. Request that the Typist 1 position be funded in order to hire an additional full-time employee. The
prior employee was transferred to another department resulting in the office now being shortstaffed. This position is needed to perform the day-to-day operations for the City Council members, its committees and provide customer service to constituents and other duties as needed.6 MONTH STATUS: Not yet accomplished.
2). Continue cross training of staff in all department functions. 6 MONTH STATUS: Ongoing and continuous.
ACTUAL ACTUAL ACTUAL ACTUAL 6 MONTH ESTIMATEDSERVICE INDICATORS 2013-2014 2014-2015 2015-2016 2016-2017 2017-2018 2017-2018CITY CLERKIncoming files processed 193 177 234 166 110 200Finalized/Outgoing files Processed 179 151 219 139 84 150Council/Committee Agendas Processed 206 200 214 154 108 200Council/Committee Minutes Processed 132 170 182 102 74 160INTERDEPARTMENTAL SERVICESRequests for records research fulfilled 1,063 1,153 1,254 1,293 611 1,300Requests for certifications fulfilled 625 641 621 589 193 600CONSTITUENT SERVICESRecords research requests pursuant to FOIA 544 524 522 340 101 300Certified record requests 47 31 44 13 4 15Filings/Postings pursuant to FOIA 1,392 1,400 1,102 1,328 548 1,400Claims/Summonses/Writs against the City Processed 443 493 652 488 252 550
157
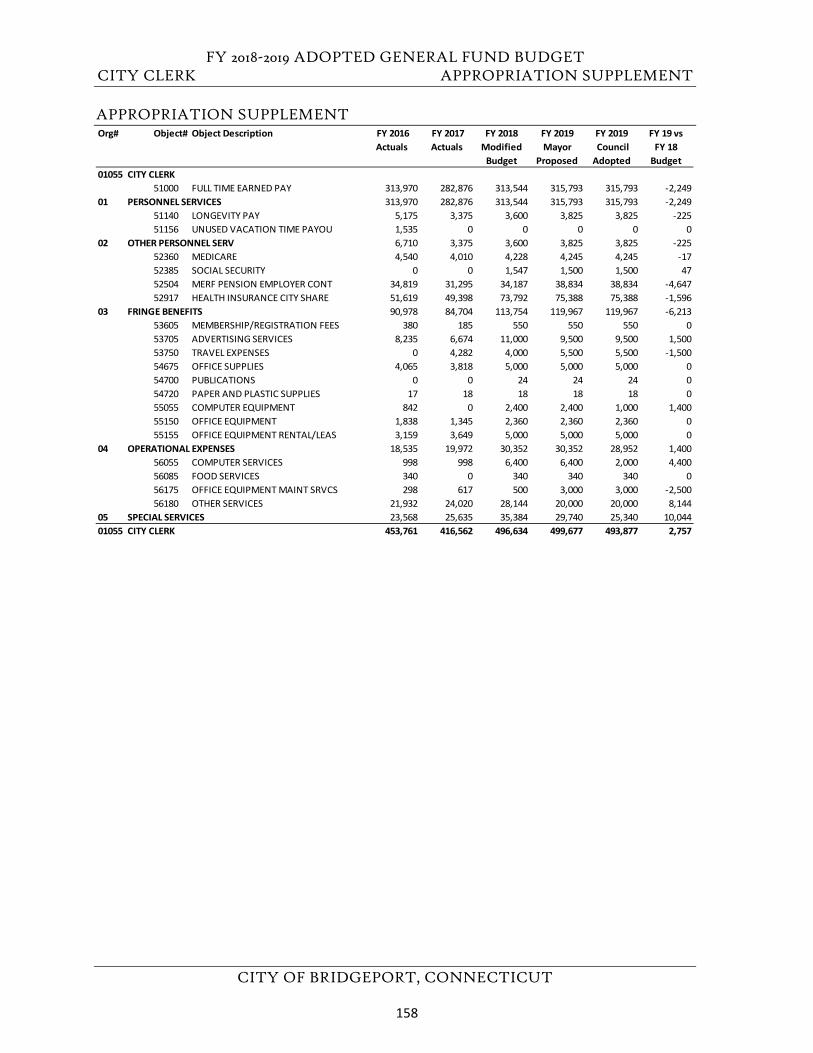
FY 2018-2019 ADOPTED GENERAL FUND BUDGET CITY CLERK APPROPRIATION SUPPLEMENT
CITY OF BRIDGEPORT, CONNECTICUT
APPROPRIATION SUPPLEMENT Org# Object# Object Description FY 2016
Actuals FY 2017 Actuals
FY 2018 Modified
Budget
FY 2019Mayor
Proposed
FY 2019 Council Adopted
FY 19 vs FY 18
Budget01055 CITY CLERK
51000 FULL TIME EARNED PAY 313,970 282,876 313,544 315,793 315,793 -2,24901 PERSONNEL SERVICES 313,970 282,876 313,544 315,793 315,793 -2,249
51140 LONGEVITY PAY 5,175 3,375 3,600 3,825 3,825 -22551156 UNUSED VACATION TIME PAYOU 1,535 0 0 0 0 0
02 OTHER PERSONNEL SERV 6,710 3,375 3,600 3,825 3,825 -22552360 MEDICARE 4,540 4,010 4,228 4,245 4,245 -1752385 SOCIAL SECURITY 0 0 1,547 1,500 1,500 4752504 MERF PENSION EMPLOYER CONT 34,819 31,295 34,187 38,834 38,834 -4,64752917 HEALTH INSURANCE CITY SHARE 51,619 49,398 73,792 75,388 75,388 -1,596
03 FRINGE BENEFITS 90,978 84,704 113,754 119,967 119,967 -6,21353605 MEMBERSHIP/REGISTRATION FEES 380 185 550 550 550 053705 ADVERTISING SERVICES 8,235 6,674 11,000 9,500 9,500 1,50053750 TRAVEL EXPENSES 0 4,282 4,000 5,500 5,500 -1,50054675 OFFICE SUPPLIES 4,065 3,818 5,000 5,000 5,000 054700 PUBLICATIONS 0 0 24 24 24 054720 PAPER AND PLASTIC SUPPLIES 17 18 18 18 18 055055 COMPUTER EQUIPMENT 842 0 2,400 2,400 1,000 1,40055150 OFFICE EQUIPMENT 1,838 1,345 2,360 2,360 2,360 055155 OFFICE EQUIPMENT RENTAL/LEAS 3,159 3,649 5,000 5,000 5,000 0
04 OPERATIONAL EXPENSES 18,535 19,972 30,352 30,352 28,952 1,40056055 COMPUTER SERVICES 998 998 6,400 6,400 2,000 4,40056085 FOOD SERVICES 340 0 340 340 340 056175 OFFICE EQUIPMENT MAINT SRVCS 298 617 500 3,000 3,000 -2,50056180 OTHER SERVICES 21,932 24,020 28,144 20,000 20,000 8,144
05 SPECIAL SERVICES 23,568 25,635 35,384 29,740 25,340 10,04401055 CITY CLERK 453,761 416,562 496,634 499,677 493,877 2,757
158
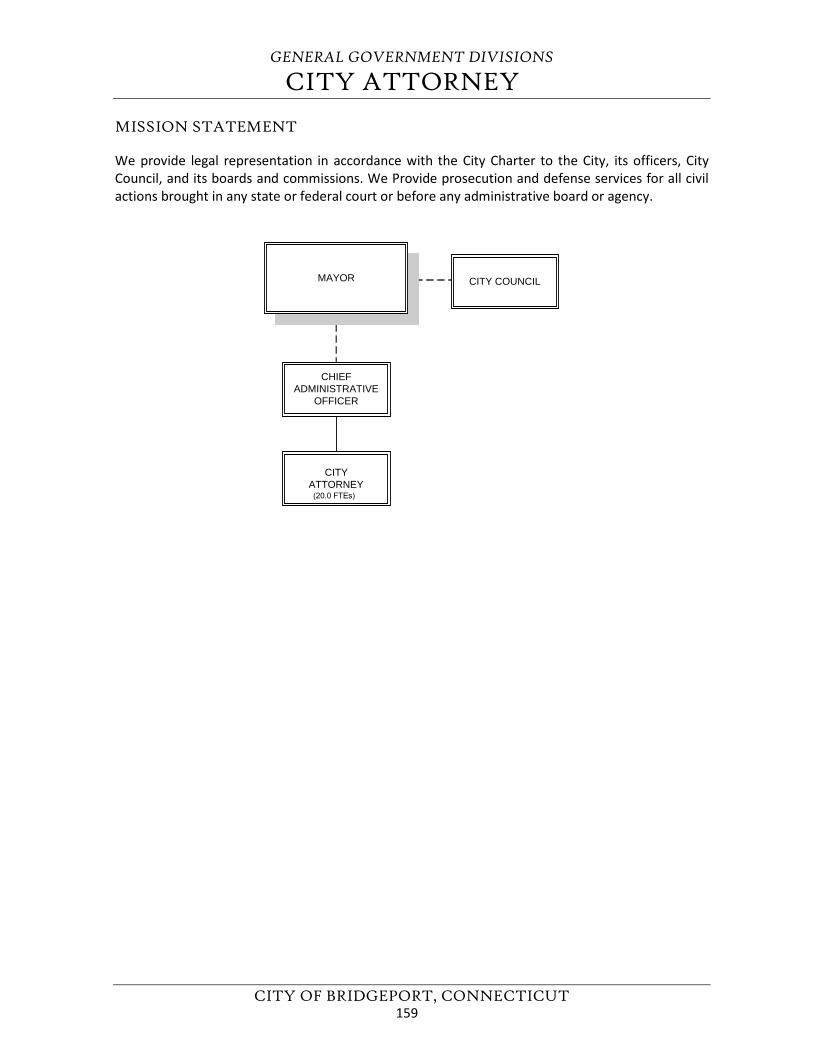
GENERAL GOVERNMENT DIVISIONS
CITY ATTORNEY
CITY OF BRIDGEPORT, CONNECTICUT
MISSION STATEMENT
We provide legal representation in accordance with the City Charter to the City, its officers, City Council, and its boards and commissions. We Provide prosecution and defense services for all civil actions brought in any state or federal court or before any administrative board or agency.
CHIEFADMINISTRATIVE
OFFICER
CITYATTORNEY (20.0 FTEs)
MAYOR CITY COUNCIL
159
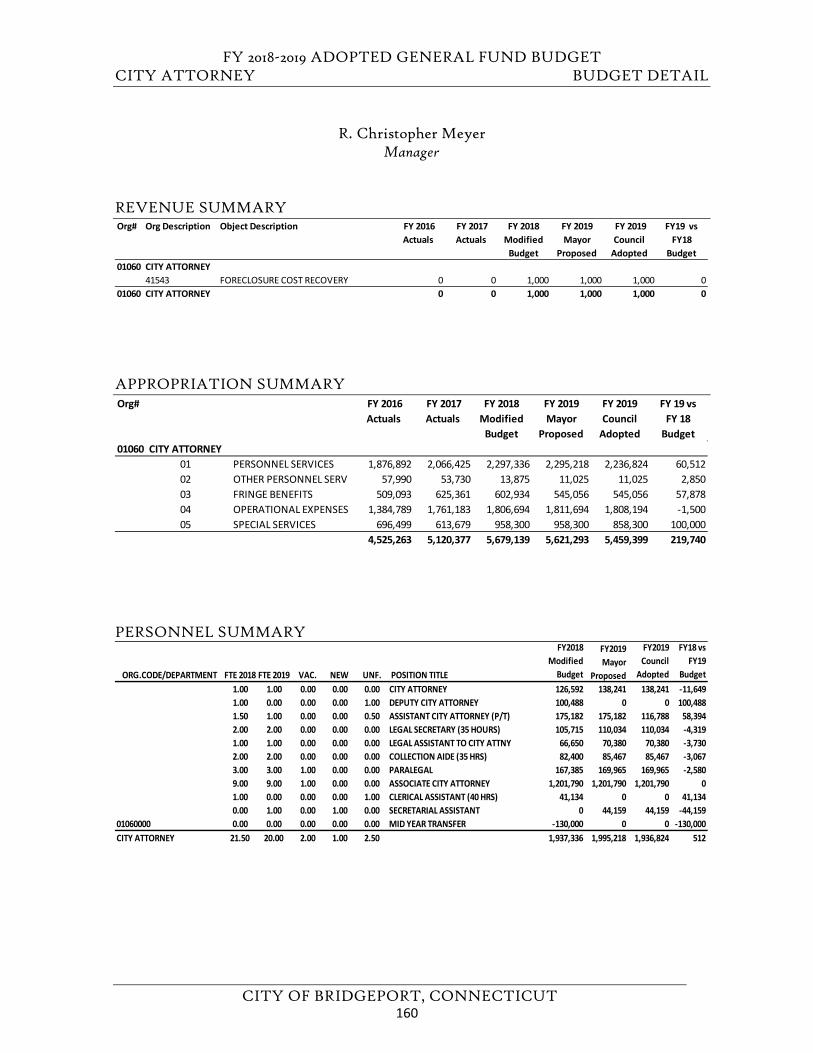
FY 2018-2019 ADOPTED GENERAL FUND BUDGET CITY ATTORNEY BUDGET DETAIL
CITY OF BRIDGEPORT, CONNECTICUT
R. Christopher MeyerManager
REVENUE SUMMARY
APPROPRIATION SUMMARY
PERSONNEL SUMMARY
Org# Org Description Object Description FY 2016 Actuals
FY 2017 Actuals
FY 2018 Modified
Budget
FY 2019 Mayor
Proposed
FY 2019 Council
Adopted
FY19 vs FY18
Budget01060 CITY ATTORNEY
41543 FORECLOSURE COST RECOVERY 0 0 1,000 1,000 1,000 001060 CITY ATTORNEY 0 0 1,000 1,000 1,000 0
Org# FY 2016 Actuals
FY 2017 Actuals
FY 2018 Modified
Budget
FY 2019 Mayor
Proposed
FY 2019 Council
Adopted
FY 19 vs FY 18
Budget01060 CITY ATTORNEY
01 PERSONNEL SERVICES 1,876,892 2,066,425 2,297,336 2,295,218 2,236,824 60,51202 OTHER PERSONNEL SERV 57,990 53,730 13,875 11,025 11,025 2,85003 FRINGE BENEFITS 509,093 625,361 602,934 545,056 545,056 57,87804 OPERATIONAL EXPENSES 1,384,789 1,761,183 1,806,694 1,811,694 1,808,194 -1,50005 SPECIAL SERVICES 696,499 613,679 958,300 958,300 858,300 100,000
4,525,263 5,120,377 5,679,139 5,621,293 5,459,399 219,740
ORG.CODE/DEPARTMENT FTE 2018 FTE 2019 VAC. NEW UNF. POSITION TITLE
FY2018 Modified
Budget
FY2019 Mayor
Proposed
FY2019 Council
Adopted
FY18 vs FY19
Budget 1.00 1.00 0.00 0.00 0.00 CITY ATTORNEY 126,592 138,241 138,241 -11,6491.00 0.00 0.00 0.00 1.00 DEPUTY CITY ATTORNEY 100,488 0 0 100,4881.50 1.00 0.00 0.00 0.50 ASSISTANT CITY ATTORNEY (P/T) 175,182 175,182 116,788 58,3942.00 2.00 0.00 0.00 0.00 LEGAL SECRETARY (35 HOURS) 105,715 110,034 110,034 -4,3191.00 1.00 0.00 0.00 0.00 LEGAL ASSISTANT TO CITY ATTNY 66,650 70,380 70,380 -3,7302.00 2.00 0.00 0.00 0.00 COLLECTION AIDE (35 HRS) 82,400 85,467 85,467 -3,0673.00 3.00 1.00 0.00 0.00 PARALEGAL 167,385 169,965 169,965 -2,5809.00 9.00 1.00 0.00 0.00 ASSOCIATE CITY ATTORNEY 1,201,790 1,201,790 1,201,790 01.00 0.00 0.00 0.00 1.00 CLERICAL ASSISTANT (40 HRS) 41,134 0 0 41,1340.00 1.00 0.00 1.00 0.00 SECRETARIAL ASSISTANT 0 44,159 44,159 -44,159
01060000 0.00 0.00 0.00 0.00 0.00 MID YEAR TRANSFER -130,000 0 0 -130,000CITY ATTORNEY 21.50 20.00 2.00 1.00 2.50 1,937,336 1,995,218 1,936,824 512
160
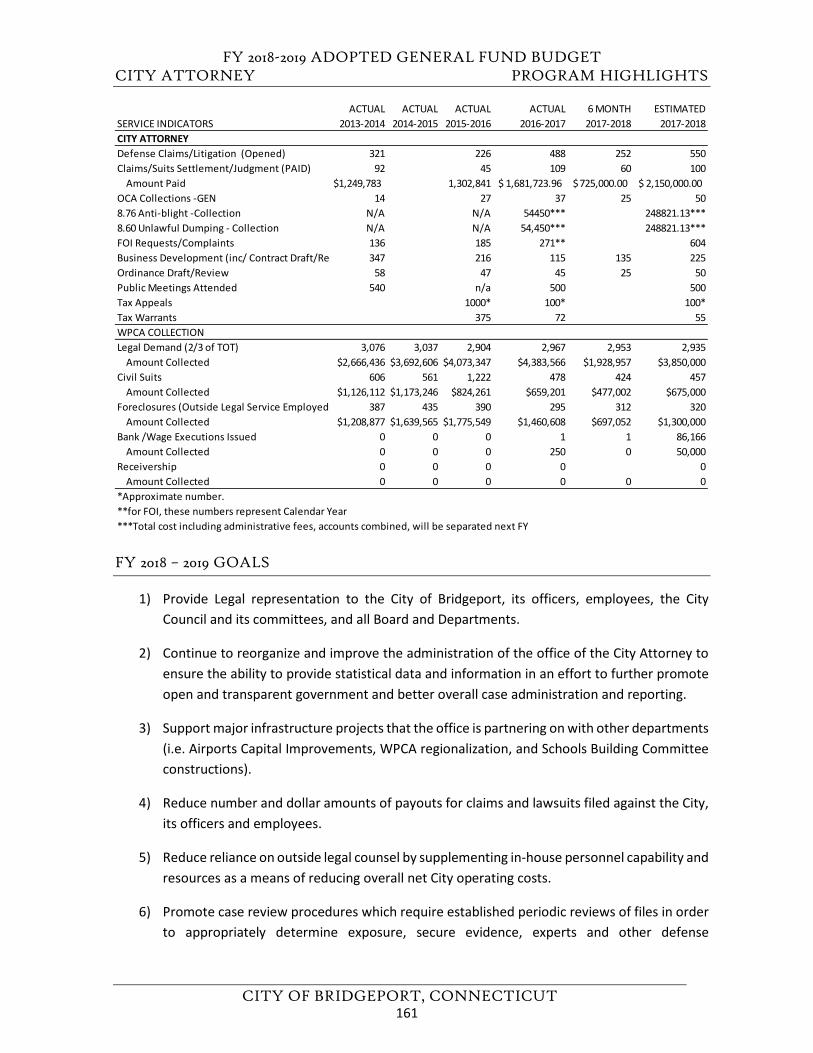
FY 2018-2019 ADOPTED GENERAL FUND BUDGET CITY ATTORNEY PROGRAM HIGHLIGHTS
CITY OF BRIDGEPORT, CONNECTICUT
FY 2018 – 2019 GOALS
1) Provide Legal representation to the City of Bridgeport, its officers, employees, the CityCouncil and its committees, and all Board and Departments.
2) Continue to reorganize and improve the administration of the office of the City Attorney toensure the ability to provide statistical data and information in an effort to further promoteopen and transparent government and better overall case administration and reporting.
3) Support major infrastructure projects that the office is partnering on with other departments (i.e. Airports Capital Improvements, WPCA regionalization, and Schools Building Committeeconstructions).
4) Reduce number and dollar amounts of payouts for claims and lawsuits filed against the City,its officers and employees.
5) Reduce reliance on outside legal counsel by supplementing in-house personnel capability and resources as a means of reducing overall net City operating costs.
6) Promote case review procedures which require established periodic reviews of files in orderto appropriately determine exposure, secure evidence, experts and other defense
ACTUAL ACTUAL ACTUAL ACTUAL 6 MONTH ESTIMATEDSERVICE INDICATORS 2013-2014 2014-2015 2015-2016 2016-2017 2017-2018 2017-2018CITY ATTORNEYDefense Claims/Litigation (Opened) 321 226 488 252 550Claims/Suits Settlement/Judgment (PAID) 92 45 109 60 100
Amount Paid $1,249,783 1,302,841 1,681,723.96$ 725,000.00$ 2,150,000.00$ OCA Collections -GEN 14 27 37 25 508.76 Anti-blight -Collection N/A N/A 54450*** 248821.13***8.60 Unlawful Dumping - Collection N/A N/A 54,450*** 248821.13***FOI Requests/Complaints 136 185 271** 604Business Development (inc/ Contract Draft/Rev 347 216 115 135 225Ordinance Draft/Review 58 47 45 25 50Public Meetings Attended 540 n/a 500 500Tax Appeals 1000* 100* 100*Tax Warrants 375 72 55WPCA COLLECTIONLegal Demand (2/3 of TOT) 3,076 3,037 2,904 2,967 2,953 2,935
Amount Collected $2,666,436 $3,692,606 $4,073,347 $4,383,566 $1,928,957 $3,850,000Civil Suits 606 561 1,222 478 424 457
Amount Collected $1,126,112 $1,173,246 $824,261 $659,201 $477,002 $675,000Foreclosures (Outside Legal Service Employed) 387 435 390 295 312 320
Amount Collected $1,208,877 $1,639,565 $1,775,549 $1,460,608 $697,052 $1,300,000Bank /Wage Executions Issued 0 0 0 1 1 86,166
Amount Collected 0 0 0 250 0 50,000Receivership 0 0 0 0 0
Amount Collected 0 0 0 0 0 0*Approximate number. **for FOI, these numbers represent Calendar Year***Total cost including administrative fees, accounts combined, will be separated next FY
161
FY 2018-2019 ADOPTED GENERAL FUND BUDGET CITY ATTORNEY PROGRAM HIGHLIGHTS
CITY OF BRIDGEPORT, CONNECTICUT
requirements. The procedures have been implemented but the lack of administrative resources have prevented full implementation.
7) Continue to mitigate added fees and costs to the ratepayer by reviewing and modifyingWPCA collection procedures with an established office committee and in conjunction withthe appropriate designees of the City Council’s Ordinance Committee while keeping WPCArates stable.
8) Continue to provide resources to the rapidly increasing FOI state mandate to maintain ourstatus as the most open and transparent municipal government in Connecticut.
9) Expand legal support to the Administration and the City’s lobbyists with respect toidentifying, prioritizing and managing the City’s legislative initiatives (example: CGS 52-557n).
10) In conjunction with the CAO and Purchasing Department, continue to monitor and identifyinformation or solutions for suggested amendments to ordinances as necessary to the CityCouncil regarding the City’s current Purchasing Ordinance.
11) Encourage/foster professional training to improve personnel performance in accordancewith the new state mandate.
12) Promote team goals and team litigation and to maximize delivery of legal services.
13) Continue the implementation and oversight of a Legal Software to better track and managecases.
14) Coordinate with (or create) accident review boards for the Police Department, FireDepartment and Public Facilities Department for Liability exposure reduction and RiskManagement.
15) Draft ordinance amendments and legal notices and otherwise support the city’s anti-blightand illegal dumping programs.
16) Continue assisting the CAO’s office in finding solutions for expediting the process forappointment and re-appointment members of city boards and commissions.
17) In furtherance of risk management, continue on-site inspection city-wide to preventdangerous conditions.
FY 2017 – 2018 GOAL STATUS
1) Provide Legal representation to the City of Bridgeport, its officers, employees, the CityCouncil and its committees, and all Board and Departments:6 MONTH STATUS: As always, we work to provide legal counsel to all interested agencies,boards, commissions and committees whose conduct impacts the City of Bridgeport from alegal standpoint.
162
FY 2018-2019 ADOPTED GENERAL FUND BUDGET CITY ATTORNEY PROGRAM HIGHLIGHTS
CITY OF BRIDGEPORT, CONNECTICUT
2) Promote team goals and team litigation and to maximize delivery of legal services.6 MONTH STATUS: Ongoing.
3) Together with the City Council’s Special Rules Committee, draft and obtain adoption ofrevised Rules of the City Council to facilitate efficient Council proceedings.6 MONTH STATUS: Ongoing
4) Reduce reliance on outside legal counsel by supplementing in-house personnel resources asa means of reducing overall net City operating costs.6 MONTH STATUS: Partially completed, multiple capabilities still needed.
5) Continue to refine City’s Freedom of Information Act (FOIA) procedures to ensure timelyresponsiveness to requests for access to public information.6 MONTH STATUS: Fully implemented, coordinators trained from each department, FOIofficials have commended our improvement
6) In conjunction with the Administration and Finance Department, analyze the viability ofprocurement of excess liability insurance coverage.6 MONTH STATUS: Ongoing discussions with Finance Director continues.
7) Expand legal support to the Administration and the City’s lobbyists with respect to managingpriority City legislative initiatives.6 MONTH STATUS: Partially completed.
8) Support major infrastructure projects that the office is partnering with other departments(i.e. Airport and Schools Building Committee).6 MONTH STATUS: With support from City Council and Airport management, Airportcompleted its runway relocation; School Building Committee’s construction receivingenhanced support from legal staff.
9) Promote case review procedures which require a review with 90 days of receipt of a new fileor based on the exposure of liability. When exposure is identified, complete a case reviewand implement appropriate defense handling thereafter. This will significantly cut down onbacklogged cases in this department.6 MONTH STATUS: Partially implemented but needs further administrative resources. Projectis already significantly reducing liability and exposure.
10) In conjunction with the CAO and Purchasing Department, proposed amendments to the CityCouncil regarding the City’s current Purchasing Ordinance.6 MONTH STATUS: Monitoring functionality, continuous review.
11) Prioritize proper and timely reporting in accordance with State and Federal reportingrequirements.6 MONTH STATUS: Ongoing Medicare reporting compliance.
163
FY 2018-2019 ADOPTED GENERAL FUND BUDGET CITY ATTORNEY PROGRAM HIGHLIGHTS
CITY OF BRIDGEPORT, CONNECTICUT
12) Continue to reduce number and dollar amounts of payouts for claims and lawsuits filedagainst the City, its officers and employees. Reduced the number of major litigation pendingcases by half approximately 50% with commensurate reduction in financial exposure.6 MONTH STATUS: Excellent results, continuing ongoing effort, significant reduction.
13) Reorganize staff attorney work groups (litigation, business/development, administrative lawsupport, and legal opinion/advice) to maximize delivery of legal services.6 MONTH STATUS: Major progress achieved, continuing effort
14) Encourage/foster professional training to improve personnel performance and meet existing CLE requirements.6 MONTH STATUS: 2017 completed, 2018 ongoing.
15) Oversee and implement a new Legal Software to better track and manage all legal files6 MONTH STATUS: Software implemented.
164
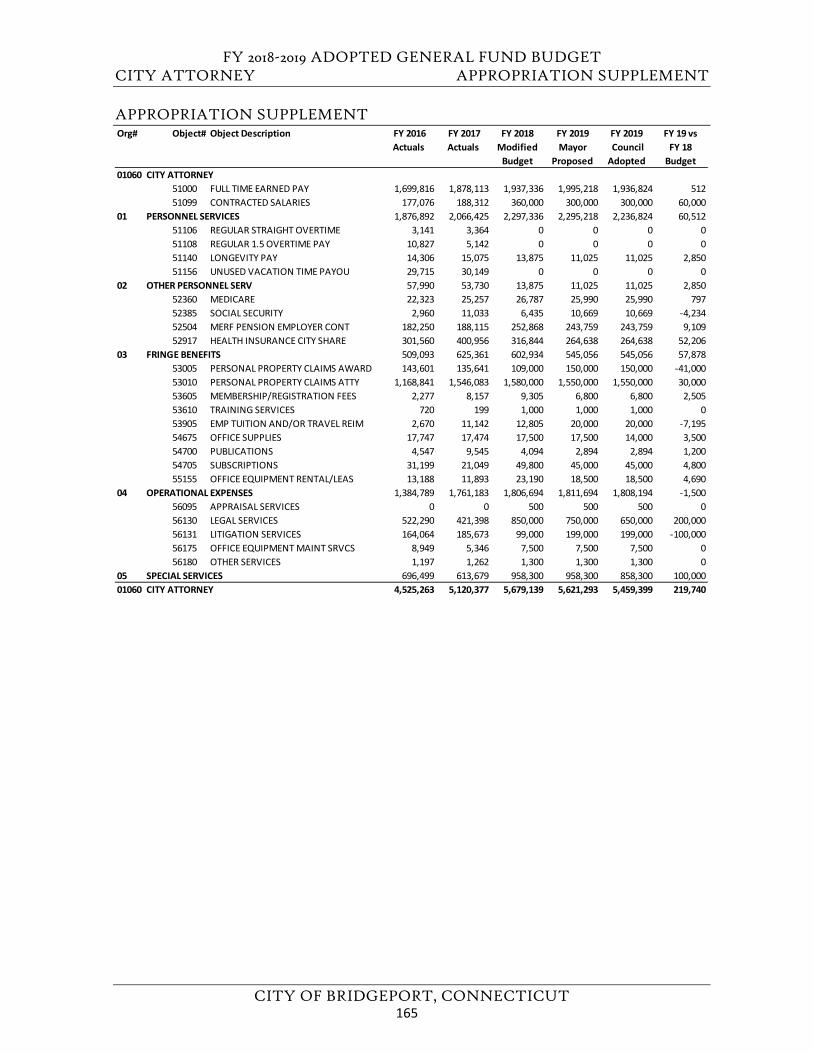
FY 2018-2019 ADOPTED GENERAL FUND BUDGET CITY ATTORNEY APPROPRIATION SUPPLEMENT
CITY OF BRIDGEPORT, CONNECTICUT
APPROPRIATION SUPPLEMENT Org# Object# Object Description FY 2016
Actuals FY 2017 Actuals
FY 2018 Modified
Budget
FY 2019Mayor
Proposed
FY 2019 Council Adopted
FY 19 vs FY 18
Budget01060 CITY ATTORNEY
51000 FULL TIME EARNED PAY 1,699,816 1,878,113 1,937,336 1,995,218 1,936,824 51251099 CONTRACTED SALARIES 177,076 188,312 360,000 300,000 300,000 60,000
01 PERSONNEL SERVICES 1,876,892 2,066,425 2,297,336 2,295,218 2,236,824 60,51251106 REGULAR STRAIGHT OVERTIME 3,141 3,364 0 0 0 051108 REGULAR 1.5 OVERTIME PAY 10,827 5,142 0 0 0 051140 LONGEVITY PAY 14,306 15,075 13,875 11,025 11,025 2,85051156 UNUSED VACATION TIME PAYOU 29,715 30,149 0 0 0 0
02 OTHER PERSONNEL SERV 57,990 53,730 13,875 11,025 11,025 2,85052360 MEDICARE 22,323 25,257 26,787 25,990 25,990 79752385 SOCIAL SECURITY 2,960 11,033 6,435 10,669 10,669 -4,23452504 MERF PENSION EMPLOYER CONT 182,250 188,115 252,868 243,759 243,759 9,10952917 HEALTH INSURANCE CITY SHARE 301,560 400,956 316,844 264,638 264,638 52,206
03 FRINGE BENEFITS 509,093 625,361 602,934 545,056 545,056 57,87853005 PERSONAL PROPERTY CLAIMS AWARD 143,601 135,641 109,000 150,000 150,000 -41,00053010 PERSONAL PROPERTY CLAIMS ATTY 1,168,841 1,546,083 1,580,000 1,550,000 1,550,000 30,00053605 MEMBERSHIP/REGISTRATION FEES 2,277 8,157 9,305 6,800 6,800 2,50553610 TRAINING SERVICES 720 199 1,000 1,000 1,000 053905 EMP TUITION AND/OR TRAVEL REIM 2,670 11,142 12,805 20,000 20,000 -7,19554675 OFFICE SUPPLIES 17,747 17,474 17,500 17,500 14,000 3,50054700 PUBLICATIONS 4,547 9,545 4,094 2,894 2,894 1,20054705 SUBSCRIPTIONS 31,199 21,049 49,800 45,000 45,000 4,80055155 OFFICE EQUIPMENT RENTAL/LEAS 13,188 11,893 23,190 18,500 18,500 4,690
04 OPERATIONAL EXPENSES 1,384,789 1,761,183 1,806,694 1,811,694 1,808,194 -1,50056095 APPRAISAL SERVICES 0 0 500 500 500 056130 LEGAL SERVICES 522,290 421,398 850,000 750,000 650,000 200,00056131 LITIGATION SERVICES 164,064 185,673 99,000 199,000 199,000 -100,00056175 OFFICE EQUIPMENT MAINT SRVCS 8,949 5,346 7,500 7,500 7,500 056180 OTHER SERVICES 1,197 1,262 1,300 1,300 1,300 0
05 SPECIAL SERVICES 696,499 613,679 958,300 958,300 858,300 100,00001060 CITY ATTORNEY 4,525,263 5,120,377 5,679,139 5,621,293 5,459,399 219,740
165

FY 2018-2019 ADOPTED GENERAL FUND BUDGET
CITY OF BRIDGEPORT, CONNECTICUT
This page left blank intentionally
166
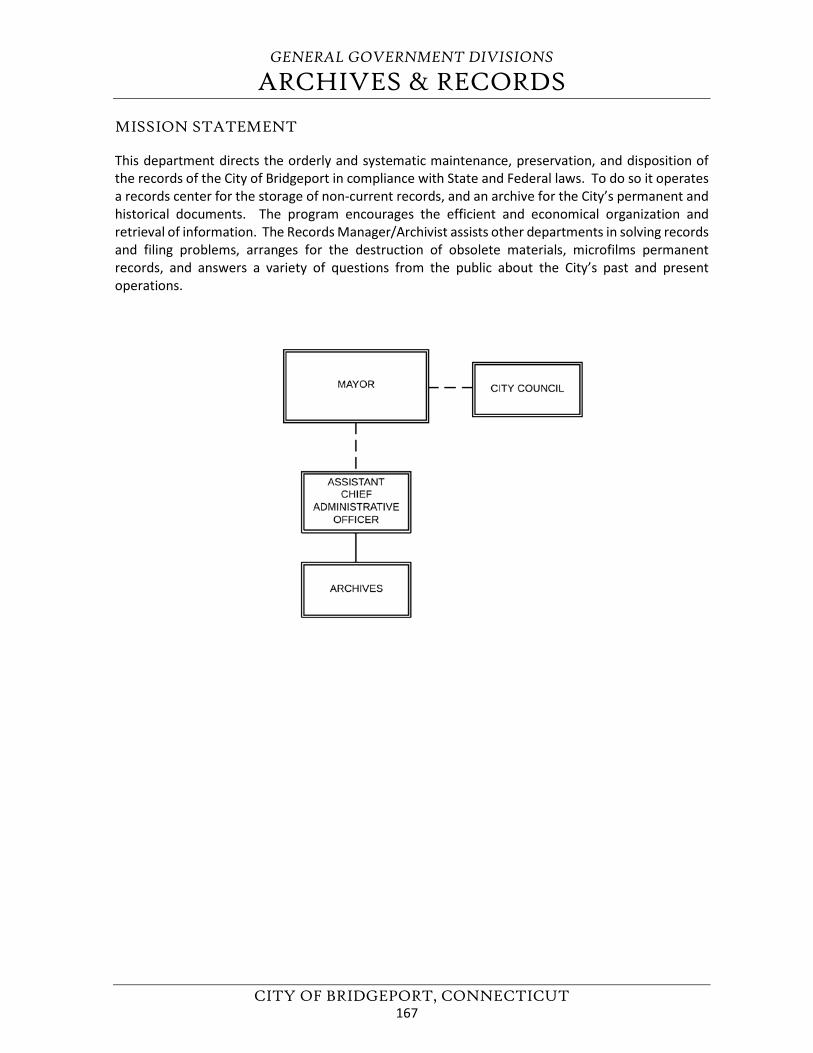
GENERAL GOVERNMENT DIVISIONS
ARCHIVES & RECORDS
CITY OF BRIDGEPORT, CONNECTICUT
MISSION STATEMENT
This department directs the orderly and systematic maintenance, preservation, and disposition of the records of the City of Bridgeport in compliance with State and Federal laws. To do so it operates a records center for the storage of non-current records, and an archive for the City’s permanent and historical documents. The program encourages the efficient and economical organization and retrieval of information. The Records Manager/Archivist assists other departments in solving records and filing problems, arranges for the destruction of obsolete materials, microfilms permanent records, and answers a variety of questions from the public about the City’s past and present operations.
167
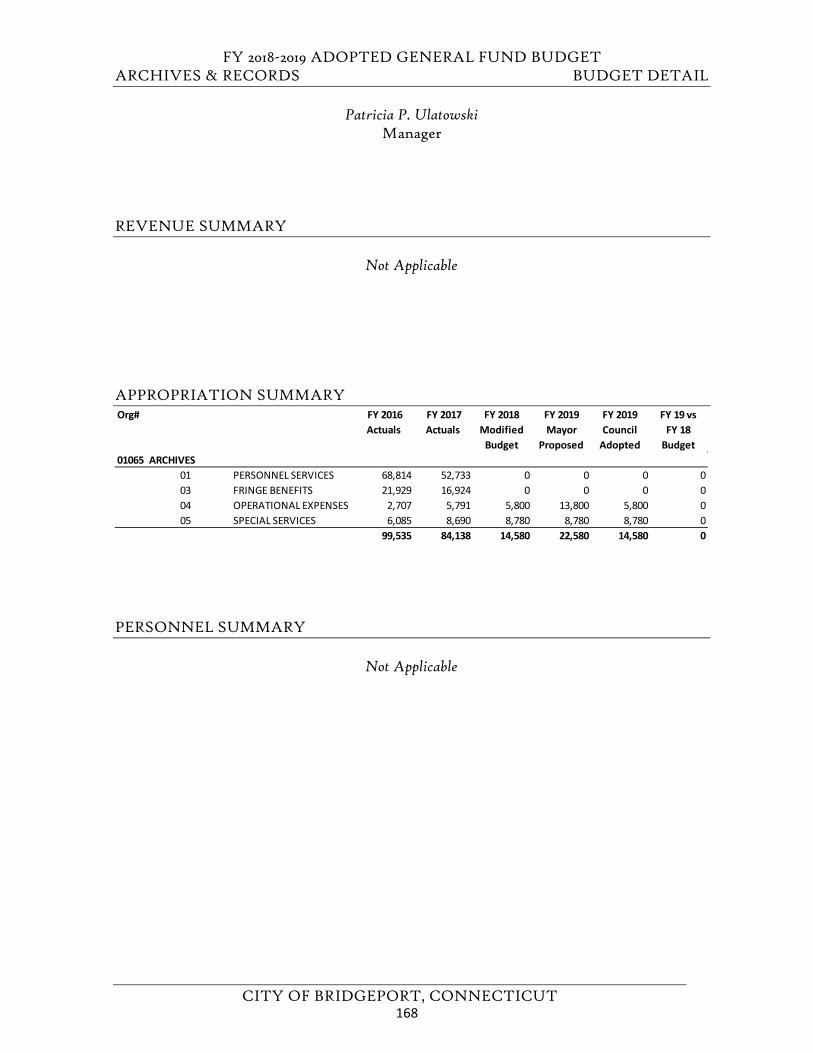
FY 2018-2019 ADOPTED GENERAL FUND BUDGET ARCHIVES & RECORDS BUDGET DETAIL
CITY OF BRIDGEPORT, CONNECTICUT
Patricia P. Ulatowski Manager
REVENUE SUMMARY
Not Applicable
APPROPRIATION SUMMARY
PERSONNEL SUMMARY
Not Applicable
Org# FY 2016 Actuals
FY 2017 Actuals
FY 2018 Modified
Budget
FY 2019 Mayor
Proposed
FY 2019 Council
Adopted
FY 19 vs FY 18
Budget01065 ARCHIVES
01 PERSONNEL SERVICES 68,814 52,733 0 0 0 003 FRINGE BENEFITS 21,929 16,924 0 0 0 004 OPERATIONAL EXPENSES 2,707 5,791 5,800 13,800 5,800 005 SPECIAL SERVICES 6,085 8,690 8,780 8,780 8,780 0
99,535 84,138 14,580 22,580 14,580 0
168
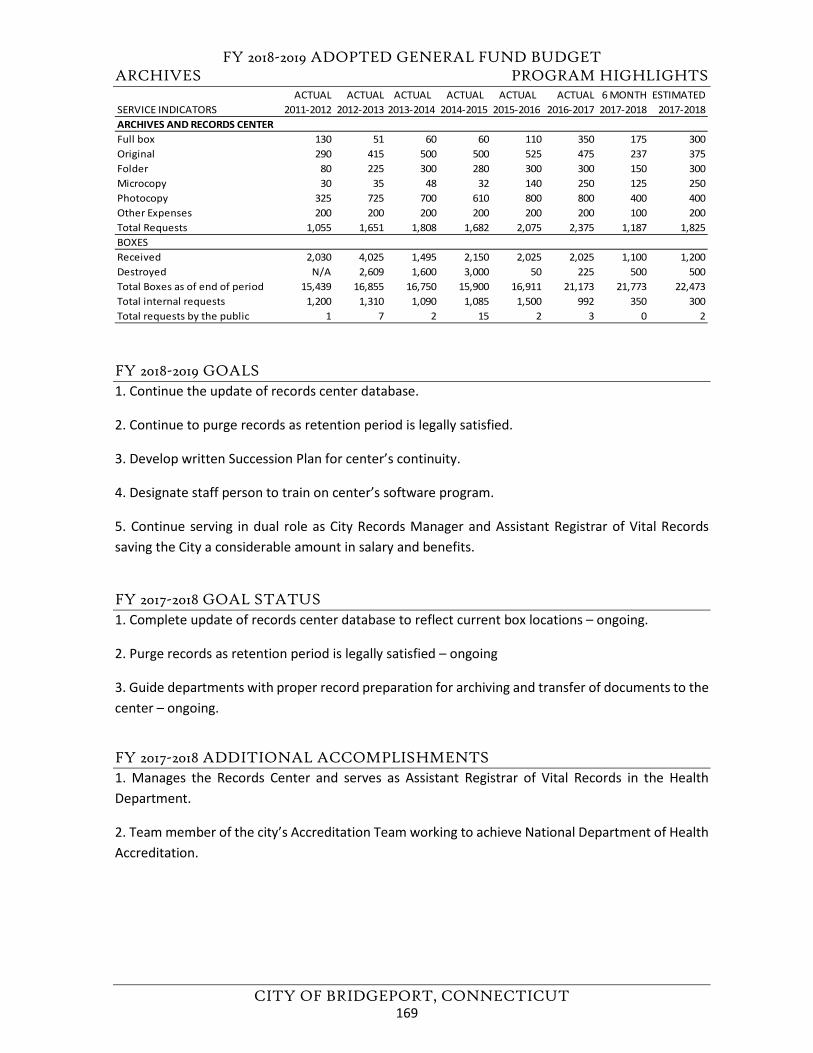
FY 2018-2019 ADOPTED GENERAL FUND BUDGET ARCHIVES PROGRAM HIGHLIGHTS
CITY OF BRIDGEPORT, CONNECTICUT
FY 2018-2019 GOALS 1. Continue the update of records center database.
2. Continue to purge records as retention period is legally satisfied.
3. Develop written Succession Plan for center’s continuity.
4. Designate staff person to train on center’s software program.
5. Continue serving in dual role as City Records Manager and Assistant Registrar of Vital Recordssaving the City a considerable amount in salary and benefits.
FY 2017-2018 GOAL STATUS 1. Complete update of records center database to reflect current box locations – ongoing.
2. Purge records as retention period is legally satisfied – ongoing
3. Guide departments with proper record preparation for archiving and transfer of documents to thecenter – ongoing.
FY 2017-2018 ADDITIONAL ACCOMPLISHMENTS 1. Manages the Records Center and serves as Assistant Registrar of Vital Records in the HealthDepartment.
2. Team member of the city’s Accreditation Team working to achieve National Department of HealthAccreditation.
ACTUAL ACTUAL ACTUAL ACTUAL ACTUAL ACTUAL 6 MONTH ESTIMATEDSERVICE INDICATORS 2011-2012 2012-2013 2013-2014 2014-2015 2015-2016 2016-2017 2017-2018 2017-2018ARCHIVES AND RECORDS CENTERFull box 130 51 60 60 110 350 175 300Original 290 415 500 500 525 475 237 375Folder 80 225 300 280 300 300 150 300Microcopy 30 35 48 32 140 250 125 250Photocopy 325 725 700 610 800 800 400 400Other Expenses 200 200 200 200 200 200 100 200Total Requests 1,055 1,651 1,808 1,682 2,075 2,375 1,187 1,825BOXESReceived 2,030 4,025 1,495 2,150 2,025 2,025 1,100 1,200Destroyed N/A 2,609 1,600 3,000 50 225 500 500Total Boxes as of end of period 15,439 16,855 16,750 15,900 16,911 21,173 21,773 22,473Total internal requests 1,200 1,310 1,090 1,085 1,500 992 350 300Total requests by the public 1 7 2 15 2 3 0 2
169
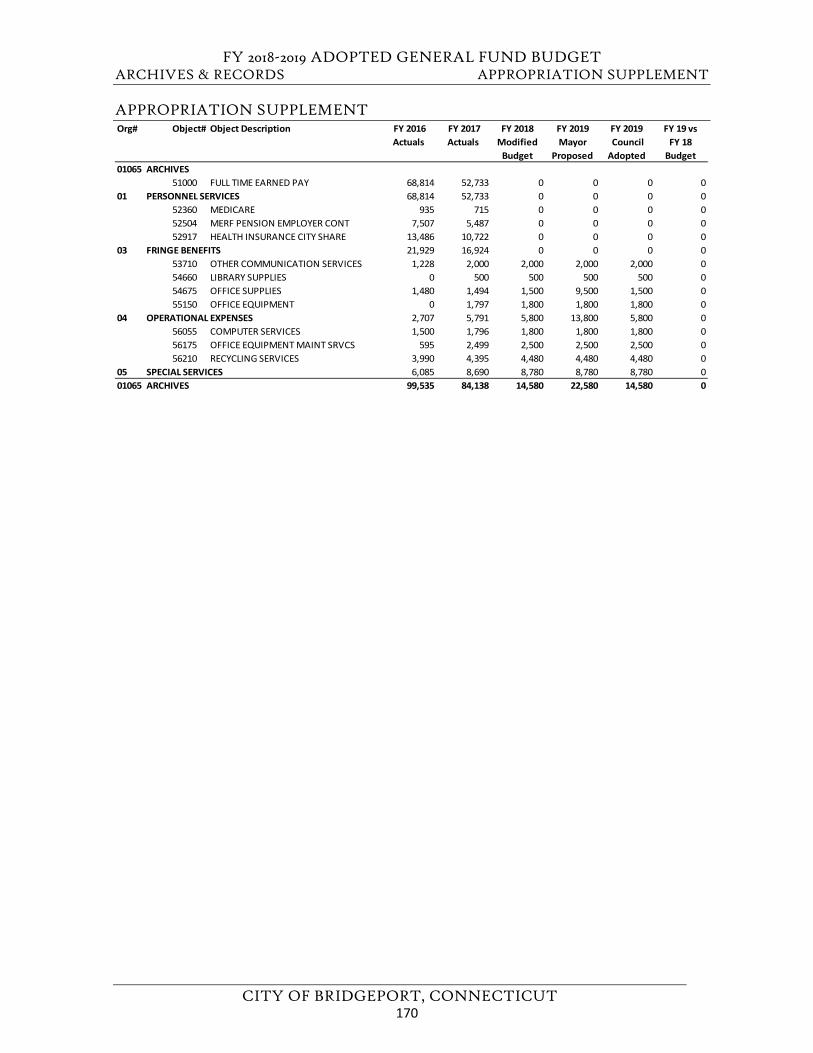
FY 2018-2019 ADOPTED GENERAL FUND BUDGET ARCHIVES & RECORDS APPROPRIATION SUPPLEMENT
CITY OF BRIDGEPORT, CONNECTICUT
APPROPRIATION SUPPLEMENT Org# Object# Object Description FY 2016
Actuals FY 2017 Actuals
FY 2018 Modified
Budget
FY 2019Mayor
Proposed
FY 2019 Council Adopted
FY 19 vs FY 18
Budget01065 ARCHIVES
51000 FULL TIME EARNED PAY 68,814 52,733 0 0 0 001 PERSONNEL SERVICES 68,814 52,733 0 0 0 0
52360 MEDICARE 935 715 0 0 0 052504 MERF PENSION EMPLOYER CONT 7,507 5,487 0 0 0 052917 HEALTH INSURANCE CITY SHARE 13,486 10,722 0 0 0 0
03 FRINGE BENEFITS 21,929 16,924 0 0 0 053710 OTHER COMMUNICATION SERVICES 1,228 2,000 2,000 2,000 2,000 054660 LIBRARY SUPPLIES 0 500 500 500 500 054675 OFFICE SUPPLIES 1,480 1,494 1,500 9,500 1,500 055150 OFFICE EQUIPMENT 0 1,797 1,800 1,800 1,800 0
04 OPERATIONAL EXPENSES 2,707 5,791 5,800 13,800 5,800 056055 COMPUTER SERVICES 1,500 1,796 1,800 1,800 1,800 056175 OFFICE EQUIPMENT MAINT SRVCS 595 2,499 2,500 2,500 2,500 056210 RECYCLING SERVICES 3,990 4,395 4,480 4,480 4,480 0
05 SPECIAL SERVICES 6,085 8,690 8,780 8,780 8,780 001065 ARCHIVES 99,535 84,138 14,580 22,580 14,580 0
170
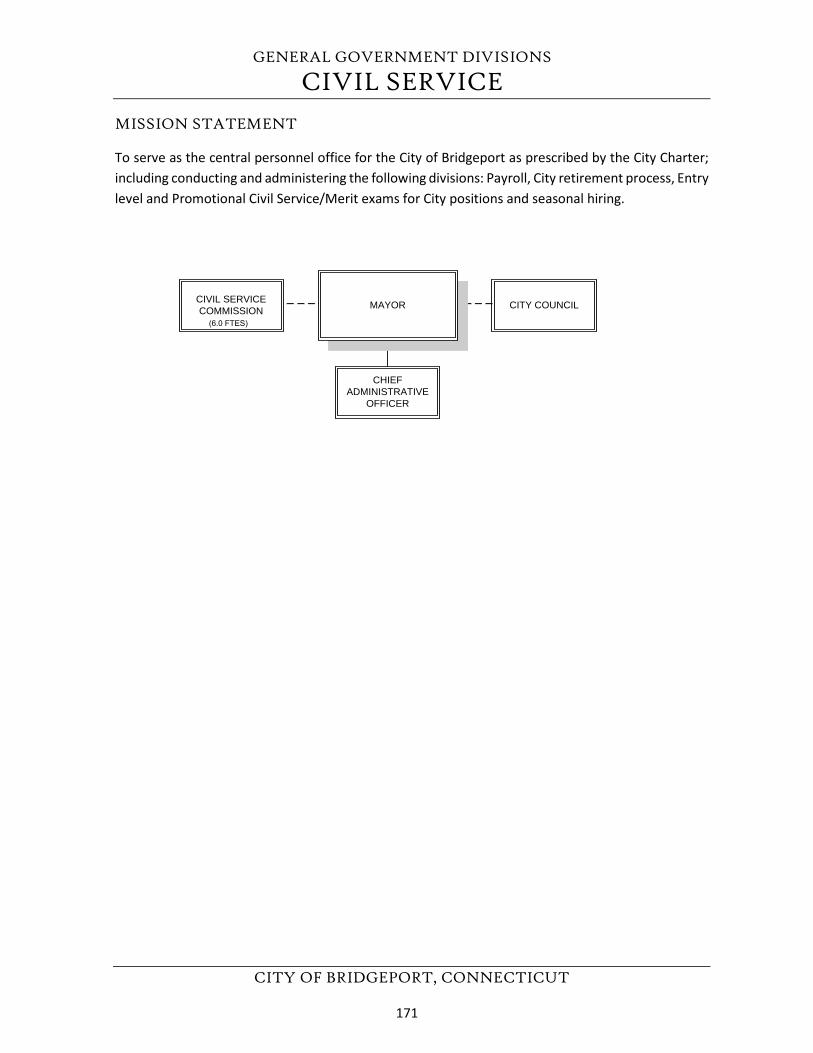
GENERAL GOVERNMENT DIVISIONS
CIVIL SERVICE
CITY OF BRIDGEPORT, CONNECTICUT
MISSION STATEMENT
To serve as the central personnel office for the City of Bridgeport as prescribed by the City Charter; including conducting and administering the following divisions: Payroll, City retirement process, Entry level and Promotional Civil Service/Merit exams for City positions and seasonal hiring.
CHIEFADMINISTRATIVE
OFFICER
CITY COUNCILCIVIL SERVICECOMMISSION (6.0 FTES)
MAYOR
171
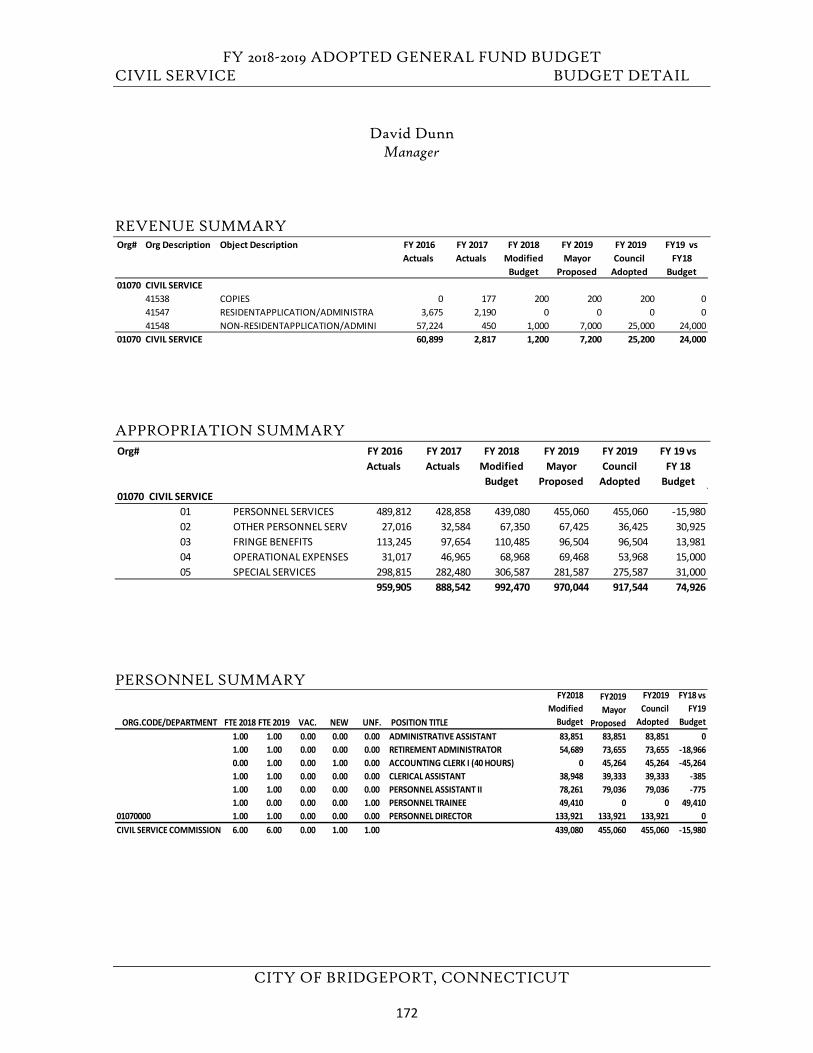
FY 2018-2019 ADOPTED GENERAL FUND BUDGET CIVIL SERVICE BUDGET DETAIL
CITY OF BRIDGEPORT, CONNECTICUT
David Dunn Manager
REVENUE SUMMARY
APPROPRIATION SUMMARY
PERSONNEL SUMMARY
Org# Org Description Object Description FY 2016 Actuals
FY 2017 Actuals
FY 2018 Modified
Budget
FY 2019 Mayor
Proposed
FY 2019 Council
Adopted
FY19 vs FY18
Budget01070 CIVIL SERVICE
41538 COPIES 0 177 200 200 200 041547 RESIDENTAPPLICATION/ADMINISTRA 3,675 2,190 0 0 0 041548 NON-RESIDENTAPPLICATION/ADMINI 57,224 450 1,000 7,000 25,000 24,000
01070 CIVIL SERVICE 60,899 2,817 1,200 7,200 25,200 24,000
Org# FY 2016 Actuals
FY 2017 Actuals
FY 2018 Modified
Budget
FY 2019 Mayor
Proposed
FY 2019 Council
Adopted
FY 19 vs FY 18
Budget01070 CIVIL SERVICE
01 PERSONNEL SERVICES 489,812 428,858 439,080 455,060 455,060 -15,98002 OTHER PERSONNEL SERV 27,016 32,584 67,350 67,425 36,425 30,92503 FRINGE BENEFITS 113,245 97,654 110,485 96,504 96,504 13,98104 OPERATIONAL EXPENSES 31,017 46,965 68,968 69,468 53,968 15,00005 SPECIAL SERVICES 298,815 282,480 306,587 281,587 275,587 31,000
959,905 888,542 992,470 970,044 917,544 74,926
ORG.CODE/DEPARTMENT FTE 2018 FTE 2019 VAC. NEW UNF. POSITION TITLE
FY2018 Modified
Budget
FY2019 Mayor
Proposed
FY2019 Council
Adopted
FY18 vs FY19
Budget 1.00 1.00 0.00 0.00 0.00 ADMINISTRATIVE ASSISTANT 83,851 83,851 83,851 01.00 1.00 0.00 0.00 0.00 RETIREMENT ADMINISTRATOR 54,689 73,655 73,655 -18,9660.00 1.00 0.00 1.00 0.00 ACCOUNTING CLERK I (40 HOURS) 0 45,264 45,264 -45,2641.00 1.00 0.00 0.00 0.00 CLERICAL ASSISTANT 38,948 39,333 39,333 -3851.00 1.00 0.00 0.00 0.00 PERSONNEL ASSISTANT II 78,261 79,036 79,036 -7751.00 0.00 0.00 0.00 1.00 PERSONNEL TRAINEE 49,410 0 0 49,410
01070000 1.00 1.00 0.00 0.00 0.00 PERSONNEL DIRECTOR 133,921 133,921 133,921 0CIVIL SERVICE COMMISSION 6.00 6.00 0.00 1.00 1.00 439,080 455,060 455,060 -15,980
172
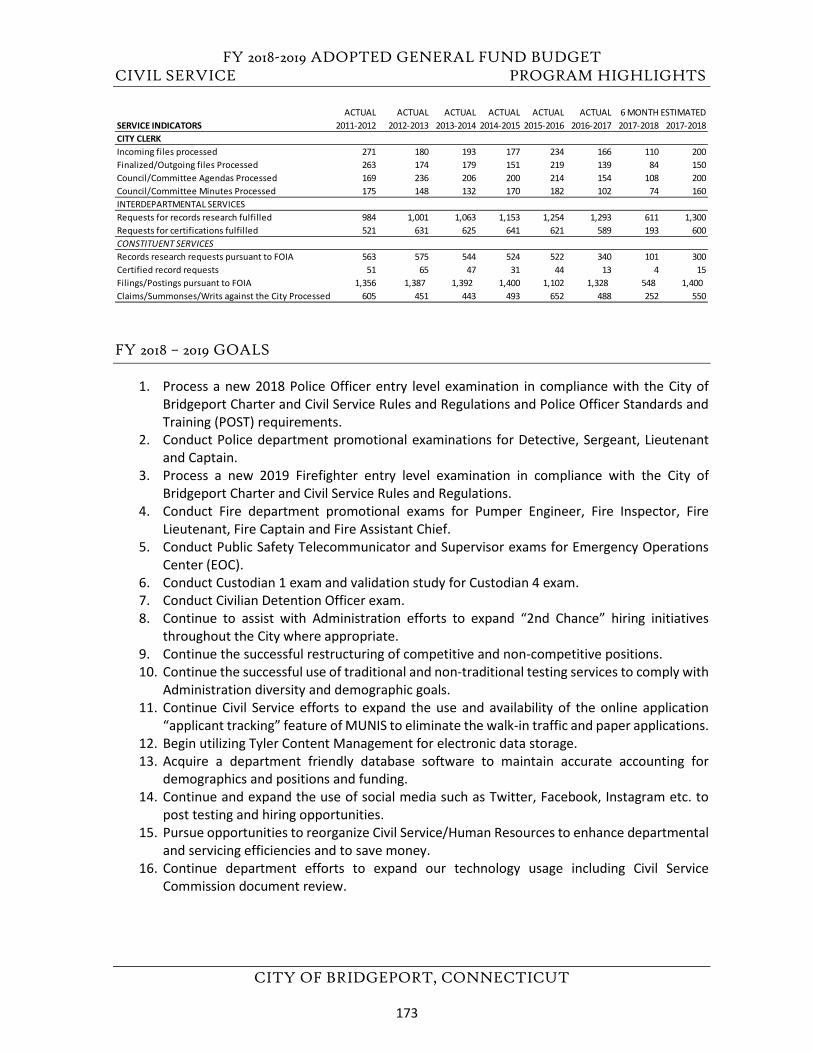
FY 2018-2019 ADOPTED GENERAL FUND BUDGET CIVIL SERVICE PROGRAM HIGHLIGHTS
CITY OF BRIDGEPORT, CONNECTICUT
FY 2018 – 2019 GOALS
1. Process a new 2018 Police Officer entry level examination in compliance with the City ofBridgeport Charter and Civil Service Rules and Regulations and Police Officer Standards andTraining (POST) requirements.
2. Conduct Police department promotional examinations for Detective, Sergeant, Lieutenantand Captain.
3. Process a new 2019 Firefighter entry level examination in compliance with the City ofBridgeport Charter and Civil Service Rules and Regulations.
4. Conduct Fire department promotional exams for Pumper Engineer, Fire Inspector, FireLieutenant, Fire Captain and Fire Assistant Chief.
5. Conduct Public Safety Telecommunicator and Supervisor exams for Emergency OperationsCenter (EOC).
6. Conduct Custodian 1 exam and validation study for Custodian 4 exam.7. Conduct Civilian Detention Officer exam.8. Continue to assist with Administration efforts to expand “2nd Chance” hiring initiatives
throughout the City where appropriate.9. Continue the successful restructuring of competitive and non-competitive positions.10. Continue the successful use of traditional and non-traditional testing services to comply with
Administration diversity and demographic goals.11. Continue Civil Service efforts to expand the use and availability of the online application
“applicant tracking” feature of MUNIS to eliminate the walk-in traffic and paper applications.12. Begin utilizing Tyler Content Management for electronic data storage.13. Acquire a department friendly database software to maintain accurate accounting for
demographics and positions and funding.14. Continue and expand the use of social media such as Twitter, Facebook, Instagram etc. to
post testing and hiring opportunities.15. Pursue opportunities to reorganize Civil Service/Human Resources to enhance departmental
and servicing efficiencies and to save money.16. Continue department efforts to expand our technology usage including Civil Service
Commission document review.
ACTUAL ACTUAL ACTUAL ACTUAL ACTUAL ACTUAL 6 MONTH ESTIMATEDSERVICE INDICATORS 2011-2012 2012-2013 2013-2014 2014-2015 2015-2016 2016-2017 2017-2018 2017-2018CITY CLERKIncoming files processed 271 180 193 177 234 166 110 200Finalized/Outgoing files Processed 263 174 179 151 219 139 84 150Council/Committee Agendas Processed 169 236 206 200 214 154 108 200Council/Committee Minutes Processed 175 148 132 170 182 102 74 160INTERDEPARTMENTAL SERVICESRequests for records research fulfilled 984 1,001 1,063 1,153 1,254 1,293 611 1,300Requests for certifications fulfilled 521 631 625 641 621 589 193 600CONSTITUENT SERVICESRecords research requests pursuant to FOIA 563 575 544 524 522 340 101 300Certified record requests 51 65 47 31 44 13 4 15Filings/Postings pursuant to FOIA 1,356 1,387 1,392 1,400 1,102 1,328 548 1,400 Claims/Summonses/Writs against the City Processed 605 451 443 493 652 488 252 550
173
FY 2018-2019 ADOPTED GENERAL FUND BUDGET CIVIL SERVICE PROGRAM HIGHLIGHTS
CITY OF BRIDGEPORT, CONNECTICUT
FY 2017 – 2018 GOAL STATUS
1. As list expires March 1, 2018 Civil Service is processing the last class from entry level Police Officer exam #2330 for March 5, 2018 Academy start date. This is the 4th Academy class from this list.
2. Civil Service has processed 4 Fire classes from the current entry level Firefighter exam #2340.3. Civil Service conducted a promotional exam for Fire Lieutenant and the list went into effect on
April 22, 2017 and expires April 22, 2019. Civil Service is continuing to make promotions off thatlist.
4. Civil Service exhausted the Public Safety Telecommunicator list and the Public Safety Supervisorlist.
5. Civil Service conducted a promotional exam for Custodian 4 that expires July 12, 2019; however,it is expected that the list will be exhausted by the next school year.
6. A Personnel Trainee exam was conducted. Further processing is forthcoming.7. Civilian Detention Officer list went into effect on June 26, 2017 and expires in 2019.8. Continue successful expansion of the non-competitive division through the system elimination
and restructuring of the competitive division for City jobs with Fire Equipment Mechanic, FireMarshal, Deputy Fire Chiefs, Deputy Police Chief and Public Safety Supervisor.
9. Continue Civil Service green efforts to expand the use and availability of the online application“applicant tracking” feature of MUNIS to eliminate the walk-in traffic and paper applications.
10. Successfully posting department information and City vacancies on social media includingFacebook, Twitter and Instagram.
11. Discussions on-going to reorganize Civil Service/Human Resources to enhance departmental andservicing efficiencies and to save money.
FY 2017 – 2018 ADDITIONAL ACCOMPLISHMENTS
1. Organization of department documents and archiving and destruction to keep work environmentclean and safe. Use of more digital filing.2. Continued improvement in the hiring of seasonal employees; processed large numbers smoothlyand efficiently.3. Expanded use and formalization of pre-employment background process by retaining a securityvendor.4. No legal challenge to exam content on any Police or Fire promotional exam.5. Continued to reduce the timing backlogs from promotional exam requirement to examcompletion.6. Exam - customer feedback currently running A+; general public either in person or via telephonehas been very positive and appreciative of extended information and assistance. Department hasoffered orientation sessions prior to exams to ease candidate anxiousness and provide opportunitiesto ask questions and get answers.7. Continued professional service for retirements.
174
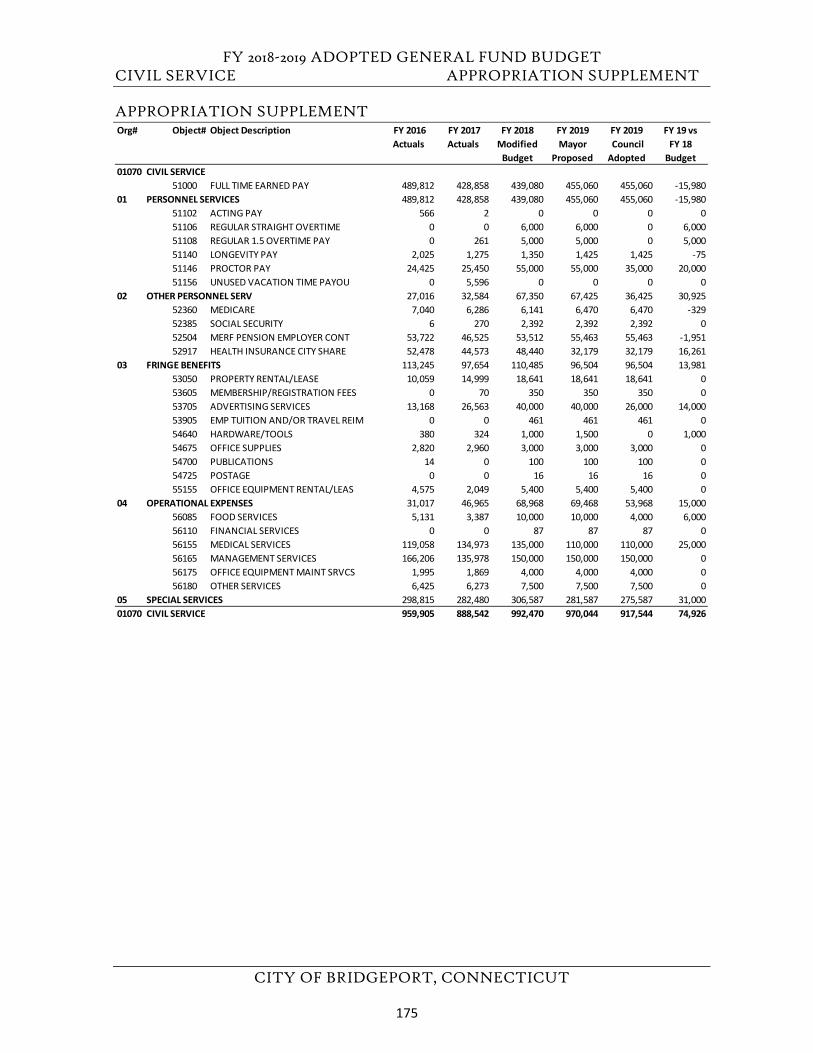
FY 2018-2019 ADOPTED GENERAL FUND BUDGET CIVIL SERVICE APPROPRIATION SUPPLEMENT
CITY OF BRIDGEPORT, CONNECTICUT
APPROPRIATION SUPPLEMENT Org# Object# Object Description FY 2016
Actuals FY 2017 Actuals
FY 2018 Modified
Budget
FY 2019Mayor
Proposed
FY 2019 Council Adopted
FY 19 vs FY 18
Budget01070 CIVIL SERVICE
51000 FULL TIME EARNED PAY 489,812 428,858 439,080 455,060 455,060 -15,98001 PERSONNEL SERVICES 489,812 428,858 439,080 455,060 455,060 -15,980
51102 ACTING PAY 566 2 0 0 0 051106 REGULAR STRAIGHT OVERTIME 0 0 6,000 6,000 0 6,00051108 REGULAR 1.5 OVERTIME PAY 0 261 5,000 5,000 0 5,00051140 LONGEVITY PAY 2,025 1,275 1,350 1,425 1,425 -7551146 PROCTOR PAY 24,425 25,450 55,000 55,000 35,000 20,00051156 UNUSED VACATION TIME PAYOU 0 5,596 0 0 0 0
02 OTHER PERSONNEL SERV 27,016 32,584 67,350 67,425 36,425 30,92552360 MEDICARE 7,040 6,286 6,141 6,470 6,470 -32952385 SOCIAL SECURITY 6 270 2,392 2,392 2,392 052504 MERF PENSION EMPLOYER CONT 53,722 46,525 53,512 55,463 55,463 -1,95152917 HEALTH INSURANCE CITY SHARE 52,478 44,573 48,440 32,179 32,179 16,261
03 FRINGE BENEFITS 113,245 97,654 110,485 96,504 96,504 13,98153050 PROPERTY RENTAL/LEASE 10,059 14,999 18,641 18,641 18,641 053605 MEMBERSHIP/REGISTRATION FEES 0 70 350 350 350 053705 ADVERTISING SERVICES 13,168 26,563 40,000 40,000 26,000 14,00053905 EMP TUITION AND/OR TRAVEL REIM 0 0 461 461 461 054640 HARDWARE/TOOLS 380 324 1,000 1,500 0 1,00054675 OFFICE SUPPLIES 2,820 2,960 3,000 3,000 3,000 054700 PUBLICATIONS 14 0 100 100 100 054725 POSTAGE 0 0 16 16 16 055155 OFFICE EQUIPMENT RENTAL/LEAS 4,575 2,049 5,400 5,400 5,400 0
04 OPERATIONAL EXPENSES 31,017 46,965 68,968 69,468 53,968 15,00056085 FOOD SERVICES 5,131 3,387 10,000 10,000 4,000 6,00056110 FINANCIAL SERVICES 0 0 87 87 87 056155 MEDICAL SERVICES 119,058 134,973 135,000 110,000 110,000 25,00056165 MANAGEMENT SERVICES 166,206 135,978 150,000 150,000 150,000 056175 OFFICE EQUIPMENT MAINT SRVCS 1,995 1,869 4,000 4,000 4,000 056180 OTHER SERVICES 6,425 6,273 7,500 7,500 7,500 0
05 SPECIAL SERVICES 298,815 282,480 306,587 281,587 275,587 31,00001070 CIVIL SERVICE 959,905 888,542 992,470 970,044 917,544 74,926
175

FY 2018-2019 ADOPTED GENERAL FUND BUDGET
CITY OF BRIDGEPORT, CONNECTICUT
This page left blank intentionally.
176
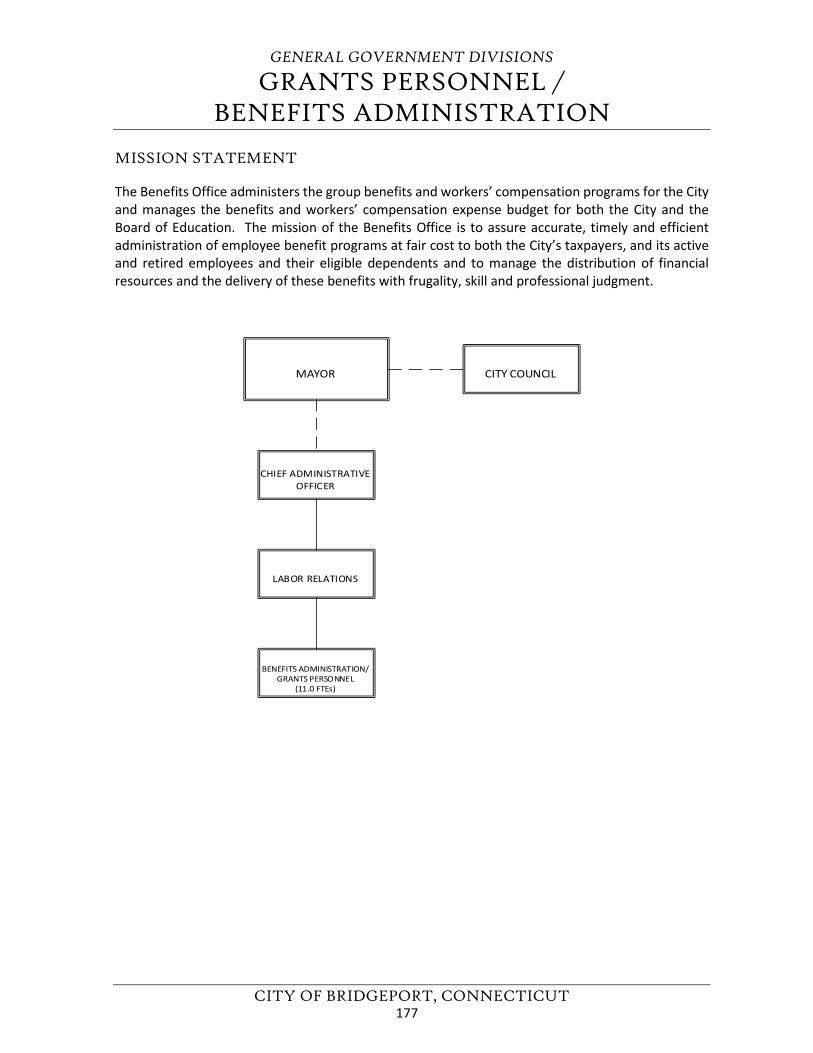
GENERAL GOVERNMENT DIVISIONS
GRANTS PERSONNEL / BENEFITS ADMINISTRATION
CITY OF BRIDGEPORT, CONNECTICUT
MISSION STATEMENT The Benefits Office administers the group benefits and workers’ compensation programs for the City and manages the benefits and workers’ compensation expense budget for both the City and the Board of Education. The mission of the Benefits Office is to assure accurate, timely and efficient administration of employee benefit programs at fair cost to both the City’s taxpayers, and its active and retired employees and their eligible dependents and to manage the distribution of financial resources and the delivery of these benefits with frugality, skill and professional judgment.
MAYOR
CHIEF ADMINISTRATIVE OFFICER
LABOR RELATIONS
CITY COUNCIL
BENEFITS ADMINISTRATION/ GRANTS PERSONNEL
(11.0 FTEs)
177
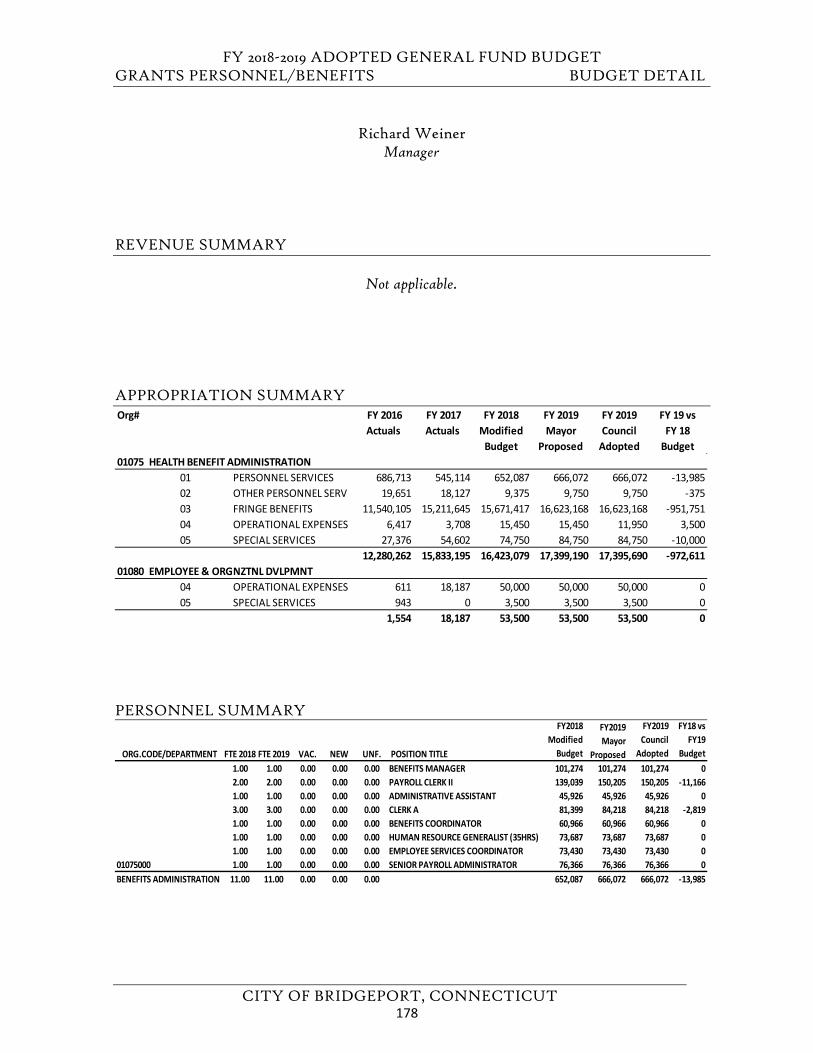
FY 2018-2019 ADOPTED GENERAL FUND BUDGET GRANTS PERSONNEL/BENEFITS BUDGET DETAIL
CITY OF BRIDGEPORT, CONNECTICUT
Richard Weiner Manager
REVENUE SUMMARY
Not applicable.
APPROPRIATION SUMMARY
PERSONNEL SUMMARY
Org# FY 2016 Actuals
FY 2017 Actuals
FY 2018 Modified
Budget
FY 2019 Mayor
Proposed
FY 2019 Council
Adopted
FY 19 vs FY 18
Budget01075 HEALTH BENEFIT ADMINISTRATION
01 PERSONNEL SERVICES 686,713 545,114 652,087 666,072 666,072 -13,98502 OTHER PERSONNEL SERV 19,651 18,127 9,375 9,750 9,750 -37503 FRINGE BENEFITS 11,540,105 15,211,645 15,671,417 16,623,168 16,623,168 -951,75104 OPERATIONAL EXPENSES 6,417 3,708 15,450 15,450 11,950 3,50005 SPECIAL SERVICES 27,376 54,602 74,750 84,750 84,750 -10,000
12,280,262 15,833,195 16,423,079 17,399,190 17,395,690 -972,61101080 EMPLOYEE & ORGNZTNL DVLPMNT
04 OPERATIONAL EXPENSES 611 18,187 50,000 50,000 50,000 005 SPECIAL SERVICES 943 0 3,500 3,500 3,500 0
1,554 18,187 53,500 53,500 53,500 0
ORG.CODE/DEPARTMENT FTE 2018 FTE 2019 VAC. NEW UNF. POSITION TITLE
FY2018 Modified
Budget
FY2019 Mayor
Proposed
FY2019 Council
Adopted
FY18 vs FY19
Budget 1.00 1.00 0.00 0.00 0.00 BENEFITS MANAGER 101,274 101,274 101,274 02.00 2.00 0.00 0.00 0.00 PAYROLL CLERK II 139,039 150,205 150,205 -11,1661.00 1.00 0.00 0.00 0.00 ADMINISTRATIVE ASSISTANT 45,926 45,926 45,926 03.00 3.00 0.00 0.00 0.00 CLERK A 81,399 84,218 84,218 -2,8191.00 1.00 0.00 0.00 0.00 BENEFITS COORDINATOR 60,966 60,966 60,966 01.00 1.00 0.00 0.00 0.00 HUMAN RESOURCE GENERALIST (35HRS) 73,687 73,687 73,687 01.00 1.00 0.00 0.00 0.00 EMPLOYEE SERVICES COORDINATOR 73,430 73,430 73,430 0
01075000 1.00 1.00 0.00 0.00 0.00 SENIOR PAYROLL ADMINISTRATOR 76,366 76,366 76,366 0BENEFITS ADMINISTRATION 11.00 11.00 0.00 0.00 0.00 652,087 666,072 666,072 -13,985
178
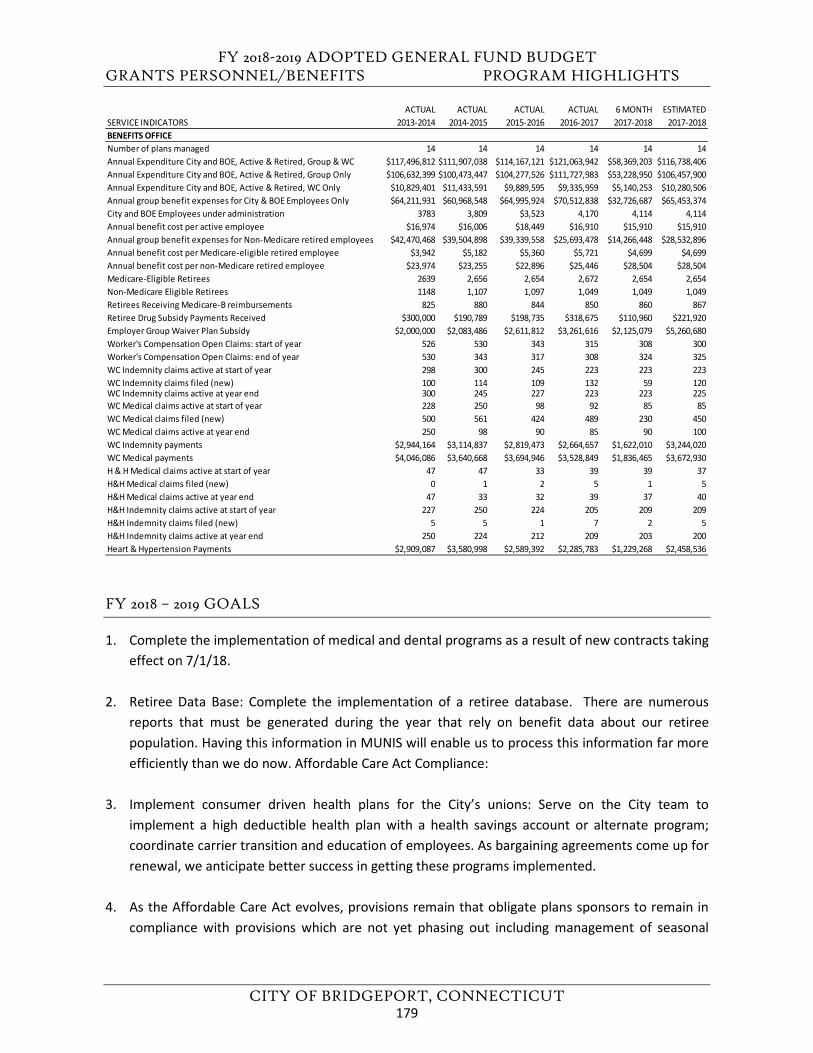
FY 2018-2019 ADOPTED GENERAL FUND BUDGET GRANTS PERSONNEL/BENEFITS PROGRAM HIGHLIGHTS
CITY OF BRIDGEPORT, CONNECTICUT
FY 2018 – 2019 GOALS
1. Complete the implementation of medical and dental programs as a result of new contracts takingeffect on 7/1/18.
2. Retiree Data Base: Complete the implementation of a retiree database. There are numerousreports that must be generated during the year that rely on benefit data about our retireepopulation. Having this information in MUNIS will enable us to process this information far moreefficiently than we do now. Affordable Care Act Compliance:
3. Implement consumer driven health plans for the City’s unions: Serve on the City team toimplement a high deductible health plan with a health savings account or alternate program;coordinate carrier transition and education of employees. As bargaining agreements come up forrenewal, we anticipate better success in getting these programs implemented.
4. As the Affordable Care Act evolves, provisions remain that obligate plans sponsors to remain incompliance with provisions which are not yet phasing out including management of seasonal
ACTUAL ACTUAL ACTUAL ACTUAL 6 MONTH ESTIMATEDSERVICE INDICATORS 2013-2014 2014-2015 2015-2016 2016-2017 2017-2018 2017-2018BENEFITS OFFICENumber of plans managed 14 14 14 14 14 14Annual Expenditure City and BOE, Active & Retired, Group & WC $117,496,812 $111,907,038 $114,167,121 $121,063,942 $58,369,203 $116,738,406Annual Expenditure City and BOE, Active & Retired, Group Only $106,632,399 $100,473,447 $104,277,526 $111,727,983 $53,228,950 $106,457,900Annual Expenditure City and BOE, Active & Retired, WC Only $10,829,401 $11,433,591 $9,889,595 $9,335,959 $5,140,253 $10,280,506Annual group benefit expenses for City & BOE Employees Only $64,211,931 $60,968,548 $64,995,924 $70,512,838 $32,726,687 $65,453,374City and BOE Employees under administration 3783 3,809 $3,523 4,170 4,114 4,114Annual benefit cost per active employee $16,974 $16,006 $18,449 $16,910 $15,910 $15,910Annual group benefit expenses for Non-Medicare retired employees $42,470,468 $39,504,898 $39,339,558 $25,693,478 $14,266,448 $28,532,896Annual benefit cost per Medicare-eligible retired employee $3,942 $5,182 $5,360 $5,721 $4,699 $4,699Annual benefit cost per non-Medicare retired employee $23,974 $23,255 $22,896 $25,446 $28,504 $28,504Medicare-Eligible Retirees 2639 2,656 2,654 2,672 2,654 2,654Non-Medicare Eligible Retirees 1148 1,107 1,097 1,049 1,049 1,049Retirees Receiving Medicare-B reimbursements 825 880 844 850 860 867Retiree Drug Subsidy Payments Received $300,000 $190,789 $198,735 $318,675 $110,960 $221,920Employer Group Waiver Plan Subsidy $2,000,000 $2,083,486 $2,611,812 $3,261,616 $2,125,079 $5,260,680Worker's Compensation Open Claims: start of year 526 530 343 315 308 300Worker's Compensation Open Claims: end of year 530 343 317 308 324 325WC Indemnity claims active at start of year 298 300 245 223 223 223WC Indemnity claims filed (new) 100 114 109 132 59 120WC Indemnity claims active at year end 300 245 227 223 223 225WC Medical claims active at start of year 228 250 98 92 85 85WC Medical claims filed (new) 500 561 424 489 230 450WC Medical claims active at year end 250 98 90 85 90 100WC Indemnity payments $2,944,164 $3,114,837 $2,819,473 $2,664,657 $1,622,010 $3,244,020WC Medical payments $4,046,086 $3,640,668 $3,694,946 $3,528,849 $1,836,465 $3,672,930H & H Medical claims active at start of year 47 47 33 39 39 37H&H Medical claims filed (new) 0 1 2 5 1 5H&H Medical claims active at year end 47 33 32 39 37 40H&H Indemnity claims active at start of year 227 250 224 205 209 209H&H Indemnity claims filed (new) 5 5 1 7 2 5H&H Indemnity claims active at year end 250 224 212 209 203 200Heart & Hypertension Payments $2,909,087 $3,580,998 $2,589,392 $2,285,783 $1,229,268 $2,458,536
179
FY 2018-2019 ADOPTED GENERAL FUND BUDGET GRANTS PERSONNEL/BENEFITS PROGRAM HIGHLIGHTS
CITY OF BRIDGEPORT, CONNECTICUT
workers, the Cadillac Tax and 1095-C form, out-of-pocket-maximums, to name a few. This Office will assure compliance with the provision during FY-19.
5. Plan for large number of firefighter retirements in FY-19 due to changes in state statutesmandating age 65 retirement for firefighter and changes in bargaining agreement languageallowing retirement after age 55 with at least 15 years of service.
FY 2017 – 2018 GOAL STATUS
1. Conduct RFP on Medical Plan: Hire a consultant to coordinate medical plan RFP, draft RFPlanguage for medical plan, including a selection panel, publish RFP, review credentials ofbidders and award a contract commencing 7/1/18.6 MONTH STATUS: RFPs were prepared for both the medical plan and the dental plan.The Segal Consulting Firm was hired to assist the City/BOE in reaching decisions on vendors.The RFP was published last fall.Selection meetings will occur in February.Vendors should be in place for 7/1/18.
2. Implement a consumer driven health plan for each of the City’s unions: Serve on the City teamto implement a high deductible health plan with a health savings account; coordinate carriertransition and education of employees. This objective is contingent on the City successfullynegotiating these programs with its unions.6 MONTH STATUS: Numerous meetings were held with various unions, however, noneexpressed a willingness to enter into an agreement for such a plan. We anticipate bettersuccess implementing these plans as bargaining agreements come up for renewal.
3. Conduct RFP for Long Term/Short Term Disability Insurance: The existing carrier has been inplace for a number of years.6 MONTH STATUS: An RFP was conducted and a contract was reached with The Hartford LifeInsurance Company.
4. Complete transition to a self-insured administration of City/BOE Medicare: With theappointment of a self-insured third party administrator effective 3/1/17, claims monitoringmeasures need to be implemented to assure an efficiently run program during FY-18.6 MONTH STATUS: The City/BOE entered into a self-insured funding arrangement for MedicareMedical Supplement Claims in 2017. Previously all vestiges of fully insured prescription drugplans were eliminted and replaced by Employer Group Waiver Plans (EGWPs).Claim projections are trending down for both Medicare medical supplemental benefits andprescription drug benefits as evidenced in the FY-19 budget being submitted.
5. Determine feasibility of a efficient administration of Medicare-B reimbursement for eligibleretirees on MERS and Pension Plans B: The number of retirees eligible for this benefit who arepresently reimbursed through the AP system has made this approach too labor intensive.
180
FY 2018-2019 ADOPTED GENERAL FUND BUDGET GRANTS PERSONNEL/BENEFITS PROGRAM HIGHLIGHTS
CITY OF BRIDGEPORT, CONNECTICUT
6 MONTH STATUS: This continues to be an issue for the Benefits Office. Unlike Pension Plan-A which is administered by our payroll system, the Pension Plans-B and the MERS pensions are not part of our payroll system and therefore required the Medicare-B reimbursements continue to be paid through individual checks to retirees, which is an obsolete and time-consuming approach.
6. Investigate the feasibility of purchasing stop-loss insurance for our workers’ compensationprogram.6 MONTH STATUS: A study was conducted with the assistance and expertise of PMA, the City’sthird party administrator for workers compensation. The cost would be prohibitive – on theorder of $500,000 per year for a $750,000 stop-loss policy. Over the next ten years, PMAestimates seven claims passing this threshold. The comment by PMA was that we could be inthe same position by reserving $500,000 for extraordinary expenses.
181
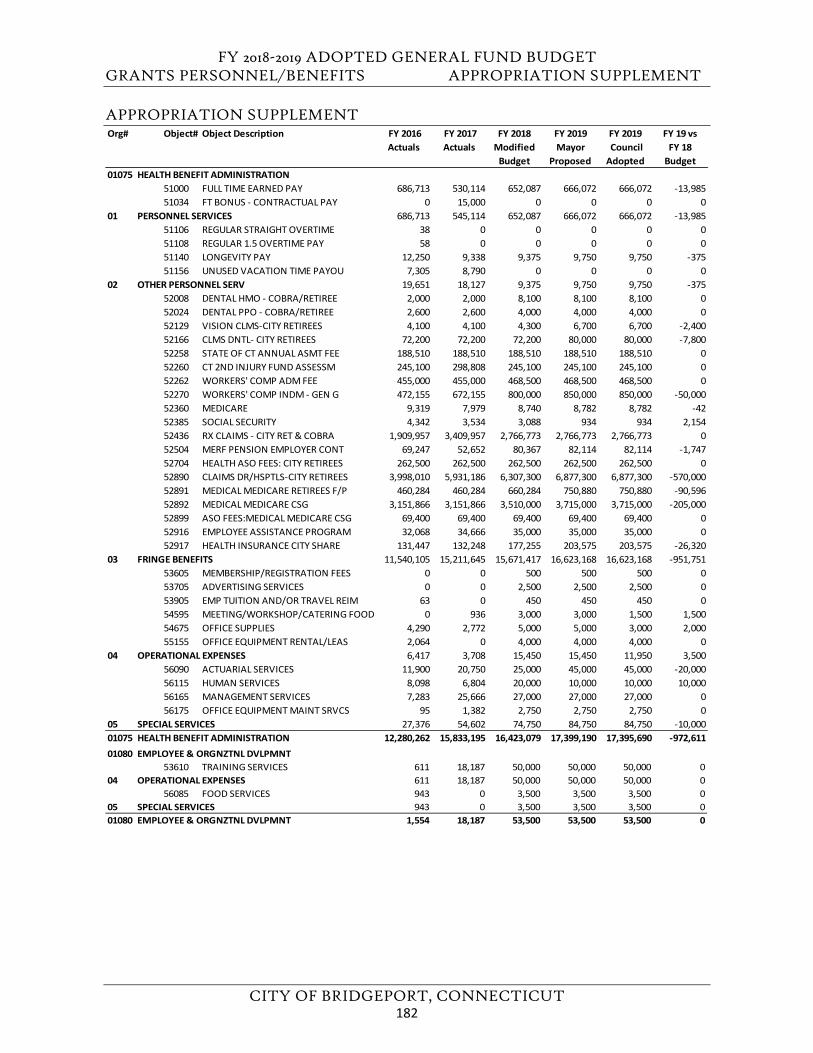
FY 2018-2019 ADOPTED GENERAL FUND BUDGET GRANTS PERSONNEL/BENEFITS APPROPRIATION SUPPLEMENT
CITY OF BRIDGEPORT, CONNECTICUT
APPROPRIATION SUPPLEMENT Org# Object# Object Description FY 2016
Actuals FY 2017 Actuals
FY 2018 Modified
Budget
FY 2019Mayor
Proposed
FY 2019 Council Adopted
FY 19 vs FY 18
Budget01075 HEALTH BENEFIT ADMINISTRATION
51000 FULL TIME EARNED PAY 686,713 530,114 652,087 666,072 666,072 -13,98551034 FT BONUS - CONTRACTUAL PAY 0 15,000 0 0 0 0
01 PERSONNEL SERVICES 686,713 545,114 652,087 666,072 666,072 -13,98551106 REGULAR STRAIGHT OVERTIME 38 0 0 0 0 051108 REGULAR 1.5 OVERTIME PAY 58 0 0 0 0 051140 LONGEVITY PAY 12,250 9,338 9,375 9,750 9,750 -37551156 UNUSED VACATION TIME PAYOU 7,305 8,790 0 0 0 0
02 OTHER PERSONNEL SERV 19,651 18,127 9,375 9,750 9,750 -37552008 DENTAL HMO - COBRA/RETIREE 2,000 2,000 8,100 8,100 8,100 052024 DENTAL PPO - COBRA/RETIREE 2,600 2,600 4,000 4,000 4,000 052129 VISION CLMS-CITY RETIREES 4,100 4,100 4,300 6,700 6,700 -2,40052166 CLMS DNTL- CITY RETIREES 72,200 72,200 72,200 80,000 80,000 -7,80052258 STATE OF CT ANNUAL ASMT FEE 188,510 188,510 188,510 188,510 188,510 052260 CT 2ND INJURY FUND ASSESSM 245,100 298,808 245,100 245,100 245,100 052262 WORKERS' COMP ADM FEE 455,000 455,000 468,500 468,500 468,500 052270 WORKERS' COMP INDM - GEN G 472,155 672,155 800,000 850,000 850,000 -50,00052360 MEDICARE 9,319 7,979 8,740 8,782 8,782 -4252385 SOCIAL SECURITY 4,342 3,534 3,088 934 934 2,15452436 RX CLAIMS - CITY RET & COBRA 1,909,957 3,409,957 2,766,773 2,766,773 2,766,773 052504 MERF PENSION EMPLOYER CONT 69,247 52,652 80,367 82,114 82,114 -1,74752704 HEALTH ASO FEES: CITY RETIREES 262,500 262,500 262,500 262,500 262,500 052890 CLAIMS DR/HSPTLS-CITY RETIREES 3,998,010 5,931,186 6,307,300 6,877,300 6,877,300 -570,00052891 MEDICAL MEDICARE RETIREES F/P 460,284 460,284 660,284 750,880 750,880 -90,59652892 MEDICAL MEDICARE CSG 3,151,866 3,151,866 3,510,000 3,715,000 3,715,000 -205,00052899 ASO FEES:MEDICAL MEDICARE CSG 69,400 69,400 69,400 69,400 69,400 052916 EMPLOYEE ASSISTANCE PROGRAM 32,068 34,666 35,000 35,000 35,000 052917 HEALTH INSURANCE CITY SHARE 131,447 132,248 177,255 203,575 203,575 -26,320
03 FRINGE BENEFITS 11,540,105 15,211,645 15,671,417 16,623,168 16,623,168 -951,75153605 MEMBERSHIP/REGISTRATION FEES 0 0 500 500 500 053705 ADVERTISING SERVICES 0 0 2,500 2,500 2,500 053905 EMP TUITION AND/OR TRAVEL REIM 63 0 450 450 450 054595 MEETING/WORKSHOP/CATERING FOOD 0 936 3,000 3,000 1,500 1,50054675 OFFICE SUPPLIES 4,290 2,772 5,000 5,000 3,000 2,00055155 OFFICE EQUIPMENT RENTAL/LEAS 2,064 0 4,000 4,000 4,000 0
04 OPERATIONAL EXPENSES 6,417 3,708 15,450 15,450 11,950 3,50056090 ACTUARIAL SERVICES 11,900 20,750 25,000 45,000 45,000 -20,00056115 HUMAN SERVICES 8,098 6,804 20,000 10,000 10,000 10,00056165 MANAGEMENT SERVICES 7,283 25,666 27,000 27,000 27,000 056175 OFFICE EQUIPMENT MAINT SRVCS 95 1,382 2,750 2,750 2,750 0
05 SPECIAL SERVICES 27,376 54,602 74,750 84,750 84,750 -10,00001075 HEALTH BENEFIT ADMINISTRATION 12,280,262 15,833,195 16,423,079 17,399,190 17,395,690 -972,61101080 EMPLOYEE & ORGNZTNL DVLPMNT
53610 TRAINING SERVICES 611 18,187 50,000 50,000 50,000 004 OPERATIONAL EXPENSES 611 18,187 50,000 50,000 50,000 0
56085 FOOD SERVICES 943 0 3,500 3,500 3,500 005 SPECIAL SERVICES 943 0 3,500 3,500 3,500 001080 EMPLOYEE & ORGNZTNL DVLPMNT 1,554 18,187 53,500 53,500 53,500 0
182
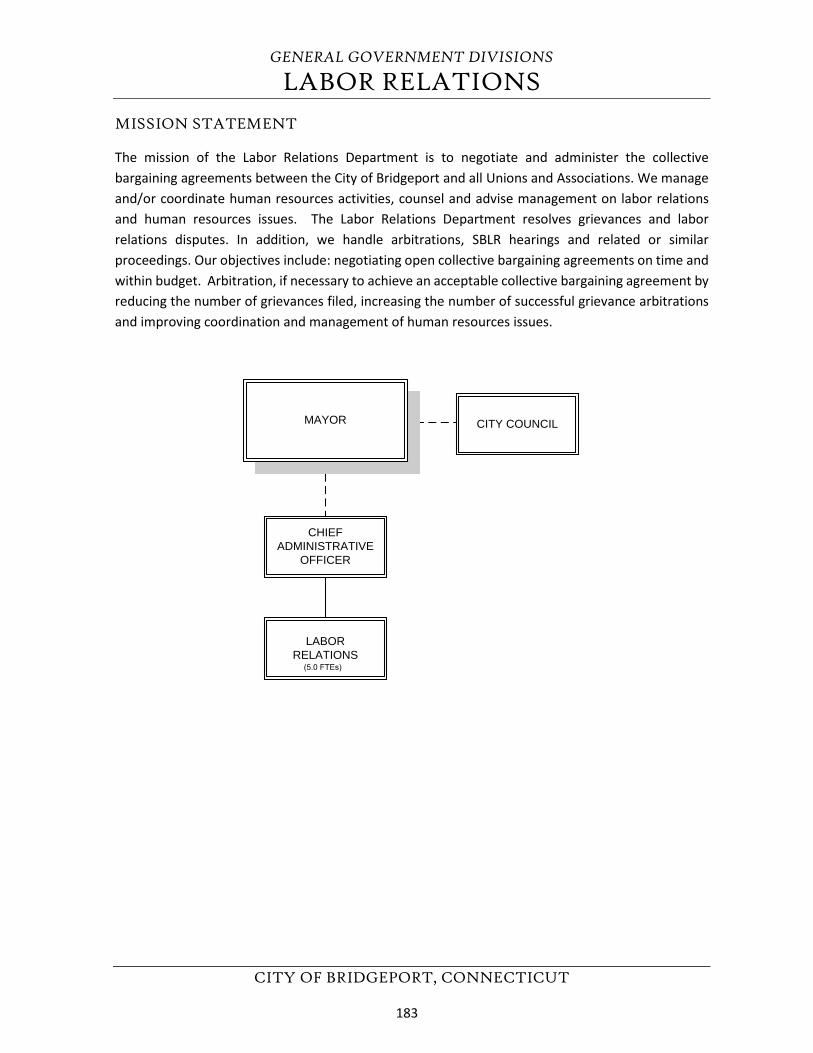
GENERAL GOVERNMENT DIVISIONS
LABOR RELATIONS
CITY OF BRIDGEPORT, CONNECTICUT
MISSION STATEMENT
The mission of the Labor Relations Department is to negotiate and administer the collective bargaining agreements between the City of Bridgeport and all Unions and Associations. We manage and/or coordinate human resources activities, counsel and advise management on labor relations and human resources issues. The Labor Relations Department resolves grievances and labor relations disputes. In addition, we handle arbitrations, SBLR hearings and related or similar proceedings. Our objectives include: negotiating open collective bargaining agreements on time and within budget. Arbitration, if necessary to achieve an acceptable collective bargaining agreement by reducing the number of grievances filed, increasing the number of successful grievance arbitrations and improving coordination and management of human resources issues.
CHIEFADMINISTRATIVE
OFFICER
LABORRELATIONS (5.0 FTEs)
MAYOR CITY COUNCIL
183
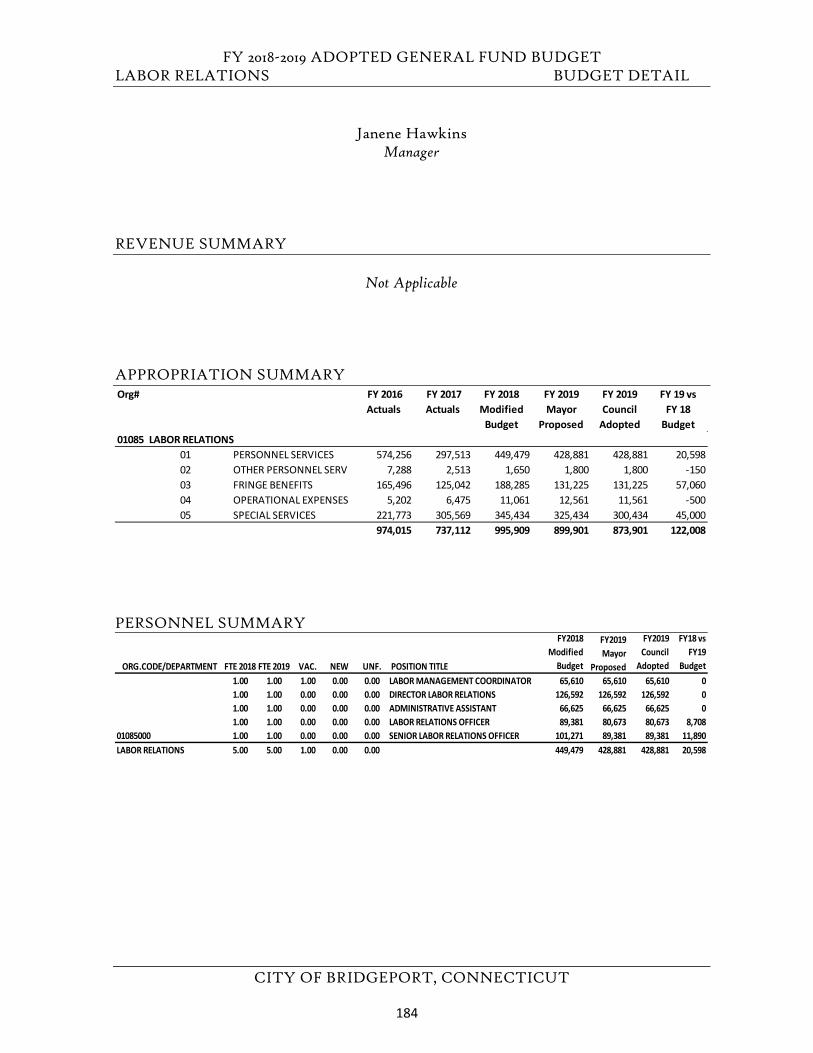
FY 2018-2019 ADOPTED GENERAL FUND BUDGET LABOR RELATIONS BUDGET DETAIL
CITY OF BRIDGEPORT, CONNECTICUT
Janene Hawkins Manager
REVENUE SUMMARY
Not Applicable
APPROPRIATION SUMMARY
PERSONNEL SUMMARY
Org# FY 2016 Actuals
FY 2017 Actuals
FY 2018 Modified
Budget
FY 2019 Mayor
Proposed
FY 2019 Council
Adopted
FY 19 vs FY 18
Budget01085 LABOR RELATIONS
01 PERSONNEL SERVICES 574,256 297,513 449,479 428,881 428,881 20,59802 OTHER PERSONNEL SERV 7,288 2,513 1,650 1,800 1,800 -15003 FRINGE BENEFITS 165,496 125,042 188,285 131,225 131,225 57,06004 OPERATIONAL EXPENSES 5,202 6,475 11,061 12,561 11,561 -50005 SPECIAL SERVICES 221,773 305,569 345,434 325,434 300,434 45,000
974,015 737,112 995,909 899,901 873,901 122,008
ORG.CODE/DEPARTMENT FTE 2018 FTE 2019 VAC. NEW UNF. POSITION TITLE
FY2018 Modified
Budget
FY2019 Mayor
Proposed
FY2019 Council
Adopted
FY18 vs FY19
Budget 1.00 1.00 1.00 0.00 0.00 LABOR MANAGEMENT COORDINATOR 65,610 65,610 65,610 01.00 1.00 0.00 0.00 0.00 DIRECTOR LABOR RELATIONS 126,592 126,592 126,592 01.00 1.00 0.00 0.00 0.00 ADMINISTRATIVE ASSISTANT 66,625 66,625 66,625 01.00 1.00 0.00 0.00 0.00 LABOR RELATIONS OFFICER 89,381 80,673 80,673 8,708
01085000 1.00 1.00 0.00 0.00 0.00 SENIOR LABOR RELATIONS OFFICER 101,271 89,381 89,381 11,890LABOR RELATIONS 5.00 5.00 1.00 0.00 0.00 449,479 428,881 428,881 20,598
184
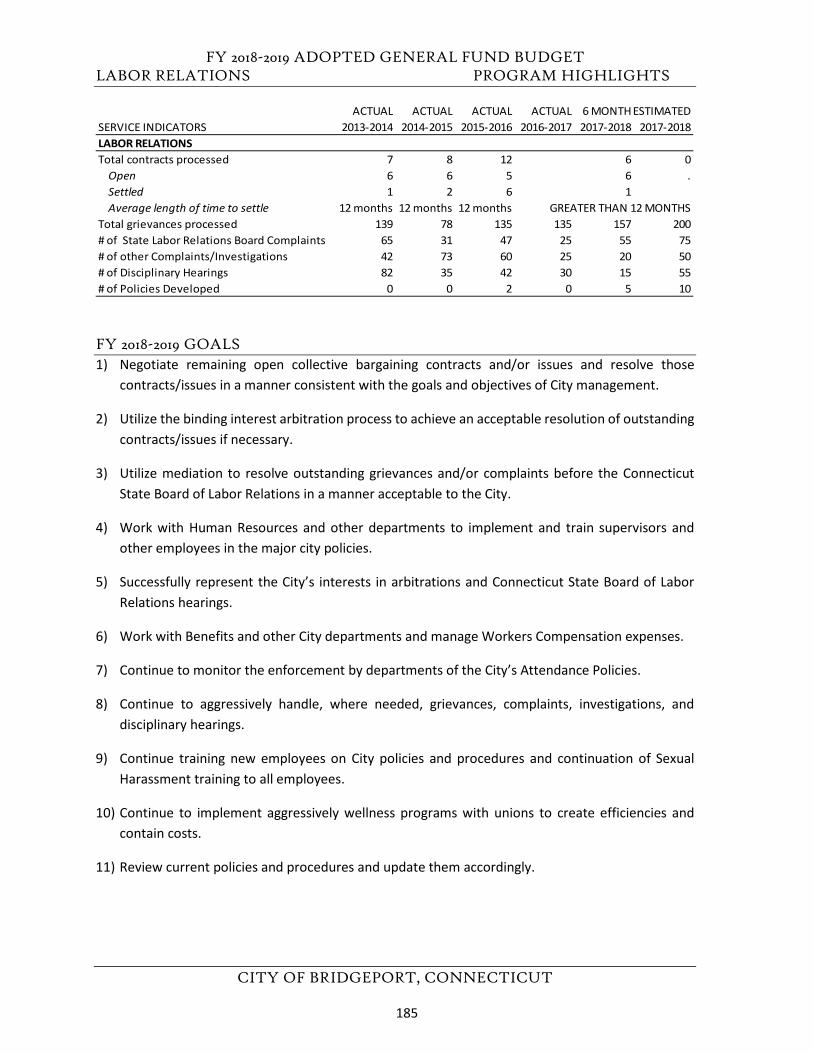
FY 2018-2019 ADOPTED GENERAL FUND BUDGET LABOR RELATIONS PROGRAM HIGHLIGHTS
CITY OF BRIDGEPORT, CONNECTICUT
FY 2018-2019 GOALS 1) Negotiate remaining open collective bargaining contracts and/or issues and resolve those
contracts/issues in a manner consistent with the goals and objectives of City management.
2) Utilize the binding interest arbitration process to achieve an acceptable resolution of outstandingcontracts/issues if necessary.
3) Utilize mediation to resolve outstanding grievances and/or complaints before the ConnecticutState Board of Labor Relations in a manner acceptable to the City.
4) Work with Human Resources and other departments to implement and train supervisors andother employees in the major city policies.
5) Successfully represent the City’s interests in arbitrations and Connecticut State Board of LaborRelations hearings.
6) Work with Benefits and other City departments and manage Workers Compensation expenses.
7) Continue to monitor the enforcement by departments of the City’s Attendance Policies.
8) Continue to aggressively handle, where needed, grievances, complaints, investigations, anddisciplinary hearings.
9) Continue training new employees on City policies and procedures and continuation of SexualHarassment training to all employees.
10) Continue to implement aggressively wellness programs with unions to create efficiencies andcontain costs.
11) Review current policies and procedures and update them accordingly.
ACTUAL ACTUAL ACTUAL ACTUAL 6 MONTHESTIMATEDSERVICE INDICATORS 2013-2014 2014-2015 2015-2016 2016-2017 2017-2018 2017-2018LABOR RELATIONS Total contracts processed 7 8 12 6 0
Open 6 6 5 6 .Settled 1 2 6 1Average length of time to settle 12 months 12 months 12 months GREATER THAN 12 MONTHS
Total grievances processed 139 78 135 135 157 200# of State Labor Relations Board Complaints 65 31 47 25 55 75# of other Complaints/Investigations 42 73 60 25 20 50# of Disciplinary Hearings 82 35 42 30 15 55# of Policies Developed 0 0 2 0 5 10
185
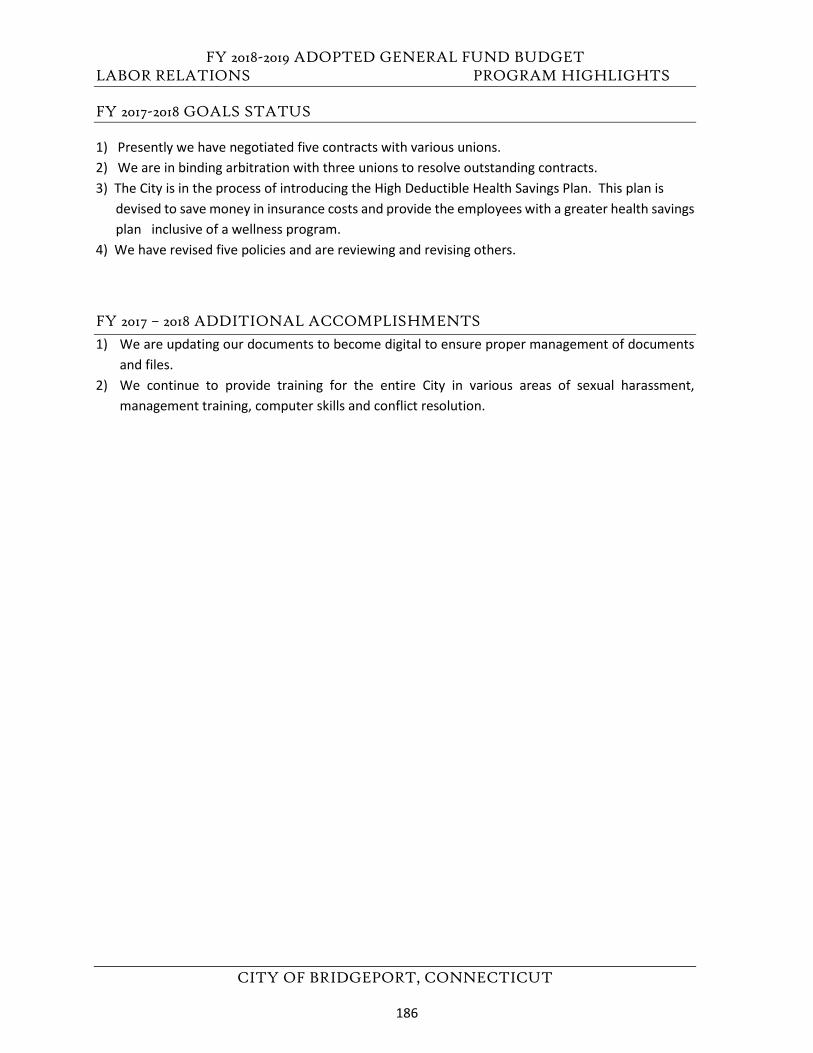
FY 2018-2019 ADOPTED GENERAL FUND BUDGET LABOR RELATIONS PROGRAM HIGHLIGHTS
CITY OF BRIDGEPORT, CONNECTICUT
FY 2017-2018 GOALS STATUS
1) Presently we have negotiated five contracts with various unions.2) We are in binding arbitration with three unions to resolve outstanding contracts.3) The City is in the process of introducing the High Deductible Health Savings Plan. This plan is
devised to save money in insurance costs and provide the employees with a greater health savingsplan inclusive of a wellness program.
4) We have revised five policies and are reviewing and revising others.
FY 2017 – 2018 ADDITIONAL ACCOMPLISHMENTS 1) We are updating our documents to become digital to ensure proper management of documents
and files.2) We continue to provide training for the entire City in various areas of sexual harassment,
management training, computer skills and conflict resolution.
186
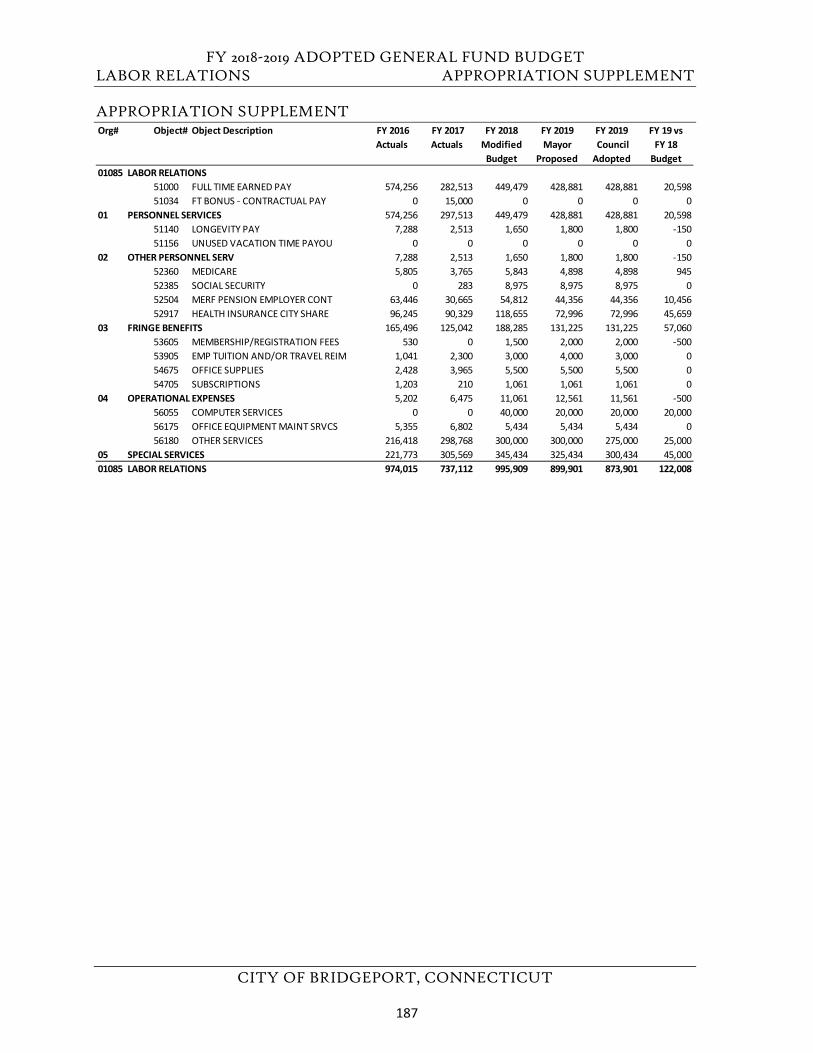
FY 2018-2019 ADOPTED GENERAL FUND BUDGET LABOR RELATIONS APPROPRIATION SUPPLEMENT
CITY OF BRIDGEPORT, CONNECTICUT
APPROPRIATION SUPPLEMENT Org# Object# Object Description FY 2016
Actuals FY 2017 Actuals
FY 2018 Modified
Budget
FY 2019Mayor
Proposed
FY 2019 Council Adopted
FY 19 vs FY 18
Budget01085 LABOR RELATIONS
51000 FULL TIME EARNED PAY 574,256 282,513 449,479 428,881 428,881 20,59851034 FT BONUS - CONTRACTUAL PAY 0 15,000 0 0 0 0
01 PERSONNEL SERVICES 574,256 297,513 449,479 428,881 428,881 20,59851140 LONGEVITY PAY 7,288 2,513 1,650 1,800 1,800 -15051156 UNUSED VACATION TIME PAYOU 0 0 0 0 0 0
02 OTHER PERSONNEL SERV 7,288 2,513 1,650 1,800 1,800 -15052360 MEDICARE 5,805 3,765 5,843 4,898 4,898 94552385 SOCIAL SECURITY 0 283 8,975 8,975 8,975 052504 MERF PENSION EMPLOYER CONT 63,446 30,665 54,812 44,356 44,356 10,45652917 HEALTH INSURANCE CITY SHARE 96,245 90,329 118,655 72,996 72,996 45,659
03 FRINGE BENEFITS 165,496 125,042 188,285 131,225 131,225 57,06053605 MEMBERSHIP/REGISTRATION FEES 530 0 1,500 2,000 2,000 -50053905 EMP TUITION AND/OR TRAVEL REIM 1,041 2,300 3,000 4,000 3,000 054675 OFFICE SUPPLIES 2,428 3,965 5,500 5,500 5,500 054705 SUBSCRIPTIONS 1,203 210 1,061 1,061 1,061 0
04 OPERATIONAL EXPENSES 5,202 6,475 11,061 12,561 11,561 -50056055 COMPUTER SERVICES 0 0 40,000 20,000 20,000 20,00056175 OFFICE EQUIPMENT MAINT SRVCS 5,355 6,802 5,434 5,434 5,434 056180 OTHER SERVICES 216,418 298,768 300,000 300,000 275,000 25,000
05 SPECIAL SERVICES 221,773 305,569 345,434 325,434 300,434 45,00001085 LABOR RELATIONS 974,015 737,112 995,909 899,901 873,901 122,008
187

FY 2018-2019 ADOPTED GENERAL FUND BUDGET
CITY OF BRIDGEPORT, CONNECTICUT
This page left blank intentionally.
188
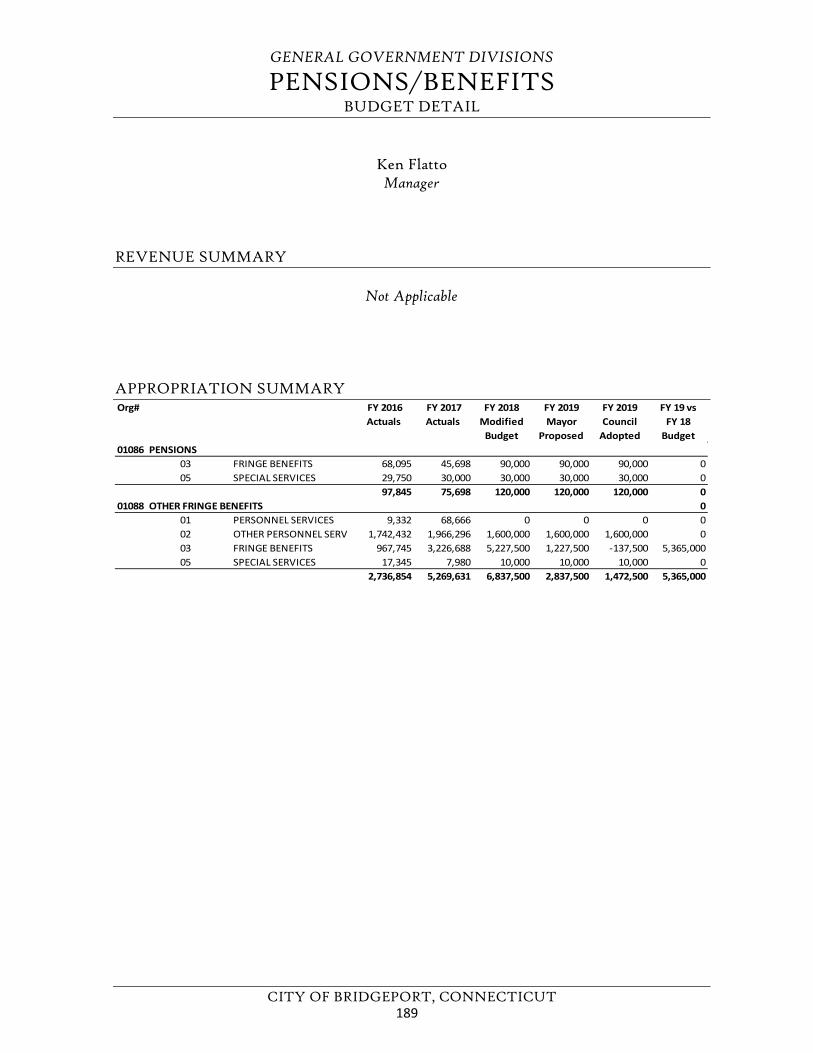
GENERAL GOVERNMENT DIVISIONS
PENSIONS/BENEFITS BUDGET DETAIL
CITY OF BRIDGEPORT, CONNECTICUT
Ken Flatto Manager
REVENUE SUMMARY
Not Applicable
APPROPRIATION SUMMARY Org# FY 2016
Actuals FY 2017 Actuals
FY 2018 Modified
Budget
FY 2019 Mayor
Proposed
FY 2019 Council
Adopted
FY 19 vs FY 18
Budget01086 PENSIONS
03 FRINGE BENEFITS 68,095 45,698 90,000 90,000 90,000 005 SPECIAL SERVICES 29,750 30,000 30,000 30,000 30,000 0
97,845 75,698 120,000 120,000 120,000 001088 OTHER FRINGE BENEFITS 0
01 PERSONNEL SERVICES 9,332 68,666 0 0 0 002 OTHER PERSONNEL SERV 1,742,432 1,966,296 1,600,000 1,600,000 1,600,000 003 FRINGE BENEFITS 967,745 3,226,688 5,227,500 1,227,500 -137,500 5,365,00005 SPECIAL SERVICES 17,345 7,980 10,000 10,000 10,000 0
2,736,854 5,269,631 6,837,500 2,837,500 1,472,500 5,365,000
189
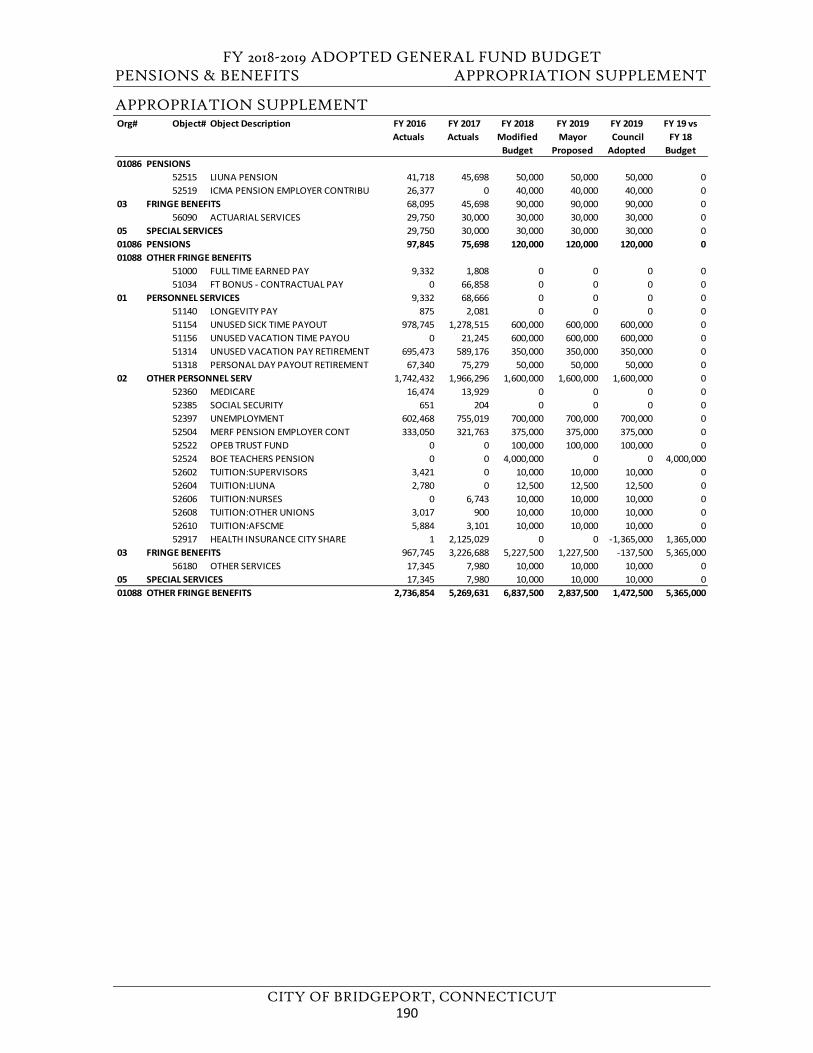
FY 2018-2019 ADOPTED GENERAL FUND BUDGET PENSIONS & BENEFITS APPROPRIATION SUPPLEMENT
CITY OF BRIDGEPORT, CONNECTICUT
APPROPRIATION SUPPLEMENT Org# Object# Object Description FY 2016
Actuals FY 2017 Actuals
FY 2018 Modified
Budget
FY 2019Mayor
Proposed
FY 2019 Council Adopted
FY 19 vs FY 18
Budget01086 PENSIONS
52515 LIUNA PENSION 41,718 45,698 50,000 50,000 50,000 052519 ICMA PENSION EMPLOYER CONTRIBU 26,377 0 40,000 40,000 40,000 0
03 FRINGE BENEFITS 68,095 45,698 90,000 90,000 90,000 056090 ACTUARIAL SERVICES 29,750 30,000 30,000 30,000 30,000 0
05 SPECIAL SERVICES 29,750 30,000 30,000 30,000 30,000 001086 PENSIONS 97,845 75,698 120,000 120,000 120,000 001088 OTHER FRINGE BENEFITS
51000 FULL TIME EARNED PAY 9,332 1,808 0 0 0 051034 FT BONUS - CONTRACTUAL PAY 0 66,858 0 0 0 0
01 PERSONNEL SERVICES 9,332 68,666 0 0 0 051140 LONGEVITY PAY 875 2,081 0 0 0 051154 UNUSED SICK TIME PAYOUT 978,745 1,278,515 600,000 600,000 600,000 051156 UNUSED VACATION TIME PAYOU 0 21,245 600,000 600,000 600,000 051314 UNUSED VACATION PAY RETIREMENT 695,473 589,176 350,000 350,000 350,000 051318 PERSONAL DAY PAYOUT RETIREMENT 67,340 75,279 50,000 50,000 50,000 0
02 OTHER PERSONNEL SERV 1,742,432 1,966,296 1,600,000 1,600,000 1,600,000 052360 MEDICARE 16,474 13,929 0 0 0 052385 SOCIAL SECURITY 651 204 0 0 0 052397 UNEMPLOYMENT 602,468 755,019 700,000 700,000 700,000 052504 MERF PENSION EMPLOYER CONT 333,050 321,763 375,000 375,000 375,000 052522 OPEB TRUST FUND 0 0 100,000 100,000 100,000 052524 BOE TEACHERS PENSION 0 0 4,000,000 0 0 4,000,00052602 TUITION:SUPERVISORS 3,421 0 10,000 10,000 10,000 052604 TUITION:LIUNA 2,780 0 12,500 12,500 12,500 052606 TUITION:NURSES 0 6,743 10,000 10,000 10,000 052608 TUITION:OTHER UNIONS 3,017 900 10,000 10,000 10,000 052610 TUITION:AFSCME 5,884 3,101 10,000 10,000 10,000 052917 HEALTH INSURANCE CITY SHARE 1 2,125,029 0 0 -1,365,000 1,365,000
03 FRINGE BENEFITS 967,745 3,226,688 5,227,500 1,227,500 -137,500 5,365,00056180 OTHER SERVICES 17,345 7,980 10,000 10,000 10,000 0
05 SPECIAL SERVICES 17,345 7,980 10,000 10,000 10,000 001088 OTHER FRINGE BENEFITS 2,736,854 5,269,631 6,837,500 2,837,500 1,472,500 5,365,000
190
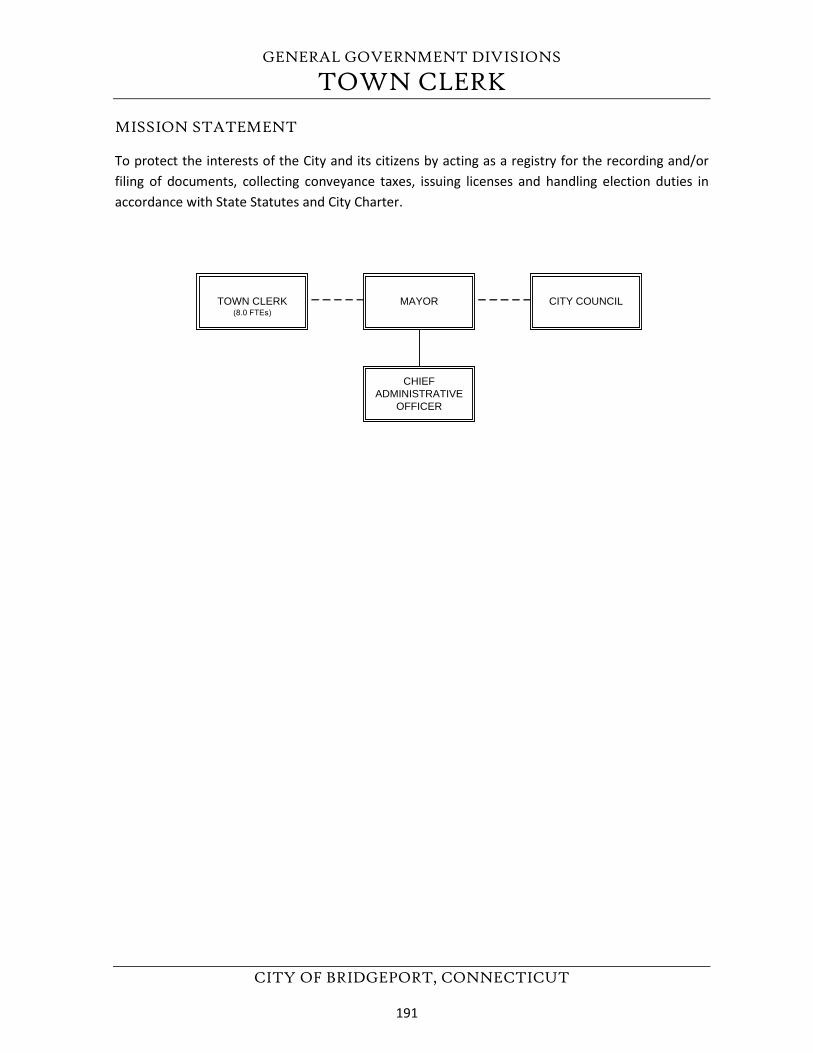
GENERAL GOVERNMENT DIVISIONS
TOWN CLERK
CITY OF BRIDGEPORT, CONNECTICUT
MISSION STATEMENT
To protect the interests of the City and its citizens by acting as a registry for the recording and/or filing of documents, collecting conveyance taxes, issuing licenses and handling election duties in accordance with State Statutes and City Charter.
CHIEFADMINISTRATIVE
OFFICER
CITY COUNCILTOWN CLERK(8.0 FTEs)
MAYOR
191
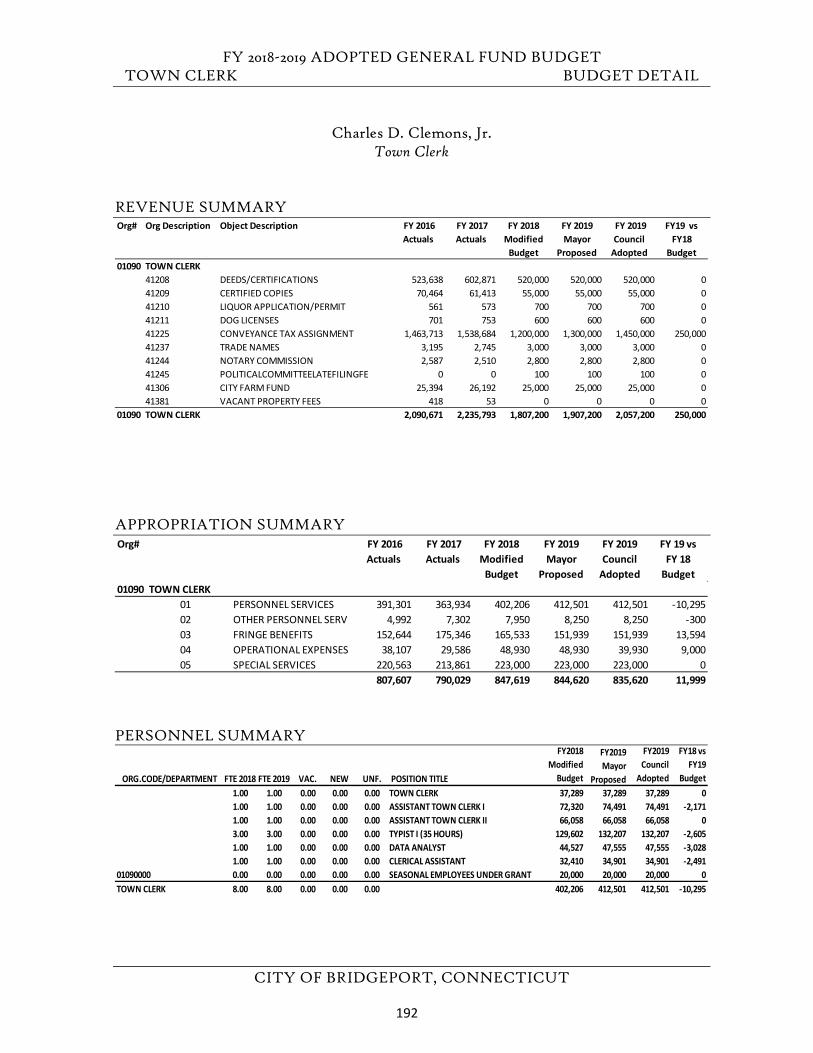
FY 2018-2019 ADOPTED GENERAL FUND BUDGET TOWN CLERK BUDGET DETAIL
CITY OF BRIDGEPORT, CONNECTICUT
Charles D. Clemons, Jr. Town Clerk
REVENUE SUMMARY
APPROPRIATION SUMMARY
PERSONNEL SUMMARY
Org# Org Description Object Description FY 2016 Actuals
FY 2017 Actuals
FY 2018 Modified
Budget
FY 2019 Mayor
Proposed
FY 2019 Council
Adopted
FY19 vs FY18
Budget01090 TOWN CLERK
41208 DEEDS/CERTIFICATIONS 523,638 602,871 520,000 520,000 520,000 041209 CERTIFIED COPIES 70,464 61,413 55,000 55,000 55,000 041210 LIQUOR APPLICATION/PERMIT 561 573 700 700 700 041211 DOG LICENSES 701 753 600 600 600 041225 CONVEYANCE TAX ASSIGNMENT 1,463,713 1,538,684 1,200,000 1,300,000 1,450,000 250,00041237 TRADE NAMES 3,195 2,745 3,000 3,000 3,000 041244 NOTARY COMMISSION 2,587 2,510 2,800 2,800 2,800 041245 POLITICALCOMMITTEELATEFILINGFE 0 0 100 100 100 041306 CITY FARM FUND 25,394 26,192 25,000 25,000 25,000 041381 VACANT PROPERTY FEES 418 53 0 0 0 0
01090 TOWN CLERK 2,090,671 2,235,793 1,807,200 1,907,200 2,057,200 250,000
Org# FY 2016 Actuals
FY 2017 Actuals
FY 2018 Modified
Budget
FY 2019 Mayor
Proposed
FY 2019 Council
Adopted
FY 19 vs FY 18
Budget01090 TOWN CLERK
01 PERSONNEL SERVICES 391,301 363,934 402,206 412,501 412,501 -10,29502 OTHER PERSONNEL SERV 4,992 7,302 7,950 8,250 8,250 -30003 FRINGE BENEFITS 152,644 175,346 165,533 151,939 151,939 13,59404 OPERATIONAL EXPENSES 38,107 29,586 48,930 48,930 39,930 9,00005 SPECIAL SERVICES 220,563 213,861 223,000 223,000 223,000 0
807,607 790,029 847,619 844,620 835,620 11,999
ORG.CODE/DEPARTMENT FTE 2018 FTE 2019 VAC. NEW UNF. POSITION TITLE
FY2018 Modified
Budget
FY2019 Mayor
Proposed
FY2019 Council
Adopted
FY18 vs FY19
Budget 1.00 1.00 0.00 0.00 0.00 TOWN CLERK 37,289 37,289 37,289 01.00 1.00 0.00 0.00 0.00 ASSISTANT TOWN CLERK I 72,320 74,491 74,491 -2,1711.00 1.00 0.00 0.00 0.00 ASSISTANT TOWN CLERK II 66,058 66,058 66,058 03.00 3.00 0.00 0.00 0.00 TYPIST I (35 HOURS) 129,602 132,207 132,207 -2,6051.00 1.00 0.00 0.00 0.00 DATA ANALYST 44,527 47,555 47,555 -3,0281.00 1.00 0.00 0.00 0.00 CLERICAL ASSISTANT 32,410 34,901 34,901 -2,491
01090000 0.00 0.00 0.00 0.00 0.00 SEASONAL EMPLOYEES UNDER GRANT 20,000 20,000 20,000 0TOWN CLERK 8.00 8.00 0.00 0.00 0.00 402,206 412,501 412,501 -10,295
192
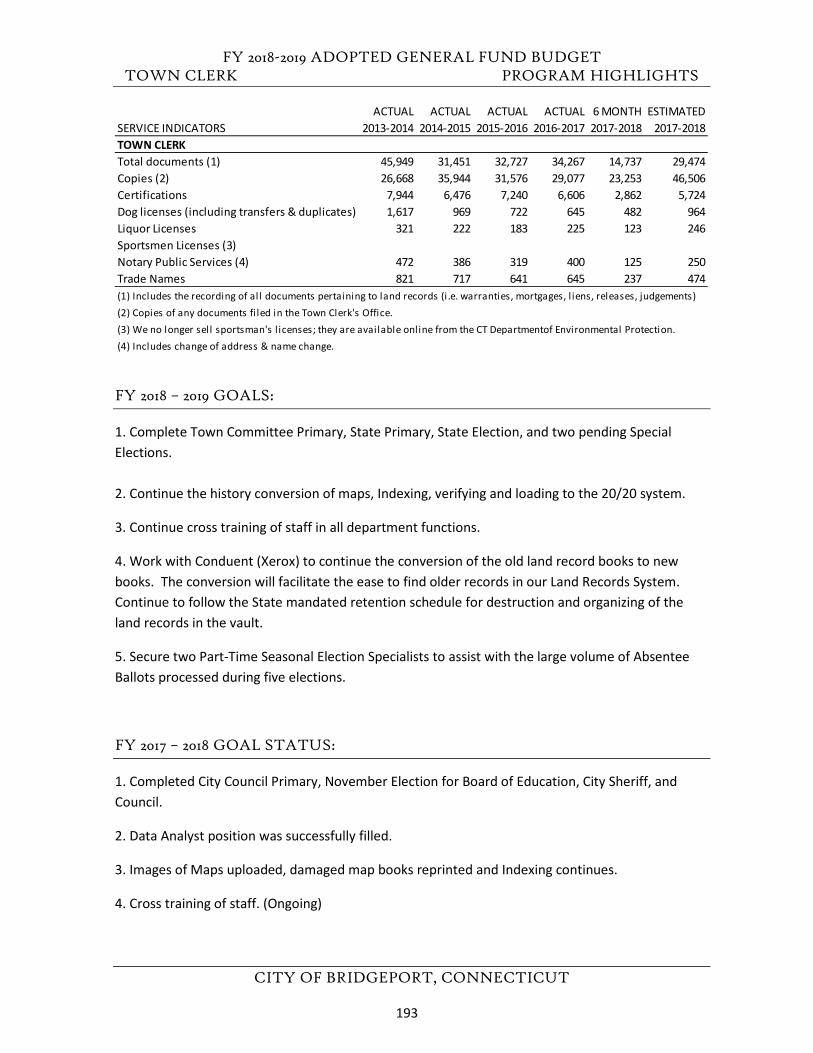
FY 2018-2019 ADOPTED GENERAL FUND BUDGET TOWN CLERK PROGRAM HIGHLIGHTS
CITY OF BRIDGEPORT, CONNECTICUT
FY 2018 – 2019 GOALS:
1. Complete Town Committee Primary, State Primary, State Election, and two pending SpecialElections.
2. Continue the history conversion of maps, Indexing, verifying and loading to the 20/20 system.
3. Continue cross training of staff in all department functions.
4. Work with Conduent (Xerox) to continue the conversion of the old land record books to newbooks. The conversion will facilitate the ease to find older records in our Land Records System.Continue to follow the State mandated retention schedule for destruction and organizing of theland records in the vault.
5. Secure two Part-Time Seasonal Election Specialists to assist with the large volume of AbsenteeBallots processed during five elections.
FY 2017 – 2018 GOAL STATUS:
1. Completed City Council Primary, November Election for Board of Education, City Sheriff, andCouncil.
2. Data Analyst position was successfully filled.
3. Images of Maps uploaded, damaged map books reprinted and Indexing continues.
4. Cross training of staff. (Ongoing)
ACTUAL ACTUAL ACTUAL ACTUAL 6 MONTH ESTIMATEDSERVICE INDICATORS 2013-2014 2014-2015 2015-2016 2016-2017 2017-2018 2017-2018TOWN CLERKTotal documents (1) 45,949 31,451 32,727 34,267 14,737 29,474Copies (2) 26,668 35,944 31,576 29,077 23,253 46,506Certifications 7,944 6,476 7,240 6,606 2,862 5,724Dog licenses (including transfers & duplicates) 1,617 969 722 645 482 964Liquor Licenses 321 222 183 225 123 246Sportsmen Licenses (3)Notary Public Services (4) 472 386 319 400 125 250Trade Names 821 717 641 645 237 474(1) Includes the recording of all documents pertaining to land records (i .e. warranties, mortgages, l iens, releases, judgements)(2) Copies of any documents fi led in the Town Clerk's Office.(3) We no longer sell sportsman's l icenses; they are available online from the CT Departmentof Environmental Protection.(4) Includes change of address & name change.
193
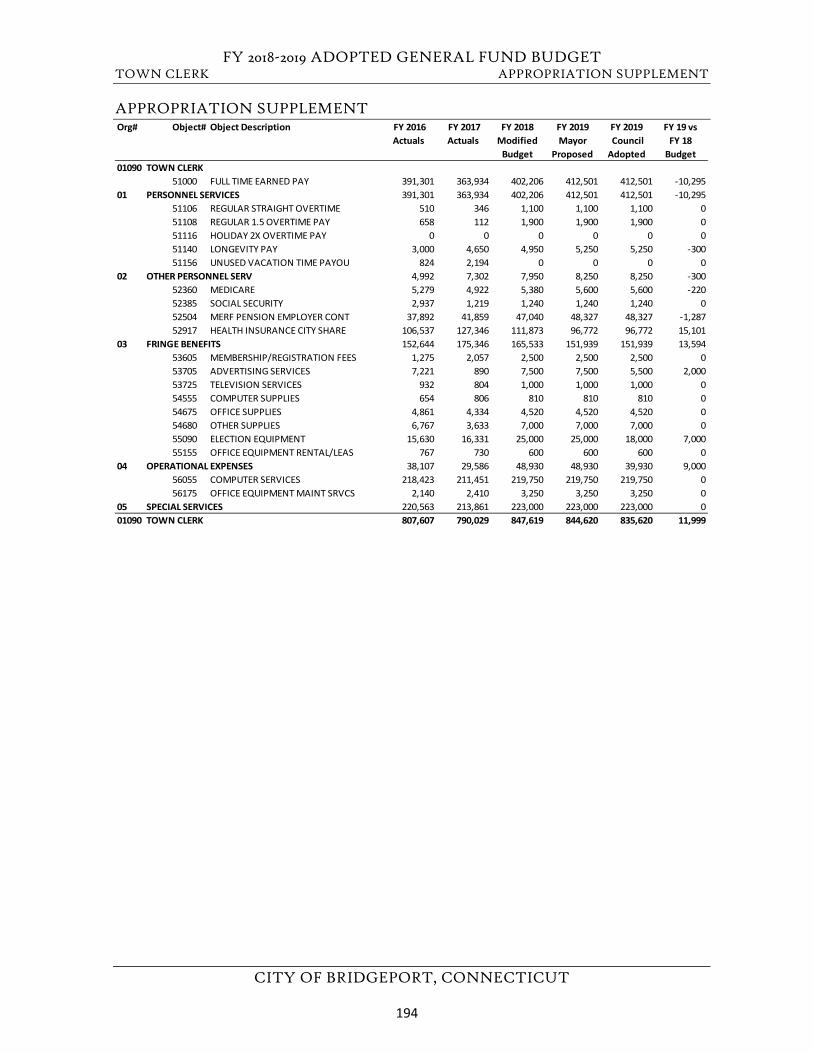
FY 2018-2019 ADOPTED GENERAL FUND BUDGET TOWN CLERK APPROPRIATION SUPPLEMENT
CITY OF BRIDGEPORT, CONNECTICUT
APPROPRIATION SUPPLEMENT Org# Object# Object Description FY 2016
Actuals FY 2017 Actuals
FY 2018 Modified
Budget
FY 2019Mayor
Proposed
FY 2019 Council Adopted
FY 19 vs FY 18
Budget01090 TOWN CLERK
51000 FULL TIME EARNED PAY 391,301 363,934 402,206 412,501 412,501 -10,29501 PERSONNEL SERVICES 391,301 363,934 402,206 412,501 412,501 -10,295
51106 REGULAR STRAIGHT OVERTIME 510 346 1,100 1,100 1,100 051108 REGULAR 1.5 OVERTIME PAY 658 112 1,900 1,900 1,900 051116 HOLIDAY 2X OVERTIME PAY 0 0 0 0 0 051140 LONGEVITY PAY 3,000 4,650 4,950 5,250 5,250 -30051156 UNUSED VACATION TIME PAYOU 824 2,194 0 0 0 0
02 OTHER PERSONNEL SERV 4,992 7,302 7,950 8,250 8,250 -30052360 MEDICARE 5,279 4,922 5,380 5,600 5,600 -22052385 SOCIAL SECURITY 2,937 1,219 1,240 1,240 1,240 052504 MERF PENSION EMPLOYER CONT 37,892 41,859 47,040 48,327 48,327 -1,28752917 HEALTH INSURANCE CITY SHARE 106,537 127,346 111,873 96,772 96,772 15,101
03 FRINGE BENEFITS 152,644 175,346 165,533 151,939 151,939 13,59453605 MEMBERSHIP/REGISTRATION FEES 1,275 2,057 2,500 2,500 2,500 053705 ADVERTISING SERVICES 7,221 890 7,500 7,500 5,500 2,00053725 TELEVISION SERVICES 932 804 1,000 1,000 1,000 054555 COMPUTER SUPPLIES 654 806 810 810 810 054675 OFFICE SUPPLIES 4,861 4,334 4,520 4,520 4,520 054680 OTHER SUPPLIES 6,767 3,633 7,000 7,000 7,000 055090 ELECTION EQUIPMENT 15,630 16,331 25,000 25,000 18,000 7,00055155 OFFICE EQUIPMENT RENTAL/LEAS 767 730 600 600 600 0
04 OPERATIONAL EXPENSES 38,107 29,586 48,930 48,930 39,930 9,00056055 COMPUTER SERVICES 218,423 211,451 219,750 219,750 219,750 056175 OFFICE EQUIPMENT MAINT SRVCS 2,140 2,410 3,250 3,250 3,250 0
05 SPECIAL SERVICES 220,563 213,861 223,000 223,000 223,000 001090 TOWN CLERK 807,607 790,029 847,619 844,620 835,620 11,999
194
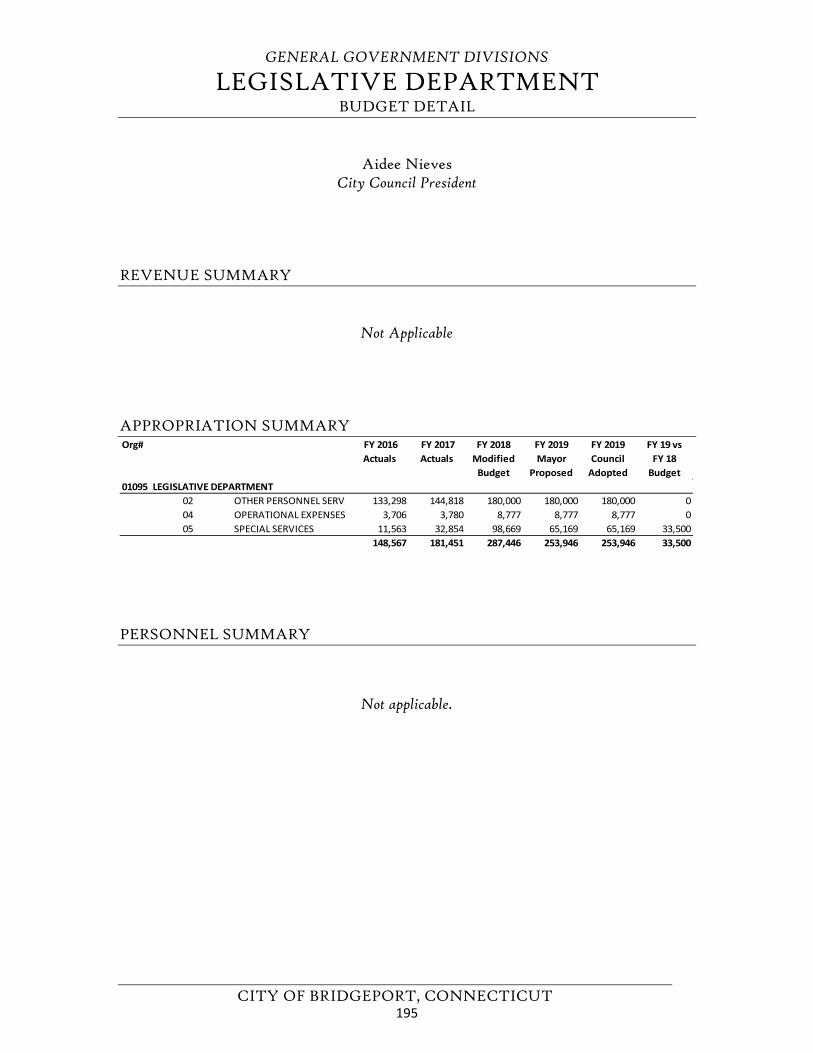
GENERAL GOVERNMENT DIVISIONS
LEGISLATIVE DEPARTMENT BUDGET DETAIL
CITY OF BRIDGEPORT, CONNECTICUT
Aidee Nieves City Council President
REVENUE SUMMARY
Not Applicable
APPROPRIATION SUMMARY
PERSONNEL SUMMARY
Not applicable.
Org# FY 2016 Actuals
FY 2017 Actuals
FY 2018 Modified
Budget
FY 2019 Mayor
Proposed
FY 2019 Council
Adopted
FY 19 vs FY 18
Budget01095 LEGISLATIVE DEPARTMENT
02 OTHER PERSONNEL SERV 133,298 144,818 180,000 180,000 180,000 004 OPERATIONAL EXPENSES 3,706 3,780 8,777 8,777 8,777 005 SPECIAL SERVICES 11,563 32,854 98,669 65,169 65,169 33,500
148,567 181,451 287,446 253,946 253,946 33,500
195
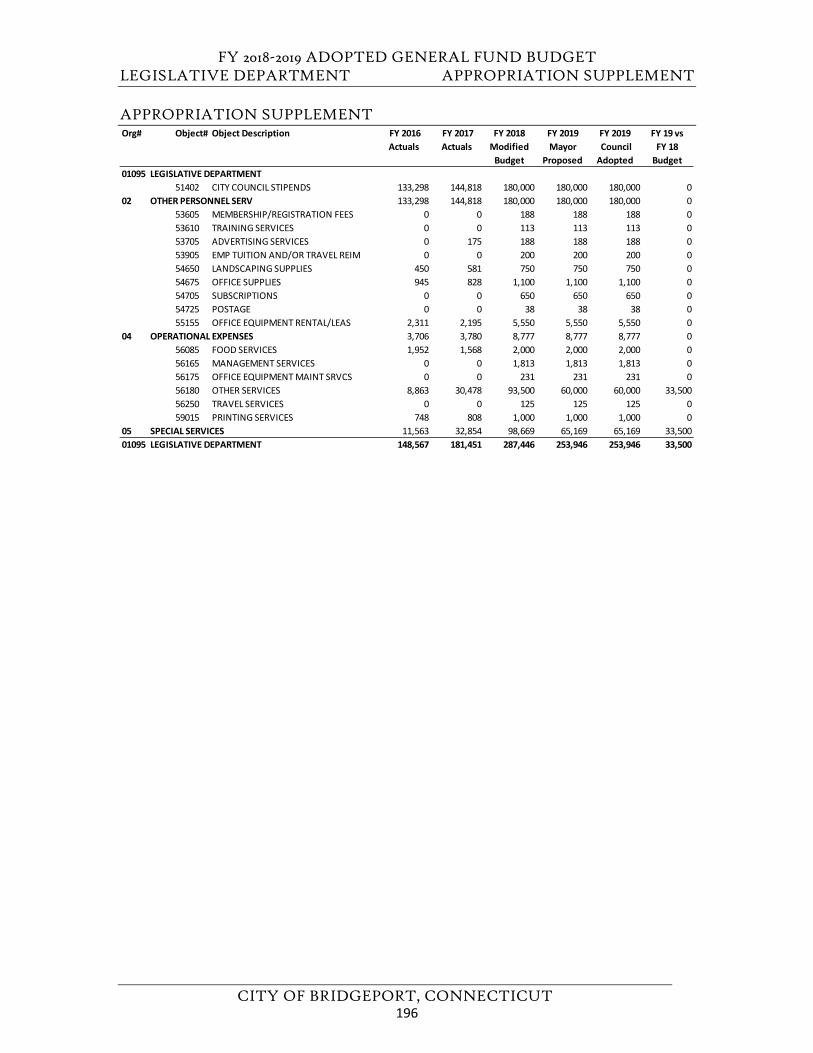
FY 2018-2019 ADOPTED GENERAL FUND BUDGET LEGISLATIVE DEPARTMENT APPROPRIATION SUPPLEMENT
CITY OF BRIDGEPORT, CONNECTICUT
APPROPRIATION SUPPLEMENT Org# Object# Object Description FY 2016
Actuals FY 2017 Actuals
FY 2018 Modified
Budget
FY 2019Mayor
Proposed
FY 2019 Council Adopted
FY 19 vs FY 18
Budget01095 LEGISLATIVE DEPARTMENT
51402 CITY COUNCIL STIPENDS 133,298 144,818 180,000 180,000 180,000 002 OTHER PERSONNEL SERV 133,298 144,818 180,000 180,000 180,000 0
53605 MEMBERSHIP/REGISTRATION FEES 0 0 188 188 188 053610 TRAINING SERVICES 0 0 113 113 113 053705 ADVERTISING SERVICES 0 175 188 188 188 053905 EMP TUITION AND/OR TRAVEL REIM 0 0 200 200 200 054650 LANDSCAPING SUPPLIES 450 581 750 750 750 054675 OFFICE SUPPLIES 945 828 1,100 1,100 1,100 054705 SUBSCRIPTIONS 0 0 650 650 650 054725 POSTAGE 0 0 38 38 38 055155 OFFICE EQUIPMENT RENTAL/LEAS 2,311 2,195 5,550 5,550 5,550 0
04 OPERATIONAL EXPENSES 3,706 3,780 8,777 8,777 8,777 056085 FOOD SERVICES 1,952 1,568 2,000 2,000 2,000 056165 MANAGEMENT SERVICES 0 0 1,813 1,813 1,813 056175 OFFICE EQUIPMENT MAINT SRVCS 0 0 231 231 231 056180 OTHER SERVICES 8,863 30,478 93,500 60,000 60,000 33,50056250 TRAVEL SERVICES 0 0 125 125 125 059015 PRINTING SERVICES 748 808 1,000 1,000 1,000 0
05 SPECIAL SERVICES 11,563 32,854 98,669 65,169 65,169 33,50001095 LEGISLATIVE DEPARTMENT 148,567 181,451 287,446 253,946 253,946 33,500
196
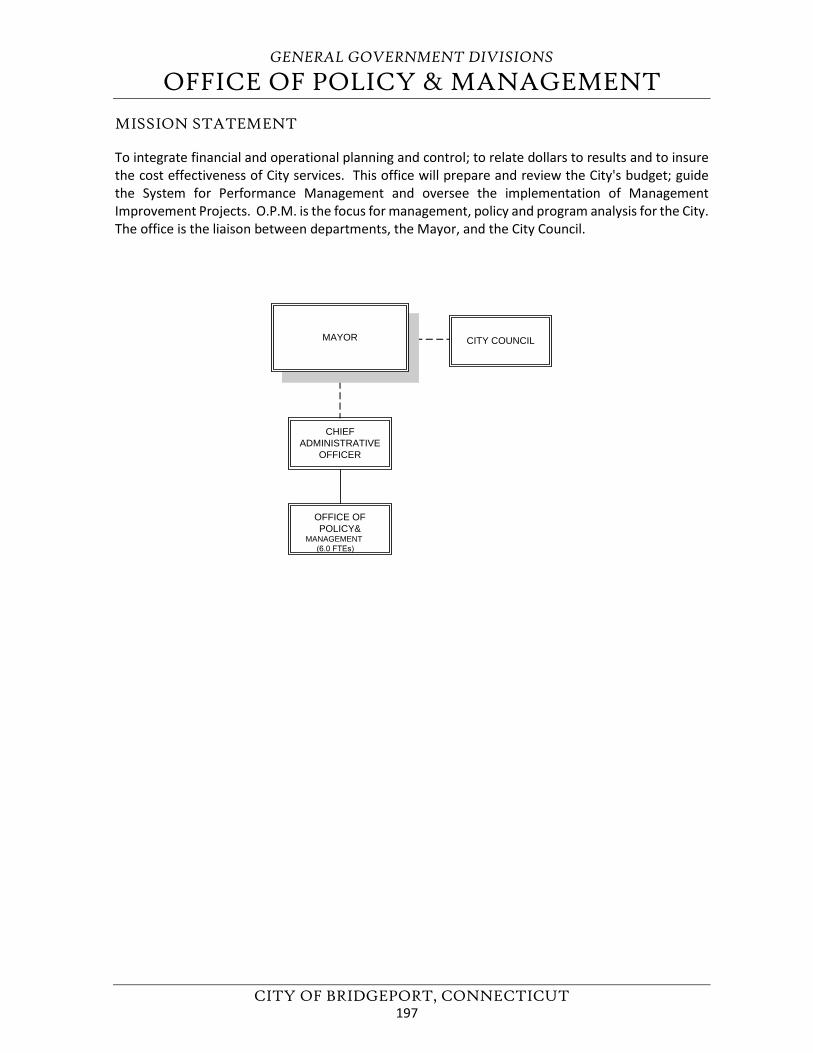
GENERAL GOVERNMENT DIVISIONS
OFFICE OF POLICY & MANAGEMENT
CITY OF BRIDGEPORT, CONNECTICUT
MISSION STATEMENT
To integrate financial and operational planning and control; to relate dollars to results and to insure the cost effectiveness of City services. This office will prepare and review the City's budget; guide the System for Performance Management and oversee the implementation of Management Improvement Projects. O.P.M. is the focus for management, policy and program analysis for the City. The office is the liaison between departments, the Mayor, and the City Council.
CHIEFADMINISTRATIVE
OFFICER
OFFICE OFPOLICY&
MANAGEMENT (6.0 FTEs)
MAYOR CITY COUNCIL
197
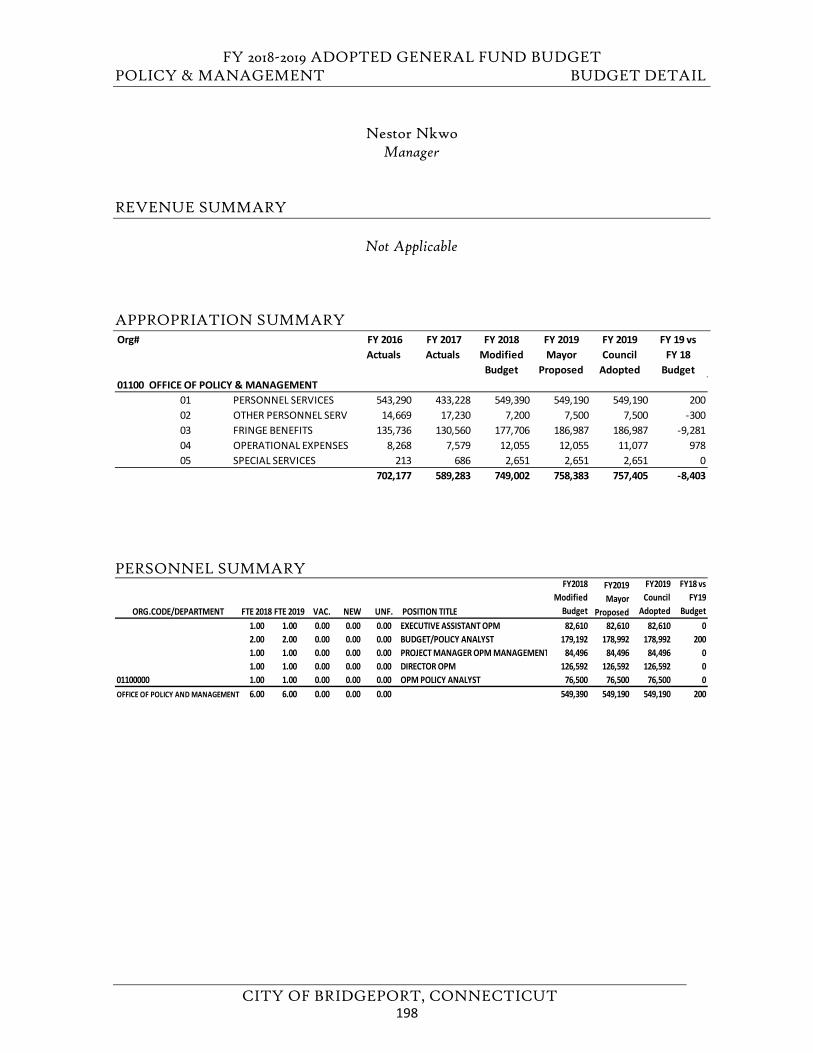
FY 2018-2019 ADOPTED GENERAL FUND BUDGET POLICY & MANAGEMENT BUDGET DETAIL
CITY OF BRIDGEPORT, CONNECTICUT
Nestor Nkwo Manager
REVENUE SUMMARY
Not Applicable
APPROPRIATION SUMMARY
PERSONNEL SUMMARY
Org# FY 2016 Actuals
FY 2017 Actuals
FY 2018 Modified
Budget
FY 2019 Mayor
Proposed
FY 2019 Council
Adopted
FY 19 vs FY 18
Budget01100 OFFICE OF POLICY & MANAGEMENT
01 PERSONNEL SERVICES 543,290 433,228 549,390 549,190 549,190 20002 OTHER PERSONNEL SERV 14,669 17,230 7,200 7,500 7,500 -30003 FRINGE BENEFITS 135,736 130,560 177,706 186,987 186,987 -9,28104 OPERATIONAL EXPENSES 8,268 7,579 12,055 12,055 11,077 97805 SPECIAL SERVICES 213 686 2,651 2,651 2,651 0
702,177 589,283 749,002 758,383 757,405 -8,403
ORG.CODE/DEPARTMENT FTE 2018 FTE 2019 VAC. NEW UNF. POSITION TITLE
FY2018 Modified
Budget
FY2019 Mayor
Proposed
FY2019 Council
Adopted
FY18 vs FY19
Budget 1.00 1.00 0.00 0.00 0.00 EXECUTIVE ASSISTANT OPM 82,610 82,610 82,610 02.00 2.00 0.00 0.00 0.00 BUDGET/POLICY ANALYST 179,192 178,992 178,992 2001.00 1.00 0.00 0.00 0.00 PROJECT MANAGER OPM MANAGEMENT 84,496 84,496 84,496 01.00 1.00 0.00 0.00 0.00 DIRECTOR OPM 126,592 126,592 126,592 0
01100000 1.00 1.00 0.00 0.00 0.00 OPM POLICY ANALYST 76,500 76,500 76,500 0OFFICE OF POLICY AND MANAGEMENT 6.00 6.00 0.00 0.00 0.00 549,390 549,190 549,190 200
198
FY 2018-2019 ADOPTED GENERAL FUND BUDGET POLICY & MANAGEMENT PROGRAM HIGHLIGHTS
CITY OF BRIDGEPORT, CONNECTICUT
FY 2018-2019 GOALS 1) To prepare a City budget that connects the missions, goals and objectives for all City
departments and divisions to the service and performance of that work.2) To collect data reflecting performance levels for service for all City departments. To analyze
department performance levels using history, benchmarking and other comparative analysismethods and integrate these measures into the City budgets. To support related endeavorsin the CitiStat Program, and to work to make this a performance-based culture.
3) Continue to support City departments financially and operationally in providing necessaryservices to their customers.
4) To maintain and control through the fiscal year, the City-wide and department budgets.5) To develop, maintain, and produce monthly reports throughout the fiscal year detailing
justifications and documentation for all City expenditures.6) To provide support and guidance in budgeting and financial management decision making to
other departments.7) To provide budgeting support to all grants received by the City of Bridgeport.8) To support the payroll system and their team.
FY 2017-2018 GOAL STATUS 1) To prepare a City budget that connects the missions, goals and objectives for all City
departments and divisions to the service and performance of that work.6 MONTH STATUS: For the eighth time, the Bridgeport Budget book received a distinguishedbudget award from the Government Financial Officer’s Association. This awards program was established in 1984 to encourage and assist local governments to prepare budget documentsof the very highest quality. Budget reviews are conducted by selected members of the GFOAprofessional staff and outside reviewers. Only those budgets that meet the criteria outlinedin the process receive awards. Criteria are based upon guidelines established by the NationalAdvisory Council on State and Local budgeting and the GFOA’s recommended practices onbudgeting.
2) To maintain an effective City-wide System for Performance Management.6 MONTH STATUS: We continue to refine our performance management templates and usethe information from them to enhance our budget book.
3) Continue to support City departments financially and operationally in providing necessaryservices to their customers.6 MONTH STATUS: This process is continuous.
4) To maintain and control through the fiscal year, the City-wide and department budgets.6 MONTH STATUS: This process is continuous.
5) To develop, maintain, and produce monthly reports throughout the fiscal year detailingjustifications and documentation for all City expenditures.6 MONTH STATUS: OPM closely monitors spending and revenues continuously. Monthlyreports are produced by the Finance Department in concert with OPM.
199
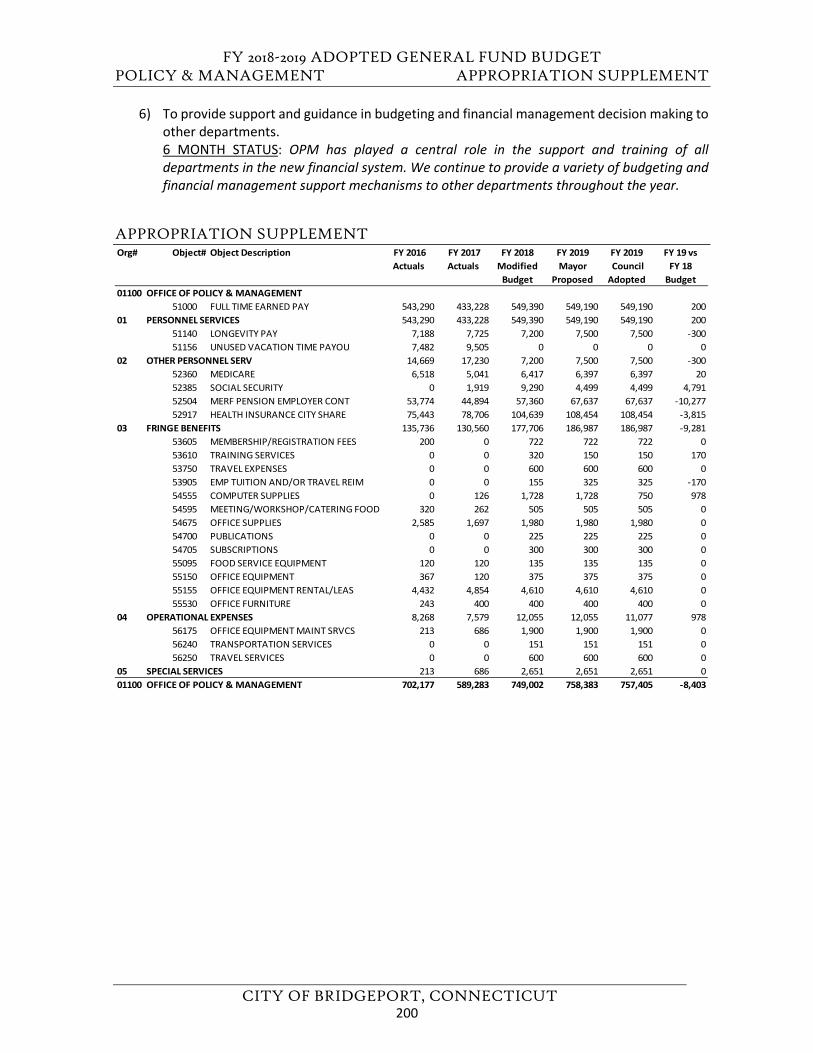
FY 2018-2019 ADOPTED GENERAL FUND BUDGET POLICY & MANAGEMENT APPROPRIATION SUPPLEMENT
CITY OF BRIDGEPORT, CONNECTICUT
6) To provide support and guidance in budgeting and financial management decision making toother departments.6 MONTH STATUS: OPM has played a central role in the support and training of alldepartments in the new financial system. We continue to provide a variety of budgeting andfinancial management support mechanisms to other departments throughout the year.
APPROPRIATION SUPPLEMENT Org# Object# Object Description FY 2016
Actuals FY 2017 Actuals
FY 2018 Modified
Budget
FY 2019Mayor
Proposed
FY 2019 Council Adopted
FY 19 vs FY 18
Budget01100 OFFICE OF POLICY & MANAGEMENT
51000 FULL TIME EARNED PAY 543,290 433,228 549,390 549,190 549,190 20001 PERSONNEL SERVICES 543,290 433,228 549,390 549,190 549,190 200
51140 LONGEVITY PAY 7,188 7,725 7,200 7,500 7,500 -30051156 UNUSED VACATION TIME PAYOU 7,482 9,505 0 0 0 0
02 OTHER PERSONNEL SERV 14,669 17,230 7,200 7,500 7,500 -30052360 MEDICARE 6,518 5,041 6,417 6,397 6,397 2052385 SOCIAL SECURITY 0 1,919 9,290 4,499 4,499 4,79152504 MERF PENSION EMPLOYER CONT 53,774 44,894 57,360 67,637 67,637 -10,27752917 HEALTH INSURANCE CITY SHARE 75,443 78,706 104,639 108,454 108,454 -3,815
03 FRINGE BENEFITS 135,736 130,560 177,706 186,987 186,987 -9,28153605 MEMBERSHIP/REGISTRATION FEES 200 0 722 722 722 053610 TRAINING SERVICES 0 0 320 150 150 17053750 TRAVEL EXPENSES 0 0 600 600 600 053905 EMP TUITION AND/OR TRAVEL REIM 0 0 155 325 325 -17054555 COMPUTER SUPPLIES 0 126 1,728 1,728 750 97854595 MEETING/WORKSHOP/CATERING FOOD 320 262 505 505 505 054675 OFFICE SUPPLIES 2,585 1,697 1,980 1,980 1,980 054700 PUBLICATIONS 0 0 225 225 225 054705 SUBSCRIPTIONS 0 0 300 300 300 055095 FOOD SERVICE EQUIPMENT 120 120 135 135 135 055150 OFFICE EQUIPMENT 367 120 375 375 375 055155 OFFICE EQUIPMENT RENTAL/LEAS 4,432 4,854 4,610 4,610 4,610 055530 OFFICE FURNITURE 243 400 400 400 400 0
04 OPERATIONAL EXPENSES 8,268 7,579 12,055 12,055 11,077 97856175 OFFICE EQUIPMENT MAINT SRVCS 213 686 1,900 1,900 1,900 056240 TRANSPORTATION SERVICES 0 0 151 151 151 056250 TRAVEL SERVICES 0 0 600 600 600 0
05 SPECIAL SERVICES 213 686 2,651 2,651 2,651 001100 OFFICE OF POLICY & MANAGEMENT 702,177 589,283 749,002 758,383 757,405 -8,403
200
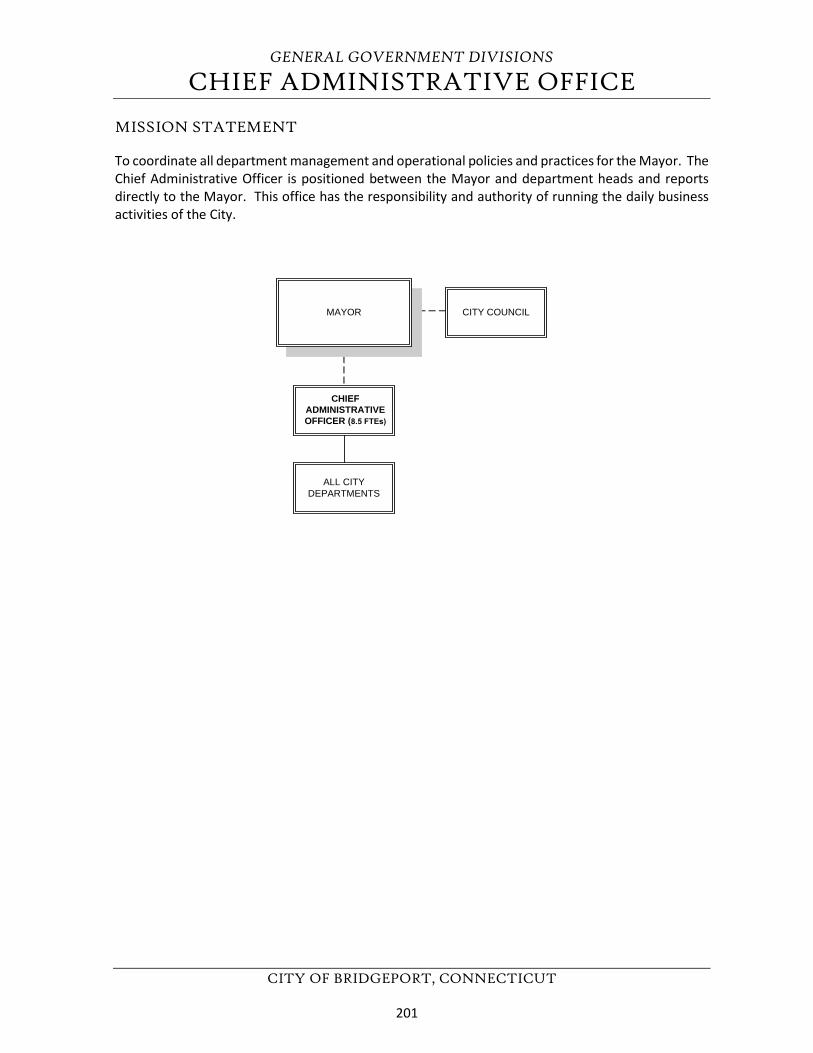
GENERAL GOVERNMENT DIVISIONS
CHIEF ADMINISTRATIVE OFFICE
CITY OF BRIDGEPORT, CONNECTICUT
MISSION STATEMENT
To coordinate all department management and operational policies and practices for the Mayor. The Chief Administrative Officer is positioned between the Mayor and department heads and reports directly to the Mayor. This office has the responsibility and authority of running the daily business activities of the City.
CHIEF ADMINISTRATIVE OFFICER (8.5 FTEs)
CITY COUNCILMAYOR
ALL CITYDEPARTMENTS
201
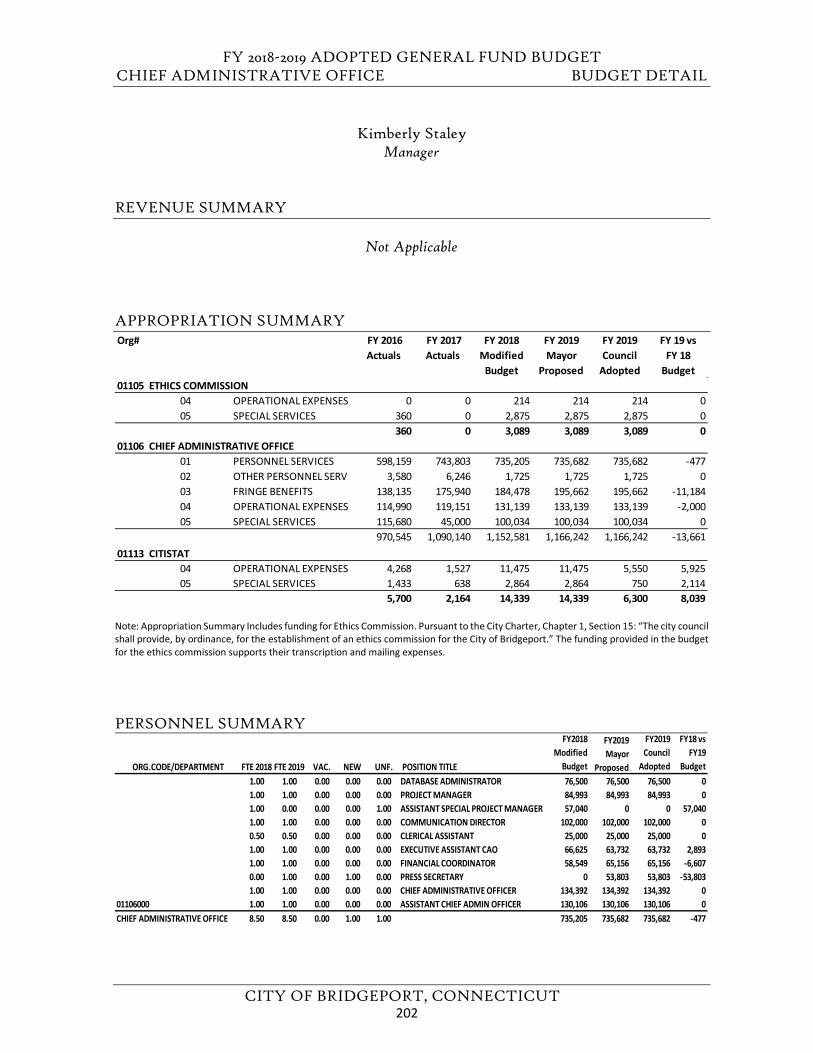
FY 2018-2019 ADOPTED GENERAL FUND BUDGET CHIEF ADMINISTRATIVE OFFICE BUDGET DETAIL
CITY OF BRIDGEPORT, CONNECTICUT
Kimberly Staley Manager
REVENUE SUMMARY
Not Applicable
APPROPRIATION SUMMARY
Note: Appropriation Summary Includes funding for Ethics Commission. Pursuant to the City Charter, Chapter 1, Section 15: “The city council shall provide, by ordinance, for the establishment of an ethics commission for the City of Bridgeport.” The funding provided in the budget for the ethics commission supports their transcription and mailing expenses.
PERSONNEL SUMMARY
Org# FY 2016 Actuals
FY 2017 Actuals
FY 2018 Modified
Budget
FY 2019 Mayor
Proposed
FY 2019 Council
Adopted
FY 19 vs FY 18
Budget01105 ETHICS COMMISSION
04 OPERATIONAL EXPENSES 0 0 214 214 214 005 SPECIAL SERVICES 360 0 2,875 2,875 2,875 0
360 0 3,089 3,089 3,089 001106 CHIEF ADMINISTRATIVE OFFICE
01 PERSONNEL SERVICES 598,159 743,803 735,205 735,682 735,682 -47702 OTHER PERSONNEL SERV 3,580 6,246 1,725 1,725 1,725 003 FRINGE BENEFITS 138,135 175,940 184,478 195,662 195,662 -11,18404 OPERATIONAL EXPENSES 114,990 119,151 131,139 133,139 133,139 -2,00005 SPECIAL SERVICES 115,680 45,000 100,034 100,034 100,034 0
970,545 1,090,140 1,152,581 1,166,242 1,166,242 -13,66101113 CITISTAT
04 OPERATIONAL EXPENSES 4,268 1,527 11,475 11,475 5,550 5,92505 SPECIAL SERVICES 1,433 638 2,864 2,864 750 2,114
5,700 2,164 14,339 14,339 6,300 8,039
ORG.CODE/DEPARTMENT FTE 2018 FTE 2019 VAC. NEW UNF. POSITION TITLE
FY2018 Modified
Budget
FY2019 Mayor
Proposed
FY2019 Council
Adopted
FY18 vs FY19
Budget 1.00 1.00 0.00 0.00 0.00 DATABASE ADMINISTRATOR 76,500 76,500 76,500 01.00 1.00 0.00 0.00 0.00 PROJECT MANAGER 84,993 84,993 84,993 01.00 0.00 0.00 0.00 1.00 ASSISTANT SPECIAL PROJECT MANAGER 57,040 0 0 57,0401.00 1.00 0.00 0.00 0.00 COMMUNICATION DIRECTOR 102,000 102,000 102,000 00.50 0.50 0.00 0.00 0.00 CLERICAL ASSISTANT 25,000 25,000 25,000 01.00 1.00 0.00 0.00 0.00 EXECUTIVE ASSISTANT CAO 66,625 63,732 63,732 2,8931.00 1.00 0.00 0.00 0.00 FINANCIAL COORDINATOR 58,549 65,156 65,156 -6,6070.00 1.00 0.00 1.00 0.00 PRESS SECRETARY 0 53,803 53,803 -53,8031.00 1.00 0.00 0.00 0.00 CHIEF ADMINISTRATIVE OFFICER 134,392 134,392 134,392 0
01106000 1.00 1.00 0.00 0.00 0.00 ASSISTANT CHIEF ADMIN OFFICER 130,106 130,106 130,106 0CHIEF ADMINISTRATIVE OFFICE 8.50 8.50 0.00 1.00 1.00 735,205 735,682 735,682 -477
202
FY 2018-2019 ADOPTED GENERAL FUND BUDGET CHIEF ADMINISTRATIVE OFFICE PROGRAM HIGHLIGHTS
CITY OF BRIDGEPORT, CONNECTICUT
FY 2018-2019 GOALS 1) Oversee all departmental management and operational policies and practices.2) Provide assistance to departments in identifying and complying with executive priorities,
goals, policies and procedures.3) Create and maintain continuity among municipal services and strategic planning, budgeting,
and capital project programs.4) Continue to implement a performance evaluation system to determine performance factors
and outcomes.
FY 2017-2018 GOAL STATUS 1) Oversee all departmental management and operational policies and practices.
6 MONTH STATUS: We continue to work to identify departmental performance metrics, toevaluate departments citywide to optimize practices, policies, and procedures.
2) Continue to implement a performance evaluation system to determine performance factorsand outcomes.6 MONTH STATUS: CAO’s office continues to work with various city departments, especiallythose with direct contact with the public, on digital data tracking, policy revision, internal workprocess procedures, job duty alignment and training.
3) Provide assistance to departments in identifying and complying with executive priorities,goals, policies and procedures.6 MONTH STATUS: We continue to evaluate, analyze, and provide quality control to optimizethe efficiency of services and functions provided by city departments.
4) Work with individuals, community groups, institutions, and agencies to ascertain concerns tobe addressed through administrative remedies.6 MONTH STATUS: Ongoing. We strive to cooperate with and support local businesses,agencies, and non-profit organizations to work together on common goals for the bettermentof the City of Bridgeport.
203
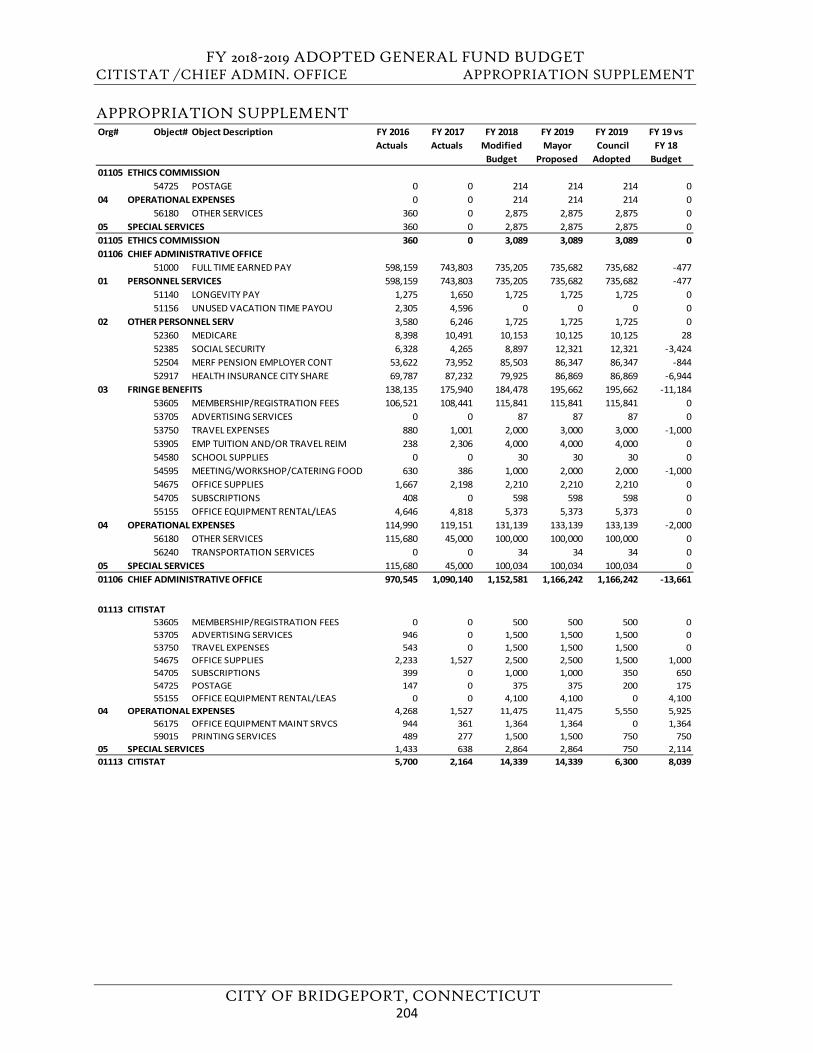
FY 2018-2019 ADOPTED GENERAL FUND BUDGET CITISTAT /CHIEF ADMIN. OFFICE APPROPRIATION SUPPLEMENT
CITY OF BRIDGEPORT, CONNECTICUT
APPROPRIATION SUPPLEMENT Org# Object# Object Description FY 2016
Actuals FY 2017 Actuals
FY 2018 Modified
Budget
FY 2019Mayor
Proposed
FY 2019 Council Adopted
FY 19 vs FY 18
Budget01105 ETHICS COMMISSION
54725 POSTAGE 0 0 214 214 214 004 OPERATIONAL EXPENSES 0 0 214 214 214 0
56180 OTHER SERVICES 360 0 2,875 2,875 2,875 005 SPECIAL SERVICES 360 0 2,875 2,875 2,875 001105 ETHICS COMMISSION 360 0 3,089 3,089 3,089 001106 CHIEF ADMINISTRATIVE OFFICE
51000 FULL TIME EARNED PAY 598,159 743,803 735,205 735,682 735,682 -47701 PERSONNEL SERVICES 598,159 743,803 735,205 735,682 735,682 -477
51140 LONGEVITY PAY 1,275 1,650 1,725 1,725 1,725 051156 UNUSED VACATION TIME PAYOU 2,305 4,596 0 0 0 0
02 OTHER PERSONNEL SERV 3,580 6,246 1,725 1,725 1,725 052360 MEDICARE 8,398 10,491 10,153 10,125 10,125 2852385 SOCIAL SECURITY 6,328 4,265 8,897 12,321 12,321 -3,42452504 MERF PENSION EMPLOYER CONT 53,622 73,952 85,503 86,347 86,347 -84452917 HEALTH INSURANCE CITY SHARE 69,787 87,232 79,925 86,869 86,869 -6,944
03 FRINGE BENEFITS 138,135 175,940 184,478 195,662 195,662 -11,18453605 MEMBERSHIP/REGISTRATION FEES 106,521 108,441 115,841 115,841 115,841 053705 ADVERTISING SERVICES 0 0 87 87 87 053750 TRAVEL EXPENSES 880 1,001 2,000 3,000 3,000 -1,00053905 EMP TUITION AND/OR TRAVEL REIM 238 2,306 4,000 4,000 4,000 054580 SCHOOL SUPPLIES 0 0 30 30 30 054595 MEETING/WORKSHOP/CATERING FOOD 630 386 1,000 2,000 2,000 -1,00054675 OFFICE SUPPLIES 1,667 2,198 2,210 2,210 2,210 054705 SUBSCRIPTIONS 408 0 598 598 598 055155 OFFICE EQUIPMENT RENTAL/LEAS 4,646 4,818 5,373 5,373 5,373 0
04 OPERATIONAL EXPENSES 114,990 119,151 131,139 133,139 133,139 -2,00056180 OTHER SERVICES 115,680 45,000 100,000 100,000 100,000 056240 TRANSPORTATION SERVICES 0 0 34 34 34 0
05 SPECIAL SERVICES 115,680 45,000 100,034 100,034 100,034 001106 CHIEF ADMINISTRATIVE OFFICE 970,545 1,090,140 1,152,581 1,166,242 1,166,242 -13,661
01113 CITISTAT53605 MEMBERSHIP/REGISTRATION FEES 0 0 500 500 500 053705 ADVERTISING SERVICES 946 0 1,500 1,500 1,500 053750 TRAVEL EXPENSES 543 0 1,500 1,500 1,500 054675 OFFICE SUPPLIES 2,233 1,527 2,500 2,500 1,500 1,00054705 SUBSCRIPTIONS 399 0 1,000 1,000 350 65054725 POSTAGE 147 0 375 375 200 17555155 OFFICE EQUIPMENT RENTAL/LEAS 0 0 4,100 4,100 0 4,100
04 OPERATIONAL EXPENSES 4,268 1,527 11,475 11,475 5,550 5,92556175 OFFICE EQUIPMENT MAINT SRVCS 944 361 1,364 1,364 0 1,36459015 PRINTING SERVICES 489 277 1,500 1,500 750 750
05 SPECIAL SERVICES 1,433 638 2,864 2,864 750 2,11401113 CITISTAT 5,700 2,164 14,339 14,339 6,300 8,039
204
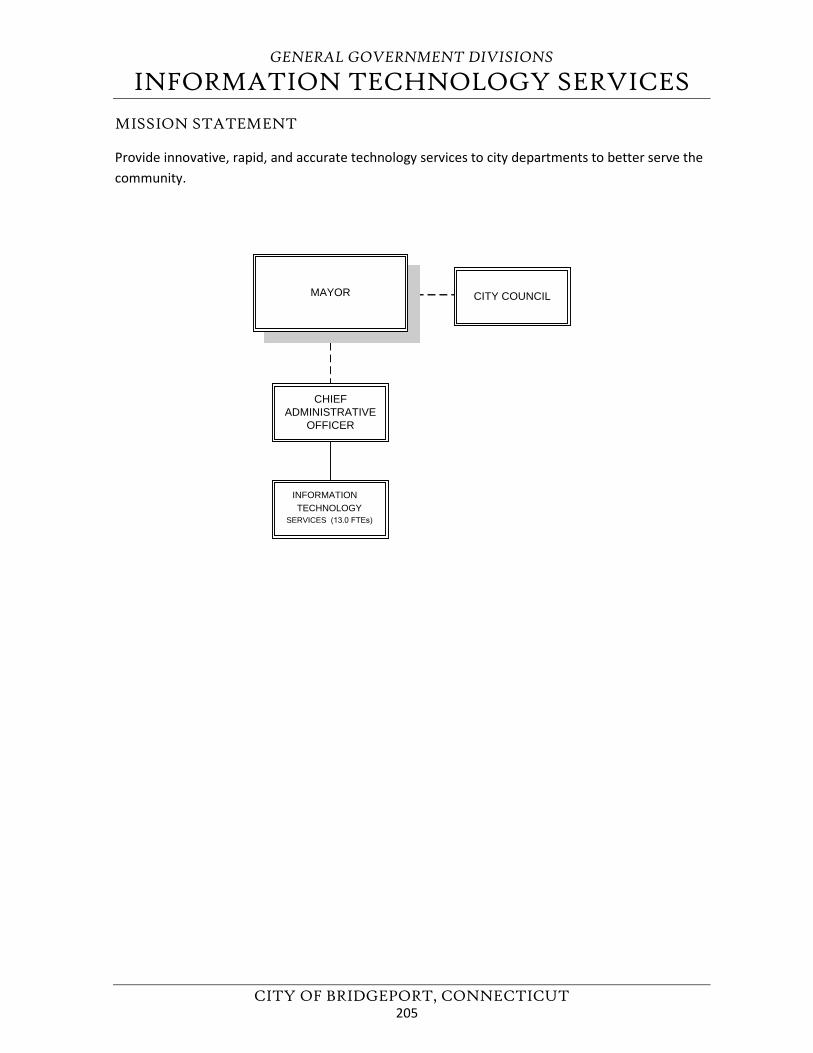
GENERAL GOVERNMENT DIVISIONS
INFORMATION TECHNOLOGY SERVICES
CITY OF BRIDGEPORT, CONNECTICUT
MISSION STATEMENT
Provide innovative, rapid, and accurate technology services to city departments to better serve the community.
CHIEFADMINISTRATIVE
OFFICER
INFORMATIONTECHNOLOGY
SERVICES (13.0 FTEs)
MAYOR CITY COUNCIL
205
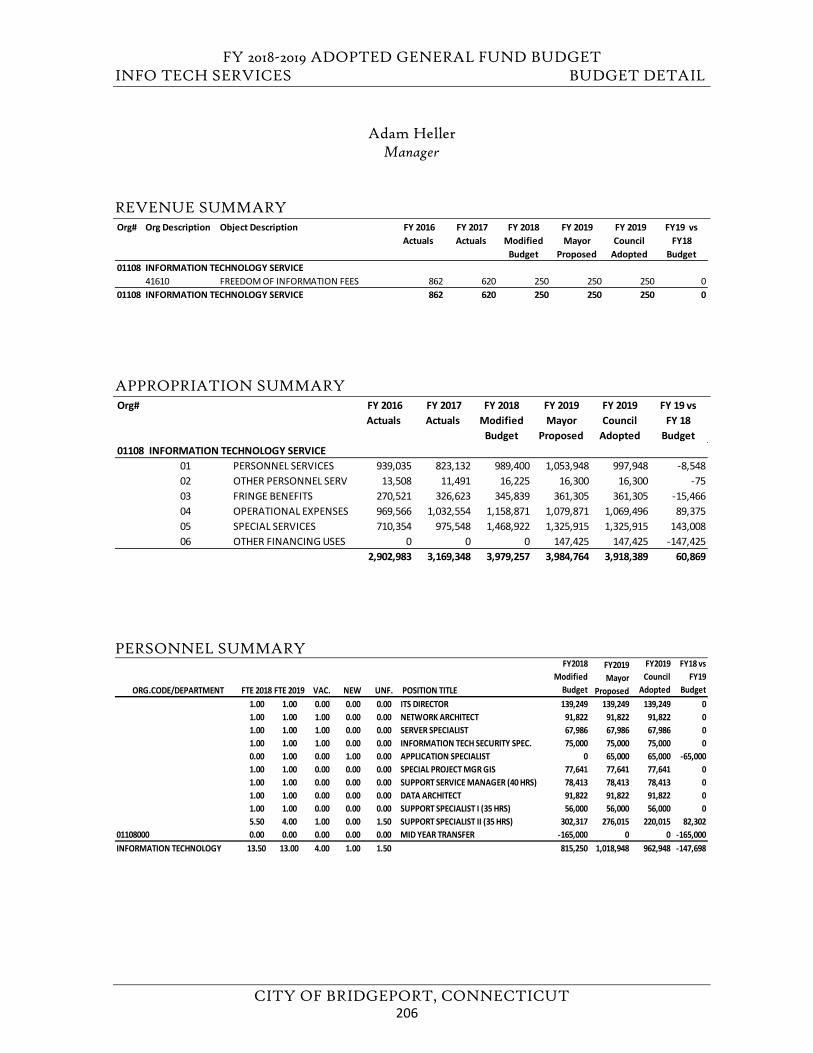
FY 2018-2019 ADOPTED GENERAL FUND BUDGET INFO TECH SERVICES BUDGET DETAIL
CITY OF BRIDGEPORT, CONNECTICUT
Adam Heller Manager
REVENUE SUMMARY
APPROPRIATION SUMMARY
PERSONNEL SUMMARY
Org# Org Description Object Description FY 2016 Actuals
FY 2017 Actuals
FY 2018 Modified
Budget
FY 2019 Mayor
Proposed
FY 2019 Council
Adopted
FY19 vs FY18
Budget01108 INFORMATION TECHNOLOGY SERVICE
41610 FREEDOM OF INFORMATION FEES 862 620 250 250 250 001108 INFORMATION TECHNOLOGY SERVICE 862 620 250 250 250 0
Org# FY 2016 Actuals
FY 2017 Actuals
FY 2018 Modified
Budget
FY 2019 Mayor
Proposed
FY 2019 Council
Adopted
FY 19 vs FY 18
Budget01108 INFORMATION TECHNOLOGY SERVICE
01 PERSONNEL SERVICES 939,035 823,132 989,400 1,053,948 997,948 -8,54802 OTHER PERSONNEL SERV 13,508 11,491 16,225 16,300 16,300 -7503 FRINGE BENEFITS 270,521 326,623 345,839 361,305 361,305 -15,46604 OPERATIONAL EXPENSES 969,566 1,032,554 1,158,871 1,079,871 1,069,496 89,37505 SPECIAL SERVICES 710,354 975,548 1,468,922 1,325,915 1,325,915 143,00806 OTHER FINANCING USES 0 0 0 147,425 147,425 -147,425
2,902,983 3,169,348 3,979,257 3,984,764 3,918,389 60,869
ORG.CODE/DEPARTMENT FTE 2018 FTE 2019 VAC. NEW UNF. POSITION TITLE
FY2018 Modified
Budget
FY2019 Mayor
Proposed
FY2019 Council
Adopted
FY18 vs FY19
Budget 1.00 1.00 0.00 0.00 0.00 ITS DIRECTOR 139,249 139,249 139,249 01.00 1.00 1.00 0.00 0.00 NETWORK ARCHITECT 91,822 91,822 91,822 01.00 1.00 1.00 0.00 0.00 SERVER SPECIALIST 67,986 67,986 67,986 01.00 1.00 1.00 0.00 0.00 INFORMATION TECH SECURITY SPEC. 75,000 75,000 75,000 00.00 1.00 0.00 1.00 0.00 APPLICATION SPECIALIST 0 65,000 65,000 -65,0001.00 1.00 0.00 0.00 0.00 SPECIAL PROJECT MGR GIS 77,641 77,641 77,641 01.00 1.00 0.00 0.00 0.00 SUPPORT SERVICE MANAGER (40 HRS) 78,413 78,413 78,413 01.00 1.00 0.00 0.00 0.00 DATA ARCHITECT 91,822 91,822 91,822 01.00 1.00 0.00 0.00 0.00 SUPPORT SPECIALIST I (35 HRS) 56,000 56,000 56,000 05.50 4.00 1.00 0.00 1.50 SUPPORT SPECIALIST II (35 HRS) 302,317 276,015 220,015 82,302
01108000 0.00 0.00 0.00 0.00 0.00 MID YEAR TRANSFER -165,000 0 0 -165,000INFORMATION TECHNOLOGY 13.50 13.00 4.00 1.00 1.50 815,250 1,018,948 962,948 -147,698
206
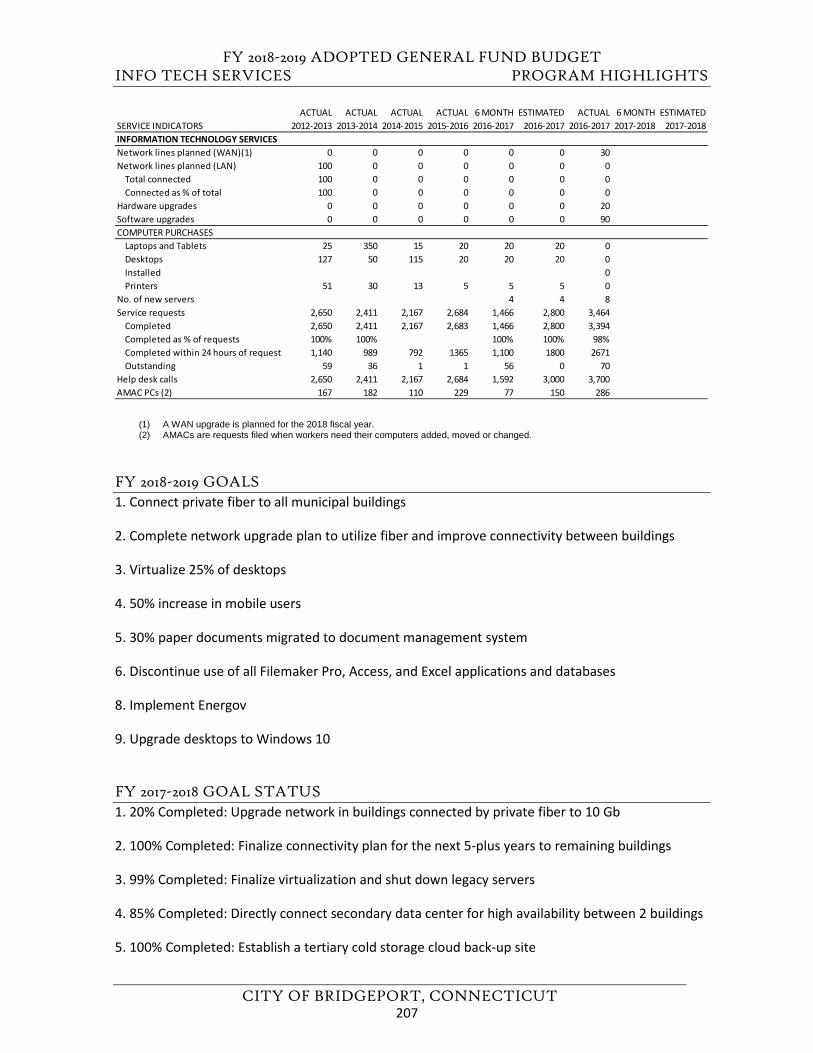
FY 2018-2019 ADOPTED GENERAL FUND BUDGET INFO TECH SERVICES PROGRAM HIGHLIGHTS
CITY OF BRIDGEPORT, CONNECTICUT
(1) A WAN upgrade is planned for the 2018 fiscal year.(2) AMACs are requests filed when workers need their computers added, moved or changed.
FY 2018-2019 GOALS 1. Connect private fiber to all municipal buildings
2. Complete network upgrade plan to utilize fiber and improve connectivity between buildings
3. Virtualize 25% of desktops
4. 50% increase in mobile users
5. 30% paper documents migrated to document management system
6. Discontinue use of all Filemaker Pro, Access, and Excel applications and databases
8. Implement Energov
9. Upgrade desktops to Windows 10
FY 2017-2018 GOAL STATUS 1. 20% Completed: Upgrade network in buildings connected by private fiber to 10 Gb
2. 100% Completed: Finalize connectivity plan for the next 5-plus years to remaining buildings
3. 99% Completed: Finalize virtualization and shut down legacy servers
4. 85% Completed: Directly connect secondary data center for high availability between 2 buildings
5. 100% Completed: Establish a tertiary cold storage cloud back-up site
ACTUAL ACTUAL ACTUAL ACTUAL 6 MONTH ESTIMATED ACTUAL 6 MONTH ESTIMATEDSERVICE INDICATORS 2012-2013 2013-2014 2014-2015 2015-2016 2016-2017 2016-2017 2016-2017 2017-2018 2017-2018INFORMATION TECHNOLOGY SERVICESNetwork lines planned (WAN)(1) 0 0 0 0 0 0 30Network lines planned (LAN) 100 0 0 0 0 0 0
Total connected 100 0 0 0 0 0 0Connected as % of total 100 0 0 0 0 0 0
Hardware upgrades 0 0 0 0 0 0 20Software upgrades 0 0 0 0 0 0 90COMPUTER PURCHASES
Laptops and Tablets 25 350 15 20 20 20 0Desktops 127 50 115 20 20 20 0Installed 0Printers 51 30 13 5 5 5 0
No. of new servers 4 4 8Service requests 2,650 2,411 2,167 2,684 1,466 2,800 3,464
Completed 2,650 2,411 2,167 2,683 1,466 2,800 3,394Completed as % of requests 100% 100% 100% 100% 98%Completed within 24 hours of request 1,140 989 792 1365 1,100 1800 2671Outstanding 59 36 1 1 56 0 70
Help desk calls 2,650 2,411 2,167 2,684 1,592 3,000 3,700AMAC PCs (2) 167 182 110 229 77 150 286
207
FY 2018-2019 ADOPTED GENERAL FUND BUDGET INFO TECH SERVICES PROGRAM HIGHLIGHTS
CITY OF BRIDGEPORT, CONNECTICUT
6. Postponed to 2019: Upgrade all desktops to Windows 10 from Windows 7
7. 100% Completed: Further integrate applications for seamless transfer of information betweenprograms
8. 100% Completed: Increase utilization of GIS and expand access to GIS
9. 100% Completed: Complete dispatch and RMS implementation
10. Postponed to 2019: Complete Energov implementation
11. 100% Completed: Implement perpetual VPN solution
12. 100% Completed: Continue to convert budget from capital to operating providing for moreflexibility to react to Mayoral initiatives and industry changes.
FY 2017 – 2018 ADDITIONAL ACCOMPLISHMENTS
1. Conducted city-wide fiber assessment and feasibility study
2. Upgraded financial system
3. Updated police technology
208
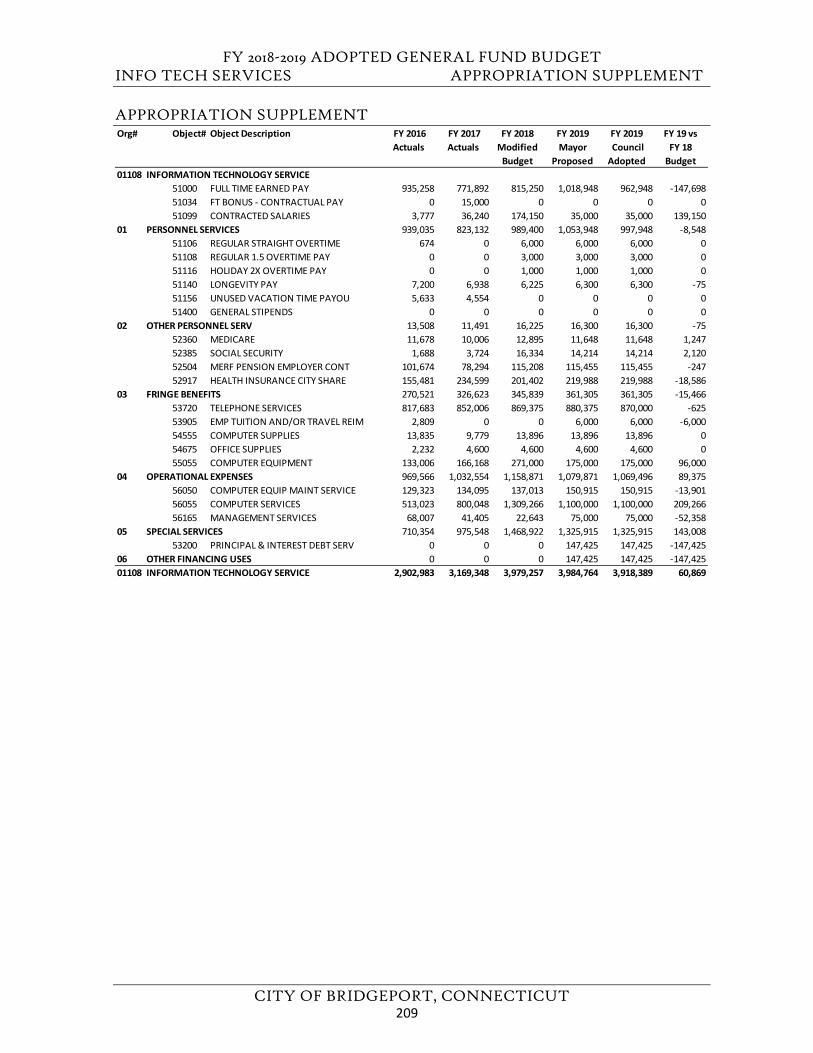
FY 2018-2019 ADOPTED GENERAL FUND BUDGET INFO TECH SERVICES APPROPRIATION SUPPLEMENT
CITY OF BRIDGEPORT, CONNECTICUT
APPROPRIATION SUPPLEMENT Org# Object# Object Description FY 2016
Actuals FY 2017 Actuals
FY 2018 Modified
Budget
FY 2019Mayor
Proposed
FY 2019 Council Adopted
FY 19 vs FY 18
Budget01108 INFORMATION TECHNOLOGY SERVICE
51000 FULL TIME EARNED PAY 935,258 771,892 815,250 1,018,948 962,948 -147,69851034 FT BONUS - CONTRACTUAL PAY 0 15,000 0 0 0 051099 CONTRACTED SALARIES 3,777 36,240 174,150 35,000 35,000 139,150
01 PERSONNEL SERVICES 939,035 823,132 989,400 1,053,948 997,948 -8,54851106 REGULAR STRAIGHT OVERTIME 674 0 6,000 6,000 6,000 051108 REGULAR 1.5 OVERTIME PAY 0 0 3,000 3,000 3,000 051116 HOLIDAY 2X OVERTIME PAY 0 0 1,000 1,000 1,000 051140 LONGEVITY PAY 7,200 6,938 6,225 6,300 6,300 -7551156 UNUSED VACATION TIME PAYOU 5,633 4,554 0 0 0 051400 GENERAL STIPENDS 0 0 0 0 0 0
02 OTHER PERSONNEL SERV 13,508 11,491 16,225 16,300 16,300 -7552360 MEDICARE 11,678 10,006 12,895 11,648 11,648 1,24752385 SOCIAL SECURITY 1,688 3,724 16,334 14,214 14,214 2,12052504 MERF PENSION EMPLOYER CONT 101,674 78,294 115,208 115,455 115,455 -24752917 HEALTH INSURANCE CITY SHARE 155,481 234,599 201,402 219,988 219,988 -18,586
03 FRINGE BENEFITS 270,521 326,623 345,839 361,305 361,305 -15,46653720 TELEPHONE SERVICES 817,683 852,006 869,375 880,375 870,000 -62553905 EMP TUITION AND/OR TRAVEL REIM 2,809 0 0 6,000 6,000 -6,00054555 COMPUTER SUPPLIES 13,835 9,779 13,896 13,896 13,896 054675 OFFICE SUPPLIES 2,232 4,600 4,600 4,600 4,600 055055 COMPUTER EQUIPMENT 133,006 166,168 271,000 175,000 175,000 96,000
04 OPERATIONAL EXPENSES 969,566 1,032,554 1,158,871 1,079,871 1,069,496 89,37556050 COMPUTER EQUIP MAINT SERVICE 129,323 134,095 137,013 150,915 150,915 -13,90156055 COMPUTER SERVICES 513,023 800,048 1,309,266 1,100,000 1,100,000 209,26656165 MANAGEMENT SERVICES 68,007 41,405 22,643 75,000 75,000 -52,358
05 SPECIAL SERVICES 710,354 975,548 1,468,922 1,325,915 1,325,915 143,00853200 PRINCIPAL & INTEREST DEBT SERV 0 0 0 147,425 147,425 -147,425
06 OTHER FINANCING USES 0 0 0 147,425 147,425 -147,42501108 INFORMATION TECHNOLOGY SERVICE 2,902,983 3,169,348 3,979,257 3,984,764 3,918,389 60,869
209

FY 2018-2019 ADOPTED GENERAL FUND BUDGET
CITY OF BRIDGEPORT, CONNECTICUT
This page left blank intentionally.
210
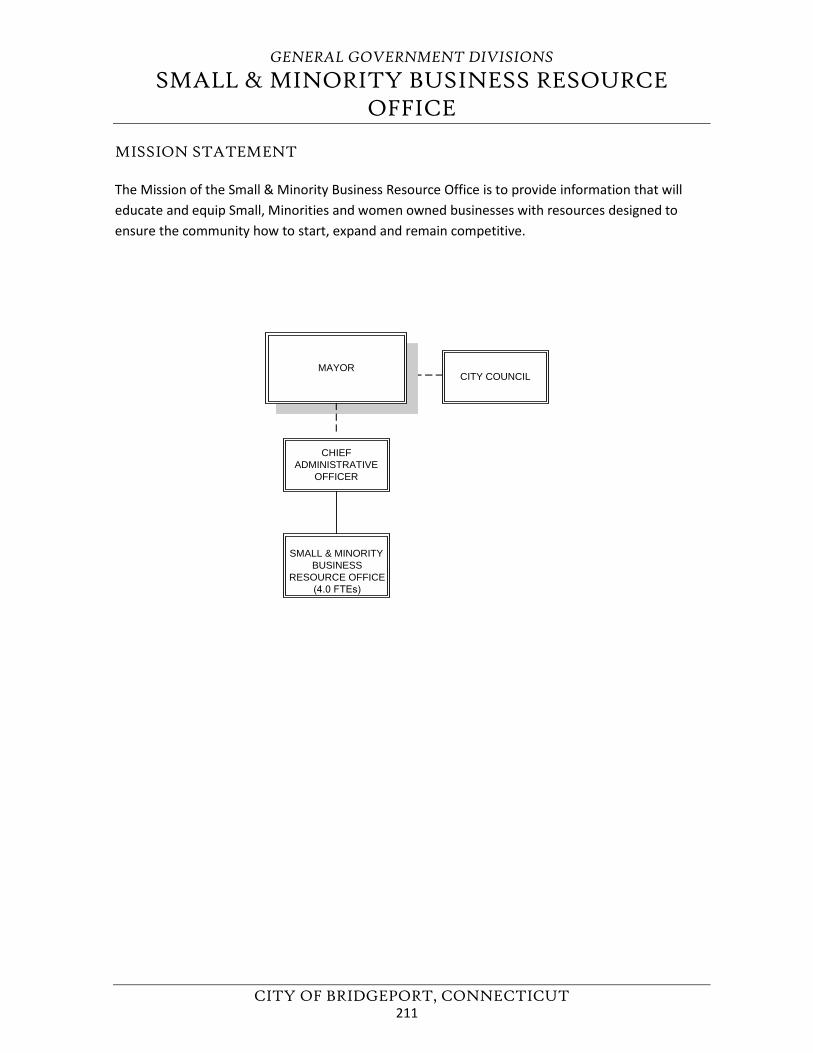
GENERAL GOVERNMENT DIVISIONS
SMALL & MINORITY BUSINESS RESOURCE OFFICE
CITY OF BRIDGEPORT, CONNECTICUT
MISSION STATEMENT
The Mission of the Small & Minority Business Resource Office is to provide information that will educate and equip Small, Minorities and women owned businesses with resources designed to ensure the community how to start, expand and remain competitive.
CHIEFADMINISTRATIVE
OFFICER
CITY COUNCIL
SMALL & MINORITY BUSINESS
RESOURCE OFFICE(4.0 FTEs)
MAYOR
211
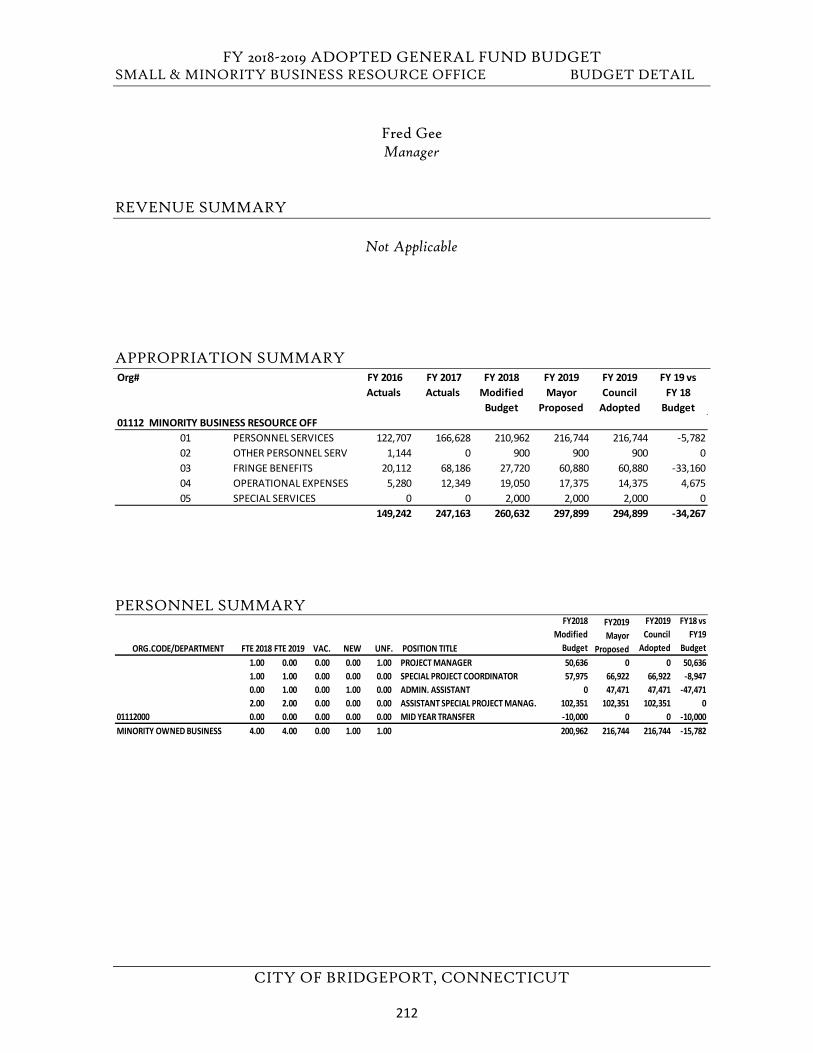
FY 2018-2019 ADOPTED GENERAL FUND BUDGET SMALL & MINORITY BUSINESS RESOURCE OFFICE BUDGET DETAIL
CITY OF BRIDGEPORT, CONNECTICUT
Fred Gee Manager
REVENUE SUMMARY
Not Applicable
APPROPRIATION SUMMARY
PERSONNEL SUMMARY
Org# FY 2016 Actuals
FY 2017 Actuals
FY 2018 Modified
Budget
FY 2019 Mayor
Proposed
FY 2019 Council
Adopted
FY 19 vs FY 18
Budget01112 MINORITY BUSINESS RESOURCE OFF
01 PERSONNEL SERVICES 122,707 166,628 210,962 216,744 216,744 -5,78202 OTHER PERSONNEL SERV 1,144 0 900 900 900 003 FRINGE BENEFITS 20,112 68,186 27,720 60,880 60,880 -33,16004 OPERATIONAL EXPENSES 5,280 12,349 19,050 17,375 14,375 4,67505 SPECIAL SERVICES 0 0 2,000 2,000 2,000 0
149,242 247,163 260,632 297,899 294,899 -34,267
ORG.CODE/DEPARTMENT FTE 2018 FTE 2019 VAC. NEW UNF. POSITION TITLE
FY2018 Modified
Budget
FY2019 Mayor
Proposed
FY2019 Council
Adopted
FY18 vs FY19
Budget 1.00 0.00 0.00 0.00 1.00 PROJECT MANAGER 50,636 0 0 50,6361.00 1.00 0.00 0.00 0.00 SPECIAL PROJECT COORDINATOR 57,975 66,922 66,922 -8,9470.00 1.00 0.00 1.00 0.00 ADMIN. ASSISTANT 0 47,471 47,471 -47,4712.00 2.00 0.00 0.00 0.00 ASSISTANT SPECIAL PROJECT MANAG. 102,351 102,351 102,351 0
01112000 0.00 0.00 0.00 0.00 0.00 MID YEAR TRANSFER -10,000 0 0 -10,000MINORITY OWNED BUSINESS 4.00 4.00 0.00 1.00 1.00 200,962 216,744 216,744 -15,782
212
FY 2018-2019 ADOPTED GENERAL FUND BUDGET SMALL & MINORITY BUSINESS RESOURCE OFFICE PROGRAM HIGHLIGHTS
CITY OF BRIDGEPORT, CONNECTICUT
FY 2018-2019 GOALS 1. Continue to work with and build relationships with municipalities and other organizations,groups and socially responsible civic leaders.
2. Execute the newly designed Bridgeport Bonding Institute. Assisting Contractors with theirBonding needs.
3. Hosting networking events for Bridgeport Based Small Businesses trainings/certifications
4. Engage Downtown Merchants developing methods to increase traffic to the DowntownBusinesses.
5. Increase our Hispanic populations participation on City of Bridgeport projects.
FY 2017 – 2018 GOAL STATUS: 1. Resourced out $280,000.00 in Micro loans for Bridgeport Based Businesses.
2. Hosted 11 Business Essentials 101.
3. Identified new lenders in the region Key Bank, Community Economic Development Fund, IFGConstruction Funding
4. Implemented obtainable Bonding Program to assist MBE’s.
FY 2017 – 2018 ADDITIONAL ACCOMPLISHMENT: 1. Partnered with Economic Development to host the 1st annual Holiday Pop up Market.
213
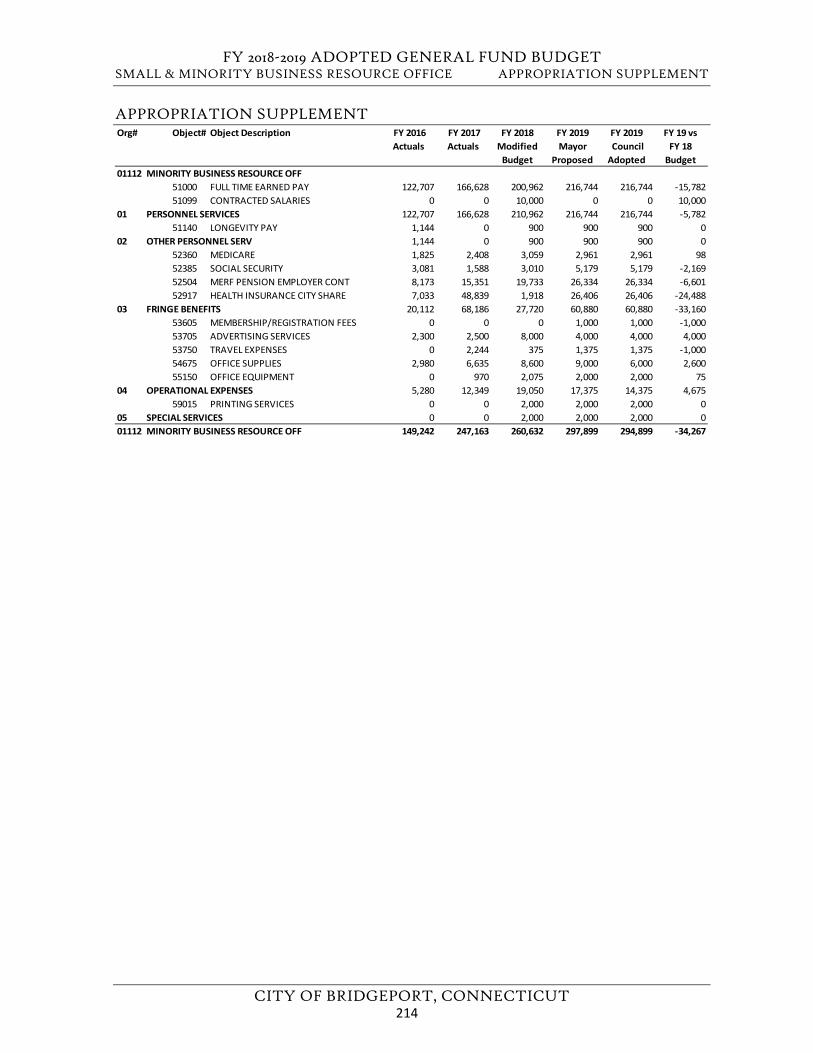
FY 2018-2019 ADOPTED GENERAL FUND BUDGET SMALL & MINORITY BUSINESS RESOURCE OFFICE APPROPRIATION SUPPLEMENT
CITY OF BRIDGEPORT, CONNECTICUT
APPROPRIATION SUPPLEMENT Org# Object# Object Description FY 2016
Actuals FY 2017 Actuals
FY 2018 Modified
Budget
FY 2019Mayor
Proposed
FY 2019 Council Adopted
FY 19 vs FY 18
Budget01112 MINORITY BUSINESS RESOURCE OFF
51000 FULL TIME EARNED PAY 122,707 166,628 200,962 216,744 216,744 -15,78251099 CONTRACTED SALARIES 0 0 10,000 0 0 10,000
01 PERSONNEL SERVICES 122,707 166,628 210,962 216,744 216,744 -5,78251140 LONGEVITY PAY 1,144 0 900 900 900 0
02 OTHER PERSONNEL SERV 1,144 0 900 900 900 052360 MEDICARE 1,825 2,408 3,059 2,961 2,961 9852385 SOCIAL SECURITY 3,081 1,588 3,010 5,179 5,179 -2,16952504 MERF PENSION EMPLOYER CONT 8,173 15,351 19,733 26,334 26,334 -6,60152917 HEALTH INSURANCE CITY SHARE 7,033 48,839 1,918 26,406 26,406 -24,488
03 FRINGE BENEFITS 20,112 68,186 27,720 60,880 60,880 -33,16053605 MEMBERSHIP/REGISTRATION FEES 0 0 0 1,000 1,000 -1,00053705 ADVERTISING SERVICES 2,300 2,500 8,000 4,000 4,000 4,00053750 TRAVEL EXPENSES 0 2,244 375 1,375 1,375 -1,00054675 OFFICE SUPPLIES 2,980 6,635 8,600 9,000 6,000 2,60055150 OFFICE EQUIPMENT 0 970 2,075 2,000 2,000 75
04 OPERATIONAL EXPENSES 5,280 12,349 19,050 17,375 14,375 4,67559015 PRINTING SERVICES 0 0 2,000 2,000 2,000 0
05 SPECIAL SERVICES 0 0 2,000 2,000 2,000 001112 MINORITY BUSINESS RESOURCE OFF 149,242 247,163 260,632 297,899 294,899 -34,267
214
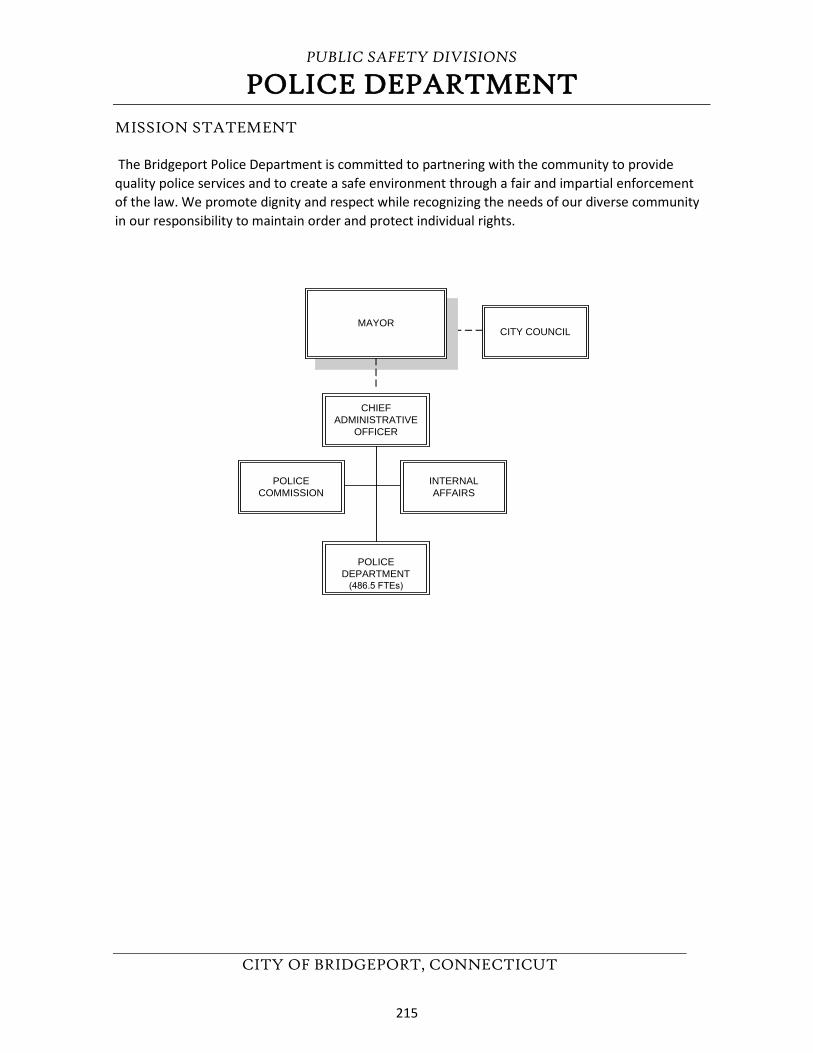
PUBLIC SAFETY DIVISIONS
POLICE DEPARTMENT
CITY OF BRIDGEPORT, CONNECTICUT
MISSION STATEMENT
The Bridgeport Police Department is committed to partnering with the community to provide quality police services and to create a safe environment through a fair and impartial enforcement of the law. We promote dignity and respect while recognizing the needs of our diverse community in our responsibility to maintain order and protect individual rights.
CHIEFADMINISTRATIVE
OFFICER
CITY COUNCIL
POLICEDEPARTMENT
(486.5 FTEs)
MAYOR
INTERNALAFFAIRS
POLICECOMMISSION
215
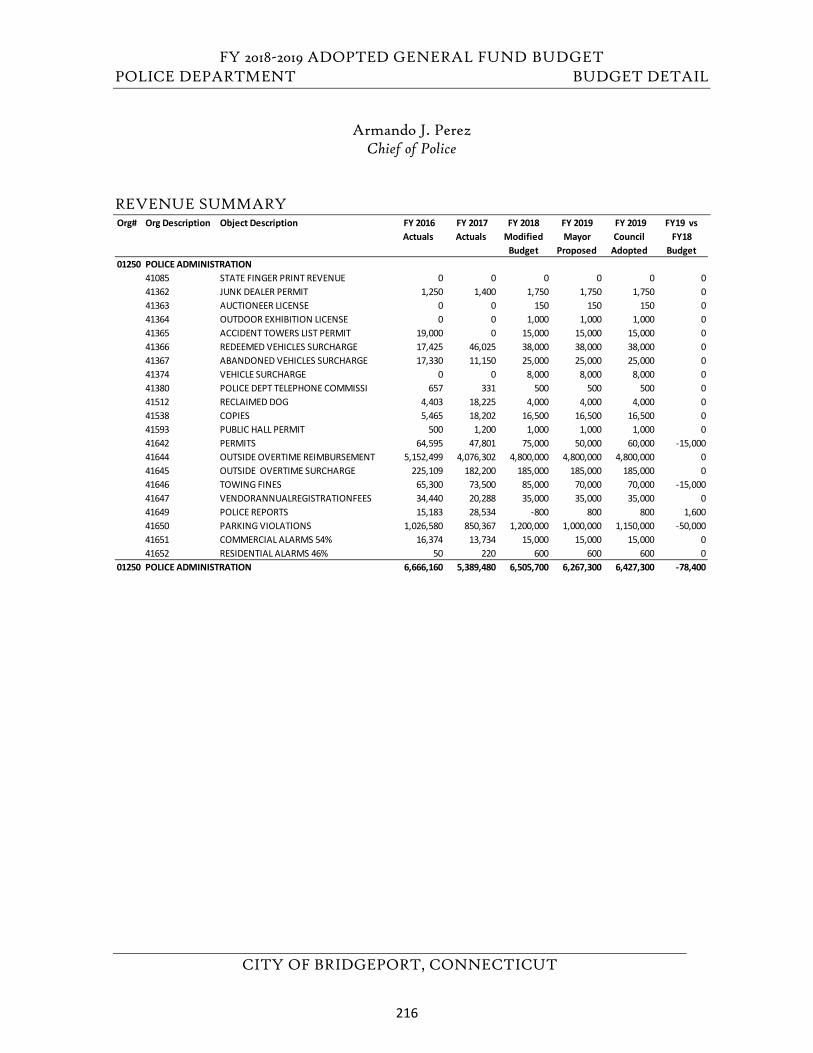
FY 2018-2019 ADOPTED GENERAL FUND BUDGET POLICE DEPARTMENT BUDGET DETAIL
CITY OF BRIDGEPORT, CONNECTICUT
Armando J. Perez Chief of Police
REVENUE SUMMARY Org# Org Description Object Description FY 2016
Actuals FY 2017 Actuals
FY 2018 Modified
Budget
FY 2019 Mayor
Proposed
FY 2019 Council
Adopted
FY19 vs FY18
Budget01250 POLICE ADMINISTRATION
41085 STATE FINGER PRINT REVENUE 0 0 0 0 0 041362 JUNK DEALER PERMIT 1,250 1,400 1,750 1,750 1,750 041363 AUCTIONEER LICENSE 0 0 150 150 150 041364 OUTDOOR EXHIBITION LICENSE 0 0 1,000 1,000 1,000 041365 ACCIDENT TOWERS LIST PERMIT 19,000 0 15,000 15,000 15,000 041366 REDEEMED VEHICLES SURCHARGE 17,425 46,025 38,000 38,000 38,000 041367 ABANDONED VEHICLES SURCHARGE 17,330 11,150 25,000 25,000 25,000 041374 VEHICLE SURCHARGE 0 0 8,000 8,000 8,000 041380 POLICE DEPT TELEPHONE COMMISSI 657 331 500 500 500 041512 RECLAIMED DOG 4,403 18,225 4,000 4,000 4,000 041538 COPIES 5,465 18,202 16,500 16,500 16,500 041593 PUBLIC HALL PERMIT 500 1,200 1,000 1,000 1,000 041642 PERMITS 64,595 47,801 75,000 50,000 60,000 -15,00041644 OUTSIDE OVERTIME REIMBURSEMENT 5,152,499 4,076,302 4,800,000 4,800,000 4,800,000 041645 OUTSIDE OVERTIME SURCHARGE 225,109 182,200 185,000 185,000 185,000 041646 TOWING FINES 65,300 73,500 85,000 70,000 70,000 -15,00041647 VENDORANNUALREGISTRATIONFEES 34,440 20,288 35,000 35,000 35,000 041649 POLICE REPORTS 15,183 28,534 -800 800 800 1,60041650 PARKING VIOLATIONS 1,026,580 850,367 1,200,000 1,000,000 1,150,000 -50,00041651 COMMERCIAL ALARMS 54% 16,374 13,734 15,000 15,000 15,000 041652 RESIDENTIAL ALARMS 46% 50 220 600 600 600 0
01250 POLICE ADMINISTRATION 6,666,160 5,389,480 6,505,700 6,267,300 6,427,300 -78,400
216
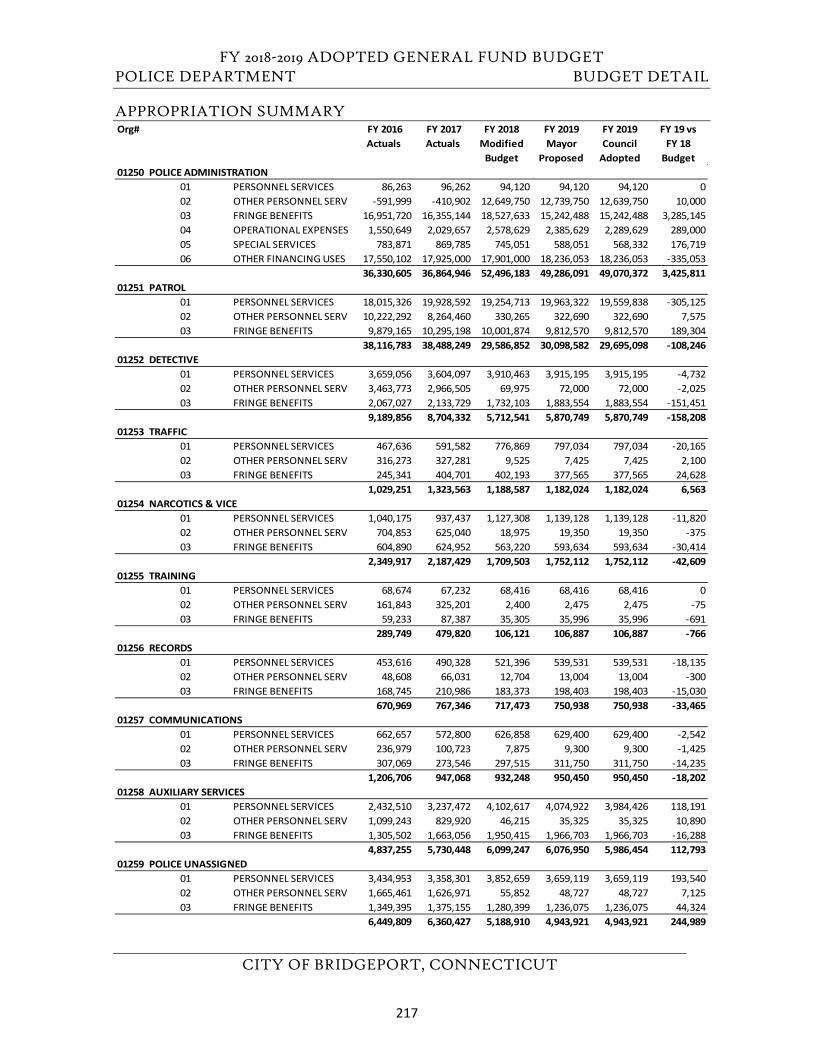
FY 2018-2019 ADOPTED GENERAL FUND BUDGET POLICE DEPARTMENT BUDGET DETAIL
CITY OF BRIDGEPORT, CONNECTICUT
APPROPRIATION SUMMARY Org# FY 2016
Actuals FY 2017 Actuals
FY 2018 Modified
Budget
FY 2019 Mayor
Proposed
FY 2019 Council
Adopted
FY 19 vs FY 18
Budget01250 POLICE ADMINISTRATION
01 PERSONNEL SERVICES 86,263 96,262 94,120 94,120 94,120 002 OTHER PERSONNEL SERV -591,999 -410,902 12,649,750 12,739,750 12,639,750 10,00003 FRINGE BENEFITS 16,951,720 16,355,144 18,527,633 15,242,488 15,242,488 3,285,14504 OPERATIONAL EXPENSES 1,550,649 2,029,657 2,578,629 2,385,629 2,289,629 289,00005 SPECIAL SERVICES 783,871 869,785 745,051 588,051 568,332 176,71906 OTHER FINANCING USES 17,550,102 17,925,000 17,901,000 18,236,053 18,236,053 -335,053
36,330,605 36,864,946 52,496,183 49,286,091 49,070,372 3,425,81101251 PATROL
01 PERSONNEL SERVICES 18,015,326 19,928,592 19,254,713 19,963,322 19,559,838 -305,12502 OTHER PERSONNEL SERV 10,222,292 8,264,460 330,265 322,690 322,690 7,57503 FRINGE BENEFITS 9,879,165 10,295,198 10,001,874 9,812,570 9,812,570 189,304
38,116,783 38,488,249 29,586,852 30,098,582 29,695,098 -108,24601252 DETECTIVE
01 PERSONNEL SERVICES 3,659,056 3,604,097 3,910,463 3,915,195 3,915,195 -4,73202 OTHER PERSONNEL SERV 3,463,773 2,966,505 69,975 72,000 72,000 -2,02503 FRINGE BENEFITS 2,067,027 2,133,729 1,732,103 1,883,554 1,883,554 -151,451
9,189,856 8,704,332 5,712,541 5,870,749 5,870,749 -158,20801253 TRAFFIC
01 PERSONNEL SERVICES 467,636 591,582 776,869 797,034 797,034 -20,16502 OTHER PERSONNEL SERV 316,273 327,281 9,525 7,425 7,425 2,10003 FRINGE BENEFITS 245,341 404,701 402,193 377,565 377,565 24,628
1,029,251 1,323,563 1,188,587 1,182,024 1,182,024 6,56301254 NARCOTICS & VICE
01 PERSONNEL SERVICES 1,040,175 937,437 1,127,308 1,139,128 1,139,128 -11,82002 OTHER PERSONNEL SERV 704,853 625,040 18,975 19,350 19,350 -37503 FRINGE BENEFITS 604,890 624,952 563,220 593,634 593,634 -30,414
2,349,917 2,187,429 1,709,503 1,752,112 1,752,112 -42,60901255 TRAINING
01 PERSONNEL SERVICES 68,674 67,232 68,416 68,416 68,416 002 OTHER PERSONNEL SERV 161,843 325,201 2,400 2,475 2,475 -7503 FRINGE BENEFITS 59,233 87,387 35,305 35,996 35,996 -691
289,749 479,820 106,121 106,887 106,887 -76601256 RECORDS
01 PERSONNEL SERVICES 453,616 490,328 521,396 539,531 539,531 -18,13502 OTHER PERSONNEL SERV 48,608 66,031 12,704 13,004 13,004 -30003 FRINGE BENEFITS 168,745 210,986 183,373 198,403 198,403 -15,030
670,969 767,346 717,473 750,938 750,938 -33,46501257 COMMUNICATIONS
01 PERSONNEL SERVICES 662,657 572,800 626,858 629,400 629,400 -2,54202 OTHER PERSONNEL SERV 236,979 100,723 7,875 9,300 9,300 -1,42503 FRINGE BENEFITS 307,069 273,546 297,515 311,750 311,750 -14,235
1,206,706 947,068 932,248 950,450 950,450 -18,20201258 AUXILIARY SERVICES
01 PERSONNEL SERVICES 2,432,510 3,237,472 4,102,617 4,074,922 3,984,426 118,19102 OTHER PERSONNEL SERV 1,099,243 829,920 46,215 35,325 35,325 10,89003 FRINGE BENEFITS 1,305,502 1,663,056 1,950,415 1,966,703 1,966,703 -16,288
4,837,255 5,730,448 6,099,247 6,076,950 5,986,454 112,79301259 POLICE UNASSIGNED
01 PERSONNEL SERVICES 3,434,953 3,358,301 3,852,659 3,659,119 3,659,119 193,54002 OTHER PERSONNEL SERV 1,665,461 1,626,971 55,852 48,727 48,727 7,12503 FRINGE BENEFITS 1,349,395 1,375,155 1,280,399 1,236,075 1,236,075 44,324
6,449,809 6,360,427 5,188,910 4,943,921 4,943,921 244,989
217
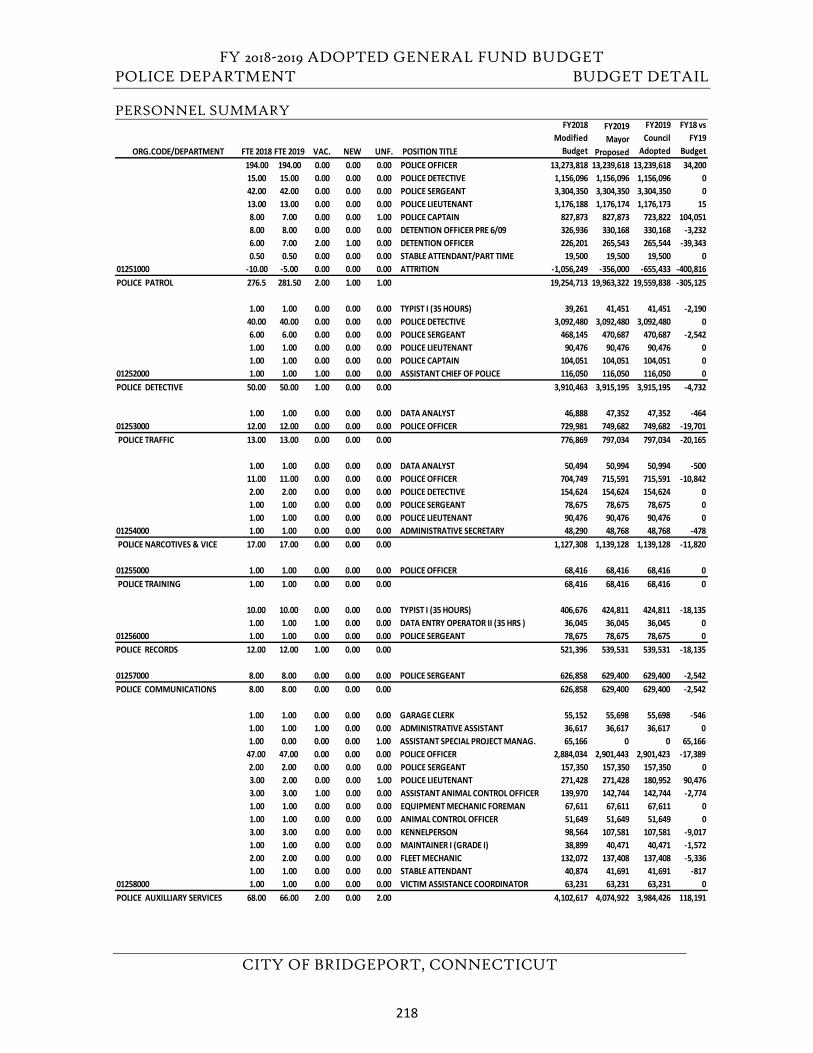
FY 2018-2019 ADOPTED GENERAL FUND BUDGET POLICE DEPARTMENT BUDGET DETAIL
CITY OF BRIDGEPORT, CONNECTICUT
PERSONNEL SUMMARY
ORG.CODE/DEPARTMENT FTE 2018 FTE 2019 VAC. NEW UNF. POSITION TITLE
FY2018 Modified
Budget
FY2019 Mayor
Proposed
FY2019 Council
Adopted
FY18 vs FY19
Budget 194.00 194.00 0.00 0.00 0.00 POLICE OFFICER 13,273,818 13,239,618 13,239,618 34,20015.00 15.00 0.00 0.00 0.00 POLICE DETECTIVE 1,156,096 1,156,096 1,156,096 042.00 42.00 0.00 0.00 0.00 POLICE SERGEANT 3,304,350 3,304,350 3,304,350 013.00 13.00 0.00 0.00 0.00 POLICE LIEUTENANT 1,176,188 1,176,174 1,176,173 158.00 7.00 0.00 0.00 1.00 POLICE CAPTAIN 827,873 827,873 723,822 104,0518.00 8.00 0.00 0.00 0.00 DETENTION OFFICER PRE 6/09 326,936 330,168 330,168 -3,2326.00 7.00 2.00 1.00 0.00 DETENTION OFFICER 226,201 265,543 265,544 -39,3430.50 0.50 0.00 0.00 0.00 STABLE ATTENDANT/PART TIME 19,500 19,500 19,500 0
01251000 -10.00 -5.00 0.00 0.00 0.00 ATTRITION -1,056,249 -356,000 -655,433 -400,816POLICE PATROL 276.5 281.50 2.00 1.00 1.00 19,254,713 19,963,322 19,559,838 -305,125
1.00 1.00 0.00 0.00 0.00 TYPIST I (35 HOURS) 39,261 41,451 41,451 -2,19040.00 40.00 0.00 0.00 0.00 POLICE DETECTIVE 3,092,480 3,092,480 3,092,480 06.00 6.00 0.00 0.00 0.00 POLICE SERGEANT 468,145 470,687 470,687 -2,5421.00 1.00 0.00 0.00 0.00 POLICE LIEUTENANT 90,476 90,476 90,476 01.00 1.00 0.00 0.00 0.00 POLICE CAPTAIN 104,051 104,051 104,051 0
01252000 1.00 1.00 1.00 0.00 0.00 ASSISTANT CHIEF OF POLICE 116,050 116,050 116,050 0POLICE DETECTIVE 50.00 50.00 1.00 0.00 0.00 3,910,463 3,915,195 3,915,195 -4,732
1.00 1.00 0.00 0.00 0.00 DATA ANALYST 46,888 47,352 47,352 -46401253000 12.00 12.00 0.00 0.00 0.00 POLICE OFFICER 729,981 749,682 749,682 -19,701 POLICE TRAFFIC 13.00 13.00 0.00 0.00 0.00 776,869 797,034 797,034 -20,165
1.00 1.00 0.00 0.00 0.00 DATA ANALYST 50,494 50,994 50,994 -50011.00 11.00 0.00 0.00 0.00 POLICE OFFICER 704,749 715,591 715,591 -10,8422.00 2.00 0.00 0.00 0.00 POLICE DETECTIVE 154,624 154,624 154,624 01.00 1.00 0.00 0.00 0.00 POLICE SERGEANT 78,675 78,675 78,675 01.00 1.00 0.00 0.00 0.00 POLICE LIEUTENANT 90,476 90,476 90,476 0
01254000 1.00 1.00 0.00 0.00 0.00 ADMINISTRATIVE SECRETARY 48,290 48,768 48,768 -478 POLICE NARCOTIVES & VICE 17.00 17.00 0.00 0.00 0.00 1,127,308 1,139,128 1,139,128 -11,820
01255000 1.00 1.00 0.00 0.00 0.00 POLICE OFFICER 68,416 68,416 68,416 0 POLICE TRAINING 1.00 1.00 0.00 0.00 0.00 68,416 68,416 68,416 0
10.00 10.00 0.00 0.00 0.00 TYPIST I (35 HOURS) 406,676 424,811 424,811 -18,1351.00 1.00 1.00 0.00 0.00 DATA ENTRY OPERATOR II (35 HRS ) 36,045 36,045 36,045 0
01256000 1.00 1.00 0.00 0.00 0.00 POLICE SERGEANT 78,675 78,675 78,675 0POLICE RECORDS 12.00 12.00 1.00 0.00 0.00 521,396 539,531 539,531 -18,135
01257000 8.00 8.00 0.00 0.00 0.00 POLICE SERGEANT 626,858 629,400 629,400 -2,542POLICE COMMUNICATIONS 8.00 8.00 0.00 0.00 0.00 626,858 629,400 629,400 -2,542
1.00 1.00 0.00 0.00 0.00 GARAGE CLERK 55,152 55,698 55,698 -5461.00 1.00 1.00 0.00 0.00 ADMINISTRATIVE ASSISTANT 36,617 36,617 36,617 01.00 0.00 0.00 0.00 1.00 ASSISTANT SPECIAL PROJECT MANAG. 65,166 0 0 65,166
47.00 47.00 0.00 0.00 0.00 POLICE OFFICER 2,884,034 2,901,443 2,901,423 -17,3892.00 2.00 0.00 0.00 0.00 POLICE SERGEANT 157,350 157,350 157,350 03.00 2.00 0.00 0.00 1.00 POLICE LIEUTENANT 271,428 271,428 180,952 90,4763.00 3.00 1.00 0.00 0.00 ASSISTANT ANIMAL CONTROL OFFICER 139,970 142,744 142,744 -2,7741.00 1.00 0.00 0.00 0.00 EQUIPMENT MECHANIC FOREMAN 67,611 67,611 67,611 01.00 1.00 0.00 0.00 0.00 ANIMAL CONTROL OFFICER 51,649 51,649 51,649 03.00 3.00 0.00 0.00 0.00 KENNELPERSON 98,564 107,581 107,581 -9,0171.00 1.00 0.00 0.00 0.00 MAINTAINER I (GRADE I) 38,899 40,471 40,471 -1,5722.00 2.00 0.00 0.00 0.00 FLEET MECHANIC 132,072 137,408 137,408 -5,3361.00 1.00 0.00 0.00 0.00 STABLE ATTENDANT 40,874 41,691 41,691 -817
01258000 1.00 1.00 0.00 0.00 0.00 VICTIM ASSISTANCE COORDINATOR 63,231 63,231 63,231 0POLICE AUXILLIARY SERVICES 68.00 66.00 2.00 0.00 2.00 4,102,617 4,074,922 3,984,426 118,191
218
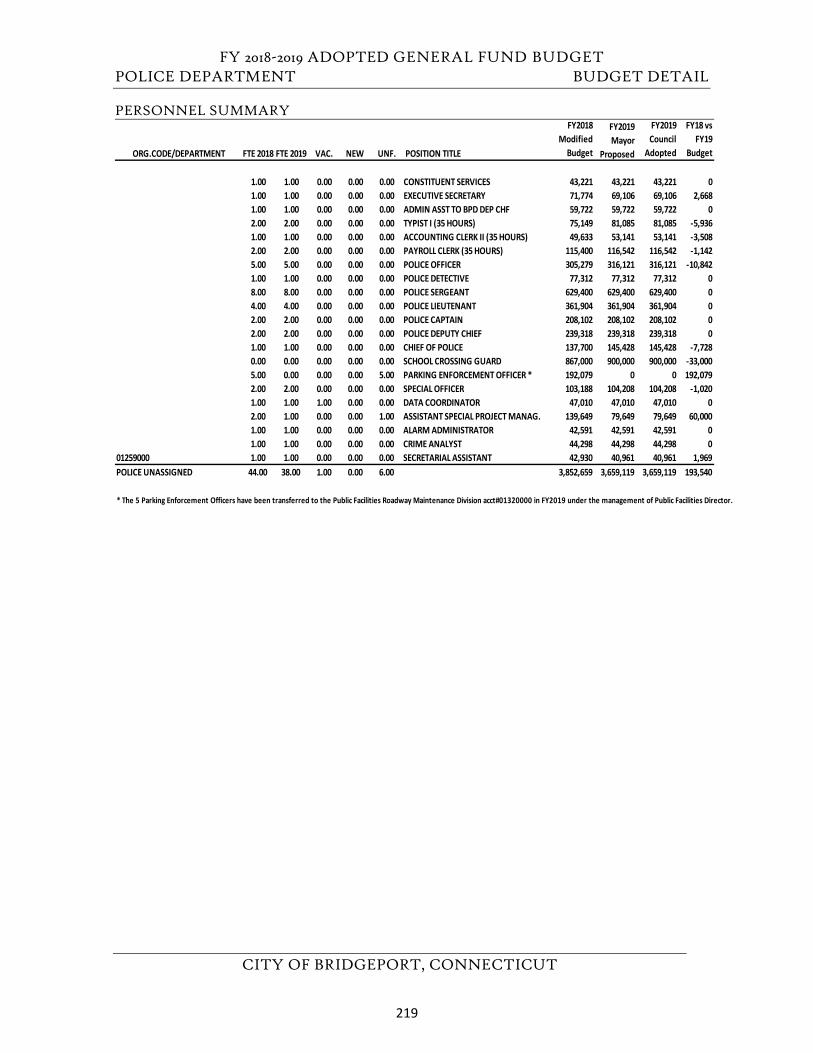
FY 2018-2019 ADOPTED GENERAL FUND BUDGET POLICE DEPARTMENT BUDGET DETAIL
CITY OF BRIDGEPORT, CONNECTICUT
PERSONNEL SUMMARY
ORG.CODE/DEPARTMENT FTE 2018 FTE 2019 VAC. NEW UNF. POSITION TITLE
FY2018 Modified
Budget
FY2019 Mayor
Proposed
FY2019 Council
Adopted
FY18 vs FY19
Budget
1.00 1.00 0.00 0.00 0.00 CONSTITUENT SERVICES 43,221 43,221 43,221 01.00 1.00 0.00 0.00 0.00 EXECUTIVE SECRETARY 71,774 69,106 69,106 2,6681.00 1.00 0.00 0.00 0.00 ADMIN ASST TO BPD DEP CHF 59,722 59,722 59,722 02.00 2.00 0.00 0.00 0.00 TYPIST I (35 HOURS) 75,149 81,085 81,085 -5,9361.00 1.00 0.00 0.00 0.00 ACCOUNTING CLERK II (35 HOURS) 49,633 53,141 53,141 -3,5082.00 2.00 0.00 0.00 0.00 PAYROLL CLERK (35 HOURS) 115,400 116,542 116,542 -1,1425.00 5.00 0.00 0.00 0.00 POLICE OFFICER 305,279 316,121 316,121 -10,8421.00 1.00 0.00 0.00 0.00 POLICE DETECTIVE 77,312 77,312 77,312 08.00 8.00 0.00 0.00 0.00 POLICE SERGEANT 629,400 629,400 629,400 04.00 4.00 0.00 0.00 0.00 POLICE LIEUTENANT 361,904 361,904 361,904 02.00 2.00 0.00 0.00 0.00 POLICE CAPTAIN 208,102 208,102 208,102 02.00 2.00 0.00 0.00 0.00 POLICE DEPUTY CHIEF 239,318 239,318 239,318 01.00 1.00 0.00 0.00 0.00 CHIEF OF POLICE 137,700 145,428 145,428 -7,7280.00 0.00 0.00 0.00 0.00 SCHOOL CROSSING GUARD 867,000 900,000 900,000 -33,0005.00 0.00 0.00 0.00 5.00 PARKING ENFORCEMENT OFFICER * 192,079 0 0 192,0792.00 2.00 0.00 0.00 0.00 SPECIAL OFFICER 103,188 104,208 104,208 -1,0201.00 1.00 1.00 0.00 0.00 DATA COORDINATOR 47,010 47,010 47,010 02.00 1.00 0.00 0.00 1.00 ASSISTANT SPECIAL PROJECT MANAG. 139,649 79,649 79,649 60,0001.00 1.00 0.00 0.00 0.00 ALARM ADMINISTRATOR 42,591 42,591 42,591 01.00 1.00 0.00 0.00 0.00 CRIME ANALYST 44,298 44,298 44,298 0
01259000 1.00 1.00 0.00 0.00 0.00 SECRETARIAL ASSISTANT 42,930 40,961 40,961 1,969POLICE UNASSIGNED 44.00 38.00 1.00 0.00 6.00 3,852,659 3,659,119 3,659,119 193,540
* The 5 Parking Enforcement Officers have been transferred to the Public Facilities Roadway Maintenance Division acct#01320000 in FY2019 under the management of Public Facilities Director.
219
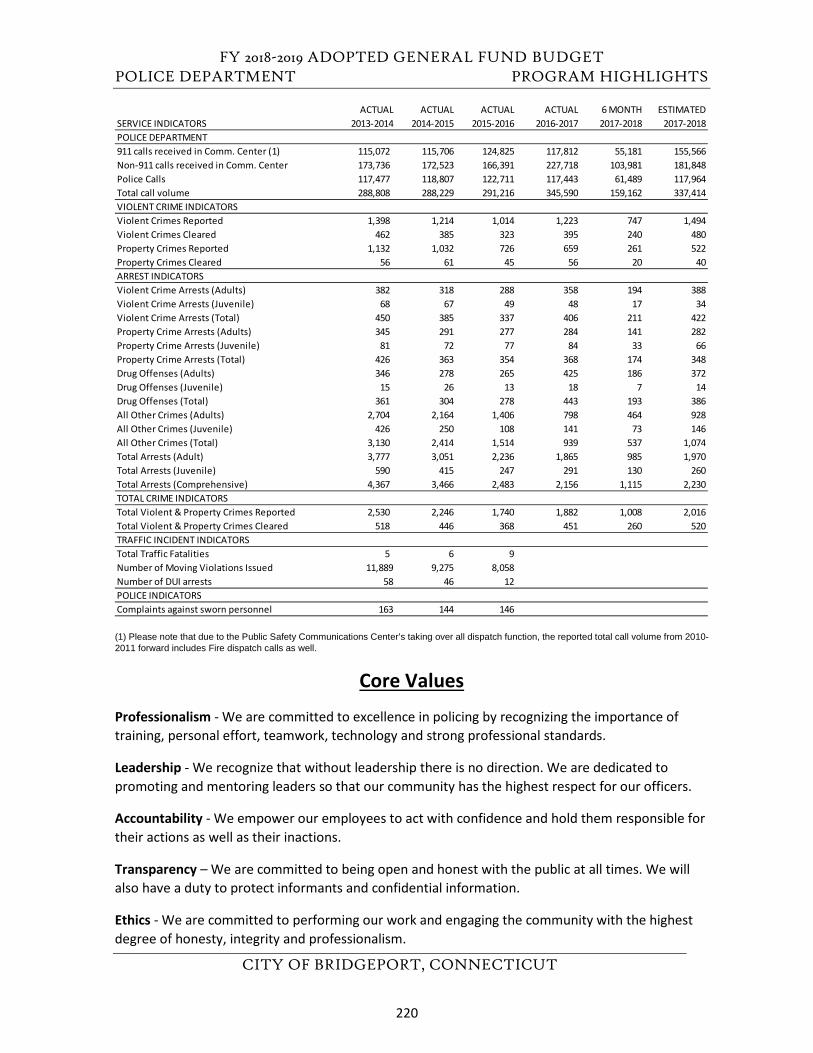
FY 2018-2019 ADOPTED GENERAL FUND BUDGET POLICE DEPARTMENT PROGRAM HIGHLIGHTS
CITY OF BRIDGEPORT, CONNECTICUT
(1) Please note that due to the Public Safety Communications Center’s taking over all dispatch function, the reported total call volume from 2010-2011 forward includes Fire dispatch calls as well.
Core Values
Professionalism - We are committed to excellence in policing by recognizing the importance of training, personal effort, teamwork, technology and strong professional standards.
Leadership - We recognize that without leadership there is no direction. We are dedicated to promoting and mentoring leaders so that our community has the highest respect for our officers.
Accountability - We empower our employees to act with confidence and hold them responsible for their actions as well as their inactions.
Transparency – We are committed to being open and honest with the public at all times. We will also have a duty to protect informants and confidential information.
Ethics - We are committed to performing our work and engaging the community with the highest degree of honesty, integrity and professionalism.
ACTUAL ACTUAL ACTUAL ACTUAL 6 MONTH ESTIMATEDSERVICE INDICATORS 2013-2014 2014-2015 2015-2016 2016-2017 2017-2018 2017-2018POLICE DEPARTMENT 911 calls received in Comm. Center (1) 115,072 115,706 124,825 117,812 55,181 155,566Non-911 calls received in Comm. Center 173,736 172,523 166,391 227,718 103,981 181,848Police Calls 117,477 118,807 122,711 117,443 61,489 117,964Total call volume 288,808 288,229 291,216 345,590 159,162 337,414VIOLENT CRIME INDICATORS Violent Crimes Reported 1,398 1,214 1,014 1,223 747 1,494Violent Crimes Cleared 462 385 323 395 240 480Property Crimes Reported 1,132 1,032 726 659 261 522Property Crimes Cleared 56 61 45 56 20 40ARREST INDICATORS Violent Crime Arrests (Adults) 382 318 288 358 194 388Violent Crime Arrests (Juvenile) 68 67 49 48 17 34Violent Crime Arrests (Total) 450 385 337 406 211 422Property Crime Arrests (Adults) 345 291 277 284 141 282Property Crime Arrests (Juvenile) 81 72 77 84 33 66Property Crime Arrests (Total) 426 363 354 368 174 348Drug Offenses (Adults) 346 278 265 425 186 372Drug Offenses (Juvenile) 15 26 13 18 7 14Drug Offenses (Total) 361 304 278 443 193 386All Other Crimes (Adults) 2,704 2,164 1,406 798 464 928All Other Crimes (Juvenile) 426 250 108 141 73 146All Other Crimes (Total) 3,130 2,414 1,514 939 537 1,074Total Arrests (Adult) 3,777 3,051 2,236 1,865 985 1,970Total Arrests (Juvenile) 590 415 247 291 130 260Total Arrests (Comprehensive) 4,367 3,466 2,483 2,156 1,115 2,230TOTAL CRIME INDICATORSTotal Violent & Property Crimes Reported 2,530 2,246 1,740 1,882 1,008 2,016Total Violent & Property Crimes Cleared 518 446 368 451 260 520TRAFFIC INCIDENT INDICATORS Total Traffic Fatalities 5 6 9Number of Moving Violations Issued 11,889 9,275 8,058Number of DUI arrests 58 46 12POLICE INDICATORS Complaints against sworn personnel 163 144 146
220
FY 2018-2019 ADOPTED GENERAL FUND BUDGET POLICE DEPARTMENT PROGRAM HIGHLIGHTS
CITY OF BRIDGEPORT, CONNECTICUT
FY 2018-2019 GOALS 1.Body Camera/Dash Camera Program Implemented
2.Go “Live” with our Record Management System (NexGen)
3. Establish greater Legitimacy in the Community through continued De-Escalation Training, Diversity Training, Community Policing.
4. Implement and Graduate another academy class and begin the recruitment process for additionalhighly diversified classes of recruits.
FY 2017-2018 GOAL STATUS 1. Make Bridgeport the largest safe City in CT. Crime down 4.3 Percent over last year.
2.Increase the Department Strength to 450 Officers. Department strength significantly increased to413 Officers.
3. Redistrict the Police Officer’s Assigned Posts-Ongoing with Ret. Chief J. Gaudett spearheading theinitiative.
4.Acquire Nexgen Record Management System-Accomplished (Training and Implementation tofollow.)
FY 2017 – 2018 ADDITIONAL ACCOMPLISHMENTS:
1.The Department has a Homicide Clearance (Solved) Rate far exceeding the National Standard.
2. Establishment of Walking POSTS on Stratford Avenue (Re-Vitalization of Community PolicingModel)
3.Demonstrated an Overtime reduction of almost 20% for the last fiscal year.
4.Strengthened Community Services with additional personnel and Civilian Consultants to betterserve the Community and significantly improve relations. This was done in conjunction with theOffice of the CAO.
221
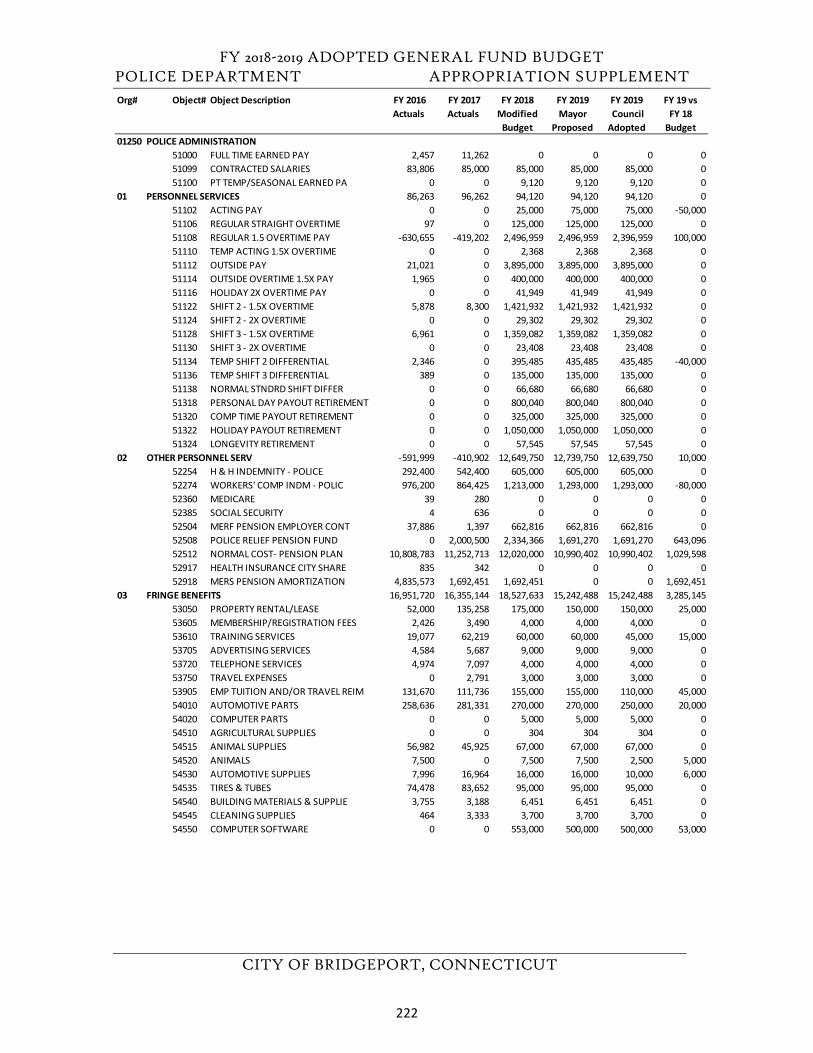
FY 2018-2019 ADOPTED GENERAL FUND BUDGET POLICE DEPARTMENT APPROPRIATION SUPPLEMENT
CITY OF BRIDGEPORT, CONNECTICUT
Org# Object# Object Description FY 2016 Actuals
FY 2017 Actuals
FY 2018 Modified
Budget
FY 2019Mayor
Proposed
FY 2019 Council Adopted
FY 19 vs FY 18
Budget01250 POLICE ADMINISTRATION
51000 FULL TIME EARNED PAY 2,457 11,262 0 0 0 051099 CONTRACTED SALARIES 83,806 85,000 85,000 85,000 85,000 051100 PT TEMP/SEASONAL EARNED PA 0 0 9,120 9,120 9,120 0
01 PERSONNEL SERVICES 86,263 96,262 94,120 94,120 94,120 051102 ACTING PAY 0 0 25,000 75,000 75,000 -50,00051106 REGULAR STRAIGHT OVERTIME 97 0 125,000 125,000 125,000 051108 REGULAR 1.5 OVERTIME PAY -630,655 -419,202 2,496,959 2,496,959 2,396,959 100,00051110 TEMP ACTING 1.5X OVERTIME 0 0 2,368 2,368 2,368 051112 OUTSIDE PAY 21,021 0 3,895,000 3,895,000 3,895,000 051114 OUTSIDE OVERTIME 1.5X PAY 1,965 0 400,000 400,000 400,000 051116 HOLIDAY 2X OVERTIME PAY 0 0 41,949 41,949 41,949 051122 SHIFT 2 - 1.5X OVERTIME 5,878 8,300 1,421,932 1,421,932 1,421,932 051124 SHIFT 2 - 2X OVERTIME 0 0 29,302 29,302 29,302 051128 SHIFT 3 - 1.5X OVERTIME 6,961 0 1,359,082 1,359,082 1,359,082 051130 SHIFT 3 - 2X OVERTIME 0 0 23,408 23,408 23,408 051134 TEMP SHIFT 2 DIFFERENTIAL 2,346 0 395,485 435,485 435,485 -40,00051136 TEMP SHIFT 3 DIFFERENTIAL 389 0 135,000 135,000 135,000 051138 NORMAL STNDRD SHIFT DIFFER 0 0 66,680 66,680 66,680 051318 PERSONAL DAY PAYOUT RETIREMENT 0 0 800,040 800,040 800,040 051320 COMP TIME PAYOUT RETIREMENT 0 0 325,000 325,000 325,000 051322 HOLIDAY PAYOUT RETIREMENT 0 0 1,050,000 1,050,000 1,050,000 051324 LONGEVITY RETIREMENT 0 0 57,545 57,545 57,545 0
02 OTHER PERSONNEL SERV -591,999 -410,902 12,649,750 12,739,750 12,639,750 10,00052254 H & H INDEMNITY - POLICE 292,400 542,400 605,000 605,000 605,000 052274 WORKERS' COMP INDM - POLIC 976,200 864,425 1,213,000 1,293,000 1,293,000 -80,00052360 MEDICARE 39 280 0 0 0 052385 SOCIAL SECURITY 4 636 0 0 0 052504 MERF PENSION EMPLOYER CONT 37,886 1,397 662,816 662,816 662,816 052508 POLICE RELIEF PENSION FUND 0 2,000,500 2,334,366 1,691,270 1,691,270 643,09652512 NORMAL COST- PENSION PLAN 10,808,783 11,252,713 12,020,000 10,990,402 10,990,402 1,029,59852917 HEALTH INSURANCE CITY SHARE 835 342 0 0 0 052918 MERS PENSION AMORTIZATION 4,835,573 1,692,451 1,692,451 0 0 1,692,451
03 FRINGE BENEFITS 16,951,720 16,355,144 18,527,633 15,242,488 15,242,488 3,285,14553050 PROPERTY RENTAL/LEASE 52,000 135,258 175,000 150,000 150,000 25,00053605 MEMBERSHIP/REGISTRATION FEES 2,426 3,490 4,000 4,000 4,000 053610 TRAINING SERVICES 19,077 62,219 60,000 60,000 45,000 15,00053705 ADVERTISING SERVICES 4,584 5,687 9,000 9,000 9,000 053720 TELEPHONE SERVICES 4,974 7,097 4,000 4,000 4,000 053750 TRAVEL EXPENSES 0 2,791 3,000 3,000 3,000 053905 EMP TUITION AND/OR TRAVEL REIM 131,670 111,736 155,000 155,000 110,000 45,00054010 AUTOMOTIVE PARTS 258,636 281,331 270,000 270,000 250,000 20,00054020 COMPUTER PARTS 0 0 5,000 5,000 5,000 054510 AGRICULTURAL SUPPLIES 0 0 304 304 304 054515 ANIMAL SUPPLIES 56,982 45,925 67,000 67,000 67,000 054520 ANIMALS 7,500 0 7,500 7,500 2,500 5,00054530 AUTOMOTIVE SUPPLIES 7,996 16,964 16,000 16,000 10,000 6,00054535 TIRES & TUBES 74,478 83,652 95,000 95,000 95,000 054540 BUILDING MATERIALS & SUPPLIE 3,755 3,188 6,451 6,451 6,451 054545 CLEANING SUPPLIES 464 3,333 3,700 3,700 3,700 054550 COMPUTER SOFTWARE 0 0 553,000 500,000 500,000 53,000
222
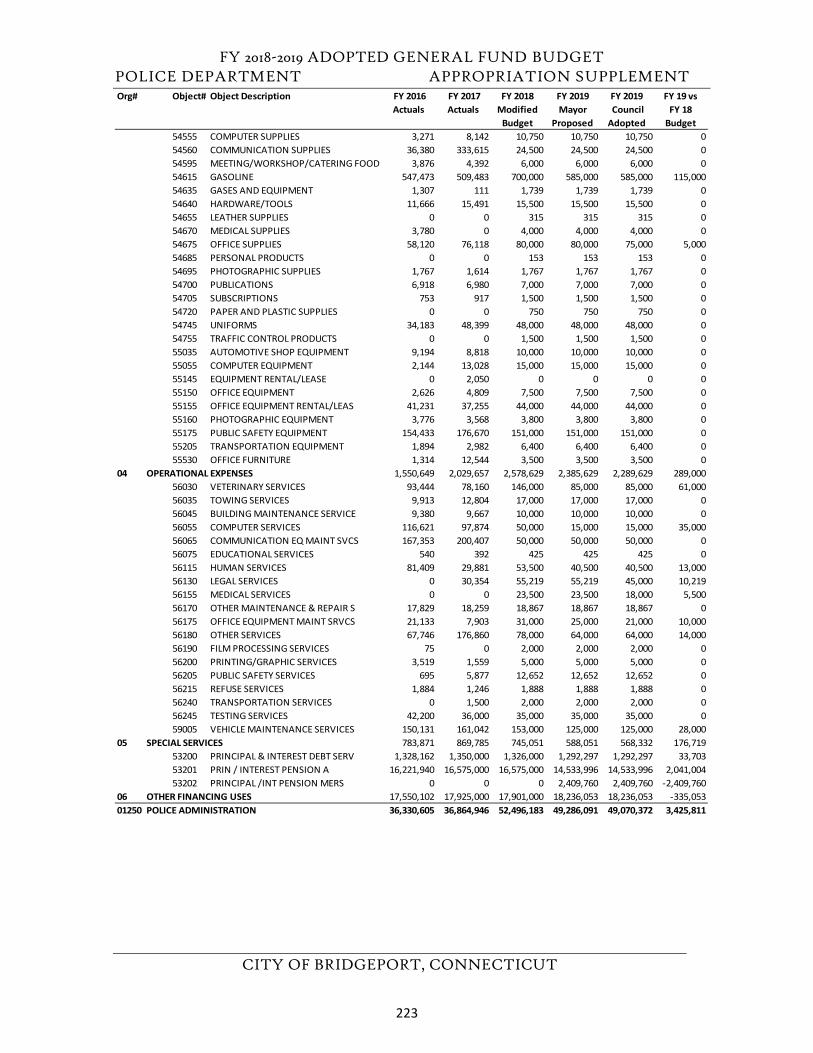
FY 2018-2019 ADOPTED GENERAL FUND BUDGET POLICE DEPARTMENT APPROPRIATION SUPPLEMENT
CITY OF BRIDGEPORT, CONNECTICUT
Org# Object# Object Description FY 2016 Actuals
FY 2017 Actuals
FY 2018 Modified
Budget
FY 2019Mayor
Proposed
FY 2019 Council Adopted
FY 19 vs FY 18
Budget54555 COMPUTER SUPPLIES 3,271 8,142 10,750 10,750 10,750 054560 COMMUNICATION SUPPLIES 36,380 333,615 24,500 24,500 24,500 054595 MEETING/WORKSHOP/CATERING FOOD 3,876 4,392 6,000 6,000 6,000 054615 GASOLINE 547,473 509,483 700,000 585,000 585,000 115,00054635 GASES AND EQUIPMENT 1,307 111 1,739 1,739 1,739 054640 HARDWARE/TOOLS 11,666 15,491 15,500 15,500 15,500 054655 LEATHER SUPPLIES 0 0 315 315 315 054670 MEDICAL SUPPLIES 3,780 0 4,000 4,000 4,000 054675 OFFICE SUPPLIES 58,120 76,118 80,000 80,000 75,000 5,00054685 PERSONAL PRODUCTS 0 0 153 153 153 054695 PHOTOGRAPHIC SUPPLIES 1,767 1,614 1,767 1,767 1,767 054700 PUBLICATIONS 6,918 6,980 7,000 7,000 7,000 054705 SUBSCRIPTIONS 753 917 1,500 1,500 1,500 054720 PAPER AND PLASTIC SUPPLIES 0 0 750 750 750 054745 UNIFORMS 34,183 48,399 48,000 48,000 48,000 054755 TRAFFIC CONTROL PRODUCTS 0 0 1,500 1,500 1,500 055035 AUTOMOTIVE SHOP EQUIPMENT 9,194 8,818 10,000 10,000 10,000 055055 COMPUTER EQUIPMENT 2,144 13,028 15,000 15,000 15,000 055145 EQUIPMENT RENTAL/LEASE 0 2,050 0 0 0 055150 OFFICE EQUIPMENT 2,626 4,809 7,500 7,500 7,500 055155 OFFICE EQUIPMENT RENTAL/LEAS 41,231 37,255 44,000 44,000 44,000 055160 PHOTOGRAPHIC EQUIPMENT 3,776 3,568 3,800 3,800 3,800 055175 PUBLIC SAFETY EQUIPMENT 154,433 176,670 151,000 151,000 151,000 055205 TRANSPORTATION EQUIPMENT 1,894 2,982 6,400 6,400 6,400 055530 OFFICE FURNITURE 1,314 12,544 3,500 3,500 3,500 0
04 OPERATIONAL EXPENSES 1,550,649 2,029,657 2,578,629 2,385,629 2,289,629 289,00056030 VETERINARY SERVICES 93,444 78,160 146,000 85,000 85,000 61,00056035 TOWING SERVICES 9,913 12,804 17,000 17,000 17,000 056045 BUILDING MAINTENANCE SERVICE 9,380 9,667 10,000 10,000 10,000 056055 COMPUTER SERVICES 116,621 97,874 50,000 15,000 15,000 35,00056065 COMMUNICATION EQ MAINT SVCS 167,353 200,407 50,000 50,000 50,000 056075 EDUCATIONAL SERVICES 540 392 425 425 425 056115 HUMAN SERVICES 81,409 29,881 53,500 40,500 40,500 13,00056130 LEGAL SERVICES 0 30,354 55,219 55,219 45,000 10,21956155 MEDICAL SERVICES 0 0 23,500 23,500 18,000 5,50056170 OTHER MAINTENANCE & REPAIR S 17,829 18,259 18,867 18,867 18,867 056175 OFFICE EQUIPMENT MAINT SRVCS 21,133 7,903 31,000 25,000 21,000 10,00056180 OTHER SERVICES 67,746 176,860 78,000 64,000 64,000 14,00056190 FILM PROCESSING SERVICES 75 0 2,000 2,000 2,000 056200 PRINTING/GRAPHIC SERVICES 3,519 1,559 5,000 5,000 5,000 056205 PUBLIC SAFETY SERVICES 695 5,877 12,652 12,652 12,652 056215 REFUSE SERVICES 1,884 1,246 1,888 1,888 1,888 056240 TRANSPORTATION SERVICES 0 1,500 2,000 2,000 2,000 056245 TESTING SERVICES 42,200 36,000 35,000 35,000 35,000 059005 VEHICLE MAINTENANCE SERVICES 150,131 161,042 153,000 125,000 125,000 28,000
05 SPECIAL SERVICES 783,871 869,785 745,051 588,051 568,332 176,71953200 PRINCIPAL & INTEREST DEBT SERV 1,328,162 1,350,000 1,326,000 1,292,297 1,292,297 33,70353201 PRIN / INTEREST PENSION A 16,221,940 16,575,000 16,575,000 14,533,996 14,533,996 2,041,00453202 PRINCIPAL /INT PENSION MERS 0 0 0 2,409,760 2,409,760 -2,409,760
06 OTHER FINANCING USES 17,550,102 17,925,000 17,901,000 18,236,053 18,236,053 -335,05301250 POLICE ADMINISTRATION 36,330,605 36,864,946 52,496,183 49,286,091 49,070,372 3,425,811
223
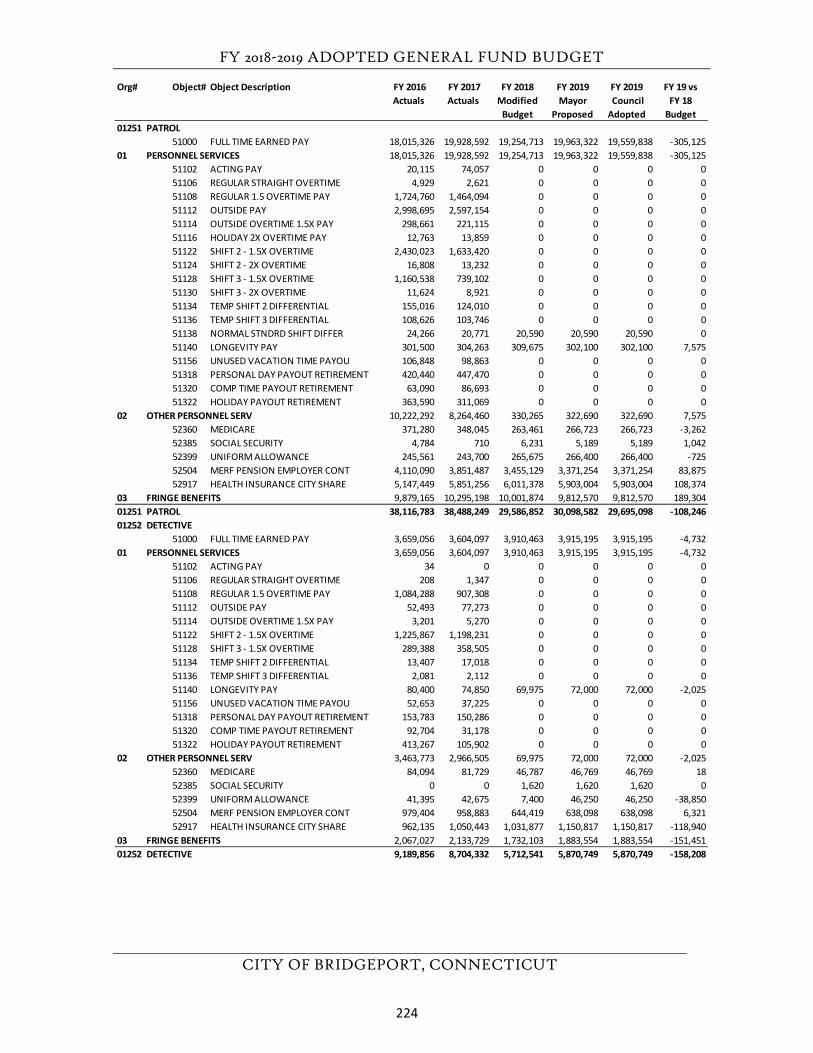
FY 2018-2019 ADOPTED GENERAL FUND BUDGET
CITY OF BRIDGEPORT, CONNECTICUT
Org# Object# Object Description FY 2016 Actuals
FY 2017 Actuals
FY 2018 Modified
Budget
FY 2019Mayor
Proposed
FY 2019 Council Adopted
FY 19 vs FY 18
Budget01251 PATROL
51000 FULL TIME EARNED PAY 18,015,326 19,928,592 19,254,713 19,963,322 19,559,838 -305,12501 PERSONNEL SERVICES 18,015,326 19,928,592 19,254,713 19,963,322 19,559,838 -305,125
51102 ACTING PAY 20,115 74,057 0 0 0 051106 REGULAR STRAIGHT OVERTIME 4,929 2,621 0 0 0 051108 REGULAR 1.5 OVERTIME PAY 1,724,760 1,464,094 0 0 0 051112 OUTSIDE PAY 2,998,695 2,597,154 0 0 0 051114 OUTSIDE OVERTIME 1.5X PAY 298,661 221,115 0 0 0 051116 HOLIDAY 2X OVERTIME PAY 12,763 13,859 0 0 0 051122 SHIFT 2 - 1.5X OVERTIME 2,430,023 1,633,420 0 0 0 051124 SHIFT 2 - 2X OVERTIME 16,808 13,232 0 0 0 051128 SHIFT 3 - 1.5X OVERTIME 1,160,538 739,102 0 0 0 051130 SHIFT 3 - 2X OVERTIME 11,624 8,921 0 0 0 051134 TEMP SHIFT 2 DIFFERENTIAL 155,016 124,010 0 0 0 051136 TEMP SHIFT 3 DIFFERENTIAL 108,626 103,746 0 0 0 051138 NORMAL STNDRD SHIFT DIFFER 24,266 20,771 20,590 20,590 20,590 051140 LONGEVITY PAY 301,500 304,263 309,675 302,100 302,100 7,57551156 UNUSED VACATION TIME PAYOU 106,848 98,863 0 0 0 051318 PERSONAL DAY PAYOUT RETIREMENT 420,440 447,470 0 0 0 051320 COMP TIME PAYOUT RETIREMENT 63,090 86,693 0 0 0 051322 HOLIDAY PAYOUT RETIREMENT 363,590 311,069 0 0 0 0
02 OTHER PERSONNEL SERV 10,222,292 8,264,460 330,265 322,690 322,690 7,57552360 MEDICARE 371,280 348,045 263,461 266,723 266,723 -3,26252385 SOCIAL SECURITY 4,784 710 6,231 5,189 5,189 1,04252399 UNIFORM ALLOWANCE 245,561 243,700 265,675 266,400 266,400 -72552504 MERF PENSION EMPLOYER CONT 4,110,090 3,851,487 3,455,129 3,371,254 3,371,254 83,87552917 HEALTH INSURANCE CITY SHARE 5,147,449 5,851,256 6,011,378 5,903,004 5,903,004 108,374
03 FRINGE BENEFITS 9,879,165 10,295,198 10,001,874 9,812,570 9,812,570 189,30401251 PATROL 38,116,783 38,488,249 29,586,852 30,098,582 29,695,098 -108,24601252 DETECTIVE
51000 FULL TIME EARNED PAY 3,659,056 3,604,097 3,910,463 3,915,195 3,915,195 -4,73201 PERSONNEL SERVICES 3,659,056 3,604,097 3,910,463 3,915,195 3,915,195 -4,732
51102 ACTING PAY 34 0 0 0 0 051106 REGULAR STRAIGHT OVERTIME 208 1,347 0 0 0 051108 REGULAR 1.5 OVERTIME PAY 1,084,288 907,308 0 0 0 051112 OUTSIDE PAY 52,493 77,273 0 0 0 051114 OUTSIDE OVERTIME 1.5X PAY 3,201 5,270 0 0 0 051122 SHIFT 2 - 1.5X OVERTIME 1,225,867 1,198,231 0 0 0 051128 SHIFT 3 - 1.5X OVERTIME 289,388 358,505 0 0 0 051134 TEMP SHIFT 2 DIFFERENTIAL 13,407 17,018 0 0 0 051136 TEMP SHIFT 3 DIFFERENTIAL 2,081 2,112 0 0 0 051140 LONGEVITY PAY 80,400 74,850 69,975 72,000 72,000 -2,02551156 UNUSED VACATION TIME PAYOU 52,653 37,225 0 0 0 051318 PERSONAL DAY PAYOUT RETIREMENT 153,783 150,286 0 0 0 051320 COMP TIME PAYOUT RETIREMENT 92,704 31,178 0 0 0 051322 HOLIDAY PAYOUT RETIREMENT 413,267 105,902 0 0 0 0
02 OTHER PERSONNEL SERV 3,463,773 2,966,505 69,975 72,000 72,000 -2,02552360 MEDICARE 84,094 81,729 46,787 46,769 46,769 1852385 SOCIAL SECURITY 0 0 1,620 1,620 1,620 052399 UNIFORM ALLOWANCE 41,395 42,675 7,400 46,250 46,250 -38,85052504 MERF PENSION EMPLOYER CONT 979,404 958,883 644,419 638,098 638,098 6,32152917 HEALTH INSURANCE CITY SHARE 962,135 1,050,443 1,031,877 1,150,817 1,150,817 -118,940
03 FRINGE BENEFITS 2,067,027 2,133,729 1,732,103 1,883,554 1,883,554 -151,45101252 DETECTIVE 9,189,856 8,704,332 5,712,541 5,870,749 5,870,749 -158,208
224
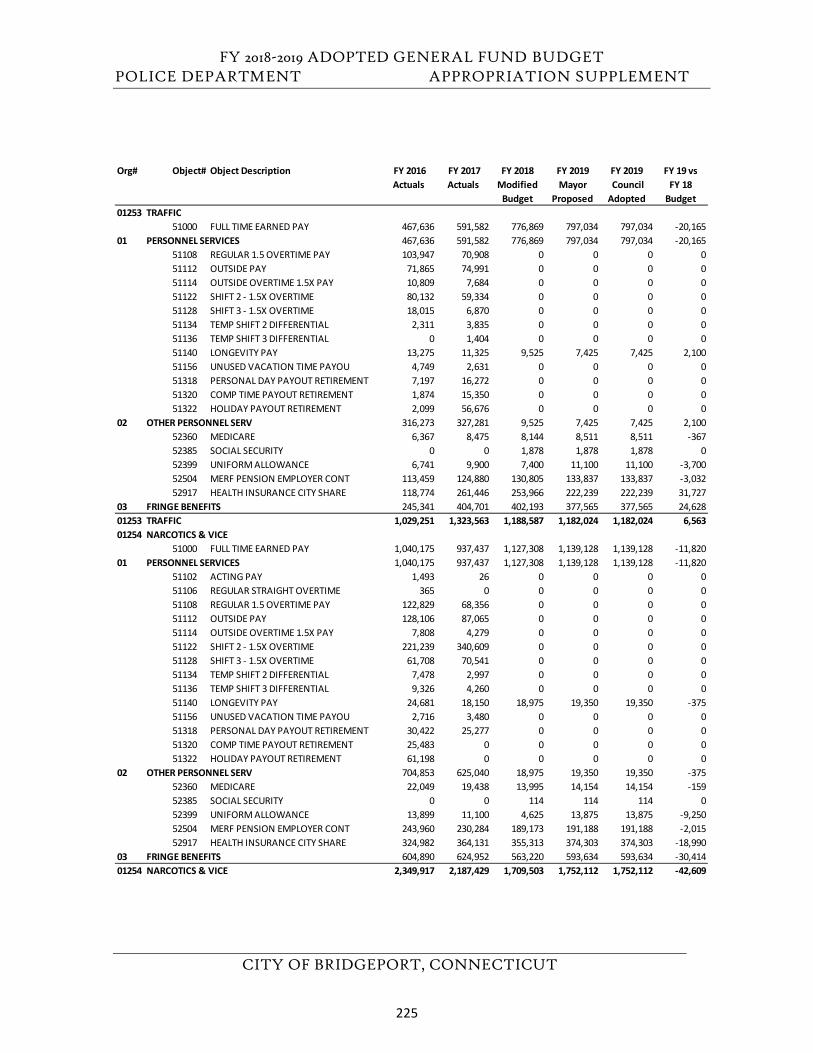
FY 2018-2019 ADOPTED GENERAL FUND BUDGET POLICE DEPARTMENT APPROPRIATION SUPPLEMENT
CITY OF BRIDGEPORT, CONNECTICUT
Org# Object# Object Description FY 2016 Actuals
FY 2017 Actuals
FY 2018 Modified
Budget
FY 2019Mayor
Proposed
FY 2019 Council Adopted
FY 19 vs FY 18
Budget01253 TRAFFIC
51000 FULL TIME EARNED PAY 467,636 591,582 776,869 797,034 797,034 -20,16501 PERSONNEL SERVICES 467,636 591,582 776,869 797,034 797,034 -20,165
51108 REGULAR 1.5 OVERTIME PAY 103,947 70,908 0 0 0 051112 OUTSIDE PAY 71,865 74,991 0 0 0 051114 OUTSIDE OVERTIME 1.5X PAY 10,809 7,684 0 0 0 051122 SHIFT 2 - 1.5X OVERTIME 80,132 59,334 0 0 0 051128 SHIFT 3 - 1.5X OVERTIME 18,015 6,870 0 0 0 051134 TEMP SHIFT 2 DIFFERENTIAL 2,311 3,835 0 0 0 051136 TEMP SHIFT 3 DIFFERENTIAL 0 1,404 0 0 0 051140 LONGEVITY PAY 13,275 11,325 9,525 7,425 7,425 2,10051156 UNUSED VACATION TIME PAYOU 4,749 2,631 0 0 0 051318 PERSONAL DAY PAYOUT RETIREMENT 7,197 16,272 0 0 0 051320 COMP TIME PAYOUT RETIREMENT 1,874 15,350 0 0 0 051322 HOLIDAY PAYOUT RETIREMENT 2,099 56,676 0 0 0 0
02 OTHER PERSONNEL SERV 316,273 327,281 9,525 7,425 7,425 2,10052360 MEDICARE 6,367 8,475 8,144 8,511 8,511 -36752385 SOCIAL SECURITY 0 0 1,878 1,878 1,878 052399 UNIFORM ALLOWANCE 6,741 9,900 7,400 11,100 11,100 -3,70052504 MERF PENSION EMPLOYER CONT 113,459 124,880 130,805 133,837 133,837 -3,03252917 HEALTH INSURANCE CITY SHARE 118,774 261,446 253,966 222,239 222,239 31,727
03 FRINGE BENEFITS 245,341 404,701 402,193 377,565 377,565 24,62801253 TRAFFIC 1,029,251 1,323,563 1,188,587 1,182,024 1,182,024 6,56301254 NARCOTICS & VICE
51000 FULL TIME EARNED PAY 1,040,175 937,437 1,127,308 1,139,128 1,139,128 -11,82001 PERSONNEL SERVICES 1,040,175 937,437 1,127,308 1,139,128 1,139,128 -11,820
51102 ACTING PAY 1,493 26 0 0 0 051106 REGULAR STRAIGHT OVERTIME 365 0 0 0 0 051108 REGULAR 1.5 OVERTIME PAY 122,829 68,356 0 0 0 051112 OUTSIDE PAY 128,106 87,065 0 0 0 051114 OUTSIDE OVERTIME 1.5X PAY 7,808 4,279 0 0 0 051122 SHIFT 2 - 1.5X OVERTIME 221,239 340,609 0 0 0 051128 SHIFT 3 - 1.5X OVERTIME 61,708 70,541 0 0 0 051134 TEMP SHIFT 2 DIFFERENTIAL 7,478 2,997 0 0 0 051136 TEMP SHIFT 3 DIFFERENTIAL 9,326 4,260 0 0 0 051140 LONGEVITY PAY 24,681 18,150 18,975 19,350 19,350 -37551156 UNUSED VACATION TIME PAYOU 2,716 3,480 0 0 0 051318 PERSONAL DAY PAYOUT RETIREMENT 30,422 25,277 0 0 0 051320 COMP TIME PAYOUT RETIREMENT 25,483 0 0 0 0 051322 HOLIDAY PAYOUT RETIREMENT 61,198 0 0 0 0 0
02 OTHER PERSONNEL SERV 704,853 625,040 18,975 19,350 19,350 -37552360 MEDICARE 22,049 19,438 13,995 14,154 14,154 -15952385 SOCIAL SECURITY 0 0 114 114 114 052399 UNIFORM ALLOWANCE 13,899 11,100 4,625 13,875 13,875 -9,25052504 MERF PENSION EMPLOYER CONT 243,960 230,284 189,173 191,188 191,188 -2,01552917 HEALTH INSURANCE CITY SHARE 324,982 364,131 355,313 374,303 374,303 -18,990
03 FRINGE BENEFITS 604,890 624,952 563,220 593,634 593,634 -30,41401254 NARCOTICS & VICE 2,349,917 2,187,429 1,709,503 1,752,112 1,752,112 -42,609
225
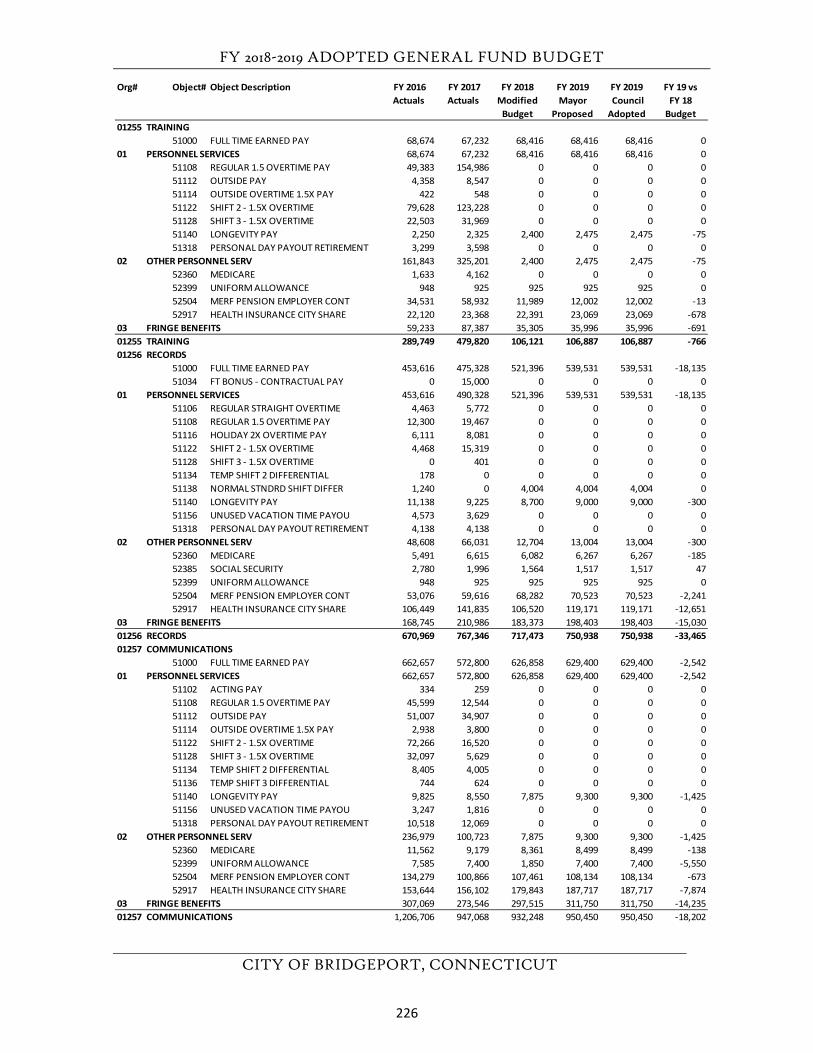
FY 2018-2019 ADOPTED GENERAL FUND BUDGET
CITY OF BRIDGEPORT, CONNECTICUT
Org# Object# Object Description FY 2016 Actuals
FY 2017 Actuals
FY 2018 Modified
Budget
FY 2019Mayor
Proposed
FY 2019 Council Adopted
FY 19 vs FY 18
Budget01255 TRAINING
51000 FULL TIME EARNED PAY 68,674 67,232 68,416 68,416 68,416 001 PERSONNEL SERVICES 68,674 67,232 68,416 68,416 68,416 0
51108 REGULAR 1.5 OVERTIME PAY 49,383 154,986 0 0 0 051112 OUTSIDE PAY 4,358 8,547 0 0 0 051114 OUTSIDE OVERTIME 1.5X PAY 422 548 0 0 0 051122 SHIFT 2 - 1.5X OVERTIME 79,628 123,228 0 0 0 051128 SHIFT 3 - 1.5X OVERTIME 22,503 31,969 0 0 0 051140 LONGEVITY PAY 2,250 2,325 2,400 2,475 2,475 -7551318 PERSONAL DAY PAYOUT RETIREMENT 3,299 3,598 0 0 0 0
02 OTHER PERSONNEL SERV 161,843 325,201 2,400 2,475 2,475 -7552360 MEDICARE 1,633 4,162 0 0 0 052399 UNIFORM ALLOWANCE 948 925 925 925 925 052504 MERF PENSION EMPLOYER CONT 34,531 58,932 11,989 12,002 12,002 -1352917 HEALTH INSURANCE CITY SHARE 22,120 23,368 22,391 23,069 23,069 -678
03 FRINGE BENEFITS 59,233 87,387 35,305 35,996 35,996 -69101255 TRAINING 289,749 479,820 106,121 106,887 106,887 -76601256 RECORDS
51000 FULL TIME EARNED PAY 453,616 475,328 521,396 539,531 539,531 -18,13551034 FT BONUS - CONTRACTUAL PAY 0 15,000 0 0 0 0
01 PERSONNEL SERVICES 453,616 490,328 521,396 539,531 539,531 -18,13551106 REGULAR STRAIGHT OVERTIME 4,463 5,772 0 0 0 051108 REGULAR 1.5 OVERTIME PAY 12,300 19,467 0 0 0 051116 HOLIDAY 2X OVERTIME PAY 6,111 8,081 0 0 0 051122 SHIFT 2 - 1.5X OVERTIME 4,468 15,319 0 0 0 051128 SHIFT 3 - 1.5X OVERTIME 0 401 0 0 0 051134 TEMP SHIFT 2 DIFFERENTIAL 178 0 0 0 0 051138 NORMAL STNDRD SHIFT DIFFER 1,240 0 4,004 4,004 4,004 051140 LONGEVITY PAY 11,138 9,225 8,700 9,000 9,000 -30051156 UNUSED VACATION TIME PAYOU 4,573 3,629 0 0 0 051318 PERSONAL DAY PAYOUT RETIREMENT 4,138 4,138 0 0 0 0
02 OTHER PERSONNEL SERV 48,608 66,031 12,704 13,004 13,004 -30052360 MEDICARE 5,491 6,615 6,082 6,267 6,267 -18552385 SOCIAL SECURITY 2,780 1,996 1,564 1,517 1,517 4752399 UNIFORM ALLOWANCE 948 925 925 925 925 052504 MERF PENSION EMPLOYER CONT 53,076 59,616 68,282 70,523 70,523 -2,24152917 HEALTH INSURANCE CITY SHARE 106,449 141,835 106,520 119,171 119,171 -12,651
03 FRINGE BENEFITS 168,745 210,986 183,373 198,403 198,403 -15,03001256 RECORDS 670,969 767,346 717,473 750,938 750,938 -33,46501257 COMMUNICATIONS
51000 FULL TIME EARNED PAY 662,657 572,800 626,858 629,400 629,400 -2,54201 PERSONNEL SERVICES 662,657 572,800 626,858 629,400 629,400 -2,542
51102 ACTING PAY 334 259 0 0 0 051108 REGULAR 1.5 OVERTIME PAY 45,599 12,544 0 0 0 051112 OUTSIDE PAY 51,007 34,907 0 0 0 051114 OUTSIDE OVERTIME 1.5X PAY 2,938 3,800 0 0 0 051122 SHIFT 2 - 1.5X OVERTIME 72,266 16,520 0 0 0 051128 SHIFT 3 - 1.5X OVERTIME 32,097 5,629 0 0 0 051134 TEMP SHIFT 2 DIFFERENTIAL 8,405 4,005 0 0 0 051136 TEMP SHIFT 3 DIFFERENTIAL 744 624 0 0 0 051140 LONGEVITY PAY 9,825 8,550 7,875 9,300 9,300 -1,42551156 UNUSED VACATION TIME PAYOU 3,247 1,816 0 0 0 051318 PERSONAL DAY PAYOUT RETIREMENT 10,518 12,069 0 0 0 0
02 OTHER PERSONNEL SERV 236,979 100,723 7,875 9,300 9,300 -1,42552360 MEDICARE 11,562 9,179 8,361 8,499 8,499 -13852399 UNIFORM ALLOWANCE 7,585 7,400 1,850 7,400 7,400 -5,55052504 MERF PENSION EMPLOYER CONT 134,279 100,866 107,461 108,134 108,134 -67352917 HEALTH INSURANCE CITY SHARE 153,644 156,102 179,843 187,717 187,717 -7,874
03 FRINGE BENEFITS 307,069 273,546 297,515 311,750 311,750 -14,23501257 COMMUNICATIONS 1,206,706 947,068 932,248 950,450 950,450 -18,202
226
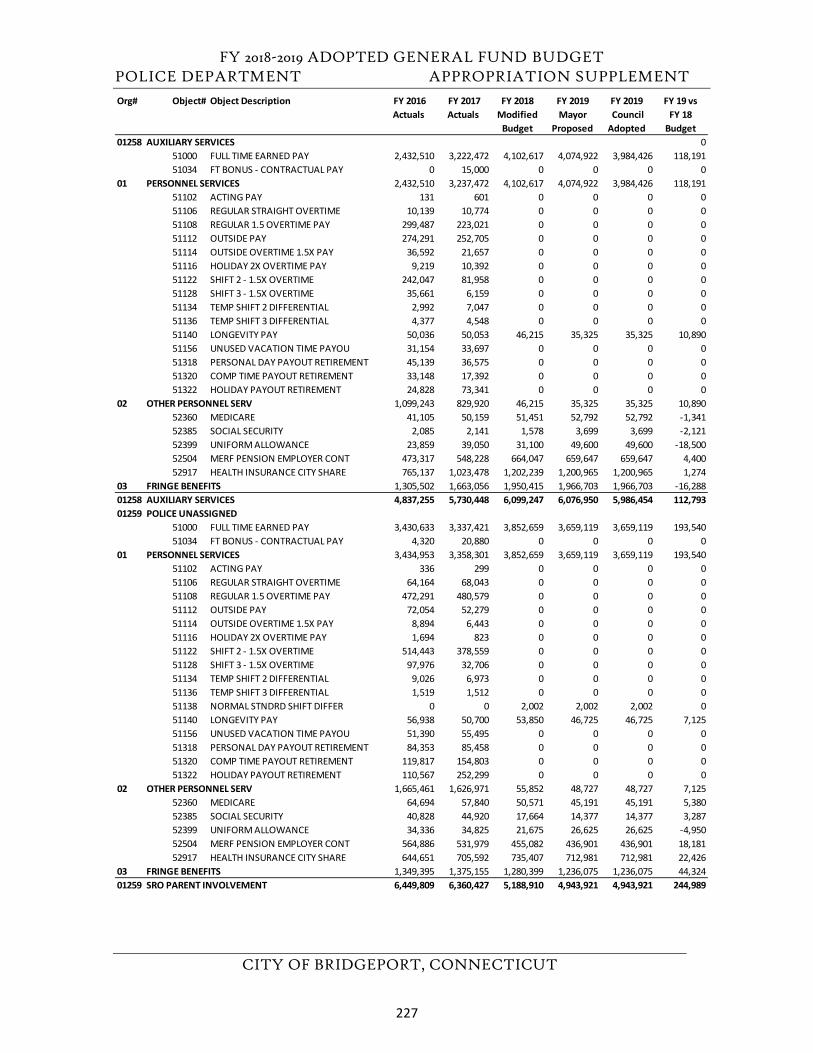
FY 2018-2019 ADOPTED GENERAL FUND BUDGET POLICE DEPARTMENT APPROPRIATION SUPPLEMENT
CITY OF BRIDGEPORT, CONNECTICUT
Org# Object# Object Description FY 2016 Actuals
FY 2017 Actuals
FY 2018 Modified
Budget
FY 2019Mayor
Proposed
FY 2019 Council Adopted
FY 19 vs FY 18
Budget01258 AUXILIARY SERVICES 0
51000 FULL TIME EARNED PAY 2,432,510 3,222,472 4,102,617 4,074,922 3,984,426 118,19151034 FT BONUS - CONTRACTUAL PAY 0 15,000 0 0 0 0
01 PERSONNEL SERVICES 2,432,510 3,237,472 4,102,617 4,074,922 3,984,426 118,19151102 ACTING PAY 131 601 0 0 0 051106 REGULAR STRAIGHT OVERTIME 10,139 10,774 0 0 0 051108 REGULAR 1.5 OVERTIME PAY 299,487 223,021 0 0 0 051112 OUTSIDE PAY 274,291 252,705 0 0 0 051114 OUTSIDE OVERTIME 1.5X PAY 36,592 21,657 0 0 0 051116 HOLIDAY 2X OVERTIME PAY 9,219 10,392 0 0 0 051122 SHIFT 2 - 1.5X OVERTIME 242,047 81,958 0 0 0 051128 SHIFT 3 - 1.5X OVERTIME 35,661 6,159 0 0 0 051134 TEMP SHIFT 2 DIFFERENTIAL 2,992 7,047 0 0 0 051136 TEMP SHIFT 3 DIFFERENTIAL 4,377 4,548 0 0 0 051140 LONGEVITY PAY 50,036 50,053 46,215 35,325 35,325 10,89051156 UNUSED VACATION TIME PAYOU 31,154 33,697 0 0 0 051318 PERSONAL DAY PAYOUT RETIREMENT 45,139 36,575 0 0 0 051320 COMP TIME PAYOUT RETIREMENT 33,148 17,392 0 0 0 051322 HOLIDAY PAYOUT RETIREMENT 24,828 73,341 0 0 0 0
02 OTHER PERSONNEL SERV 1,099,243 829,920 46,215 35,325 35,325 10,89052360 MEDICARE 41,105 50,159 51,451 52,792 52,792 -1,34152385 SOCIAL SECURITY 2,085 2,141 1,578 3,699 3,699 -2,12152399 UNIFORM ALLOWANCE 23,859 39,050 31,100 49,600 49,600 -18,50052504 MERF PENSION EMPLOYER CONT 473,317 548,228 664,047 659,647 659,647 4,40052917 HEALTH INSURANCE CITY SHARE 765,137 1,023,478 1,202,239 1,200,965 1,200,965 1,274
03 FRINGE BENEFITS 1,305,502 1,663,056 1,950,415 1,966,703 1,966,703 -16,28801258 AUXILIARY SERVICES 4,837,255 5,730,448 6,099,247 6,076,950 5,986,454 112,79301259 POLICE UNASSIGNED
51000 FULL TIME EARNED PAY 3,430,633 3,337,421 3,852,659 3,659,119 3,659,119 193,54051034 FT BONUS - CONTRACTUAL PAY 4,320 20,880 0 0 0 0
01 PERSONNEL SERVICES 3,434,953 3,358,301 3,852,659 3,659,119 3,659,119 193,54051102 ACTING PAY 336 299 0 0 0 051106 REGULAR STRAIGHT OVERTIME 64,164 68,043 0 0 0 051108 REGULAR 1.5 OVERTIME PAY 472,291 480,579 0 0 0 051112 OUTSIDE PAY 72,054 52,279 0 0 0 051114 OUTSIDE OVERTIME 1.5X PAY 8,894 6,443 0 0 0 051116 HOLIDAY 2X OVERTIME PAY 1,694 823 0 0 0 051122 SHIFT 2 - 1.5X OVERTIME 514,443 378,559 0 0 0 051128 SHIFT 3 - 1.5X OVERTIME 97,976 32,706 0 0 0 051134 TEMP SHIFT 2 DIFFERENTIAL 9,026 6,973 0 0 0 051136 TEMP SHIFT 3 DIFFERENTIAL 1,519 1,512 0 0 0 051138 NORMAL STNDRD SHIFT DIFFER 0 0 2,002 2,002 2,002 051140 LONGEVITY PAY 56,938 50,700 53,850 46,725 46,725 7,12551156 UNUSED VACATION TIME PAYOU 51,390 55,495 0 0 0 051318 PERSONAL DAY PAYOUT RETIREMENT 84,353 85,458 0 0 0 051320 COMP TIME PAYOUT RETIREMENT 119,817 154,803 0 0 0 051322 HOLIDAY PAYOUT RETIREMENT 110,567 252,299 0 0 0 0
02 OTHER PERSONNEL SERV 1,665,461 1,626,971 55,852 48,727 48,727 7,12552360 MEDICARE 64,694 57,840 50,571 45,191 45,191 5,38052385 SOCIAL SECURITY 40,828 44,920 17,664 14,377 14,377 3,28752399 UNIFORM ALLOWANCE 34,336 34,825 21,675 26,625 26,625 -4,95052504 MERF PENSION EMPLOYER CONT 564,886 531,979 455,082 436,901 436,901 18,18152917 HEALTH INSURANCE CITY SHARE 644,651 705,592 735,407 712,981 712,981 22,426
03 FRINGE BENEFITS 1,349,395 1,375,155 1,280,399 1,236,075 1,236,075 44,32401259 SRO PARENT INVOLVEMENT 6,449,809 6,360,427 5,188,910 4,943,921 4,943,921 244,989
227

FY 2018-2019 ADOPTED GENERAL FUND BUDGET
CITY OF BRIDGEPORT, CONNECTICUT
This page left blank intentionally.
228
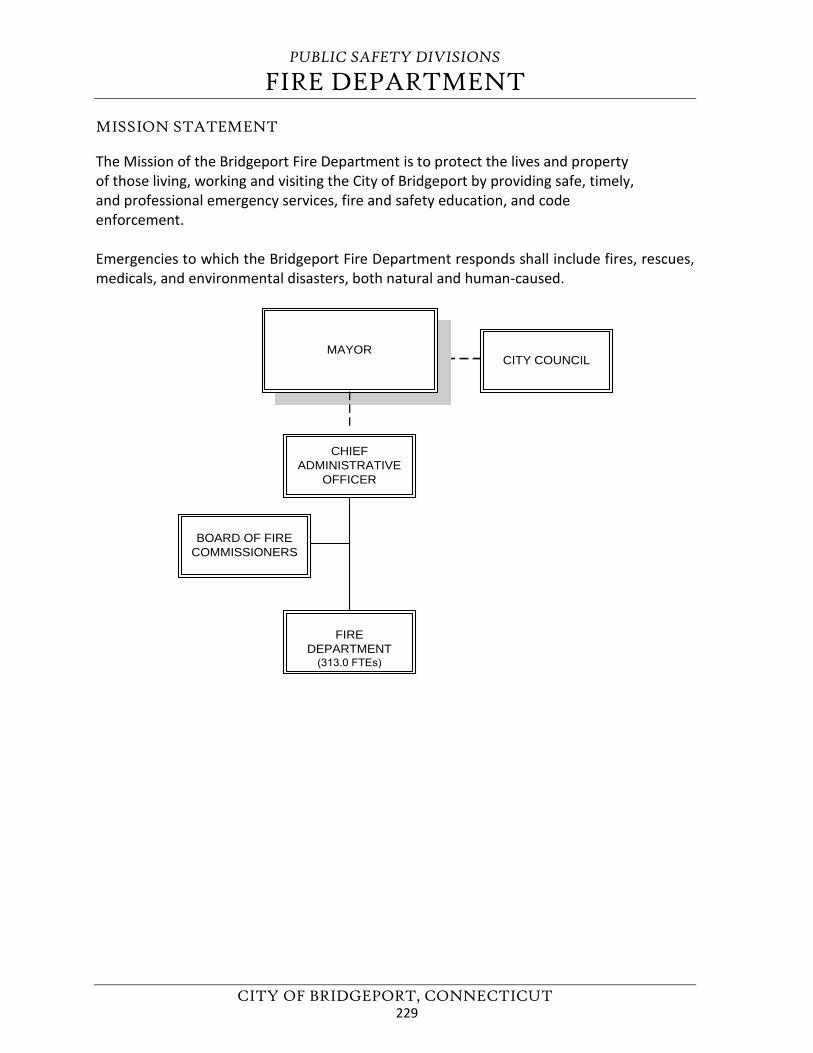
PUBLIC SAFETY DIVISIONS
FIRE DEPARTMENT
CITY OF BRIDGEPORT, CONNECTICUT
MISSION STATEMENT
The Mission of the Bridgeport Fire Department is to protect the lives and property of those living, working and visiting the City of Bridgeport by providing safe, timely, and professional emergency services, fire and safety education, and code enforcement.
Emergencies to which the Bridgeport Fire Department responds shall include fires, rescues, medicals, and environmental disasters, both natural and human-caused.
CHIEFADMINISTRATIVE
OFFICER
CITY COUNCIL
FIRE DEPARTMENT
(313.0 FTEs)
MAYOR
BOARD OF FIRECOMMISSIONERS
229
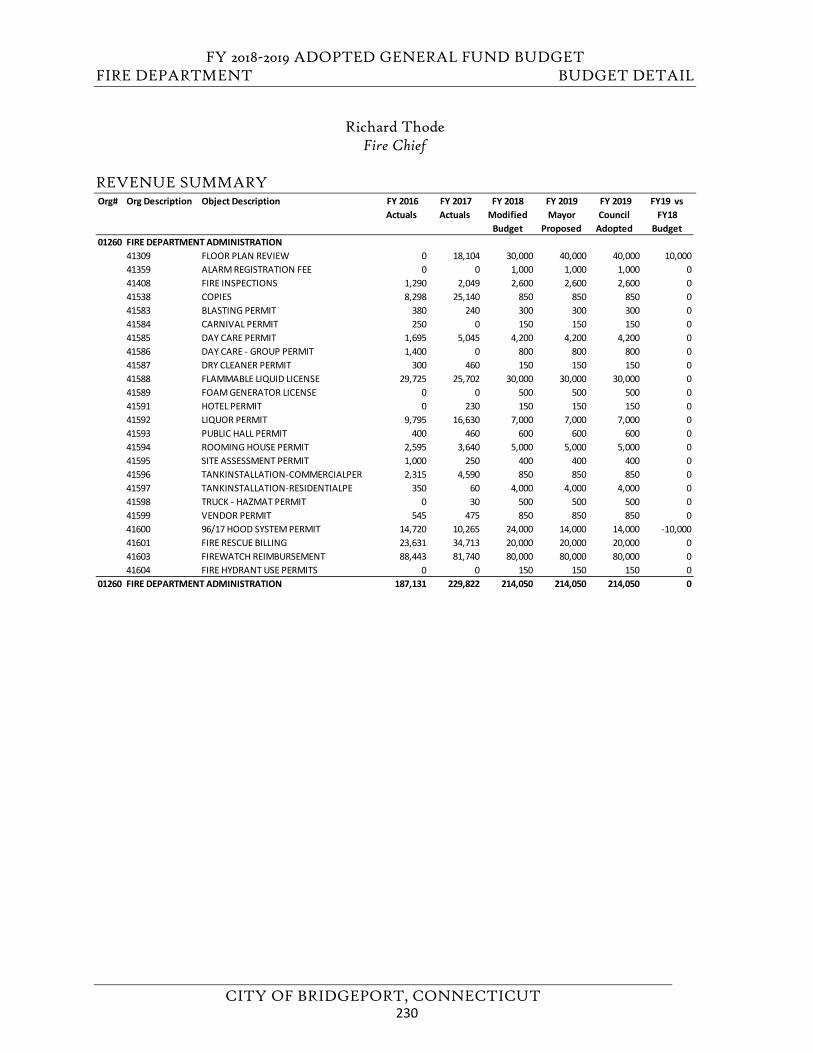
FY 2018-2019 ADOPTED GENERAL FUND BUDGET FIRE DEPARTMENT BUDGET DETAIL
CITY OF BRIDGEPORT, CONNECTICUT
Richard Thode Fire Chief
REVENUE SUMMARY Org# Org Description Object Description FY 2016
Actuals FY 2017 Actuals
FY 2018 Modified
Budget
FY 2019 Mayor
Proposed
FY 2019 Council
Adopted
FY19 vs FY18
Budget01260 FIRE DEPARTMENT ADMINISTRATION
41309 FLOOR PLAN REVIEW 0 18,104 30,000 40,000 40,000 10,00041359 ALARM REGISTRATION FEE 0 0 1,000 1,000 1,000 041408 FIRE INSPECTIONS 1,290 2,049 2,600 2,600 2,600 041538 COPIES 8,298 25,140 850 850 850 041583 BLASTING PERMIT 380 240 300 300 300 041584 CARNIVAL PERMIT 250 0 150 150 150 041585 DAY CARE PERMIT 1,695 5,045 4,200 4,200 4,200 041586 DAY CARE - GROUP PERMIT 1,400 0 800 800 800 041587 DRY CLEANER PERMIT 300 460 150 150 150 041588 FLAMMABLE LIQUID LICENSE 29,725 25,702 30,000 30,000 30,000 041589 FOAM GENERATOR LICENSE 0 0 500 500 500 041591 HOTEL PERMIT 0 230 150 150 150 041592 LIQUOR PERMIT 9,795 16,630 7,000 7,000 7,000 041593 PUBLIC HALL PERMIT 400 460 600 600 600 041594 ROOMING HOUSE PERMIT 2,595 3,640 5,000 5,000 5,000 041595 SITE ASSESSMENT PERMIT 1,000 250 400 400 400 041596 TANKINSTALLATION-COMMERCIALPER 2,315 4,590 850 850 850 041597 TANKINSTALLATION-RESIDENTIALPE 350 60 4,000 4,000 4,000 041598 TRUCK - HAZMAT PERMIT 0 30 500 500 500 041599 VENDOR PERMIT 545 475 850 850 850 041600 96/17 HOOD SYSTEM PERMIT 14,720 10,265 24,000 14,000 14,000 -10,00041601 FIRE RESCUE BILLING 23,631 34,713 20,000 20,000 20,000 041603 FIREWATCH REIMBURSEMENT 88,443 81,740 80,000 80,000 80,000 041604 FIRE HYDRANT USE PERMITS 0 0 150 150 150 0
01260 FIRE DEPARTMENT ADMINISTRATION 187,131 229,822 214,050 214,050 214,050 0
230
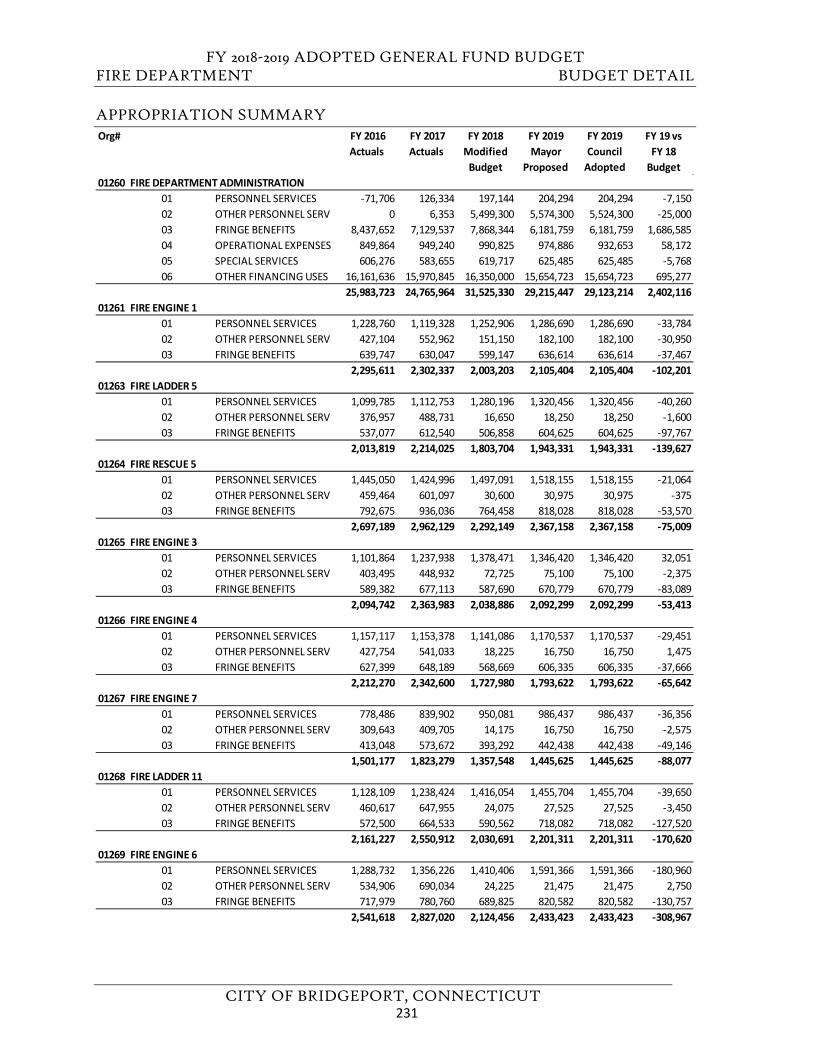
FY 2018-2019 ADOPTED GENERAL FUND BUDGET FIRE DEPARTMENT BUDGET DETAIL
CITY OF BRIDGEPORT, CONNECTICUT
APPROPRIATION SUMMARY Org# FY 2016
Actuals FY 2017 Actuals
FY 2018 Modified
Budget
FY 2019 Mayor
Proposed
FY 2019 Council
Adopted
FY 19 vs FY 18
Budget01260 FIRE DEPARTMENT ADMINISTRATION
01 PERSONNEL SERVICES -71,706 126,334 197,144 204,294 204,294 -7,15002 OTHER PERSONNEL SERV 0 6,353 5,499,300 5,574,300 5,524,300 -25,00003 FRINGE BENEFITS 8,437,652 7,129,537 7,868,344 6,181,759 6,181,759 1,686,58504 OPERATIONAL EXPENSES 849,864 949,240 990,825 974,886 932,653 58,17205 SPECIAL SERVICES 606,276 583,655 619,717 625,485 625,485 -5,76806 OTHER FINANCING USES 16,161,636 15,970,845 16,350,000 15,654,723 15,654,723 695,277
25,983,723 24,765,964 31,525,330 29,215,447 29,123,214 2,402,11601261 FIRE ENGINE 1
01 PERSONNEL SERVICES 1,228,760 1,119,328 1,252,906 1,286,690 1,286,690 -33,78402 OTHER PERSONNEL SERV 427,104 552,962 151,150 182,100 182,100 -30,95003 FRINGE BENEFITS 639,747 630,047 599,147 636,614 636,614 -37,467
2,295,611 2,302,337 2,003,203 2,105,404 2,105,404 -102,20101263 FIRE LADDER 5
01 PERSONNEL SERVICES 1,099,785 1,112,753 1,280,196 1,320,456 1,320,456 -40,26002 OTHER PERSONNEL SERV 376,957 488,731 16,650 18,250 18,250 -1,60003 FRINGE BENEFITS 537,077 612,540 506,858 604,625 604,625 -97,767
2,013,819 2,214,025 1,803,704 1,943,331 1,943,331 -139,62701264 FIRE RESCUE 5
01 PERSONNEL SERVICES 1,445,050 1,424,996 1,497,091 1,518,155 1,518,155 -21,06402 OTHER PERSONNEL SERV 459,464 601,097 30,600 30,975 30,975 -37503 FRINGE BENEFITS 792,675 936,036 764,458 818,028 818,028 -53,570
2,697,189 2,962,129 2,292,149 2,367,158 2,367,158 -75,00901265 FIRE ENGINE 3
01 PERSONNEL SERVICES 1,101,864 1,237,938 1,378,471 1,346,420 1,346,420 32,05102 OTHER PERSONNEL SERV 403,495 448,932 72,725 75,100 75,100 -2,37503 FRINGE BENEFITS 589,382 677,113 587,690 670,779 670,779 -83,089
2,094,742 2,363,983 2,038,886 2,092,299 2,092,299 -53,41301266 FIRE ENGINE 4
01 PERSONNEL SERVICES 1,157,117 1,153,378 1,141,086 1,170,537 1,170,537 -29,45102 OTHER PERSONNEL SERV 427,754 541,033 18,225 16,750 16,750 1,47503 FRINGE BENEFITS 627,399 648,189 568,669 606,335 606,335 -37,666
2,212,270 2,342,600 1,727,980 1,793,622 1,793,622 -65,64201267 FIRE ENGINE 7
01 PERSONNEL SERVICES 778,486 839,902 950,081 986,437 986,437 -36,35602 OTHER PERSONNEL SERV 309,643 409,705 14,175 16,750 16,750 -2,57503 FRINGE BENEFITS 413,048 573,672 393,292 442,438 442,438 -49,146
1,501,177 1,823,279 1,357,548 1,445,625 1,445,625 -88,07701268 FIRE LADDER 11
01 PERSONNEL SERVICES 1,128,109 1,238,424 1,416,054 1,455,704 1,455,704 -39,65002 OTHER PERSONNEL SERV 460,617 647,955 24,075 27,525 27,525 -3,45003 FRINGE BENEFITS 572,500 664,533 590,562 718,082 718,082 -127,520
2,161,227 2,550,912 2,030,691 2,201,311 2,201,311 -170,62001269 FIRE ENGINE 6
01 PERSONNEL SERVICES 1,288,732 1,356,226 1,410,406 1,591,366 1,591,366 -180,96002 OTHER PERSONNEL SERV 534,906 690,034 24,225 21,475 21,475 2,75003 FRINGE BENEFITS 717,979 780,760 689,825 820,582 820,582 -130,757
2,541,618 2,827,020 2,124,456 2,433,423 2,433,423 -308,967
231
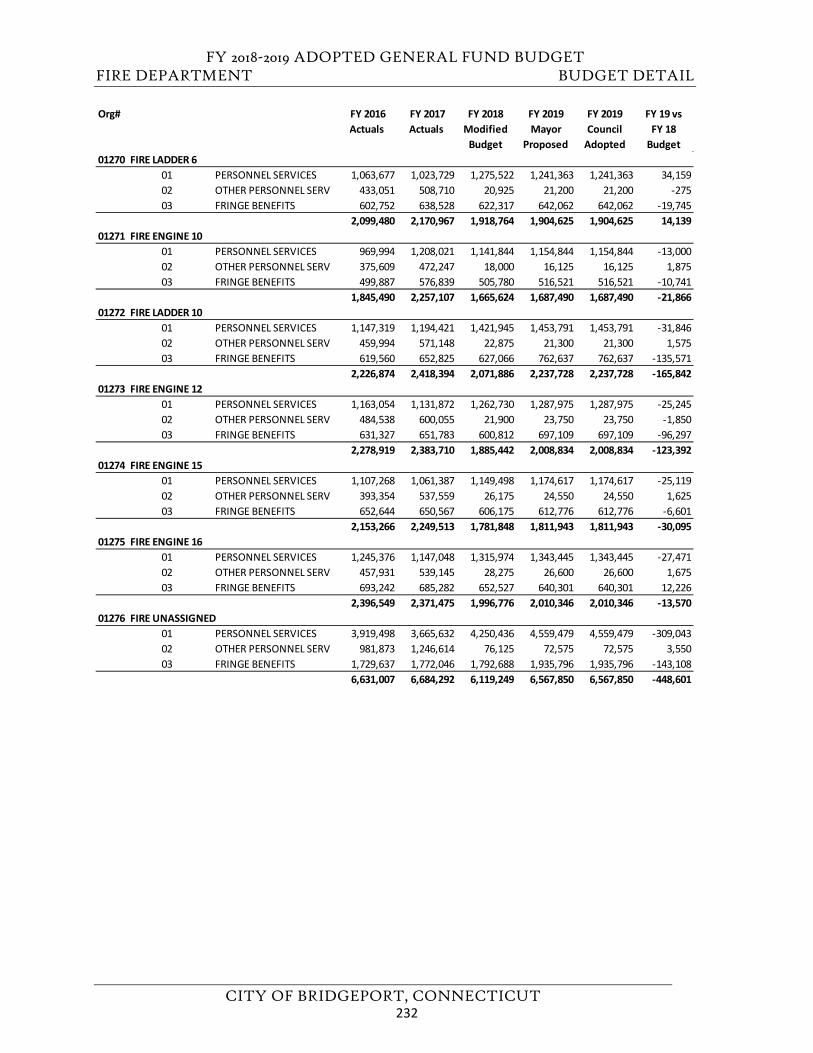
FY 2018-2019 ADOPTED GENERAL FUND BUDGET FIRE DEPARTMENT BUDGET DETAIL
CITY OF BRIDGEPORT, CONNECTICUT
Org# FY 2016 Actuals
FY 2017 Actuals
FY 2018 Modified
Budget
FY 2019 Mayor
Proposed
FY 2019 Council
Adopted
FY 19 vs FY 18
Budget01270 FIRE LADDER 6
01 PERSONNEL SERVICES 1,063,677 1,023,729 1,275,522 1,241,363 1,241,363 34,15902 OTHER PERSONNEL SERV 433,051 508,710 20,925 21,200 21,200 -27503 FRINGE BENEFITS 602,752 638,528 622,317 642,062 642,062 -19,745
2,099,480 2,170,967 1,918,764 1,904,625 1,904,625 14,13901271 FIRE ENGINE 10
01 PERSONNEL SERVICES 969,994 1,208,021 1,141,844 1,154,844 1,154,844 -13,00002 OTHER PERSONNEL SERV 375,609 472,247 18,000 16,125 16,125 1,87503 FRINGE BENEFITS 499,887 576,839 505,780 516,521 516,521 -10,741
1,845,490 2,257,107 1,665,624 1,687,490 1,687,490 -21,86601272 FIRE LADDER 10
01 PERSONNEL SERVICES 1,147,319 1,194,421 1,421,945 1,453,791 1,453,791 -31,84602 OTHER PERSONNEL SERV 459,994 571,148 22,875 21,300 21,300 1,57503 FRINGE BENEFITS 619,560 652,825 627,066 762,637 762,637 -135,571
2,226,874 2,418,394 2,071,886 2,237,728 2,237,728 -165,84201273 FIRE ENGINE 12
01 PERSONNEL SERVICES 1,163,054 1,131,872 1,262,730 1,287,975 1,287,975 -25,24502 OTHER PERSONNEL SERV 484,538 600,055 21,900 23,750 23,750 -1,85003 FRINGE BENEFITS 631,327 651,783 600,812 697,109 697,109 -96,297
2,278,919 2,383,710 1,885,442 2,008,834 2,008,834 -123,39201274 FIRE ENGINE 15
01 PERSONNEL SERVICES 1,107,268 1,061,387 1,149,498 1,174,617 1,174,617 -25,11902 OTHER PERSONNEL SERV 393,354 537,559 26,175 24,550 24,550 1,62503 FRINGE BENEFITS 652,644 650,567 606,175 612,776 612,776 -6,601
2,153,266 2,249,513 1,781,848 1,811,943 1,811,943 -30,09501275 FIRE ENGINE 16
01 PERSONNEL SERVICES 1,245,376 1,147,048 1,315,974 1,343,445 1,343,445 -27,47102 OTHER PERSONNEL SERV 457,931 539,145 28,275 26,600 26,600 1,67503 FRINGE BENEFITS 693,242 685,282 652,527 640,301 640,301 12,226
2,396,549 2,371,475 1,996,776 2,010,346 2,010,346 -13,57001276 FIRE UNASSIGNED
01 PERSONNEL SERVICES 3,919,498 3,665,632 4,250,436 4,559,479 4,559,479 -309,04302 OTHER PERSONNEL SERV 981,873 1,246,614 76,125 72,575 72,575 3,55003 FRINGE BENEFITS 1,729,637 1,772,046 1,792,688 1,935,796 1,935,796 -143,108
6,631,007 6,684,292 6,119,249 6,567,850 6,567,850 -448,601
232
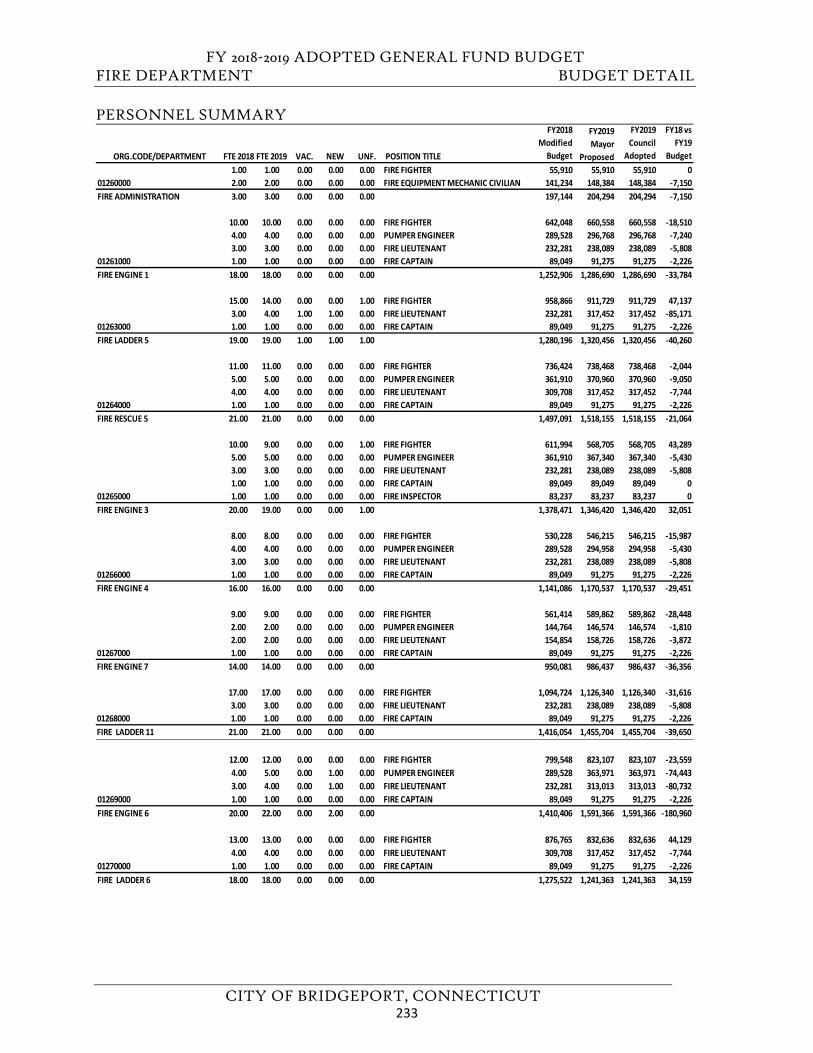
FY 2018-2019 ADOPTED GENERAL FUND BUDGET FIRE DEPARTMENT BUDGET DETAIL
CITY OF BRIDGEPORT, CONNECTICUT
PERSONNEL SUMMARY
ORG.CODE/DEPARTMENT FTE 2018 FTE 2019 VAC. NEW UNF. POSITION TITLE
FY2018 Modified
Budget
FY2019 Mayor
Proposed
FY2019 Council
Adopted
FY18 vs FY19
Budget 1.00 1.00 0.00 0.00 0.00 FIRE FIGHTER 55,910 55,910 55,910 0
01260000 2.00 2.00 0.00 0.00 0.00 FIRE EQUIPMENT MECHANIC CIVILIAN 141,234 148,384 148,384 -7,150FIRE ADMINISTRATION 3.00 3.00 0.00 0.00 0.00 197,144 204,294 204,294 -7,150
10.00 10.00 0.00 0.00 0.00 FIRE FIGHTER 642,048 660,558 660,558 -18,5104.00 4.00 0.00 0.00 0.00 PUMPER ENGINEER 289,528 296,768 296,768 -7,2403.00 3.00 0.00 0.00 0.00 FIRE LIEUTENANT 232,281 238,089 238,089 -5,808
01261000 1.00 1.00 0.00 0.00 0.00 FIRE CAPTAIN 89,049 91,275 91,275 -2,226FIRE ENGINE 1 18.00 18.00 0.00 0.00 0.00 1,252,906 1,286,690 1,286,690 -33,784
15.00 14.00 0.00 0.00 1.00 FIRE FIGHTER 958,866 911,729 911,729 47,1373.00 4.00 1.00 1.00 0.00 FIRE LIEUTENANT 232,281 317,452 317,452 -85,171
01263000 1.00 1.00 0.00 0.00 0.00 FIRE CAPTAIN 89,049 91,275 91,275 -2,226FIRE LADDER 5 19.00 19.00 1.00 1.00 1.00 1,280,196 1,320,456 1,320,456 -40,260
11.00 11.00 0.00 0.00 0.00 FIRE FIGHTER 736,424 738,468 738,468 -2,0445.00 5.00 0.00 0.00 0.00 PUMPER ENGINEER 361,910 370,960 370,960 -9,0504.00 4.00 0.00 0.00 0.00 FIRE LIEUTENANT 309,708 317,452 317,452 -7,744
01264000 1.00 1.00 0.00 0.00 0.00 FIRE CAPTAIN 89,049 91,275 91,275 -2,226FIRE RESCUE 5 21.00 21.00 0.00 0.00 0.00 1,497,091 1,518,155 1,518,155 -21,064
10.00 9.00 0.00 0.00 1.00 FIRE FIGHTER 611,994 568,705 568,705 43,2895.00 5.00 0.00 0.00 0.00 PUMPER ENGINEER 361,910 367,340 367,340 -5,4303.00 3.00 0.00 0.00 0.00 FIRE LIEUTENANT 232,281 238,089 238,089 -5,8081.00 1.00 0.00 0.00 0.00 FIRE CAPTAIN 89,049 89,049 89,049 0
01265000 1.00 1.00 0.00 0.00 0.00 FIRE INSPECTOR 83,237 83,237 83,237 0FIRE ENGINE 3 20.00 19.00 0.00 0.00 1.00 1,378,471 1,346,420 1,346,420 32,051
8.00 8.00 0.00 0.00 0.00 FIRE FIGHTER 530,228 546,215 546,215 -15,9874.00 4.00 0.00 0.00 0.00 PUMPER ENGINEER 289,528 294,958 294,958 -5,4303.00 3.00 0.00 0.00 0.00 FIRE LIEUTENANT 232,281 238,089 238,089 -5,808
01266000 1.00 1.00 0.00 0.00 0.00 FIRE CAPTAIN 89,049 91,275 91,275 -2,226FIRE ENGINE 4 16.00 16.00 0.00 0.00 0.00 1,141,086 1,170,537 1,170,537 -29,451
9.00 9.00 0.00 0.00 0.00 FIRE FIGHTER 561,414 589,862 589,862 -28,4482.00 2.00 0.00 0.00 0.00 PUMPER ENGINEER 144,764 146,574 146,574 -1,8102.00 2.00 0.00 0.00 0.00 FIRE LIEUTENANT 154,854 158,726 158,726 -3,872
01267000 1.00 1.00 0.00 0.00 0.00 FIRE CAPTAIN 89,049 91,275 91,275 -2,226FIRE ENGINE 7 14.00 14.00 0.00 0.00 0.00 950,081 986,437 986,437 -36,356
17.00 17.00 0.00 0.00 0.00 FIRE FIGHTER 1,094,724 1,126,340 1,126,340 -31,6163.00 3.00 0.00 0.00 0.00 FIRE LIEUTENANT 232,281 238,089 238,089 -5,808
01268000 1.00 1.00 0.00 0.00 0.00 FIRE CAPTAIN 89,049 91,275 91,275 -2,226FIRE LADDER 11 21.00 21.00 0.00 0.00 0.00 1,416,054 1,455,704 1,455,704 -39,650
12.00 12.00 0.00 0.00 0.00 FIRE FIGHTER 799,548 823,107 823,107 -23,5594.00 5.00 0.00 1.00 0.00 PUMPER ENGINEER 289,528 363,971 363,971 -74,4433.00 4.00 0.00 1.00 0.00 FIRE LIEUTENANT 232,281 313,013 313,013 -80,732
01269000 1.00 1.00 0.00 0.00 0.00 FIRE CAPTAIN 89,049 91,275 91,275 -2,226FIRE ENGINE 6 20.00 22.00 0.00 2.00 0.00 1,410,406 1,591,366 1,591,366 -180,960
13.00 13.00 0.00 0.00 0.00 FIRE FIGHTER 876,765 832,636 832,636 44,1294.00 4.00 0.00 0.00 0.00 FIRE LIEUTENANT 309,708 317,452 317,452 -7,744
01270000 1.00 1.00 0.00 0.00 0.00 FIRE CAPTAIN 89,049 91,275 91,275 -2,226FIRE LADDER 6 18.00 18.00 0.00 0.00 0.00 1,275,522 1,241,363 1,241,363 34,159
233
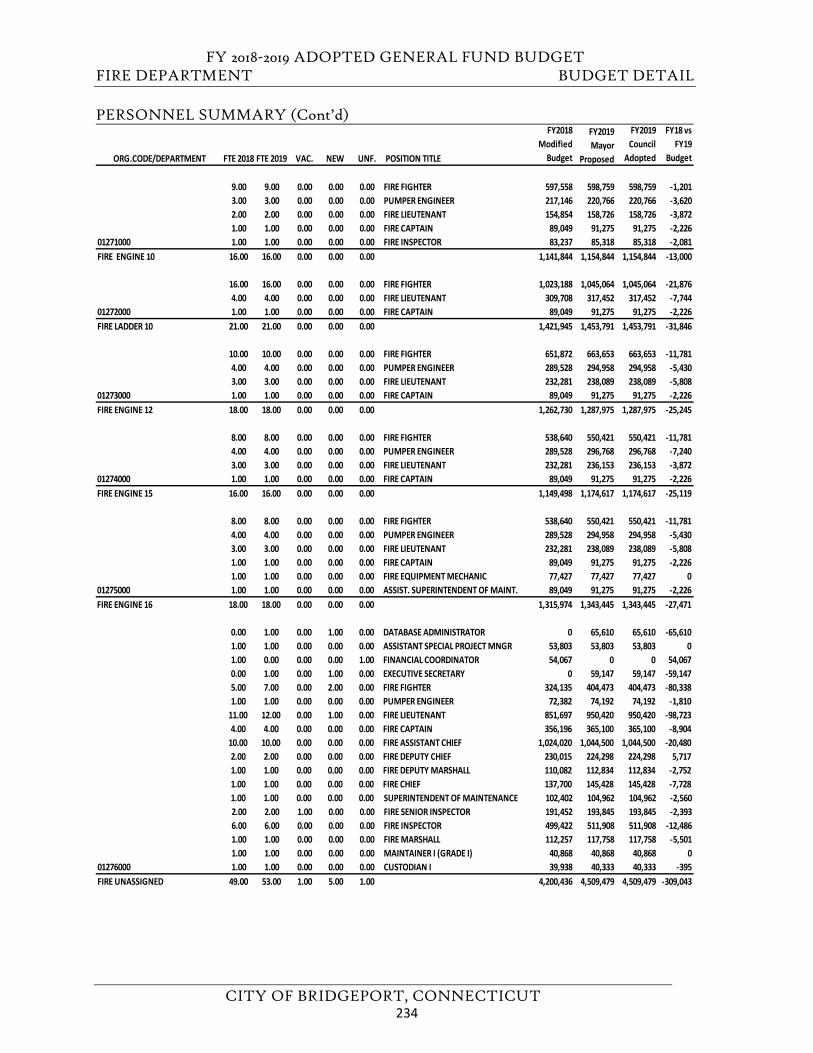
FY 2018-2019 ADOPTED GENERAL FUND BUDGET FIRE DEPARTMENT BUDGET DETAIL
CITY OF BRIDGEPORT, CONNECTICUT
PERSONNEL SUMMARY (Cont’d)
ORG.CODE/DEPARTMENT FTE 2018 FTE 2019 VAC. NEW UNF. POSITION TITLE
FY2018 Modified
Budget
FY2019 Mayor
Proposed
FY2019 Council
Adopted
FY18 vs FY19
Budget
9.00 9.00 0.00 0.00 0.00 FIRE FIGHTER 597,558 598,759 598,759 -1,2013.00 3.00 0.00 0.00 0.00 PUMPER ENGINEER 217,146 220,766 220,766 -3,6202.00 2.00 0.00 0.00 0.00 FIRE LIEUTENANT 154,854 158,726 158,726 -3,8721.00 1.00 0.00 0.00 0.00 FIRE CAPTAIN 89,049 91,275 91,275 -2,226
01271000 1.00 1.00 0.00 0.00 0.00 FIRE INSPECTOR 83,237 85,318 85,318 -2,081FIRE ENGINE 10 16.00 16.00 0.00 0.00 0.00 1,141,844 1,154,844 1,154,844 -13,000
16.00 16.00 0.00 0.00 0.00 FIRE FIGHTER 1,023,188 1,045,064 1,045,064 -21,8764.00 4.00 0.00 0.00 0.00 FIRE LIEUTENANT 309,708 317,452 317,452 -7,744
01272000 1.00 1.00 0.00 0.00 0.00 FIRE CAPTAIN 89,049 91,275 91,275 -2,226FIRE LADDER 10 21.00 21.00 0.00 0.00 0.00 1,421,945 1,453,791 1,453,791 -31,846
10.00 10.00 0.00 0.00 0.00 FIRE FIGHTER 651,872 663,653 663,653 -11,7814.00 4.00 0.00 0.00 0.00 PUMPER ENGINEER 289,528 294,958 294,958 -5,4303.00 3.00 0.00 0.00 0.00 FIRE LIEUTENANT 232,281 238,089 238,089 -5,808
01273000 1.00 1.00 0.00 0.00 0.00 FIRE CAPTAIN 89,049 91,275 91,275 -2,226FIRE ENGINE 12 18.00 18.00 0.00 0.00 0.00 1,262,730 1,287,975 1,287,975 -25,245
8.00 8.00 0.00 0.00 0.00 FIRE FIGHTER 538,640 550,421 550,421 -11,7814.00 4.00 0.00 0.00 0.00 PUMPER ENGINEER 289,528 296,768 296,768 -7,2403.00 3.00 0.00 0.00 0.00 FIRE LIEUTENANT 232,281 236,153 236,153 -3,872
01274000 1.00 1.00 0.00 0.00 0.00 FIRE CAPTAIN 89,049 91,275 91,275 -2,226FIRE ENGINE 15 16.00 16.00 0.00 0.00 0.00 1,149,498 1,174,617 1,174,617 -25,119
8.00 8.00 0.00 0.00 0.00 FIRE FIGHTER 538,640 550,421 550,421 -11,7814.00 4.00 0.00 0.00 0.00 PUMPER ENGINEER 289,528 294,958 294,958 -5,4303.00 3.00 0.00 0.00 0.00 FIRE LIEUTENANT 232,281 238,089 238,089 -5,8081.00 1.00 0.00 0.00 0.00 FIRE CAPTAIN 89,049 91,275 91,275 -2,2261.00 1.00 0.00 0.00 0.00 FIRE EQUIPMENT MECHANIC 77,427 77,427 77,427 0
01275000 1.00 1.00 0.00 0.00 0.00 ASSIST. SUPERINTENDENT OF MAINT. 89,049 91,275 91,275 -2,226FIRE ENGINE 16 18.00 18.00 0.00 0.00 0.00 1,315,974 1,343,445 1,343,445 -27,471
0.00 1.00 0.00 1.00 0.00 DATABASE ADMINISTRATOR 0 65,610 65,610 -65,6101.00 1.00 0.00 0.00 0.00 ASSISTANT SPECIAL PROJECT MNGR 53,803 53,803 53,803 01.00 0.00 0.00 0.00 1.00 FINANCIAL COORDINATOR 54,067 0 0 54,0670.00 1.00 0.00 1.00 0.00 EXECUTIVE SECRETARY 0 59,147 59,147 -59,1475.00 7.00 0.00 2.00 0.00 FIRE FIGHTER 324,135 404,473 404,473 -80,3381.00 1.00 0.00 0.00 0.00 PUMPER ENGINEER 72,382 74,192 74,192 -1,810
11.00 12.00 0.00 1.00 0.00 FIRE LIEUTENANT 851,697 950,420 950,420 -98,7234.00 4.00 0.00 0.00 0.00 FIRE CAPTAIN 356,196 365,100 365,100 -8,904
10.00 10.00 0.00 0.00 0.00 FIRE ASSISTANT CHIEF 1,024,020 1,044,500 1,044,500 -20,4802.00 2.00 0.00 0.00 0.00 FIRE DEPUTY CHIEF 230,015 224,298 224,298 5,7171.00 1.00 0.00 0.00 0.00 FIRE DEPUTY MARSHALL 110,082 112,834 112,834 -2,7521.00 1.00 0.00 0.00 0.00 FIRE CHIEF 137,700 145,428 145,428 -7,7281.00 1.00 0.00 0.00 0.00 SUPERINTENDENT OF MAINTENANCE 102,402 104,962 104,962 -2,5602.00 2.00 1.00 0.00 0.00 FIRE SENIOR INSPECTOR 191,452 193,845 193,845 -2,3936.00 6.00 0.00 0.00 0.00 FIRE INSPECTOR 499,422 511,908 511,908 -12,4861.00 1.00 0.00 0.00 0.00 FIRE MARSHALL 112,257 117,758 117,758 -5,5011.00 1.00 0.00 0.00 0.00 MAINTAINER I (GRADE I) 40,868 40,868 40,868 0
01276000 1.00 1.00 0.00 0.00 0.00 CUSTODIAN I 39,938 40,333 40,333 -395FIRE UNASSIGNED 49.00 53.00 1.00 5.00 1.00 4,200,436 4,509,479 4,509,479 -309,043
234
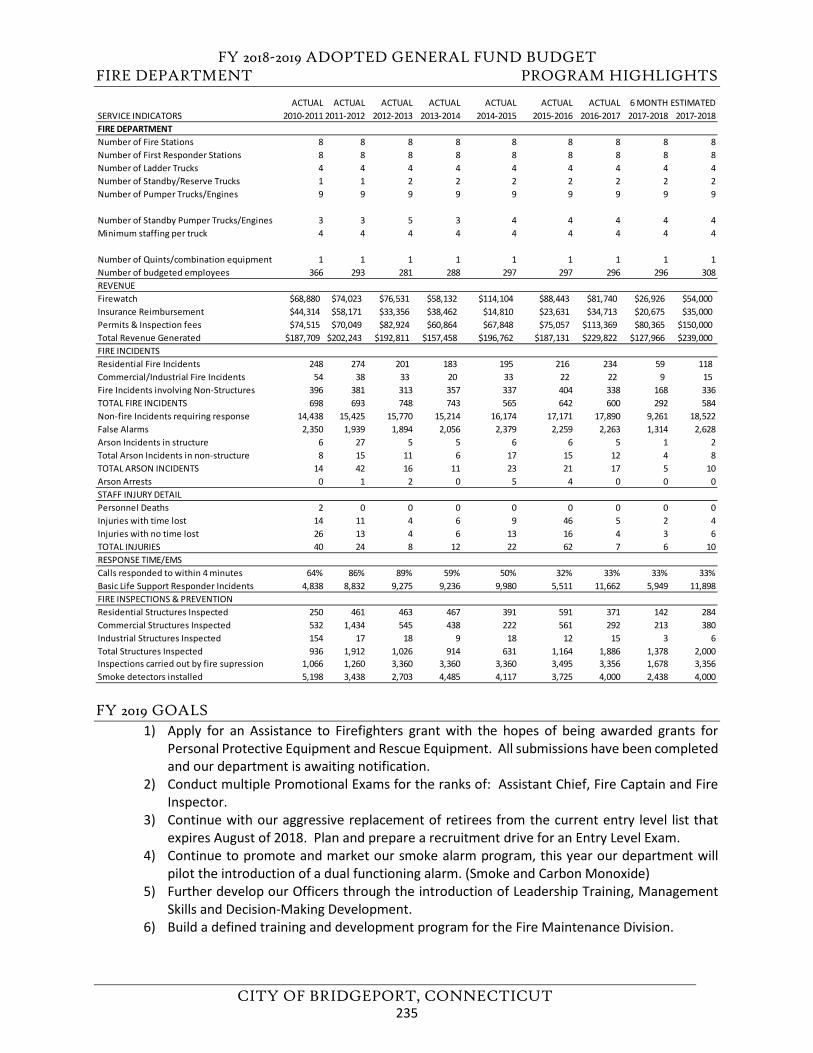
FY 2018-2019 ADOPTED GENERAL FUND BUDGET FIRE DEPARTMENT PROGRAM HIGHLIGHTS
CITY OF BRIDGEPORT, CONNECTICUT
FY 2019 GOALS 1) Apply for an Assistance to Firefighters grant with the hopes of being awarded grants for
Personal Protective Equipment and Rescue Equipment. All submissions have been completedand our department is awaiting notification.
2) Conduct multiple Promotional Exams for the ranks of: Assistant Chief, Fire Captain and FireInspector.
3) Continue with our aggressive replacement of retirees from the current entry level list thatexpires August of 2018. Plan and prepare a recruitment drive for an Entry Level Exam.
4) Continue to promote and market our smoke alarm program, this year our department willpilot the introduction of a dual functioning alarm. (Smoke and Carbon Monoxide)
5) Further develop our Officers through the introduction of Leadership Training, ManagementSkills and Decision-Making Development.
6) Build a defined training and development program for the Fire Maintenance Division.
ACTUAL ACTUAL ACTUAL ACTUAL ACTUAL ACTUAL ACTUAL 6 MONTH ESTIMATEDSERVICE INDICATORS 2010-2011 2011-2012 2012-2013 2013-2014 2014-2015 2015-2016 2016-2017 2017-2018 2017-2018FIRE DEPARTMENTNumber of Fire Stations 8 8 8 8 8 8 8 8 8Number of First Responder Stations 8 8 8 8 8 8 8 8 8Number of Ladder Trucks 4 4 4 4 4 4 4 4 4Number of Standby/Reserve Trucks 1 1 2 2 2 2 2 2 2Number of Pumper Trucks/Engines 9 9 9 9 9 9 9 9 9
Number of Standby Pumper Trucks/Engines 3 3 5 3 4 4 4 4 4Minimum staffing per truck 4 4 4 4 4 4 4 4 4
Number of Quints/combination equipment 1 1 1 1 1 1 1 1 1Number of budgeted employees 366 293 281 288 297 297 296 296 308REVENUEFirewatch $68,880 $74,023 $76,531 $58,132 $114,104 $88,443 $81,740 $26,926 $54,000Insurance Reimbursement $44,314 $58,171 $33,356 $38,462 $14,810 $23,631 $34,713 $20,675 $35,000Permits & Inspection fees $74,515 $70,049 $82,924 $60,864 $67,848 $75,057 $113,369 $80,365 $150,000Total Revenue Generated $187,709 $202,243 $192,811 $157,458 $196,762 $187,131 $229,822 $127,966 $239,000FIRE INCIDENTSResidential Fire Incidents 248 274 201 183 195 216 234 59 118Commercial/Industrial Fire Incidents 54 38 33 20 33 22 22 9 15Fire Incidents involving Non-Structures 396 381 313 357 337 404 338 168 336TOTAL FIRE INCIDENTS 698 693 748 743 565 642 600 292 584Non-fire Incidents requiring response 14,438 15,425 15,770 15,214 16,174 17,171 17,890 9,261 18,522False Alarms 2,350 1,939 1,894 2,056 2,379 2,259 2,263 1,314 2,628Arson Incidents in structure 6 27 5 5 6 6 5 1 2Total Arson Incidents in non-structure 8 15 11 6 17 15 12 4 8TOTAL ARSON INCIDENTS 14 42 16 11 23 21 17 5 10Arson Arrests 0 1 2 0 5 4 0 0 0STAFF INJURY DETAILPersonnel Deaths 2 0 0 0 0 0 0 0 0Injuries with time lost 14 11 4 6 9 46 5 2 4Injuries with no time lost 26 13 4 6 13 16 4 3 6TOTAL INJURIES 40 24 8 12 22 62 7 6 10RESPONSE TIME/EMSCalls responded to within 4 minutes 64% 86% 89% 59% 50% 32% 33% 33% 33%Basic Life Support Responder Incidents 4,838 8,832 9,275 9,236 9,980 5,511 11,662 5,949 11,898FIRE INSPECTIONS & PREVENTIONResidential Structures Inspected 250 461 463 467 391 591 371 142 284Commercial Structures Inspected 532 1,434 545 438 222 561 292 213 380Industrial Structures Inspected 154 17 18 9 18 12 15 3 6Total Structures Inspected 936 1,912 1,026 914 631 1,164 1,886 1,378 2,000Inspections carried out by fire supression 1,066 1,260 3,360 3,360 3,360 3,495 3,356 1,678 3,356Smoke detectors installed 5,198 3,438 2,703 4,485 4,117 3,725 4,000 2,438 4,000
235
FY 2018-2019 ADOPTED GENERAL FUND BUDGET FIRE DEPARTMENT PROGRAM HIGHLIGHTS
CITY OF BRIDGEPORT, CONNECTICUT
7) Increase the manpower of the Fire Prevention Bureau with 6 new Fire Inspectors and ensurethe Prevention Bureau is successfully using a mobile technology to increase efficiency.
8) Ensure the cooperation and involvement of the Fire Prevention Bureau in the streamlining ofcity agencies as they relate to technology.
9) Finish the implementation of Nexgen CAD software and ensure all support products arefunctional.
10) Introduce RFID technology for the tracking of equipment and ensure that the information istranslated to the proper RMS.
11) Work with the Mayor’s Office to continue to develop the Fire Department section of thewebpage to assist constituents in finding informational needs from our organization.
12) Support the Fire Prevention Bureau with specialized training to create a more efficient andeffective workflow.
FY 2018 GOAL STATUS
1) Seek Capital funding to replace a Fire Aerial Ladder / Pumper, Engine #16, Quint. This vehicleis a 1996 Pierce Quint which is twenty years old with high engine hours / mileage. An AFGgrant application was also submitted seeking funding for this project.6 MONTH STATUS: The AFG grant was denied for this apparatus but capital funds were
approved and allocated for this unit. The unit has been ordered and should arrive in late fallof 2018.
2) Seek Capital funding to replace four aging ancillary staff vehicles. Three of these vehicles are2007 Ford Explorers with over 100,000 miles and the other vehicle is a 2002 Minivan with high mileage.6 MONTH STATUS: Two of these vehicles are ordered and will be placed into service in early
spring of 2018.
3) Apply for an Assistance to Firefighters Grant with the hopes of being awarded grants forHealth and Wellness, Safety Equipment, and a Fire Apparatus. All submissions have beenmade and our department is awaiting notification.6 MONTH STATUS: Our department received two awards: 1 for equipment Bauer Compressor
and 1 for Health and Wellness. Equipment and training for both awards have been completed.
4) Conduct multiple Promotional Exams for the ranks of: Deputy Chief, Fire Marshal, Asst. Chief,and Fire Inspector.6 MONTH STATUS: The Promotional Exams for Deputy Chief and the Fire Marshal are complete and the exams for Assistant Chief and Fire Inspector are in the planning stage.
5) Continue with our aggressive replacement of retirees from the current entry level list. Thiswill aid in efforts to diminish overtime expenditures.6 MONTH STATUS: We have hired a total of 15 recruits this fiscal year and are operating nearfull strength.
6) Continue to promote and market our smoke alarm program, this year our department willpilot the introduction of a dual functioning alarm. (Smoke and Carbon Monoxide)
236
FY 2018-2019 ADOPTED GENERAL FUND BUDGET FIRE DEPARTMENT PROGRAM HIGHLIGHTS
CITY OF BRIDGEPORT, CONNECTICUT
6 MONTH STATUS: The smoke alarm program is continuing to be very successful with another 2500 smoke installed to date in FY2018. The introduction of Carbon Monoxide Alarms has started with a pilot of units being carried on fire apparatus for installs at emergency scenes.
7) Introduce online refresher training for annual required training: Emergency Medical,Hazardous Material and OSHA training. In addition, introduce Public Fire and Life SafetyEducator training for the company officers.6 MONTH STATUS: The department is introducing online Medical Training as a pilot programin calendar year 2018. In addition, the department is hosting Public Fire and Life SafetyEducator I through the CT Fire Academy in November of 2018.
8) Continue to build relationships with other city departments to create a greater level ofinteroperability and all hazard planning.6 MONTH STATUS: Our department continues to be a key member of the planning andimplementation of groups associated to Public Safety.
9) Start to build a comprehensive 5-year department plan forecasting the need for replacingpersonnel and equipment.6 MONTH STATUS: Information is being gathered and as it relates to our larger cost assets forthe creation of a department working document.
10) The department has created an IT working group to meet the technological goals of theorganization. The current projects include a change in dispatch software, upgrading the FleetManagement and computer based training.6 MONTH STATUS: The department has trained a few members in our RMS to assist in thefurther use of the product. In addition, the department has played a significant role in theimplementation of the new dispatch software.
FY 2018 ADDITIONAL ACCOMPLISHMENTS 1) The Bridgeport Fire Department received two AFG Grants from FEMA. One Grant was for Health
and Wellness and the other was for an Air Compressor. Both projects have been implemented.2) Implemented a new Fire Station Alerting System. This system was paid for by the 2005 COPS
grant.3) RYASAP along with members from the Fire Marshal Bureau, continue to conduct Fire Safety
education in the Bridgeport Elementary Schools by administering the Masters of Disastercurriculum that is centered on a series of lesson plans that help educate children about theimportance of Fire Prevention and Safety.
4) Our department acquired a Military Surplus Vehicle for evacuations and response during highwater incidents and large amounts of snowfall.
5) We have started some initial Officer Development training with the promotion of a class of newLieutenants, Leadership training for the Command Staff.
6) Additional training and monitoring of the data being submitted to our RMS has taken place. Thishas resulted in a minor increase in revenue from Fire/Rescue Billing.
7) We have instituted a weekly staff meeting with the command staff to create bettercommunication throughout the department at all levels.
8) Our department has worked to increase our digital presents. Our Facebook, Twitter, and city webpage content is regularly updated and has become a great tool to interface with our constituents.
237
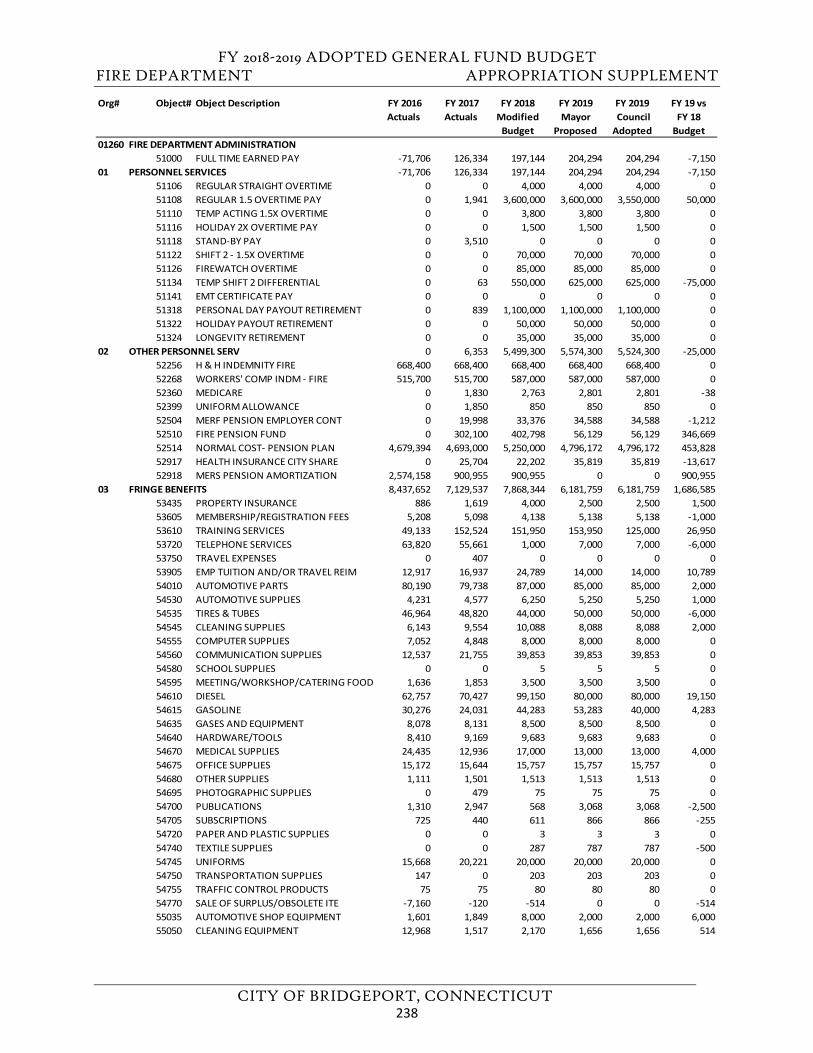
FY 2018-2019 ADOPTED GENERAL FUND BUDGET FIRE DEPARTMENT APPROPRIATION SUPPLEMENT
CITY OF BRIDGEPORT, CONNECTICUT
Org# Object# Object Description FY 2016 Actuals
FY 2017 Actuals
FY 2018 Modified
Budget
FY 2019Mayor
Proposed
FY 2019 Council Adopted
FY 19 vs FY 18
Budget01260 FIRE DEPARTMENT ADMINISTRATION
51000 FULL TIME EARNED PAY -71,706 126,334 197,144 204,294 204,294 -7,15001 PERSONNEL SERVICES -71,706 126,334 197,144 204,294 204,294 -7,150
51106 REGULAR STRAIGHT OVERTIME 0 0 4,000 4,000 4,000 051108 REGULAR 1.5 OVERTIME PAY 0 1,941 3,600,000 3,600,000 3,550,000 50,00051110 TEMP ACTING 1.5X OVERTIME 0 0 3,800 3,800 3,800 051116 HOLIDAY 2X OVERTIME PAY 0 0 1,500 1,500 1,500 051118 STAND-BY PAY 0 3,510 0 0 0 051122 SHIFT 2 - 1.5X OVERTIME 0 0 70,000 70,000 70,000 051126 FIREWATCH OVERTIME 0 0 85,000 85,000 85,000 051134 TEMP SHIFT 2 DIFFERENTIAL 0 63 550,000 625,000 625,000 -75,00051141 EMT CERTIFICATE PAY 0 0 0 0 0 051318 PERSONAL DAY PAYOUT RETIREMENT 0 839 1,100,000 1,100,000 1,100,000 051322 HOLIDAY PAYOUT RETIREMENT 0 0 50,000 50,000 50,000 051324 LONGEVITY RETIREMENT 0 0 35,000 35,000 35,000 0
02 OTHER PERSONNEL SERV 0 6,353 5,499,300 5,574,300 5,524,300 -25,00052256 H & H INDEMNITY FIRE 668,400 668,400 668,400 668,400 668,400 052268 WORKERS' COMP INDM - FIRE 515,700 515,700 587,000 587,000 587,000 052360 MEDICARE 0 1,830 2,763 2,801 2,801 -3852399 UNIFORM ALLOWANCE 0 1,850 850 850 850 052504 MERF PENSION EMPLOYER CONT 0 19,998 33,376 34,588 34,588 -1,21252510 FIRE PENSION FUND 0 302,100 402,798 56,129 56,129 346,66952514 NORMAL COST- PENSION PLAN 4,679,394 4,693,000 5,250,000 4,796,172 4,796,172 453,82852917 HEALTH INSURANCE CITY SHARE 0 25,704 22,202 35,819 35,819 -13,61752918 MERS PENSION AMORTIZATION 2,574,158 900,955 900,955 0 0 900,955
03 FRINGE BENEFITS 8,437,652 7,129,537 7,868,344 6,181,759 6,181,759 1,686,58553435 PROPERTY INSURANCE 886 1,619 4,000 2,500 2,500 1,50053605 MEMBERSHIP/REGISTRATION FEES 5,208 5,098 4,138 5,138 5,138 -1,00053610 TRAINING SERVICES 49,133 152,524 151,950 153,950 125,000 26,95053720 TELEPHONE SERVICES 63,820 55,661 1,000 7,000 7,000 -6,00053750 TRAVEL EXPENSES 0 407 0 0 0 053905 EMP TUITION AND/OR TRAVEL REIM 12,917 16,937 24,789 14,000 14,000 10,78954010 AUTOMOTIVE PARTS 80,190 79,738 87,000 85,000 85,000 2,00054530 AUTOMOTIVE SUPPLIES 4,231 4,577 6,250 5,250 5,250 1,00054535 TIRES & TUBES 46,964 48,820 44,000 50,000 50,000 -6,00054545 CLEANING SUPPLIES 6,143 9,554 10,088 8,088 8,088 2,00054555 COMPUTER SUPPLIES 7,052 4,848 8,000 8,000 8,000 054560 COMMUNICATION SUPPLIES 12,537 21,755 39,853 39,853 39,853 054580 SCHOOL SUPPLIES 0 0 5 5 5 054595 MEETING/WORKSHOP/CATERING FOOD 1,636 1,853 3,500 3,500 3,500 054610 DIESEL 62,757 70,427 99,150 80,000 80,000 19,15054615 GASOLINE 30,276 24,031 44,283 53,283 40,000 4,28354635 GASES AND EQUIPMENT 8,078 8,131 8,500 8,500 8,500 054640 HARDWARE/TOOLS 8,410 9,169 9,683 9,683 9,683 054670 MEDICAL SUPPLIES 24,435 12,936 17,000 13,000 13,000 4,00054675 OFFICE SUPPLIES 15,172 15,644 15,757 15,757 15,757 054680 OTHER SUPPLIES 1,111 1,501 1,513 1,513 1,513 054695 PHOTOGRAPHIC SUPPLIES 0 479 75 75 75 054700 PUBLICATIONS 1,310 2,947 568 3,068 3,068 -2,50054705 SUBSCRIPTIONS 725 440 611 866 866 -25554720 PAPER AND PLASTIC SUPPLIES 0 0 3 3 3 054740 TEXTILE SUPPLIES 0 0 287 787 787 -50054745 UNIFORMS 15,668 20,221 20,000 20,000 20,000 054750 TRANSPORTATION SUPPLIES 147 0 203 203 203 054755 TRAFFIC CONTROL PRODUCTS 75 75 80 80 80 054770 SALE OF SURPLUS/OBSOLETE ITE -7,160 -120 -514 0 0 -51455035 AUTOMOTIVE SHOP EQUIPMENT 1,601 1,849 8,000 2,000 2,000 6,00055050 CLEANING EQUIPMENT 12,968 1,517 2,170 1,656 1,656 514
238
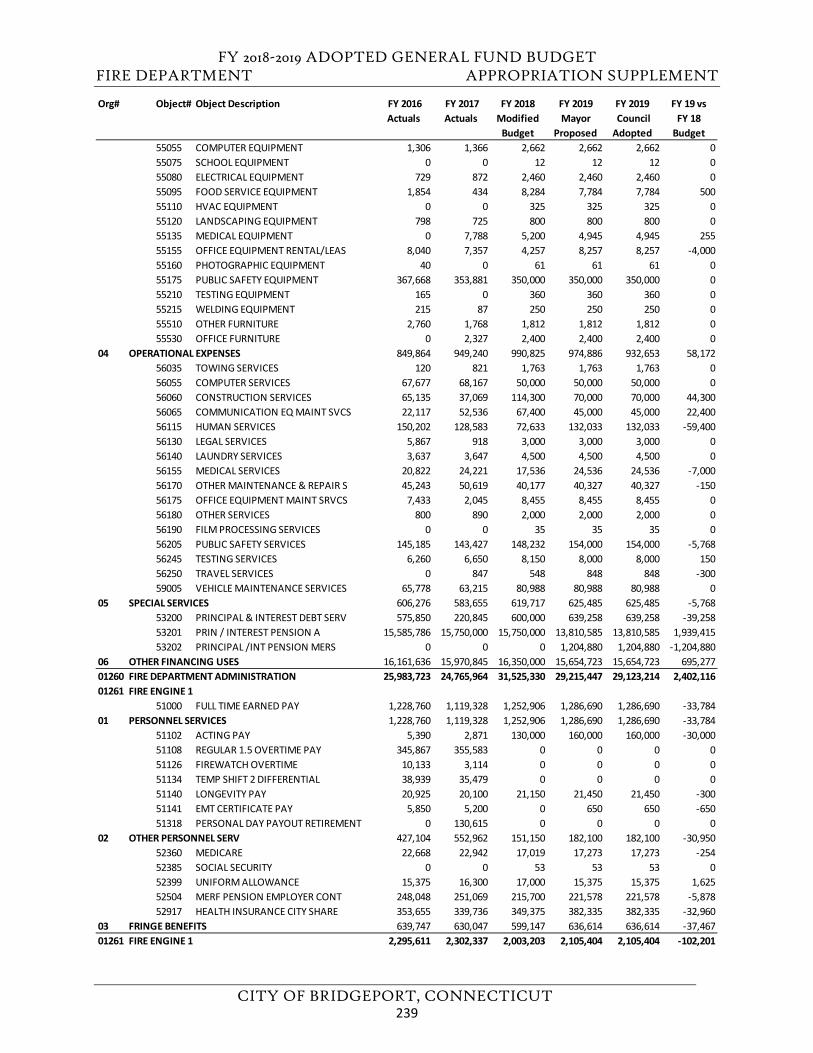
FY 2018-2019 ADOPTED GENERAL FUND BUDGET FIRE DEPARTMENT APPROPRIATION SUPPLEMENT
CITY OF BRIDGEPORT, CONNECTICUT
Org# Object# Object Description FY 2016 Actuals
FY 2017 Actuals
FY 2018 Modified
Budget
FY 2019Mayor
Proposed
FY 2019 Council Adopted
FY 19 vs FY 18
Budget55055 COMPUTER EQUIPMENT 1,306 1,366 2,662 2,662 2,662 055075 SCHOOL EQUIPMENT 0 0 12 12 12 055080 ELECTRICAL EQUIPMENT 729 872 2,460 2,460 2,460 055095 FOOD SERVICE EQUIPMENT 1,854 434 8,284 7,784 7,784 50055110 HVAC EQUIPMENT 0 0 325 325 325 055120 LANDSCAPING EQUIPMENT 798 725 800 800 800 055135 MEDICAL EQUIPMENT 0 7,788 5,200 4,945 4,945 25555155 OFFICE EQUIPMENT RENTAL/LEAS 8,040 7,357 4,257 8,257 8,257 -4,00055160 PHOTOGRAPHIC EQUIPMENT 40 0 61 61 61 055175 PUBLIC SAFETY EQUIPMENT 367,668 353,881 350,000 350,000 350,000 055210 TESTING EQUIPMENT 165 0 360 360 360 055215 WELDING EQUIPMENT 215 87 250 250 250 055510 OTHER FURNITURE 2,760 1,768 1,812 1,812 1,812 055530 OFFICE FURNITURE 0 2,327 2,400 2,400 2,400 0
04 OPERATIONAL EXPENSES 849,864 949,240 990,825 974,886 932,653 58,17256035 TOWING SERVICES 120 821 1,763 1,763 1,763 056055 COMPUTER SERVICES 67,677 68,167 50,000 50,000 50,000 056060 CONSTRUCTION SERVICES 65,135 37,069 114,300 70,000 70,000 44,30056065 COMMUNICATION EQ MAINT SVCS 22,117 52,536 67,400 45,000 45,000 22,40056115 HUMAN SERVICES 150,202 128,583 72,633 132,033 132,033 -59,40056130 LEGAL SERVICES 5,867 918 3,000 3,000 3,000 056140 LAUNDRY SERVICES 3,637 3,647 4,500 4,500 4,500 056155 MEDICAL SERVICES 20,822 24,221 17,536 24,536 24,536 -7,00056170 OTHER MAINTENANCE & REPAIR S 45,243 50,619 40,177 40,327 40,327 -15056175 OFFICE EQUIPMENT MAINT SRVCS 7,433 2,045 8,455 8,455 8,455 056180 OTHER SERVICES 800 890 2,000 2,000 2,000 056190 FILM PROCESSING SERVICES 0 0 35 35 35 056205 PUBLIC SAFETY SERVICES 145,185 143,427 148,232 154,000 154,000 -5,76856245 TESTING SERVICES 6,260 6,650 8,150 8,000 8,000 15056250 TRAVEL SERVICES 0 847 548 848 848 -30059005 VEHICLE MAINTENANCE SERVICES 65,778 63,215 80,988 80,988 80,988 0
05 SPECIAL SERVICES 606,276 583,655 619,717 625,485 625,485 -5,76853200 PRINCIPAL & INTEREST DEBT SERV 575,850 220,845 600,000 639,258 639,258 -39,25853201 PRIN / INTEREST PENSION A 15,585,786 15,750,000 15,750,000 13,810,585 13,810,585 1,939,41553202 PRINCIPAL /INT PENSION MERS 0 0 0 1,204,880 1,204,880 -1,204,880
06 OTHER FINANCING USES 16,161,636 15,970,845 16,350,000 15,654,723 15,654,723 695,27701260 FIRE DEPARTMENT ADMINISTRATION 25,983,723 24,765,964 31,525,330 29,215,447 29,123,214 2,402,11601261 FIRE ENGINE 1
51000 FULL TIME EARNED PAY 1,228,760 1,119,328 1,252,906 1,286,690 1,286,690 -33,78401 PERSONNEL SERVICES 1,228,760 1,119,328 1,252,906 1,286,690 1,286,690 -33,784
51102 ACTING PAY 5,390 2,871 130,000 160,000 160,000 -30,00051108 REGULAR 1.5 OVERTIME PAY 345,867 355,583 0 0 0 051126 FIREWATCH OVERTIME 10,133 3,114 0 0 0 051134 TEMP SHIFT 2 DIFFERENTIAL 38,939 35,479 0 0 0 051140 LONGEVITY PAY 20,925 20,100 21,150 21,450 21,450 -30051141 EMT CERTIFICATE PAY 5,850 5,200 0 650 650 -65051318 PERSONAL DAY PAYOUT RETIREMENT 0 130,615 0 0 0 0
02 OTHER PERSONNEL SERV 427,104 552,962 151,150 182,100 182,100 -30,95052360 MEDICARE 22,668 22,942 17,019 17,273 17,273 -25452385 SOCIAL SECURITY 0 0 53 53 53 052399 UNIFORM ALLOWANCE 15,375 16,300 17,000 15,375 15,375 1,62552504 MERF PENSION EMPLOYER CONT 248,048 251,069 215,700 221,578 221,578 -5,87852917 HEALTH INSURANCE CITY SHARE 353,655 339,736 349,375 382,335 382,335 -32,960
03 FRINGE BENEFITS 639,747 630,047 599,147 636,614 636,614 -37,46701261 FIRE ENGINE 1 2,295,611 2,302,337 2,003,203 2,105,404 2,105,404 -102,201
239
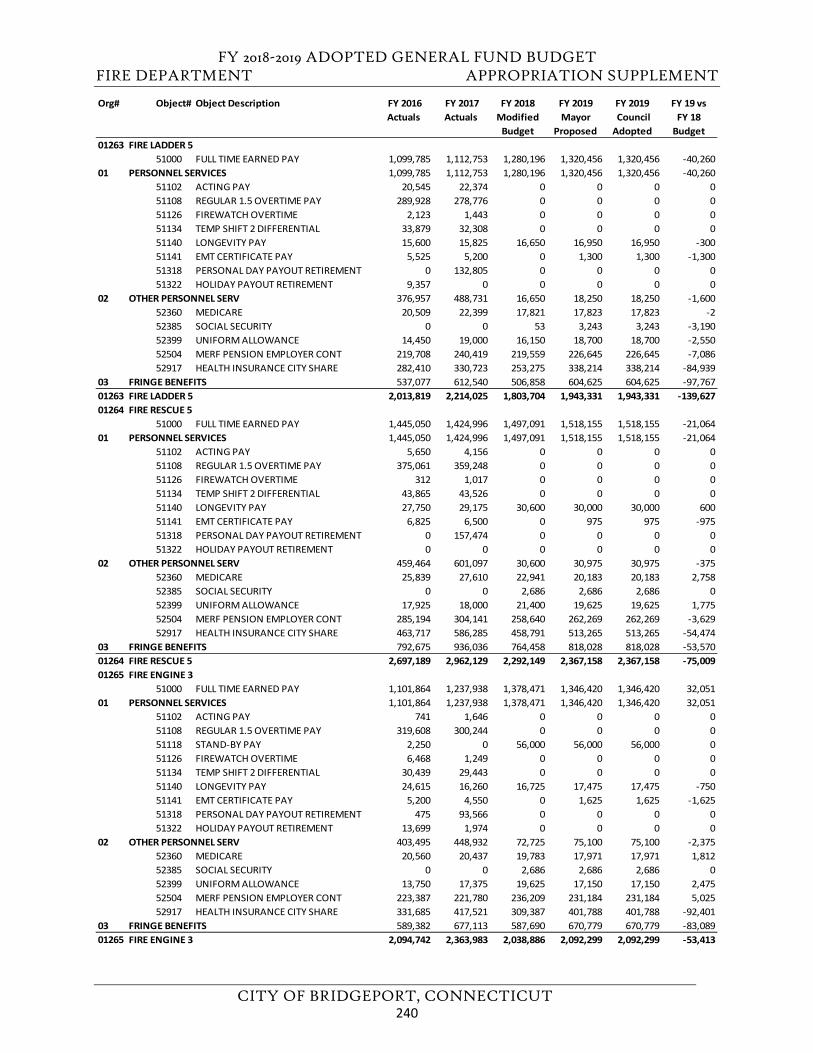
FY 2018-2019 ADOPTED GENERAL FUND BUDGET FIRE DEPARTMENT APPROPRIATION SUPPLEMENT
CITY OF BRIDGEPORT, CONNECTICUT
Org# Object# Object Description FY 2016 Actuals
FY 2017 Actuals
FY 2018 Modified
Budget
FY 2019Mayor
Proposed
FY 2019 Council Adopted
FY 19 vs FY 18
Budget01263 FIRE LADDER 5
51000 FULL TIME EARNED PAY 1,099,785 1,112,753 1,280,196 1,320,456 1,320,456 -40,26001 PERSONNEL SERVICES 1,099,785 1,112,753 1,280,196 1,320,456 1,320,456 -40,260
51102 ACTING PAY 20,545 22,374 0 0 0 051108 REGULAR 1.5 OVERTIME PAY 289,928 278,776 0 0 0 051126 FIREWATCH OVERTIME 2,123 1,443 0 0 0 051134 TEMP SHIFT 2 DIFFERENTIAL 33,879 32,308 0 0 0 051140 LONGEVITY PAY 15,600 15,825 16,650 16,950 16,950 -30051141 EMT CERTIFICATE PAY 5,525 5,200 0 1,300 1,300 -1,30051318 PERSONAL DAY PAYOUT RETIREMENT 0 132,805 0 0 0 051322 HOLIDAY PAYOUT RETIREMENT 9,357 0 0 0 0 0
02 OTHER PERSONNEL SERV 376,957 488,731 16,650 18,250 18,250 -1,60052360 MEDICARE 20,509 22,399 17,821 17,823 17,823 -252385 SOCIAL SECURITY 0 0 53 3,243 3,243 -3,19052399 UNIFORM ALLOWANCE 14,450 19,000 16,150 18,700 18,700 -2,55052504 MERF PENSION EMPLOYER CONT 219,708 240,419 219,559 226,645 226,645 -7,08652917 HEALTH INSURANCE CITY SHARE 282,410 330,723 253,275 338,214 338,214 -84,939
03 FRINGE BENEFITS 537,077 612,540 506,858 604,625 604,625 -97,76701263 FIRE LADDER 5 2,013,819 2,214,025 1,803,704 1,943,331 1,943,331 -139,62701264 FIRE RESCUE 5
51000 FULL TIME EARNED PAY 1,445,050 1,424,996 1,497,091 1,518,155 1,518,155 -21,06401 PERSONNEL SERVICES 1,445,050 1,424,996 1,497,091 1,518,155 1,518,155 -21,064
51102 ACTING PAY 5,650 4,156 0 0 0 051108 REGULAR 1.5 OVERTIME PAY 375,061 359,248 0 0 0 051126 FIREWATCH OVERTIME 312 1,017 0 0 0 051134 TEMP SHIFT 2 DIFFERENTIAL 43,865 43,526 0 0 0 051140 LONGEVITY PAY 27,750 29,175 30,600 30,000 30,000 60051141 EMT CERTIFICATE PAY 6,825 6,500 0 975 975 -97551318 PERSONAL DAY PAYOUT RETIREMENT 0 157,474 0 0 0 051322 HOLIDAY PAYOUT RETIREMENT 0 0 0 0 0 0
02 OTHER PERSONNEL SERV 459,464 601,097 30,600 30,975 30,975 -37552360 MEDICARE 25,839 27,610 22,941 20,183 20,183 2,75852385 SOCIAL SECURITY 0 0 2,686 2,686 2,686 052399 UNIFORM ALLOWANCE 17,925 18,000 21,400 19,625 19,625 1,77552504 MERF PENSION EMPLOYER CONT 285,194 304,141 258,640 262,269 262,269 -3,62952917 HEALTH INSURANCE CITY SHARE 463,717 586,285 458,791 513,265 513,265 -54,474
03 FRINGE BENEFITS 792,675 936,036 764,458 818,028 818,028 -53,57001264 FIRE RESCUE 5 2,697,189 2,962,129 2,292,149 2,367,158 2,367,158 -75,00901265 FIRE ENGINE 3
51000 FULL TIME EARNED PAY 1,101,864 1,237,938 1,378,471 1,346,420 1,346,420 32,05101 PERSONNEL SERVICES 1,101,864 1,237,938 1,378,471 1,346,420 1,346,420 32,051
51102 ACTING PAY 741 1,646 0 0 0 051108 REGULAR 1.5 OVERTIME PAY 319,608 300,244 0 0 0 051118 STAND-BY PAY 2,250 0 56,000 56,000 56,000 051126 FIREWATCH OVERTIME 6,468 1,249 0 0 0 051134 TEMP SHIFT 2 DIFFERENTIAL 30,439 29,443 0 0 0 051140 LONGEVITY PAY 24,615 16,260 16,725 17,475 17,475 -75051141 EMT CERTIFICATE PAY 5,200 4,550 0 1,625 1,625 -1,62551318 PERSONAL DAY PAYOUT RETIREMENT 475 93,566 0 0 0 051322 HOLIDAY PAYOUT RETIREMENT 13,699 1,974 0 0 0 0
02 OTHER PERSONNEL SERV 403,495 448,932 72,725 75,100 75,100 -2,37552360 MEDICARE 20,560 20,437 19,783 17,971 17,971 1,81252385 SOCIAL SECURITY 0 0 2,686 2,686 2,686 052399 UNIFORM ALLOWANCE 13,750 17,375 19,625 17,150 17,150 2,47552504 MERF PENSION EMPLOYER CONT 223,387 221,780 236,209 231,184 231,184 5,02552917 HEALTH INSURANCE CITY SHARE 331,685 417,521 309,387 401,788 401,788 -92,401
03 FRINGE BENEFITS 589,382 677,113 587,690 670,779 670,779 -83,08901265 FIRE ENGINE 3 2,094,742 2,363,983 2,038,886 2,092,299 2,092,299 -53,413
240
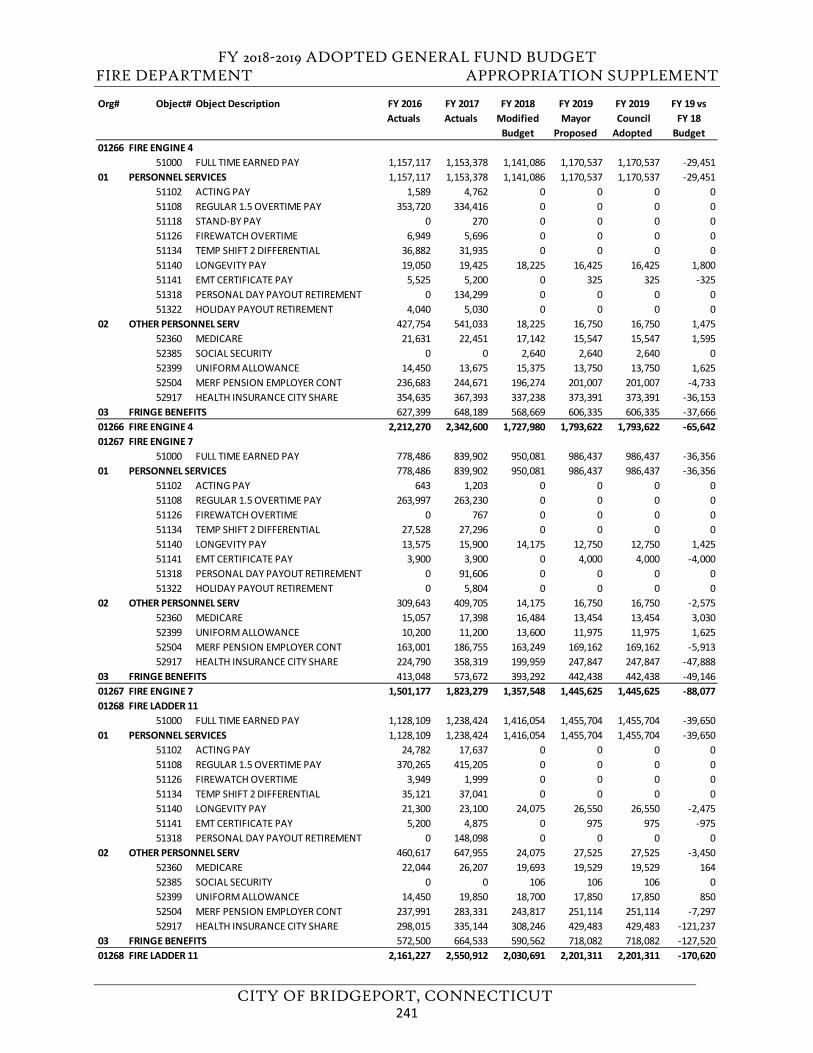
FY 2018-2019 ADOPTED GENERAL FUND BUDGET FIRE DEPARTMENT APPROPRIATION SUPPLEMENT
CITY OF BRIDGEPORT, CONNECTICUT
Org# Object# Object Description FY 2016 Actuals
FY 2017 Actuals
FY 2018 Modified
Budget
FY 2019Mayor
Proposed
FY 2019 Council Adopted
FY 19 vs FY 18
Budget01266 FIRE ENGINE 4
51000 FULL TIME EARNED PAY 1,157,117 1,153,378 1,141,086 1,170,537 1,170,537 -29,45101 PERSONNEL SERVICES 1,157,117 1,153,378 1,141,086 1,170,537 1,170,537 -29,451
51102 ACTING PAY 1,589 4,762 0 0 0 051108 REGULAR 1.5 OVERTIME PAY 353,720 334,416 0 0 0 051118 STAND-BY PAY 0 270 0 0 0 051126 FIREWATCH OVERTIME 6,949 5,696 0 0 0 051134 TEMP SHIFT 2 DIFFERENTIAL 36,882 31,935 0 0 0 051140 LONGEVITY PAY 19,050 19,425 18,225 16,425 16,425 1,80051141 EMT CERTIFICATE PAY 5,525 5,200 0 325 325 -32551318 PERSONAL DAY PAYOUT RETIREMENT 0 134,299 0 0 0 051322 HOLIDAY PAYOUT RETIREMENT 4,040 5,030 0 0 0 0
02 OTHER PERSONNEL SERV 427,754 541,033 18,225 16,750 16,750 1,47552360 MEDICARE 21,631 22,451 17,142 15,547 15,547 1,59552385 SOCIAL SECURITY 0 0 2,640 2,640 2,640 052399 UNIFORM ALLOWANCE 14,450 13,675 15,375 13,750 13,750 1,62552504 MERF PENSION EMPLOYER CONT 236,683 244,671 196,274 201,007 201,007 -4,73352917 HEALTH INSURANCE CITY SHARE 354,635 367,393 337,238 373,391 373,391 -36,153
03 FRINGE BENEFITS 627,399 648,189 568,669 606,335 606,335 -37,66601266 FIRE ENGINE 4 2,212,270 2,342,600 1,727,980 1,793,622 1,793,622 -65,64201267 FIRE ENGINE 7
51000 FULL TIME EARNED PAY 778,486 839,902 950,081 986,437 986,437 -36,35601 PERSONNEL SERVICES 778,486 839,902 950,081 986,437 986,437 -36,356
51102 ACTING PAY 643 1,203 0 0 0 051108 REGULAR 1.5 OVERTIME PAY 263,997 263,230 0 0 0 051126 FIREWATCH OVERTIME 0 767 0 0 0 051134 TEMP SHIFT 2 DIFFERENTIAL 27,528 27,296 0 0 0 051140 LONGEVITY PAY 13,575 15,900 14,175 12,750 12,750 1,42551141 EMT CERTIFICATE PAY 3,900 3,900 0 4,000 4,000 -4,00051318 PERSONAL DAY PAYOUT RETIREMENT 0 91,606 0 0 0 051322 HOLIDAY PAYOUT RETIREMENT 0 5,804 0 0 0 0
02 OTHER PERSONNEL SERV 309,643 409,705 14,175 16,750 16,750 -2,57552360 MEDICARE 15,057 17,398 16,484 13,454 13,454 3,03052399 UNIFORM ALLOWANCE 10,200 11,200 13,600 11,975 11,975 1,62552504 MERF PENSION EMPLOYER CONT 163,001 186,755 163,249 169,162 169,162 -5,91352917 HEALTH INSURANCE CITY SHARE 224,790 358,319 199,959 247,847 247,847 -47,888
03 FRINGE BENEFITS 413,048 573,672 393,292 442,438 442,438 -49,14601267 FIRE ENGINE 7 1,501,177 1,823,279 1,357,548 1,445,625 1,445,625 -88,07701268 FIRE LADDER 11
51000 FULL TIME EARNED PAY 1,128,109 1,238,424 1,416,054 1,455,704 1,455,704 -39,65001 PERSONNEL SERVICES 1,128,109 1,238,424 1,416,054 1,455,704 1,455,704 -39,650
51102 ACTING PAY 24,782 17,637 0 0 0 051108 REGULAR 1.5 OVERTIME PAY 370,265 415,205 0 0 0 051126 FIREWATCH OVERTIME 3,949 1,999 0 0 0 051134 TEMP SHIFT 2 DIFFERENTIAL 35,121 37,041 0 0 0 051140 LONGEVITY PAY 21,300 23,100 24,075 26,550 26,550 -2,47551141 EMT CERTIFICATE PAY 5,200 4,875 0 975 975 -97551318 PERSONAL DAY PAYOUT RETIREMENT 0 148,098 0 0 0 0
02 OTHER PERSONNEL SERV 460,617 647,955 24,075 27,525 27,525 -3,45052360 MEDICARE 22,044 26,207 19,693 19,529 19,529 16452385 SOCIAL SECURITY 0 0 106 106 106 052399 UNIFORM ALLOWANCE 14,450 19,850 18,700 17,850 17,850 85052504 MERF PENSION EMPLOYER CONT 237,991 283,331 243,817 251,114 251,114 -7,29752917 HEALTH INSURANCE CITY SHARE 298,015 335,144 308,246 429,483 429,483 -121,237
03 FRINGE BENEFITS 572,500 664,533 590,562 718,082 718,082 -127,52001268 FIRE LADDER 11 2,161,227 2,550,912 2,030,691 2,201,311 2,201,311 -170,620
241
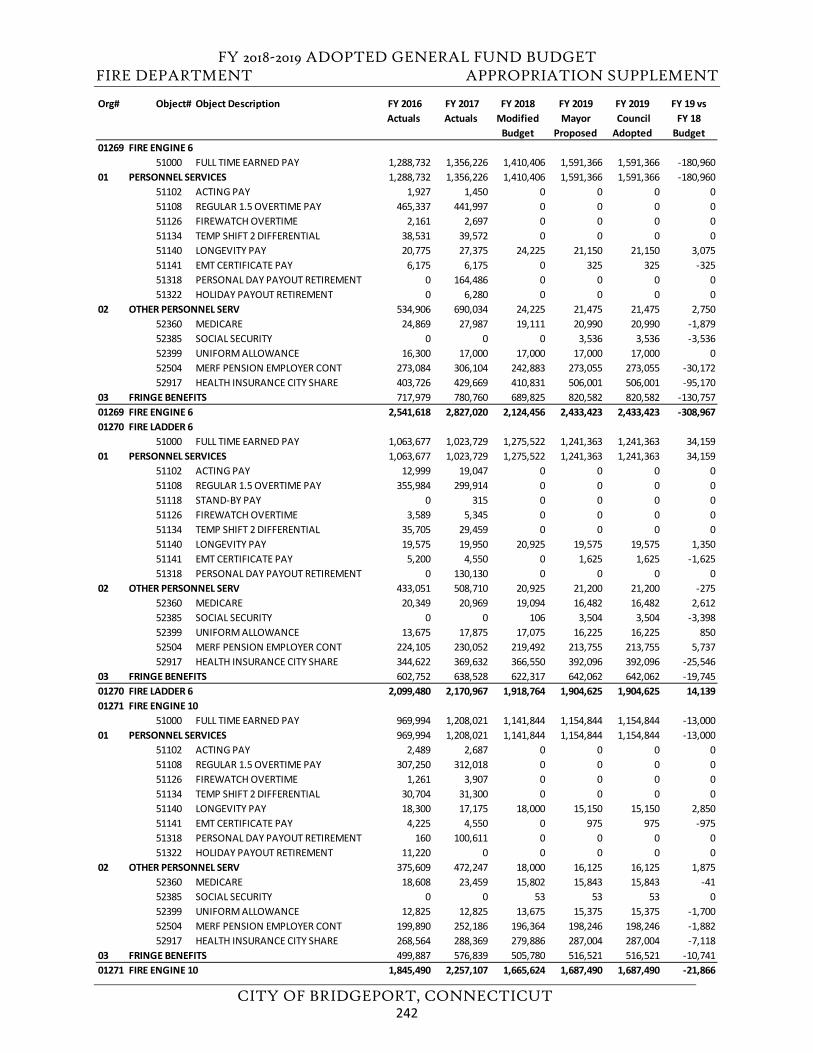
FY 2018-2019 ADOPTED GENERAL FUND BUDGET FIRE DEPARTMENT APPROPRIATION SUPPLEMENT
CITY OF BRIDGEPORT, CONNECTICUT
Org# Object# Object Description FY 2016 Actuals
FY 2017 Actuals
FY 2018 Modified
Budget
FY 2019Mayor
Proposed
FY 2019 Council Adopted
FY 19 vs FY 18
Budget01269 FIRE ENGINE 6
51000 FULL TIME EARNED PAY 1,288,732 1,356,226 1,410,406 1,591,366 1,591,366 -180,96001 PERSONNEL SERVICES 1,288,732 1,356,226 1,410,406 1,591,366 1,591,366 -180,960
51102 ACTING PAY 1,927 1,450 0 0 0 051108 REGULAR 1.5 OVERTIME PAY 465,337 441,997 0 0 0 051126 FIREWATCH OVERTIME 2,161 2,697 0 0 0 051134 TEMP SHIFT 2 DIFFERENTIAL 38,531 39,572 0 0 0 051140 LONGEVITY PAY 20,775 27,375 24,225 21,150 21,150 3,07551141 EMT CERTIFICATE PAY 6,175 6,175 0 325 325 -32551318 PERSONAL DAY PAYOUT RETIREMENT 0 164,486 0 0 0 051322 HOLIDAY PAYOUT RETIREMENT 0 6,280 0 0 0 0
02 OTHER PERSONNEL SERV 534,906 690,034 24,225 21,475 21,475 2,75052360 MEDICARE 24,869 27,987 19,111 20,990 20,990 -1,87952385 SOCIAL SECURITY 0 0 0 3,536 3,536 -3,53652399 UNIFORM ALLOWANCE 16,300 17,000 17,000 17,000 17,000 052504 MERF PENSION EMPLOYER CONT 273,084 306,104 242,883 273,055 273,055 -30,17252917 HEALTH INSURANCE CITY SHARE 403,726 429,669 410,831 506,001 506,001 -95,170
03 FRINGE BENEFITS 717,979 780,760 689,825 820,582 820,582 -130,75701269 FIRE ENGINE 6 2,541,618 2,827,020 2,124,456 2,433,423 2,433,423 -308,96701270 FIRE LADDER 6
51000 FULL TIME EARNED PAY 1,063,677 1,023,729 1,275,522 1,241,363 1,241,363 34,15901 PERSONNEL SERVICES 1,063,677 1,023,729 1,275,522 1,241,363 1,241,363 34,159
51102 ACTING PAY 12,999 19,047 0 0 0 051108 REGULAR 1.5 OVERTIME PAY 355,984 299,914 0 0 0 051118 STAND-BY PAY 0 315 0 0 0 051126 FIREWATCH OVERTIME 3,589 5,345 0 0 0 051134 TEMP SHIFT 2 DIFFERENTIAL 35,705 29,459 0 0 0 051140 LONGEVITY PAY 19,575 19,950 20,925 19,575 19,575 1,35051141 EMT CERTIFICATE PAY 5,200 4,550 0 1,625 1,625 -1,62551318 PERSONAL DAY PAYOUT RETIREMENT 0 130,130 0 0 0 0
02 OTHER PERSONNEL SERV 433,051 508,710 20,925 21,200 21,200 -27552360 MEDICARE 20,349 20,969 19,094 16,482 16,482 2,61252385 SOCIAL SECURITY 0 0 106 3,504 3,504 -3,39852399 UNIFORM ALLOWANCE 13,675 17,875 17,075 16,225 16,225 85052504 MERF PENSION EMPLOYER CONT 224,105 230,052 219,492 213,755 213,755 5,73752917 HEALTH INSURANCE CITY SHARE 344,622 369,632 366,550 392,096 392,096 -25,546
03 FRINGE BENEFITS 602,752 638,528 622,317 642,062 642,062 -19,74501270 FIRE LADDER 6 2,099,480 2,170,967 1,918,764 1,904,625 1,904,625 14,13901271 FIRE ENGINE 10
51000 FULL TIME EARNED PAY 969,994 1,208,021 1,141,844 1,154,844 1,154,844 -13,00001 PERSONNEL SERVICES 969,994 1,208,021 1,141,844 1,154,844 1,154,844 -13,000
51102 ACTING PAY 2,489 2,687 0 0 0 051108 REGULAR 1.5 OVERTIME PAY 307,250 312,018 0 0 0 051126 FIREWATCH OVERTIME 1,261 3,907 0 0 0 051134 TEMP SHIFT 2 DIFFERENTIAL 30,704 31,300 0 0 0 051140 LONGEVITY PAY 18,300 17,175 18,000 15,150 15,150 2,85051141 EMT CERTIFICATE PAY 4,225 4,550 0 975 975 -97551318 PERSONAL DAY PAYOUT RETIREMENT 160 100,611 0 0 0 051322 HOLIDAY PAYOUT RETIREMENT 11,220 0 0 0 0 0
02 OTHER PERSONNEL SERV 375,609 472,247 18,000 16,125 16,125 1,87552360 MEDICARE 18,608 23,459 15,802 15,843 15,843 -4152385 SOCIAL SECURITY 0 0 53 53 53 052399 UNIFORM ALLOWANCE 12,825 12,825 13,675 15,375 15,375 -1,70052504 MERF PENSION EMPLOYER CONT 199,890 252,186 196,364 198,246 198,246 -1,88252917 HEALTH INSURANCE CITY SHARE 268,564 288,369 279,886 287,004 287,004 -7,118
03 FRINGE BENEFITS 499,887 576,839 505,780 516,521 516,521 -10,74101271 FIRE ENGINE 10 1,845,490 2,257,107 1,665,624 1,687,490 1,687,490 -21,866
242

FY 2018-2019 ADOPTED GENERAL FUND BUDGET FIRE DEPARTMENT APPROPRIATION SUPPLEMENT
CITY OF BRIDGEPORT, CONNECTICUT
Org# Object# Object Description FY 2016 Actuals
FY 2017 Actuals
FY 2018 Modified
Budget
FY 2019Mayor
Proposed
FY 2019 Council Adopted
FY 19 vs FY 18
Budget01269 FIRE ENGINE 6
51000 FULL TIME EARNED PAY 1,288,732 1,356,226 1,410,406 1,591,366 1,591,366 -180,96001 PERSONNEL SERVICES 1,288,732 1,356,226 1,410,406 1,591,366 1,591,366 -180,960
51102 ACTING PAY 1,927 1,450 0 0 0 051108 REGULAR 1.5 OVERTIME PAY 465,337 441,997 0 0 0 051126 FIREWATCH OVERTIME 2,161 2,697 0 0 0 051134 TEMP SHIFT 2 DIFFERENTIAL 38,531 39,572 0 0 0 051140 LONGEVITY PAY 20,775 27,375 24,225 21,150 21,150 3,07551141 EMT CERTIFICATE PAY 6,175 6,175 0 325 325 -32551318 PERSONAL DAY PAYOUT RETIREMENT 0 164,486 0 0 0 051322 HOLIDAY PAYOUT RETIREMENT 0 6,280 0 0 0 0
02 OTHER PERSONNEL SERV 534,906 690,034 24,225 21,475 21,475 2,75052360 MEDICARE 24,869 27,987 19,111 20,990 20,990 -1,87952385 SOCIAL SECURITY 0 0 0 3,536 3,536 -3,53652399 UNIFORM ALLOWANCE 16,300 17,000 17,000 17,000 17,000 052504 MERF PENSION EMPLOYER CONT 273,084 306,104 242,883 273,055 273,055 -30,17252917 HEALTH INSURANCE CITY SHARE 403,726 429,669 410,831 506,001 506,001 -95,170
03 FRINGE BENEFITS 717,979 780,760 689,825 820,582 820,582 -130,75701269 FIRE ENGINE 6 2,541,618 2,827,020 2,124,456 2,433,423 2,433,423 -308,96701270 FIRE LADDER 6
51000 FULL TIME EARNED PAY 1,063,677 1,023,729 1,275,522 1,241,363 1,241,363 34,15901 PERSONNEL SERVICES 1,063,677 1,023,729 1,275,522 1,241,363 1,241,363 34,159
51102 ACTING PAY 12,999 19,047 0 0 0 051108 REGULAR 1.5 OVERTIME PAY 355,984 299,914 0 0 0 051118 STAND-BY PAY 0 315 0 0 0 051126 FIREWATCH OVERTIME 3,589 5,345 0 0 0 051134 TEMP SHIFT 2 DIFFERENTIAL 35,705 29,459 0 0 0 051140 LONGEVITY PAY 19,575 19,950 20,925 19,575 19,575 1,35051141 EMT CERTIFICATE PAY 5,200 4,550 0 1,625 1,625 -1,62551318 PERSONAL DAY PAYOUT RETIREMENT 0 130,130 0 0 0 0
02 OTHER PERSONNEL SERV 433,051 508,710 20,925 21,200 21,200 -27552360 MEDICARE 20,349 20,969 19,094 16,482 16,482 2,61252385 SOCIAL SECURITY 0 0 106 3,504 3,504 -3,39852399 UNIFORM ALLOWANCE 13,675 17,875 17,075 16,225 16,225 85052504 MERF PENSION EMPLOYER CONT 224,105 230,052 219,492 213,755 213,755 5,73752917 HEALTH INSURANCE CITY SHARE 344,622 369,632 366,550 392,096 392,096 -25,546
03 FRINGE BENEFITS 602,752 638,528 622,317 642,062 642,062 -19,74501270 FIRE LADDER 6 2,099,480 2,170,967 1,918,764 1,904,625 1,904,625 14,13901271 FIRE ENGINE 10
51000 FULL TIME EARNED PAY 969,994 1,208,021 1,141,844 1,154,844 1,154,844 -13,00001 PERSONNEL SERVICES 969,994 1,208,021 1,141,844 1,154,844 1,154,844 -13,000
51102 ACTING PAY 2,489 2,687 0 0 0 051108 REGULAR 1.5 OVERTIME PAY 307,250 312,018 0 0 0 051126 FIREWATCH OVERTIME 1,261 3,907 0 0 0 051134 TEMP SHIFT 2 DIFFERENTIAL 30,704 31,300 0 0 0 051140 LONGEVITY PAY 18,300 17,175 18,000 15,150 15,150 2,85051141 EMT CERTIFICATE PAY 4,225 4,550 0 975 975 -97551318 PERSONAL DAY PAYOUT RETIREMENT 160 100,611 0 0 0 051322 HOLIDAY PAYOUT RETIREMENT 11,220 0 0 0 0 0
02 OTHER PERSONNEL SERV 375,609 472,247 18,000 16,125 16,125 1,87552360 MEDICARE 18,608 23,459 15,802 15,843 15,843 -4152385 SOCIAL SECURITY 0 0 53 53 53 052399 UNIFORM ALLOWANCE 12,825 12,825 13,675 15,375 15,375 -1,70052504 MERF PENSION EMPLOYER CONT 199,890 252,186 196,364 198,246 198,246 -1,88252917 HEALTH INSURANCE CITY SHARE 268,564 288,369 279,886 287,004 287,004 -7,118
03 FRINGE BENEFITS 499,887 576,839 505,780 516,521 516,521 -10,74101271 FIRE ENGINE 10 1,845,490 2,257,107 1,665,624 1,687,490 1,687,490 -21,866
243
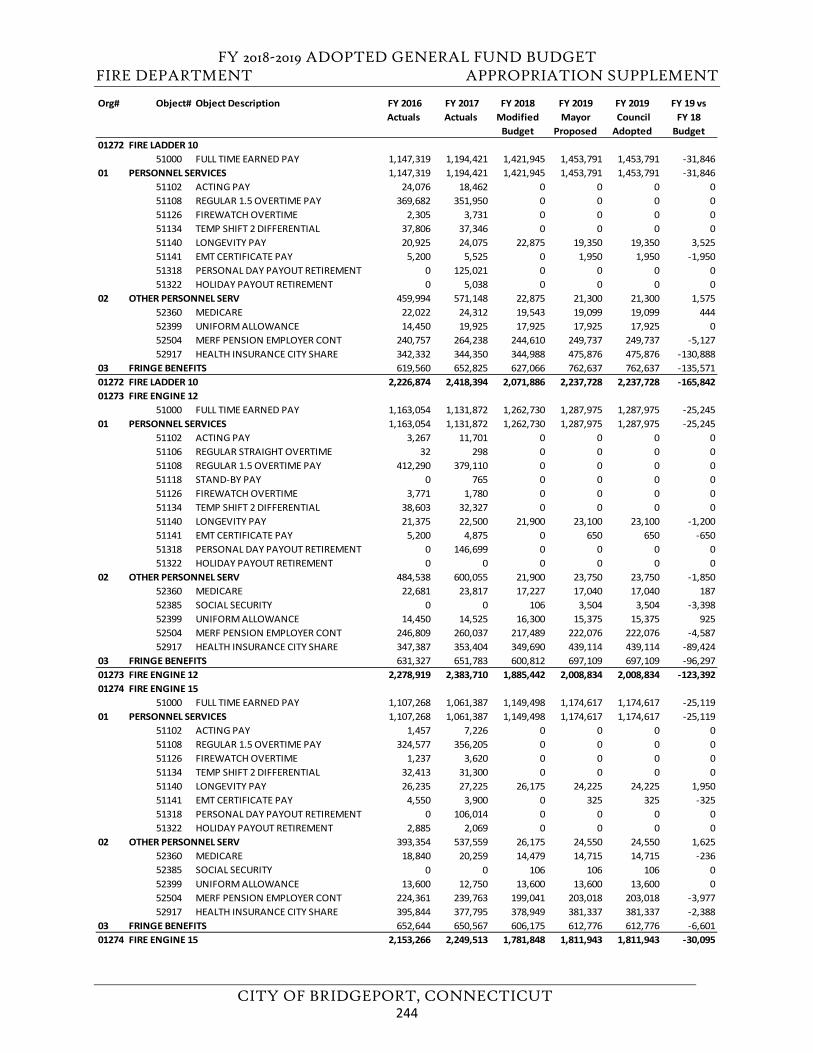
FY 2018-2019 ADOPTED GENERAL FUND BUDGET FIRE DEPARTMENT APPROPRIATION SUPPLEMENT
CITY OF BRIDGEPORT, CONNECTICUT
Org# Object# Object Description FY 2016 Actuals
FY 2017 Actuals
FY 2018 Modified
Budget
FY 2019Mayor
Proposed
FY 2019 Council Adopted
FY 19 vs FY 18
Budget01272 FIRE LADDER 10
51000 FULL TIME EARNED PAY 1,147,319 1,194,421 1,421,945 1,453,791 1,453,791 -31,84601 PERSONNEL SERVICES 1,147,319 1,194,421 1,421,945 1,453,791 1,453,791 -31,846
51102 ACTING PAY 24,076 18,462 0 0 0 051108 REGULAR 1.5 OVERTIME PAY 369,682 351,950 0 0 0 051126 FIREWATCH OVERTIME 2,305 3,731 0 0 0 051134 TEMP SHIFT 2 DIFFERENTIAL 37,806 37,346 0 0 0 051140 LONGEVITY PAY 20,925 24,075 22,875 19,350 19,350 3,52551141 EMT CERTIFICATE PAY 5,200 5,525 0 1,950 1,950 -1,95051318 PERSONAL DAY PAYOUT RETIREMENT 0 125,021 0 0 0 051322 HOLIDAY PAYOUT RETIREMENT 0 5,038 0 0 0 0
02 OTHER PERSONNEL SERV 459,994 571,148 22,875 21,300 21,300 1,57552360 MEDICARE 22,022 24,312 19,543 19,099 19,099 44452399 UNIFORM ALLOWANCE 14,450 19,925 17,925 17,925 17,925 052504 MERF PENSION EMPLOYER CONT 240,757 264,238 244,610 249,737 249,737 -5,12752917 HEALTH INSURANCE CITY SHARE 342,332 344,350 344,988 475,876 475,876 -130,888
03 FRINGE BENEFITS 619,560 652,825 627,066 762,637 762,637 -135,57101272 FIRE LADDER 10 2,226,874 2,418,394 2,071,886 2,237,728 2,237,728 -165,84201273 FIRE ENGINE 12
51000 FULL TIME EARNED PAY 1,163,054 1,131,872 1,262,730 1,287,975 1,287,975 -25,24501 PERSONNEL SERVICES 1,163,054 1,131,872 1,262,730 1,287,975 1,287,975 -25,245
51102 ACTING PAY 3,267 11,701 0 0 0 051106 REGULAR STRAIGHT OVERTIME 32 298 0 0 0 051108 REGULAR 1.5 OVERTIME PAY 412,290 379,110 0 0 0 051118 STAND-BY PAY 0 765 0 0 0 051126 FIREWATCH OVERTIME 3,771 1,780 0 0 0 051134 TEMP SHIFT 2 DIFFERENTIAL 38,603 32,327 0 0 0 051140 LONGEVITY PAY 21,375 22,500 21,900 23,100 23,100 -1,20051141 EMT CERTIFICATE PAY 5,200 4,875 0 650 650 -65051318 PERSONAL DAY PAYOUT RETIREMENT 0 146,699 0 0 0 051322 HOLIDAY PAYOUT RETIREMENT 0 0 0 0 0 0
02 OTHER PERSONNEL SERV 484,538 600,055 21,900 23,750 23,750 -1,85052360 MEDICARE 22,681 23,817 17,227 17,040 17,040 18752385 SOCIAL SECURITY 0 0 106 3,504 3,504 -3,39852399 UNIFORM ALLOWANCE 14,450 14,525 16,300 15,375 15,375 92552504 MERF PENSION EMPLOYER CONT 246,809 260,037 217,489 222,076 222,076 -4,58752917 HEALTH INSURANCE CITY SHARE 347,387 353,404 349,690 439,114 439,114 -89,424
03 FRINGE BENEFITS 631,327 651,783 600,812 697,109 697,109 -96,29701273 FIRE ENGINE 12 2,278,919 2,383,710 1,885,442 2,008,834 2,008,834 -123,39201274 FIRE ENGINE 15
51000 FULL TIME EARNED PAY 1,107,268 1,061,387 1,149,498 1,174,617 1,174,617 -25,11901 PERSONNEL SERVICES 1,107,268 1,061,387 1,149,498 1,174,617 1,174,617 -25,119
51102 ACTING PAY 1,457 7,226 0 0 0 051108 REGULAR 1.5 OVERTIME PAY 324,577 356,205 0 0 0 051126 FIREWATCH OVERTIME 1,237 3,620 0 0 0 051134 TEMP SHIFT 2 DIFFERENTIAL 32,413 31,300 0 0 0 051140 LONGEVITY PAY 26,235 27,225 26,175 24,225 24,225 1,95051141 EMT CERTIFICATE PAY 4,550 3,900 0 325 325 -32551318 PERSONAL DAY PAYOUT RETIREMENT 0 106,014 0 0 0 051322 HOLIDAY PAYOUT RETIREMENT 2,885 2,069 0 0 0 0
02 OTHER PERSONNEL SERV 393,354 537,559 26,175 24,550 24,550 1,62552360 MEDICARE 18,840 20,259 14,479 14,715 14,715 -23652385 SOCIAL SECURITY 0 0 106 106 106 052399 UNIFORM ALLOWANCE 13,600 12,750 13,600 13,600 13,600 052504 MERF PENSION EMPLOYER CONT 224,361 239,763 199,041 203,018 203,018 -3,97752917 HEALTH INSURANCE CITY SHARE 395,844 377,795 378,949 381,337 381,337 -2,388
03 FRINGE BENEFITS 652,644 650,567 606,175 612,776 612,776 -6,60101274 FIRE ENGINE 15 2,153,266 2,249,513 1,781,848 1,811,943 1,811,943 -30,095
244
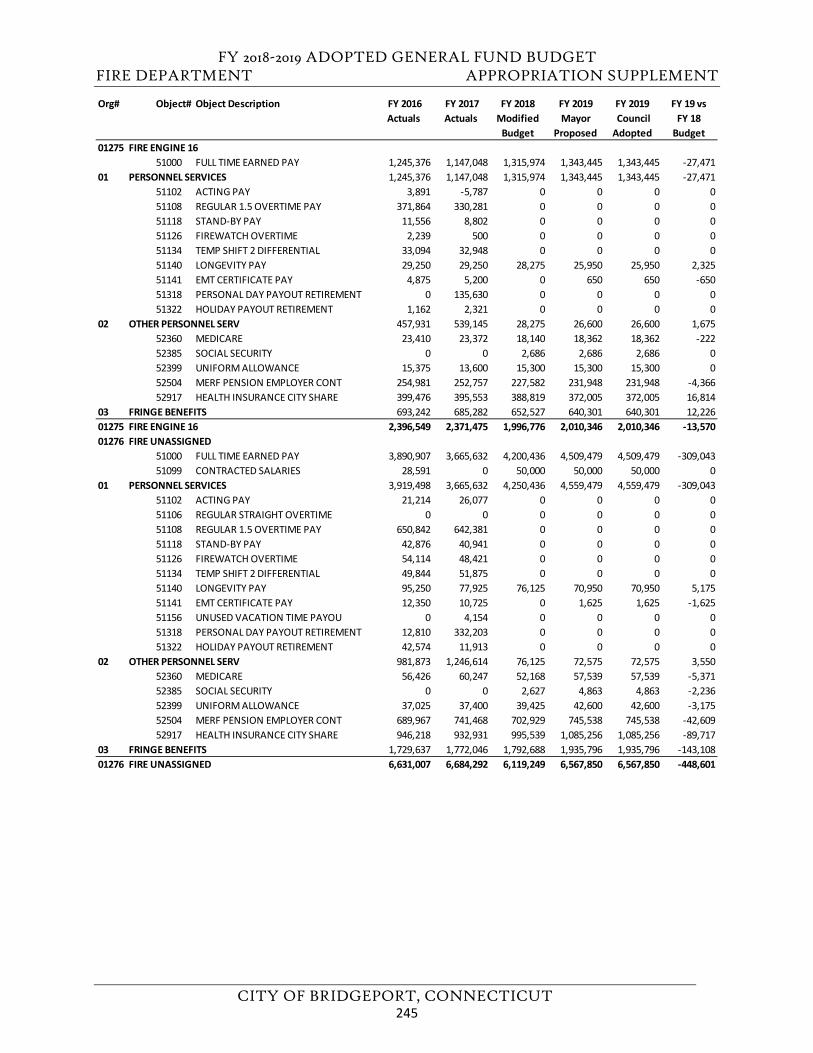
FY 2018-2019 ADOPTED GENERAL FUND BUDGET FIRE DEPARTMENT APPROPRIATION SUPPLEMENT
CITY OF BRIDGEPORT, CONNECTICUT
Org# Object# Object Description FY 2016 Actuals
FY 2017 Actuals
FY 2018 Modified
Budget
FY 2019Mayor
Proposed
FY 2019 Council Adopted
FY 19 vs FY 18
Budget01275 FIRE ENGINE 16
51000 FULL TIME EARNED PAY 1,245,376 1,147,048 1,315,974 1,343,445 1,343,445 -27,47101 PERSONNEL SERVICES 1,245,376 1,147,048 1,315,974 1,343,445 1,343,445 -27,471
51102 ACTING PAY 3,891 -5,787 0 0 0 051108 REGULAR 1.5 OVERTIME PAY 371,864 330,281 0 0 0 051118 STAND-BY PAY 11,556 8,802 0 0 0 051126 FIREWATCH OVERTIME 2,239 500 0 0 0 051134 TEMP SHIFT 2 DIFFERENTIAL 33,094 32,948 0 0 0 051140 LONGEVITY PAY 29,250 29,250 28,275 25,950 25,950 2,32551141 EMT CERTIFICATE PAY 4,875 5,200 0 650 650 -65051318 PERSONAL DAY PAYOUT RETIREMENT 0 135,630 0 0 0 051322 HOLIDAY PAYOUT RETIREMENT 1,162 2,321 0 0 0 0
02 OTHER PERSONNEL SERV 457,931 539,145 28,275 26,600 26,600 1,67552360 MEDICARE 23,410 23,372 18,140 18,362 18,362 -22252385 SOCIAL SECURITY 0 0 2,686 2,686 2,686 052399 UNIFORM ALLOWANCE 15,375 13,600 15,300 15,300 15,300 052504 MERF PENSION EMPLOYER CONT 254,981 252,757 227,582 231,948 231,948 -4,36652917 HEALTH INSURANCE CITY SHARE 399,476 395,553 388,819 372,005 372,005 16,814
03 FRINGE BENEFITS 693,242 685,282 652,527 640,301 640,301 12,22601275 FIRE ENGINE 16 2,396,549 2,371,475 1,996,776 2,010,346 2,010,346 -13,57001276 FIRE UNASSIGNED
51000 FULL TIME EARNED PAY 3,890,907 3,665,632 4,200,436 4,509,479 4,509,479 -309,04351099 CONTRACTED SALARIES 28,591 0 50,000 50,000 50,000 0
01 PERSONNEL SERVICES 3,919,498 3,665,632 4,250,436 4,559,479 4,559,479 -309,04351102 ACTING PAY 21,214 26,077 0 0 0 051106 REGULAR STRAIGHT OVERTIME 0 0 0 0 0 051108 REGULAR 1.5 OVERTIME PAY 650,842 642,381 0 0 0 051118 STAND-BY PAY 42,876 40,941 0 0 0 051126 FIREWATCH OVERTIME 54,114 48,421 0 0 0 051134 TEMP SHIFT 2 DIFFERENTIAL 49,844 51,875 0 0 0 051140 LONGEVITY PAY 95,250 77,925 76,125 70,950 70,950 5,17551141 EMT CERTIFICATE PAY 12,350 10,725 0 1,625 1,625 -1,62551156 UNUSED VACATION TIME PAYOU 0 4,154 0 0 0 051318 PERSONAL DAY PAYOUT RETIREMENT 12,810 332,203 0 0 0 051322 HOLIDAY PAYOUT RETIREMENT 42,574 11,913 0 0 0 0
02 OTHER PERSONNEL SERV 981,873 1,246,614 76,125 72,575 72,575 3,55052360 MEDICARE 56,426 60,247 52,168 57,539 57,539 -5,37152385 SOCIAL SECURITY 0 0 2,627 4,863 4,863 -2,23652399 UNIFORM ALLOWANCE 37,025 37,400 39,425 42,600 42,600 -3,17552504 MERF PENSION EMPLOYER CONT 689,967 741,468 702,929 745,538 745,538 -42,60952917 HEALTH INSURANCE CITY SHARE 946,218 932,931 995,539 1,085,256 1,085,256 -89,717
03 FRINGE BENEFITS 1,729,637 1,772,046 1,792,688 1,935,796 1,935,796 -143,10801276 FIRE UNASSIGNED 6,631,007 6,684,292 6,119,249 6,567,850 6,567,850 -448,601
245
FY 2018-2019 ADOPTED GENERAL FUND BUDGET
CITY OF BRIDGEPORT, CONNECTICUT
This page left blank intentionally.
246
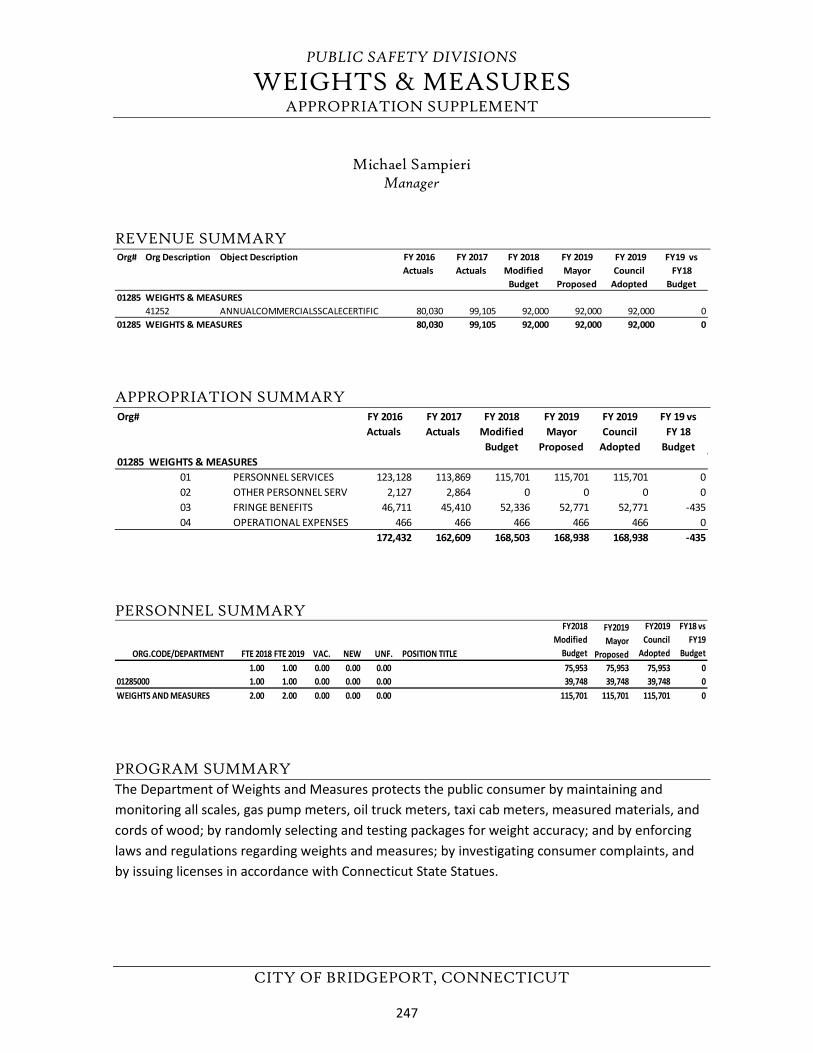
PUBLIC SAFETY DIVISIONS
WEIGHTS & MEASURES APPROPRIATION SUPPLEMENT
CITY OF BRIDGEPORT, CONNECTICUT
Michael Sampieri Manager
REVENUE SUMMARY
APPROPRIATION SUMMARY
PERSONNEL SUMMARY
PROGRAM SUMMARY The Department of Weights and Measures protects the public consumer by maintaining and monitoring all scales, gas pump meters, oil truck meters, taxi cab meters, measured materials, and cords of wood; by randomly selecting and testing packages for weight accuracy; and by enforcing laws and regulations regarding weights and measures; by investigating consumer complaints, and by issuing licenses in accordance with Connecticut State Statues.
Org# Org Description Object Description FY 2016 Actuals
FY 2017 Actuals
FY 2018 Modified
Budget
FY 2019 Mayor
Proposed
FY 2019 Council
Adopted
FY19 vs FY18
Budget01285 WEIGHTS & MEASURES
41252 ANNUALCOMMERCIALSSCALECERTIFIC 80,030 99,105 92,000 92,000 92,000 001285 WEIGHTS & MEASURES 80,030 99,105 92,000 92,000 92,000 0
Org# FY 2016 Actuals
FY 2017 Actuals
FY 2018 Modified
Budget
FY 2019 Mayor
Proposed
FY 2019 Council
Adopted
FY 19 vs FY 18
Budget01285 WEIGHTS & MEASURES
01 PERSONNEL SERVICES 123,128 113,869 115,701 115,701 115,701 002 OTHER PERSONNEL SERV 2,127 2,864 0 0 0 003 FRINGE BENEFITS 46,711 45,410 52,336 52,771 52,771 -43504 OPERATIONAL EXPENSES 466 466 466 466 466 0
172,432 162,609 168,503 168,938 168,938 -435
ORG.CODE/DEPARTMENT FTE 2018 FTE 2019 VAC. NEW UNF. POSITION TITLE
FY2018 Modified
Budget
FY2019 Mayor
Proposed
FY2019 Council
Adopted
FY18 vs FY19
Budget 1.00 1.00 0.00 0.00 0.00 75,953 75,953 75,953 0
01285000 1.00 1.00 0.00 0.00 0.00 39,748 39,748 39,748 0WEIGHTS AND MEASURES 2.00 2.00 0.00 0.00 0.00 115,701 115,701 115,701 0
247
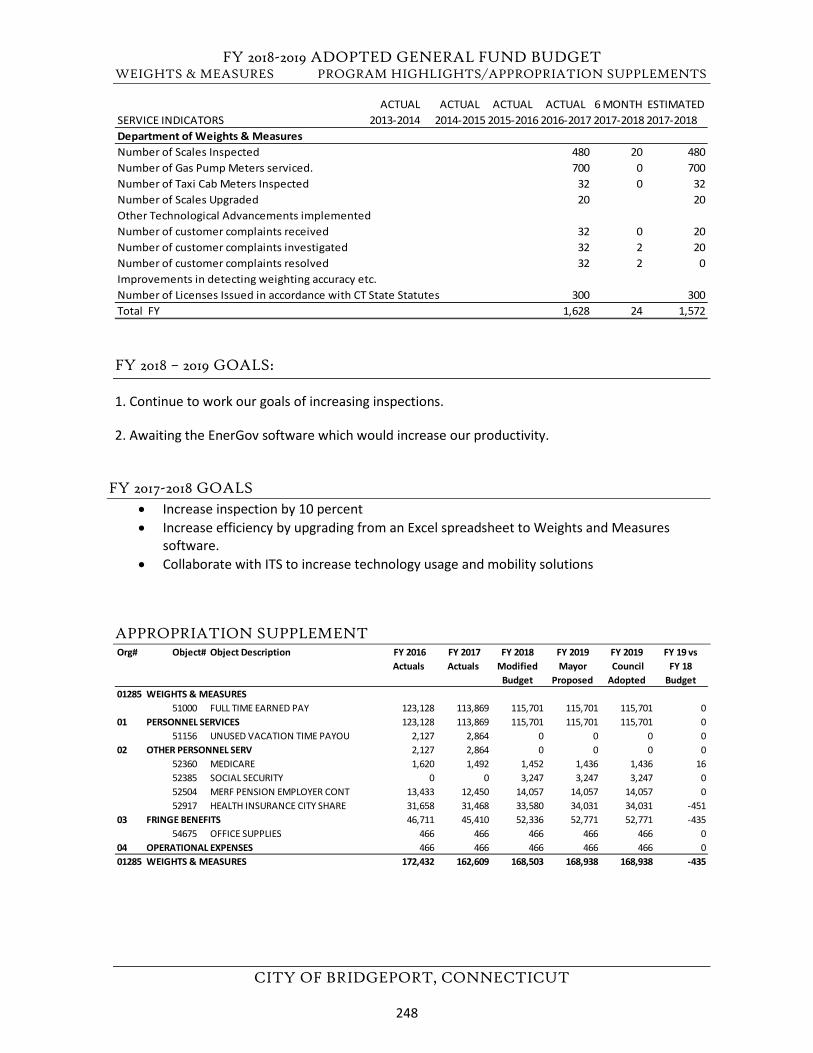
FY 2018-2019 ADOPTED GENERAL FUND BUDGET WEIGHTS & MEASURES PROGRAM HIGHLIGHTS/APPROPRIATION SUPPLEMENTS
CITY OF BRIDGEPORT, CONNECTICUT
FY 2018 – 2019 GOALS:
1. Continue to work our goals of increasing inspections.
2. Awaiting the EnerGov software which would increase our productivity.
FY 2017-2018 GOALS • Increase inspection by 10 percent• Increase efficiency by upgrading from an Excel spreadsheet to Weights and Measures
software.• Collaborate with ITS to increase technology usage and mobility solutions
APPROPRIATION SUPPLEMENT
ACTUAL ACTUAL ACTUAL ACTUAL 6 MONTH ESTIMATEDSERVICE INDICATORS 2013-2014 2014-2015 2015-2016 2016-2017 2017-2018 2017-2018Department of Weights & MeasuresNumber of Scales Inspected 480 20 480Number of Gas Pump Meters serviced. 700 0 700Number of Taxi Cab Meters Inspected 32 0 32Number of Scales Upgraded 20 20Other Technological Advancements implementedNumber of customer complaints received 32 0 20Number of customer complaints investigated 32 2 20Number of customer complaints resolved 32 2 0Improvements in detecting weighting accuracy etc.Number of Licenses Issued in accordance with CT State Statutes 300 300Total FY 1,628 24 1,572
Org# Object# Object Description FY 2016 Actuals
FY 2017 Actuals
FY 2018 Modified
Budget
FY 2019Mayor
Proposed
FY 2019 Council Adopted
FY 19 vs FY 18
Budget01285 WEIGHTS & MEASURES
51000 FULL TIME EARNED PAY 123,128 113,869 115,701 115,701 115,701 001 PERSONNEL SERVICES 123,128 113,869 115,701 115,701 115,701 0
51156 UNUSED VACATION TIME PAYOU 2,127 2,864 0 0 0 002 OTHER PERSONNEL SERV 2,127 2,864 0 0 0 0
52360 MEDICARE 1,620 1,492 1,452 1,436 1,436 1652385 SOCIAL SECURITY 0 0 3,247 3,247 3,247 052504 MERF PENSION EMPLOYER CONT 13,433 12,450 14,057 14,057 14,057 052917 HEALTH INSURANCE CITY SHARE 31,658 31,468 33,580 34,031 34,031 -451
03 FRINGE BENEFITS 46,711 45,410 52,336 52,771 52,771 -43554675 OFFICE SUPPLIES 466 466 466 466 466 0
04 OPERATIONAL EXPENSES 466 466 466 466 466 001285 WEIGHTS & MEASURES 172,432 162,609 168,503 168,938 168,938 -435
248
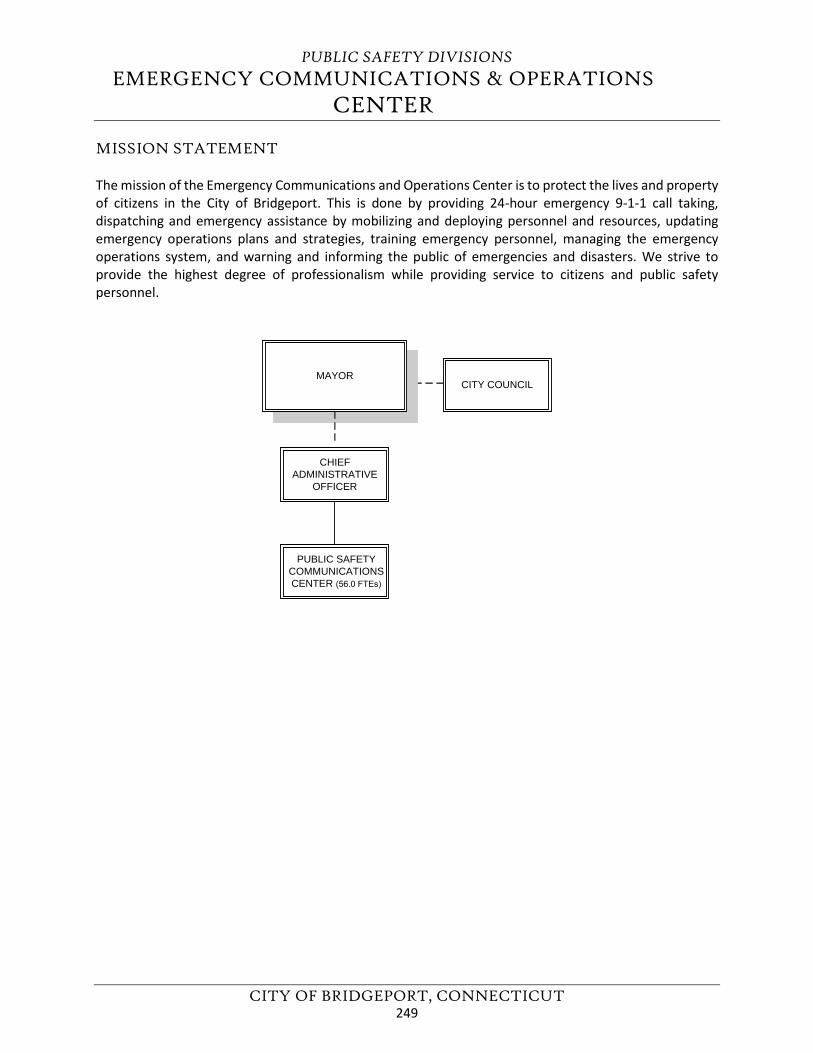
PUBLIC SAFETY DIVISIONS
EMERGENCY COMMUNICATIONS & OPERATIONSCENTER
CITY OF BRIDGEPORT, CONNECTICUT
MISSION STATEMENT
The mission of the Emergency Communications and Operations Center is to protect the lives and property of citizens in the City of Bridgeport. This is done by providing 24-hour emergency 9-1-1 call taking, dispatching and emergency assistance by mobilizing and deploying personnel and resources, updating emergency operations plans and strategies, training emergency personnel, managing the emergency operations system, and warning and informing the public of emergencies and disasters. We strive to provide the highest degree of professionalism while providing service to citizens and public safety personnel.
CHIEFADMINISTRATIVE
OFFICER
CITY COUNCIL
PUBLIC SAFETY COMMUNICATIONS CENTER (56.0 FTEs)
MAYOR
249
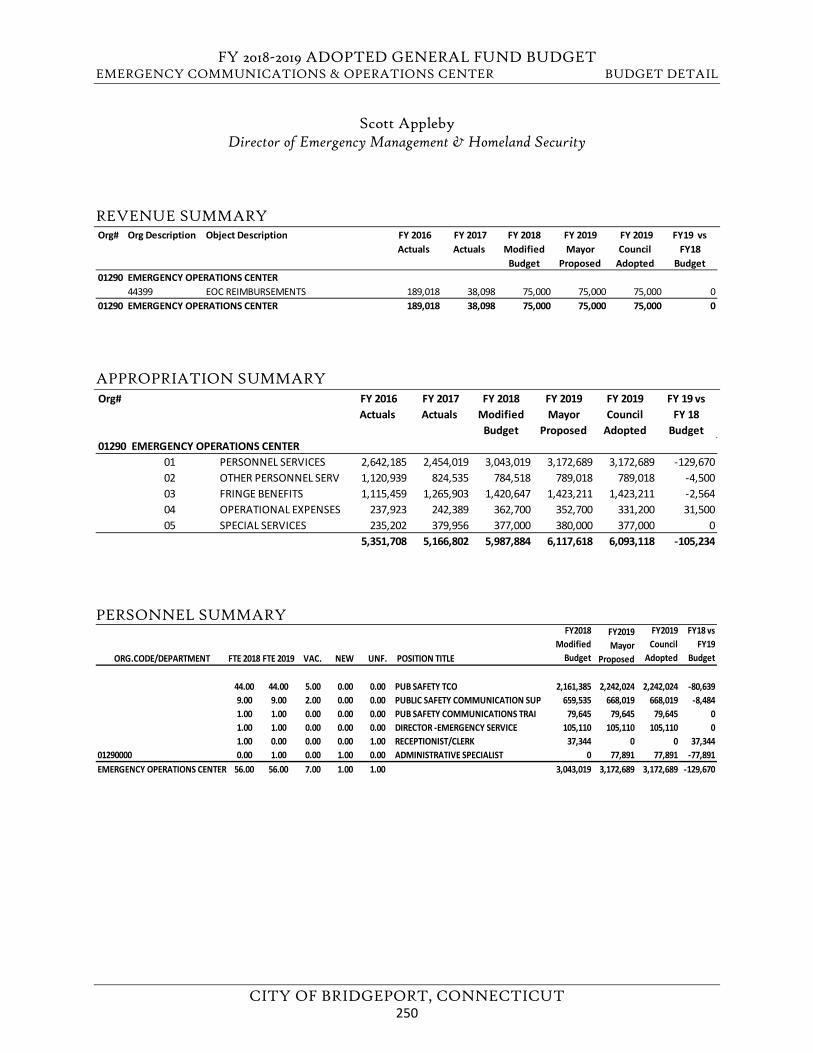
FY 2018-2019 ADOPTED GENERAL FUND BUDGET EMERGENCY COMMUNICATIONS & OPERATIONS CENTER BUDGET DETAIL
CITY OF BRIDGEPORT, CONNECTICUT
Scott Appleby Director of Emergency Management & Homeland Security
REVENUE SUMMARY
APPROPRIATION SUMMARY
PERSONNEL SUMMARY
Org# Org Description Object Description FY 2016 Actuals
FY 2017 Actuals
FY 2018 Modified
Budget
FY 2019 Mayor
Proposed
FY 2019 Council
Adopted
FY19 vs FY18
Budget01290 EMERGENCY OPERATIONS CENTER
44399 EOC REIMBURSEMENTS 189,018 38,098 75,000 75,000 75,000 001290 EMERGENCY OPERATIONS CENTER 189,018 38,098 75,000 75,000 75,000 0
Org# FY 2016 Actuals
FY 2017 Actuals
FY 2018 Modified
Budget
FY 2019 Mayor
Proposed
FY 2019 Council
Adopted
FY 19 vs FY 18
Budget01290 EMERGENCY OPERATIONS CENTER
01 PERSONNEL SERVICES 2,642,185 2,454,019 3,043,019 3,172,689 3,172,689 -129,67002 OTHER PERSONNEL SERV 1,120,939 824,535 784,518 789,018 789,018 -4,50003 FRINGE BENEFITS 1,115,459 1,265,903 1,420,647 1,423,211 1,423,211 -2,56404 OPERATIONAL EXPENSES 237,923 242,389 362,700 352,700 331,200 31,50005 SPECIAL SERVICES 235,202 379,956 377,000 380,000 377,000 0
5,351,708 5,166,802 5,987,884 6,117,618 6,093,118 -105,234
ORG.CODE/DEPARTMENT FTE 2018 FTE 2019 VAC. NEW UNF. POSITION TITLE
FY2018 Modified
Budget
FY2019 Mayor
Proposed
FY2019 Council
Adopted
FY18 vs FY19
Budget
44.00 44.00 5.00 0.00 0.00 PUB SAFETY TCO 2,161,385 2,242,024 2,242,024 -80,6399.00 9.00 2.00 0.00 0.00 PUBLIC SAFETY COMMUNICATION SUP 659,535 668,019 668,019 -8,4841.00 1.00 0.00 0.00 0.00 PUB SAFETY COMMUNICATIONS TRAI 79,645 79,645 79,645 01.00 1.00 0.00 0.00 0.00 DIRECTOR -EMERGENCY SERVICE 105,110 105,110 105,110 01.00 0.00 0.00 0.00 1.00 RECEPTIONIST/CLERK 37,344 0 0 37,344
01290000 0.00 1.00 0.00 1.00 0.00 ADMINISTRATIVE SPECIALIST 0 77,891 77,891 -77,891EMERGENCY OPERATIONS CENTER 56.00 56.00 7.00 1.00 1.00 3,043,019 3,172,689 3,172,689 -129,670
250
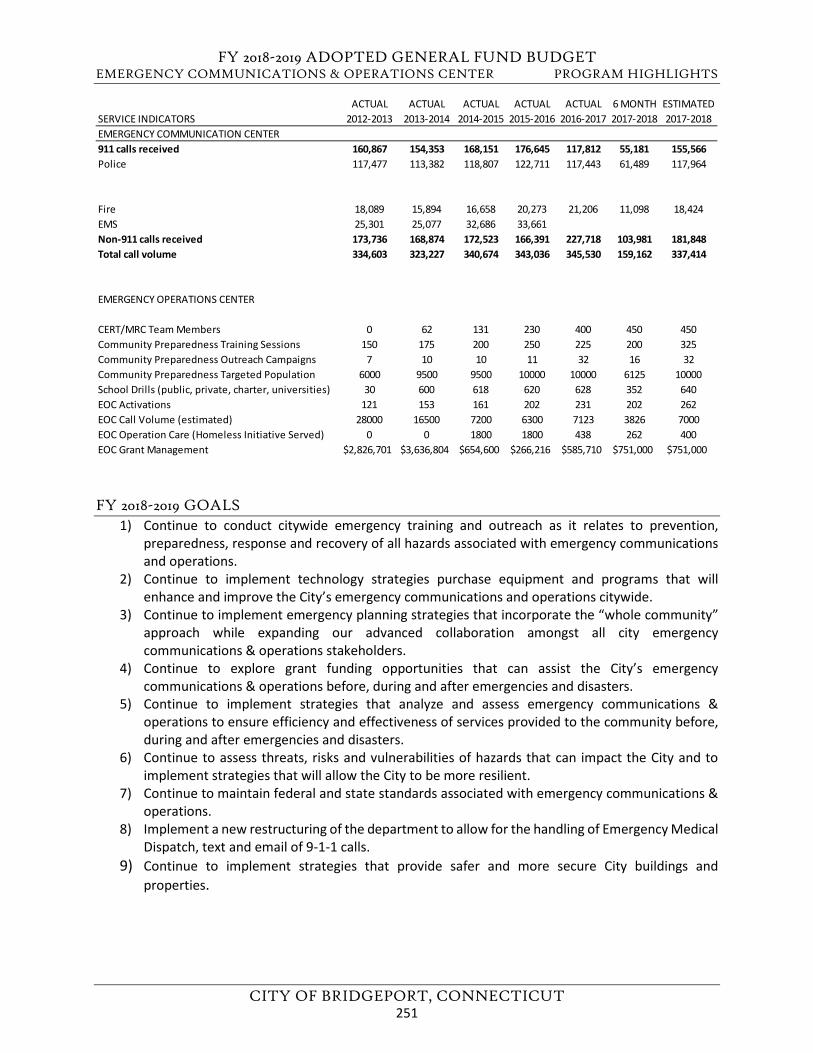
FY 2018-2019 ADOPTED GENERAL FUND BUDGET EMERGENCY COMMUNICATIONS & OPERATIONS CENTER PROGRAM HIGHLIGHTS
CITY OF BRIDGEPORT, CONNECTICUT
FY 2018-2019 GOALS 1) Continue to conduct citywide emergency training and outreach as it relates to prevention,
preparedness, response and recovery of all hazards associated with emergency communicationsand operations.
2) Continue to implement technology strategies purchase equipment and programs that willenhance and improve the City’s emergency communications and operations citywide.
3) Continue to implement emergency planning strategies that incorporate the “whole community”approach while expanding our advanced collaboration amongst all city emergencycommunications & operations stakeholders.
4) Continue to explore grant funding opportunities that can assist the City’s emergencycommunications & operations before, during and after emergencies and disasters.
5) Continue to implement strategies that analyze and assess emergency communications &operations to ensure efficiency and effectiveness of services provided to the community before,during and after emergencies and disasters.
6) Continue to assess threats, risks and vulnerabilities of hazards that can impact the City and toimplement strategies that will allow the City to be more resilient.
7) Continue to maintain federal and state standards associated with emergency communications &operations.
8) Implement a new restructuring of the department to allow for the handling of Emergency Medical Dispatch, text and email of 9-1-1 calls.
9) Continue to implement strategies that provide safer and more secure City buildings andproperties.
SERVICE INDICATORSACTUAL
2012-2013ACTUAL
2013-2014ACTUAL
2014-2015ACTUAL
2015-2016ACTUAL
2016-20176 MONTH 2017-2018
ESTIMATED 2017-2018
EMERGENCY COMMUNICATION CENTER911 calls received 160,867 154,353 168,151 176,645 117,812 55,181 155,566Police 117,477 113,382 118,807 122,711 117,443 61,489 117,964
Fire 18,089 15,894 16,658 20,273 21,206 11,098 18,424EMS 25,301 25,077 32,686 33,661Non-911 calls received 173,736 168,874 172,523 166,391 227,718 103,981 181,848Total call volume 334,603 323,227 340,674 343,036 345,530 159,162 337,414
EMERGENCY OPERATIONS CENTER
CERT/MRC Team Members 0 62 131 230 400 450 450Community Preparedness Training Sessions 150 175 200 250 225 200 325Community Preparedness Outreach Campaigns 7 10 10 11 32 16 32Community Preparedness Targeted Population 6000 9500 9500 10000 10000 6125 10000School Drills (public, private, charter, universities) 30 600 618 620 628 352 640EOC Activations 121 153 161 202 231 202 262EOC Call Volume (estimated) 28000 16500 7200 6300 7123 3826 7000EOC Operation Care (Homeless Initiative Served) 0 0 1800 1800 438 262 400EOC Grant Management $2,826,701 $3,636,804 $654,600 $266,216 $585,710 $751,000 $751,000
251
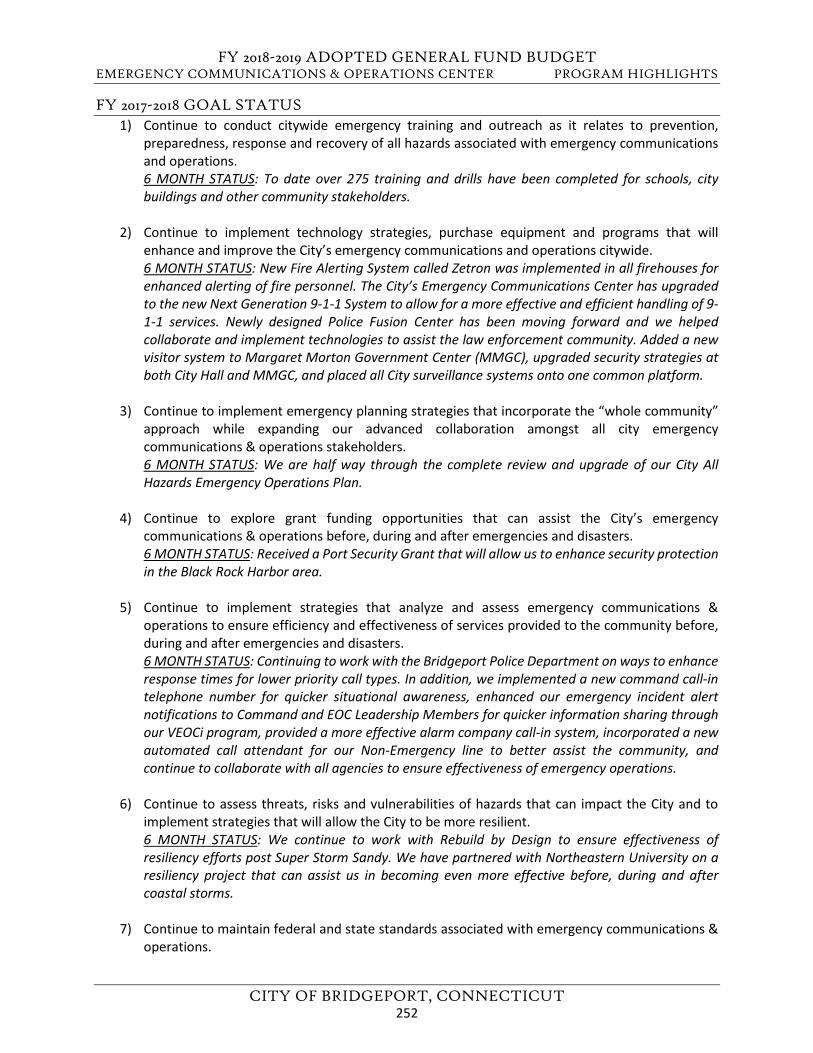
FY 2018-2019 ADOPTED GENERAL FUND BUDGET EMERGENCY COMMUNICATIONS & OPERATIONS CENTER PROGRAM HIGHLIGHTS
CITY OF BRIDGEPORT, CONNECTICUT
FY 2017-2018 GOAL STATUS 1) Continue to conduct citywide emergency training and outreach as it relates to prevention,
preparedness, response and recovery of all hazards associated with emergency communicationsand operations.6 MONTH STATUS: To date over 275 training and drills have been completed for schools, citybuildings and other community stakeholders.
2) Continue to implement technology strategies, purchase equipment and programs that willenhance and improve the City’s emergency communications and operations citywide.6 MONTH STATUS: New Fire Alerting System called Zetron was implemented in all firehouses forenhanced alerting of fire personnel. The City’s Emergency Communications Center has upgradedto the new Next Generation 9-1-1 System to allow for a more effective and efficient handling of 9-1-1 services. Newly designed Police Fusion Center has been moving forward and we helpedcollaborate and implement technologies to assist the law enforcement community. Added a newvisitor system to Margaret Morton Government Center (MMGC), upgraded security strategies atboth City Hall and MMGC, and placed all City surveillance systems onto one common platform.
3) Continue to implement emergency planning strategies that incorporate the “whole community”approach while expanding our advanced collaboration amongst all city emergencycommunications & operations stakeholders.6 MONTH STATUS: We are half way through the complete review and upgrade of our City AllHazards Emergency Operations Plan.
4) Continue to explore grant funding opportunities that can assist the City’s emergencycommunications & operations before, during and after emergencies and disasters.6 MONTH STATUS: Received a Port Security Grant that will allow us to enhance security protectionin the Black Rock Harbor area.
5) Continue to implement strategies that analyze and assess emergency communications &operations to ensure efficiency and effectiveness of services provided to the community before,during and after emergencies and disasters.6 MONTH STATUS: Continuing to work with the Bridgeport Police Department on ways to enhanceresponse times for lower priority call types. In addition, we implemented a new command call-intelephone number for quicker situational awareness, enhanced our emergency incident alertnotifications to Command and EOC Leadership Members for quicker information sharing throughour VEOCi program, provided a more effective alarm company call-in system, incorporated a newautomated call attendant for our Non-Emergency line to better assist the community, andcontinue to collaborate with all agencies to ensure effectiveness of emergency operations.
6) Continue to assess threats, risks and vulnerabilities of hazards that can impact the City and toimplement strategies that will allow the City to be more resilient.6 MONTH STATUS: We continue to work with Rebuild by Design to ensure effectiveness ofresiliency efforts post Super Storm Sandy. We have partnered with Northeastern University on aresiliency project that can assist us in becoming even more effective before, during and aftercoastal storms.
7) Continue to maintain federal and state standards associated with emergency communications &operations.
252
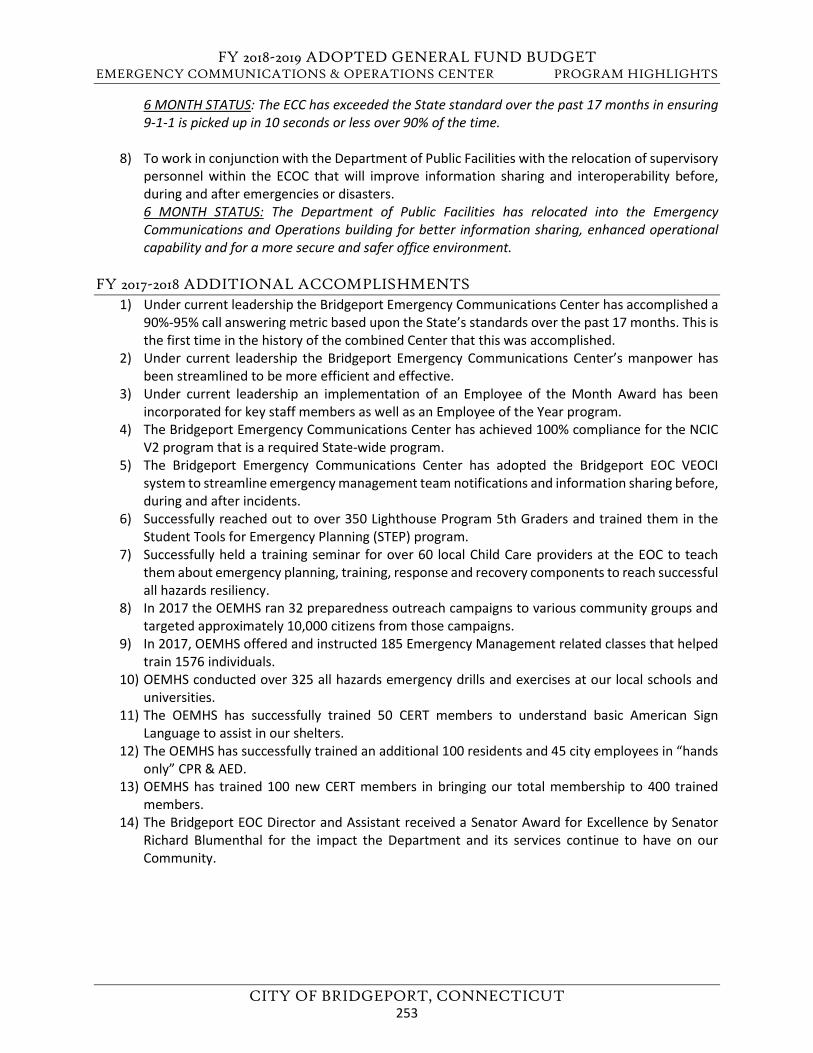
FY 2018-2019 ADOPTED GENERAL FUND BUDGET EMERGENCY COMMUNICATIONS & OPERATIONS CENTER PROGRAM HIGHLIGHTS
CITY OF BRIDGEPORT, CONNECTICUT
6 MONTH STATUS: The ECC has exceeded the State standard over the past 17 months in ensuring 9-1-1 is picked up in 10 seconds or less over 90% of the time.
8) To work in conjunction with the Department of Public Facilities with the relocation of supervisorypersonnel within the ECOC that will improve information sharing and interoperability before,during and after emergencies or disasters.6 MONTH STATUS: The Department of Public Facilities has relocated into the EmergencyCommunications and Operations building for better information sharing, enhanced operationalcapability and for a more secure and safer office environment.
FY 2017-2018 ADDITIONAL ACCOMPLISHMENTS 1) Under current leadership the Bridgeport Emergency Communications Center has accomplished a
90%-95% call answering metric based upon the State’s standards over the past 17 months. This isthe first time in the history of the combined Center that this was accomplished.
2) Under current leadership the Bridgeport Emergency Communications Center’s manpower hasbeen streamlined to be more efficient and effective.
3) Under current leadership an implementation of an Employee of the Month Award has beenincorporated for key staff members as well as an Employee of the Year program.
4) The Bridgeport Emergency Communications Center has achieved 100% compliance for the NCICV2 program that is a required State-wide program.
5) The Bridgeport Emergency Communications Center has adopted the Bridgeport EOC VEOCIsystem to streamline emergency management team notifications and information sharing before, during and after incidents.
6) Successfully reached out to over 350 Lighthouse Program 5th Graders and trained them in theStudent Tools for Emergency Planning (STEP) program.
7) Successfully held a training seminar for over 60 local Child Care providers at the EOC to teachthem about emergency planning, training, response and recovery components to reach successful all hazards resiliency.
8) In 2017 the OEMHS ran 32 preparedness outreach campaigns to various community groups andtargeted approximately 10,000 citizens from those campaigns.
9) In 2017, OEMHS offered and instructed 185 Emergency Management related classes that helpedtrain 1576 individuals.
10) OEMHS conducted over 325 all hazards emergency drills and exercises at our local schools anduniversities.
11) The OEMHS has successfully trained 50 CERT members to understand basic American SignLanguage to assist in our shelters.
12) The OEMHS has successfully trained an additional 100 residents and 45 city employees in “handsonly” CPR & AED.
13) OEMHS has trained 100 new CERT members in bringing our total membership to 400 trainedmembers.
14) The Bridgeport EOC Director and Assistant received a Senator Award for Excellence by SenatorRichard Blumenthal for the impact the Department and its services continue to have on ourCommunity.
253
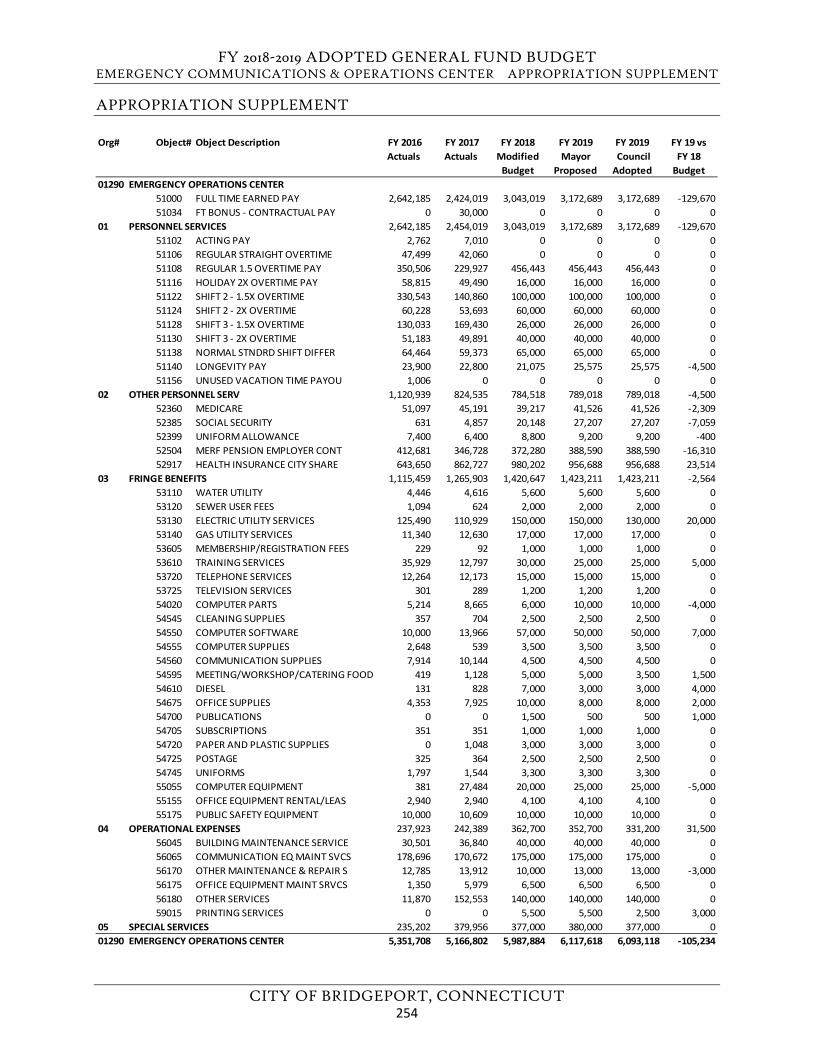
FY 2018-2019 ADOPTED GENERAL FUND BUDGET EMERGENCY COMMUNICATIONS & OPERATIONS CENTER APPROPRIATION SUPPLEMENT
CITY OF BRIDGEPORT, CONNECTICUT
APPROPRIATION SUPPLEMENT
Org# Object# Object Description FY 2016 Actuals
FY 2017 Actuals
FY 2018 Modified
Budget
FY 2019Mayor
Proposed
FY 2019 Council Adopted
FY 19 vs FY 18
Budget01290 EMERGENCY OPERATIONS CENTER
51000 FULL TIME EARNED PAY 2,642,185 2,424,019 3,043,019 3,172,689 3,172,689 -129,67051034 FT BONUS - CONTRACTUAL PAY 0 30,000 0 0 0 0
01 PERSONNEL SERVICES 2,642,185 2,454,019 3,043,019 3,172,689 3,172,689 -129,67051102 ACTING PAY 2,762 7,010 0 0 0 051106 REGULAR STRAIGHT OVERTIME 47,499 42,060 0 0 0 051108 REGULAR 1.5 OVERTIME PAY 350,506 229,927 456,443 456,443 456,443 051116 HOLIDAY 2X OVERTIME PAY 58,815 49,490 16,000 16,000 16,000 051122 SHIFT 2 - 1.5X OVERTIME 330,543 140,860 100,000 100,000 100,000 051124 SHIFT 2 - 2X OVERTIME 60,228 53,693 60,000 60,000 60,000 051128 SHIFT 3 - 1.5X OVERTIME 130,033 169,430 26,000 26,000 26,000 051130 SHIFT 3 - 2X OVERTIME 51,183 49,891 40,000 40,000 40,000 051138 NORMAL STNDRD SHIFT DIFFER 64,464 59,373 65,000 65,000 65,000 051140 LONGEVITY PAY 23,900 22,800 21,075 25,575 25,575 -4,50051156 UNUSED VACATION TIME PAYOU 1,006 0 0 0 0 0
02 OTHER PERSONNEL SERV 1,120,939 824,535 784,518 789,018 789,018 -4,50052360 MEDICARE 51,097 45,191 39,217 41,526 41,526 -2,30952385 SOCIAL SECURITY 631 4,857 20,148 27,207 27,207 -7,05952399 UNIFORM ALLOWANCE 7,400 6,400 8,800 9,200 9,200 -40052504 MERF PENSION EMPLOYER CONT 412,681 346,728 372,280 388,590 388,590 -16,31052917 HEALTH INSURANCE CITY SHARE 643,650 862,727 980,202 956,688 956,688 23,514
03 FRINGE BENEFITS 1,115,459 1,265,903 1,420,647 1,423,211 1,423,211 -2,56453110 WATER UTILITY 4,446 4,616 5,600 5,600 5,600 053120 SEWER USER FEES 1,094 624 2,000 2,000 2,000 053130 ELECTRIC UTILITY SERVICES 125,490 110,929 150,000 150,000 130,000 20,00053140 GAS UTILITY SERVICES 11,340 12,630 17,000 17,000 17,000 053605 MEMBERSHIP/REGISTRATION FEES 229 92 1,000 1,000 1,000 053610 TRAINING SERVICES 35,929 12,797 30,000 25,000 25,000 5,00053720 TELEPHONE SERVICES 12,264 12,173 15,000 15,000 15,000 053725 TELEVISION SERVICES 301 289 1,200 1,200 1,200 054020 COMPUTER PARTS 5,214 8,665 6,000 10,000 10,000 -4,00054545 CLEANING SUPPLIES 357 704 2,500 2,500 2,500 054550 COMPUTER SOFTWARE 10,000 13,966 57,000 50,000 50,000 7,00054555 COMPUTER SUPPLIES 2,648 539 3,500 3,500 3,500 054560 COMMUNICATION SUPPLIES 7,914 10,144 4,500 4,500 4,500 054595 MEETING/WORKSHOP/CATERING FOOD 419 1,128 5,000 5,000 3,500 1,50054610 DIESEL 131 828 7,000 3,000 3,000 4,00054675 OFFICE SUPPLIES 4,353 7,925 10,000 8,000 8,000 2,00054700 PUBLICATIONS 0 0 1,500 500 500 1,00054705 SUBSCRIPTIONS 351 351 1,000 1,000 1,000 054720 PAPER AND PLASTIC SUPPLIES 0 1,048 3,000 3,000 3,000 054725 POSTAGE 325 364 2,500 2,500 2,500 054745 UNIFORMS 1,797 1,544 3,300 3,300 3,300 055055 COMPUTER EQUIPMENT 381 27,484 20,000 25,000 25,000 -5,00055155 OFFICE EQUIPMENT RENTAL/LEAS 2,940 2,940 4,100 4,100 4,100 055175 PUBLIC SAFETY EQUIPMENT 10,000 10,609 10,000 10,000 10,000 0
04 OPERATIONAL EXPENSES 237,923 242,389 362,700 352,700 331,200 31,50056045 BUILDING MAINTENANCE SERVICE 30,501 36,840 40,000 40,000 40,000 056065 COMMUNICATION EQ MAINT SVCS 178,696 170,672 175,000 175,000 175,000 056170 OTHER MAINTENANCE & REPAIR S 12,785 13,912 10,000 13,000 13,000 -3,00056175 OFFICE EQUIPMENT MAINT SRVCS 1,350 5,979 6,500 6,500 6,500 056180 OTHER SERVICES 11,870 152,553 140,000 140,000 140,000 059015 PRINTING SERVICES 0 0 5,500 5,500 2,500 3,000
05 SPECIAL SERVICES 235,202 379,956 377,000 380,000 377,000 001290 EMERGENCY OPERATIONS CENTER 5,351,708 5,166,802 5,987,884 6,117,618 6,093,118 -105,234
254
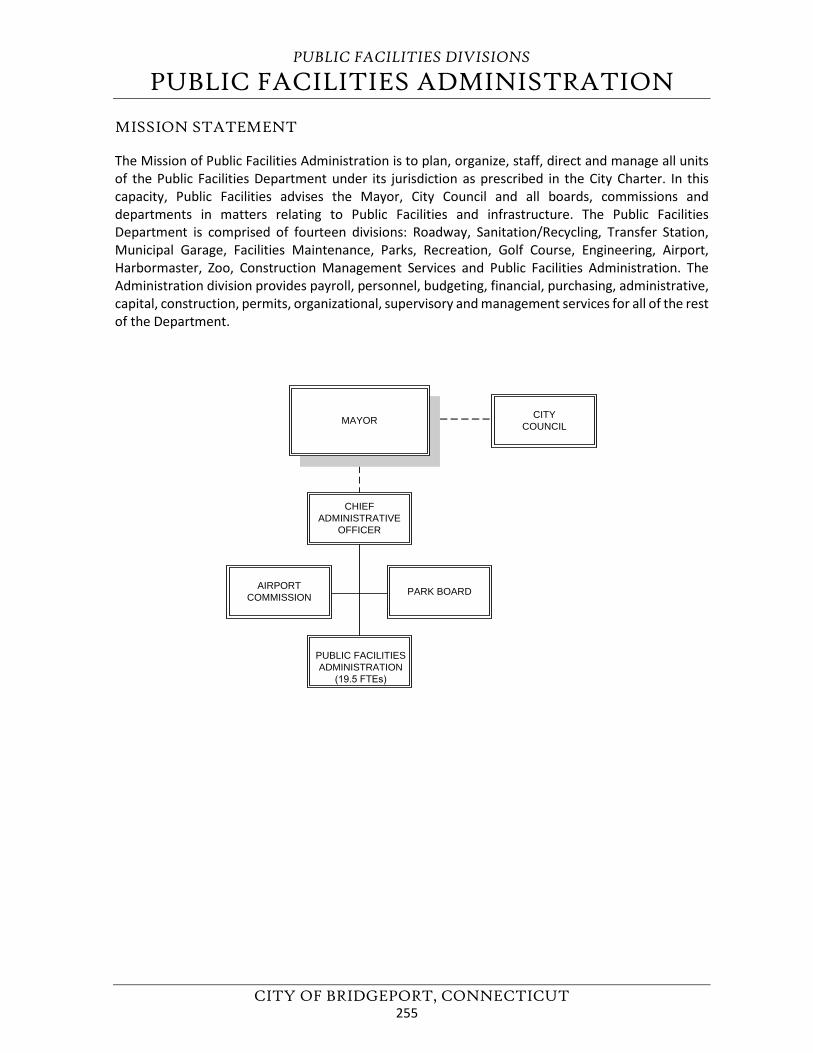
PUBLIC FACILITIES DIVISIONS
PUBLIC FACILITIES ADMINISTRATION
CITY OF BRIDGEPORT, CONNECTICUT
MISSION STATEMENT
The Mission of Public Facilities Administration is to plan, organize, staff, direct and manage all units of the Public Facilities Department under its jurisdiction as prescribed in the City Charter. In this capacity, Public Facilities advises the Mayor, City Council and all boards, commissions and departments in matters relating to Public Facilities and infrastructure. The Public Facilities Department is comprised of fourteen divisions: Roadway, Sanitation/Recycling, Transfer Station, Municipal Garage, Facilities Maintenance, Parks, Recreation, Golf Course, Engineering, Airport, Harbormaster, Zoo, Construction Management Services and Public Facilities Administration. The Administration division provides payroll, personnel, budgeting, financial, purchasing, administrative, capital, construction, permits, organizational, supervisory and management services for all of the rest of the Department.
CHIEFADMINISTRATIVE
OFFICER
MAYOR CITYCOUNCIL
PUBLIC FACILITIES ADMINISTRATION
(19.5 FTEs)
AIRPORTCOMMISSION PARK BOARD
255
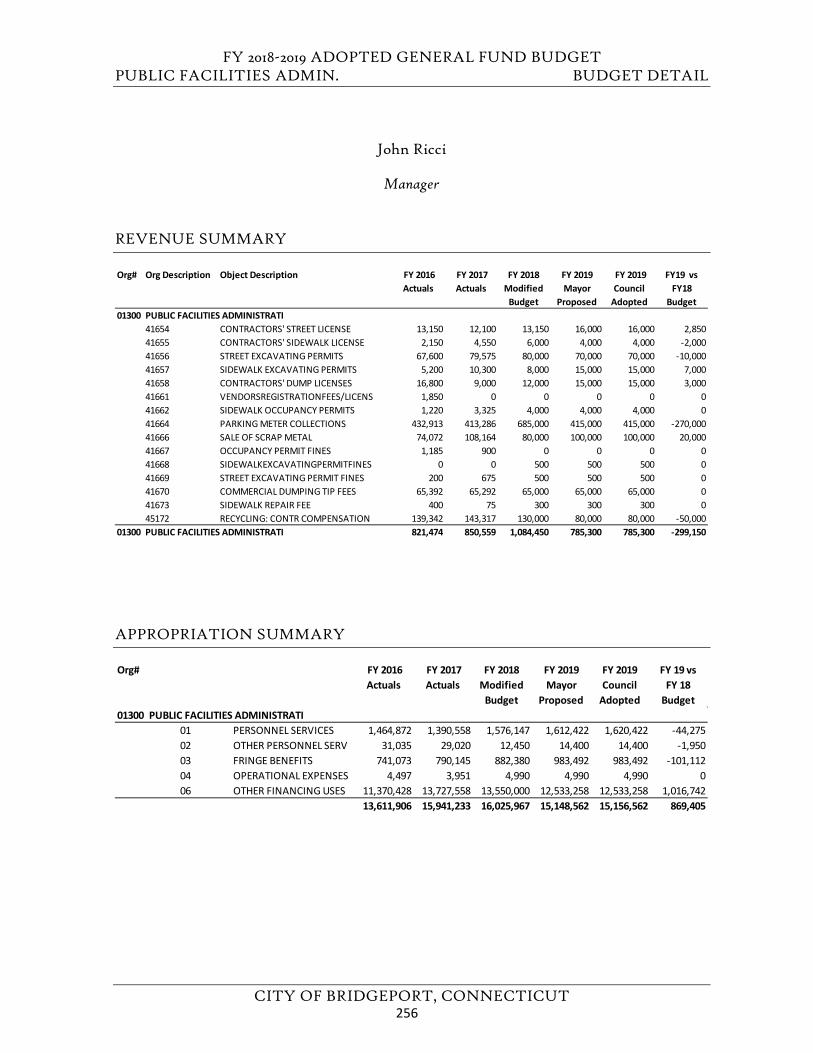
FY 2018-2019 ADOPTED GENERAL FUND BUDGET PUBLIC FACILITIES ADMIN. BUDGET DETAIL
CITY OF BRIDGEPORT, CONNECTICUT
John Ricci
Manager
REVENUE SUMMARY
APPROPRIATION SUMMARY
Org# Org Description Object Description FY 2016 Actuals
FY 2017 Actuals
FY 2018 Modified
Budget
FY 2019 Mayor
Proposed
FY 2019 Council
Adopted
FY19 vs FY18
Budget01300 PUBLIC FACILITIES ADMINISTRATI
41654 CONTRACTORS' STREET LICENSE 13,150 12,100 13,150 16,000 16,000 2,85041655 CONTRACTORS' SIDEWALK LICENSE 2,150 4,550 6,000 4,000 4,000 -2,00041656 STREET EXCAVATING PERMITS 67,600 79,575 80,000 70,000 70,000 -10,00041657 SIDEWALK EXCAVATING PERMITS 5,200 10,300 8,000 15,000 15,000 7,00041658 CONTRACTORS' DUMP LICENSES 16,800 9,000 12,000 15,000 15,000 3,00041661 VENDORSREGISTRATIONFEES/LICENS 1,850 0 0 0 0 041662 SIDEWALK OCCUPANCY PERMITS 1,220 3,325 4,000 4,000 4,000 041664 PARKING METER COLLECTIONS 432,913 413,286 685,000 415,000 415,000 -270,00041666 SALE OF SCRAP METAL 74,072 108,164 80,000 100,000 100,000 20,00041667 OCCUPANCY PERMIT FINES 1,185 900 0 0 0 041668 SIDEWALKEXCAVATINGPERMITFINES 0 0 500 500 500 041669 STREET EXCAVATING PERMIT FINES 200 675 500 500 500 041670 COMMERCIAL DUMPING TIP FEES 65,392 65,292 65,000 65,000 65,000 041673 SIDEWALK REPAIR FEE 400 75 300 300 300 045172 RECYCLING: CONTR COMPENSATION 139,342 143,317 130,000 80,000 80,000 -50,000
01300 PUBLIC FACILITIES ADMINISTRATI 821,474 850,559 1,084,450 785,300 785,300 -299,150
Org# FY 2016 Actuals
FY 2017 Actuals
FY 2018 Modified
Budget
FY 2019 Mayor
Proposed
FY 2019 Council
Adopted
FY 19 vs FY 18
Budget01300 PUBLIC FACILITIES ADMINISTRATI
01 PERSONNEL SERVICES 1,464,872 1,390,558 1,576,147 1,612,422 1,620,422 -44,27502 OTHER PERSONNEL SERV 31,035 29,020 12,450 14,400 14,400 -1,95003 FRINGE BENEFITS 741,073 790,145 882,380 983,492 983,492 -101,11204 OPERATIONAL EXPENSES 4,497 3,951 4,990 4,990 4,990 006 OTHER FINANCING USES 11,370,428 13,727,558 13,550,000 12,533,258 12,533,258 1,016,742
13,611,906 15,941,233 16,025,967 15,148,562 15,156,562 869,405
256
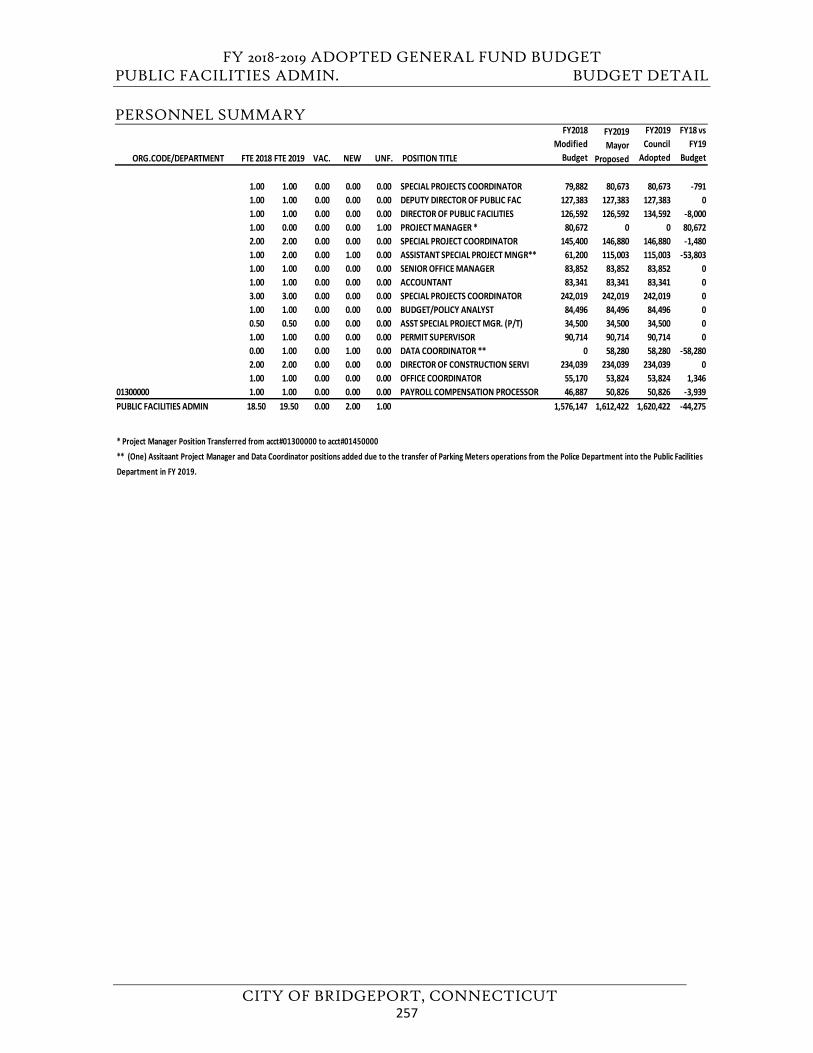
FY 2018-2019 ADOPTED GENERAL FUND BUDGET PUBLIC FACILITIES ADMIN. BUDGET DETAIL
CITY OF BRIDGEPORT, CONNECTICUT
PERSONNEL SUMMARY
ORG.CODE/DEPARTMENT FTE 2018 FTE 2019 VAC. NEW UNF. POSITION TITLE
FY2018 Modified
Budget
FY2019 Mayor
Proposed
FY2019 Council
Adopted
FY18 vs FY19
Budget
1.00 1.00 0.00 0.00 0.00 SPECIAL PROJECTS COORDINATOR 79,882 80,673 80,673 -7911.00 1.00 0.00 0.00 0.00 DEPUTY DIRECTOR OF PUBLIC FAC 127,383 127,383 127,383 01.00 1.00 0.00 0.00 0.00 DIRECTOR OF PUBLIC FACILITIES 126,592 126,592 134,592 -8,0001.00 0.00 0.00 0.00 1.00 PROJECT MANAGER * 80,672 0 0 80,6722.00 2.00 0.00 0.00 0.00 SPECIAL PROJECT COORDINATOR 145,400 146,880 146,880 -1,4801.00 2.00 0.00 1.00 0.00 ASSISTANT SPECIAL PROJECT MNGR** 61,200 115,003 115,003 -53,8031.00 1.00 0.00 0.00 0.00 SENIOR OFFICE MANAGER 83,852 83,852 83,852 01.00 1.00 0.00 0.00 0.00 ACCOUNTANT 83,341 83,341 83,341 03.00 3.00 0.00 0.00 0.00 SPECIAL PROJECTS COORDINATOR 242,019 242,019 242,019 01.00 1.00 0.00 0.00 0.00 BUDGET/POLICY ANALYST 84,496 84,496 84,496 00.50 0.50 0.00 0.00 0.00 ASST SPECIAL PROJECT MGR. (P/T) 34,500 34,500 34,500 01.00 1.00 0.00 0.00 0.00 PERMIT SUPERVISOR 90,714 90,714 90,714 00.00 1.00 0.00 1.00 0.00 DATA COORDINATOR ** 0 58,280 58,280 -58,2802.00 2.00 0.00 0.00 0.00 DIRECTOR OF CONSTRUCTION SERVI 234,039 234,039 234,039 01.00 1.00 0.00 0.00 0.00 OFFICE COORDINATOR 55,170 53,824 53,824 1,346
01300000 1.00 1.00 0.00 0.00 0.00 PAYROLL COMPENSATION PROCESSOR 46,887 50,826 50,826 -3,939PUBLIC FACILITIES ADMIN 18.50 19.50 0.00 2.00 1.00 1,576,147 1,612,422 1,620,422 -44,275
* Project Manager Position Transferred from acct#01300000 to acct#01450000** (One) Assitaant Project Manager and Data Coordinator positions added due to the transfer of Parking Meters operations from the Police Department into the Public Facilities Department in FY 2019.
257
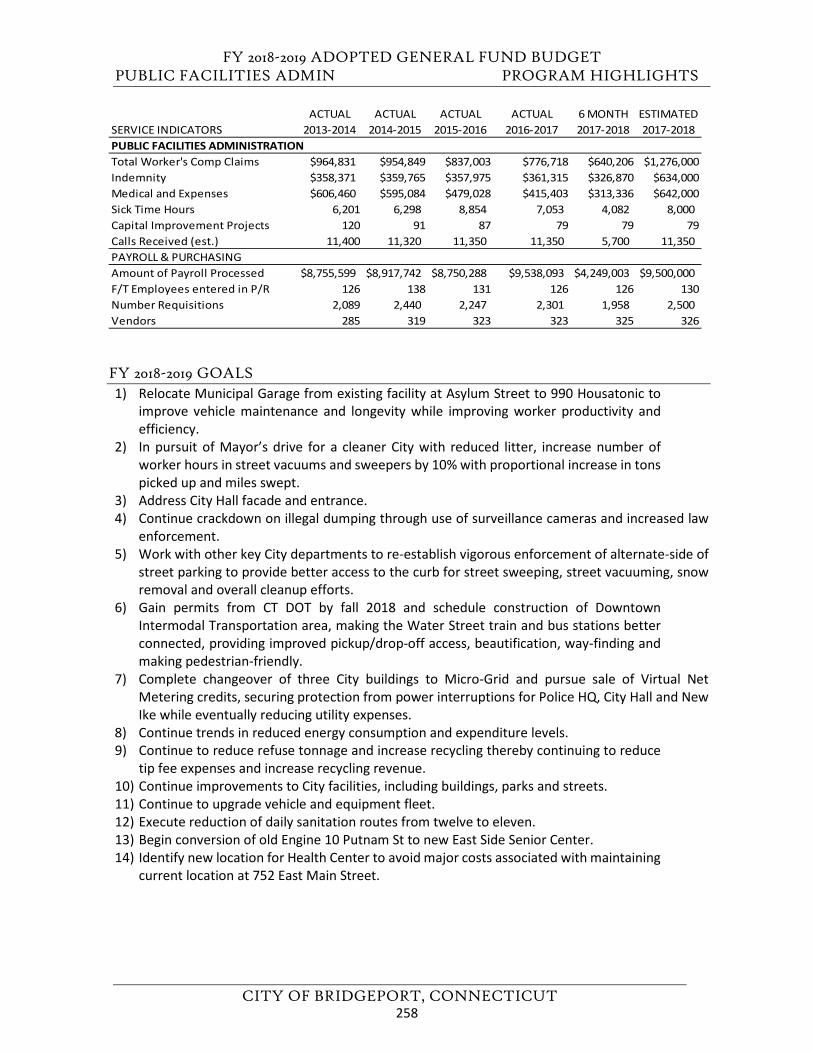
FY 2018-2019 ADOPTED GENERAL FUND BUDGET PUBLIC FACILITIES ADMIN PROGRAM HIGHLIGHTS
CITY OF BRIDGEPORT, CONNECTICUT
FY 2018-2019 GOALS 1) Relocate Municipal Garage from existing facility at Asylum Street to 990 Housatonic to
improve vehicle maintenance and longevity while improving worker productivity andefficiency.
2) In pursuit of Mayor’s drive for a cleaner City with reduced litter, increase number ofworker hours in street vacuums and sweepers by 10% with proportional increase in tonspicked up and miles swept.
3) Address City Hall facade and entrance.4) Continue crackdown on illegal dumping through use of surveillance cameras and increased law
enforcement.5) Work with other key City departments to re-establish vigorous enforcement of alternate-side of
street parking to provide better access to the curb for street sweeping, street vacuuming, snowremoval and overall cleanup efforts.
6) Gain permits from CT DOT by fall 2018 and schedule construction of DowntownIntermodal Transportation area, making the Water Street train and bus stations betterconnected, providing improved pickup/drop-off access, beautification, way-finding andmaking pedestrian-friendly.
7) Complete changeover of three City buildings to Micro-Grid and pursue sale of Virtual NetMetering credits, securing protection from power interruptions for Police HQ, City Hall and NewIke while eventually reducing utility expenses.
8) Continue trends in reduced energy consumption and expenditure levels.9) Continue to reduce refuse tonnage and increase recycling thereby continuing to reduce
tip fee expenses and increase recycling revenue.10) Continue improvements to City facilities, including buildings, parks and streets.11) Continue to upgrade vehicle and equipment fleet.12) Execute reduction of daily sanitation routes from twelve to eleven.13) Begin conversion of old Engine 10 Putnam St to new East Side Senior Center.14) Identify new location for Health Center to avoid major costs associated with maintaining
current location at 752 East Main Street.
ACTUAL ACTUAL ACTUAL ACTUAL 6 MONTH ESTIMATEDSERVICE INDICATORS 2013-2014 2014-2015 2015-2016 2016-2017 2017-2018 2017-2018PUBLIC FACILITIES ADMINISTRATIONTotal Worker's Comp Claims $964,831 $954,849 $837,003 $776,718 $640,206 $1,276,000Indemnity $358,371 $359,765 $357,975 $361,315 $326,870 $634,000Medical and Expenses $606,460 $595,084 $479,028 $415,403 $313,336 $642,000Sick Time Hours 6,201 6,298 8,854 7,053 4,082 8,000 Capital Improvement Projects 120 91 87 79 79 79Calls Received (est.) 11,400 11,320 11,350 11,350 5,700 11,350 PAYROLL & PURCHASINGAmount of Payroll Processed $8,755,599 $8,917,742 $8,750,288 $9,538,093 $4,249,003 $9,500,000F/T Employees entered in P/R 126 138 131 126 126 130Number Requisitions 2,089 2,440 2,247 2,301 1,958 2,500 Vendors 285 319 323 323 325 326
258
FY 2018-2019 ADOPTED GENERAL FUND BUDGET PUBLIC FACILITIES ADMIN PROGRAM HIGHLIGHTS
CITY OF BRIDGEPORT, CONNECTICUT
FY 2017-2018 GOAL STATUS 1) In pursuit of Mayor’s drive for a cleaner City with reduced litter:
a) Increase number of worker hours in street vacuums by 10-20% with proportional increase intons picked up.b) Increase number of worker hours in street sweepers by 10-20% with proportional increasein miles swept and loads discarded.6 MONTH STATUS: Partially meeting goal. Street sweeping and vacuuming given high priority bydepartment with worker-input measures up approximately 10%. Manpower remains a challenge.Vacant positions throughout Sanitation, Recycling and Transfer Station drain fill-ins fromRoadway, meaning that on a typical day, there may be only approximately 19 workers availablefor actual Roadway activities.
2) Continue crackdown on illegal dumping through use of surveillance cameras and increased lawenforcement.6 MONTH STATUS: Meeting goal. Working with Police Department, ten new illegal dumpingcameras were installed during calendar years 2016 and 2017, leading to 27 caught on camera,15 arrests and $7,150 in fines. Locations that had been seeing daily illegal dumping have seen itstop, or reduced to very little.
3) Work with other key City departments to re-establish vigorous enforcement of alternate-side ofstreet parking to provide better access to the curb for street sweeping, street vacuuming, snowremoval and overall cleanup efforts.6 MONTH STATUS: Partially meeting goal. Alternate-side enforcement dependent on availabilityof BPD.
4) Purchase or lease additional Sweepers and street vacuums to maintain and expand fleetavailability to reduce litter, sand and debris in streets and sidewalks.6 MONTH STATUS: Meeting goal. Leased one additional sweeper and purchased five streetvacuums.
5) Relocate Municipal Garage from existing facility at Asylum Street to 990 Housatonic toimprove vehicle maintenance and longevity while improving worker productivity andefficiency.6 MONTH STATUS: Meeting goal. Construction started Jan 2018. Expect summer 2018completion.
6) Finish re-design and schedule construction of Downtown Intermodal Transportationarea, making the Water Street train and bus stations better connected, providingimproved pickup/drop-off access, beautification, way-finding and making pedestrian-friendly.6 MONTH STATUS: Meeting goal. Multi-year project. Re-designs complete. State DOT approvalprocess April 2018 – Oct 2018. Construction likely spring 2019 start.
7) Continue trends in reduced energy consumption and expenditure levels.6 MONTH STATUS: Meeting goal. FY17 electric utilities re-established multi-year downward trendin consumption and expense. FY15 had seen first increase in eight years, and FY16 resumed thedownward momentum that FY17 continues. FY15 spike was due to increased rates and much
259
FY 2018-2019 ADOPTED GENERAL FUND BUDGET PUBLIC FACILITIES ADMIN PROGRAM HIGHLIGHTS
CITY OF BRIDGEPORT, CONNECTICUT
higher streetlight expense. The streetlight consumption the last four months of FY15 was more than double the levels of FY14, causing the whole fiscal year to increase by more than 20%. UI then performed streetlight changeovers to LED starting very-late FY15 and then throughout FY16, completing the changes during first quarter FY17. These issues make generating a baseline difficult to compare costs after the changeover to before, but so far 20% reduction reasonable. Expecting higher savings over time. Meanwhile, electric rates in effect Dec 2016 through Dec 2020 down approximately 11% from previous. Rates were higher in FY15 than FY14 by 40%, contributing to the spike at that time. Gas Utility Expenses increased slightly in FY17 after declining for FY16 and FY15. Gas utility expenses are less than half of what they were ten years ago, primarily due to rates. Continuous upgrades to boilers across City buildings helps as do improved energy management Comparatively mild winters have also helped. See Facilities Maintenance section for more comprehensive analysis, utility detail tables and graphs.
8) Continue to reduce refuse tonnage and increase recycling thereby continuing to reducetip fee expenses and increase recycling revenue.6 MONTH STATUS: Meeting goal, efforts ongoing. Single Stream recycling’s, first six years’ resultsexcellent. Single Stream (no sort) recycling initiated September 2011. In first twelve months ofSingle Stream, delivered 5155 tons of recycling, which was a 61% increase from the previoustwelve months’ 3203 tons. Growth continued through the second year of Single Stream (Sept2012-Aug 2013) as citywide 5346 tons of recycling were delivered. The third year of Single Streamsaw continued growth up to 5459 tons, or 2% over the previous year. That trend continued inFY15, with 5669 tons collected, an increase of almost 4% over the previous year. By FY16, SingleStream recycling tonnage up to 6117 tons, and FY17 totaled 6341 tons, which represents almostdouble the tons collected in the last year before Single Stream. So, the big growth happenedimmediately after switching to Single Stream but then continued strongly every year after that,with annual increases no less than 2% and as high as 8%, quite an accomplishment given thelighter materials involved and efforts industry-wide toward, lighter, smaller packaging, and muchless paper. Meanwhile solid waste tonnages citywide (all sources) during those same periodsdropped from 60,436 in FY11, to 58,736 for FY12, 55,698 for FY13, 55,538 in FY14, to 55,224 inFY15, back up to 57,218 in FY16, and then decreasing again in FY17 down to 55,088. Solid wastetonnages can rise or fall for many reasons, only one of which is recycling. But if assume all newtons recycled would have entered the solid waste stream, then City avoided $130k tip fee expense just from the first-year increase alone. The value of the tip fees avoided for all the tons of recycling in FY17 (not just the increase) was $389k. Additionally, the City entered into a five-year contracteffective July 1, 2013 that pays a guaranteed minimum for the Single Stream recycling and anadditional bonus rate for clean cardboard, resulting in approximately $110k-$140k new revenueeach year! Combining the tip fee avoided plus the new revenue, that means recycling contributedapproximately $529k to the City’s Budget for FY17 alone! Over the past six years since going toSingle Stream, the combination of tip fees avoided plus revenues received totals more than $2.7Mbenefit to the City’s Budget.
9) Continue improvements to City facilities, including buildings, parks and streets.6 MONTH STATUS: Meeting goal, ongoing, continuous effort. See Facilities Maintenance,Roadway and Parks sections for more details.
10) Continue to upgrade vehicle and equipment fleet.
260
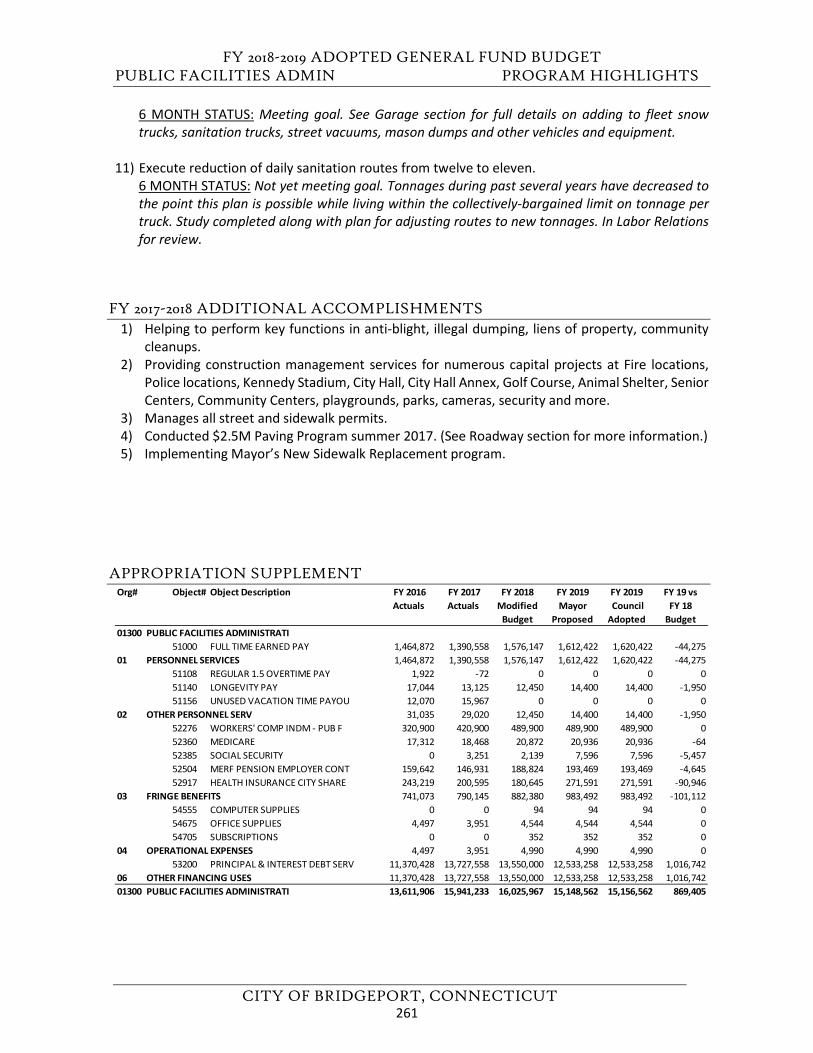
FY 2018-2019 ADOPTED GENERAL FUND BUDGET PUBLIC FACILITIES ADMIN PROGRAM HIGHLIGHTS
CITY OF BRIDGEPORT, CONNECTICUT
6 MONTH STATUS: Meeting goal. See Garage section for full details on adding to fleet snow trucks, sanitation trucks, street vacuums, mason dumps and other vehicles and equipment.
11) Execute reduction of daily sanitation routes from twelve to eleven.6 MONTH STATUS: Not yet meeting goal. Tonnages during past several years have decreased tothe point this plan is possible while living within the collectively-bargained limit on tonnage pertruck. Study completed along with plan for adjusting routes to new tonnages. In Labor Relationsfor review.
FY 2017-2018 ADDITIONAL ACCOMPLISHMENTS 1) Helping to perform key functions in anti-blight, illegal dumping, liens of property, community
cleanups.2) Providing construction management services for numerous capital projects at Fire locations,
Police locations, Kennedy Stadium, City Hall, City Hall Annex, Golf Course, Animal Shelter, SeniorCenters, Community Centers, playgrounds, parks, cameras, security and more.
3) Manages all street and sidewalk permits.4) Conducted $2.5M Paving Program summer 2017. (See Roadway section for more information.)5) Implementing Mayor’s New Sidewalk Replacement program.
APPROPRIATION SUPPLEMENT Org# Object# Object Description FY 2016
Actuals FY 2017 Actuals
FY 2018 Modified
Budget
FY 2019Mayor
Proposed
FY 2019 Council Adopted
FY 19 vs FY 18
Budget01300 PUBLIC FACILITIES ADMINISTRATI
51000 FULL TIME EARNED PAY 1,464,872 1,390,558 1,576,147 1,612,422 1,620,422 -44,27501 PERSONNEL SERVICES 1,464,872 1,390,558 1,576,147 1,612,422 1,620,422 -44,275
51108 REGULAR 1.5 OVERTIME PAY 1,922 -72 0 0 0 051140 LONGEVITY PAY 17,044 13,125 12,450 14,400 14,400 -1,95051156 UNUSED VACATION TIME PAYOU 12,070 15,967 0 0 0 0
02 OTHER PERSONNEL SERV 31,035 29,020 12,450 14,400 14,400 -1,95052276 WORKERS' COMP INDM - PUB F 320,900 420,900 489,900 489,900 489,900 052360 MEDICARE 17,312 18,468 20,872 20,936 20,936 -6452385 SOCIAL SECURITY 0 3,251 2,139 7,596 7,596 -5,45752504 MERF PENSION EMPLOYER CONT 159,642 146,931 188,824 193,469 193,469 -4,64552917 HEALTH INSURANCE CITY SHARE 243,219 200,595 180,645 271,591 271,591 -90,946
03 FRINGE BENEFITS 741,073 790,145 882,380 983,492 983,492 -101,11254555 COMPUTER SUPPLIES 0 0 94 94 94 054675 OFFICE SUPPLIES 4,497 3,951 4,544 4,544 4,544 054705 SUBSCRIPTIONS 0 0 352 352 352 0
04 OPERATIONAL EXPENSES 4,497 3,951 4,990 4,990 4,990 053200 PRINCIPAL & INTEREST DEBT SERV 11,370,428 13,727,558 13,550,000 12,533,258 12,533,258 1,016,742
06 OTHER FINANCING USES 11,370,428 13,727,558 13,550,000 12,533,258 12,533,258 1,016,74201300 PUBLIC FACILITIES ADMINISTRATI 13,611,906 15,941,233 16,025,967 15,148,562 15,156,562 869,405
261

FY 2018-2019 ADOPTED GENERAL FUND BUDGET
CITY OF BRIDGEPORT, CONNECTICUT
This page left blank intentionally.
262
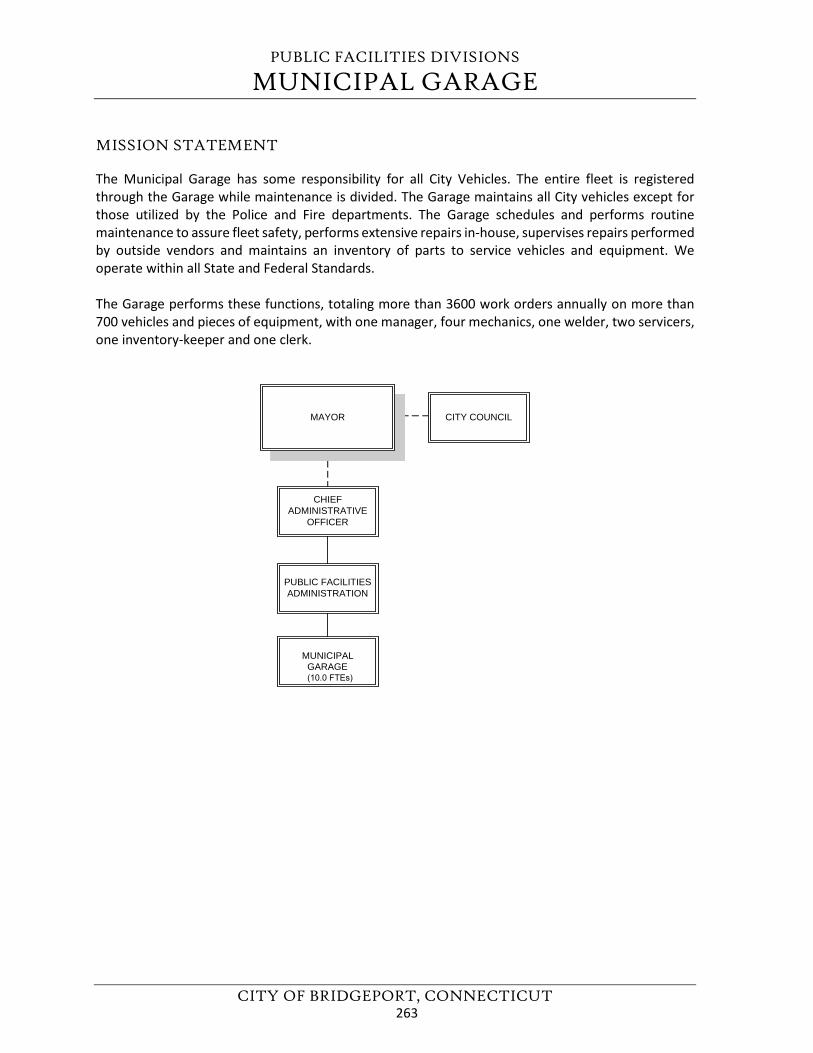
PUBLIC FACILITIES DIVISIONS
MUNICIPAL GARAGE
CITY OF BRIDGEPORT, CONNECTICUT
MISSION STATEMENT
The Municipal Garage has some responsibility for all City Vehicles. The entire fleet is registered through the Garage while maintenance is divided. The Garage maintains all City vehicles except for those utilized by the Police and Fire departments. The Garage schedules and performs routine maintenance to assure fleet safety, performs extensive repairs in-house, supervises repairs performed by outside vendors and maintains an inventory of parts to service vehicles and equipment. We operate within all State and Federal Standards.
The Garage performs these functions, totaling more than 3600 work orders annually on more than 700 vehicles and pieces of equipment, with one manager, four mechanics, one welder, two servicers, one inventory-keeper and one clerk.
CHIEFADMINISTRATIVE
OFFICER
PUBLIC FACILITIESADMINISTRATION
MUNICIPALGARAGE(10.0 FTEs)
MAYOR CITY COUNCIL
263

FY 2018-2019 ADOPTED GENERAL FUND BUDGET MUNICIPAL GARAGE BUDGET DETAIL
CITY OF BRIDGEPORT, CONNECTICUT
John Ricci Manager
REVENUE SUMMARY
Not Applicable
APPROPRIATION SUMMARY
PERSONNEL SUMMARY
Org# FY 2016 Actuals
FY 2017 Actuals
FY 2018 Modified
Budget
FY 2019 Mayor
Proposed
FY 2019 Council
Adopted
FY 19 vs FY 18
Budget01305 MUNICIPAL GARAGE
01 PERSONNEL SERVICES 473,751 449,300 567,755 603,261 603,261 -35,50602 OTHER PERSONNEL SERV 166,413 149,092 131,120 131,260 131,260 -14003 FRINGE BENEFITS 167,706 196,106 206,832 242,122 242,122 -35,29004 OPERATIONAL EXPENSES 1,055,619 1,083,365 1,388,044 1,310,510 1,210,584 177,46005 SPECIAL SERVICES 297,442 282,376 323,350 373,350 323,350 0
2,160,931 2,160,239 2,617,101 2,660,503 2,510,577 106,524
ORG.CODE/DEPARTMENT FTE 2018 FTE 2019 VAC. NEW UNF. POSITION TITLE
FY2018 Modified
Budget
FY2019 Mayor
Proposed
FY2019 Council
Adopted
FY18 vs FY19
Budget
1.00 1.00 0.00 0.00 0.00 GARAGE CLERK 41,346 42,566 42,566 -1,2201.00 0.00 0.00 0.00 1.00 AUTOMOTIVE PARTS SPECIALIST 57,702 0 0 57,7020.00 1.00 0.00 1.00 0.00 MANAGER MUNICIPAL GARAGE 0 76,217 76,217 -76,2171.00 1.00 0.00 0.00 0.00 EQUIPMENT MECHANIC FOREMAN 60,267 60,267 60,267 01.00 1.00 0.00 0.00 0.00 WELDER 70,260 73,099 73,099 -2,8394.00 4.00 0.00 0.00 0.00 FLEET MECHANIC 254,343 264,618 264,618 -10,275
01305000 2.00 2.00 0.00 0.00 0.00 AUTOMOTIVE SERVICER 83,837 86,494 86,494 -2,657MUNICIPAL GARAGE 10.00 10.00 0.00 1.00 1.00 567,755 603,261 603,261 -35,506
264
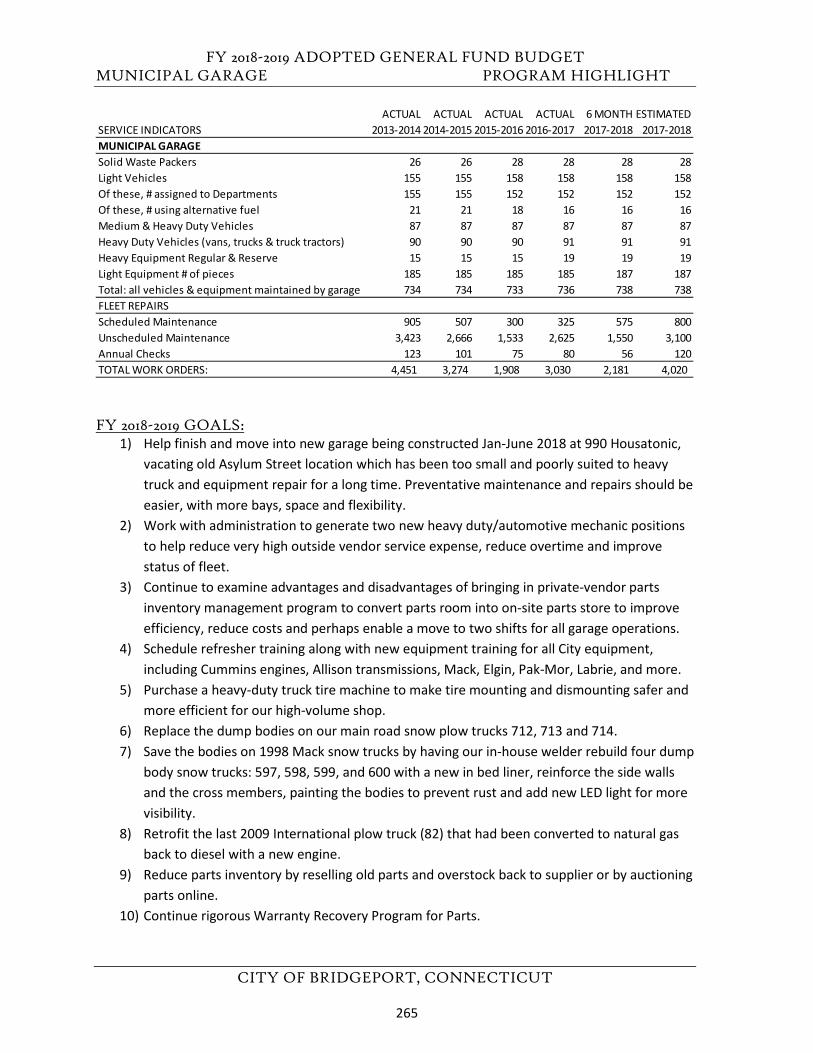
FY 2018-2019 ADOPTED GENERAL FUND BUDGET MUNICIPAL GARAGE PROGRAM HIGHLIGHT
CITY OF BRIDGEPORT, CONNECTICUT
FY 2018-2019 GOALS: 1) Help finish and move into new garage being constructed Jan-June 2018 at 990 Housatonic,
vacating old Asylum Street location which has been too small and poorly suited to heavytruck and equipment repair for a long time. Preventative maintenance and repairs should beeasier, with more bays, space and flexibility.
2) Work with administration to generate two new heavy duty/automotive mechanic positionsto help reduce very high outside vendor service expense, reduce overtime and improvestatus of fleet.
3) Continue to examine advantages and disadvantages of bringing in private-vendor partsinventory management program to convert parts room into on-site parts store to improveefficiency, reduce costs and perhaps enable a move to two shifts for all garage operations.
4) Schedule refresher training along with new equipment training for all City equipment,including Cummins engines, Allison transmissions, Mack, Elgin, Pak-Mor, Labrie, and more.
5) Purchase a heavy-duty truck tire machine to make tire mounting and dismounting safer andmore efficient for our high-volume shop.
6) Replace the dump bodies on our main road snow plow trucks 712, 713 and 714.7) Save the bodies on 1998 Mack snow trucks by having our in-house welder rebuild four dump
body snow trucks: 597, 598, 599, and 600 with a new in bed liner, reinforce the side wallsand the cross members, painting the bodies to prevent rust and add new LED light for morevisibility.
8) Retrofit the last 2009 International plow truck (82) that had been converted to natural gasback to diesel with a new engine.
9) Reduce parts inventory by reselling old parts and overstock back to supplier or by auctioningparts online.
10) Continue rigorous Warranty Recovery Program for Parts.
ACTUAL ACTUAL ACTUAL ACTUAL 6 MONTH ESTIMATEDSERVICE INDICATORS 2013-2014 2014-2015 2015-2016 2016-2017 2017-2018 2017-2018MUNICIPAL GARAGESolid Waste Packers 26 26 28 28 28 28Light Vehicles 155 155 158 158 158 158Of these, # assigned to Departments 155 155 152 152 152 152Of these, # using alternative fuel 21 21 18 16 16 16Medium & Heavy Duty Vehicles 87 87 87 87 87 87Heavy Duty Vehicles (vans, trucks & truck tractors) 90 90 90 91 91 91Heavy Equipment Regular & Reserve 15 15 15 19 19 19Light Equipment # of pieces 185 185 185 185 187 187Total: all vehicles & equipment maintained by garage 734 734 733 736 738 738FLEET REPAIRS Scheduled Maintenance 905 507 300 325 575 800Unscheduled Maintenance 3,423 2,666 1,533 2,625 1,550 3,100Annual Checks 123 101 75 80 56 120TOTAL WORK ORDERS: 4,451 3,274 1,908 3,030 2,181 4,020
265
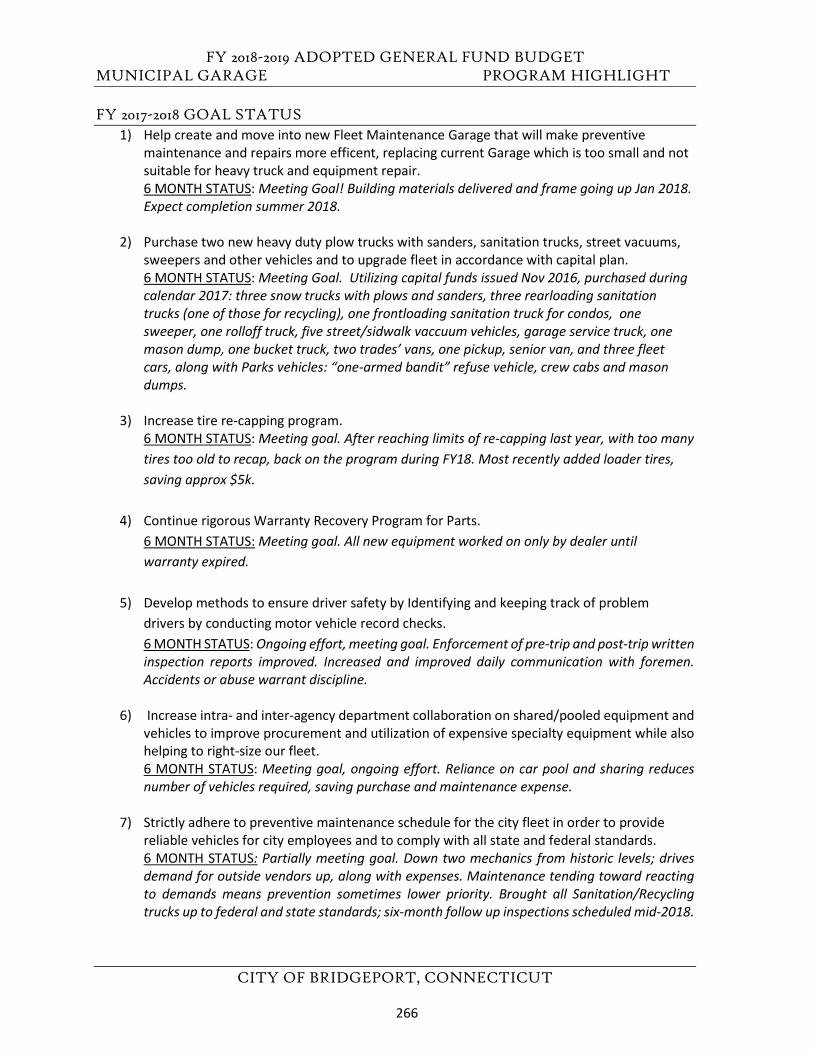
FY 2018-2019 ADOPTED GENERAL FUND BUDGET MUNICIPAL GARAGE PROGRAM HIGHLIGHT
CITY OF BRIDGEPORT, CONNECTICUT
FY 2017-2018 GOAL STATUS 1) Help create and move into new Fleet Maintenance Garage that will make preventive
maintenance and repairs more efficent, replacing current Garage which is too small and notsuitable for heavy truck and equipment repair.6 MONTH STATUS: Meeting Goal! Building materials delivered and frame going up Jan 2018.Expect completion summer 2018.
2) Purchase two new heavy duty plow trucks with sanders, sanitation trucks, street vacuums,sweepers and other vehicles and to upgrade fleet in accordance with capital plan.6 MONTH STATUS: Meeting Goal. Utilizing capital funds issued Nov 2016, purchased duringcalendar 2017: three snow trucks with plows and sanders, three rearloading sanitationtrucks (one of those for recycling), one frontloading sanitation truck for condos, onesweeper, one rolloff truck, five street/sidwalk vaccuum vehicles, garage service truck, onemason dump, one bucket truck, two trades’ vans, one pickup, senior van, and three fleetcars, along with Parks vehicles: “one-armed bandit” refuse vehicle, crew cabs and masondumps.
3) Increase tire re-capping program.6 MONTH STATUS: Meeting goal. After reaching limits of re-capping last year, with too manytires too old to recap, back on the program during FY18. Most recently added loader tires,saving approx $5k.
4) Continue rigorous Warranty Recovery Program for Parts.6 MONTH STATUS: Meeting goal. All new equipment worked on only by dealer untilwarranty expired.
5) Develop methods to ensure driver safety by Identifying and keeping track of problemdrivers by conducting motor vehicle record checks.6 MONTH STATUS: Ongoing effort, meeting goal. Enforcement of pre-trip and post-trip written inspection reports improved. Increased and improved daily communication with foremen.Accidents or abuse warrant discipline.
6) Increase intra- and inter-agency department collaboration on shared/pooled equipment andvehicles to improve procurement and utilization of expensive specialty equipment while alsohelping to right-size our fleet.6 MONTH STATUS: Meeting goal, ongoing effort. Reliance on car pool and sharing reducesnumber of vehicles required, saving purchase and maintenance expense.
7) Strictly adhere to preventive maintenance schedule for the city fleet in order to providereliable vehicles for city employees and to comply with all state and federal standards.6 MONTH STATUS: Partially meeting goal. Down two mechanics from historic levels; drivesdemand for outside vendors up, along with expenses. Maintenance tending toward reactingto demands means prevention sometimes lower priority. Brought all Sanitation/Recyclingtrucks up to federal and state standards; six-month follow up inspections scheduled mid-2018.
266
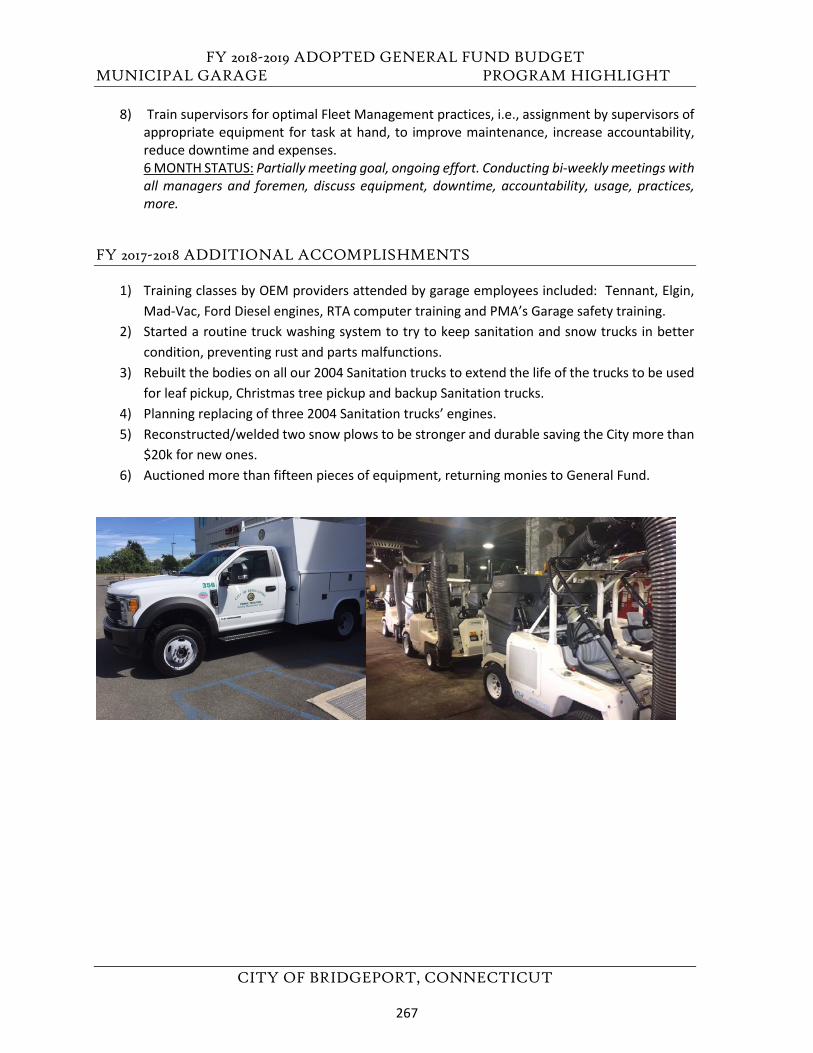
FY 2018-2019 ADOPTED GENERAL FUND BUDGET MUNICIPAL GARAGE PROGRAM HIGHLIGHT
CITY OF BRIDGEPORT, CONNECTICUT
8) Train supervisors for optimal Fleet Management practices, i.e., assignment by supervisors ofappropriate equipment for task at hand, to improve maintenance, increase accountability,reduce downtime and expenses.6 MONTH STATUS: Partially meeting goal, ongoing effort. Conducting bi-weekly meetings with all managers and foremen, discuss equipment, downtime, accountability, usage, practices,more.
FY 2017-2018 ADDITIONAL ACCOMPLISHMENTS
1) Training classes by OEM providers attended by garage employees included: Tennant, Elgin,Mad-Vac, Ford Diesel engines, RTA computer training and PMA’s Garage safety training.
2) Started a routine truck washing system to try to keep sanitation and snow trucks in bettercondition, preventing rust and parts malfunctions.
3) Rebuilt the bodies on all our 2004 Sanitation trucks to extend the life of the trucks to be usedfor leaf pickup, Christmas tree pickup and backup Sanitation trucks.
4) Planning replacing of three 2004 Sanitation trucks’ engines.5) Reconstructed/welded two snow plows to be stronger and durable saving the City more than
$20k for new ones.6) Auctioned more than fifteen pieces of equipment, returning monies to General Fund.
267
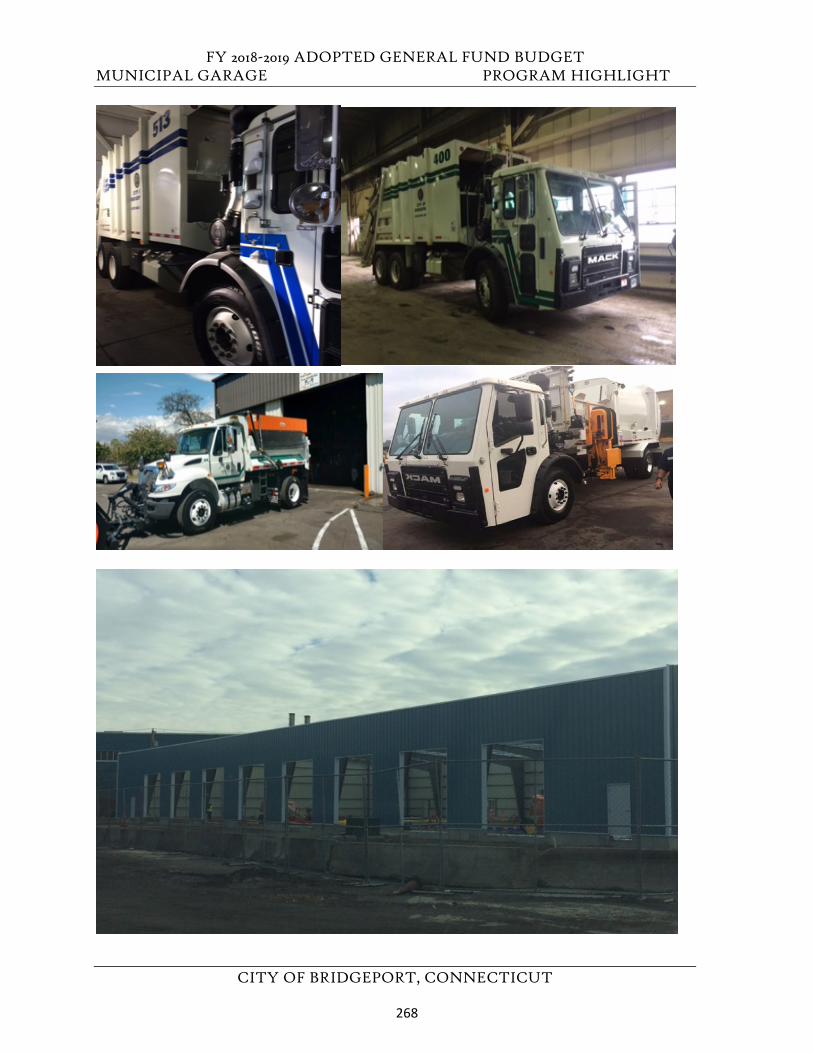
FY 2018-2019 ADOPTED GENERAL FUND BUDGET MUNICIPAL GARAGE PROGRAM HIGHLIGHT
CITY OF BRIDGEPORT, CONNECTICUT
268
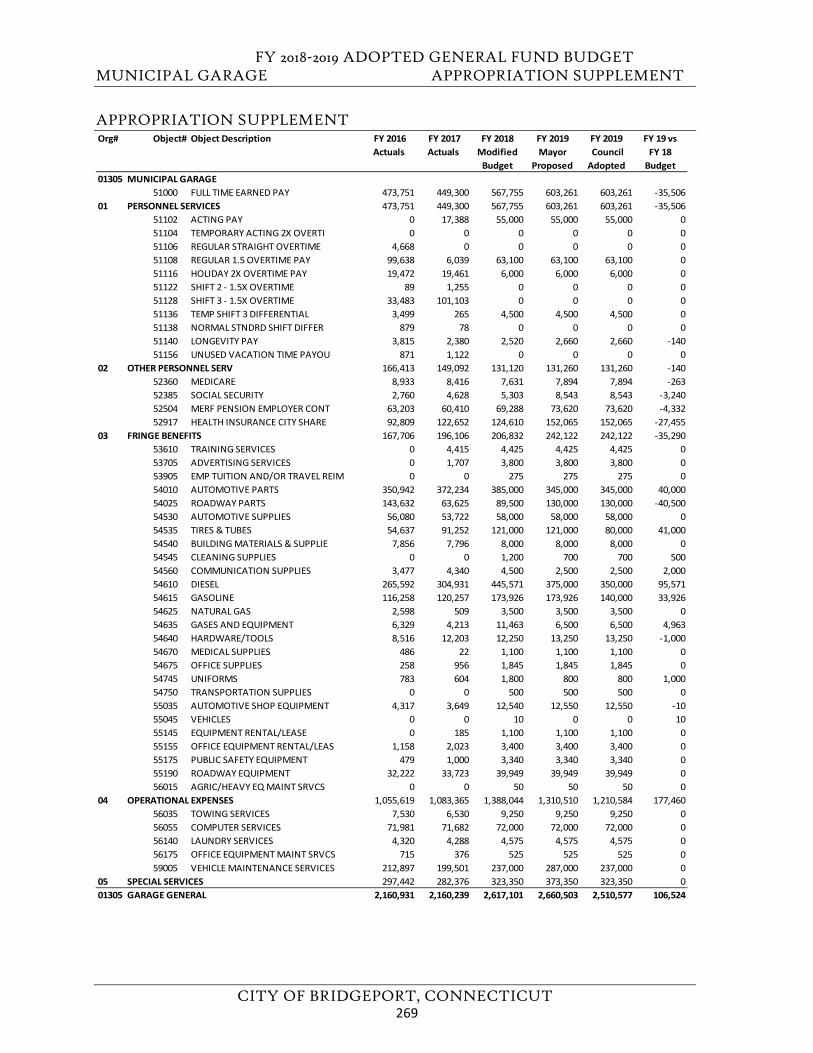
FY 2018-2019 ADOPTED GENERAL FUND BUDGET MUNICIPAL GARAGE APPROPRIATION SUPPLEMENT
CITY OF BRIDGEPORT, CONNECTICUT
APPROPRIATION SUPPLEMENT Org# Object# Object Description FY 2016
Actuals FY 2017 Actuals
FY 2018 Modified
Budget
FY 2019Mayor
Proposed
FY 2019 Council Adopted
FY 19 vs FY 18
Budget01305 MUNICIPAL GARAGE
51000 FULL TIME EARNED PAY 473,751 449,300 567,755 603,261 603,261 -35,50601 PERSONNEL SERVICES 473,751 449,300 567,755 603,261 603,261 -35,506
51102 ACTING PAY 0 17,388 55,000 55,000 55,000 051104 TEMPORARY ACTING 2X OVERTI 0 0 0 0 0 051106 REGULAR STRAIGHT OVERTIME 4,668 0 0 0 0 051108 REGULAR 1.5 OVERTIME PAY 99,638 6,039 63,100 63,100 63,100 051116 HOLIDAY 2X OVERTIME PAY 19,472 19,461 6,000 6,000 6,000 051122 SHIFT 2 - 1.5X OVERTIME 89 1,255 0 0 0 051128 SHIFT 3 - 1.5X OVERTIME 33,483 101,103 0 0 0 051136 TEMP SHIFT 3 DIFFERENTIAL 3,499 265 4,500 4,500 4,500 051138 NORMAL STNDRD SHIFT DIFFER 879 78 0 0 0 051140 LONGEVITY PAY 3,815 2,380 2,520 2,660 2,660 -14051156 UNUSED VACATION TIME PAYOU 871 1,122 0 0 0 0
02 OTHER PERSONNEL SERV 166,413 149,092 131,120 131,260 131,260 -14052360 MEDICARE 8,933 8,416 7,631 7,894 7,894 -26352385 SOCIAL SECURITY 2,760 4,628 5,303 8,543 8,543 -3,24052504 MERF PENSION EMPLOYER CONT 63,203 60,410 69,288 73,620 73,620 -4,33252917 HEALTH INSURANCE CITY SHARE 92,809 122,652 124,610 152,065 152,065 -27,455
03 FRINGE BENEFITS 167,706 196,106 206,832 242,122 242,122 -35,29053610 TRAINING SERVICES 0 4,415 4,425 4,425 4,425 053705 ADVERTISING SERVICES 0 1,707 3,800 3,800 3,800 053905 EMP TUITION AND/OR TRAVEL REIM 0 0 275 275 275 054010 AUTOMOTIVE PARTS 350,942 372,234 385,000 345,000 345,000 40,00054025 ROADWAY PARTS 143,632 63,625 89,500 130,000 130,000 -40,50054530 AUTOMOTIVE SUPPLIES 56,080 53,722 58,000 58,000 58,000 054535 TIRES & TUBES 54,637 91,252 121,000 121,000 80,000 41,00054540 BUILDING MATERIALS & SUPPLIE 7,856 7,796 8,000 8,000 8,000 054545 CLEANING SUPPLIES 0 0 1,200 700 700 50054560 COMMUNICATION SUPPLIES 3,477 4,340 4,500 2,500 2,500 2,00054610 DIESEL 265,592 304,931 445,571 375,000 350,000 95,57154615 GASOLINE 116,258 120,257 173,926 173,926 140,000 33,92654625 NATURAL GAS 2,598 509 3,500 3,500 3,500 054635 GASES AND EQUIPMENT 6,329 4,213 11,463 6,500 6,500 4,96354640 HARDWARE/TOOLS 8,516 12,203 12,250 13,250 13,250 -1,00054670 MEDICAL SUPPLIES 486 22 1,100 1,100 1,100 054675 OFFICE SUPPLIES 258 956 1,845 1,845 1,845 054745 UNIFORMS 783 604 1,800 800 800 1,00054750 TRANSPORTATION SUPPLIES 0 0 500 500 500 055035 AUTOMOTIVE SHOP EQUIPMENT 4,317 3,649 12,540 12,550 12,550 -1055045 VEHICLES 0 0 10 0 0 1055145 EQUIPMENT RENTAL/LEASE 0 185 1,100 1,100 1,100 055155 OFFICE EQUIPMENT RENTAL/LEAS 1,158 2,023 3,400 3,400 3,400 055175 PUBLIC SAFETY EQUIPMENT 479 1,000 3,340 3,340 3,340 055190 ROADWAY EQUIPMENT 32,222 33,723 39,949 39,949 39,949 056015 AGRIC/HEAVY EQ MAINT SRVCS 0 0 50 50 50 0
04 OPERATIONAL EXPENSES 1,055,619 1,083,365 1,388,044 1,310,510 1,210,584 177,46056035 TOWING SERVICES 7,530 6,530 9,250 9,250 9,250 056055 COMPUTER SERVICES 71,981 71,682 72,000 72,000 72,000 056140 LAUNDRY SERVICES 4,320 4,288 4,575 4,575 4,575 056175 OFFICE EQUIPMENT MAINT SRVCS 715 376 525 525 525 059005 VEHICLE MAINTENANCE SERVICES 212,897 199,501 237,000 287,000 237,000 0
05 SPECIAL SERVICES 297,442 282,376 323,350 373,350 323,350 001305 GARAGE GENERAL 2,160,931 2,160,239 2,617,101 2,660,503 2,510,577 106,524
269
FY 2018-2019 ADOPTED GENERAL FUND BUDGET
CITY OF BRIDGEPORT, CONNECTICUT
This page left blank intentionally.
270
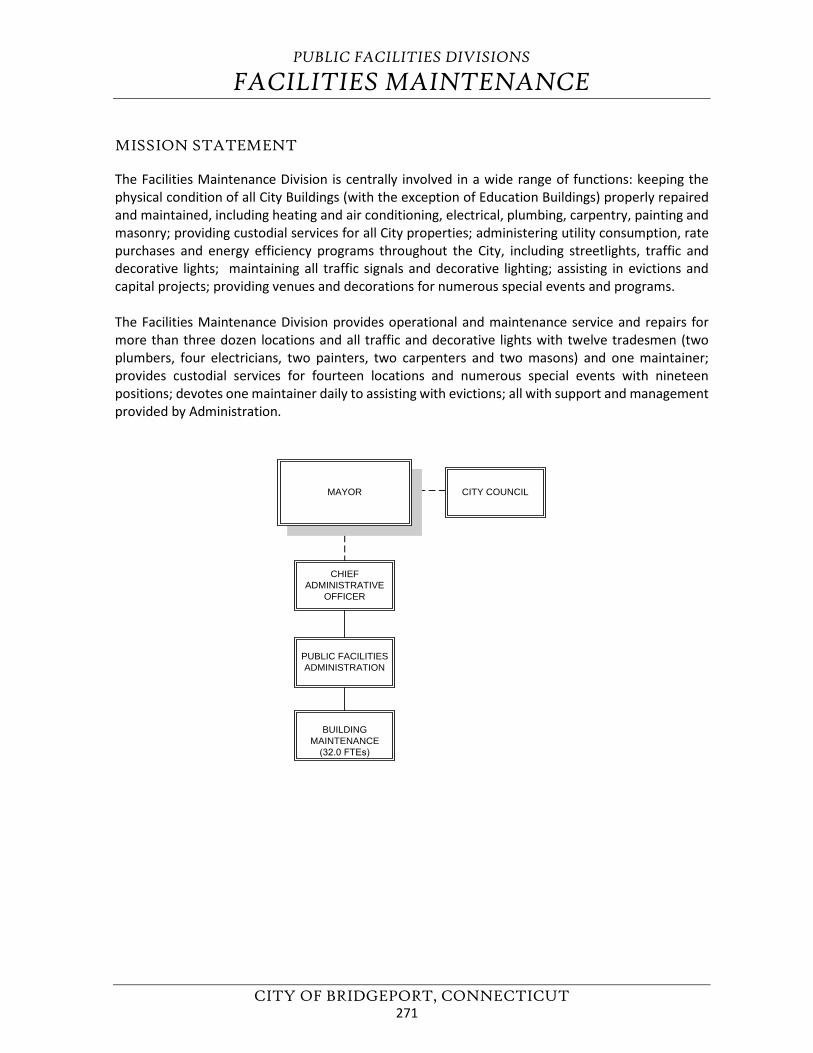
PUBLIC FACILITIES DIVISIONS
FACILITIES MAINTENANCE
CITY OF BRIDGEPORT, CONNECTICUT
MISSION STATEMENT
The Facilities Maintenance Division is centrally involved in a wide range of functions: keeping the physical condition of all City Buildings (with the exception of Education Buildings) properly repaired and maintained, including heating and air conditioning, electrical, plumbing, carpentry, painting and masonry; providing custodial services for all City properties; administering utility consumption, rate purchases and energy efficiency programs throughout the City, including streetlights, traffic and decorative lights; maintaining all traffic signals and decorative lighting; assisting in evictions and capital projects; providing venues and decorations for numerous special events and programs.
The Facilities Maintenance Division provides operational and maintenance service and repairs for more than three dozen locations and all traffic and decorative lights with twelve tradesmen (two plumbers, four electricians, two painters, two carpenters and two masons) and one maintainer; provides custodial services for fourteen locations and numerous special events with nineteen positions; devotes one maintainer daily to assisting with evictions; all with support and management provided by Administration.
CHIEFADMINISTRATIVE
OFFICER
PUBLIC FACILITIESADMINISTRATION
BUILDINGMAINTENANCE
(32.0 FTEs)
MAYOR CITY COUNCIL
271
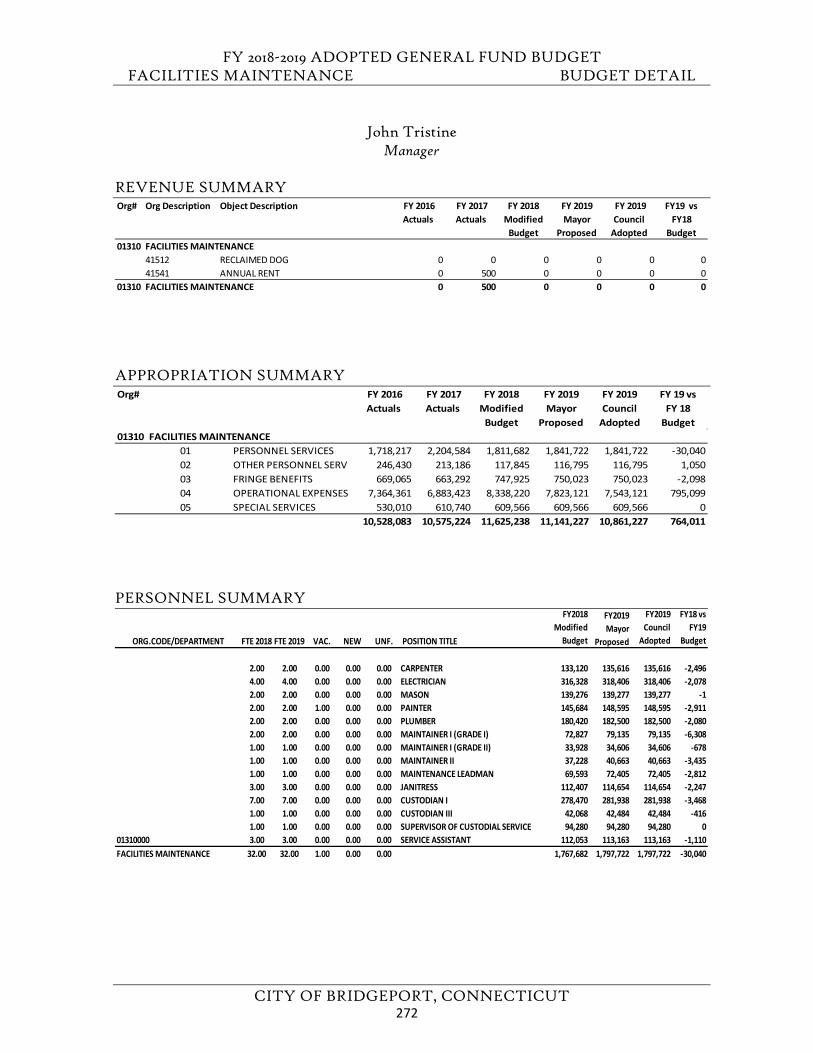
FY 2018-2019 ADOPTED GENERAL FUND BUDGET FACILITIES MAINTENANCE BUDGET DETAIL
CITY OF BRIDGEPORT, CONNECTICUT
John Tristine Manager
REVENUE SUMMARY
APPROPRIATION SUMMARY
PERSONNEL SUMMARY
Org# Org Description Object Description FY 2016 Actuals
FY 2017 Actuals
FY 2018 Modified
Budget
FY 2019 Mayor
Proposed
FY 2019 Council
Adopted
FY19 vs FY18
Budget01310 FACILITIES MAINTENANCE
41512 RECLAIMED DOG 0 0 0 0 0 041541 ANNUAL RENT 0 500 0 0 0 0
01310 FACILITIES MAINTENANCE 0 500 0 0 0 0
Org# FY 2016 Actuals
FY 2017 Actuals
FY 2018 Modified
Budget
FY 2019 Mayor
Proposed
FY 2019 Council
Adopted
FY 19 vs FY 18
Budget01310 FACILITIES MAINTENANCE
01 PERSONNEL SERVICES 1,718,217 2,204,584 1,811,682 1,841,722 1,841,722 -30,04002 OTHER PERSONNEL SERV 246,430 213,186 117,845 116,795 116,795 1,05003 FRINGE BENEFITS 669,065 663,292 747,925 750,023 750,023 -2,09804 OPERATIONAL EXPENSES 7,364,361 6,883,423 8,338,220 7,823,121 7,543,121 795,09905 SPECIAL SERVICES 530,010 610,740 609,566 609,566 609,566 0
10,528,083 10,575,224 11,625,238 11,141,227 10,861,227 764,011
ORG.CODE/DEPARTMENT FTE 2018 FTE 2019 VAC. NEW UNF. POSITION TITLE
FY2018 Modified
Budget
FY2019 Mayor
Proposed
FY2019 Council
Adopted
FY18 vs FY19
Budget
2.00 2.00 0.00 0.00 0.00 CARPENTER 133,120 135,616 135,616 -2,4964.00 4.00 0.00 0.00 0.00 ELECTRICIAN 316,328 318,406 318,406 -2,0782.00 2.00 0.00 0.00 0.00 MASON 139,276 139,277 139,277 -12.00 2.00 1.00 0.00 0.00 PAINTER 145,684 148,595 148,595 -2,9112.00 2.00 0.00 0.00 0.00 PLUMBER 180,420 182,500 182,500 -2,0802.00 2.00 0.00 0.00 0.00 MAINTAINER I (GRADE I) 72,827 79,135 79,135 -6,3081.00 1.00 0.00 0.00 0.00 MAINTAINER I (GRADE II) 33,928 34,606 34,606 -6781.00 1.00 0.00 0.00 0.00 MAINTAINER II 37,228 40,663 40,663 -3,4351.00 1.00 0.00 0.00 0.00 MAINTENANCE LEADMAN 69,593 72,405 72,405 -2,8123.00 3.00 0.00 0.00 0.00 JANITRESS 112,407 114,654 114,654 -2,2477.00 7.00 0.00 0.00 0.00 CUSTODIAN I 278,470 281,938 281,938 -3,4681.00 1.00 0.00 0.00 0.00 CUSTODIAN III 42,068 42,484 42,484 -4161.00 1.00 0.00 0.00 0.00 SUPERVISOR OF CUSTODIAL SERVICE 94,280 94,280 94,280 0
01310000 3.00 3.00 0.00 0.00 0.00 SERVICE ASSISTANT 112,053 113,163 113,163 -1,110FACILITIES MAINTENANCE 32.00 32.00 1.00 0.00 0.00 1,767,682 1,797,722 1,797,722 -30,040
272
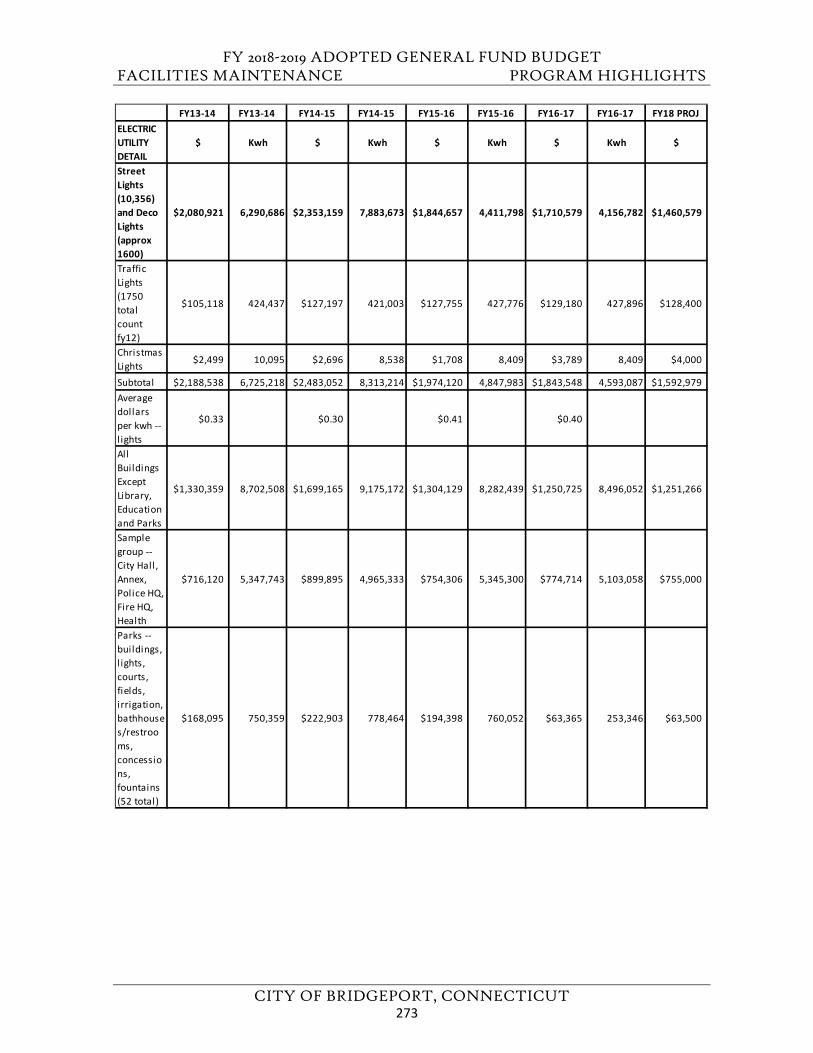
FY 2018-2019 ADOPTED GENERAL FUND BUDGET FACILITIES MAINTENANCE PROGRAM HIGHLIGHTS
CITY OF BRIDGEPORT, CONNECTICUT
FY13-14 FY13-14 FY14-15 FY14-15 FY15-16 FY15-16 FY16-17 FY16-17 FY18 PROJ ELECTRIC UTILITY DETAIL
$ Kwh $ Kwh $ Kwh $ Kwh $
Street Lights (10,356) and Deco Lights (approx 1600)
$2,080,921 6,290,686 $2,353,159 7,883,673 $1,844,657 4,411,798 $1,710,579 4,156,782 $1,460,579
Traffic Lights (1750 total count fy12)
$105,118 424,437 $127,197 421,003 $127,755 427,776 $129,180 427,896 $128,400
Christmas Lights $2,499 10,095 $2,696 8,538 $1,708 8,409 $3,789 8,409 $4,000
Subtotal $2,188,538 6,725,218 $2,483,052 8,313,214 $1,974,120 4,847,983 $1,843,548 4,593,087 $1,592,979Average dollars per kwh -- l ights
$0.33 $0.30 $0.41 $0.40
All Buildings Except Library, Education and Parks
$1,330,359 8,702,508 $1,699,165 9,175,172 $1,304,129 8,282,439 $1,250,725 8,496,052 $1,251,266
Sample group -- City Hall, Annex, Police HQ, Fire HQ, Health
$716,120 5,347,743 $899,895 4,965,333 $754,306 5,345,300 $774,714 5,103,058 $755,000
Parks -- buildings, l ights, courts, fields, irrigation, bathhouses/restrooms, concessions, fountains (52 total)
$168,095 750,359 $222,903 778,464 $194,398 760,052 $63,365 253,346 $63,500
273
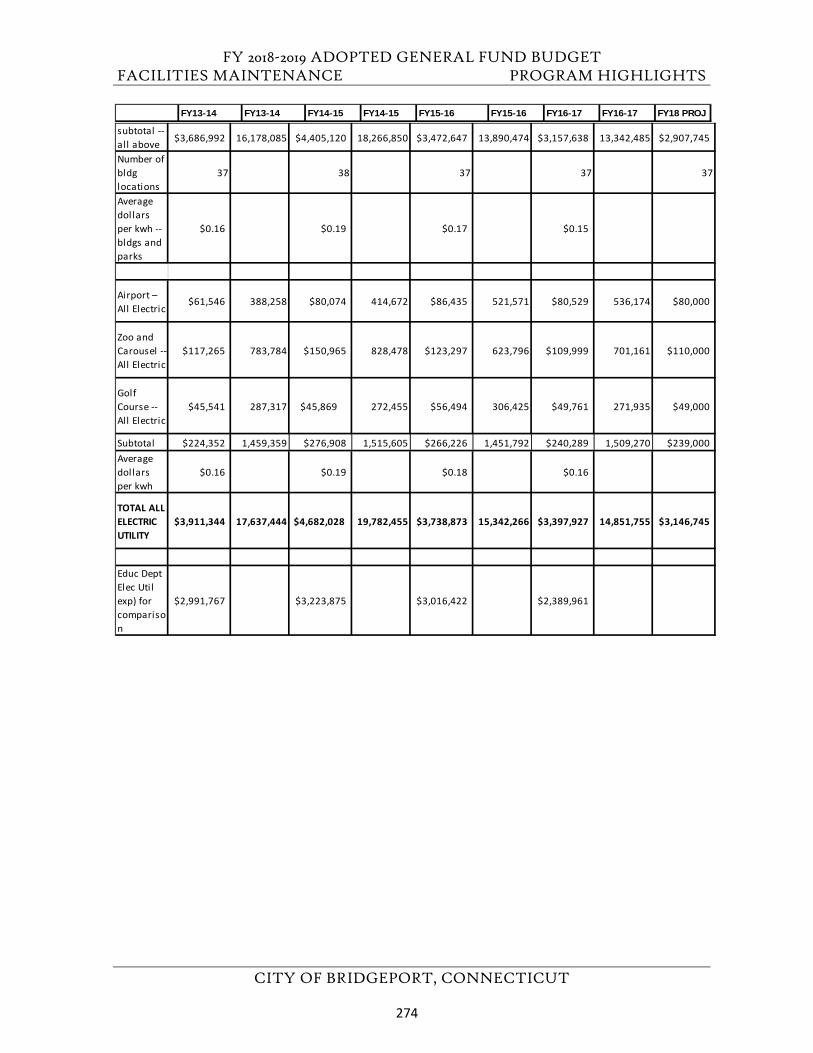
FY 2018-2019 ADOPTED GENERAL FUND BUDGET FACILITIES MAINTENANCE PROGRAM HIGHLIGHTS
CITY OF BRIDGEPORT, CONNECTICUT
FY13-14 FY13-14 FY14-15 FY14-15 FY15-16 FY15-16 FY16-17 FY16-17 FY18 PROJ
subtotal -- all above $3,686,992 16,178,085 $4,405,120 18,266,850 $3,472,647 13,890,474 $3,157,638 13,342,485 $2,907,745
Number of bldg locations
37 38 37 37 37
Average dollars per kwh -- bldgs and parks
$0.16 $0.19 $0.17 $0.15
Airport – All Electric
$61,546 388,258 $80,074 414,672 $86,435 521,571 $80,529 536,174 $80,000
Zoo and Carousel -- All Electric
$117,265 783,784 $150,965 828,478 $123,297 623,796 $109,999 701,161 $110,000
Golf Course -- All Electric
$45,541 287,317 $45,869 272,455 $56,494 306,425 $49,761 271,935 $49,000
Subtotal $224,352 1,459,359 $276,908 1,515,605 $266,226 1,451,792 $240,289 1,509,270 $239,000Average dollars per kwh
$0.16 $0.19 $0.18 $0.16
TOTAL ALL ELECTRIC UTILITY
$3,911,344 17,637,444 $4,682,028 19,782,455 $3,738,873 15,342,266 $3,397,927 14,851,755 $3,146,745
Educ Dept Elec Util exp) for comparison
$2,991,767 $3,223,875 $3,016,422 $2,389,961
274
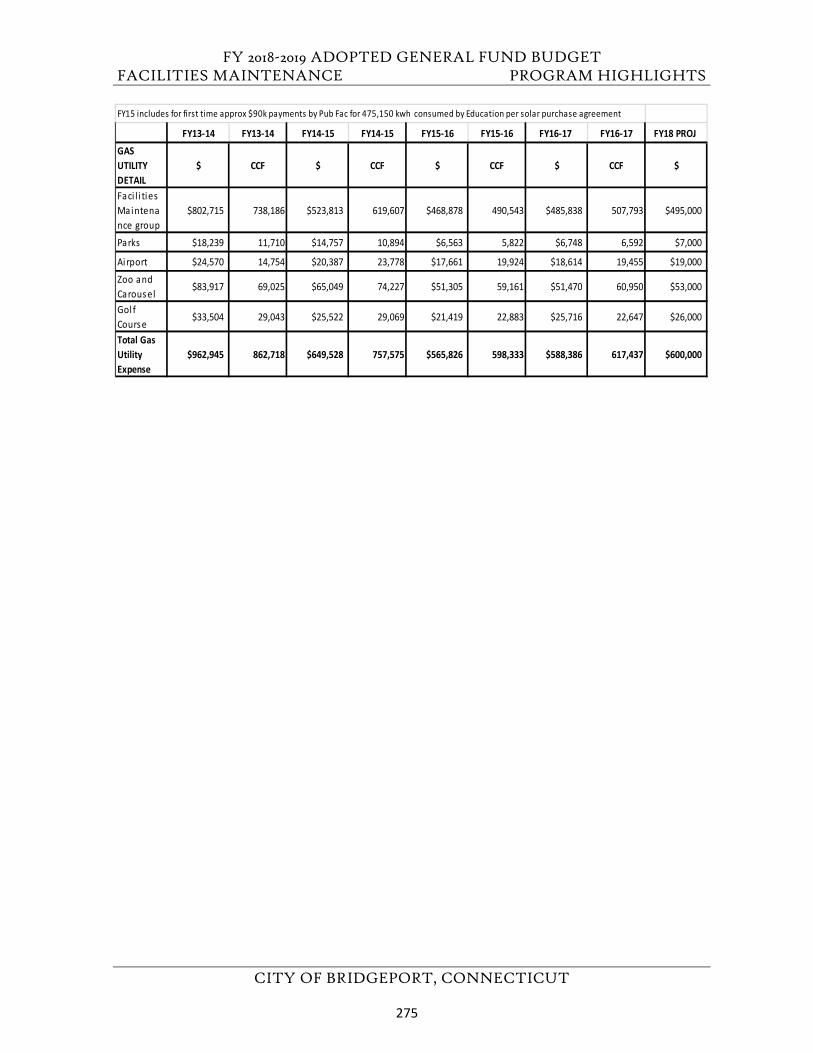
FY 2018-2019 ADOPTED GENERAL FUND BUDGET FACILITIES MAINTENANCE PROGRAM HIGHLIGHTS
CITY OF BRIDGEPORT, CONNECTICUT
FY15 includes for first time approx $90k payments by Pub Fac for 475,150 kwh consumed by Education per solar purchase agreement
FY13-14 FY13-14 FY14-15 FY14-15 FY15-16 FY15-16 FY16-17 FY16-17 FY18 PROJ
GAS UTILITY DETAIL
$ CCF $ CCF $ CCF $ CCF $
Faci l i ties Maintenance group
$802,715 738,186 $523,813 619,607 $468,878 490,543 $485,838 507,793 $495,000
Parks $18,239 11,710 $14,757 10,894 $6,563 5,822 $6,748 6,592 $7,000
Airport $24,570 14,754 $20,387 23,778 $17,661 19,924 $18,614 19,455 $19,000
Zoo and Carousel
$83,917 69,025 $65,049 74,227 $51,305 59,161 $51,470 60,950 $53,000
Gol f Course
$33,504 29,043 $25,522 29,069 $21,419 22,883 $25,716 22,647 $26,000
Total Gas Utility Expense
$962,945 862,718 $649,528 757,575 $565,826 598,333 $588,386 617,437 $600,000
275
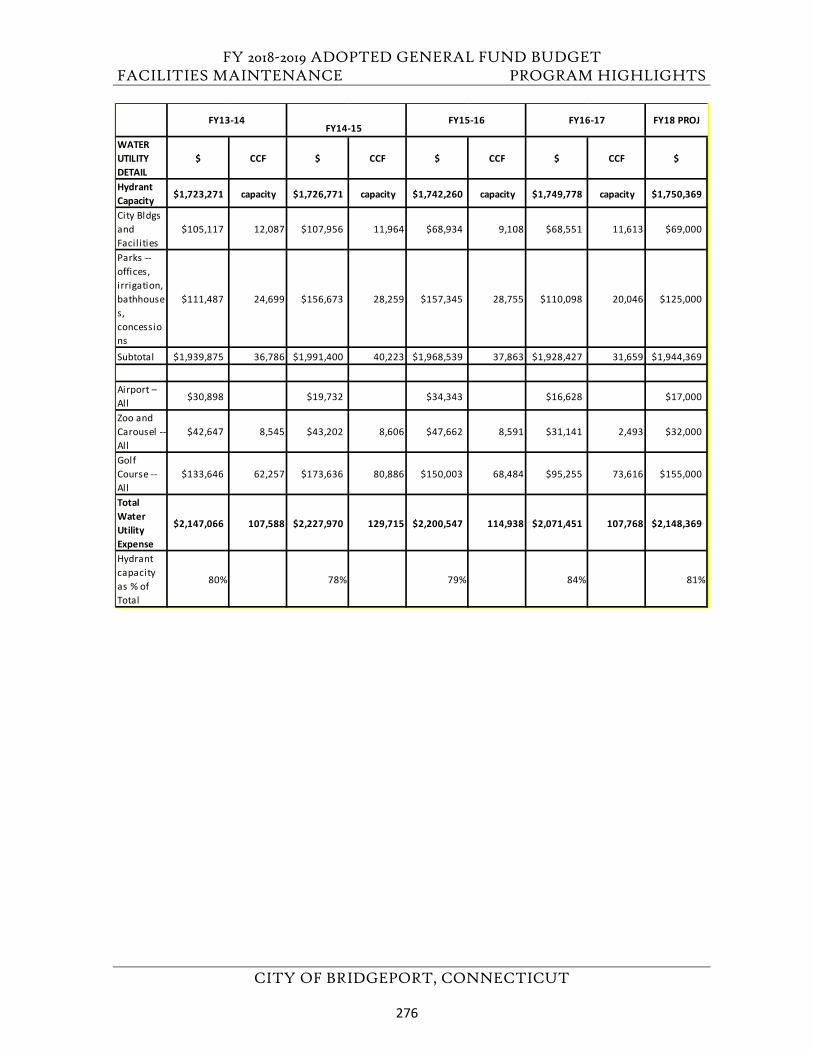
FY 2018-2019 ADOPTED GENERAL FUND BUDGET FACILITIES MAINTENANCE PROGRAM HIGHLIGHTS
CITY OF BRIDGEPORT, CONNECTICUT
WATER UTILITY DETAIL
$ CCF $ CCF $ CCF $ CCF $
Hydrant Capacity $1,723,271 capacity $1,726,771 capacity $1,742,260 capacity $1,749,778 capacity $1,750,369
City Bldgs and Facil ities
$105,117 12,087 $107,956 11,964 $68,934 9,108 $68,551 11,613 $69,000
Parks -- offices, irrigation, bathhouses, concessions
$111,487 24,699 $156,673 28,259 $157,345 28,755 $110,098 20,046 $125,000
Subtotal $1,939,875 36,786 $1,991,400 40,223 $1,968,539 37,863 $1,928,427 31,659 $1,944,369
Airport – All $30,898 $19,732 $34,343 $16,628 $17,000
Zoo and Carousel -- All
$42,647 8,545 $43,202 8,606 $47,662 8,591 $31,141 2,493 $32,000
Golf Course -- All
$133,646 62,257 $173,636 80,886 $150,003 68,484 $95,255 73,616 $155,000
Total Water Utility Expense
$2,147,066 107,588 $2,227,970 129,715 $2,200,547 114,938 $2,071,451 107,768 $2,148,369
Hydrant capacity as % of Total
80% 78% 79% 84% 81%
FY18 PROJFY13-14 FY14-15
FY15-16 FY16-17
276
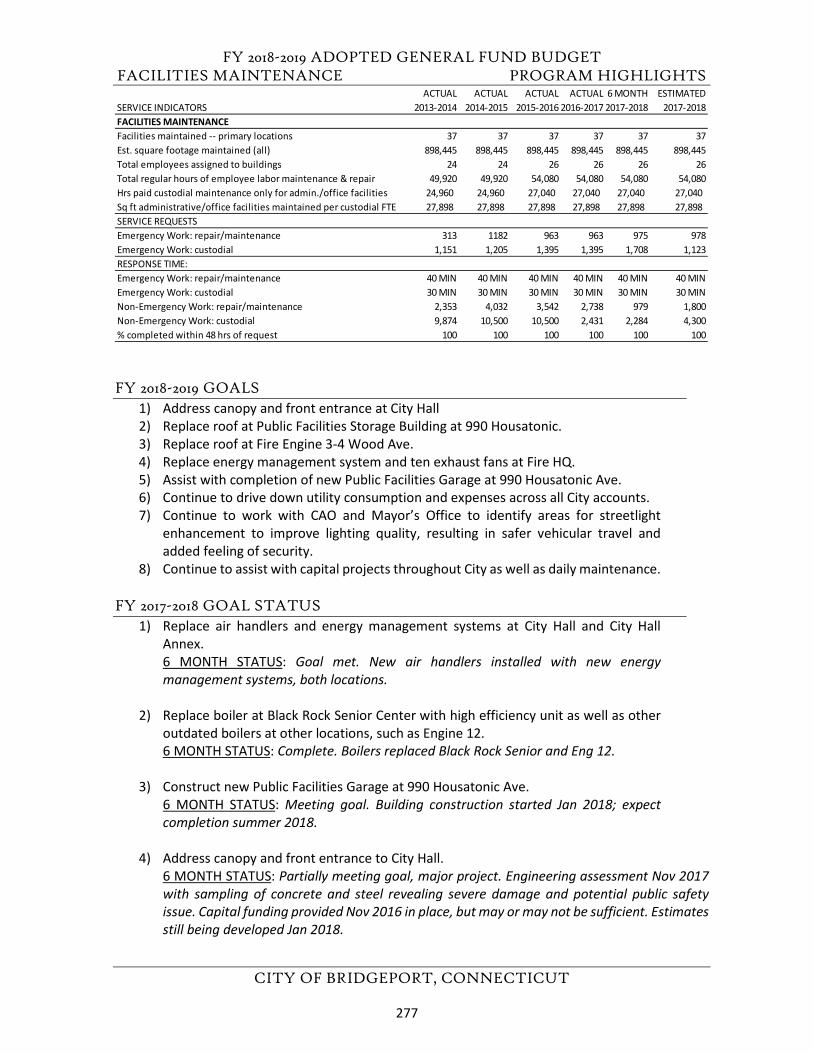
FY 2018-2019 ADOPTED GENERAL FUND BUDGET FACILITIES MAINTENANCE PROGRAM HIGHLIGHTS
CITY OF BRIDGEPORT, CONNECTICUT
FY 2018-2019 GOALS 1) Address canopy and front entrance at City Hall2) Replace roof at Public Facilities Storage Building at 990 Housatonic.3) Replace roof at Fire Engine 3-4 Wood Ave.4) Replace energy management system and ten exhaust fans at Fire HQ.5) Assist with completion of new Public Facilities Garage at 990 Housatonic Ave.6) Continue to drive down utility consumption and expenses across all City accounts.7) Continue to work with CAO and Mayor’s Office to identify areas for streetlight
enhancement to improve lighting quality, resulting in safer vehicular travel andadded feeling of security.
8) Continue to assist with capital projects throughout City as well as daily maintenance.
FY 2017-2018 GOAL STATUS 1) Replace air handlers and energy management systems at City Hall and City Hall
Annex.6 MONTH STATUS: Goal met. New air handlers installed with new energymanagement systems, both locations.
2) Replace boiler at Black Rock Senior Center with high efficiency unit as well as otheroutdated boilers at other locations, such as Engine 12.6 MONTH STATUS: Complete. Boilers replaced Black Rock Senior and Eng 12.
3) Construct new Public Facilities Garage at 990 Housatonic Ave.6 MONTH STATUS: Meeting goal. Building construction started Jan 2018; expectcompletion summer 2018.
4) Address canopy and front entrance to City Hall.6 MONTH STATUS: Partially meeting goal, major project. Engineering assessment Nov 2017with sampling of concrete and steel revealing severe damage and potential public safetyissue. Capital funding provided Nov 2016 in place, but may or may not be sufficient. Estimates still being developed Jan 2018.
ACTUAL ACTUAL ACTUAL ACTUAL 6 MONTH ESTIMATEDSERVICE INDICATORS 2013-2014 2014-2015 2015-2016 2016-2017 2017-2018 2017-2018FACILITIES MAINTENANCEFacilities maintained -- primary locations 37 37 37 37 37 37Est. square footage maintained (all) 898,445 898,445 898,445 898,445 898,445 898,445Total employees assigned to buildings 24 24 26 26 26 26Total regular hours of employee labor maintenance & repair 49,920 49,920 54,080 54,080 54,080 54,080Hrs paid custodial maintenance only for admin./office facilities 24,960 24,960 27,040 27,040 27,040 27,040 Sq ft administrative/office facilities maintained per custodial FTE 27,898 27,898 27,898 27,898 27,898 27,898SERVICE REQUESTSEmergency Work: repair/maintenance 313 1182 963 963 975 978Emergency Work: custodial 1,151 1,205 1,395 1,395 1,708 1,123RESPONSE TIME:Emergency Work: repair/maintenance 40 MIN 40 MIN 40 MIN 40 MIN 40 MIN 40 MINEmergency Work: custodial 30 MIN 30 MIN 30 MIN 30 MIN 30 MIN 30 MINNon-Emergency Work: repair/maintenance 2,353 4,032 3,542 2,738 979 1,800Non-Emergency Work: custodial 9,874 10,500 10,500 2,431 2,284 4,300% completed within 48 hrs of request 100 100 100 100 100 100
277
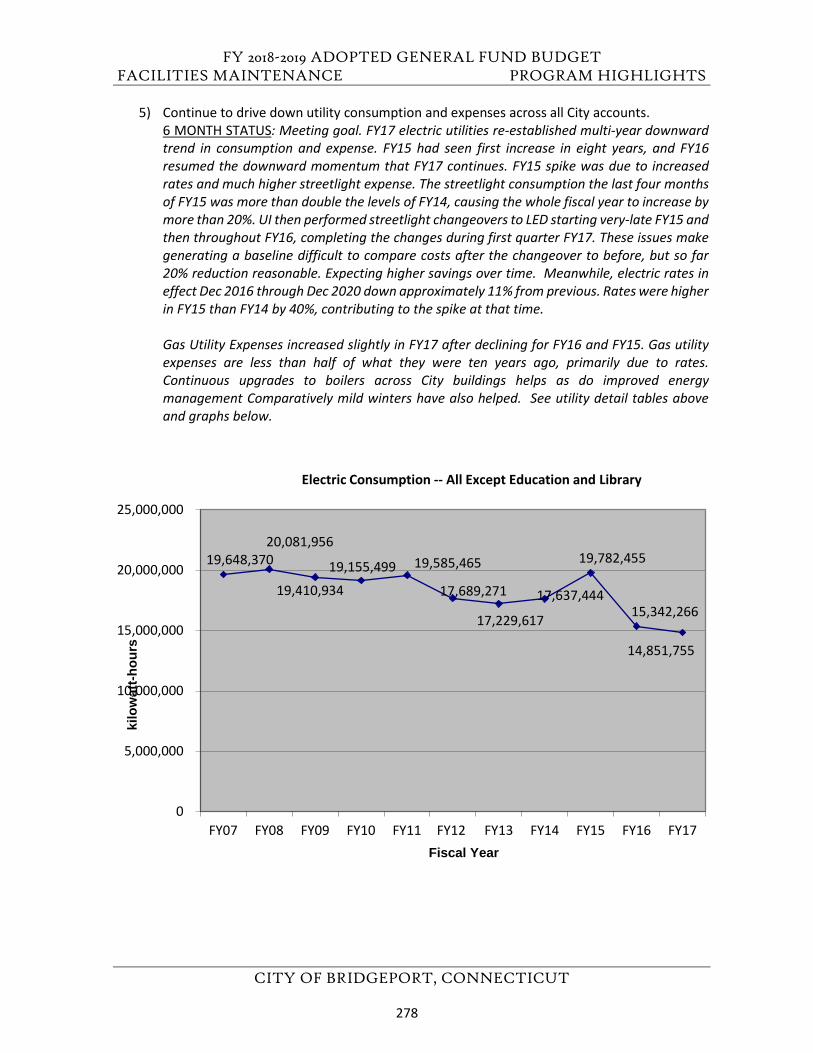
FY 2018-2019 ADOPTED GENERAL FUND BUDGET FACILITIES MAINTENANCE PROGRAM HIGHLIGHTS
CITY OF BRIDGEPORT, CONNECTICUT
5) Continue to drive down utility consumption and expenses across all City accounts.6 MONTH STATUS: Meeting goal. FY17 electric utilities re-established multi-year downwardtrend in consumption and expense. FY15 had seen first increase in eight years, and FY16resumed the downward momentum that FY17 continues. FY15 spike was due to increasedrates and much higher streetlight expense. The streetlight consumption the last four monthsof FY15 was more than double the levels of FY14, causing the whole fiscal year to increase bymore than 20%. UI then performed streetlight changeovers to LED starting very-late FY15 and then throughout FY16, completing the changes during first quarter FY17. These issues makegenerating a baseline difficult to compare costs after the changeover to before, but so far20% reduction reasonable. Expecting higher savings over time. Meanwhile, electric rates ineffect Dec 2016 through Dec 2020 down approximately 11% from previous. Rates were higher in FY15 than FY14 by 40%, contributing to the spike at that time.
Gas Utility Expenses increased slightly in FY17 after declining for FY16 and FY15. Gas utilityexpenses are less than half of what they were ten years ago, primarily due to rates.Continuous upgrades to boilers across City buildings helps as do improved energymanagement Comparatively mild winters have also helped. See utility detail tables aboveand graphs below.
19,648,370 20,081,956
19,410,934
19,155,499 19,585,465
17,689,271
17,229,617
17,637,444
19,782,455
15,342,266
14,851,755
0
5,000,000
10,000,000
15,000,000
20,000,000
25,000,000
FY07 FY08 FY09 FY10 FY11 FY12 FY13 FY14 FY15 FY16 FY17
kilo
wat
t-hou
rs
Fiscal Year
Electric Consumption -- All Except Education and Library
278
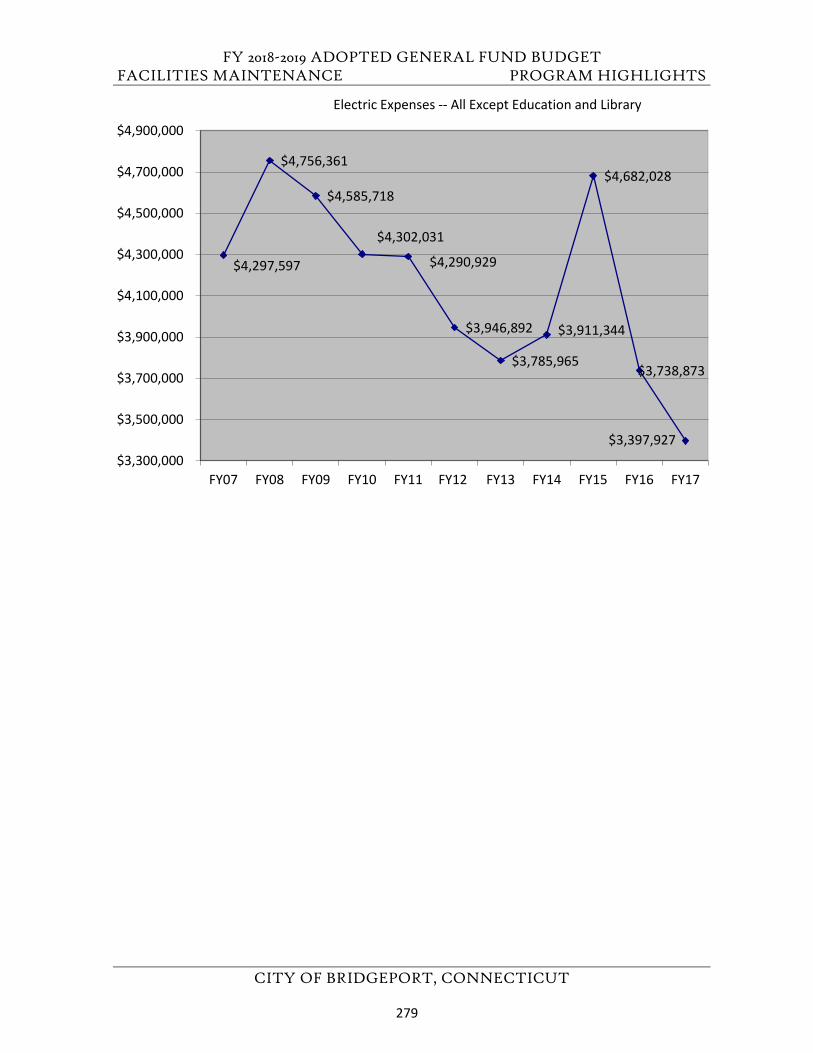
FY 2018-2019 ADOPTED GENERAL FUND BUDGET FACILITIES MAINTENANCE PROGRAM HIGHLIGHTS
CITY OF BRIDGEPORT, CONNECTICUT
$4,297,597
$4,756,361
$4,585,718
$4,302,031
$4,290,929
$3,946,892
$3,785,965
$3,911,344
$4,682,028
$3,738,873
$3,397,927 $3,300,000
$3,500,000
$3,700,000
$3,900,000
$4,100,000
$4,300,000
$4,500,000
$4,700,000
$4,900,000
FY07 FY08 FY09 FY10 FY11 FY12 FY13 FY14 FY15 FY16 FY17
Electric Expenses -- All Except Education and Library
279
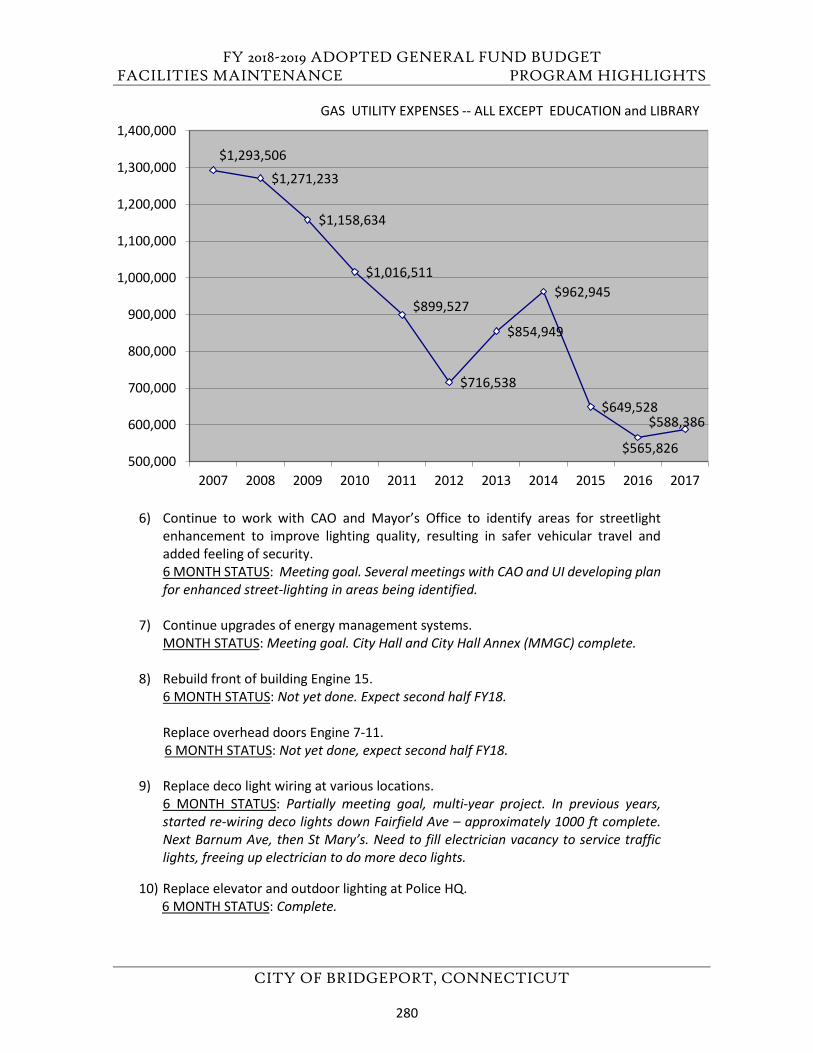
FY 2018-2019 ADOPTED GENERAL FUND BUDGET FACILITIES MAINTENANCE PROGRAM HIGHLIGHTS
CITY OF BRIDGEPORT, CONNECTICUT
6) Continue to work with CAO and Mayor’s Office to identify areas for streetlightenhancement to improve lighting quality, resulting in safer vehicular travel andadded feeling of security.6 MONTH STATUS: Meeting goal. Several meetings with CAO and UI developing planfor enhanced street-lighting in areas being identified.
7) Continue upgrades of energy management systems.MONTH STATUS: Meeting goal. City Hall and City Hall Annex (MMGC) complete.
8) Rebuild front of building Engine 15.6 MONTH STATUS: Not yet done. Expect second half FY18.
Replace overhead doors Engine 7-11.6 MONTH STATUS: Not yet done, expect second half FY18.
9) Replace deco light wiring at various locations.6 MONTH STATUS: Partially meeting goal, multi-year project. In previous years,started re-wiring deco lights down Fairfield Ave – approximately 1000 ft complete.Next Barnum Ave, then St Mary’s. Need to fill electrician vacancy to service trafficlights, freeing up electrician to do more deco lights.
10) Replace elevator and outdoor lighting at Police HQ.6 MONTH STATUS: Complete.
$1,293,506
$1,271,233
$1,158,634
$1,016,511
$899,527
$716,538
$854,949
$962,945
$649,528
$565,826
$588,386
500,000
600,000
700,000
800,000
900,000
1,000,000
1,100,000
1,200,000
1,300,000
1,400,000
2007 2008 2009 2010 2011 2012 2013 2014 2015 2016 2017
GAS UTILITY EXPENSES -- ALL EXCEPT EDUCATION and LIBRARY
280
FY 2018-2019 ADOPTED GENERAL FUND BUDGET FACILITIES MAINTENANCE PROGRAM HIGHLIGHTS
CITY OF BRIDGEPORT, CONNECTICUT
FY 2017-2018 ADDITIONAL ACCOMPLISHMENTS 1) Assisted with conversion of three City buildings over to new Micro-Grid built by
private investors with assistance from State DEEP grants. Full changeover scheduledmid-March 2018. Will result in a “fail safe” premium power supply for City Hall, PoliceHeadquarters and the Golden Hill (New Ike”) Senior Center in the event of a powerinterruption due to weather, grid failure or other reasons at costs comparable tothose provided by UI. This 20-year combined heat and power plant will also providesavings of approximately $35,000 per year in thermal energy as hot water for heatingand domestic purposes. The City should see no net cost from this project and gainuninterrupted power to vital buildings. The system will generate excess power thatcan be sold back into the grid to other consumers. City actively working to developprivate agent for sale of these Virtual Net Metering credits such that City shouldeventually see net reductions to utility expenses.
2) Major electrical upgrade at EOC installed to facilitate new 911 fiber optic system.3) Roof replacement Black Rock Senior Center.4) East Washington Avenue Bridge repairs complete.5) Preparing to replace generator City Hall spring 2018.6) LED changeover Annex hall lights.7) Painting Fire HQ apparatus floor and walls.
281
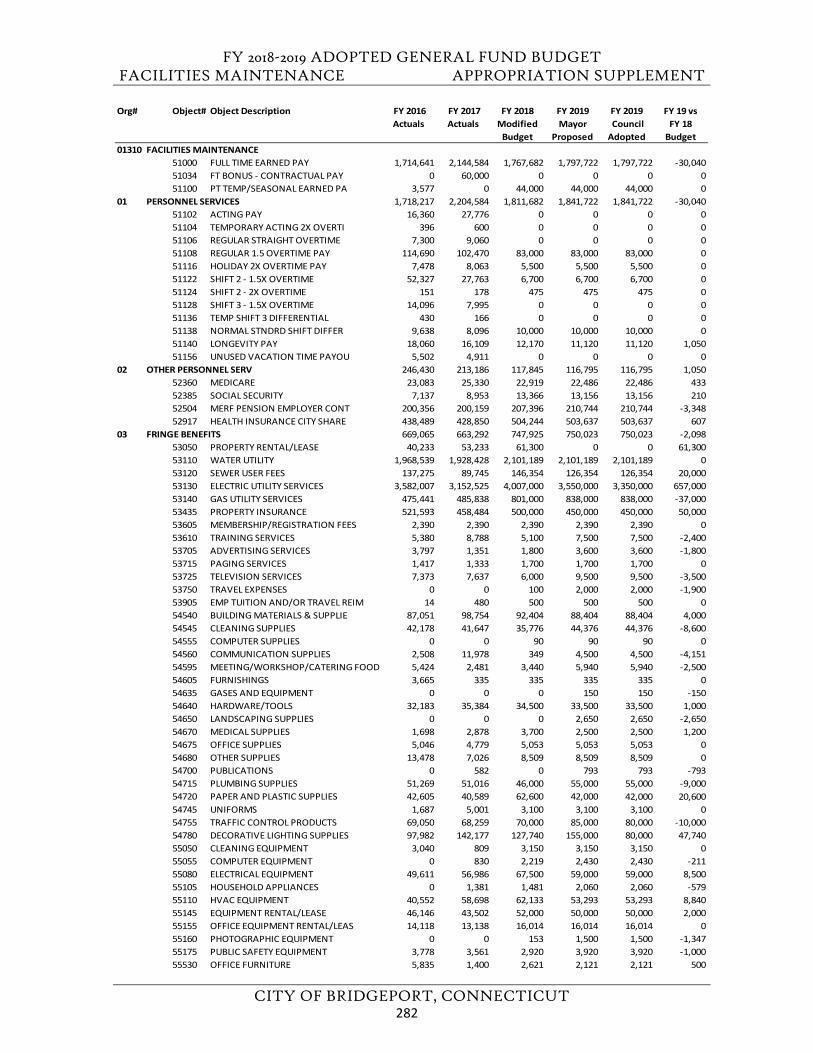
FY 2018-2019 ADOPTED GENERAL FUND BUDGET FACILITIES MAINTENANCE APPROPRIATION SUPPLEMENT
CITY OF BRIDGEPORT, CONNECTICUT
Org# Object# Object Description FY 2016 Actuals
FY 2017 Actuals
FY 2018 Modified
Budget
FY 2019Mayor
Proposed
FY 2019 Council Adopted
FY 19 vs FY 18
Budget01310 FACILITIES MAINTENANCE
51000 FULL TIME EARNED PAY 1,714,641 2,144,584 1,767,682 1,797,722 1,797,722 -30,04051034 FT BONUS - CONTRACTUAL PAY 0 60,000 0 0 0 051100 PT TEMP/SEASONAL EARNED PA 3,577 0 44,000 44,000 44,000 0
01 PERSONNEL SERVICES 1,718,217 2,204,584 1,811,682 1,841,722 1,841,722 -30,04051102 ACTING PAY 16,360 27,776 0 0 0 051104 TEMPORARY ACTING 2X OVERTI 396 600 0 0 0 051106 REGULAR STRAIGHT OVERTIME 7,300 9,060 0 0 0 051108 REGULAR 1.5 OVERTIME PAY 114,690 102,470 83,000 83,000 83,000 051116 HOLIDAY 2X OVERTIME PAY 7,478 8,063 5,500 5,500 5,500 051122 SHIFT 2 - 1.5X OVERTIME 52,327 27,763 6,700 6,700 6,700 051124 SHIFT 2 - 2X OVERTIME 151 178 475 475 475 051128 SHIFT 3 - 1.5X OVERTIME 14,096 7,995 0 0 0 051136 TEMP SHIFT 3 DIFFERENTIAL 430 166 0 0 0 051138 NORMAL STNDRD SHIFT DIFFER 9,638 8,096 10,000 10,000 10,000 051140 LONGEVITY PAY 18,060 16,109 12,170 11,120 11,120 1,05051156 UNUSED VACATION TIME PAYOU 5,502 4,911 0 0 0 0
02 OTHER PERSONNEL SERV 246,430 213,186 117,845 116,795 116,795 1,05052360 MEDICARE 23,083 25,330 22,919 22,486 22,486 43352385 SOCIAL SECURITY 7,137 8,953 13,366 13,156 13,156 21052504 MERF PENSION EMPLOYER CONT 200,356 200,159 207,396 210,744 210,744 -3,34852917 HEALTH INSURANCE CITY SHARE 438,489 428,850 504,244 503,637 503,637 607
03 FRINGE BENEFITS 669,065 663,292 747,925 750,023 750,023 -2,09853050 PROPERTY RENTAL/LEASE 40,233 53,233 61,300 0 0 61,30053110 WATER UTILITY 1,968,539 1,928,428 2,101,189 2,101,189 2,101,189 053120 SEWER USER FEES 137,275 89,745 146,354 126,354 126,354 20,00053130 ELECTRIC UTILITY SERVICES 3,582,007 3,152,525 4,007,000 3,550,000 3,350,000 657,00053140 GAS UTILITY SERVICES 475,441 485,838 801,000 838,000 838,000 -37,00053435 PROPERTY INSURANCE 521,593 458,484 500,000 450,000 450,000 50,00053605 MEMBERSHIP/REGISTRATION FEES 2,390 2,390 2,390 2,390 2,390 053610 TRAINING SERVICES 5,380 8,788 5,100 7,500 7,500 -2,40053705 ADVERTISING SERVICES 3,797 1,351 1,800 3,600 3,600 -1,80053715 PAGING SERVICES 1,417 1,333 1,700 1,700 1,700 053725 TELEVISION SERVICES 7,373 7,637 6,000 9,500 9,500 -3,50053750 TRAVEL EXPENSES 0 0 100 2,000 2,000 -1,90053905 EMP TUITION AND/OR TRAVEL REIM 14 480 500 500 500 054540 BUILDING MATERIALS & SUPPLIE 87,051 98,754 92,404 88,404 88,404 4,00054545 CLEANING SUPPLIES 42,178 41,647 35,776 44,376 44,376 -8,60054555 COMPUTER SUPPLIES 0 0 90 90 90 054560 COMMUNICATION SUPPLIES 2,508 11,978 349 4,500 4,500 -4,15154595 MEETING/WORKSHOP/CATERING FOOD 5,424 2,481 3,440 5,940 5,940 -2,50054605 FURNISHINGS 3,665 335 335 335 335 054635 GASES AND EQUIPMENT 0 0 0 150 150 -15054640 HARDWARE/TOOLS 32,183 35,384 34,500 33,500 33,500 1,00054650 LANDSCAPING SUPPLIES 0 0 0 2,650 2,650 -2,65054670 MEDICAL SUPPLIES 1,698 2,878 3,700 2,500 2,500 1,20054675 OFFICE SUPPLIES 5,046 4,779 5,053 5,053 5,053 054680 OTHER SUPPLIES 13,478 7,026 8,509 8,509 8,509 054700 PUBLICATIONS 0 582 0 793 793 -79354715 PLUMBING SUPPLIES 51,269 51,016 46,000 55,000 55,000 -9,00054720 PAPER AND PLASTIC SUPPLIES 42,605 40,589 62,600 42,000 42,000 20,60054745 UNIFORMS 1,687 5,001 3,100 3,100 3,100 054755 TRAFFIC CONTROL PRODUCTS 69,050 68,259 70,000 85,000 80,000 -10,00054780 DECORATIVE LIGHTING SUPPLIES 97,982 142,177 127,740 155,000 80,000 47,74055050 CLEANING EQUIPMENT 3,040 809 3,150 3,150 3,150 055055 COMPUTER EQUIPMENT 0 830 2,219 2,430 2,430 -21155080 ELECTRICAL EQUIPMENT 49,611 56,986 67,500 59,000 59,000 8,50055105 HOUSEHOLD APPLIANCES 0 1,381 1,481 2,060 2,060 -57955110 HVAC EQUIPMENT 40,552 58,698 62,133 53,293 53,293 8,84055145 EQUIPMENT RENTAL/LEASE 46,146 43,502 52,000 50,000 50,000 2,00055155 OFFICE EQUIPMENT RENTAL/LEAS 14,118 13,138 16,014 16,014 16,014 055160 PHOTOGRAPHIC EQUIPMENT 0 0 153 1,500 1,500 -1,34755175 PUBLIC SAFETY EQUIPMENT 3,778 3,561 2,920 3,920 3,920 -1,00055530 OFFICE FURNITURE 5,835 1,400 2,621 2,121 2,121 500
282
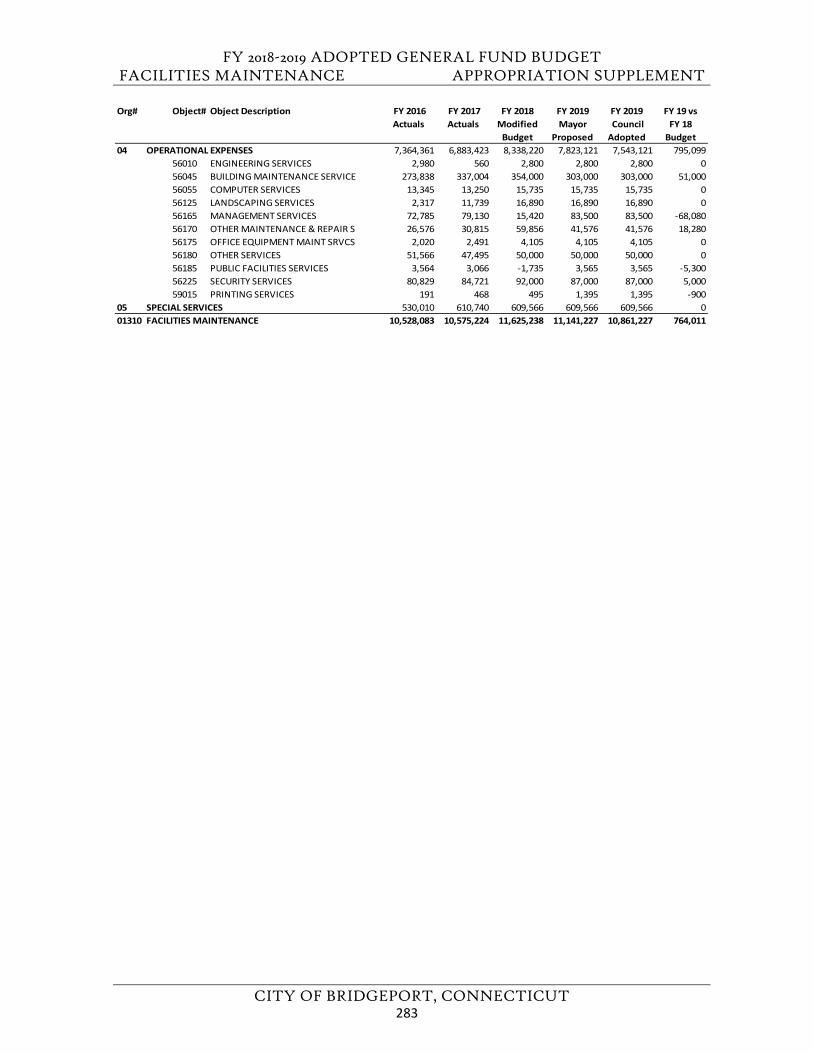
FY 2018-2019 ADOPTED GENERAL FUND BUDGET FACILITIES MAINTENANCE APPROPRIATION SUPPLEMENT
CITY OF BRIDGEPORT, CONNECTICUT
Org# Object# Object Description FY 2016 Actuals
FY 2017 Actuals
FY 2018 Modified
Budget
FY 2019Mayor
Proposed
FY 2019 Council Adopted
FY 19 vs FY 18
Budget04 OPERATIONAL EXPENSES 7,364,361 6,883,423 8,338,220 7,823,121 7,543,121 795,099
56010 ENGINEERING SERVICES 2,980 560 2,800 2,800 2,800 056045 BUILDING MAINTENANCE SERVICE 273,838 337,004 354,000 303,000 303,000 51,00056055 COMPUTER SERVICES 13,345 13,250 15,735 15,735 15,735 056125 LANDSCAPING SERVICES 2,317 11,739 16,890 16,890 16,890 056165 MANAGEMENT SERVICES 72,785 79,130 15,420 83,500 83,500 -68,08056170 OTHER MAINTENANCE & REPAIR S 26,576 30,815 59,856 41,576 41,576 18,28056175 OFFICE EQUIPMENT MAINT SRVCS 2,020 2,491 4,105 4,105 4,105 056180 OTHER SERVICES 51,566 47,495 50,000 50,000 50,000 056185 PUBLIC FACILITIES SERVICES 3,564 3,066 -1,735 3,565 3,565 -5,30056225 SECURITY SERVICES 80,829 84,721 92,000 87,000 87,000 5,00059015 PRINTING SERVICES 191 468 495 1,395 1,395 -900
05 SPECIAL SERVICES 530,010 610,740 609,566 609,566 609,566 001310 FACILITIES MAINTENANCE 10,528,083 10,575,224 11,625,238 11,141,227 10,861,227 764,011
283

FY 2018-2019 ADOPTED GENERAL FUND BUDGET
CITY OF BRIDGEPORT, CONNECTICUT
This page left blank intentionally.
284
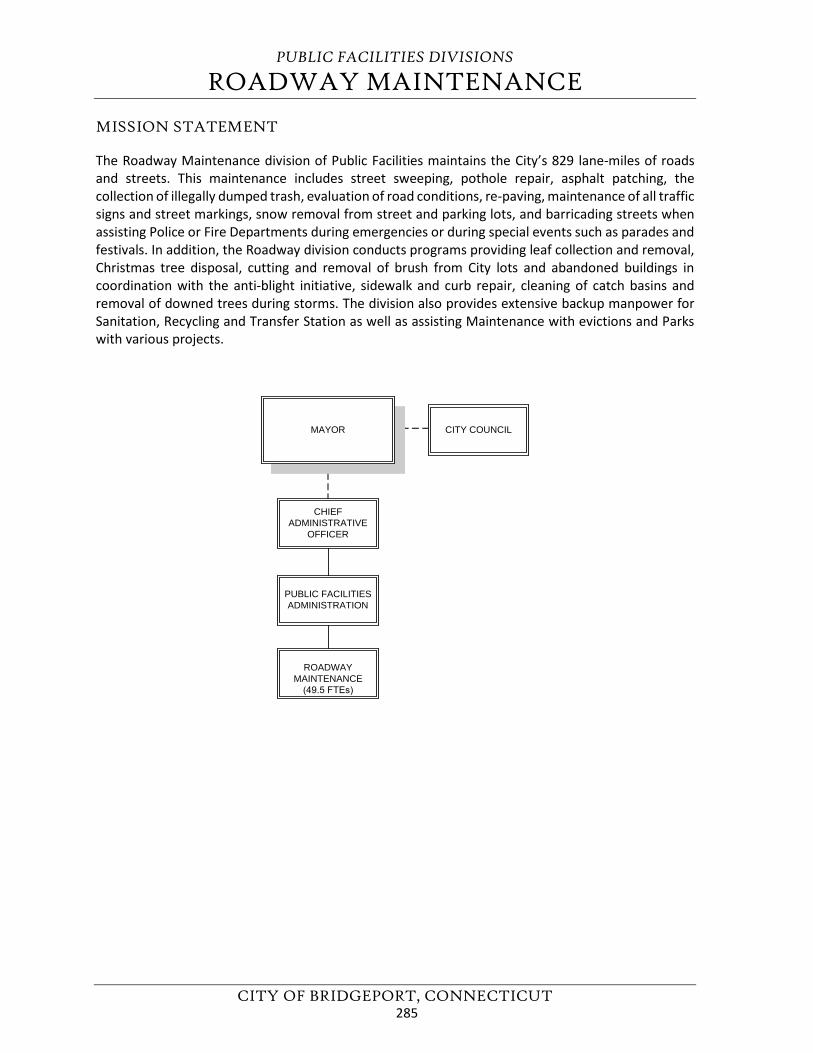
PUBLIC FACILITIES DIVISIONS
ROADWAY MAINTENANCE
CITY OF BRIDGEPORT, CONNECTICUT
MISSION STATEMENT
The Roadway Maintenance division of Public Facilities maintains the City’s 829 lane-miles of roads and streets. This maintenance includes street sweeping, pothole repair, asphalt patching, the collection of illegally dumped trash, evaluation of road conditions, re-paving, maintenance of all traffic signs and street markings, snow removal from street and parking lots, and barricading streets when assisting Police or Fire Departments during emergencies or during special events such as parades and festivals. In addition, the Roadway division conducts programs providing leaf collection and removal, Christmas tree disposal, cutting and removal of brush from City lots and abandoned buildings in coordination with the anti-blight initiative, sidewalk and curb repair, cleaning of catch basins and removal of downed trees during storms. The division also provides extensive backup manpower for Sanitation, Recycling and Transfer Station as well as assisting Maintenance with evictions and Parks with various projects.
CHIEFADMINISTRATIVE
OFFICER
PUBLIC FACILITIESADMINISTRATION
ROADWAYMAINTENANCE
(49.5 FTEs)
MAYOR CITY COUNCIL
285
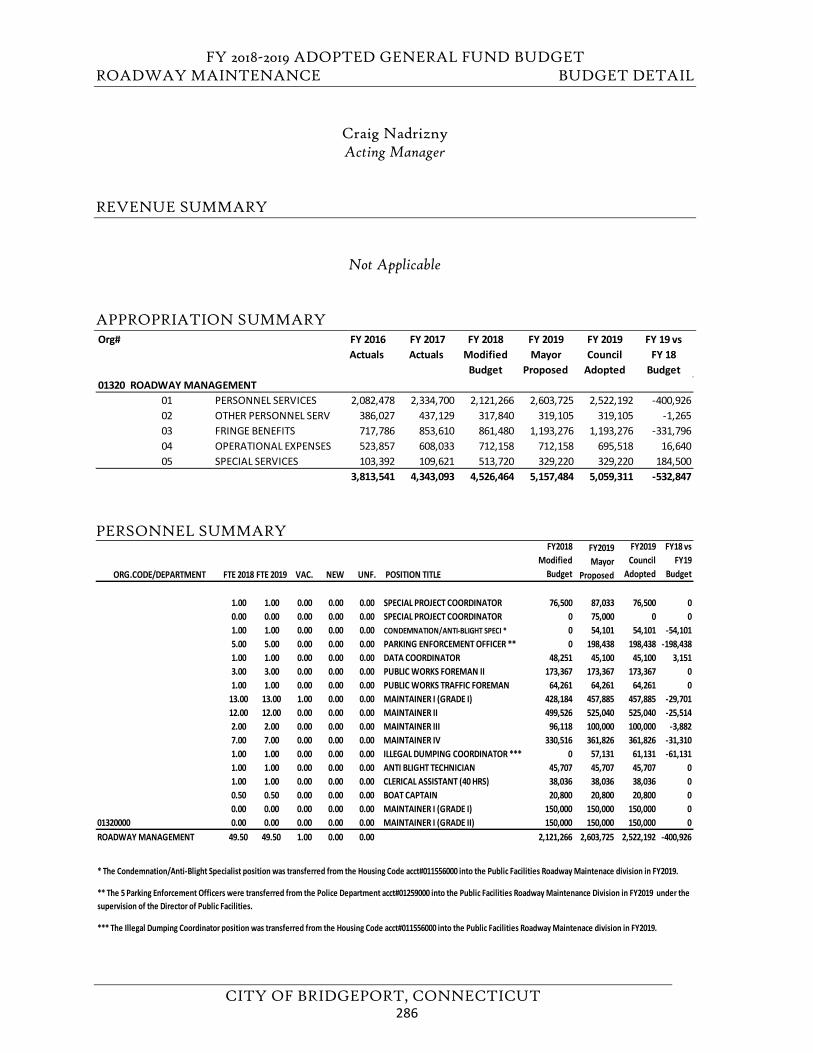
FY 2018-2019 ADOPTED GENERAL FUND BUDGET ROADWAY MAINTENANCE BUDGET DETAIL
CITY OF BRIDGEPORT, CONNECTICUT
Craig Nadrizny Acting Manager
REVENUE SUMMARY
Not Applicable
APPROPRIATION SUMMARY
PERSONNEL SUMMARY
Org# FY 2016 Actuals
FY 2017 Actuals
FY 2018 Modified
Budget
FY 2019 Mayor
Proposed
FY 2019 Council
Adopted
FY 19 vs FY 18
Budget01320 ROADWAY MANAGEMENT
01 PERSONNEL SERVICES 2,082,478 2,334,700 2,121,266 2,603,725 2,522,192 -400,92602 OTHER PERSONNEL SERV 386,027 437,129 317,840 319,105 319,105 -1,26503 FRINGE BENEFITS 717,786 853,610 861,480 1,193,276 1,193,276 -331,79604 OPERATIONAL EXPENSES 523,857 608,033 712,158 712,158 695,518 16,64005 SPECIAL SERVICES 103,392 109,621 513,720 329,220 329,220 184,500
3,813,541 4,343,093 4,526,464 5,157,484 5,059,311 -532,847
ORG.CODE/DEPARTMENT FTE 2018 FTE 2019 VAC. NEW UNF. POSITION TITLE
FY2018 Modified
Budget
FY2019 Mayor
Proposed
FY2019 Council
Adopted
FY18 vs FY19
Budget
1.00 1.00 0.00 0.00 0.00 SPECIAL PROJECT COORDINATOR 76,500 87,033 76,500 00.00 0.00 0.00 0.00 0.00 SPECIAL PROJECT COORDINATOR 0 75,000 0 01.00 1.00 0.00 0.00 0.00 CONDEMNATION/ANTI-BLIGHT SPECI * 0 54,101 54,101 -54,1015.00 5.00 0.00 0.00 0.00 PARKING ENFORCEMENT OFFICER ** 0 198,438 198,438 -198,4381.00 1.00 0.00 0.00 0.00 DATA COORDINATOR 48,251 45,100 45,100 3,1513.00 3.00 0.00 0.00 0.00 PUBLIC WORKS FOREMAN II 173,367 173,367 173,367 01.00 1.00 0.00 0.00 0.00 PUBLIC WORKS TRAFFIC FOREMAN 64,261 64,261 64,261 0
13.00 13.00 1.00 0.00 0.00 MAINTAINER I (GRADE I) 428,184 457,885 457,885 -29,70112.00 12.00 0.00 0.00 0.00 MAINTAINER II 499,526 525,040 525,040 -25,5142.00 2.00 0.00 0.00 0.00 MAINTAINER III 96,118 100,000 100,000 -3,8827.00 7.00 0.00 0.00 0.00 MAINTAINER IV 330,516 361,826 361,826 -31,3101.00 1.00 0.00 0.00 0.00 ILLEGAL DUMPING COORDINATOR *** 0 57,131 61,131 -61,1311.00 1.00 0.00 0.00 0.00 ANTI BLIGHT TECHNICIAN 45,707 45,707 45,707 01.00 1.00 0.00 0.00 0.00 CLERICAL ASSISTANT (40 HRS) 38,036 38,036 38,036 00.50 0.50 0.00 0.00 0.00 BOAT CAPTAIN 20,800 20,800 20,800 00.00 0.00 0.00 0.00 0.00 MAINTAINER I (GRADE I) 150,000 150,000 150,000 0
01320000 0.00 0.00 0.00 0.00 0.00 MAINTAINER I (GRADE II) 150,000 150,000 150,000 0ROADWAY MANAGEMENT 49.50 49.50 1.00 0.00 0.00 2,121,266 2,603,725 2,522,192 -400,926
* The Condemnation/Anti-Blight Specialist position was transferred from the Housing Code acct#011556000 into the Public Facilities Roadway Maintenace division in FY2019.
** The 5 Parking Enforcement Officers were transferred from the Police Department acct#01259000 into the Public Facilities Roadway Maintenance Division in FY2019 under thesupervision of the Director of Public Facilities.
*** The Illegal Dumping Coordinator position was transferred from the Housing Code acct#011556000 into the Public Facilities Roadway Maintenace division in FY2019.
286
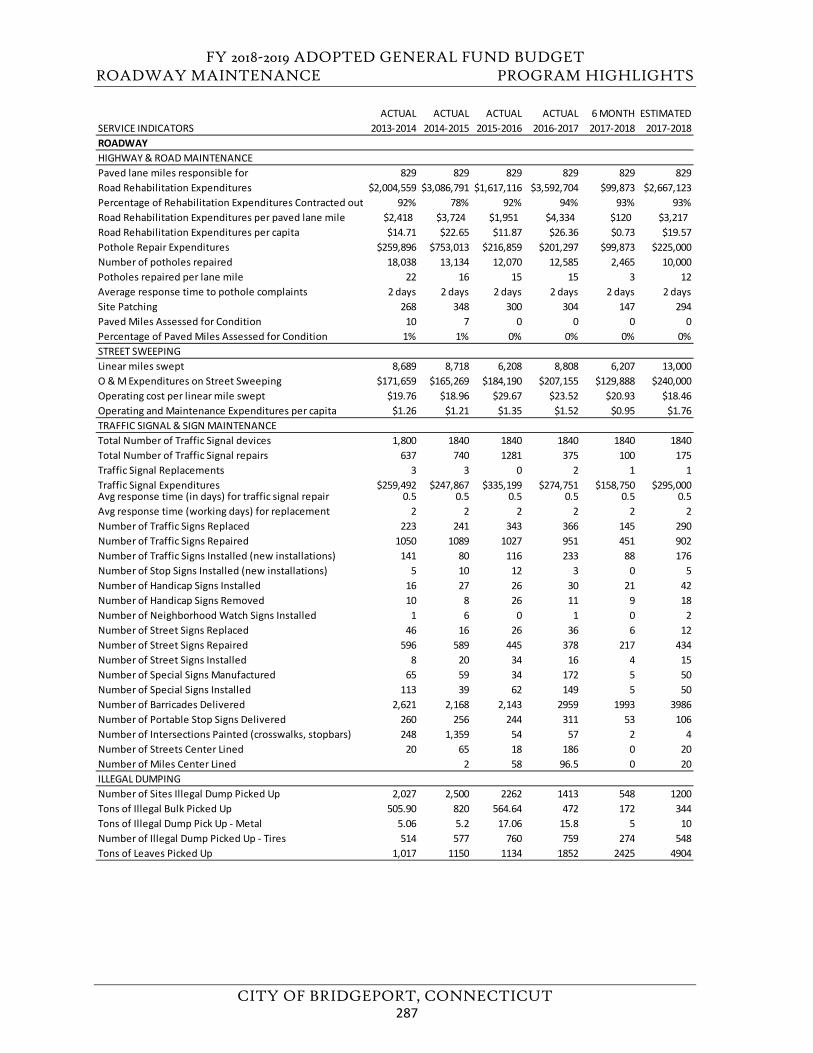
FY 2018-2019 ADOPTED GENERAL FUND BUDGET ROADWAY MAINTENANCE PROGRAM HIGHLIGHTS
CITY OF BRIDGEPORT, CONNECTICUT
ACTUAL ACTUAL ACTUAL ACTUAL 6 MONTH ESTIMATEDSERVICE INDICATORS 2013-2014 2014-2015 2015-2016 2016-2017 2017-2018 2017-2018ROADWAY HIGHWAY & ROAD MAINTENANCEPaved lane miles responsible for 829 829 829 829 829 829Road Rehabilitation Expenditures $2,004,559 $3,086,791 $1,617,116 $3,592,704 $99,873 $2,667,123Percentage of Rehabilitation Expenditures Contracted out 92% 78% 92% 94% 93% 93%Road Rehabilitation Expenditures per paved lane mile $2,418 $3,724 $1,951 $4,334 $120 $3,217Road Rehabilitation Expenditures per capita $14.71 $22.65 $11.87 $26.36 $0.73 $19.57Pothole Repair Expenditures $259,896 $753,013 $216,859 $201,297 $99,873 $225,000Number of potholes repaired 18,038 13,134 12,070 12,585 2,465 10,000Potholes repaired per lane mile 22 16 15 15 3 12Average response time to pothole complaints 2 days 2 days 2 days 2 days 2 days 2 daysSite Patching 268 348 300 304 147 294Paved Miles Assessed for Condition 10 7 0 0 0 0Percentage of Paved Miles Assessed for Condition 1% 1% 0% 0% 0% 0%STREET SWEEPINGLinear miles swept 8,689 8,718 6,208 8,808 6,207 13,000O & M Expenditures on Street Sweeping $171,659 $165,269 $184,190 $207,155 $129,888 $240,000Operating cost per linear mile swept $19.76 $18.96 $29.67 $23.52 $20.93 $18.46Operating and Maintenance Expenditures per capita $1.26 $1.21 $1.35 $1.52 $0.95 $1.76TRAFFIC SIGNAL & SIGN MAINTENANCETotal Number of Traffic Signal devices 1,800 1840 1840 1840 1840 1840Total Number of Traffic Signal repairs 637 740 1281 375 100 175Traffic Signal Replacements 3 3 0 2 1 1Traffic Signal Expenditures $259,492 $247,867 $335,199 $274,751 $158,750 $295,000Avg response time (in days) for traffic signal repair 0.5 0.5 0.5 0.5 0.5 0.5Avg response time (working days) for replacement 2 2 2 2 2 2Number of Traffic Signs Replaced 223 241 343 366 145 290Number of Traffic Signs Repaired 1050 1089 1027 951 451 902Number of Traffic Signs Installed (new installations) 141 80 116 233 88 176Number of Stop Signs Installed (new installations) 5 10 12 3 0 5Number of Handicap Signs Installed 16 27 26 30 21 42Number of Handicap Signs Removed 10 8 26 11 9 18Number of Neighborhood Watch Signs Installed 1 6 0 1 0 2Number of Street Signs Replaced 46 16 26 36 6 12Number of Street Signs Repaired 596 589 445 378 217 434Number of Street Signs Installed 8 20 34 16 4 15Number of Special Signs Manufactured 65 59 34 172 5 50Number of Special Signs Installed 113 39 62 149 5 50Number of Barricades Delivered 2,621 2,168 2,143 2959 1993 3986Number of Portable Stop Signs Delivered 260 256 244 311 53 106Number of Intersections Painted (crosswalks, stopbars) 248 1,359 54 57 2 4Number of Streets Center Lined 20 65 18 186 0 20Number of Miles Center Lined 2 58 96.5 0 20ILLEGAL DUMPING Number of Sites Illegal Dump Picked Up 2,027 2,500 2262 1413 548 1200Tons of Illegal Bulk Picked Up 505.90 820 564.64 472 172 344Tons of Illegal Dump Pick Up - Metal 5.06 5.2 17.06 15.8 5 10Number of Illegal Dump Picked Up - Tires 514 577 760 759 274 548Tons of Leaves Picked Up 1,017 1150 1134 1852 2425 4904
287
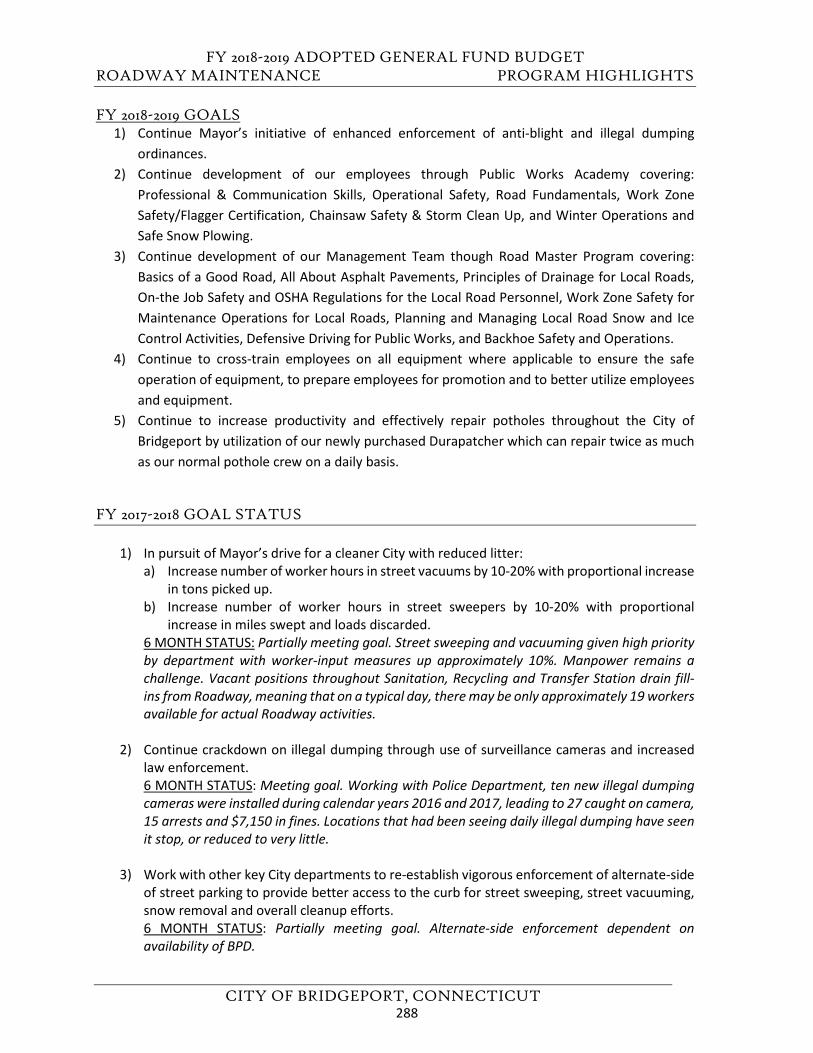
FY 2018-2019 ADOPTED GENERAL FUND BUDGET ROADWAY MAINTENANCE PROGRAM HIGHLIGHTS
CITY OF BRIDGEPORT, CONNECTICUT
FY 2018-2019 GOALS 1) Continue Mayor’s initiative of enhanced enforcement of anti-blight and illegal dumping
ordinances.2) Continue development of our employees through Public Works Academy covering:
Professional & Communication Skills, Operational Safety, Road Fundamentals, Work ZoneSafety/Flagger Certification, Chainsaw Safety & Storm Clean Up, and Winter Operations andSafe Snow Plowing.
3) Continue development of our Management Team though Road Master Program covering:Basics of a Good Road, All About Asphalt Pavements, Principles of Drainage for Local Roads,On-the Job Safety and OSHA Regulations for the Local Road Personnel, Work Zone Safety forMaintenance Operations for Local Roads, Planning and Managing Local Road Snow and IceControl Activities, Defensive Driving for Public Works, and Backhoe Safety and Operations.
4) Continue to cross-train employees on all equipment where applicable to ensure the safeoperation of equipment, to prepare employees for promotion and to better utilize employeesand equipment.
5) Continue to increase productivity and effectively repair potholes throughout the City ofBridgeport by utilization of our newly purchased Durapatcher which can repair twice as muchas our normal pothole crew on a daily basis.
FY 2017-2018 GOAL STATUS
1) In pursuit of Mayor’s drive for a cleaner City with reduced litter:a) Increase number of worker hours in street vacuums by 10-20% with proportional increase
in tons picked up.b) Increase number of worker hours in street sweepers by 10-20% with proportional
increase in miles swept and loads discarded.6 MONTH STATUS: Partially meeting goal. Street sweeping and vacuuming given high priority by department with worker-input measures up approximately 10%. Manpower remains a challenge. Vacant positions throughout Sanitation, Recycling and Transfer Station drain fill-ins from Roadway, meaning that on a typical day, there may be only approximately 19 workers available for actual Roadway activities.
2) Continue crackdown on illegal dumping through use of surveillance cameras and increasedlaw enforcement.6 MONTH STATUS: Meeting goal. Working with Police Department, ten new illegal dumpingcameras were installed during calendar years 2016 and 2017, leading to 27 caught on camera, 15 arrests and $7,150 in fines. Locations that had been seeing daily illegal dumping have seenit stop, or reduced to very little.
3) Work with other key City departments to re-establish vigorous enforcement of alternate-sideof street parking to provide better access to the curb for street sweeping, street vacuuming,snow removal and overall cleanup efforts.6 MONTH STATUS: Partially meeting goal. Alternate-side enforcement dependent onavailability of BPD.
288
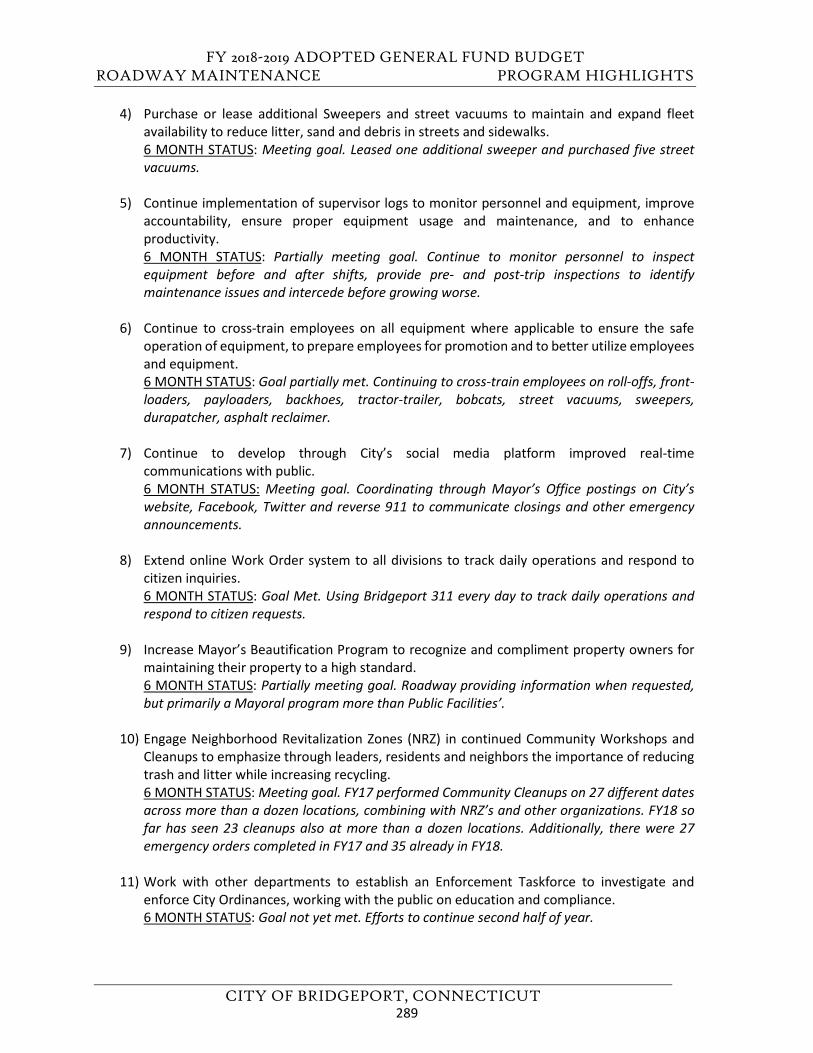
FY 2018-2019 ADOPTED GENERAL FUND BUDGET ROADWAY MAINTENANCE PROGRAM HIGHLIGHTS
CITY OF BRIDGEPORT, CONNECTICUT
4) Purchase or lease additional Sweepers and street vacuums to maintain and expand fleetavailability to reduce litter, sand and debris in streets and sidewalks.6 MONTH STATUS: Meeting goal. Leased one additional sweeper and purchased five streetvacuums.
5) Continue implementation of supervisor logs to monitor personnel and equipment, improveaccountability, ensure proper equipment usage and maintenance, and to enhanceproductivity.6 MONTH STATUS: Partially meeting goal. Continue to monitor personnel to inspectequipment before and after shifts, provide pre- and post-trip inspections to identifymaintenance issues and intercede before growing worse.
6) Continue to cross-train employees on all equipment where applicable to ensure the safeoperation of equipment, to prepare employees for promotion and to better utilize employeesand equipment.6 MONTH STATUS: Goal partially met. Continuing to cross-train employees on roll-offs, front-loaders, payloaders, backhoes, tractor-trailer, bobcats, street vacuums, sweepers,durapatcher, asphalt reclaimer.
7) Continue to develop through City’s social media platform improved real-timecommunications with public.6 MONTH STATUS: Meeting goal. Coordinating through Mayor’s Office postings on City’swebsite, Facebook, Twitter and reverse 911 to communicate closings and other emergencyannouncements.
8) Extend online Work Order system to all divisions to track daily operations and respond tocitizen inquiries.6 MONTH STATUS: Goal Met. Using Bridgeport 311 every day to track daily operations andrespond to citizen requests.
9) Increase Mayor’s Beautification Program to recognize and compliment property owners formaintaining their property to a high standard.6 MONTH STATUS: Partially meeting goal. Roadway providing information when requested,but primarily a Mayoral program more than Public Facilities’.
10) Engage Neighborhood Revitalization Zones (NRZ) in continued Community Workshops andCleanups to emphasize through leaders, residents and neighbors the importance of reducingtrash and litter while increasing recycling.6 MONTH STATUS: Meeting goal. FY17 performed Community Cleanups on 27 different datesacross more than a dozen locations, combining with NRZ’s and other organizations. FY18 sofar has seen 23 cleanups also at more than a dozen locations. Additionally, there were 27emergency orders completed in FY17 and 35 already in FY18.
11) Work with other departments to establish an Enforcement Taskforce to investigate andenforce City Ordinances, working with the public on education and compliance.6 MONTH STATUS: Goal not yet met. Efforts to continue second half of year.
289
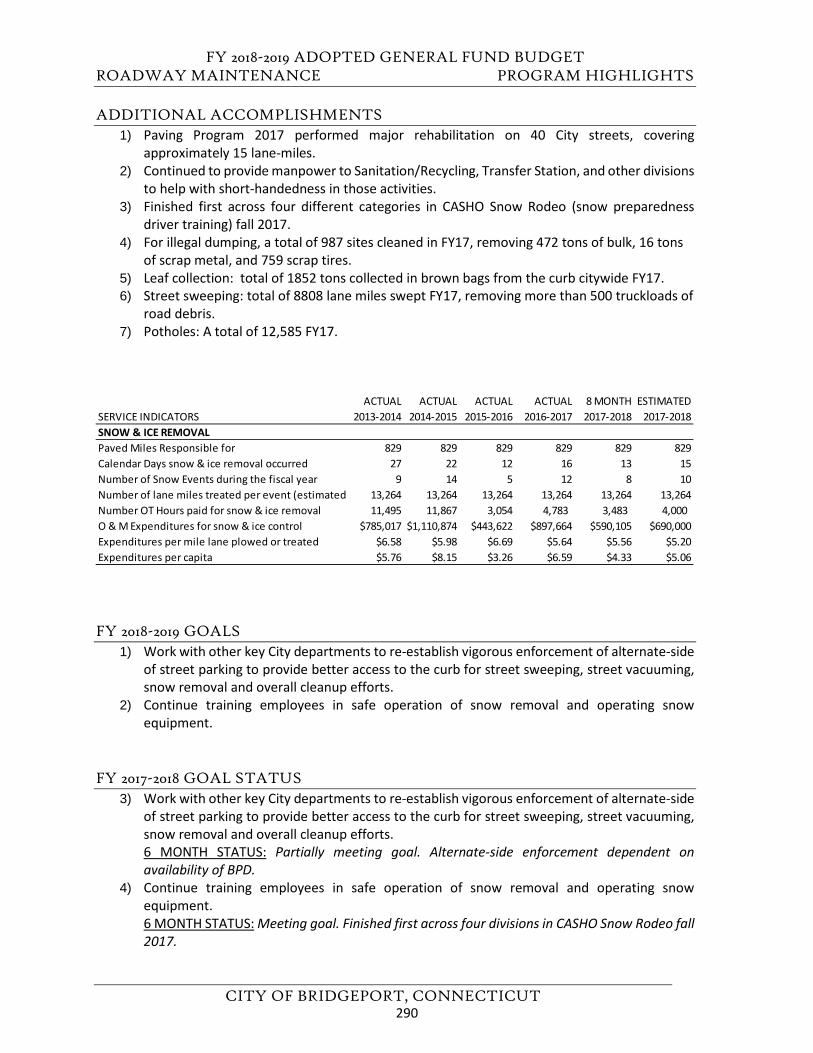
FY 2018-2019 ADOPTED GENERAL FUND BUDGET ROADWAY MAINTENANCE PROGRAM HIGHLIGHTS
CITY OF BRIDGEPORT, CONNECTICUT
ADDITIONAL ACCOMPLISHMENTS 1) Paving Program 2017 performed major rehabilitation on 40 City streets, covering
approximately 15 lane-miles.2) Continued to provide manpower to Sanitation/Recycling, Transfer Station, and other divisions
to help with short-handedness in those activities.3) Finished first across four different categories in CASHO Snow Rodeo (snow preparedness
driver training) fall 2017.4) For illegal dumping, a total of 987 sites cleaned in FY17, removing 472 tons of bulk, 16 tons
of scrap metal, and 759 scrap tires.5) Leaf collection: total of 1852 tons collected in brown bags from the curb citywide FY17.6) Street sweeping: total of 8808 lane miles swept FY17, removing more than 500 truckloads of
road debris.7) Potholes: A total of 12,585 FY17.
FY 2018-2019 GOALS 1) Work with other key City departments to re-establish vigorous enforcement of alternate-side
of street parking to provide better access to the curb for street sweeping, street vacuuming,snow removal and overall cleanup efforts.
2) Continue training employees in safe operation of snow removal and operating snowequipment.
FY 2017-2018 GOAL STATUS 3) Work with other key City departments to re-establish vigorous enforcement of alternate-side
of street parking to provide better access to the curb for street sweeping, street vacuuming,snow removal and overall cleanup efforts.6 MONTH STATUS: Partially meeting goal. Alternate-side enforcement dependent onavailability of BPD.
4) Continue training employees in safe operation of snow removal and operating snowequipment.6 MONTH STATUS: Meeting goal. Finished first across four divisions in CASHO Snow Rodeo fall2017.
ACTUAL ACTUAL ACTUAL ACTUAL 8 MONTH ESTIMATEDSERVICE INDICATORS 2013-2014 2014-2015 2015-2016 2016-2017 2017-2018 2017-2018SNOW & ICE REMOVAL Paved Miles Responsible for 829 829 829 829 829 829Calendar Days snow & ice removal occurred 27 22 12 16 13 15Number of Snow Events during the fiscal year 9 14 5 12 8 10Number of lane miles treated per event (estimated) 13,264 13,264 13,264 13,264 13,264 13,264Number OT Hours paid for snow & ice removal 11,495 11,867 3,054 4,783 3,483 4,000 O & M Expenditures for snow & ice control $785,017 $1,110,874 $443,622 $897,664 $590,105 $690,000Expenditures per mile lane plowed or treated $6.58 $5.98 $6.69 $5.64 $5.56 $5.20Expenditures per capita $5.76 $8.15 $3.26 $6.59 $4.33 $5.06
290
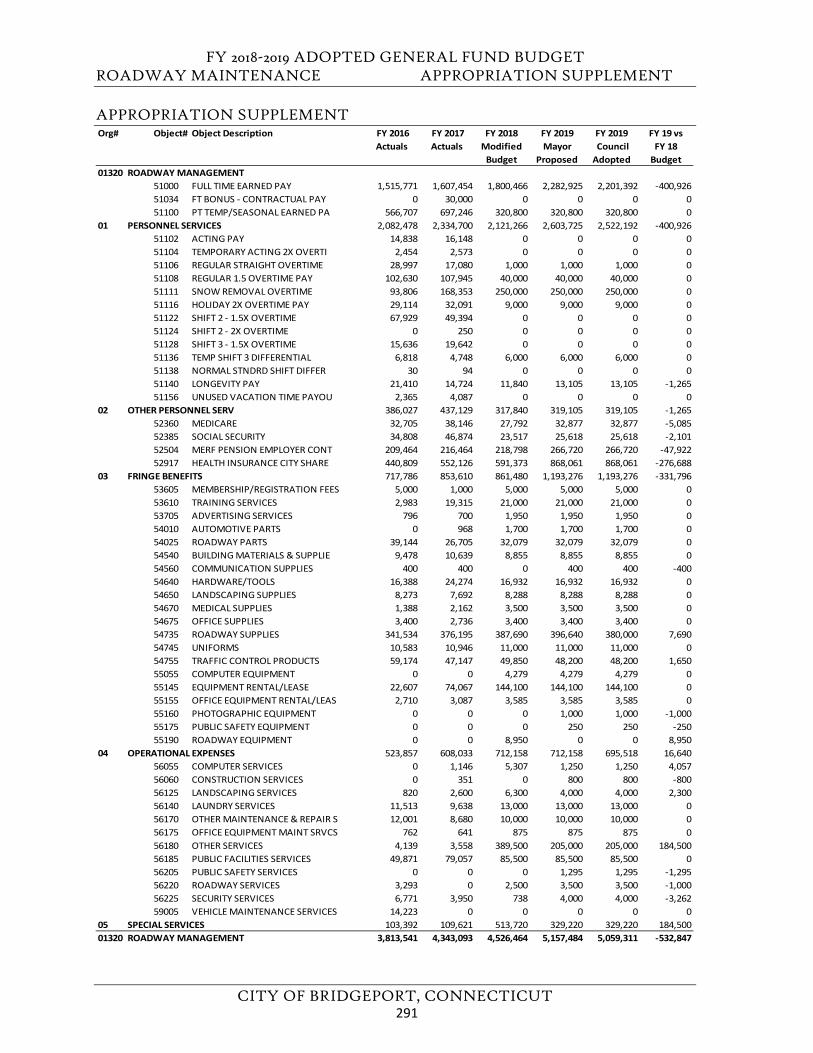
FY 2018-2019 ADOPTED GENERAL FUND BUDGET ROADWAY MAINTENANCE APPROPRIATION SUPPLEMENT
CITY OF BRIDGEPORT, CONNECTICUT
APPROPRIATION SUPPLEMENT Org# Object# Object Description FY 2016
Actuals FY 2017 Actuals
FY 2018 Modified
Budget
FY 2019Mayor
Proposed
FY 2019 Council Adopted
FY 19 vs FY 18
Budget01320 ROADWAY MANAGEMENT
51000 FULL TIME EARNED PAY 1,515,771 1,607,454 1,800,466 2,282,925 2,201,392 -400,92651034 FT BONUS - CONTRACTUAL PAY 0 30,000 0 0 0 051100 PT TEMP/SEASONAL EARNED PA 566,707 697,246 320,800 320,800 320,800 0
01 PERSONNEL SERVICES 2,082,478 2,334,700 2,121,266 2,603,725 2,522,192 -400,92651102 ACTING PAY 14,838 16,148 0 0 0 051104 TEMPORARY ACTING 2X OVERTI 2,454 2,573 0 0 0 051106 REGULAR STRAIGHT OVERTIME 28,997 17,080 1,000 1,000 1,000 051108 REGULAR 1.5 OVERTIME PAY 102,630 107,945 40,000 40,000 40,000 051111 SNOW REMOVAL OVERTIME 93,806 168,353 250,000 250,000 250,000 051116 HOLIDAY 2X OVERTIME PAY 29,114 32,091 9,000 9,000 9,000 051122 SHIFT 2 - 1.5X OVERTIME 67,929 49,394 0 0 0 051124 SHIFT 2 - 2X OVERTIME 0 250 0 0 0 051128 SHIFT 3 - 1.5X OVERTIME 15,636 19,642 0 0 0 051136 TEMP SHIFT 3 DIFFERENTIAL 6,818 4,748 6,000 6,000 6,000 051138 NORMAL STNDRD SHIFT DIFFER 30 94 0 0 0 051140 LONGEVITY PAY 21,410 14,724 11,840 13,105 13,105 -1,26551156 UNUSED VACATION TIME PAYOU 2,365 4,087 0 0 0 0
02 OTHER PERSONNEL SERV 386,027 437,129 317,840 319,105 319,105 -1,26552360 MEDICARE 32,705 38,146 27,792 32,877 32,877 -5,08552385 SOCIAL SECURITY 34,808 46,874 23,517 25,618 25,618 -2,10152504 MERF PENSION EMPLOYER CONT 209,464 216,464 218,798 266,720 266,720 -47,92252917 HEALTH INSURANCE CITY SHARE 440,809 552,126 591,373 868,061 868,061 -276,688
03 FRINGE BENEFITS 717,786 853,610 861,480 1,193,276 1,193,276 -331,79653605 MEMBERSHIP/REGISTRATION FEES 5,000 1,000 5,000 5,000 5,000 053610 TRAINING SERVICES 2,983 19,315 21,000 21,000 21,000 053705 ADVERTISING SERVICES 796 700 1,950 1,950 1,950 054010 AUTOMOTIVE PARTS 0 968 1,700 1,700 1,700 054025 ROADWAY PARTS 39,144 26,705 32,079 32,079 32,079 054540 BUILDING MATERIALS & SUPPLIE 9,478 10,639 8,855 8,855 8,855 054560 COMMUNICATION SUPPLIES 400 400 0 400 400 -40054640 HARDWARE/TOOLS 16,388 24,274 16,932 16,932 16,932 054650 LANDSCAPING SUPPLIES 8,273 7,692 8,288 8,288 8,288 054670 MEDICAL SUPPLIES 1,388 2,162 3,500 3,500 3,500 054675 OFFICE SUPPLIES 3,400 2,736 3,400 3,400 3,400 054735 ROADWAY SUPPLIES 341,534 376,195 387,690 396,640 380,000 7,69054745 UNIFORMS 10,583 10,946 11,000 11,000 11,000 054755 TRAFFIC CONTROL PRODUCTS 59,174 47,147 49,850 48,200 48,200 1,65055055 COMPUTER EQUIPMENT 0 0 4,279 4,279 4,279 055145 EQUIPMENT RENTAL/LEASE 22,607 74,067 144,100 144,100 144,100 055155 OFFICE EQUIPMENT RENTAL/LEAS 2,710 3,087 3,585 3,585 3,585 055160 PHOTOGRAPHIC EQUIPMENT 0 0 0 1,000 1,000 -1,00055175 PUBLIC SAFETY EQUIPMENT 0 0 0 250 250 -25055190 ROADWAY EQUIPMENT 0 0 8,950 0 0 8,950
04 OPERATIONAL EXPENSES 523,857 608,033 712,158 712,158 695,518 16,64056055 COMPUTER SERVICES 0 1,146 5,307 1,250 1,250 4,05756060 CONSTRUCTION SERVICES 0 351 0 800 800 -80056125 LANDSCAPING SERVICES 820 2,600 6,300 4,000 4,000 2,30056140 LAUNDRY SERVICES 11,513 9,638 13,000 13,000 13,000 056170 OTHER MAINTENANCE & REPAIR S 12,001 8,680 10,000 10,000 10,000 056175 OFFICE EQUIPMENT MAINT SRVCS 762 641 875 875 875 056180 OTHER SERVICES 4,139 3,558 389,500 205,000 205,000 184,50056185 PUBLIC FACILITIES SERVICES 49,871 79,057 85,500 85,500 85,500 056205 PUBLIC SAFETY SERVICES 0 0 0 1,295 1,295 -1,29556220 ROADWAY SERVICES 3,293 0 2,500 3,500 3,500 -1,00056225 SECURITY SERVICES 6,771 3,950 738 4,000 4,000 -3,26259005 VEHICLE MAINTENANCE SERVICES 14,223 0 0 0 0 0
05 SPECIAL SERVICES 103,392 109,621 513,720 329,220 329,220 184,50001320 ROADWAY MANAGEMENT 3,813,541 4,343,093 4,526,464 5,157,484 5,059,311 -532,847
291
FY 2018-2019 ADOPTED GENERAL FUND BUDGET
CITY OF BRIDGEPORT, CONNECTICUT
This page left blank intentionally.
292
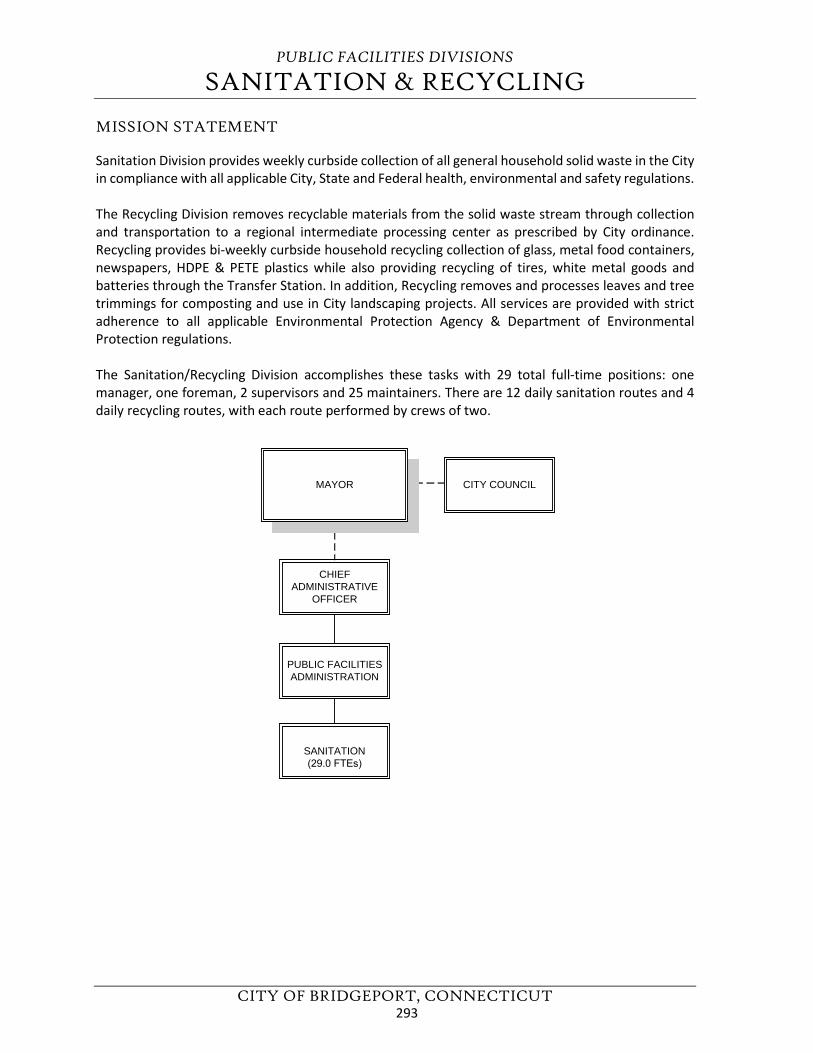
PUBLIC FACILITIES DIVISIONS
SANITATION & RECYCLING
CITY OF BRIDGEPORT, CONNECTICUT
MISSION STATEMENT
Sanitation Division provides weekly curbside collection of all general household solid waste in the City in compliance with all applicable City, State and Federal health, environmental and safety regulations.
The Recycling Division removes recyclable materials from the solid waste stream through collection and transportation to a regional intermediate processing center as prescribed by City ordinance. Recycling provides bi-weekly curbside household recycling collection of glass, metal food containers, newspapers, HDPE & PETE plastics while also providing recycling of tires, white metal goods and batteries through the Transfer Station. In addition, Recycling removes and processes leaves and tree trimmings for composting and use in City landscaping projects. All services are provided with strict adherence to all applicable Environmental Protection Agency & Department of Environmental Protection regulations.
The Sanitation/Recycling Division accomplishes these tasks with 29 total full-time positions: one manager, one foreman, 2 supervisors and 25 maintainers. There are 12 daily sanitation routes and 4 daily recycling routes, with each route performed by crews of two.
CHIEFADMINISTRATIVE
OFFICER
PUBLIC FACILITIESADMINISTRATION
SANITATION(29.0 FTEs)
MAYOR CITY COUNCIL
293
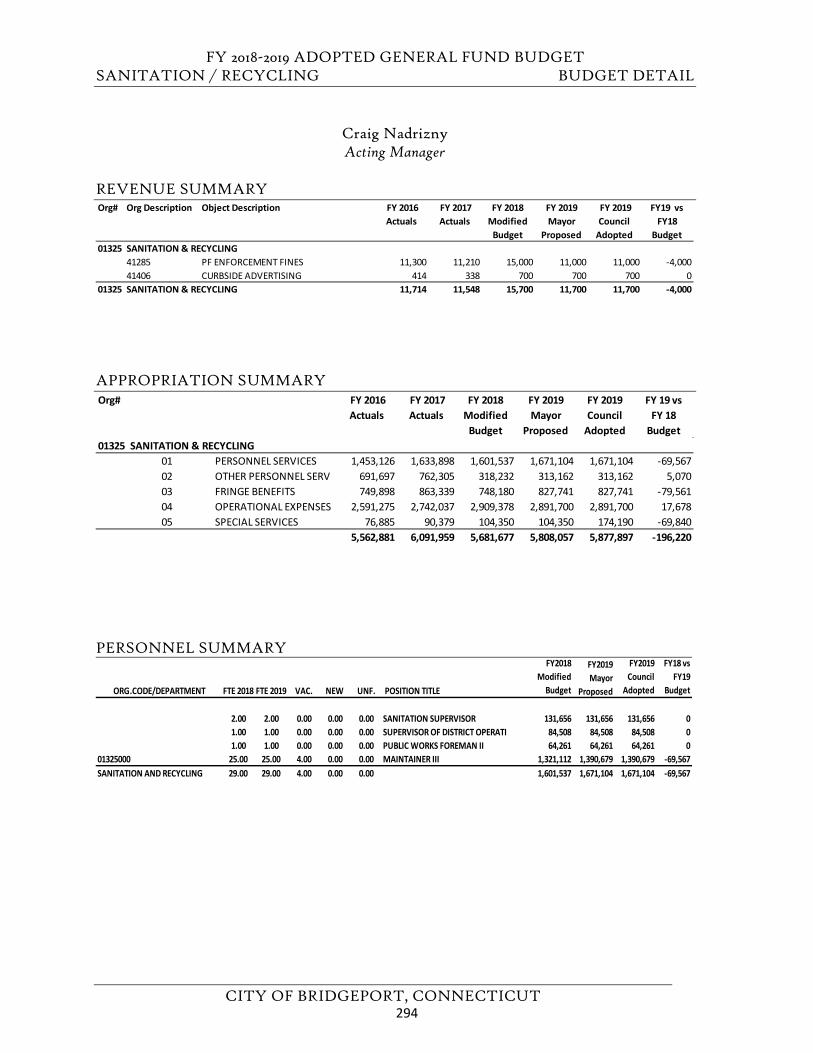
FY 2018-2019 ADOPTED GENERAL FUND BUDGET SANITATION / RECYCLING BUDGET DETAIL
CITY OF BRIDGEPORT, CONNECTICUT
Craig Nadrizny Acting Manager
REVENUE SUMMARY
APPROPRIATION SUMMARY
PERSONNEL SUMMARY
Org# Org Description Object Description FY 2016 Actuals
FY 2017 Actuals
FY 2018 Modified
Budget
FY 2019 Mayor
Proposed
FY 2019 Council
Adopted
FY19 vs FY18
Budget01325 SANITATION & RECYCLING
41285 PF ENFORCEMENT FINES 11,300 11,210 15,000 11,000 11,000 -4,00041406 CURBSIDE ADVERTISING 414 338 700 700 700 0
01325 SANITATION & RECYCLING 11,714 11,548 15,700 11,700 11,700 -4,000
Org# FY 2016 Actuals
FY 2017 Actuals
FY 2018 Modified
Budget
FY 2019 Mayor
Proposed
FY 2019 Council
Adopted
FY 19 vs FY 18
Budget01325 SANITATION & RECYCLING
01 PERSONNEL SERVICES 1,453,126 1,633,898 1,601,537 1,671,104 1,671,104 -69,56702 OTHER PERSONNEL SERV 691,697 762,305 318,232 313,162 313,162 5,07003 FRINGE BENEFITS 749,898 863,339 748,180 827,741 827,741 -79,56104 OPERATIONAL EXPENSES 2,591,275 2,742,037 2,909,378 2,891,700 2,891,700 17,67805 SPECIAL SERVICES 76,885 90,379 104,350 104,350 174,190 -69,840
5,562,881 6,091,959 5,681,677 5,808,057 5,877,897 -196,220
ORG.CODE/DEPARTMENT FTE 2018 FTE 2019 VAC. NEW UNF. POSITION TITLE
FY2018 Modified
Budget
FY2019 Mayor
Proposed
FY2019 Council
Adopted
FY18 vs FY19
Budget
2.00 2.00 0.00 0.00 0.00 SANITATION SUPERVISOR 131,656 131,656 131,656 01.00 1.00 0.00 0.00 0.00 SUPERVISOR OF DISTRICT OPERATI 84,508 84,508 84,508 01.00 1.00 0.00 0.00 0.00 PUBLIC WORKS FOREMAN II 64,261 64,261 64,261 0
01325000 25.00 25.00 4.00 0.00 0.00 MAINTAINER III 1,321,112 1,390,679 1,390,679 -69,567SANITATION AND RECYCLING 29.00 29.00 4.00 0.00 0.00 1,601,537 1,671,104 1,671,104 -69,567
294
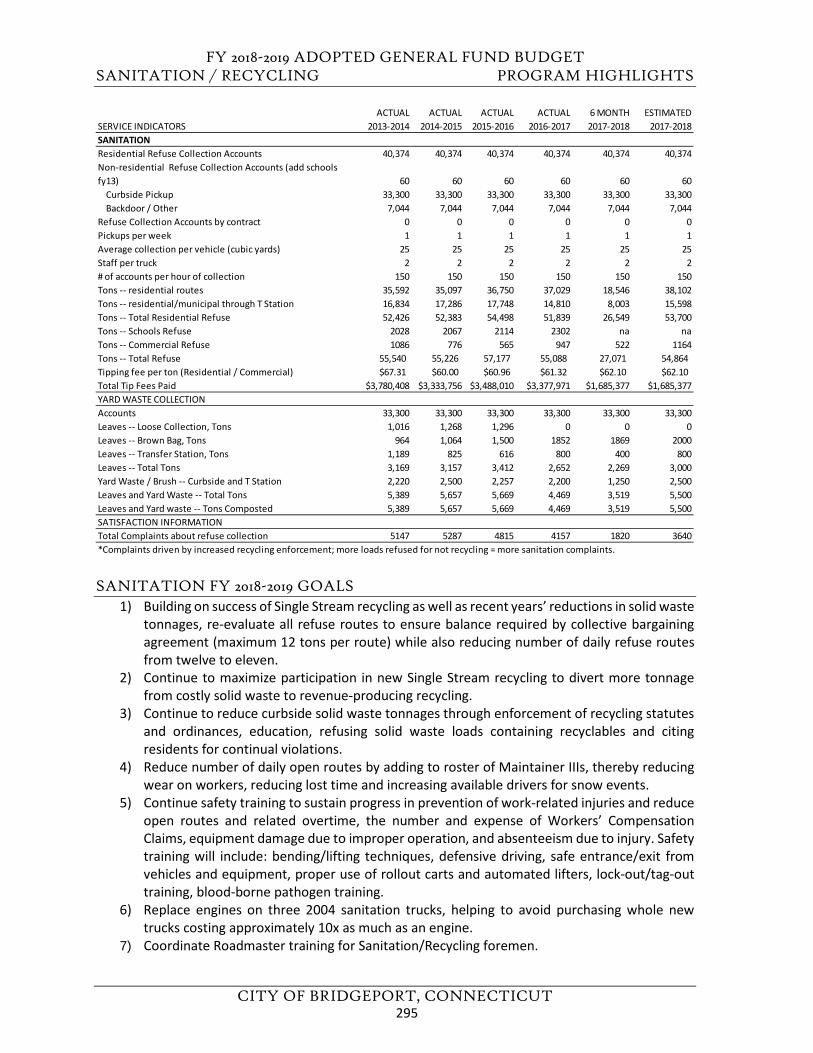
FY 2018-2019 ADOPTED GENERAL FUND BUDGET SANITATION / RECYCLING PROGRAM HIGHLIGHTS
CITY OF BRIDGEPORT, CONNECTICUT
SANITATION FY 2018-2019 GOALS 1) Building on success of Single Stream recycling as well as recent years’ reductions in solid waste
tonnages, re-evaluate all refuse routes to ensure balance required by collective bargainingagreement (maximum 12 tons per route) while also reducing number of daily refuse routesfrom twelve to eleven.
2) Continue to maximize participation in new Single Stream recycling to divert more tonnagefrom costly solid waste to revenue-producing recycling.
3) Continue to reduce curbside solid waste tonnages through enforcement of recycling statutesand ordinances, education, refusing solid waste loads containing recyclables and citingresidents for continual violations.
4) Reduce number of daily open routes by adding to roster of Maintainer IIIs, thereby reducingwear on workers, reducing lost time and increasing available drivers for snow events.
5) Continue safety training to sustain progress in prevention of work-related injuries and reduceopen routes and related overtime, the number and expense of Workers’ CompensationClaims, equipment damage due to improper operation, and absenteeism due to injury. Safetytraining will include: bending/lifting techniques, defensive driving, safe entrance/exit fromvehicles and equipment, proper use of rollout carts and automated lifters, lock-out/tag-outtraining, blood-borne pathogen training.
6) Replace engines on three 2004 sanitation trucks, helping to avoid purchasing whole newtrucks costing approximately 10x as much as an engine.
7) Coordinate Roadmaster training for Sanitation/Recycling foremen.
ACTUAL ACTUAL ACTUAL ACTUAL 6 MONTH ESTIMATEDSERVICE INDICATORS 2013-2014 2014-2015 2015-2016 2016-2017 2017-2018 2017-2018SANITATIONResidential Refuse Collection Accounts 40,374 40,374 40,374 40,374 40,374 40,374Non-residential Refuse Collection Accounts (add schools fy13) 60 60 60 60 60 60
Curbside Pickup 33,300 33,300 33,300 33,300 33,300 33,300Backdoor / Other 7,044 7,044 7,044 7,044 7,044 7,044
Refuse Collection Accounts by contract 0 0 0 0 0 0Pickups per week 1 1 1 1 1 1Average collection per vehicle (cubic yards) 25 25 25 25 25 25Staff per truck 2 2 2 2 2 2# of accounts per hour of collection 150 150 150 150 150 150Tons -- residential routes 35,592 35,097 36,750 37,029 18,546 38,102Tons -- residential/municipal through T Station 16,834 17,286 17,748 14,810 8,003 15,598Tons -- Total Residential Refuse 52,426 52,383 54,498 51,839 26,549 53,700Tons -- Schools Refuse 2028 2067 2114 2302 na naTons -- Commercial Refuse 1086 776 565 947 522 1164Tons -- Total Refuse 55,540 55,226 57,177 55,088 27,071 54,864Tipping fee per ton (Residential / Commercial) $67.31 $60.00 $60.96 $61.32 $62.10 $62.10Total Tip Fees Paid $3,780,408 $3,333,756 $3,488,010 $3,377,971 $1,685,377 $1,685,377YARD WASTE COLLECTIONAccounts 33,300 33,300 33,300 33,300 33,300 33,300Leaves -- Loose Collection, Tons 1,016 1,268 1,296 0 0 0Leaves -- Brown Bag, Tons 964 1,064 1,500 1852 1869 2000Leaves -- Transfer Station, Tons 1,189 825 616 800 400 800Leaves -- Total Tons 3,169 3,157 3,412 2,652 2,269 3,000Yard Waste / Brush -- Curbside and T Station 2,220 2,500 2,257 2,200 1,250 2,500Leaves and Yard Waste -- Total Tons 5,389 5,657 5,669 4,469 3,519 5,500Leaves and Yard waste -- Tons Composted 5,389 5,657 5,669 4,469 3,519 5,500SATISFACTION INFORMATIONTotal Complaints about refuse collection 5147 5287 4815 4157 1820 3640*Complaints driven by increased recycling enforcement; more loads refused for not recycling = more sanitation complaints.
295
FY 2018-2019 ADOPTED GENERAL FUND BUDGET SANITATION / RECYCLING PROGRAM HIGHLIGHTS
CITY OF BRIDGEPORT, CONNECTICUT
SANITATION FY 2017-2018 GOAL STATUS 1) Building on success of Single Stream recycling as well as recent years’ reductions in solid waste
tonnages, re-evaluate all refuse routes to ensure balance required by collective bargainingagreement (maximum 12 tons per route) while also reducing number of daily refuse routesfrom twelve to eleven.6 MONTH STATUS: Partially meeting goal; multi-year, multi-department effort. Departmenthas been pursuing decrease of daily refuse routes from twelve to eleven for several years. Planfor reorganization of refuse routes such that total number daily can be reduced by one whilestaying within collective bargaining agreement of maximum 12 tons per load completed bydepartment during FY13 and submitted to Labor Relations. If plan fully authorized andimplemented, annual savings projected at more than $130k. Analysis, along withconsideration of appropriate bargaining units ongoing through Labor Relations as of Feb 2018.
2) Reduce number of daily open routes by adding to roster of Maintainer IIIs, thereby reducingwear on workers, reducing lost time and increasing available drivers for snow events.6 MONTH STATUS: Partially meeting goal, ongoing effort. Two vacant positions in process offilling Jan 2018.
3) Continue to maximize participation in new Single Stream recycling to divert more tonnagefrom costly solid waste to revenue-producing recycling.6 MONTH STATUS: Meeting goal, efforts ongoing, first six years’ results excellent. SingleStream (no sort) recycling initiated September 2011. In first twelve months of Single Stream,delivered 5155 tons of recycling, which was a 61% increase from the previous twelve months’3203 tons. Growth continued through the second year of Single Stream (Sept 2012-Aug 2013)as citywide 5346 tons of recycling were delivered. The third year of Single Stream sawcontinued growth up to 5459 tons, or 2% over the previous year. That trend continued in fy15,with 5669 tons collected, an increase of almost 4% over the previous year. By fy16, SingleStream recycling tonnage up to 6117 tons, and FY17 totaled 6341 tons, which representsalmost double the tons collected in the last year before Single Stream. So the big growthhappened immediately after switching to Single Stream but then continued strongly every year after that, with annual increases no less than 2% and as high as 8%, quite an accomplishmentgiven the lighter materials involved and efforts industry-wide toward, lighter, smallerpackaging, and much less paper. Meanwhile solid waste tonnages citywide (all sources) during those same periods dropped from 60,436 in FY 11, to 58,736 for FY 12, 55,698 for FY 13, 55,538 in FY14, to 55,224 in FY15, back up to 57,218 in FY16, and then decreasing again in FY17 downto 55,088. Solid waste tonnages can rise or fall for many reasons, only one of which is recycling. But if assume all new tons recycled would have entered the solid waste stream, then Cityavoided $130k tip fee expense just from the first-year increase alone. The value of the tip feesavoided for all the tons of recycling in FY17 (not just the increase) was $389k! Additionally,the City entered into a five-year contract effective July 1, 2013 that pays a guaranteedminimum for the Single Stream recycling and an additional bonus rate for clean cardboard,resulting in approximately $110k-$140k new revenue each year! Combining the tip feeavoided plus the new revenue, that means recycling contributed approximately $529k tothe City’s Budget for FY17 alone! Over the past six years since going to Single Stream, thecombination of tip fees avoided plus revenues received totals more than $2.7M benefit tothe City’s Budget!
296
FY 2018-2019 ADOPTED GENERAL FUND BUDGET SANITATION / RECYCLING PROGRAM HIGHLIGHTS
CITY OF BRIDGEPORT, CONNECTICUT
4) Continue to reduce curbside solid waste tonnages through enforcement of recycling statutesand ordinances, education, refusing solid waste loads containing recyclables and citingresidents for continual violations.6 MONTH STATUS: Meeting Goal, ongoing efforts combining education and enforcement.Staff continues to assess loads daily and meets residents to provide information. During FY17,approximately 5200 households tagged for non-compliance with recycling ordinance. Most allhouseholds are followed up with educational efforts. We continue to cite average 430 cartsmonthly. Educational efforts follow the first and second offenses, with loads rejected for thirdoffense. Fourth offense warrants intervention by Anti-Blight, who can then issue monetaryfines. Most households comply following this process. Anti-Blight involvement was necessaryfor fourth occurrences in approximately 36 cases in FY17. Enforcement continues; it’s a keycomponent to increasing recyclables to decrease tip fee expense and add revenue.
5) Continue safety training to sustain progress in prevention of work-related injuries and reduceopen routes and related overtime, the number and expense of Workers’ CompensationClaims, equipment damage due to improper operation, and absenteeism due to injury. Safetytraining will include: bending/lifting techniques, defensive driving, safe entrance/exit fromvehicles and equipment, proper use of rollout carts and automated lifters, lock-out/tag-outtraining, blood-borne pathogen training.6 MONTH STATUS: Meeting goal; ongoing, multi-year effort. All foremen trained on AccidentInvestigation. Safety training courses conducted annually: proper handling of rollout carts,lock-out-tag-out training, safe operation of compactors/compaction blades. Researching andplanning defensive driving course relevant to daily obstacles as well as professional heavyequipment training for payloader and backhoe operations (which also help to developemployees for higher classified positions). Sanitation/Recycling continues to lead PublicFacilities in fewest number of injury claims and workers comp lost time, which given thenumber of employees, is remarkable. During FY17, out of 64 claims in Public Facilities, only 11were Sani/Recyc; that’s approximately $96k out of $282k total paid out in claims. During FY18,that continues, with only 9 Sani/Recyc claims out of 34 total Pub Fac claims, or only $35k paidout of $135k total department-wide. This is the result of years of effort by the department, but also due to the City’s conversion to rollout carts and automatic lifters for all solid waste andrecycling routes completed approximately six years ago.
6) Continue progress made through Safety Committee Meetings in areas of effective andconsistent communication, teaching and advising employees of the different hazards, andespecially an active investigation of injury claims, thereby continuing to reduce the numberand severity of new claims as well as decreasing associated costs.6 MONTH STATUS: Efforts ongoing. Automated cart lift, annual safety training, active TWPpolicy, detailed accident investigations and a zero-tolerance enforcement approach of allapplicable safety sensitive procedures continue to keep injury claims down driving moreefficiency and more productivity. Supervisors attended refresher classes on proper accidentinvestigations. All employees were given Workers Compensation pamphlets and trained onhow the program works.
297
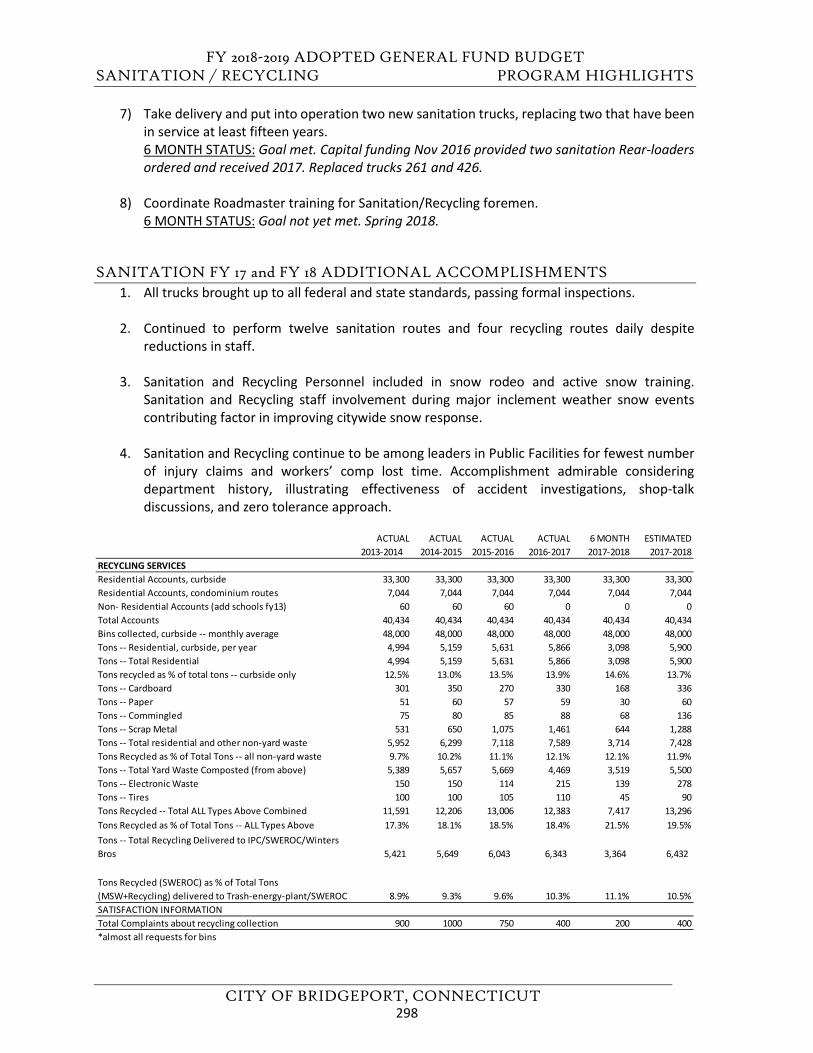
FY 2018-2019 ADOPTED GENERAL FUND BUDGET SANITATION / RECYCLING PROGRAM HIGHLIGHTS
CITY OF BRIDGEPORT, CONNECTICUT
7) Take delivery and put into operation two new sanitation trucks, replacing two that have beenin service at least fifteen years.6 MONTH STATUS: Goal met. Capital funding Nov 2016 provided two sanitation Rear-loadersordered and received 2017. Replaced trucks 261 and 426.
8) Coordinate Roadmaster training for Sanitation/Recycling foremen.6 MONTH STATUS: Goal not yet met. Spring 2018.
SANITATION FY 17 and FY 18 ADDITIONAL ACCOMPLISHMENTS
1. All trucks brought up to all federal and state standards, passing formal inspections.
2. Continued to perform twelve sanitation routes and four recycling routes daily despitereductions in staff.
3. Sanitation and Recycling Personnel included in snow rodeo and active snow training.Sanitation and Recycling staff involvement during major inclement weather snow eventscontributing factor in improving citywide snow response.
4. Sanitation and Recycling continue to be among leaders in Public Facilities for fewest numberof injury claims and workers’ comp lost time. Accomplishment admirable consideringdepartment history, illustrating effectiveness of accident investigations, shop-talkdiscussions, and zero tolerance approach.
ACTUAL ACTUAL ACTUAL ACTUAL 6 MONTH ESTIMATED2013-2014 2014-2015 2015-2016 2016-2017 2017-2018 2017-2018
RECYCLING SERVICESResidential Accounts, curbside 33,300 33,300 33,300 33,300 33,300 33,300Residential Accounts, condominium routes 7,044 7,044 7,044 7,044 7,044 7,044Non- Residential Accounts (add schools fy13) 60 60 60 0 0 0Total Accounts 40,434 40,434 40,434 40,434 40,434 40,434Bins collected, curbside -- monthly average 48,000 48,000 48,000 48,000 48,000 48,000Tons -- Residential, curbside, per year 4,994 5,159 5,631 5,866 3,098 5,900Tons -- Total Residential 4,994 5,159 5,631 5,866 3,098 5,900Tons recycled as % of total tons -- curbside only 12.5% 13.0% 13.5% 13.9% 14.6% 13.7%Tons -- Cardboard 301 350 270 330 168 336Tons -- Paper 51 60 57 59 30 60Tons -- Commingled 75 80 85 88 68 136Tons -- Scrap Metal 531 650 1,075 1,461 644 1,288Tons -- Total residential and other non-yard waste 5,952 6,299 7,118 7,589 3,714 7,428Tons Recycled as % of Total Tons -- all non-yard waste 9.7% 10.2% 11.1% 12.1% 12.1% 11.9%Tons -- Total Yard Waste Composted (from above) 5,389 5,657 5,669 4,469 3,519 5,500Tons -- Electronic Waste 150 150 114 215 139 278Tons -- Tires 100 100 105 110 45 90Tons Recycled -- Total ALL Types Above Combined 11,591 12,206 13,006 12,383 7,417 13,296Tons Recycled as % of Total Tons -- ALL Types Above 17.3% 18.1% 18.5% 18.4% 21.5% 19.5%Tons -- Total Recycling Delivered to IPC/SWEROC/Winters Bros 5,421 5,649 6,043 6,343 3,364 6,432
Tons Recycled (SWEROC) as % of Total Tons (MSW+Recycling) delivered to Trash-energy-plant/SWEROC 8.9% 9.3% 9.6% 10.3% 11.1% 10.5%SATISFACTION INFORMATIONTotal Complaints about recycling collection 900 1000 750 400 200 400*almost all requests for bins
298
FY 2018-2019 ADOPTED GENERAL FUND BUDGET SANITATION / RECYCLING PROGRAM HIGHLIGHTS
CITY OF BRIDGEPORT, CONNECTICUT
RECYCLING FY 2018-2019 GOALS 1) Re-examine condo pickup schedules, deployment of dumpsters and rollout carts to improve
recycling participation at condos, continue to drive up tonnages and reduce complaints.2) Continue program to identify top-recycling households and award them additional rollout
cart(s).3) Implement additional training for staff in heavy equipment, OSHA compliance, snow removal.4) Continue enforcement strategy to increase recycling participation.5) Re-enforce recycling participation within our City buildings.
RECYCLING FY 2017-2018 GOAL STATUS 1) Re-examine condo pickup schedules, deployment of dumpsters and rollout carts to improve
recycling participation at condos, continue to drive up tonnages and reduce complaints.6 MONTH STATUS: Partially meeting goal. Condo recycling review initiated, early stages.Approximately dozen additional rollout carts distributed. Bulk of program still ahead. Ongoingeffort.
2) Continue program to identify top-recycling households and award them additional rolloutcart(s).6 MONTH STATUS: Partially meeting goal; multi-year effort. Initiated in Spring 2015, morethan 200 top-recycling households identified by staff observation, bi-lingual flyers drawn upand accompanied issuing additional Toters. Program almost universally welcomed, but lapsed.Will continue in spring 2018 and throughout year.
3) Implement additional training for staff in heavy equipment, OSHA compliance, snow removal.6 MONTH STATUS: Goal partially met. Foremen had OSHA-10 training last year. Heavyequipment training FY17. Entire department participated in snow training fall 2017. Moreplanned calendar 2018.
4) Continue enforcement strategy to increase recycling participation.6 MONTH STATUS: Meeting Goal, ongoing efforts combining education and enforcement.Staff continues to assess loads daily and meets residents to provide information. During FY17,approximately 2,000 households tagged for non-compliance with recycling ordinance. Mostall households are followed up with educational efforts. We continue to cite average 175 cartsmonthly. Educational efforts follow the first and second offenses, with loads rejected for thirdoffense. Fourth offense warrants intervention by Anti-Blight, who can then issue monetaryfines. Most households comply following this process. Anti-Blight involvement was necessaryfor fourth occurrences in approximately 75 cases in FY17. Enforcement continues; it’s a keycomponent to increasing recyclables to decrease tip fee expense and add revenue.
5) Continue aiding Education Department with sanitation and recycling collections increasingrecycling participation in schools.6 MONTH STATUS: Goal cancelled. Education department choosing to go with privatevendor/hauler Aug 2017. Public Facilities no longer involved.
6) Re-enforce recycling participation within our City buildings.6 MONTH STATUS: Partially meeting goal; ongoing effort. Needs to be re-visited in light ofchanges in personnel and assignments.
299
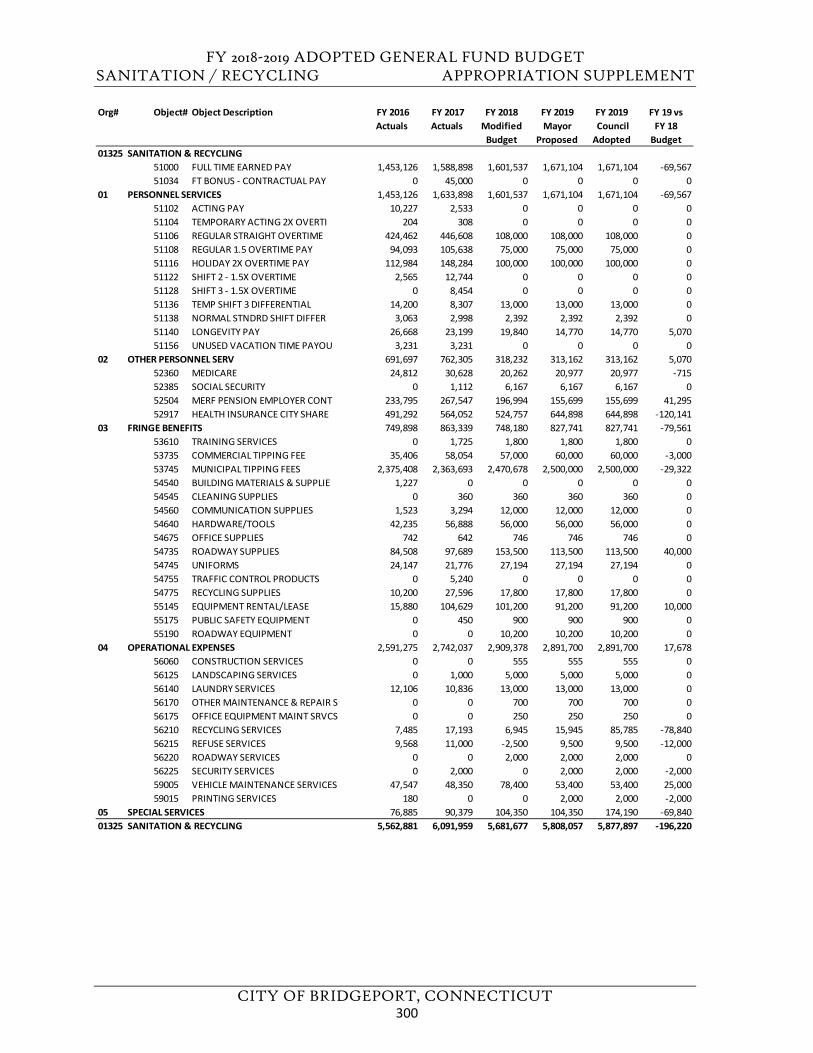
FY 2018-2019 ADOPTED GENERAL FUND BUDGET SANITATION / RECYCLING APPROPRIATION SUPPLEMENT
CITY OF BRIDGEPORT, CONNECTICUT
Org# Object# Object Description FY 2016 Actuals
FY 2017 Actuals
FY 2018 Modified
Budget
FY 2019Mayor
Proposed
FY 2019 Council Adopted
FY 19 vs FY 18
Budget01325 SANITATION & RECYCLING
51000 FULL TIME EARNED PAY 1,453,126 1,588,898 1,601,537 1,671,104 1,671,104 -69,56751034 FT BONUS - CONTRACTUAL PAY 0 45,000 0 0 0 0
01 PERSONNEL SERVICES 1,453,126 1,633,898 1,601,537 1,671,104 1,671,104 -69,56751102 ACTING PAY 10,227 2,533 0 0 0 051104 TEMPORARY ACTING 2X OVERTI 204 308 0 0 0 051106 REGULAR STRAIGHT OVERTIME 424,462 446,608 108,000 108,000 108,000 051108 REGULAR 1.5 OVERTIME PAY 94,093 105,638 75,000 75,000 75,000 051116 HOLIDAY 2X OVERTIME PAY 112,984 148,284 100,000 100,000 100,000 051122 SHIFT 2 - 1.5X OVERTIME 2,565 12,744 0 0 0 051128 SHIFT 3 - 1.5X OVERTIME 0 8,454 0 0 0 051136 TEMP SHIFT 3 DIFFERENTIAL 14,200 8,307 13,000 13,000 13,000 051138 NORMAL STNDRD SHIFT DIFFER 3,063 2,998 2,392 2,392 2,392 051140 LONGEVITY PAY 26,668 23,199 19,840 14,770 14,770 5,07051156 UNUSED VACATION TIME PAYOU 3,231 3,231 0 0 0 0
02 OTHER PERSONNEL SERV 691,697 762,305 318,232 313,162 313,162 5,07052360 MEDICARE 24,812 30,628 20,262 20,977 20,977 -71552385 SOCIAL SECURITY 0 1,112 6,167 6,167 6,167 052504 MERF PENSION EMPLOYER CONT 233,795 267,547 196,994 155,699 155,699 41,29552917 HEALTH INSURANCE CITY SHARE 491,292 564,052 524,757 644,898 644,898 -120,141
03 FRINGE BENEFITS 749,898 863,339 748,180 827,741 827,741 -79,56153610 TRAINING SERVICES 0 1,725 1,800 1,800 1,800 053735 COMMERCIAL TIPPING FEE 35,406 58,054 57,000 60,000 60,000 -3,00053745 MUNICIPAL TIPPING FEES 2,375,408 2,363,693 2,470,678 2,500,000 2,500,000 -29,32254540 BUILDING MATERIALS & SUPPLIE 1,227 0 0 0 0 054545 CLEANING SUPPLIES 0 360 360 360 360 054560 COMMUNICATION SUPPLIES 1,523 3,294 12,000 12,000 12,000 054640 HARDWARE/TOOLS 42,235 56,888 56,000 56,000 56,000 054675 OFFICE SUPPLIES 742 642 746 746 746 054735 ROADWAY SUPPLIES 84,508 97,689 153,500 113,500 113,500 40,00054745 UNIFORMS 24,147 21,776 27,194 27,194 27,194 054755 TRAFFIC CONTROL PRODUCTS 0 5,240 0 0 0 054775 RECYCLING SUPPLIES 10,200 27,596 17,800 17,800 17,800 055145 EQUIPMENT RENTAL/LEASE 15,880 104,629 101,200 91,200 91,200 10,00055175 PUBLIC SAFETY EQUIPMENT 0 450 900 900 900 055190 ROADWAY EQUIPMENT 0 0 10,200 10,200 10,200 0
04 OPERATIONAL EXPENSES 2,591,275 2,742,037 2,909,378 2,891,700 2,891,700 17,67856060 CONSTRUCTION SERVICES 0 0 555 555 555 056125 LANDSCAPING SERVICES 0 1,000 5,000 5,000 5,000 056140 LAUNDRY SERVICES 12,106 10,836 13,000 13,000 13,000 056170 OTHER MAINTENANCE & REPAIR S 0 0 700 700 700 056175 OFFICE EQUIPMENT MAINT SRVCS 0 0 250 250 250 056210 RECYCLING SERVICES 7,485 17,193 6,945 15,945 85,785 -78,84056215 REFUSE SERVICES 9,568 11,000 -2,500 9,500 9,500 -12,00056220 ROADWAY SERVICES 0 0 2,000 2,000 2,000 056225 SECURITY SERVICES 0 2,000 0 2,000 2,000 -2,00059005 VEHICLE MAINTENANCE SERVICES 47,547 48,350 78,400 53,400 53,400 25,00059015 PRINTING SERVICES 180 0 0 2,000 2,000 -2,000
05 SPECIAL SERVICES 76,885 90,379 104,350 104,350 174,190 -69,84001325 SANITATION & RECYCLING 5,562,881 6,091,959 5,681,677 5,808,057 5,877,897 -196,220
300
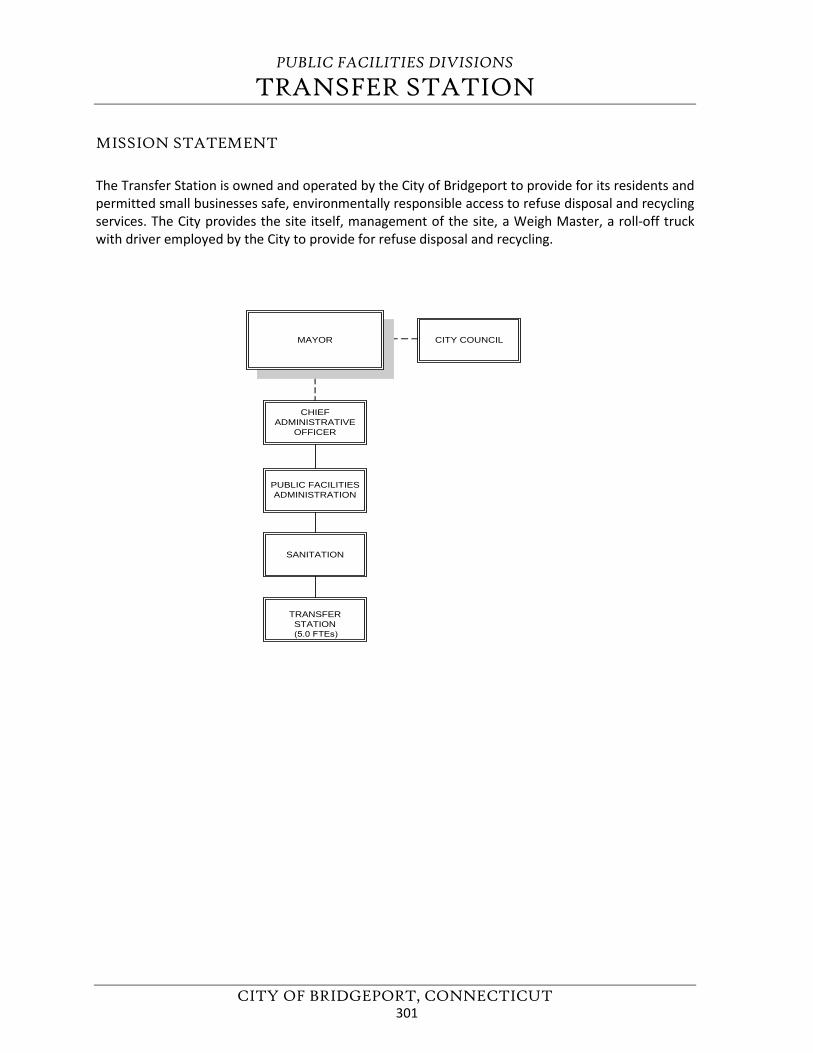
PUBLIC FACILITIES DIVISIONS
TRANSFER STATION
CITY OF BRIDGEPORT, CONNECTICUT
MISSION STATEMENT
The Transfer Station is owned and operated by the City of Bridgeport to provide for its residents and permitted small businesses safe, environmentally responsible access to refuse disposal and recycling services. The City provides the site itself, management of the site, a Weigh Master, a roll-off truck with driver employed by the City to provide for refuse disposal and recycling.
CHIEFADMINISTRATIVE
OFFICER
PUBLIC FACILITIESADMINISTRATION
SANITATION
MAYOR CITY COUNCIL
TRANSFERSTATION(5.0 FTEs)
301
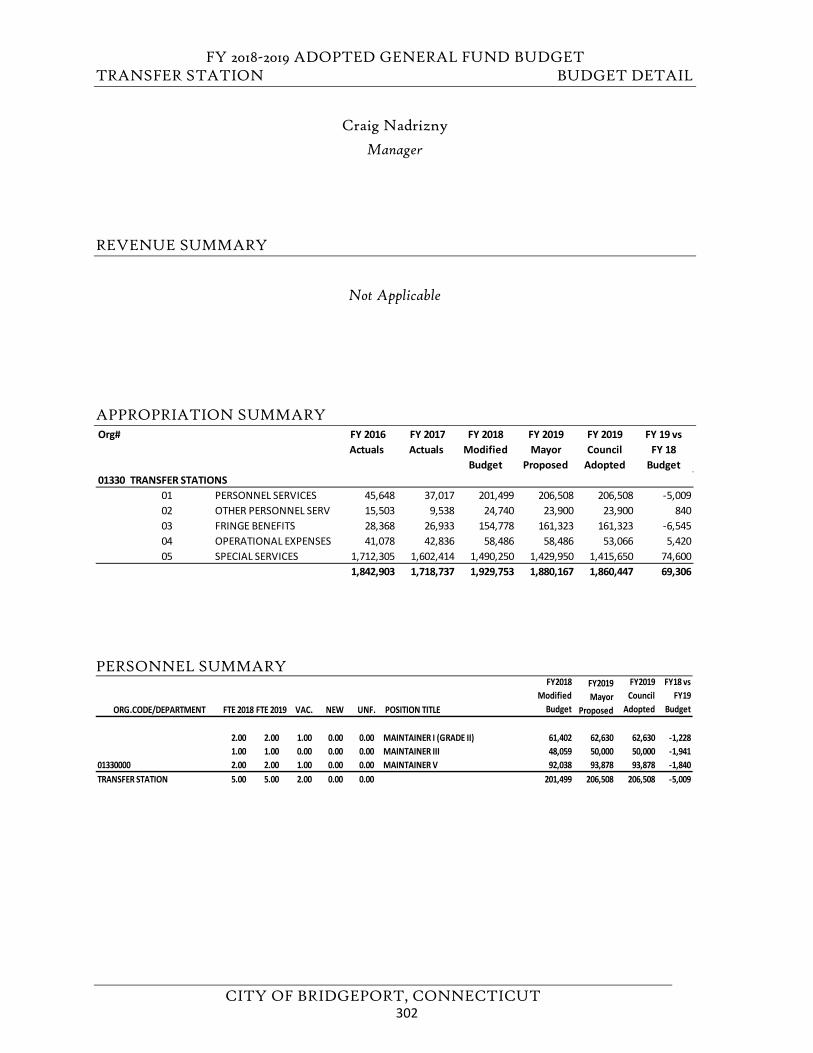
FY 2018-2019 ADOPTED GENERAL FUND BUDGET TRANSFER STATION BUDGET DETAIL
CITY OF BRIDGEPORT, CONNECTICUT
Craig Nadrizny
Manager
REVENUE SUMMARY
Not Applicable
APPROPRIATION SUMMARY
PERSONNEL SUMMARY
Org# FY 2016 Actuals
FY 2017 Actuals
FY 2018 Modified
Budget
FY 2019 Mayor
Proposed
FY 2019 Council
Adopted
FY 19 vs FY 18
Budget01330 TRANSFER STATIONS
01 PERSONNEL SERVICES 45,648 37,017 201,499 206,508 206,508 -5,00902 OTHER PERSONNEL SERV 15,503 9,538 24,740 23,900 23,900 84003 FRINGE BENEFITS 28,368 26,933 154,778 161,323 161,323 -6,54504 OPERATIONAL EXPENSES 41,078 42,836 58,486 58,486 53,066 5,42005 SPECIAL SERVICES 1,712,305 1,602,414 1,490,250 1,429,950 1,415,650 74,600
1,842,903 1,718,737 1,929,753 1,880,167 1,860,447 69,306
ORG.CODE/DEPARTMENT FTE 2018 FTE 2019 VAC. NEW UNF. POSITION TITLE
FY2018 Modified
Budget
FY2019 Mayor
Proposed
FY2019 Council
Adopted
FY18 vs FY19
Budget
2.00 2.00 1.00 0.00 0.00 MAINTAINER I (GRADE II) 61,402 62,630 62,630 -1,2281.00 1.00 0.00 0.00 0.00 MAINTAINER III 48,059 50,000 50,000 -1,941
01330000 2.00 2.00 1.00 0.00 0.00 MAINTAINER V 92,038 93,878 93,878 -1,840TRANSFER STATION 5.00 5.00 2.00 0.00 0.00 201,499 206,508 206,508 -5,009
302
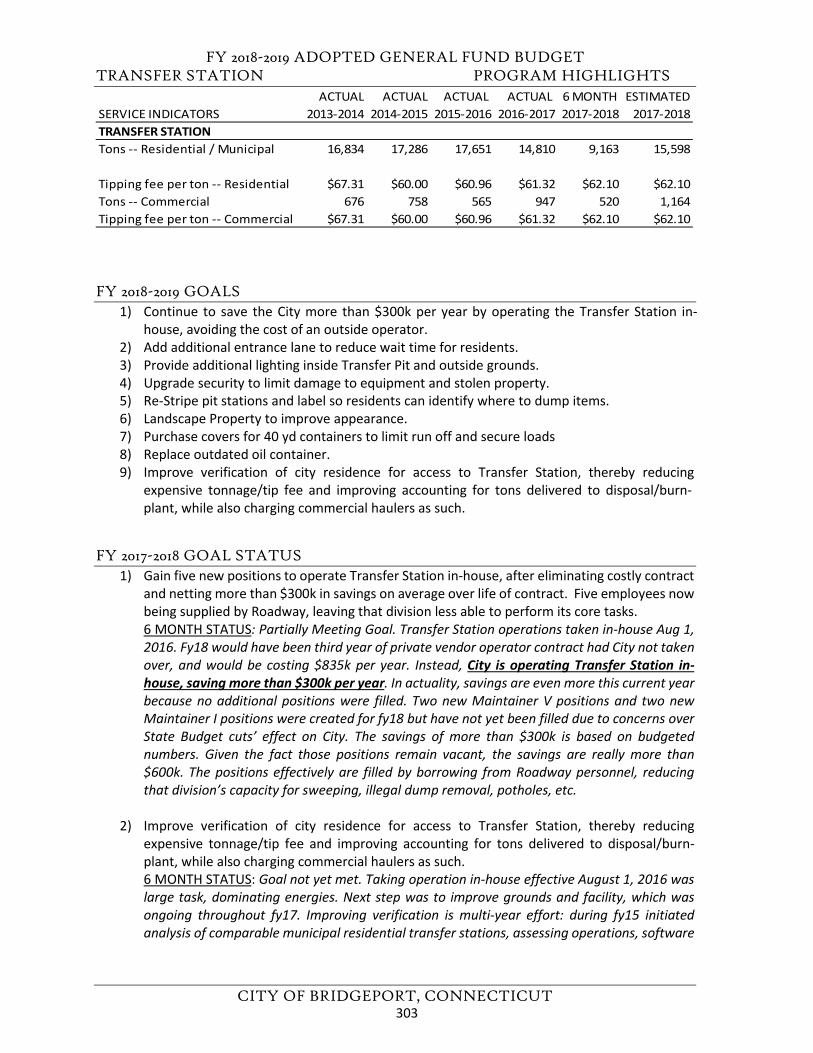
FY 2018-2019 ADOPTED GENERAL FUND BUDGET TRANSFER STATION PROGRAM HIGHLIGHTS
CITY OF BRIDGEPORT, CONNECTICUT
FY 2018-2019 GOALS 1) Continue to save the City more than $300k per year by operating the Transfer Station in-
house, avoiding the cost of an outside operator.2) Add additional entrance lane to reduce wait time for residents.3) Provide additional lighting inside Transfer Pit and outside grounds.4) Upgrade security to limit damage to equipment and stolen property.5) Re-Stripe pit stations and label so residents can identify where to dump items.6) Landscape Property to improve appearance.7) Purchase covers for 40 yd containers to limit run off and secure loads8) Replace outdated oil container.9) Improve verification of city residence for access to Transfer Station, thereby reducing
expensive tonnage/tip fee and improving accounting for tons delivered to disposal/burn-plant, while also charging commercial haulers as such.
FY 2017-2018 GOAL STATUS 1) Gain five new positions to operate Transfer Station in-house, after eliminating costly contract
and netting more than $300k in savings on average over life of contract. Five employees nowbeing supplied by Roadway, leaving that division less able to perform its core tasks.6 MONTH STATUS: Partially Meeting Goal. Transfer Station operations taken in-house Aug 1,2016. Fy18 would have been third year of private vendor operator contract had City not takenover, and would be costing $835k per year. Instead, City is operating Transfer Station in-house, saving more than $300k per year. In actuality, savings are even more this current yearbecause no additional positions were filled. Two new Maintainer V positions and two newMaintainer I positions were created for fy18 but have not yet been filled due to concerns overState Budget cuts’ effect on City. The savings of more than $300k is based on budgetednumbers. Given the fact those positions remain vacant, the savings are really more than$600k. The positions effectively are filled by borrowing from Roadway personnel, reducingthat division’s capacity for sweeping, illegal dump removal, potholes, etc.
2) Improve verification of city residence for access to Transfer Station, thereby reducingexpensive tonnage/tip fee and improving accounting for tons delivered to disposal/burn-plant, while also charging commercial haulers as such.6 MONTH STATUS: Goal not yet met. Taking operation in-house effective August 1, 2016 waslarge task, dominating energies. Next step was to improve grounds and facility, which wasongoing throughout fy17. Improving verification is multi-year effort: during fy15 initiatedanalysis of comparable municipal residential transfer stations, assessing operations, software
ACTUAL ACTUAL ACTUAL ACTUAL 6 MONTH ESTIMATEDSERVICE INDICATORS 2013-2014 2014-2015 2015-2016 2016-2017 2017-2018 2017-2018TRANSFER STATIONTons -- Residential / Municipal 16,834 17,286 17,651 14,810 9,163 15,598
Tipping fee per ton -- Residential $67.31 $60.00 $60.96 $61.32 $62.10 $62.10Tons -- Commercial 676 758 565 947 520 1,164Tipping fee per ton -- Commercial $67.31 $60.00 $60.96 $61.32 $62.10 $62.10
303
FY 2018-2019 ADOPTED GENERAL FUND BUDGET TRANSFER STATION PROGRAM HIGHLIGHTS
CITY OF BRIDGEPORT, CONNECTICUT
applications, residential ID-tags, load-tickets, studying potential future pricing for pick-up trucks versus mason-dumps, utility rack-body trucks. Examining different systems for allocating resident access and charges.
3) Purchase new scale with software to provide more accurate records, customer accountmanagement and accommodate varied payment options.6 MONTH STATUS: Meeting goal. New scale purchased and installed spring 2017. Software tobe decided later date.
4) Install computer into Scale house so all information can be tracked as it’s received.6 MONTH STATUS: Goal not yet met. Computer not yet purchased; system not yet established.
5) Impose a charge to dispose tires and Freon to offset what City pays to dispose items.6 MONTH STATUS: Partially meeting goal, will be multi-year effort. Developing system bywhich to charge, but not yet ready for Council approval nor implementation.
6) Install additional signage and provide flyers to inform residents of acceptable andunacceptable items.6 MONTH STATUS: Meeting goal. Additional signage installed; more to come. Flyersdistributed.
7) Provide additional heavy equipment training and cross training with additional employeesso the same service is provided when permanent personnel are not present.6 MONTH STATUS: Not meeting goal yet. Need to fill budgeted positions such that Roadwaycan then fill their positions and have people to cross-train.
ADDITIONAL TRANSFER STATION INFORMATION Listed below are accepted items, their associated disposal fees when applicable (or historical averages), and a typical monthly tonnage:
• Solid Waste (bulk, furniture, house-hold trash): $62.10; avg 1416 tons/month.• Leaves: processed at compost site-in-house: 42.2 tons/month.• Brush: processed at compost site-in-house: 119 tons/month.• Tires: $21/cu yd, now $840/load=approx 40 tires, Avg 3.5 loads per month.• Scrap Metal: $120/gross-ton: 75 tons/month—revenue from sale deposited to General Fund,
rates vary with market.• Waste Oil: $6,000 fee; 372 gallons/month.• Antifreeze: 35 gallons/month.• Small amounts of aggregate construction and demolition material: .75/ton, processed by City
personnel to offset costs: 9.5 tons per month.• Small amounts of construction and demolition material: $80/ton, 2.8 tons/month.• Cardboard: I.P.C., 24 tons per month; no charge: offset tip fee at burn plant, generates approx
$25/ton revenue through contract with Winters Brothers.• Mixed Paper, magazines: .5 tons per month; generates $20/ton revenue from through
contract with Winters Bros.• Mattress Recycling on average 12 tons/month separated from waste-stream to avoid tip-fee;
recycled by local non-profit organization.
304
FY 2018-2019 ADOPTED GENERAL FUND BUDGET TRANSFER STATION PROGRAM HIGHLIGHTS
CITY OF BRIDGEPORT, CONNECTICUT
• Single stream comingled recycling: 13.8 tons/month, avoids tip fee at burn plant, generates
$20/ton revenue.• Electronic waste is separated from waste stream: 19 tons per month.
The facility is open to Bridgeport residents and small business owners/haulers with permits, year-round, with the following hours of operation:
Monday- Saturday 7am – 3:30pm Closed holidays and snow events.
305
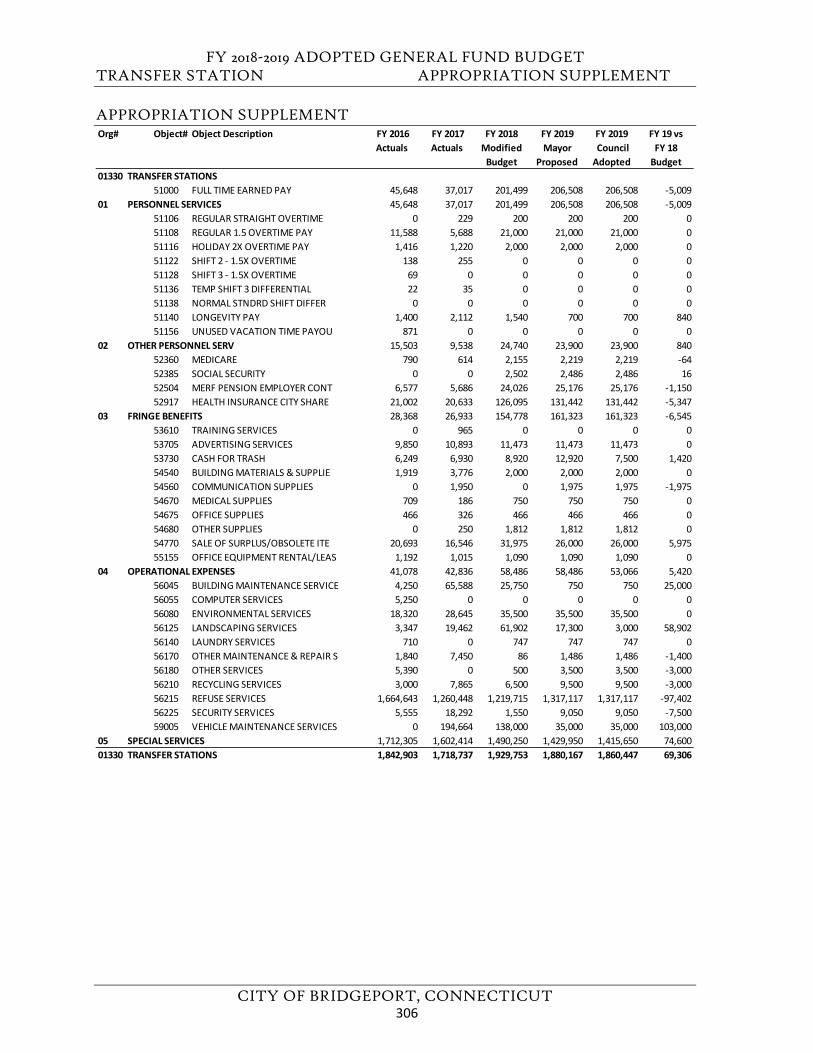
FY 2018-2019 ADOPTED GENERAL FUND BUDGET TRANSFER STATION APPROPRIATION SUPPLEMENT
CITY OF BRIDGEPORT, CONNECTICUT
APPROPRIATION SUPPLEMENT Org# Object# Object Description FY 2016
Actuals FY 2017 Actuals
FY 2018 Modified
Budget
FY 2019Mayor
Proposed
FY 2019 Council Adopted
FY 19 vs FY 18
Budget01330 TRANSFER STATIONS
51000 FULL TIME EARNED PAY 45,648 37,017 201,499 206,508 206,508 -5,00901 PERSONNEL SERVICES 45,648 37,017 201,499 206,508 206,508 -5,009
51106 REGULAR STRAIGHT OVERTIME 0 229 200 200 200 051108 REGULAR 1.5 OVERTIME PAY 11,588 5,688 21,000 21,000 21,000 051116 HOLIDAY 2X OVERTIME PAY 1,416 1,220 2,000 2,000 2,000 051122 SHIFT 2 - 1.5X OVERTIME 138 255 0 0 0 051128 SHIFT 3 - 1.5X OVERTIME 69 0 0 0 0 051136 TEMP SHIFT 3 DIFFERENTIAL 22 35 0 0 0 051138 NORMAL STNDRD SHIFT DIFFER 0 0 0 0 0 051140 LONGEVITY PAY 1,400 2,112 1,540 700 700 84051156 UNUSED VACATION TIME PAYOU 871 0 0 0 0 0
02 OTHER PERSONNEL SERV 15,503 9,538 24,740 23,900 23,900 84052360 MEDICARE 790 614 2,155 2,219 2,219 -6452385 SOCIAL SECURITY 0 0 2,502 2,486 2,486 1652504 MERF PENSION EMPLOYER CONT 6,577 5,686 24,026 25,176 25,176 -1,15052917 HEALTH INSURANCE CITY SHARE 21,002 20,633 126,095 131,442 131,442 -5,347
03 FRINGE BENEFITS 28,368 26,933 154,778 161,323 161,323 -6,54553610 TRAINING SERVICES 0 965 0 0 0 053705 ADVERTISING SERVICES 9,850 10,893 11,473 11,473 11,473 053730 CASH FOR TRASH 6,249 6,930 8,920 12,920 7,500 1,42054540 BUILDING MATERIALS & SUPPLIE 1,919 3,776 2,000 2,000 2,000 054560 COMMUNICATION SUPPLIES 0 1,950 0 1,975 1,975 -1,97554670 MEDICAL SUPPLIES 709 186 750 750 750 054675 OFFICE SUPPLIES 466 326 466 466 466 054680 OTHER SUPPLIES 0 250 1,812 1,812 1,812 054770 SALE OF SURPLUS/OBSOLETE ITE 20,693 16,546 31,975 26,000 26,000 5,97555155 OFFICE EQUIPMENT RENTAL/LEAS 1,192 1,015 1,090 1,090 1,090 0
04 OPERATIONAL EXPENSES 41,078 42,836 58,486 58,486 53,066 5,42056045 BUILDING MAINTENANCE SERVICE 4,250 65,588 25,750 750 750 25,00056055 COMPUTER SERVICES 5,250 0 0 0 0 056080 ENVIRONMENTAL SERVICES 18,320 28,645 35,500 35,500 35,500 056125 LANDSCAPING SERVICES 3,347 19,462 61,902 17,300 3,000 58,90256140 LAUNDRY SERVICES 710 0 747 747 747 056170 OTHER MAINTENANCE & REPAIR S 1,840 7,450 86 1,486 1,486 -1,40056180 OTHER SERVICES 5,390 0 500 3,500 3,500 -3,00056210 RECYCLING SERVICES 3,000 7,865 6,500 9,500 9,500 -3,00056215 REFUSE SERVICES 1,664,643 1,260,448 1,219,715 1,317,117 1,317,117 -97,40256225 SECURITY SERVICES 5,555 18,292 1,550 9,050 9,050 -7,50059005 VEHICLE MAINTENANCE SERVICES 0 194,664 138,000 35,000 35,000 103,000
05 SPECIAL SERVICES 1,712,305 1,602,414 1,490,250 1,429,950 1,415,650 74,60001330 TRANSFER STATIONS 1,842,903 1,718,737 1,929,753 1,880,167 1,860,447 69,306
306
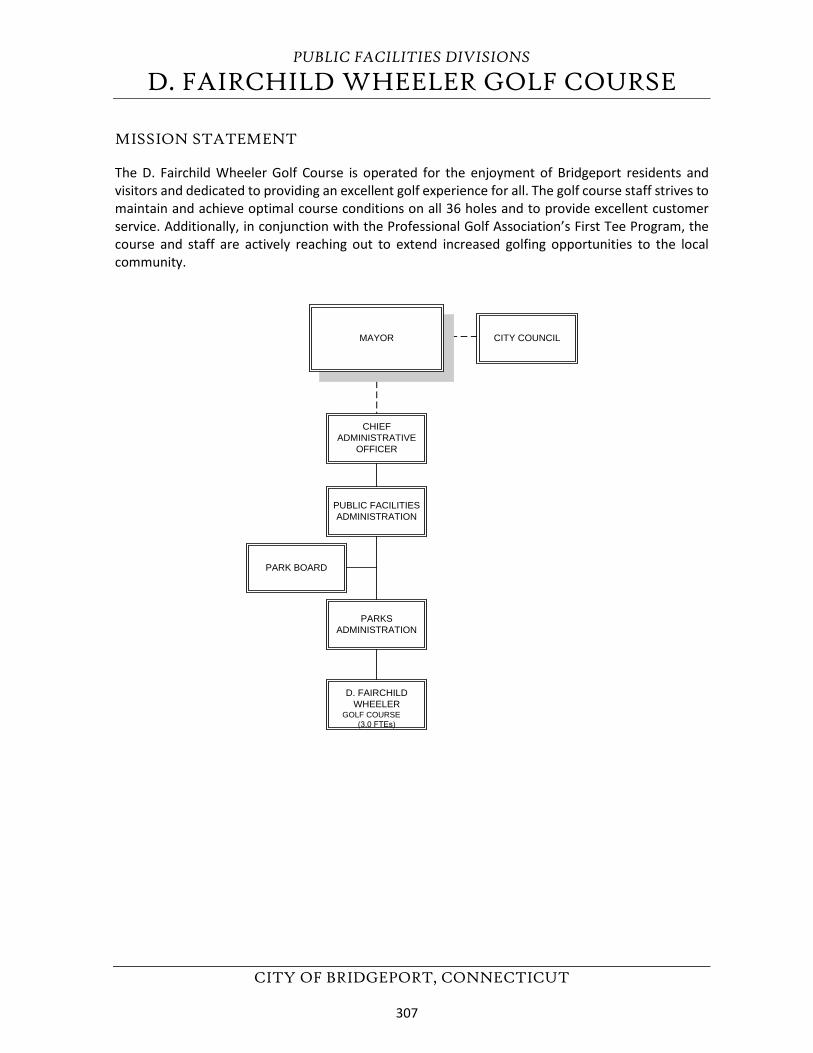
PUBLIC FACILITIES DIVISIONS
D. FAIRCHILD WHEELER GOLF COURSE
CITY OF BRIDGEPORT, CONNECTICUT
MISSION STATEMENT
The D. Fairchild Wheeler Golf Course is operated for the enjoyment of Bridgeport residents and visitors and dedicated to providing an excellent golf experience for all. The golf course staff strives to maintain and achieve optimal course conditions on all 36 holes and to provide excellent customer service. Additionally, in conjunction with the Professional Golf Association’s First Tee Program, the course and staff are actively reaching out to extend increased golfing opportunities to the local community.
CHIEFADMINISTRATIVE
OFFICER
PUBLIC FACILITIESADMINISTRATION
PARKSADMINISTRATION
MAYOR CITY COUNCIL
PARK BOARD
D. FAIRCHILDWHEELER
GOLF COURSE(3.0 FTEs)
307
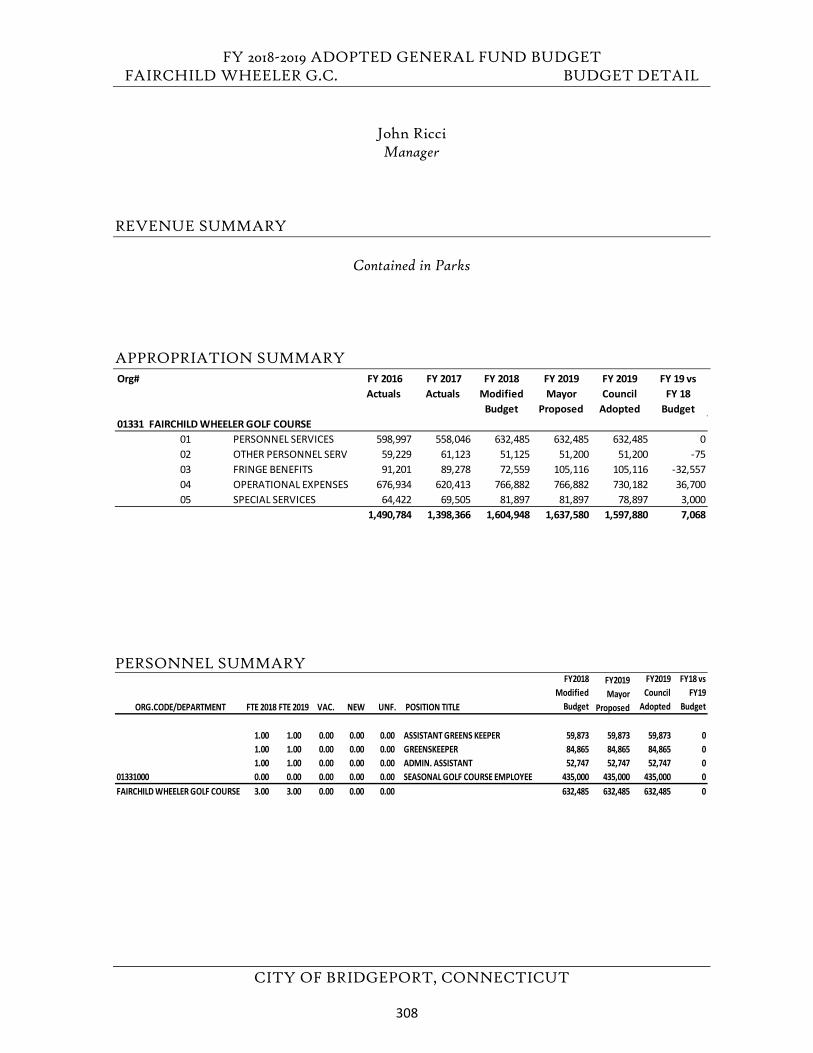
FY 2018-2019 ADOPTED GENERAL FUND BUDGET FAIRCHILD WHEELER G.C. BUDGET DETAIL
CITY OF BRIDGEPORT, CONNECTICUT
John Ricci Manager
REVENUE SUMMARY
Contained in Parks
APPROPRIATION SUMMARY
PERSONNEL SUMMARY
Org# FY 2016 Actuals
FY 2017 Actuals
FY 2018 Modified
Budget
FY 2019 Mayor
Proposed
FY 2019 Council
Adopted
FY 19 vs FY 18
Budget01331 FAIRCHILD WHEELER GOLF COURSE
01 PERSONNEL SERVICES 598,997 558,046 632,485 632,485 632,485 002 OTHER PERSONNEL SERV 59,229 61,123 51,125 51,200 51,200 -7503 FRINGE BENEFITS 91,201 89,278 72,559 105,116 105,116 -32,55704 OPERATIONAL EXPENSES 676,934 620,413 766,882 766,882 730,182 36,70005 SPECIAL SERVICES 64,422 69,505 81,897 81,897 78,897 3,000
1,490,784 1,398,366 1,604,948 1,637,580 1,597,880 7,068
ORG.CODE/DEPARTMENT FTE 2018 FTE 2019 VAC. NEW UNF. POSITION TITLE
FY2018 Modified
Budget
FY2019 Mayor
Proposed
FY2019 Council
Adopted
FY18 vs FY19
Budget
1.00 1.00 0.00 0.00 0.00 ASSISTANT GREENS KEEPER 59,873 59,873 59,873 01.00 1.00 0.00 0.00 0.00 GREENSKEEPER 84,865 84,865 84,865 01.00 1.00 0.00 0.00 0.00 ADMIN. ASSISTANT 52,747 52,747 52,747 0
01331000 0.00 0.00 0.00 0.00 0.00 SEASONAL GOLF COURSE EMPLOYEE 435,000 435,000 435,000 0FAIRCHILD WHEELER GOLF COURSE 3.00 3.00 0.00 0.00 0.00 632,485 632,485 632,485 0
308
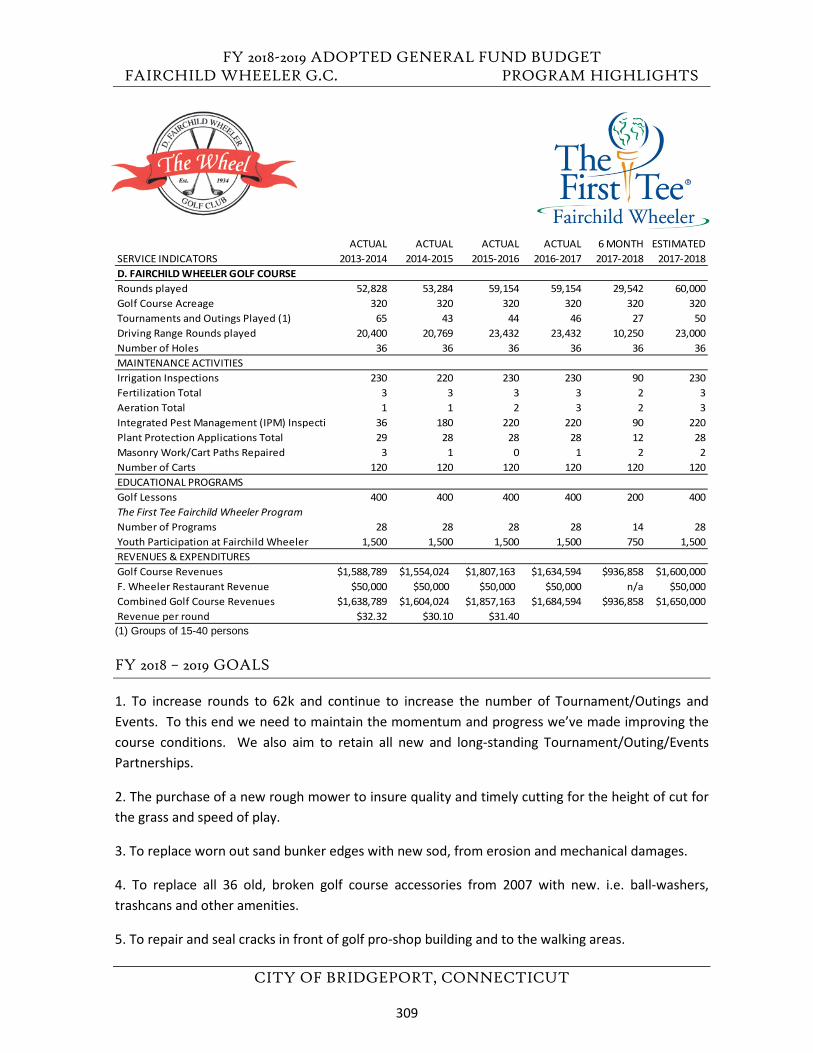
FY 2018-2019 ADOPTED GENERAL FUND BUDGET FAIRCHILD WHEELER G.C. PROGRAM HIGHLIGHTS
CITY OF BRIDGEPORT, CONNECTICUT
(1) Groups of 15-40 persons
FY 2018 – 2019 GOALS
1. To increase rounds to 62k and continue to increase the number of Tournament/Outings andEvents. To this end we need to maintain the momentum and progress we’ve made improving thecourse conditions. We also aim to retain all new and long-standing Tournament/Outing/EventsPartnerships.
2. The purchase of a new rough mower to insure quality and timely cutting for the height of cut forthe grass and speed of play.
3. To replace worn out sand bunker edges with new sod, from erosion and mechanical damages.
4. To replace all 36 old, broken golf course accessories from 2007 with new. i.e. ball-washers,trashcans and other amenities.
5. To repair and seal cracks in front of golf pro-shop building and to the walking areas.
ACTUAL ACTUAL ACTUAL ACTUAL 6 MONTH ESTIMATEDSERVICE INDICATORS 2013-2014 2014-2015 2015-2016 2016-2017 2017-2018 2017-2018D. FAIRCHILD WHEELER GOLF COURSERounds played 52,828 53,284 59,154 59,154 29,542 60,000Golf Course Acreage 320 320 320 320 320 320Tournaments and Outings Played (1) 65 43 44 46 27 50Driving Range Rounds played 20,400 20,769 23,432 23,432 10,250 23,000Number of Holes 36 36 36 36 36 36MAINTENANCE ACTIVITIESIrrigation Inspections 230 220 230 230 90 230Fertilization Total 3 3 3 3 2 3Aeration Total 1 1 2 3 2 3Integrated Pest Management (IPM) Inspecti 36 180 220 220 90 220Plant Protection Applications Total 29 28 28 28 12 28Masonry Work/Cart Paths Repaired 3 1 0 1 2 2Number of Carts 120 120 120 120 120 120EDUCATIONAL PROGRAMSGolf Lessons 400 400 400 400 200 400The First Tee Fairchild Wheeler ProgramNumber of Programs 28 28 28 28 14 28Youth Participation at Fairchild Wheeler 1,500 1,500 1,500 1,500 750 1,500REVENUES & EXPENDITURESGolf Course Revenues $1,588,789 $1,554,024 $1,807,163 $1,634,594 $936,858 $1,600,000F. Wheeler Restaurant Revenue $50,000 $50,000 $50,000 $50,000 n/a $50,000Combined Golf Course Revenues $1,638,789 $1,604,024 $1,857,163 $1,684,594 $936,858 $1,650,000Revenue per round $32.32 $30.10 $31.40
309
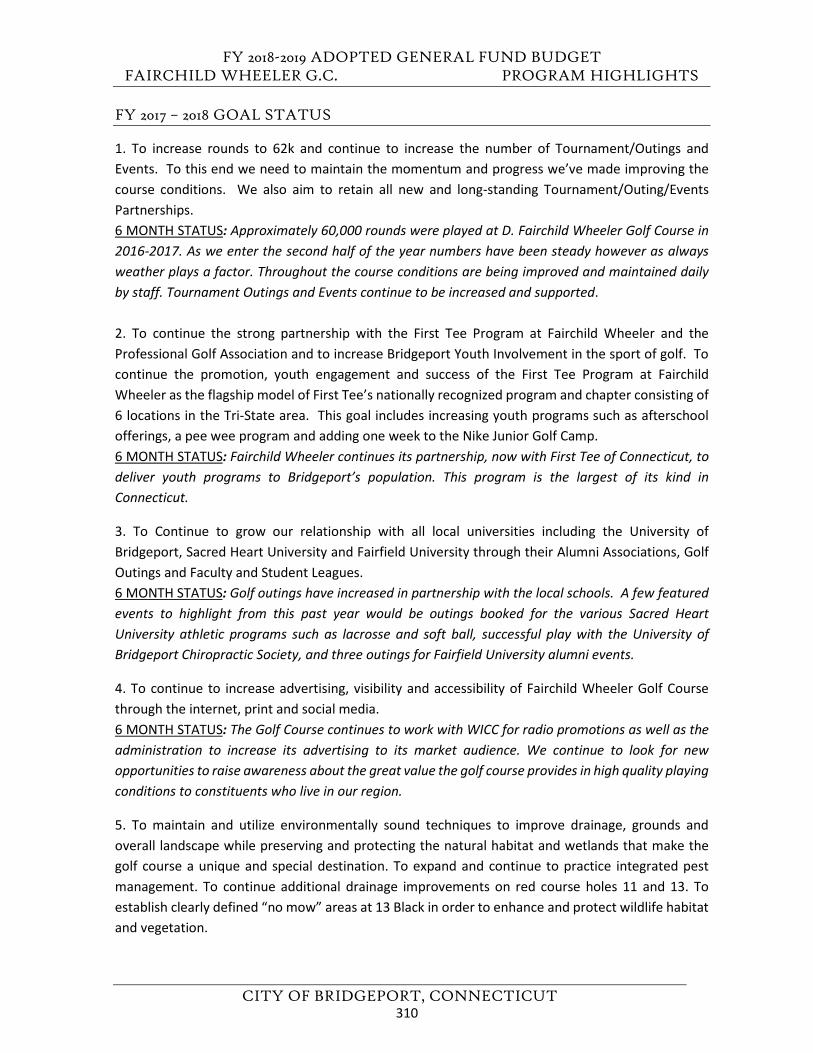
FY 2018-2019 ADOPTED GENERAL FUND BUDGET FAIRCHILD WHEELER G.C. PROGRAM HIGHLIGHTS
CITY OF BRIDGEPORT, CONNECTICUT
FY 2017 – 2018 GOAL STATUS
1. To increase rounds to 62k and continue to increase the number of Tournament/Outings andEvents. To this end we need to maintain the momentum and progress we’ve made improving thecourse conditions. We also aim to retain all new and long-standing Tournament/Outing/EventsPartnerships.6 MONTH STATUS: Approximately 60,000 rounds were played at D. Fairchild Wheeler Golf Course in2016-2017. As we enter the second half of the year numbers have been steady however as alwaysweather plays a factor. Throughout the course conditions are being improved and maintained dailyby staff. Tournament Outings and Events continue to be increased and supported.
2. To continue the strong partnership with the First Tee Program at Fairchild Wheeler and theProfessional Golf Association and to increase Bridgeport Youth Involvement in the sport of golf. Tocontinue the promotion, youth engagement and success of the First Tee Program at FairchildWheeler as the flagship model of First Tee’s nationally recognized program and chapter consisting of6 locations in the Tri-State area. This goal includes increasing youth programs such as afterschoolofferings, a pee wee program and adding one week to the Nike Junior Golf Camp.6 MONTH STATUS: Fairchild Wheeler continues its partnership, now with First Tee of Connecticut, todeliver youth programs to Bridgeport’s population. This program is the largest of its kind inConnecticut.
3. To Continue to grow our relationship with all local universities including the University ofBridgeport, Sacred Heart University and Fairfield University through their Alumni Associations, GolfOutings and Faculty and Student Leagues.6 MONTH STATUS: Golf outings have increased in partnership with the local schools. A few featuredevents to highlight from this past year would be outings booked for the various Sacred HeartUniversity athletic programs such as lacrosse and soft ball, successful play with the University ofBridgeport Chiropractic Society, and three outings for Fairfield University alumni events.
4. To continue to increase advertising, visibility and accessibility of Fairchild Wheeler Golf Coursethrough the internet, print and social media.6 MONTH STATUS: The Golf Course continues to work with WICC for radio promotions as well as theadministration to increase its advertising to its market audience. We continue to look for newopportunities to raise awareness about the great value the golf course provides in high quality playing conditions to constituents who live in our region.
5. To maintain and utilize environmentally sound techniques to improve drainage, grounds andoverall landscape while preserving and protecting the natural habitat and wetlands that make thegolf course a unique and special destination. To expand and continue to practice integrated pestmanagement. To continue additional drainage improvements on red course holes 11 and 13. Toestablish clearly defined “no mow” areas at 13 Black in order to enhance and protect wildlife habitatand vegetation.
310
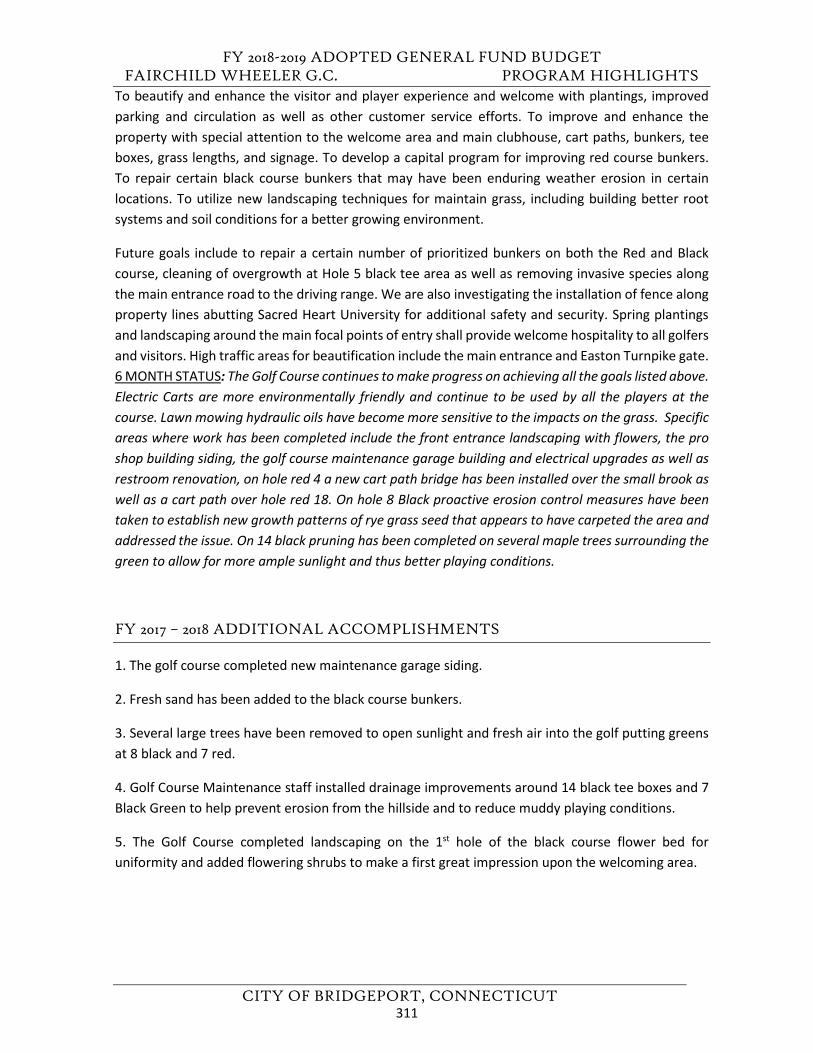
FY 2018-2019 ADOPTED GENERAL FUND BUDGET FAIRCHILD WHEELER G.C. PROGRAM HIGHLIGHTS
CITY OF BRIDGEPORT, CONNECTICUT
To beautify and enhance the visitor and player experience and welcome with plantings, improved parking and circulation as well as other customer service efforts. To improve and enhance the property with special attention to the welcome area and main clubhouse, cart paths, bunkers, tee boxes, grass lengths, and signage. To develop a capital program for improving red course bunkers. To repair certain black course bunkers that may have been enduring weather erosion in certain locations. To utilize new landscaping techniques for maintain grass, including building better root systems and soil conditions for a better growing environment.
Future goals include to repair a certain number of prioritized bunkers on both the Red and Black course, cleaning of overgrowth at Hole 5 black tee area as well as removing invasive species along the main entrance road to the driving range. We are also investigating the installation of fence along property lines abutting Sacred Heart University for additional safety and security. Spring plantings and landscaping around the main focal points of entry shall provide welcome hospitality to all golfers and visitors. High traffic areas for beautification include the main entrance and Easton Turnpike gate. 6 MONTH STATUS: The Golf Course continues to make progress on achieving all the goals listed above. Electric Carts are more environmentally friendly and continue to be used by all the players at the course. Lawn mowing hydraulic oils have become more sensitive to the impacts on the grass. Specific areas where work has been completed include the front entrance landscaping with flowers, the pro shop building siding, the golf course maintenance garage building and electrical upgrades as well as restroom renovation, on hole red 4 a new cart path bridge has been installed over the small brook as well as a cart path over hole red 18. On hole 8 Black proactive erosion control measures have been taken to establish new growth patterns of rye grass seed that appears to have carpeted the area and addressed the issue. On 14 black pruning has been completed on several maple trees surrounding the green to allow for more ample sunlight and thus better playing conditions.
FY 2017 – 2018 ADDITIONAL ACCOMPLISHMENTS
1. The golf course completed new maintenance garage siding.
2. Fresh sand has been added to the black course bunkers.
3. Several large trees have been removed to open sunlight and fresh air into the golf putting greensat 8 black and 7 red.
4. Golf Course Maintenance staff installed drainage improvements around 14 black tee boxes and 7Black Green to help prevent erosion from the hillside and to reduce muddy playing conditions.
5. The Golf Course completed landscaping on the 1st hole of the black course flower bed foruniformity and added flowering shrubs to make a first great impression upon the welcoming area.
311
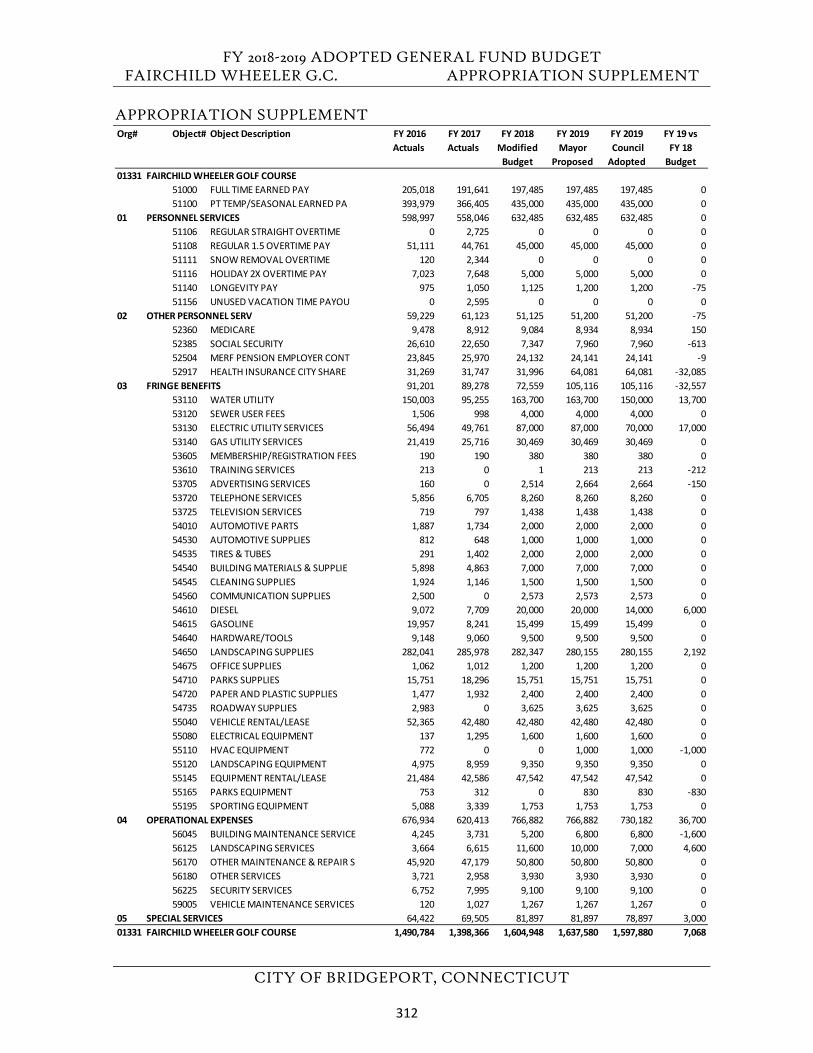
FY 2018-2019 ADOPTED GENERAL FUND BUDGET FAIRCHILD WHEELER G.C. APPROPRIATION SUPPLEMENT
CITY OF BRIDGEPORT, CONNECTICUT
APPROPRIATION SUPPLEMENT Org# Object# Object Description FY 2016
Actuals FY 2017 Actuals
FY 2018 Modified
Budget
FY 2019Mayor
Proposed
FY 2019 Council Adopted
FY 19 vs FY 18
Budget01331 FAIRCHILD WHEELER GOLF COURSE
51000 FULL TIME EARNED PAY 205,018 191,641 197,485 197,485 197,485 051100 PT TEMP/SEASONAL EARNED PA 393,979 366,405 435,000 435,000 435,000 0
01 PERSONNEL SERVICES 598,997 558,046 632,485 632,485 632,485 051106 REGULAR STRAIGHT OVERTIME 0 2,725 0 0 0 051108 REGULAR 1.5 OVERTIME PAY 51,111 44,761 45,000 45,000 45,000 051111 SNOW REMOVAL OVERTIME 120 2,344 0 0 0 051116 HOLIDAY 2X OVERTIME PAY 7,023 7,648 5,000 5,000 5,000 051140 LONGEVITY PAY 975 1,050 1,125 1,200 1,200 -7551156 UNUSED VACATION TIME PAYOU 0 2,595 0 0 0 0
02 OTHER PERSONNEL SERV 59,229 61,123 51,125 51,200 51,200 -7552360 MEDICARE 9,478 8,912 9,084 8,934 8,934 15052385 SOCIAL SECURITY 26,610 22,650 7,347 7,960 7,960 -61352504 MERF PENSION EMPLOYER CONT 23,845 25,970 24,132 24,141 24,141 -952917 HEALTH INSURANCE CITY SHARE 31,269 31,747 31,996 64,081 64,081 -32,085
03 FRINGE BENEFITS 91,201 89,278 72,559 105,116 105,116 -32,55753110 WATER UTILITY 150,003 95,255 163,700 163,700 150,000 13,70053120 SEWER USER FEES 1,506 998 4,000 4,000 4,000 053130 ELECTRIC UTILITY SERVICES 56,494 49,761 87,000 87,000 70,000 17,00053140 GAS UTILITY SERVICES 21,419 25,716 30,469 30,469 30,469 053605 MEMBERSHIP/REGISTRATION FEES 190 190 380 380 380 053610 TRAINING SERVICES 213 0 1 213 213 -21253705 ADVERTISING SERVICES 160 0 2,514 2,664 2,664 -15053720 TELEPHONE SERVICES 5,856 6,705 8,260 8,260 8,260 053725 TELEVISION SERVICES 719 797 1,438 1,438 1,438 054010 AUTOMOTIVE PARTS 1,887 1,734 2,000 2,000 2,000 054530 AUTOMOTIVE SUPPLIES 812 648 1,000 1,000 1,000 054535 TIRES & TUBES 291 1,402 2,000 2,000 2,000 054540 BUILDING MATERIALS & SUPPLIE 5,898 4,863 7,000 7,000 7,000 054545 CLEANING SUPPLIES 1,924 1,146 1,500 1,500 1,500 054560 COMMUNICATION SUPPLIES 2,500 0 2,573 2,573 2,573 054610 DIESEL 9,072 7,709 20,000 20,000 14,000 6,00054615 GASOLINE 19,957 8,241 15,499 15,499 15,499 054640 HARDWARE/TOOLS 9,148 9,060 9,500 9,500 9,500 054650 LANDSCAPING SUPPLIES 282,041 285,978 282,347 280,155 280,155 2,19254675 OFFICE SUPPLIES 1,062 1,012 1,200 1,200 1,200 054710 PARKS SUPPLIES 15,751 18,296 15,751 15,751 15,751 054720 PAPER AND PLASTIC SUPPLIES 1,477 1,932 2,400 2,400 2,400 054735 ROADWAY SUPPLIES 2,983 0 3,625 3,625 3,625 055040 VEHICLE RENTAL/LEASE 52,365 42,480 42,480 42,480 42,480 055080 ELECTRICAL EQUIPMENT 137 1,295 1,600 1,600 1,600 055110 HVAC EQUIPMENT 772 0 0 1,000 1,000 -1,00055120 LANDSCAPING EQUIPMENT 4,975 8,959 9,350 9,350 9,350 055145 EQUIPMENT RENTAL/LEASE 21,484 42,586 47,542 47,542 47,542 055165 PARKS EQUIPMENT 753 312 0 830 830 -83055195 SPORTING EQUIPMENT 5,088 3,339 1,753 1,753 1,753 0
04 OPERATIONAL EXPENSES 676,934 620,413 766,882 766,882 730,182 36,70056045 BUILDING MAINTENANCE SERVICE 4,245 3,731 5,200 6,800 6,800 -1,60056125 LANDSCAPING SERVICES 3,664 6,615 11,600 10,000 7,000 4,60056170 OTHER MAINTENANCE & REPAIR S 45,920 47,179 50,800 50,800 50,800 056180 OTHER SERVICES 3,721 2,958 3,930 3,930 3,930 056225 SECURITY SERVICES 6,752 7,995 9,100 9,100 9,100 059005 VEHICLE MAINTENANCE SERVICES 120 1,027 1,267 1,267 1,267 0
05 SPECIAL SERVICES 64,422 69,505 81,897 81,897 78,897 3,00001331 FAIRCHILD WHEELER GOLF COURSE 1,490,784 1,398,366 1,604,948 1,637,580 1,597,880 7,068
312
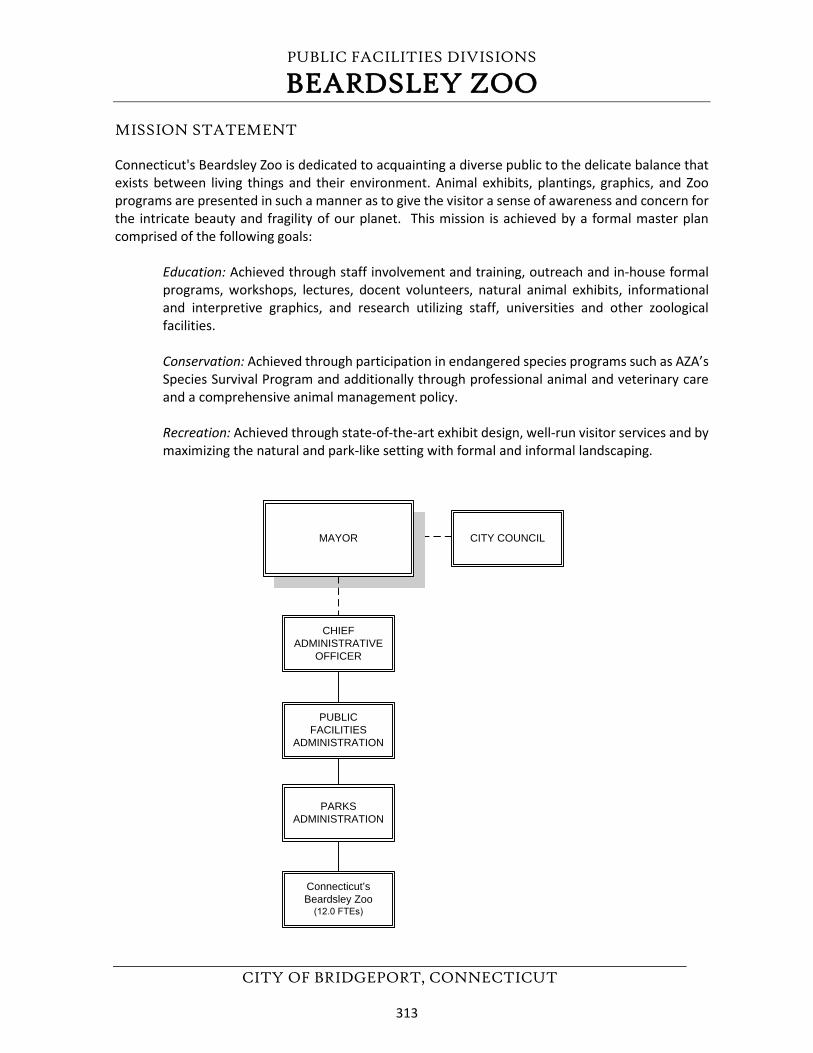
PUBLIC FACILITIES DIVISIONS
BEARDSLEY ZOO
CITY OF BRIDGEPORT, CONNECTICUT
MISSION STATEMENT
Connecticut's Beardsley Zoo is dedicated to acquainting a diverse public to the delicate balance that exists between living things and their environment. Animal exhibits, plantings, graphics, and Zoo programs are presented in such a manner as to give the visitor a sense of awareness and concern for the intricate beauty and fragility of our planet. This mission is achieved by a formal master plan comprised of the following goals:
Education: Achieved through staff involvement and training, outreach and in-house formal programs, workshops, lectures, docent volunteers, natural animal exhibits, informational and interpretive graphics, and research utilizing staff, universities and other zoological facilities.
Conservation: Achieved through participation in endangered species programs such as AZA’s Species Survival Program and additionally through professional animal and veterinary care and a comprehensive animal management policy.
Recreation: Achieved through state-of-the-art exhibit design, well-run visitor services and by maximizing the natural and park-like setting with formal and informal landscaping.
CHIEF ADMINISTRATIVE
OFFICER
PUBLIC FACILITIES
ADMINISTRATION
PARKS ADMINISTRATION
Connecticut’s Beardsley Zoo
(12.0 FTEs)
MAYOR CITY COUNCIL
313
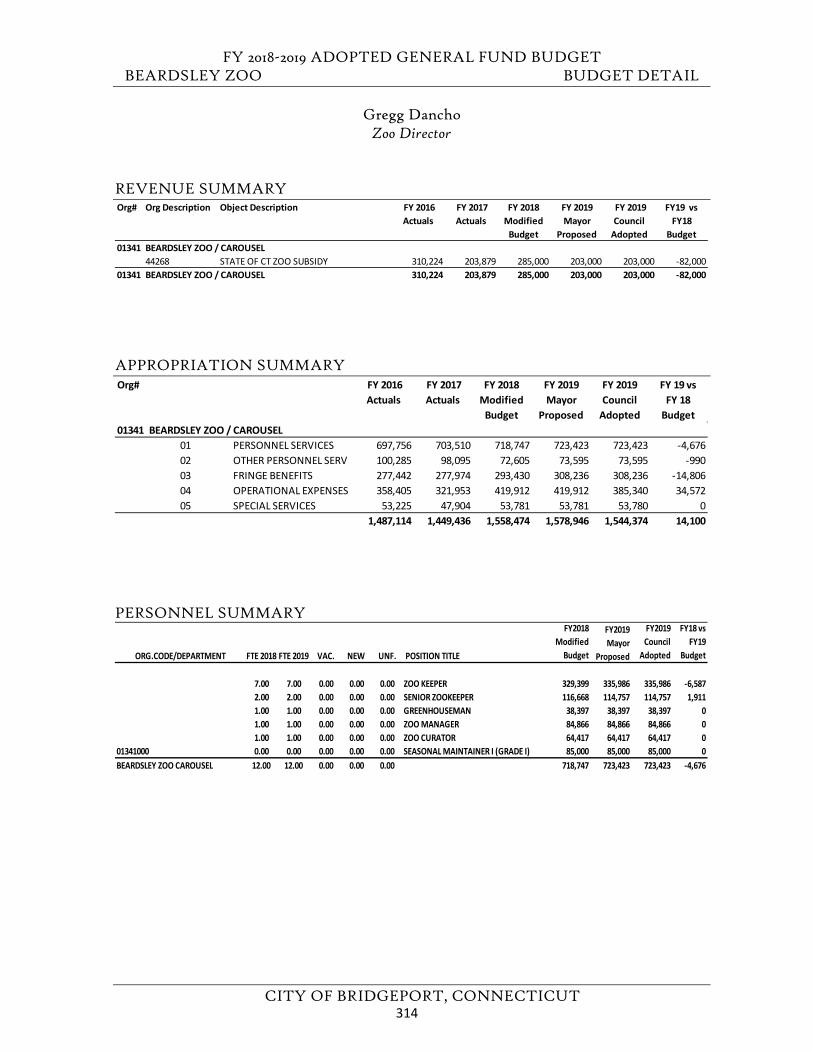
FY 2018-2019 ADOPTED GENERAL FUND BUDGET BEARDSLEY ZOO BUDGET DETAIL
CITY OF BRIDGEPORT, CONNECTICUT
Gregg Dancho Zoo Director
REVENUE SUMMARY
APPROPRIATION SUMMARY
PERSONNEL SUMMARY
Org# Org Description Object Description FY 2016 Actuals
FY 2017 Actuals
FY 2018 Modified
Budget
FY 2019 Mayor
Proposed
FY 2019 Council
Adopted
FY19 vs FY18
Budget01341 BEARDSLEY ZOO / CAROUSEL
44268 STATE OF CT ZOO SUBSIDY 310,224 203,879 285,000 203,000 203,000 -82,00001341 BEARDSLEY ZOO / CAROUSEL 310,224 203,879 285,000 203,000 203,000 -82,000
Org# FY 2016 Actuals
FY 2017 Actuals
FY 2018 Modified
Budget
FY 2019 Mayor
Proposed
FY 2019 Council
Adopted
FY 19 vs FY 18
Budget01341 BEARDSLEY ZOO / CAROUSEL
01 PERSONNEL SERVICES 697,756 703,510 718,747 723,423 723,423 -4,67602 OTHER PERSONNEL SERV 100,285 98,095 72,605 73,595 73,595 -99003 FRINGE BENEFITS 277,442 277,974 293,430 308,236 308,236 -14,80604 OPERATIONAL EXPENSES 358,405 321,953 419,912 419,912 385,340 34,57205 SPECIAL SERVICES 53,225 47,904 53,781 53,781 53,780 0
1,487,114 1,449,436 1,558,474 1,578,946 1,544,374 14,100
ORG.CODE/DEPARTMENT FTE 2018 FTE 2019 VAC. NEW UNF. POSITION TITLE
FY2018 Modified
Budget
FY2019 Mayor
Proposed
FY2019 Council
Adopted
FY18 vs FY19
Budget
7.00 7.00 0.00 0.00 0.00 ZOO KEEPER 329,399 335,986 335,986 -6,5872.00 2.00 0.00 0.00 0.00 SENIOR ZOOKEEPER 116,668 114,757 114,757 1,9111.00 1.00 0.00 0.00 0.00 GREENHOUSEMAN 38,397 38,397 38,397 01.00 1.00 0.00 0.00 0.00 ZOO MANAGER 84,866 84,866 84,866 01.00 1.00 0.00 0.00 0.00 ZOO CURATOR 64,417 64,417 64,417 0
01341000 0.00 0.00 0.00 0.00 0.00 SEASONAL MAINTAINER I (GRADE I) 85,000 85,000 85,000 0BEARDSLEY ZOO CAROUSEL 12.00 12.00 0.00 0.00 0.00 718,747 723,423 723,423 -4,676
314
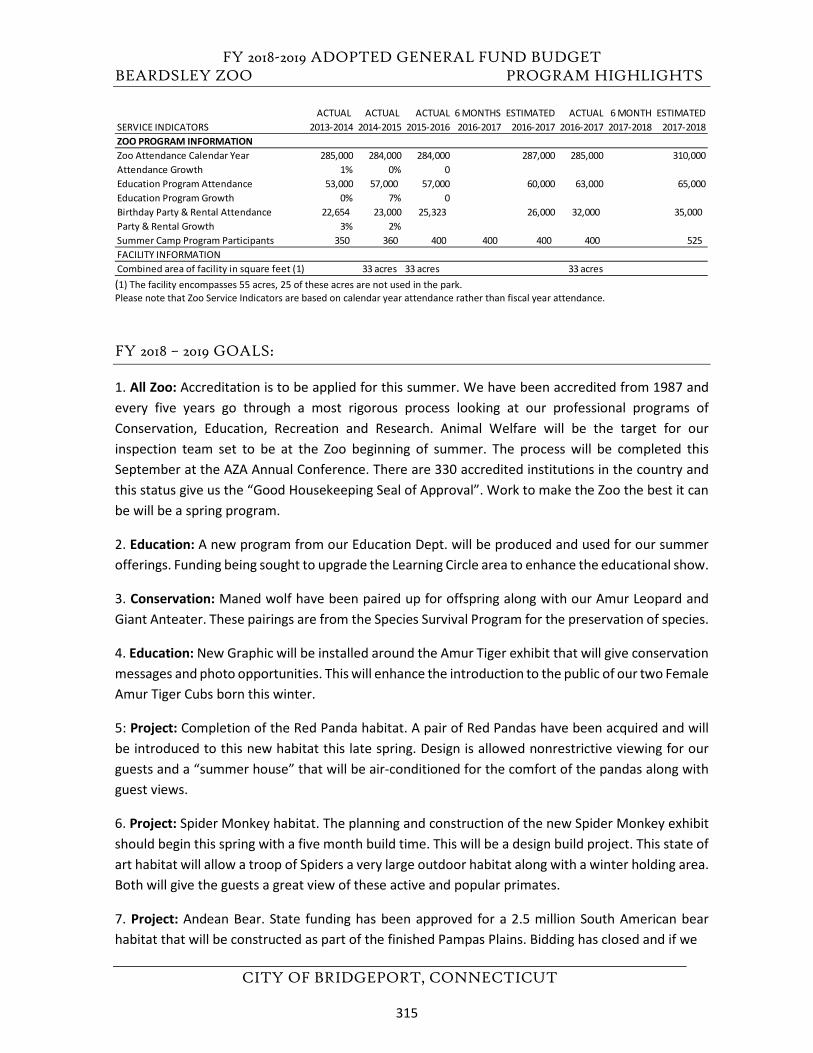
FY 2018-2019 ADOPTED GENERAL FUND BUDGET BEARDSLEY ZOO PROGRAM HIGHLIGHTS
CITY OF BRIDGEPORT, CONNECTICUT
(1) The facility encompasses 55 acres, 25 of these acres are not used in the park. Please note that Zoo Service Indicators are based on calendar year attendance rather than fiscal year attendance.
FY 2018 – 2019 GOALS:
1. All Zoo: Accreditation is to be applied for this summer. We have been accredited from 1987 andevery five years go through a most rigorous process looking at our professional programs ofConservation, Education, Recreation and Research. Animal Welfare will be the target for ourinspection team set to be at the Zoo beginning of summer. The process will be completed thisSeptember at the AZA Annual Conference. There are 330 accredited institutions in the country andthis status give us the “Good Housekeeping Seal of Approval”. Work to make the Zoo the best it canbe will be a spring program.
2. Education: A new program from our Education Dept. will be produced and used for our summerofferings. Funding being sought to upgrade the Learning Circle area to enhance the educational show.
3. Conservation: Maned wolf have been paired up for offspring along with our Amur Leopard andGiant Anteater. These pairings are from the Species Survival Program for the preservation of species.
4. Education: New Graphic will be installed around the Amur Tiger exhibit that will give conservationmessages and photo opportunities. This will enhance the introduction to the public of our two Female Amur Tiger Cubs born this winter.
5: Project: Completion of the Red Panda habitat. A pair of Red Pandas have been acquired and will be introduced to this new habitat this late spring. Design is allowed nonrestrictive viewing for our guests and a “summer house” that will be air-conditioned for the comfort of the pandas along with guest views.
6. Project: Spider Monkey habitat. The planning and construction of the new Spider Monkey exhibitshould begin this spring with a five month build time. This will be a design build project. This state ofart habitat will allow a troop of Spiders a very large outdoor habitat along with a winter holding area.Both will give the guests a great view of these active and popular primates.
7. Project: Andean Bear. State funding has been approved for a 2.5 million South American bearhabitat that will be constructed as part of the finished Pampas Plains. Bidding has closed and if we
ACTUAL ACTUAL ACTUAL 6 MONTHS ESTIMATED ACTUAL 6 MONTH ESTIMATEDSERVICE INDICATORS 2013-2014 2014-2015 2015-2016 2016-2017 2016-2017 2016-2017 2017-2018 2017-2018ZOO PROGRAM INFORMATIONZoo Attendance Calendar Year 285,000 284,000 284,000 287,000 285,000 310,000Attendance Growth 1% 0% 0Education Program Attendance 53,000 57,000 57,000 60,000 63,000 65,000Education Program Growth 0% 7% 0Birthday Party & Rental Attendance 22,654 23,000 25,323 26,000 32,000 35,000 Party & Rental Growth 3% 2%Summer Camp Program Participants 350 360 400 400 400 400 525 FACILITY INFORMATION Combined area of facility in square feet (1) 33 acres 33 acres 33 acres
315
FY 2018-2019 ADOPTED GENERAL FUND BUDGET BEARDSLEY ZOO PROGRAM HIGHLIGHTS
CITY OF BRIDGEPORT, CONNECTICUT
have a good bid the project planning will begin. This will be a design build project and it is hoped will move the construction faster.
8. Project: Amur Tiger. Funds have been acquired to hire a Zoo Architect to give us a rendering of arenovated Amur Tiger habitat. The Amur Tiger area was built in the late seventies and was updatedmid-eighties. New parameters for holding these endangered cats necessitates an increased andrenovated area. Hope to use rendering for fund raising program.
9. Education: Maze will be brought out for season for guest enjoyment and a message of endangeredspecies throughout.
10. Guest Service: Gift Shop. The Wolf Trading post will receive a facelift to allow for more productand ease of service for the guests. A new checkout area will be made to allow guests in the out of theshop easier.
11. Guest Service: Gift. A small kiosk will be installed near the Amur Tiger to show off Tiger productsnear the area.
12. All Zoo: A major IT project has been started to bring the facility up to modern technologystandards. This will enhance security, communications, and education for the entire Zoo. This is being funded by the CZS and should result in phone savings for the City as it is switched over.
13. Project: New England Farmyard. Work continue to upgrade walkways and exhibits throughoutthe area.
14. Conservation: NAA grant again been granted to the Zoo and continue to go into the Greenhousefor energy savings. New piping to be installed for hot water heating instead of gas infrared.
FY 2017 – 2018 GOAL STATUS:
1) All Zoo: The Zoo will be undergoing AZA Accreditation in 2018. The process is very extensiveand encompasses all aspects of Zoo operations. Animal Welfare, Veterinarian Care, GoverningAuthority, Guest Services, Education, Safety, Conservation, and Budget. The process starts withthe Application and will conclude with an inspection of the institution in 2018. We have beenaccredited since 1987.6 MONTH STATUS - Pending
2) Project: Funding is approx. midway for new Red Panda Exhibit. The site has been identifiedand the budget is being compiled. We hope to break ground this summer if all funding has beensecured.6 MONTH STATUS - Construction to begin March 18, two months for completion.
316
FY 2018-2019 ADOPTED GENERAL FUND BUDGET BEARDSLEY ZOO PROGRAM HIGHLIGHTS
CITY OF BRIDGEPORT, CONNECTICUT
3) Project: Spider Monkey exhibit has a Contractor identified and contracts should be signed by May. Construction will be throughout the summer and it is hoped to have a soft opening in the fall. Would also like to find funding to create a climbing area for the young guests to have them mimic the Spiders in the exhibit. This structure would be adjacent to the exhibit.6 MONTH STATUS – Contracts have been signed, work to begin April 18, four months for completion.
4) Project: The New England Farmyard is slated to have a facelift. Funding has been identifiedand the work to be accomplished would be to fix the broken sidewalks, create a definitive paththrough the area, remove and replace all old fencing, renovate the siding on the Barn, add newexhibits in the Barn, look to create a new Lynx/Bobcat area in the place of the Sheep yard andimprove the goat area.6 MONTH STATUS – work completed for Barn facelift, planning for interior of barn, goat yardcompleted, funding and planning for Bobcat/Lynx still in planning phase.
5) Project: Add a better viewing area for the west yard of the Amur Leopard Exhibit. Taking theexample of the new Pampas Plains area build a shelter that has a glass viewing for the guests tobe nose-to-nose with the leopards6 MONTH STATUS – Completed glass viewing installed with new graphics.
6) Education: Education staff will be putting on educational shows on the Learning Circle Stagefor the season. These will be a value-added program to involve our guest in interactive learningabout conservation and environmental issues in a fun and entertaining manner. This will give aguest longer visit and hope for increased revenue through concessions and membership.6 MONTH STATUS – completed with large crowds and good reviews.
7) Education: Will add to the programing the persona of Professor Beardsley. Prof. Beardsleywill act as the resident naturalist who will give impromptu talks in front of habitats, areas onZoo Grounds and also present some formal programs. This person will be uniformed as anexplorer and will invite guests to discover with him/her. Summer season.6 MONTH STATUS – completed with two docents acting in the capacity of Professor Beardsley.
8) Concession: Will add a ride component to the grounds from an outside vendor. Electric rideanimals will be placed by the Zoo fountain and will a revenue sharing program. This will take theplace of the Camel rides.6 MONTH STATUS – Completed, mall rides were used throughout the summer but will probablynot return due to low guest interest.
9) Guests: Will put in place for season the Zoos Maze. The maze will have interactive panelsthat with have a conservation theme.6 MONTH STATUS – Held for 2018 summer season.
10) Conservation: The Zoo received a new female Amur Tiger from the Philadelphia. This movehas an AZA breeding recommendation and we hope to place the male and female together thisspring. Fingers crossed.6 MONTH STATUS – Success! Two Amur Tiger cubs born!
317
FY 2018-2019 ADOPTED GENERAL FUND BUDGET BEARDSLEY ZOO PROGRAM HIGHLIGHTS
CITY OF BRIDGEPORT, CONNECTICUT
11) Conservation: A new female Red Wolf was also added to the Zoo. The pair has bred and noware waiting to see if this was successful.6 MONTH STATUS – Due to age of male wolf this does not look to happen.
12) Conservation: The Zoo will be hosting the reproductive Biologist from Cincinnati this springto attempt artificial insemination on our female Ocelot. This procedure was twice successful and has resulted in two kittens have gone off and have had kittens of their own. This is a greatconservation success story and was unprecedented. Kuma is now much older and the success isa long shot but will make a good story on conservation and we hope it will give us another cub!6 MONTH STATUS – AI was completed however a birth did not occur. This will be the last try forthis female.
13) Conservation: The Zoo again was the happy recipient of the Neighborhood Assistance Actand we will use those funds to increase efficiencies in the Zoos Greenhouse with plumbing andboiler repairs. This should result in energy savings.6 MONTH STATUS – Both Greenhouse Boilers were replaced with energy savings seen.
14) Conservation: Working with the State DEEP and UI we have erected a Osprey pole in thepark. This pole will be monitored by the Zoo Staff and CDC. It is hoped that we will have a pairthis year and are looking to have a live feed placed near nest.6 MONTH STATUS – Completed, pole installed and now waiting for occupants.
15) Conservation: Will be adding Pollinator gardens around Zoo grounds to highlight the plightof those insects who give us fruits and vegetables through their efforts.6 MONTH STATUS – Completed, Northeast Tree service donated a Pollinator Garden and BugHotel near new Animal Commissary.
16) Conservation: Working with Save The Sound and Fund for the Environment who securedfunding the Zoo will continue Phase two of ground water remediation for the Zoos parking lot.The main lot will have added permeable paving and other runoff will be diverted to a catchment area. This will eliminate many gallons of rainwater runoff from the city’s storm water system.This will be a late spring project.6 MONTH STATUS – 99 percent completed, construction is complete. To finish all is needed is toplant the areas this spring 18.
318
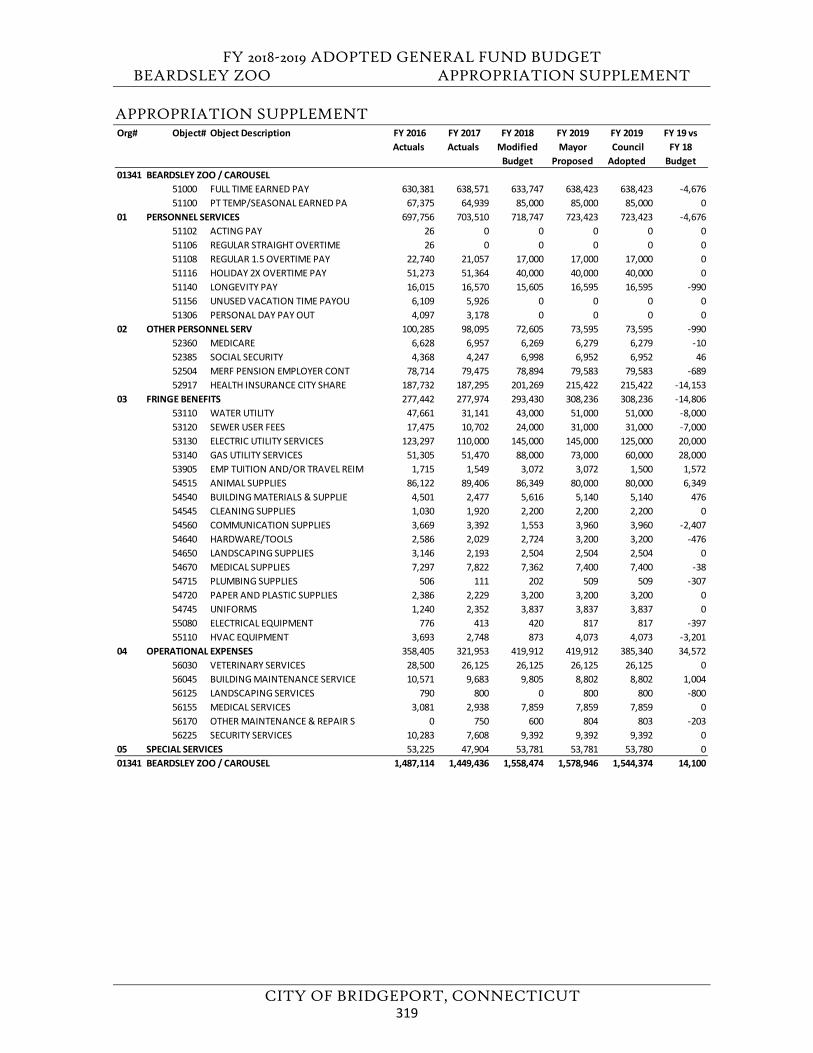
FY 2018-2019 ADOPTED GENERAL FUND BUDGET BEARDSLEY ZOO APPROPRIATION SUPPLEMENT
CITY OF BRIDGEPORT, CONNECTICUT
APPROPRIATION SUPPLEMENT Org# Object# Object Description FY 2016
Actuals FY 2017 Actuals
FY 2018 Modified
Budget
FY 2019Mayor
Proposed
FY 2019 Council Adopted
FY 19 vs FY 18
Budget01341 BEARDSLEY ZOO / CAROUSEL
51000 FULL TIME EARNED PAY 630,381 638,571 633,747 638,423 638,423 -4,67651100 PT TEMP/SEASONAL EARNED PA 67,375 64,939 85,000 85,000 85,000 0
01 PERSONNEL SERVICES 697,756 703,510 718,747 723,423 723,423 -4,67651102 ACTING PAY 26 0 0 0 0 051106 REGULAR STRAIGHT OVERTIME 26 0 0 0 0 051108 REGULAR 1.5 OVERTIME PAY 22,740 21,057 17,000 17,000 17,000 051116 HOLIDAY 2X OVERTIME PAY 51,273 51,364 40,000 40,000 40,000 051140 LONGEVITY PAY 16,015 16,570 15,605 16,595 16,595 -99051156 UNUSED VACATION TIME PAYOU 6,109 5,926 0 0 0 051306 PERSONAL DAY PAY OUT 4,097 3,178 0 0 0 0
02 OTHER PERSONNEL SERV 100,285 98,095 72,605 73,595 73,595 -99052360 MEDICARE 6,628 6,957 6,269 6,279 6,279 -1052385 SOCIAL SECURITY 4,368 4,247 6,998 6,952 6,952 4652504 MERF PENSION EMPLOYER CONT 78,714 79,475 78,894 79,583 79,583 -68952917 HEALTH INSURANCE CITY SHARE 187,732 187,295 201,269 215,422 215,422 -14,153
03 FRINGE BENEFITS 277,442 277,974 293,430 308,236 308,236 -14,80653110 WATER UTILITY 47,661 31,141 43,000 51,000 51,000 -8,00053120 SEWER USER FEES 17,475 10,702 24,000 31,000 31,000 -7,00053130 ELECTRIC UTILITY SERVICES 123,297 110,000 145,000 145,000 125,000 20,00053140 GAS UTILITY SERVICES 51,305 51,470 88,000 73,000 60,000 28,00053905 EMP TUITION AND/OR TRAVEL REIM 1,715 1,549 3,072 3,072 1,500 1,57254515 ANIMAL SUPPLIES 86,122 89,406 86,349 80,000 80,000 6,34954540 BUILDING MATERIALS & SUPPLIE 4,501 2,477 5,616 5,140 5,140 47654545 CLEANING SUPPLIES 1,030 1,920 2,200 2,200 2,200 054560 COMMUNICATION SUPPLIES 3,669 3,392 1,553 3,960 3,960 -2,40754640 HARDWARE/TOOLS 2,586 2,029 2,724 3,200 3,200 -47654650 LANDSCAPING SUPPLIES 3,146 2,193 2,504 2,504 2,504 054670 MEDICAL SUPPLIES 7,297 7,822 7,362 7,400 7,400 -3854715 PLUMBING SUPPLIES 506 111 202 509 509 -30754720 PAPER AND PLASTIC SUPPLIES 2,386 2,229 3,200 3,200 3,200 054745 UNIFORMS 1,240 2,352 3,837 3,837 3,837 055080 ELECTRICAL EQUIPMENT 776 413 420 817 817 -39755110 HVAC EQUIPMENT 3,693 2,748 873 4,073 4,073 -3,201
04 OPERATIONAL EXPENSES 358,405 321,953 419,912 419,912 385,340 34,57256030 VETERINARY SERVICES 28,500 26,125 26,125 26,125 26,125 056045 BUILDING MAINTENANCE SERVICE 10,571 9,683 9,805 8,802 8,802 1,00456125 LANDSCAPING SERVICES 790 800 0 800 800 -80056155 MEDICAL SERVICES 3,081 2,938 7,859 7,859 7,859 056170 OTHER MAINTENANCE & REPAIR S 0 750 600 804 803 -20356225 SECURITY SERVICES 10,283 7,608 9,392 9,392 9,392 0
05 SPECIAL SERVICES 53,225 47,904 53,781 53,781 53,780 001341 BEARDSLEY ZOO / CAROUSEL 1,487,114 1,449,436 1,558,474 1,578,946 1,544,374 14,100
319

FY 2018-2019 ADOPTED GENERAL FUND BUDGET
CITY OF BRIDGEPORT, CONNECTICUT
This page left blank intentionally.
320
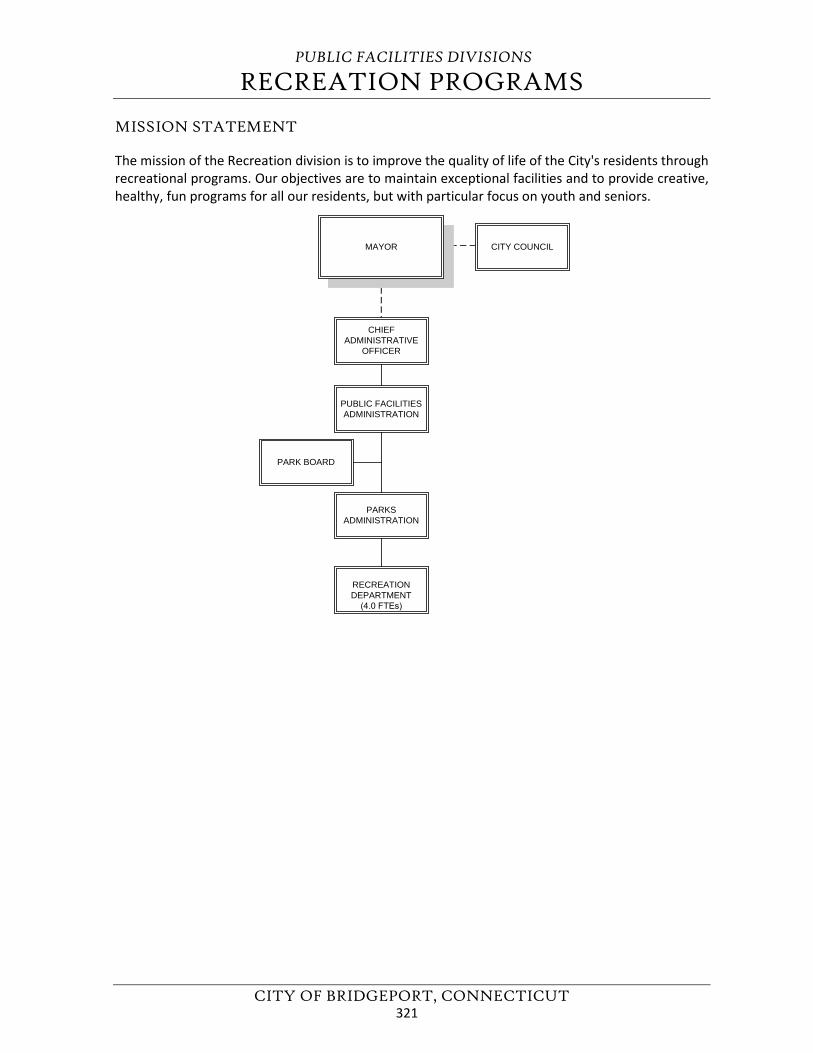
PUBLIC FACILITIES DIVISIONS
RECREATION PROGRAMS
CITY OF BRIDGEPORT, CONNECTICUT
MISSION STATEMENT
The mission of the Recreation division is to improve the quality of life of the City's residents through recreational programs. Our objectives are to maintain exceptional facilities and to provide creative, healthy, fun programs for all our residents, but with particular focus on youth and seniors.
CHIEFADMINISTRATIVE
OFFICER
PUBLIC FACILITIESADMINISTRATION
PARKSADMINISTRATION
MAYOR CITY COUNCIL
PARK BOARD
RECREATIONDEPARTMENT
(4.0 FTEs)
321
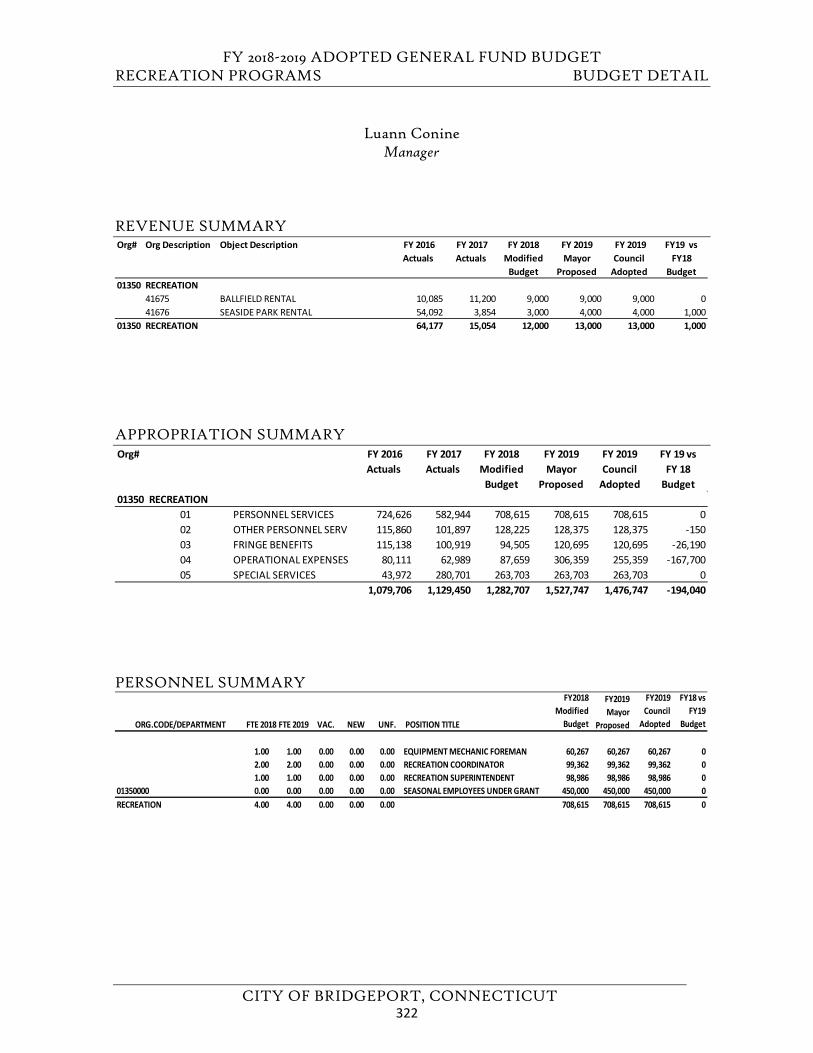
FY 2018-2019 ADOPTED GENERAL FUND BUDGET RECREATION PROGRAMS BUDGET DETAIL
CITY OF BRIDGEPORT, CONNECTICUT
Luann Conine Manager
REVENUE SUMMARY
APPROPRIATION SUMMARY
PERSONNEL SUMMARY
Org# Org Description Object Description FY 2016 Actuals
FY 2017 Actuals
FY 2018 Modified
Budget
FY 2019 Mayor
Proposed
FY 2019 Council
Adopted
FY19 vs FY18
Budget01350 RECREATION
41675 BALLFIELD RENTAL 10,085 11,200 9,000 9,000 9,000 041676 SEASIDE PARK RENTAL 54,092 3,854 3,000 4,000 4,000 1,000
01350 RECREATION 64,177 15,054 12,000 13,000 13,000 1,000
Org# FY 2016 Actuals
FY 2017 Actuals
FY 2018 Modified
Budget
FY 2019 Mayor
Proposed
FY 2019 Council
Adopted
FY 19 vs FY 18
Budget01350 RECREATION
01 PERSONNEL SERVICES 724,626 582,944 708,615 708,615 708,615 002 OTHER PERSONNEL SERV 115,860 101,897 128,225 128,375 128,375 -15003 FRINGE BENEFITS 115,138 100,919 94,505 120,695 120,695 -26,19004 OPERATIONAL EXPENSES 80,111 62,989 87,659 306,359 255,359 -167,70005 SPECIAL SERVICES 43,972 280,701 263,703 263,703 263,703 0
1,079,706 1,129,450 1,282,707 1,527,747 1,476,747 -194,040
ORG.CODE/DEPARTMENT FTE 2018 FTE 2019 VAC. NEW UNF. POSITION TITLE
FY2018 Modified
Budget
FY2019 Mayor
Proposed
FY2019 Council
Adopted
FY18 vs FY19
Budget
1.00 1.00 0.00 0.00 0.00 EQUIPMENT MECHANIC FOREMAN 60,267 60,267 60,267 02.00 2.00 0.00 0.00 0.00 RECREATION COORDINATOR 99,362 99,362 99,362 01.00 1.00 0.00 0.00 0.00 RECREATION SUPERINTENDENT 98,986 98,986 98,986 0
01350000 0.00 0.00 0.00 0.00 0.00 SEASONAL EMPLOYEES UNDER GRANT 450,000 450,000 450,000 0RECREATION 4.00 4.00 0.00 0.00 0.00 708,615 708,615 708,615 0
322
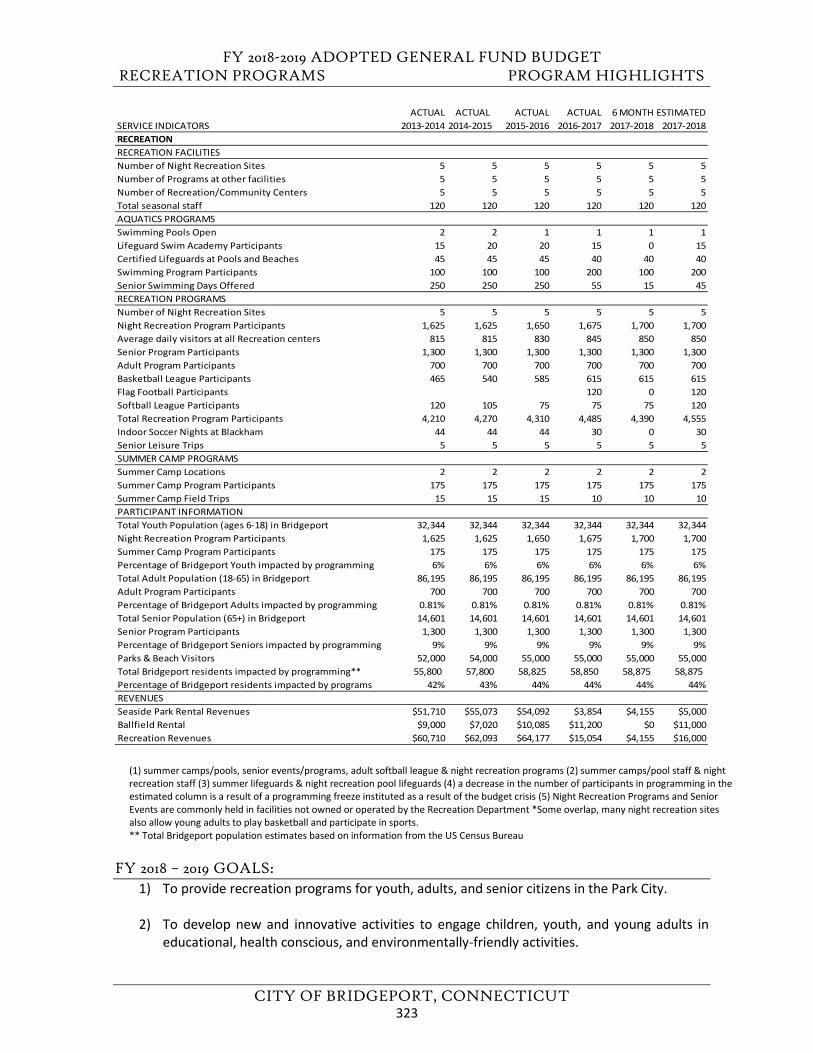
FY 2018-2019 ADOPTED GENERAL FUND BUDGET RECREATION PROGRAMS PROGRAM HIGHLIGHTS
CITY OF BRIDGEPORT, CONNECTICUT
(1) summer camps/pools, senior events/programs, adult softball league & night recreation programs (2) summer camps/pool staff & night recreation staff (3) summer lifeguards & night recreation pool lifeguards (4) a decrease in the number of participants in programming in the estimated column is a result of a programming freeze instituted as a result of the budget crisis (5) Night Recreation Programs and Senior Events are commonly held in facilities not owned or operated by the Recreation Department *Some overlap, many night recreation sites also allow young adults to play basketball and participate in sports. ** Total Bridgeport population estimates based on information from the US Census Bureau
FY 2018 – 2019 GOALS: 1) To provide recreation programs for youth, adults, and senior citizens in the Park City.
2) To develop new and innovative activities to engage children, youth, and young adults ineducational, health conscious, and environmentally-friendly activities.
ACTUAL ACTUAL ACTUAL ACTUAL 6 MONTH ESTIMATEDSERVICE INDICATORS 2013-2014 2014-2015 2015-2016 2016-2017 2017-2018 2017-2018RECREATIONRECREATION FACILITIESNumber of Night Recreation Sites 5 5 5 5 5 5Number of Programs at other facilities 5 5 5 5 5 5Number of Recreation/Community Centers 5 5 5 5 5 5Total seasonal staff 120 120 120 120 120 120AQUATICS PROGRAMS Swimming Pools Open 2 2 1 1 1 1Lifeguard Swim Academy Participants 15 20 20 15 0 15Certified Lifeguards at Pools and Beaches 45 45 45 40 40 40Swimming Program Participants 100 100 100 200 100 200Senior Swimming Days Offered 250 250 250 55 15 45RECREATION PROGRAMS Number of Night Recreation Sites 5 5 5 5 5 5Night Recreation Program Participants 1,625 1,625 1,650 1,675 1,700 1,700Average daily visitors at all Recreation centers 815 815 830 845 850 850Senior Program Participants 1,300 1,300 1,300 1,300 1,300 1,300Adult Program Participants 700 700 700 700 700 700Basketball League Participants 465 540 585 615 615 615Flag Football Participants 120 0 120Softball League Participants 120 105 75 75 75 120Total Recreation Program Participants 4,210 4,270 4,310 4,485 4,390 4,555Indoor Soccer Nights at Blackham 44 44 44 30 0 30Senior Leisure Trips 5 5 5 5 5 5SUMMER CAMP PROGRAMS Summer Camp Locations 2 2 2 2 2 2Summer Camp Program Participants 175 175 175 175 175 175Summer Camp Field Trips 15 15 15 10 10 10PARTICIPANT INFORMATION Total Youth Population (ages 6-18) in Bridgeport 32,344 32,344 32,344 32,344 32,344 32,344Night Recreation Program Participants 1,625 1,625 1,650 1,675 1,700 1,700Summer Camp Program Participants 175 175 175 175 175 175Percentage of Bridgeport Youth impacted by programming 6% 6% 6% 6% 6% 6%Total Adult Population (18-65) in Bridgeport 86,195 86,195 86,195 86,195 86,195 86,195Adult Program Participants 700 700 700 700 700 700Percentage of Bridgeport Adults impacted by programming 0.81% 0.81% 0.81% 0.81% 0.81% 0.81%Total Senior Population (65+) in Bridgeport 14,601 14,601 14,601 14,601 14,601 14,601Senior Program Participants 1,300 1,300 1,300 1,300 1,300 1,300Percentage of Bridgeport Seniors impacted by programming 9% 9% 9% 9% 9% 9%Parks & Beach Visitors 52,000 54,000 55,000 55,000 55,000 55,000Total Bridgeport residents impacted by programming** 55,800 57,800 58,825 58,850 58,875 58,875 Percentage of Bridgeport residents impacted by programs 42% 43% 44% 44% 44% 44%REVENUESSeaside Park Rental Revenues $51,710 $55,073 $54,092 $3,854 $4,155 $5,000Ballfield Rental $9,000 $7,020 $10,085 $11,200 $0 $11,000Recreation Revenues $60,710 $62,093 $64,177 $15,054 $4,155 $16,000
323
FY 2018-2019 ADOPTED GENERAL FUND BUDGET RECREATION PROGRAMS PROGRAM HIGHLIGHTS
CITY OF BRIDGEPORT, CONNECTICUT
3) To expand opportunities for youth to support and reinforce good behavior. To coordinatethe Boys and Girls Middle School Basketball League, Middle School Flag Football League, andMiddle School Soccer League through the partnership with the Board of Education AthleticsDepartment and reinforce the principles of sportsmanship and teamwork that the programinspires.
4) To provide exceptional support to youth and young adults who are entering the job field inRecreation and related areas. To continue the Lifeguard Swim Academy. The LifeguardAcademy trains youth and adults to staff our pools and beaches and provide water safetyinstruction, lifesaving skills, and other important life skills.
5) To expand upon the recreational activities offered to Adults and Senior Citizens in Bridgeportand to provide a progressive and varied assortment of fitness classes and other health related activities.
6) To continue the success of the Parks and Recreation Adult Softball League.
7) To continue to provide outstanding leadership and staff support at Seaside and BeardsleyParks and Pleasure Beach during the summer peak season most notably with lifeguard andcheckpoint staffing.
8) To continue to foster relationships with other municipal departments and communityorganizations in an effort to deliver an assortment of activities to all Bridgeport residents.
9) To provide comprehensive up-to-date web content on the City website and Facebook Pagedetailing news and information about departmental programs.
FY 2017-2018 GOAL STATUS
1) To provide recreation programs for youth, adults, and senior citizens in the Park City.6 MONTH STATUS: All city residents are eligible to participate in the programs offered by theRecreation Department. Most of the programs offered are free or very-low cost. In July andAugust 2017, the Seaside Park Summer Day Camp and Tennis Camp enrolled over 175children. Family Swim nights were offered during July and August 2017 at the BlackhamSchool swimming pool. The Night Recreation program started in January 2018 and concludesin April 2018 at five middle school sites throughout the city. This program provides recreationactivities for over 1600 children and young adults. The Recreation Department has continuedits partnership with the Department on Aging, as well as other senior community centers tobring senior citizens from all neighborhoods of the City together. Celebratory events at theHoly Trinity Greek Orthodox Church and the Mayor’s Annual Senior Picnic at Seaside Parkwere a resounding success. The Parks and Recreation Department Softball League promotedhealth and fitness by inviting local adult teams to compete. For city residents and visitors toSeaside Park, the Recreation Department facilitated Seaside Park Lifeguard Safety to ensurethe safety of thousands of visitors throughout the summer. In addition, athletic field usageand event permit requests were processed by the Parks and Recreation office staff throughout the year.
324
FY 2018-2019 ADOPTED GENERAL FUND BUDGET RECREATION PROGRAMS PROGRAM HIGHLIGHTS
CITY OF BRIDGEPORT, CONNECTICUT
2) To develop new and innovative activities to engage children, youth, and young adults ineducational, health conscious, and environmentally-friendly activities.To maintain the current structure of Night Recreation Programming while and continuing toattract more Bridgeport youth & young adults to participate.6 MONTH STATUS: The 2017-2018 Night Recreation program took place at 5 recreation sitesat Blackham, Cesar Batalla, Geraldine Johnson, Jettie Tisdale and Luis Marin Schools. Theprogram offers youths and young adults free opportunities to participate in supervisedrecreation activities three nights per week. Blackham School also includes a swimming poolstaffed by department lifeguards during the Night Recreation hours. The Night RecreationProgram offered youth swimming lessons at Blackham School in the Spring 2018 with 80participants.
3) To enhance the experience for children ages 5-12 at Seaside Park Summer Day Camp and allages for Tennis camp at Central High School and continue to provide these affordable andorganized programs to working families in Bridgeport.6 MONTH STATUS: The 2017 Seaside Park Summer Camp was a tremendous success. Thecamp staff coordinated all the daily activities including trips to the Beardsley Zoo, Bridgeport/ Port Jefferson Ferry, Adventure Park at Discovery Museum, and Lake CompounceAmusement Park.The 2017 Tennis Camp joined up with First Serve Bridgeport Tennis and offered a free ofcharge camp at Central High School. The Tennis Program provided a great facility and exciting environment for the campers. Instructors were provided by First Serve Bridgeport Tennis.
4) To expand opportunities for youth to support and reinforce good behavior. To coordinatethe Boys and Girls Middle School Basketball League, Middle School Flag Football League, andMiddle School Soccer League, through the partnership with the Board of Education AthleticsDepartment and reinforce the principles of sportsmanship and teamwork that the programinspires.6 MONTH STATUS: Middle School Basketball League for boys and girls. 41 teams areparticipating with 21 boys’ teams and 20 girls’ teams for the 2018 season. The games takeplace at Bassick, Central, and Harding High Schools on Saturdays. The league runs fromJanuary through March 2018.
Middle School Flag Football League for boys and girls. 12 schools are expected to participatein the league in the Spring 2018. The games will take place at Kennedy Stadium at CentralHigh School on Saturdays in April and May 2018.
Middle School Soccer League for boys and girls. 8 schools are expected to participate in theleague. The games will take place at Roosevelt and Columbus Middle Schools on Saturdays inApril and May 2018.
5) To provide exceptional support to youth and young adults who are entering the job field inRecreation and related areas. To continue the Lifeguard Swim Academy. The LifeguardAcademy trains youth and adults to staff our pools and beaches and provide water safetyinstruction, lifesaving skills, and other important life skills.
325
FY 2018-2019 ADOPTED GENERAL FUND BUDGET RECREATION PROGRAMS PROGRAM HIGHLIGHTS
CITY OF BRIDGEPORT, CONNECTICUT
6 MONTH STATUS: The Recreation Department provides employment opportunities for seasonal positions. Jobs include Summer Camp Counselors, Night Recreation Counselors, Park Checkpoint Attendants, and Lifeguards. The Lifeguard Swim Academy will take place in Spring 2018. The Swim Academy is a program for applicants to train and build endurance to become proficient in all lifeguard skills and receive their required certifications. The Department supports and sustains this community of certified lifeguards with attention to maintaining their practice and skill set as required by the American Red Cross.
6) To expand upon the recreational activities offered to Adults and Senior Citizens in Bridgeportand to provide a progressive and varied assortment of fitness classes and other health related activities.6 MONTH STATUS: The Recreation Department coordinated various activities for adults andsenior citizens throughout the year including the Senior Picnic at Seaside Park in September2017 that served over 500 seniors and the Halloween Dinner at the Holy Trinity GreekOrthodox Church in October 2017 that served over 300 senior citizens. The RecreationDepartment also coordinates activities and programs for Bridgeport Seniors includingSwimming, Arts and Crafts, Zumba, Line Dancing, and Chair Exercises. The Night RecreationProgram offers supervised athletic activities for adults at the five-night recreation centers and swimming nights for adults and families at the Blackham School swimming pool.
7) To continue the success of the Parks and Recreation Adult Softball League.6 MONTH STATUS: The Parks and Recreation Department Adult Softball League at SeasidePark included 5 teams for the 2017 season. Teams played a 12-game schedule and a playofftournament. Over 75 adults participated in the league.
8) To continue to provide outstanding leadership and staff support at Seaside and BeardsleyParks and Pleasure Beach during the summer peak season most notably with lifeguard andcheckpoint staffing.6 MONTH STATUS: The Recreation Department facilitated the 7 day-a-week operation of park checkpoint booths from Memorial Day through Labor Day, 2017 at Seaside Park andBeardsley Park. Park checkpoints entail issuing park stickers and passes and the collection offees for all vehicles entering the city parks. Checkpoint attendants were also on location atPleasure Beach and handle the day-to-day operation including assisting at the boating docks,transportation for the public, operation of the concession stand and other duties to ensurethe safety and provide any additional assistance.
9) To continue to foster relationships with other municipal departments and communityorganizations to deliver an assortment of activities to all Bridgeport residents.6 MONTH STATUS: Other municipal departments have joined the Recreation Department atvarious events to support city-based recreation activities. The Department on Aging partnerswith the Recreation Department to coordinate various programs and activities for seniorcitizens. The Recreation Department and Board of Education Athletics partnershipcoordinates the Middle School Sports Program which includes basketball, soccer, and flagfootball activities. The Department of Public Facilities and Board of Education have providedassistance for many recreation activities and events such as the Bridgeport Baseball Classicfeaturing local high school teams. The Lighthouse Program and Parks and RecreationDepartment partnered up along with various youth sports leagues to plan and coordinate“Healthy Kids Day”. The event takes place each summer at Seaside Park and introduces
326
FY 2018-2019 ADOPTED GENERAL FUND BUDGET RECREATION PROGRAMS PROGRAM HIGHLIGHTS
CITY OF BRIDGEPORT, CONNECTICUT
Bridgeport youths to different sports and to encourage a healthy lifestyle. Local sports organizations such as the Bridgeport American Youth Soccer Organization, Southwest Soccer Program, Bridgeport Caribe Youth Leaders, North End Little League, Black Rock Little League, Bridgeport Chargers Youth Football, Bridgeport Raiders Pop Warner Football take part in the event and also have a relationship with the Parks and Recreation Department through scheduling of their events at Park fields and facilities.
10) To provide comprehensive up-to-date web content on the City website and Facebook Pagedetailing news and information about departmental programs.6 MONTH STATUS: The Parks and Recreation Department updates the website regularly toinclude new information for the public including recent photos and new offerings.The Parks and Recreation Facebook page is updated regularly to provide new information tothe public including new offerings and activities. The Facebook page is also used as a tool topost weather cancellations and other pertinent information needed in a timely manner.
327
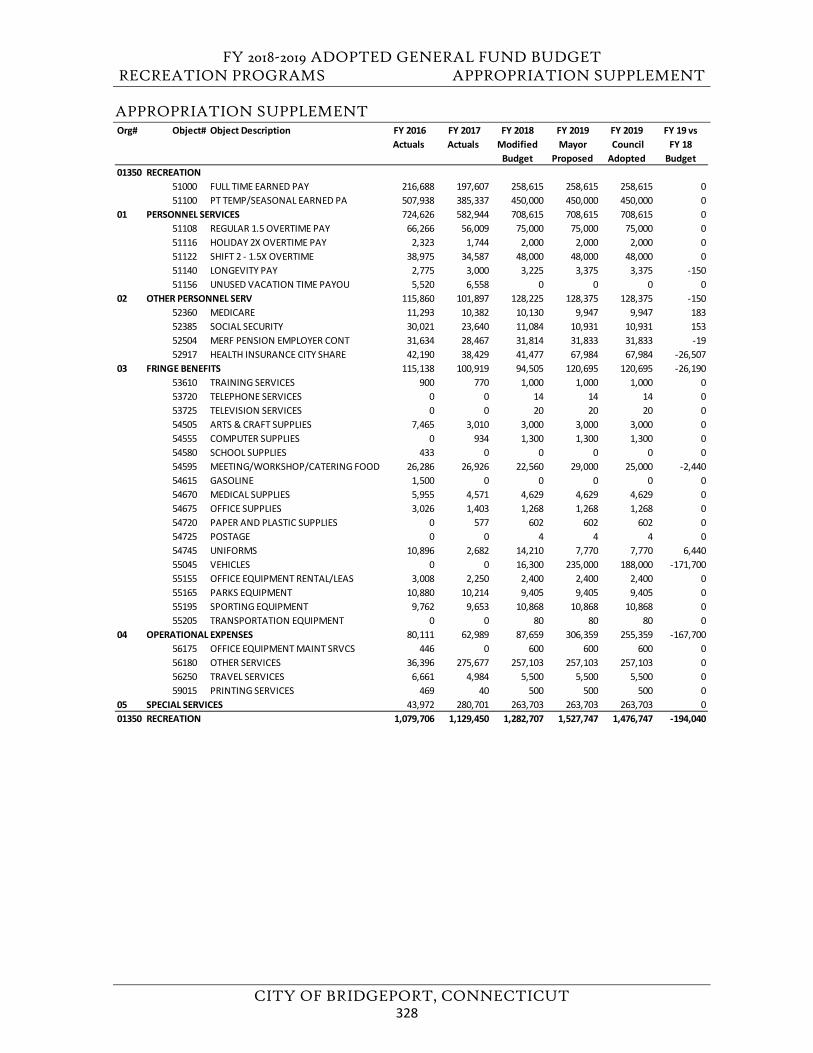
FY 2018-2019 ADOPTED GENERAL FUND BUDGET RECREATION PROGRAMS APPROPRIATION SUPPLEMENT
CITY OF BRIDGEPORT, CONNECTICUT
APPROPRIATION SUPPLEMENT Org# Object# Object Description FY 2016
Actuals FY 2017 Actuals
FY 2018 Modified
Budget
FY 2019Mayor
Proposed
FY 2019 Council Adopted
FY 19 vs FY 18
Budget01350 RECREATION
51000 FULL TIME EARNED PAY 216,688 197,607 258,615 258,615 258,615 051100 PT TEMP/SEASONAL EARNED PA 507,938 385,337 450,000 450,000 450,000 0
01 PERSONNEL SERVICES 724,626 582,944 708,615 708,615 708,615 051108 REGULAR 1.5 OVERTIME PAY 66,266 56,009 75,000 75,000 75,000 051116 HOLIDAY 2X OVERTIME PAY 2,323 1,744 2,000 2,000 2,000 051122 SHIFT 2 - 1.5X OVERTIME 38,975 34,587 48,000 48,000 48,000 051140 LONGEVITY PAY 2,775 3,000 3,225 3,375 3,375 -15051156 UNUSED VACATION TIME PAYOU 5,520 6,558 0 0 0 0
02 OTHER PERSONNEL SERV 115,860 101,897 128,225 128,375 128,375 -15052360 MEDICARE 11,293 10,382 10,130 9,947 9,947 18352385 SOCIAL SECURITY 30,021 23,640 11,084 10,931 10,931 15352504 MERF PENSION EMPLOYER CONT 31,634 28,467 31,814 31,833 31,833 -1952917 HEALTH INSURANCE CITY SHARE 42,190 38,429 41,477 67,984 67,984 -26,507
03 FRINGE BENEFITS 115,138 100,919 94,505 120,695 120,695 -26,19053610 TRAINING SERVICES 900 770 1,000 1,000 1,000 053720 TELEPHONE SERVICES 0 0 14 14 14 053725 TELEVISION SERVICES 0 0 20 20 20 054505 ARTS & CRAFT SUPPLIES 7,465 3,010 3,000 3,000 3,000 054555 COMPUTER SUPPLIES 0 934 1,300 1,300 1,300 054580 SCHOOL SUPPLIES 433 0 0 0 0 054595 MEETING/WORKSHOP/CATERING FOOD 26,286 26,926 22,560 29,000 25,000 -2,44054615 GASOLINE 1,500 0 0 0 0 054670 MEDICAL SUPPLIES 5,955 4,571 4,629 4,629 4,629 054675 OFFICE SUPPLIES 3,026 1,403 1,268 1,268 1,268 054720 PAPER AND PLASTIC SUPPLIES 0 577 602 602 602 054725 POSTAGE 0 0 4 4 4 054745 UNIFORMS 10,896 2,682 14,210 7,770 7,770 6,44055045 VEHICLES 0 0 16,300 235,000 188,000 -171,70055155 OFFICE EQUIPMENT RENTAL/LEAS 3,008 2,250 2,400 2,400 2,400 055165 PARKS EQUIPMENT 10,880 10,214 9,405 9,405 9,405 055195 SPORTING EQUIPMENT 9,762 9,653 10,868 10,868 10,868 055205 TRANSPORTATION EQUIPMENT 0 0 80 80 80 0
04 OPERATIONAL EXPENSES 80,111 62,989 87,659 306,359 255,359 -167,70056175 OFFICE EQUIPMENT MAINT SRVCS 446 0 600 600 600 056180 OTHER SERVICES 36,396 275,677 257,103 257,103 257,103 056250 TRAVEL SERVICES 6,661 4,984 5,500 5,500 5,500 059015 PRINTING SERVICES 469 40 500 500 500 0
05 SPECIAL SERVICES 43,972 280,701 263,703 263,703 263,703 001350 RECREATION 1,079,706 1,129,450 1,282,707 1,527,747 1,476,747 -194,040
328
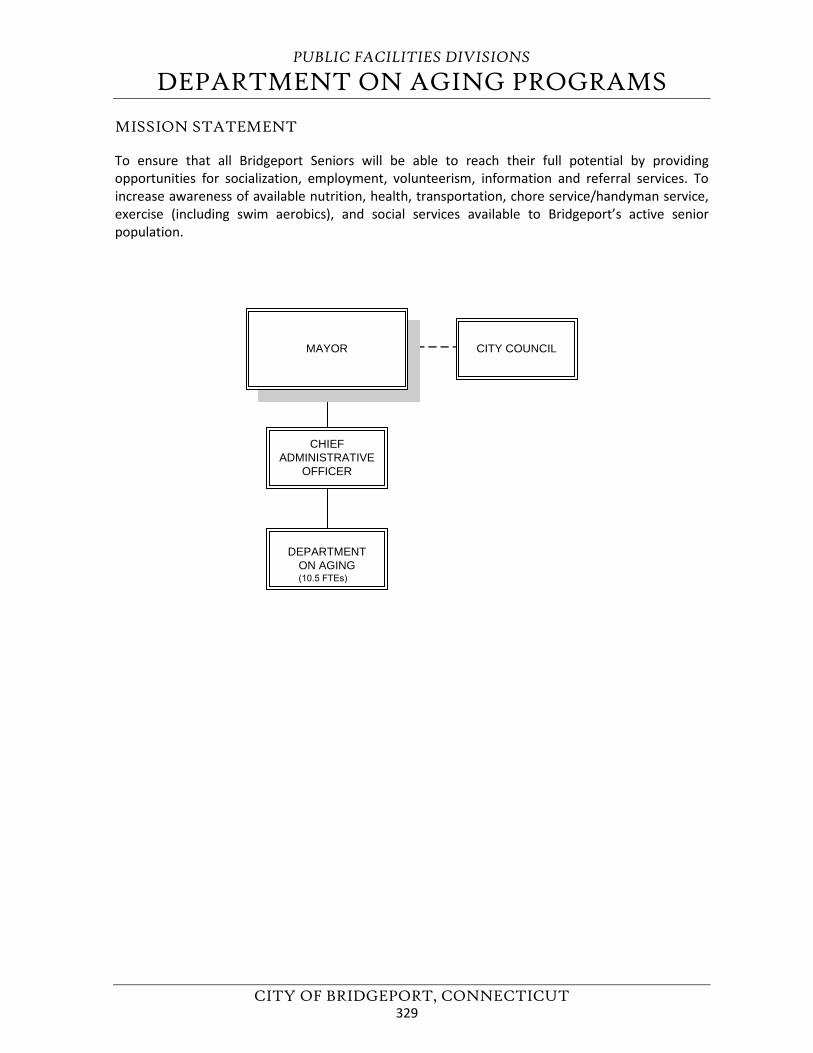
PUBLIC FACILITIES DIVISIONS
DEPARTMENT ON AGING PROGRAMS
CITY OF BRIDGEPORT, CONNECTICUT
MISSION STATEMENT
To ensure that all Bridgeport Seniors will be able to reach their full potential by providing opportunities for socialization, employment, volunteerism, information and referral services. To increase awareness of available nutrition, health, transportation, chore service/handyman service, exercise (including swim aerobics), and social services available to Bridgeport’s active senior population.
CHIEFADMINISTRATIVE
OFFICER
DEPARTMENTON AGING(10.5 FTEs)
MAYOR CITY COUNCIL
329
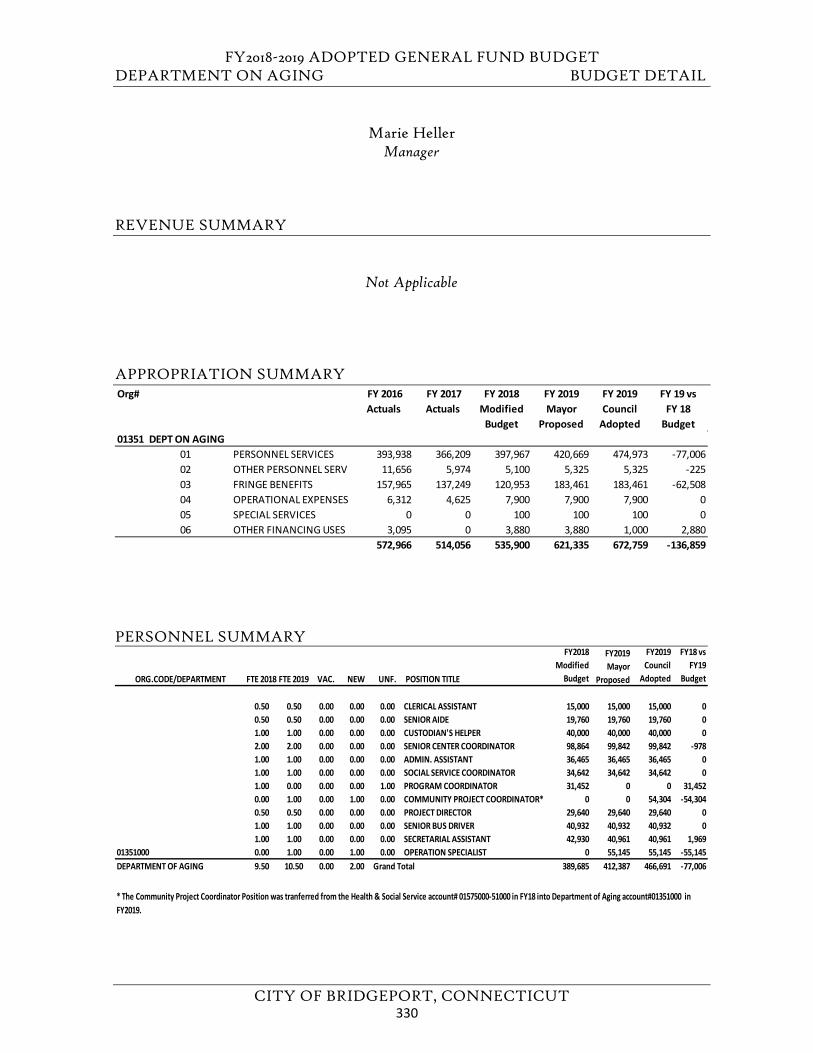
FY2018-2019 ADOPTED GENERAL FUND BUDGET DEPARTMENT ON AGING BUDGET DETAIL
CITY OF BRIDGEPORT, CONNECTICUT
Marie Heller Manager
REVENUE SUMMARY
Not Applicable
APPROPRIATION SUMMARY
PERSONNEL SUMMARY
Org# FY 2016 Actuals
FY 2017 Actuals
FY 2018 Modified
Budget
FY 2019 Mayor
Proposed
FY 2019 Council
Adopted
FY 19 vs FY 18
Budget01351 DEPT ON AGING
01 PERSONNEL SERVICES 393,938 366,209 397,967 420,669 474,973 -77,00602 OTHER PERSONNEL SERV 11,656 5,974 5,100 5,325 5,325 -22503 FRINGE BENEFITS 157,965 137,249 120,953 183,461 183,461 -62,50804 OPERATIONAL EXPENSES 6,312 4,625 7,900 7,900 7,900 005 SPECIAL SERVICES 0 0 100 100 100 006 OTHER FINANCING USES 3,095 0 3,880 3,880 1,000 2,880
572,966 514,056 535,900 621,335 672,759 -136,859
ORG.CODE/DEPARTMENT FTE 2018 FTE 2019 VAC. NEW UNF. POSITION TITLE
FY2018 Modified
Budget
FY2019 Mayor
Proposed
FY2019 Council
Adopted
FY18 vs FY19
Budget
0.50 0.50 0.00 0.00 0.00 CLERICAL ASSISTANT 15,000 15,000 15,000 00.50 0.50 0.00 0.00 0.00 SENIOR AIDE 19,760 19,760 19,760 01.00 1.00 0.00 0.00 0.00 CUSTODIAN'S HELPER 40,000 40,000 40,000 02.00 2.00 0.00 0.00 0.00 SENIOR CENTER COORDINATOR 98,864 99,842 99,842 -9781.00 1.00 0.00 0.00 0.00 ADMIN. ASSISTANT 36,465 36,465 36,465 01.00 1.00 0.00 0.00 0.00 SOCIAL SERVICE COORDINATOR 34,642 34,642 34,642 01.00 0.00 0.00 0.00 1.00 PROGRAM COORDINATOR 31,452 0 0 31,4520.00 1.00 0.00 1.00 0.00 COMMUNITY PROJECT COORDINATOR* 0 0 54,304 -54,3040.50 0.50 0.00 0.00 0.00 PROJECT DIRECTOR 29,640 29,640 29,640 01.00 1.00 0.00 0.00 0.00 SENIOR BUS DRIVER 40,932 40,932 40,932 01.00 1.00 0.00 0.00 0.00 SECRETARIAL ASSISTANT 42,930 40,961 40,961 1,969
01351000 0.00 1.00 0.00 1.00 0.00 OPERATION SPECIALIST 0 55,145 55,145 -55,145DEPARTMENT OF AGING 9.50 10.50 0.00 2.00 Grand Total 389,685 412,387 466,691 -77,006
* The Community Project Coordinator Position was tranferred from the Health & Social Service account# 01575000-51000 in FY18 into Department of Aging account#01351000 in FY2019.
330
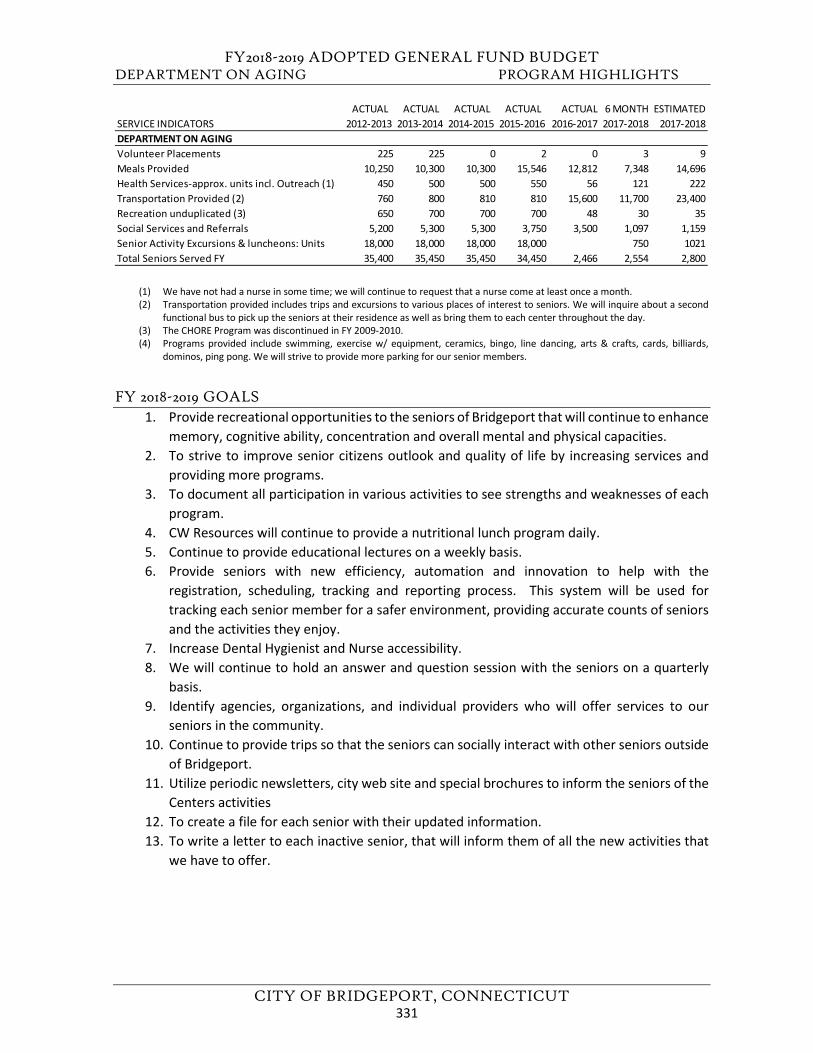
FY2018-2019 ADOPTED GENERAL FUND BUDGET DEPARTMENT ON AGING PROGRAM HIGHLIGHTS
CITY OF BRIDGEPORT, CONNECTICUT
(1) We have not had a nurse in some time; we will continue to request that a nurse come at least once a month.(2) Transportation provided includes trips and excursions to various places of interest to seniors. We will inquire about a second
functional bus to pick up the seniors at their residence as well as bring them to each center throughout the day. (3) The CHORE Program was discontinued in FY 2009-2010. (4) Programs provided include swimming, exercise w/ equipment, ceramics, bingo, line dancing, arts & crafts, cards, billiards,
dominos, ping pong. We will strive to provide more parking for our senior members.
FY 2018-2019 GOALS 1. Provide recreational opportunities to the seniors of Bridgeport that will continue to enhance
memory, cognitive ability, concentration and overall mental and physical capacities.2. To strive to improve senior citizens outlook and quality of life by increasing services and
providing more programs.3. To document all participation in various activities to see strengths and weaknesses of each
program.4. CW Resources will continue to provide a nutritional lunch program daily.5. Continue to provide educational lectures on a weekly basis.6. Provide seniors with new efficiency, automation and innovation to help with the
registration, scheduling, tracking and reporting process. This system will be used fortracking each senior member for a safer environment, providing accurate counts of seniorsand the activities they enjoy.
7. Increase Dental Hygienist and Nurse accessibility.8. We will continue to hold an answer and question session with the seniors on a quarterly
basis.9. Identify agencies, organizations, and individual providers who will offer services to our
seniors in the community.10. Continue to provide trips so that the seniors can socially interact with other seniors outside
of Bridgeport.11. Utilize periodic newsletters, city web site and special brochures to inform the seniors of the
Centers activities12. To create a file for each senior with their updated information.13. To write a letter to each inactive senior, that will inform them of all the new activities that
we have to offer.
ACTUAL ACTUAL ACTUAL ACTUAL ACTUAL 6 MONTH ESTIMATEDSERVICE INDICATORS 2012-2013 2013-2014 2014-2015 2015-2016 2016-2017 2017-2018 2017-2018DEPARTMENT ON AGINGVolunteer Placements 225 225 0 2 0 3 9Meals Provided 10,250 10,300 10,300 15,546 12,812 7,348 14,696Health Services-approx. units incl. Outreach (1) 450 500 500 550 56 121 222Transportation Provided (2) 760 800 810 810 15,600 11,700 23,400Recreation unduplicated (3) 650 700 700 700 48 30 35Social Services and Referrals 5,200 5,300 5,300 3,750 3,500 1,097 1,159Senior Activity Excursions & luncheons: Units 18,000 18,000 18,000 18,000 750 1021Total Seniors Served FY 35,400 35,450 35,450 34,450 2,466 2,554 2,800
331
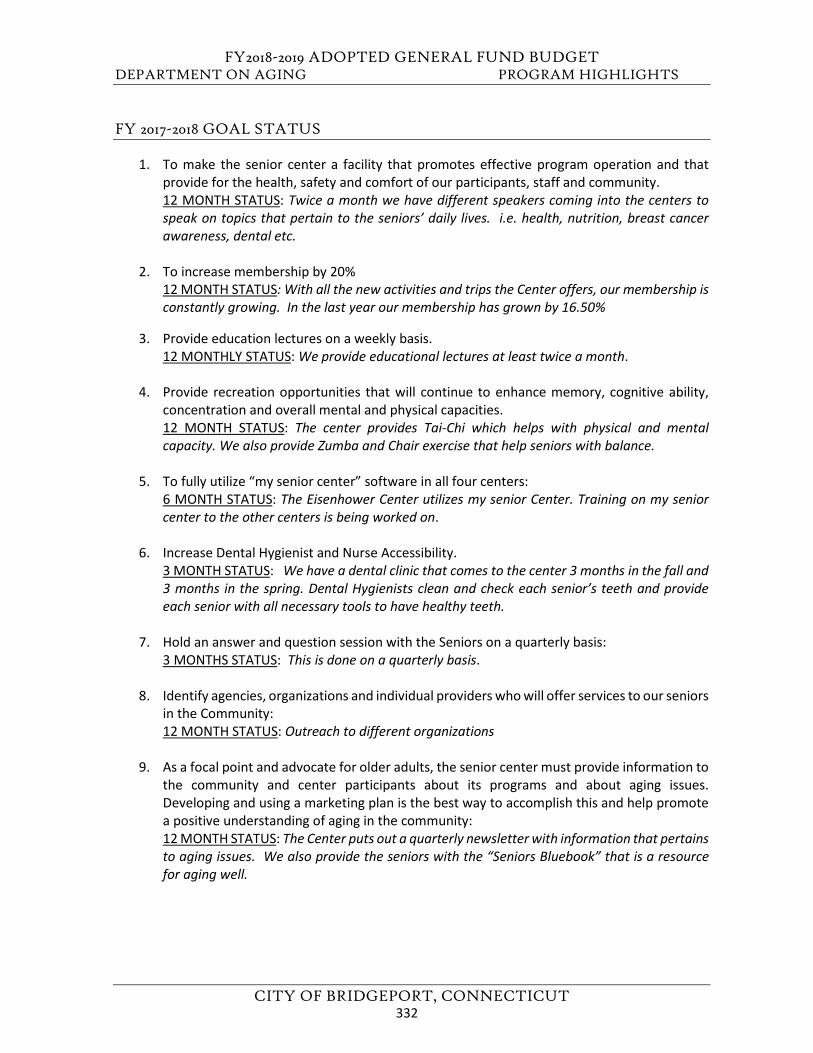
FY2018-2019 ADOPTED GENERAL FUND BUDGET DEPARTMENT ON AGING PROGRAM HIGHLIGHTS
CITY OF BRIDGEPORT, CONNECTICUT
FY 2017-2018 GOAL STATUS
1. To make the senior center a facility that promotes effective program operation and thatprovide for the health, safety and comfort of our participants, staff and community.12 MONTH STATUS: Twice a month we have different speakers coming into the centers tospeak on topics that pertain to the seniors’ daily lives. i.e. health, nutrition, breast cancerawareness, dental etc.
2. To increase membership by 20%12 MONTH STATUS: With all the new activities and trips the Center offers, our membership isconstantly growing. In the last year our membership has grown by 16.50%
3. Provide education lectures on a weekly basis.12 MONTHLY STATUS: We provide educational lectures at least twice a month.
4. Provide recreation opportunities that will continue to enhance memory, cognitive ability,concentration and overall mental and physical capacities.12 MONTH STATUS: The center provides Tai-Chi which helps with physical and mentalcapacity. We also provide Zumba and Chair exercise that help seniors with balance.
5. To fully utilize “my senior center” software in all four centers:6 MONTH STATUS: The Eisenhower Center utilizes my senior Center. Training on my seniorcenter to the other centers is being worked on.
6. Increase Dental Hygienist and Nurse Accessibility.3 MONTH STATUS: We have a dental clinic that comes to the center 3 months in the fall and3 months in the spring. Dental Hygienists clean and check each senior’s teeth and provideeach senior with all necessary tools to have healthy teeth.
7. Hold an answer and question session with the Seniors on a quarterly basis:3 MONTHS STATUS: This is done on a quarterly basis.
8. Identify agencies, organizations and individual providers who will offer services to our seniors in the Community:12 MONTH STATUS: Outreach to different organizations
9. As a focal point and advocate for older adults, the senior center must provide information tothe community and center participants about its programs and about aging issues.Developing and using a marketing plan is the best way to accomplish this and help promotea positive understanding of aging in the community:12 MONTH STATUS: The Center puts out a quarterly newsletter with information that pertains to aging issues. We also provide the seniors with the “Seniors Bluebook” that is a resourcefor aging well.
332
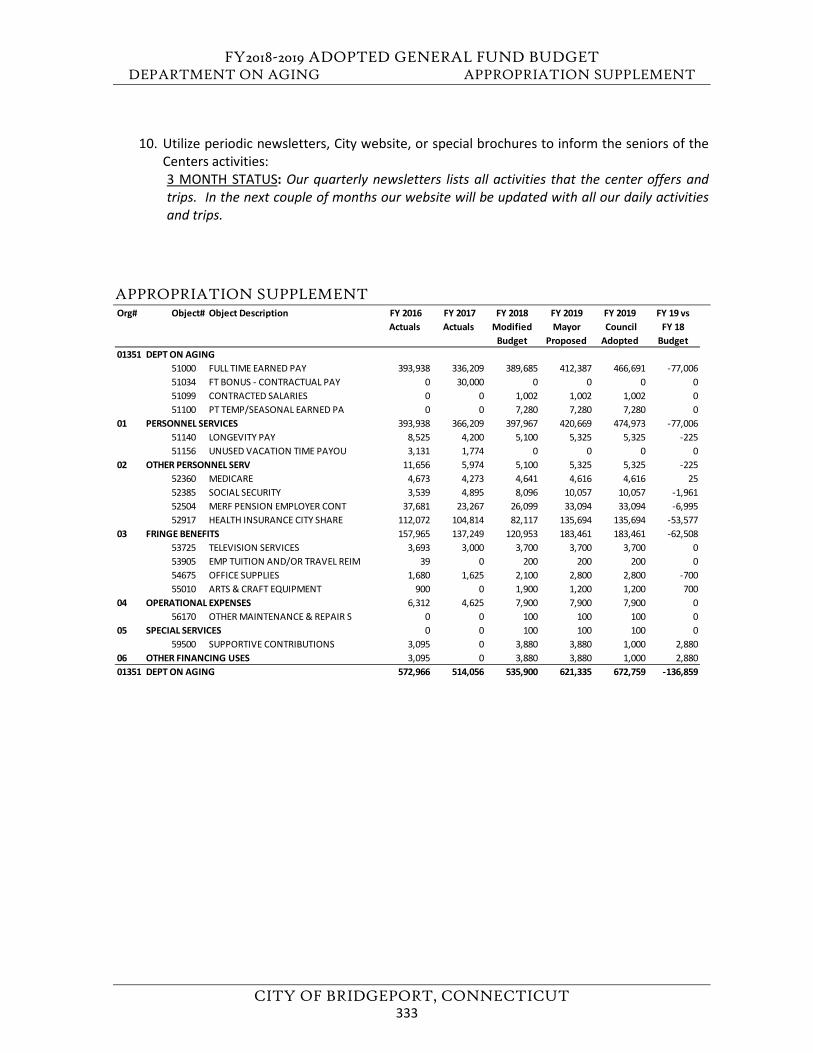
FY2018-2019 ADOPTED GENERAL FUND BUDGET DEPARTMENT ON AGING APPROPRIATION SUPPLEMENT
CITY OF BRIDGEPORT, CONNECTICUT
10. Utilize periodic newsletters, City website, or special brochures to inform the seniors of theCenters activities:3 MONTH STATUS: Our quarterly newsletters lists all activities that the center offers andtrips. In the next couple of months our website will be updated with all our daily activitiesand trips.
APPROPRIATION SUPPLEMENT Org# Object# Object Description FY 2016
Actuals FY 2017 Actuals
FY 2018 Modified
Budget
FY 2019Mayor
Proposed
FY 2019 Council Adopted
FY 19 vs FY 18
Budget01351 DEPT ON AGING
51000 FULL TIME EARNED PAY 393,938 336,209 389,685 412,387 466,691 -77,00651034 FT BONUS - CONTRACTUAL PAY 0 30,000 0 0 0 051099 CONTRACTED SALARIES 0 0 1,002 1,002 1,002 051100 PT TEMP/SEASONAL EARNED PA 0 0 7,280 7,280 7,280 0
01 PERSONNEL SERVICES 393,938 366,209 397,967 420,669 474,973 -77,00651140 LONGEVITY PAY 8,525 4,200 5,100 5,325 5,325 -22551156 UNUSED VACATION TIME PAYOU 3,131 1,774 0 0 0 0
02 OTHER PERSONNEL SERV 11,656 5,974 5,100 5,325 5,325 -22552360 MEDICARE 4,673 4,273 4,641 4,616 4,616 2552385 SOCIAL SECURITY 3,539 4,895 8,096 10,057 10,057 -1,96152504 MERF PENSION EMPLOYER CONT 37,681 23,267 26,099 33,094 33,094 -6,99552917 HEALTH INSURANCE CITY SHARE 112,072 104,814 82,117 135,694 135,694 -53,577
03 FRINGE BENEFITS 157,965 137,249 120,953 183,461 183,461 -62,50853725 TELEVISION SERVICES 3,693 3,000 3,700 3,700 3,700 053905 EMP TUITION AND/OR TRAVEL REIM 39 0 200 200 200 054675 OFFICE SUPPLIES 1,680 1,625 2,100 2,800 2,800 -70055010 ARTS & CRAFT EQUIPMENT 900 0 1,900 1,200 1,200 700
04 OPERATIONAL EXPENSES 6,312 4,625 7,900 7,900 7,900 056170 OTHER MAINTENANCE & REPAIR S 0 0 100 100 100 0
05 SPECIAL SERVICES 0 0 100 100 100 059500 SUPPORTIVE CONTRIBUTIONS 3,095 0 3,880 3,880 1,000 2,880
06 OTHER FINANCING USES 3,095 0 3,880 3,880 1,000 2,88001351 DEPT ON AGING 572,966 514,056 535,900 621,335 672,759 -136,859
333

FY2018-2019 ADOPTED GENERAL FUND BUDGET
CITY OF BRIDGEPORT, CONNECTICUT
This page left blank intentionally.
334
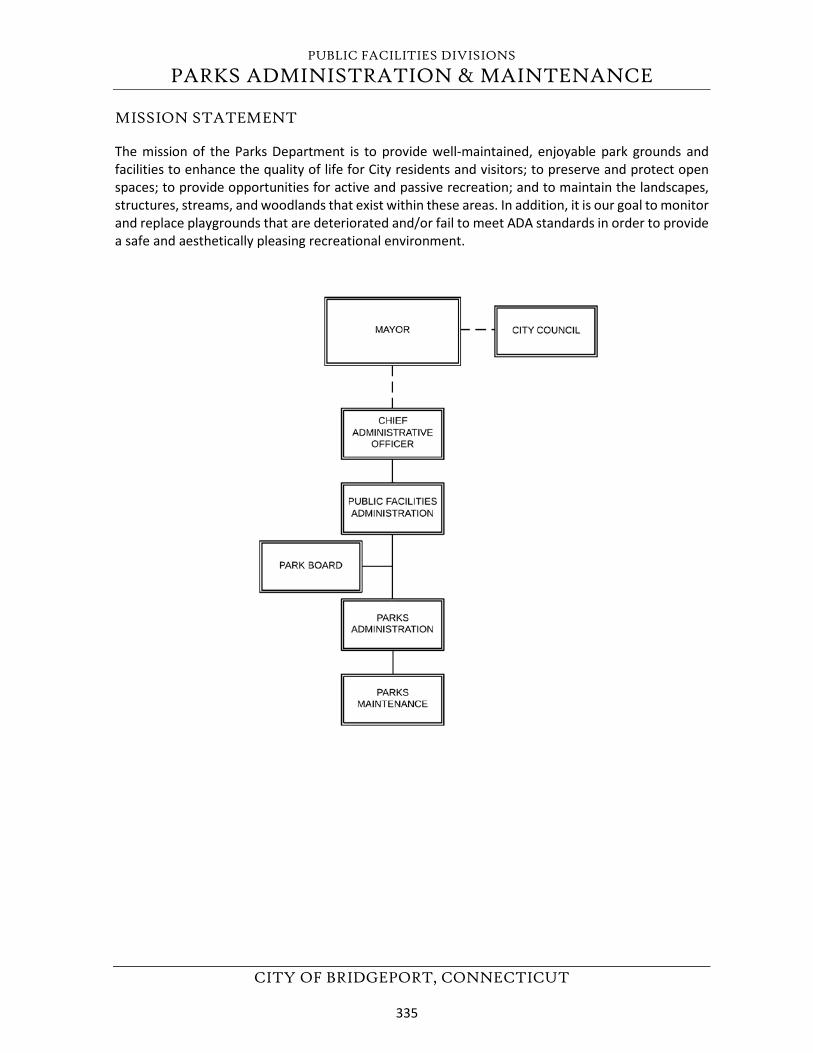
PUBLIC FACILITIES DIVISIONS
PARKS ADMINISTRATION & MAINTENANCE
CITY OF BRIDGEPORT, CONNECTICUT
MISSION STATEMENT
The mission of the Parks Department is to provide well-maintained, enjoyable park grounds and facilities to enhance the quality of life for City residents and visitors; to preserve and protect open spaces; to provide opportunities for active and passive recreation; and to maintain the landscapes, structures, streams, and woodlands that exist within these areas. In addition, it is our goal to monitor and replace playgrounds that are deteriorated and/or fail to meet ADA standards in order to provide a safe and aesthetically pleasing recreational environment.
335
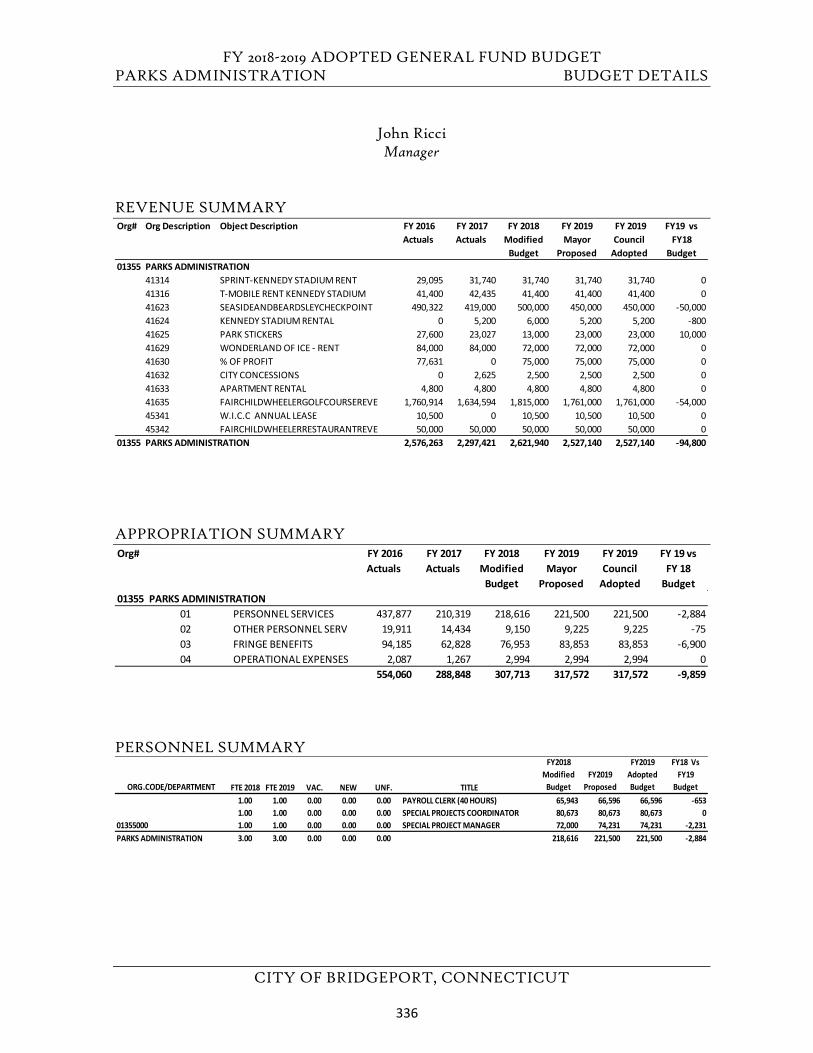
FY 2018-2019 ADOPTED GENERAL FUND BUDGET PARKS ADMINISTRATION BUDGET DETAILS
CITY OF BRIDGEPORT, CONNECTICUT
John Ricci Manager
REVENUE SUMMARY
APPROPRIATION SUMMARY
PERSONNEL SUMMARY
Org# Org Description Object Description FY 2016 Actuals
FY 2017 Actuals
FY 2018 Modified
Budget
FY 2019 Mayor
Proposed
FY 2019 Council
Adopted
FY19 vs FY18
Budget01355 PARKS ADMINISTRATION
41314 SPRINT-KENNEDY STADIUM RENT 29,095 31,740 31,740 31,740 31,740 041316 T-MOBILE RENT KENNEDY STADIUM 41,400 42,435 41,400 41,400 41,400 041623 SEASIDEANDBEARDSLEYCHECKPOINT 490,322 419,000 500,000 450,000 450,000 -50,00041624 KENNEDY STADIUM RENTAL 0 5,200 6,000 5,200 5,200 -80041625 PARK STICKERS 27,600 23,027 13,000 23,000 23,000 10,00041629 WONDERLAND OF ICE - RENT 84,000 84,000 72,000 72,000 72,000 041630 % OF PROFIT 77,631 0 75,000 75,000 75,000 041632 CITY CONCESSIONS 0 2,625 2,500 2,500 2,500 041633 APARTMENT RENTAL 4,800 4,800 4,800 4,800 4,800 041635 FAIRCHILDWHEELERGOLFCOURSEREVE 1,760,914 1,634,594 1,815,000 1,761,000 1,761,000 -54,00045341 W.I.C.C ANNUAL LEASE 10,500 0 10,500 10,500 10,500 045342 FAIRCHILDWHEELERRESTAURANTREVE 50,000 50,000 50,000 50,000 50,000 0
01355 PARKS ADMINISTRATION 2,576,263 2,297,421 2,621,940 2,527,140 2,527,140 -94,800
Org# FY 2016 Actuals
FY 2017 Actuals
FY 2018 Modified
Budget
FY 2019 Mayor
Proposed
FY 2019 Council
Adopted
FY 19 vs FY 18
Budget01355 PARKS ADMINISTRATION
01 PERSONNEL SERVICES 437,877 210,319 218,616 221,500 221,500 -2,88402 OTHER PERSONNEL SERV 19,911 14,434 9,150 9,225 9,225 -7503 FRINGE BENEFITS 94,185 62,828 76,953 83,853 83,853 -6,90004 OPERATIONAL EXPENSES 2,087 1,267 2,994 2,994 2,994 0
554,060 288,848 307,713 317,572 317,572 -9,859
ORG.CODE/DEPARTMENT FTE 2018 FTE 2019 VAC. NEW UNF. TITLE
FY2018 Modified
BudgetFY2019
Proposed
FY2019 Adopted Budget
FY18 Vs FY19
Budget 1.00 1.00 0.00 0.00 0.00 PAYROLL CLERK (40 HOURS) 65,943 66,596 66,596 -6531.00 1.00 0.00 0.00 0.00 SPECIAL PROJECTS COORDINATOR 80,673 80,673 80,673 0
01355000 1.00 1.00 0.00 0.00 0.00 SPECIAL PROJECT MANAGER 72,000 74,231 74,231 -2,231PARKS ADMINISTRATION 3.00 3.00 0.00 0.00 0.00 218,616 221,500 221,500 -2,884
336
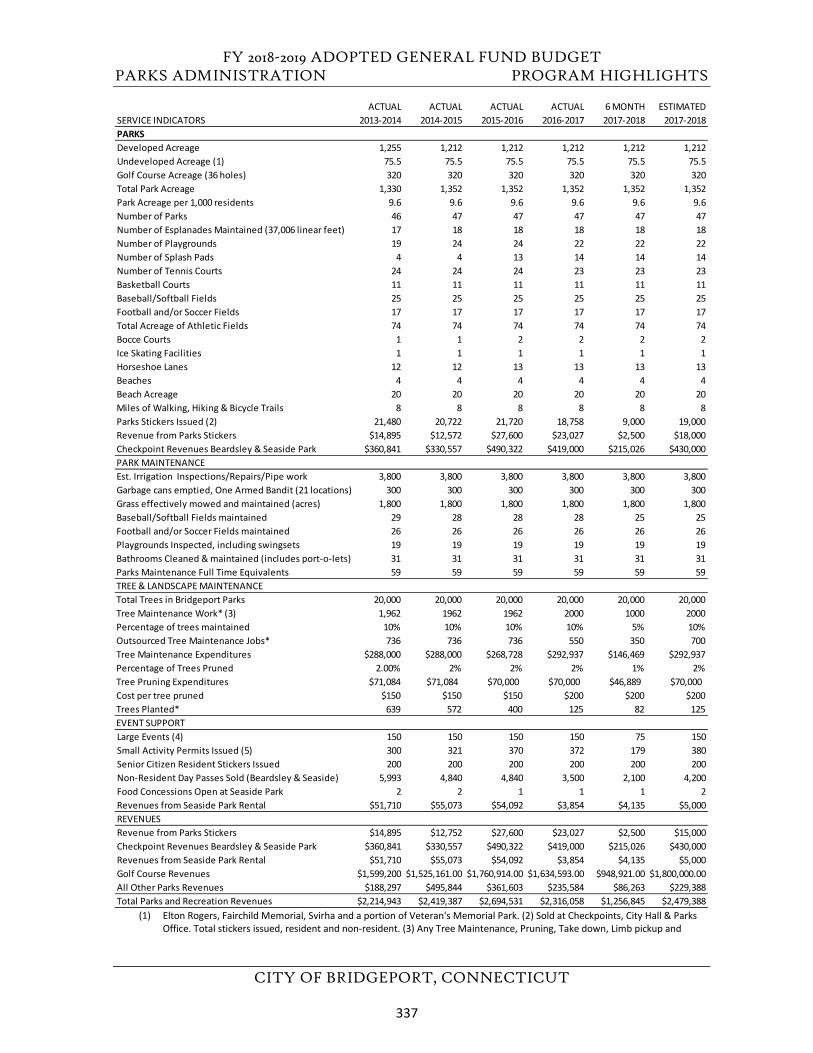
FY 2018-2019 ADOPTED GENERAL FUND BUDGET PARKS ADMINISTRATION PROGRAM HIGHLIGHTS
CITY OF BRIDGEPORT, CONNECTICUT
(1) Elton Rogers, Fairchild Memorial, Svirha and a portion of Veteran's Memorial Park. (2) Sold at Checkpoints, City Hall & Parks Office. Total stickers issued, resident and non-resident. (3) Any Tree Maintenance, Pruning, Take down, Limb pickup and
ACTUAL ACTUAL ACTUAL ACTUAL 6 MONTH ESTIMATEDSERVICE INDICATORS 2013-2014 2014-2015 2015-2016 2016-2017 2017-2018 2017-2018PARKS Developed Acreage 1,255 1,212 1,212 1,212 1,212 1,212Undeveloped Acreage (1) 75.5 75.5 75.5 75.5 75.5 75.5Golf Course Acreage (36 holes) 320 320 320 320 320 320Total Park Acreage 1,330 1,352 1,352 1,352 1,352 1,352Park Acreage per 1,000 residents 9.6 9.6 9.6 9.6 9.6 9.6Number of Parks 46 47 47 47 47 47Number of Esplanades Maintained (37,006 linear feet) 17 18 18 18 18 18Number of Playgrounds 19 24 24 22 22 22Number of Splash Pads 4 4 13 14 14 14Number of Tennis Courts 24 24 24 23 23 23Basketball Courts 11 11 11 11 11 11Baseball/Softball Fields 25 25 25 25 25 25Football and/or Soccer Fields 17 17 17 17 17 17Total Acreage of Athletic Fields 74 74 74 74 74 74Bocce Courts 1 1 2 2 2 2Ice Skating Facilities 1 1 1 1 1 1Horseshoe Lanes 12 12 13 13 13 13Beaches 4 4 4 4 4 4Beach Acreage 20 20 20 20 20 20Miles of Walking, Hiking & Bicycle Trails 8 8 8 8 8 8Parks Stickers Issued (2) 21,480 20,722 21,720 18,758 9,000 19,000Revenue from Parks Stickers $14,895 $12,572 $27,600 $23,027 $2,500 $18,000Checkpoint Revenues Beardsley & Seaside Park $360,841 $330,557 $490,322 $419,000 $215,026 $430,000PARK MAINTENANCE Est. Irrigation Inspections/Repairs/Pipe work 3,800 3,800 3,800 3,800 3,800 3,800Garbage cans emptied, One Armed Bandit (21 locations) 300 300 300 300 300 300Grass effectively mowed and maintained (acres) 1,800 1,800 1,800 1,800 1,800 1,800Baseball/Softball Fields maintained 29 28 28 28 25 25Football and/or Soccer Fields maintained 26 26 26 26 26 26Playgrounds Inspected, including swingsets 19 19 19 19 19 19Bathrooms Cleaned & maintained (includes port-o-lets) 31 31 31 31 31 31Parks Maintenance Full Time Equivalents 59 59 59 59 59 59TREE & LANDSCAPE MAINTENANCE Total Trees in Bridgeport Parks 20,000 20,000 20,000 20,000 20,000 20,000Tree Maintenance Work* (3) 1,962 1962 1962 2000 1000 2000Percentage of trees maintained 10% 10% 10% 10% 5% 10%Outsourced Tree Maintenance Jobs* 736 736 736 550 350 700Tree Maintenance Expenditures $288,000 $288,000 $268,728 $292,937 $146,469 $292,937Percentage of Trees Pruned 2.00% 2% 2% 2% 1% 2%Tree Pruning Expenditures $71,084 $71,084 $70,000 $70,000 $46,889 $70,000Cost per tree pruned $150 $150 $150 $200 $200 $200Trees Planted* 639 572 400 125 82 125EVENT SUPPORTLarge Events (4) 150 150 150 150 75 150Small Activity Permits Issued (5) 300 321 370 372 179 380Senior Citizen Resident Stickers Issued 200 200 200 200 200 200Non-Resident Day Passes Sold (Beardsley & Seaside) 5,993 4,840 4,840 3,500 2,100 4,200Food Concessions Open at Seaside Park 2 2 1 1 1 2Revenues from Seaside Park Rental $51,710 $55,073 $54,092 $3,854 $4,135 $5,000REVENUES Revenue from Parks Stickers $14,895 $12,752 $27,600 $23,027 $2,500 $15,000Checkpoint Revenues Beardsley & Seaside Park $360,841 $330,557 $490,322 $419,000 $215,026 $430,000Revenues from Seaside Park Rental $51,710 $55,073 $54,092 $3,854 $4,135 $5,000Golf Course Revenues $1,599,200 $1,525,161.00 $1,760,914.00 $1,634,593.00 $948,921.00 $1,800,000.00All Other Parks Revenues $188,297 $495,844 $361,603 $235,584 $86,263 $229,388Total Parks and Recreation Revenues $2,214,943 $2,419,387 $2,694,531 $2,316,058 $1,256,845 $2,479,388
337
FY 2018-2019 ADOPTED GENERAL FUND BUDGET PARKS ADMINISTRATION PROGRAM HIGHLIGHTS
CITY OF BRIDGEPORT, CONNECTICUT
Stump Removal done by the Parks and Recreation Department (4) Events at all Parks including Kennedy Stadium. (5) Showers, field trips, filming, fishing, picnics, weddings and rallies.
FY 2018 – 2019 GOALS:
1. To continue to deliver extensive services to City residents and visitors throughout the 47 parks wemaintain. To continue to work with the Administration, Police Department, Public Facilities andresidents of Bridgeport to ensure safe recreational havens in all parks. This includes the posting ofRules and Regulations signs in highly visible areas to inform the public, deter vandalism and providebetter grounds for enforcement of the rules and regulations. To modify the routine maintenanceschedule to improve maintenance coverage and upholding a high standard of quality, especiallyduring the peak season. To better maintain our current equipment inventory and to replace whatmay be in disrepair. To continue to make safety the utmost priority in all operations within the Parksand Recreation Dept.
2. To complete several special, capital and/or grants parks projects: Black Rock Lighthouse onFayerweather Island Coastal Engineering and Historic Preservation Phase II, Johnson Oak, SeasidePark Al Bennett Fishing Pier, Seaside Park Bandshell Electrical Installation, North End Dog Park,Increased Parking for Fields at Puglio, Wayne Street Park, Court improvements at BJ Brown, WestSide II, Washington and Newfield Parks.
3. To create and sustain the presence of high quality and healthy food concession offerings at theGrove and West Beach stands at Seaside Park and Pleasure Beach. To upgrade restroom facilities atBeardsley Park, Luis Munoz Marin/Garfield Open Space, Seaside, Washington and Went Field.
4. To continue to work closely with the Board of Parks Commissioners on projects and initiatives thatprioritize the delivery of outstanding results and services to City residents and visitors who enjoy theparks, recreation programs and D. Fairchild Wheeler Golf Course. This includes the support of all large and small events permitted throughout the park system.
5. To enhance, maintain and protect the urban tree canopy through proper tree care andmaintenance practices. To implement citywide street tree plantings and encourage communityresidents and neighborhoods to be engaged in environmental stewardship.
FY 2017 – 2018 GOAL STATUS:
1) To continue to deliver extensive services to City residents and visitors throughout our 47 beautifulparks. To continue to work with the Administration, Police Department, Public Facilities and residents of Bridgeport to ensure safe recreational havens in all parks. This includes the development andimplementation of a comprehensive maintenance programs for playgrounds, splash pads, syntheticturf fields, picnic pavilions and all park amenities and grounds. To focus on the establishment of asatellite maintenance crew on the East Side. To achieve this, we have structured a routinemaintenance schedule to provide maximum coverage for maintaining all our parks to the highstandard of quality we continue to strive to meet and uphold. To prepare for Parks Maintenancework in the future by starting the planning necessary to replenish outdated equipment and vehiclesas necessary to maintain an efficient workforce for all seasonal applications. The delivery of services
338
FY 2018-2019 ADOPTED GENERAL FUND BUDGET PARKS ADMINISTRATION PROGRAM HIGHLIGHTS
CITY OF BRIDGEPORT, CONNECTICUT
includes raising awareness within the Parks and Recreation workforce while also promoting resident participation in volunteerism and keeping parks clean.
6 MONTH STATUS: The Parks and Recreation Dept. enjoyed a busy and successful 2017 season. The City maintained all parks and either completed or made great strides towards completing all the goals listed in 2017. To replace certain equipment in the Parks Maintenance Division’s aging fleet, an automated litter container garbage truck, two crew-cab trucks and two mason dump trucks were added to the fleet in the fall of 2017. The replacement of specific lawn mower equipment helped overall landscaping operations.
2) To complete several special, capital and/or grants parks projects: Black Rock Lighthouse onFayerweather Island Coastal Engineering and Historic Preservation, Johnson Oak Park, Seaside ParkAl Bennett Fishing Pier and Wayne Street Park.6 MONTH STATUS: The Black Rock Lighthouse on Fayerweather Island has completed the initial phaseof preservation and stabilization work as afforded by the Hurricane Sandy Disaster Relief AssistanceGrant administered by the Connecticut Department of Economic and Community Development StateHistoric Preservation Office. A second phase of preservation work on the exterior and lantern levelhas been approved as an amendment and extension to the project, and is scheduled to be completedin 2018.
Johnson Oak Park Improvements in partnership with the Trust for Public Land is scheduled to be bid this February and awarded in April in order to complete the various improvements made possible by the City of Bridgeport as well as a grant from the Federal Land & Water Conservation fund administered through the State of Connecticut, Department of Environmental Protection, a Bridgeport Community Gardens grant administered by the State of Connecticut Department of Environmental Protection, an award from the National Endowment for the Arts and through the U.S. Department of HUD Community Development Block Grant Program for public park improvements at Johnson Oak Park, as well as private contributions made through the Trust for Public Land.
Al Bennett Fishing Pier construction work has commenced at Seaside Park and is scheduled to be completed by the summer. It has been made possible through disaster relief assistance for Hurricane Irene and Hurricane Sandy funded through the U.S. Department of Homeland Security Federal Emergency Management Agency (FEMA Region 1) with support also provided by the State of Connecticut Department of Emergency Services & Public Protection Division of Emergency Management and Homeland Security.
Consultants have been selected for the Wayne Street Park project, and an engineering survey has been completed to inform the proposed programming for passive and active recreation at the site. Upon the completion of the construction documents the City shall bid the construction work. This project is supported through a grant being administered by the Connecticut Department of Environmental Protection.
3) To increase awareness, celebrate and restore historical assets such as Black Rock Lighthouse onFayerweather Island, Seaside Park’s Perry Memorial Arch and the Stratfield Cemetery Gate at Clinton Park with the help of financial assistance from grants.6 MONTH STATUS: The Parks and Recreation Department is slated to continue work on the Lighthouse in 2018 as indicated in the update for the 6-month status for goal #2. The scope for evaluation and
339
FY 2018-2019 ADOPTED GENERAL FUND BUDGET PARKS ADMINISTRATION PROGRAM HIGHLIGHTS
CITY OF BRIDGEPORT, CONNECTICUT
assessment work at Seaside Park’s Perry Memorial Arch has been reviewed and identified as a special capital project potentially to be started in 2018. The Parks and Recreation Dept. has interfaced with members of the Stratfield Historic District to assist the community in achieving restoration goals for Clinton Park and Stratfield Cemetery, including the removal of fallen trees and debris within the historic burial ground area.
4) To create and sustain the presence of high quality and healthy food concession offerings at theGrove and West Beach stands at Seaside Park and Pleasure Beach. To upgrade restroom facilities atBeardsley Park, Luis Munoz Marin/Garfield Open Space, Seaside, Washington and Went Field.6 MONTH STATUS: The Concessionaire at Seaside Park provided ice cream vending trucks throughoutthe season and food and refreshments at West Beach. The concession stand at the Grove was underrenovation and is expected to be fully restored for opening in conjunction with the work being doneat Diamond 1 at Seaside Park. Pleasure Beach opened its concession stand on a limited weekend basis for 2017. All restroom facilities were fully cleaned and updated with certain fixtures such as new handdryers in 2017 and/or painted. Restrooms that need to be updated are being evaluated and assessedas part of the Parks Capital Improvement Program. Porto-let facilities were provided where necessaryat several locations.
5). To improve recreational trails, open space and welcome areas at Veteran’s Memorial Park and explore the introduction of dog runs/dog parks on the premises. 6 MONTH STATUS: An area has been identified for the North End Dog Park at Veteran’s Memorial Park. To enhance the area, unhealthy trees and invasive plant species shall be removed, healthy trees shall be pruned and a fenced in area shall be erected to provide this amenity to service the community.
6) To continue to work closely with the Board of Parks Commissioners on projects and initiatives thatprioritize the delivery of outstanding results and services to City residents and visitors who enjoy theparks, recreation programs and D. Fairchild Wheeler Golf Course. This includes the support of all large and small events permitted throughout the park system.6 MONTH STATUS: The Department of Parks and Recreation has worked closely with the Board ofPark Commissioners throughout the year, and looks forward to continuing to improve its support andfacilitation of large and small events.
7) To enhance, maintain and protect the urban tree canopy through proper tree care andmaintenance practices. To implement citywide street tree plantings and encourage communityresidents and neighborhoods to be engaged in environmental stewardship.6 MONTH STATUS: The Parks and Recreation Department continued to work closely with thecommunity to maintain the urban tree canopy. The Department planted over 100 trees as part of itsCity-wide tree planting program. We responded to tree maintenance requests and storm damagedtrees. We also reviewed work being done by the United Illuminating Company as part of its Vegetation Management Program to protect the Utility Protection Zone.
8) To continue connectivity improvements along the City-maintained rights-of-way leading to andfrom Parks including esplanades as well as greenways, public waterfront access and pedestriancorridors. This includes coordinating the completion of the Pequonnock River Trail Signage withCTMETRO. To work closely with the Administration, Public Facilities and Engineering Department aswell as the Office of Planning and Economic Development to achieve this goal.
340
FY 2018-2019 ADOPTED GENERAL FUND BUDGET PARKS ADMINISTRATION PROGRAM HIGHLIGHTS
CITY OF BRIDGEPORT, CONNECTICUT
6 MONTH STATUS: Esplanade improvements to clear overgrowth on North Avenue as well as prune and raise canopy on trees in all esplanades were started in fall 2017. Over 20,000 tulip and daffodil
bulbs were planted throughout the city. Rules and Regulation signage has been identified as a prioritized goal in visible areas of the park for the 2018 season.
9) To continue to work closely with all departments of the City of Bridgeport to improve services toresidents and all who visit the largest municipality in the State of Connecticut. To develop, champion,solidify and strengthen relationships with the Bridgeport community, the City Council, all agencies,neighborhood groups and revitalization zones, organizations and entities that are partners,contributors and supporters of Bridgeport. Within the Downtown neighborhood, the department will strive to continue working in partnership with the Downtown Special Services District, localbusinesses and various active organizations.6 MONTH STATUS: The Department of Public Facilities and Parks and Recreation Dept. looks forwardto deploying over 40 planters within the downtown Main Street corridor to enhance the streetscapein partnership with the Downtown Special Services District. The Parks Dept. continues to maintain itscollaborative partnership with environmental non-profit organizations to enhance and improve theenvironment in Bridgeport. Increased communication within the neighborhood revitalizations zonesand City Council has provided greater awareness to opportunities for new park and open spaces suchas the introduction of new amenities at West End and Wordin Park, maintenance needs such as therestoration of the picnic pavilion at West Side II and new dog park and playground amenities at AliceStreet Lot, and ways to combat and prevent vandalism at all the parks.
10) To expand the Parks and Recreation internet presence, including through social medianetworking and outreach. To engage residents to like the City of Bridgeport Parks and RecreationFacebook Page. To spread the word about special events, share positive news about Bridgeportprograms and support arts, culture and music in the parks as well as athletic, fitness and healthprograms, and youth education. To utilize the See Click Fix Application for constituent requests.6 MONTH STATUS: The Parks and Recreation Dept. has continued its Facebook page account on socialmedia and have responded to See Click Fix requests. We also have a goal of creating and/or improving the content of the existing web pages on the new City website including showing the Park Rules andRegulations, updates to upcoming events and programs.
11) To examine opportunities to increase parks revenue streams that could help offset the City’soverall operational expenses. This may include various aspects of park permitting, expanded parkingpermit requirements at specific locations, increased coordination with the Bridgeport PoliceDepartment for sticker enforcement, establish policy and procedure to collect concession and otherlicense fees and outreach to all users of the park including athletic leagues.6 MONTH STATUS: The City Public Facilities and Parks and Recreation Dept. continues to monitor allgeneral fund revenue streams as well explore new opportunities for growth where they can beidentified.
341
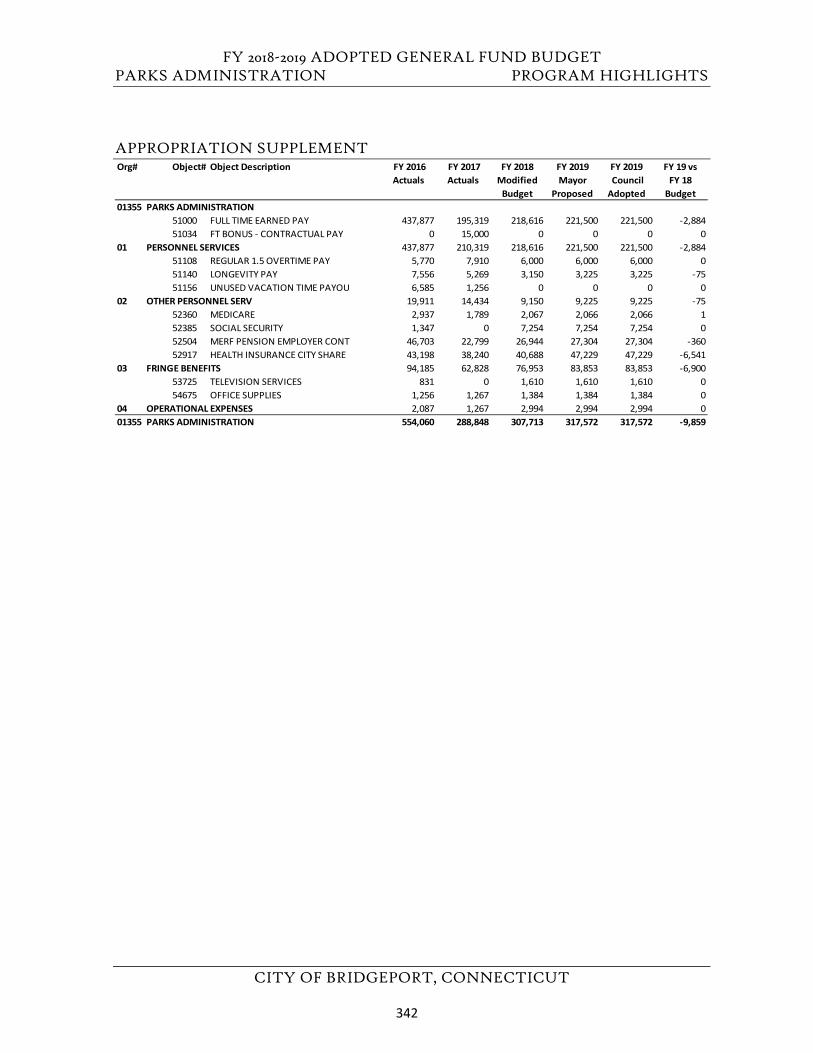
FY 2018-2019 ADOPTED GENERAL FUND BUDGET PARKS ADMINISTRATION PROGRAM HIGHLIGHTS
CITY OF BRIDGEPORT, CONNECTICUT
APPROPRIATION SUPPLEMENTOrg# Object# Object Description FY 2016
Actuals FY 2017 Actuals
FY 2018 Modified
Budget
FY 2019Mayor
Proposed
FY 2019 Council Adopted
FY 19 vs FY 18
Budget01355 PARKS ADMINISTRATION
51000 FULL TIME EARNED PAY 437,877 195,319 218,616 221,500 221,500 -2,88451034 FT BONUS - CONTRACTUAL PAY 0 15,000 0 0 0 0
01 PERSONNEL SERVICES 437,877 210,319 218,616 221,500 221,500 -2,88451108 REGULAR 1.5 OVERTIME PAY 5,770 7,910 6,000 6,000 6,000 051140 LONGEVITY PAY 7,556 5,269 3,150 3,225 3,225 -7551156 UNUSED VACATION TIME PAYOU 6,585 1,256 0 0 0 0
02 OTHER PERSONNEL SERV 19,911 14,434 9,150 9,225 9,225 -7552360 MEDICARE 2,937 1,789 2,067 2,066 2,066 152385 SOCIAL SECURITY 1,347 0 7,254 7,254 7,254 052504 MERF PENSION EMPLOYER CONT 46,703 22,799 26,944 27,304 27,304 -36052917 HEALTH INSURANCE CITY SHARE 43,198 38,240 40,688 47,229 47,229 -6,541
03 FRINGE BENEFITS 94,185 62,828 76,953 83,853 83,853 -6,90053725 TELEVISION SERVICES 831 0 1,610 1,610 1,610 054675 OFFICE SUPPLIES 1,256 1,267 1,384 1,384 1,384 0
04 OPERATIONAL EXPENSES 2,087 1,267 2,994 2,994 2,994 001355 PARKS ADMINISTRATION 554,060 288,848 307,713 317,572 317,572 -9,859
342
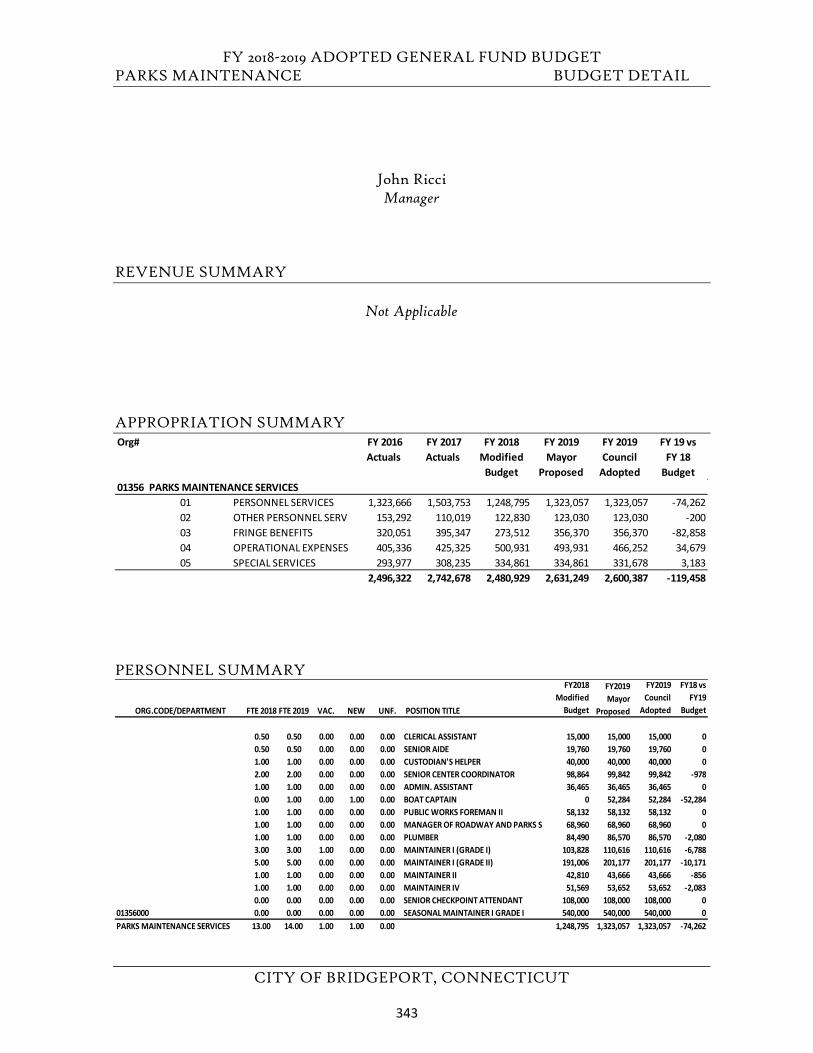
FY 2018-2019 ADOPTED GENERAL FUND BUDGET PARKS MAINTENANCE BUDGET DETAIL
CITY OF BRIDGEPORT, CONNECTICUT
John Ricci Manager
REVENUE SUMMARY
Not Applicable
APPROPRIATION SUMMARY
PERSONNEL SUMMARY
Org# FY 2016 Actuals
FY 2017 Actuals
FY 2018 Modified
Budget
FY 2019 Mayor
Proposed
FY 2019 Council
Adopted
FY 19 vs FY 18
Budget01356 PARKS MAINTENANCE SERVICES
01 PERSONNEL SERVICES 1,323,666 1,503,753 1,248,795 1,323,057 1,323,057 -74,26202 OTHER PERSONNEL SERV 153,292 110,019 122,830 123,030 123,030 -20003 FRINGE BENEFITS 320,051 395,347 273,512 356,370 356,370 -82,85804 OPERATIONAL EXPENSES 405,336 425,325 500,931 493,931 466,252 34,67905 SPECIAL SERVICES 293,977 308,235 334,861 334,861 331,678 3,183
2,496,322 2,742,678 2,480,929 2,631,249 2,600,387 -119,458
ORG.CODE/DEPARTMENT FTE 2018 FTE 2019 VAC. NEW UNF. POSITION TITLE
FY2018 Modified
Budget
FY2019 Mayor
Proposed
FY2019 Council
Adopted
FY18 vs FY19
Budget
0.50 0.50 0.00 0.00 0.00 CLERICAL ASSISTANT 15,000 15,000 15,000 00.50 0.50 0.00 0.00 0.00 SENIOR AIDE 19,760 19,760 19,760 01.00 1.00 0.00 0.00 0.00 CUSTODIAN'S HELPER 40,000 40,000 40,000 02.00 2.00 0.00 0.00 0.00 SENIOR CENTER COORDINATOR 98,864 99,842 99,842 -9781.00 1.00 0.00 0.00 0.00 ADMIN. ASSISTANT 36,465 36,465 36,465 00.00 1.00 0.00 1.00 0.00 BOAT CAPTAIN 0 52,284 52,284 -52,2841.00 1.00 0.00 0.00 0.00 PUBLIC WORKS FOREMAN II 58,132 58,132 58,132 01.00 1.00 0.00 0.00 0.00 MANAGER OF ROADWAY AND PARKS S 68,960 68,960 68,960 01.00 1.00 0.00 0.00 0.00 PLUMBER 84,490 86,570 86,570 -2,0803.00 3.00 1.00 0.00 0.00 MAINTAINER I (GRADE I) 103,828 110,616 110,616 -6,7885.00 5.00 0.00 0.00 0.00 MAINTAINER I (GRADE II) 191,006 201,177 201,177 -10,1711.00 1.00 0.00 0.00 0.00 MAINTAINER II 42,810 43,666 43,666 -8561.00 1.00 0.00 0.00 0.00 MAINTAINER IV 51,569 53,652 53,652 -2,0830.00 0.00 0.00 0.00 0.00 SENIOR CHECKPOINT ATTENDANT 108,000 108,000 108,000 0
01356000 0.00 0.00 0.00 0.00 0.00 SEASONAL MAINTAINER I GRADE I 540,000 540,000 540,000 0PARKS MAINTENANCE SERVICES 13.00 14.00 1.00 1.00 0.00 1,248,795 1,323,057 1,323,057 -74,262
343
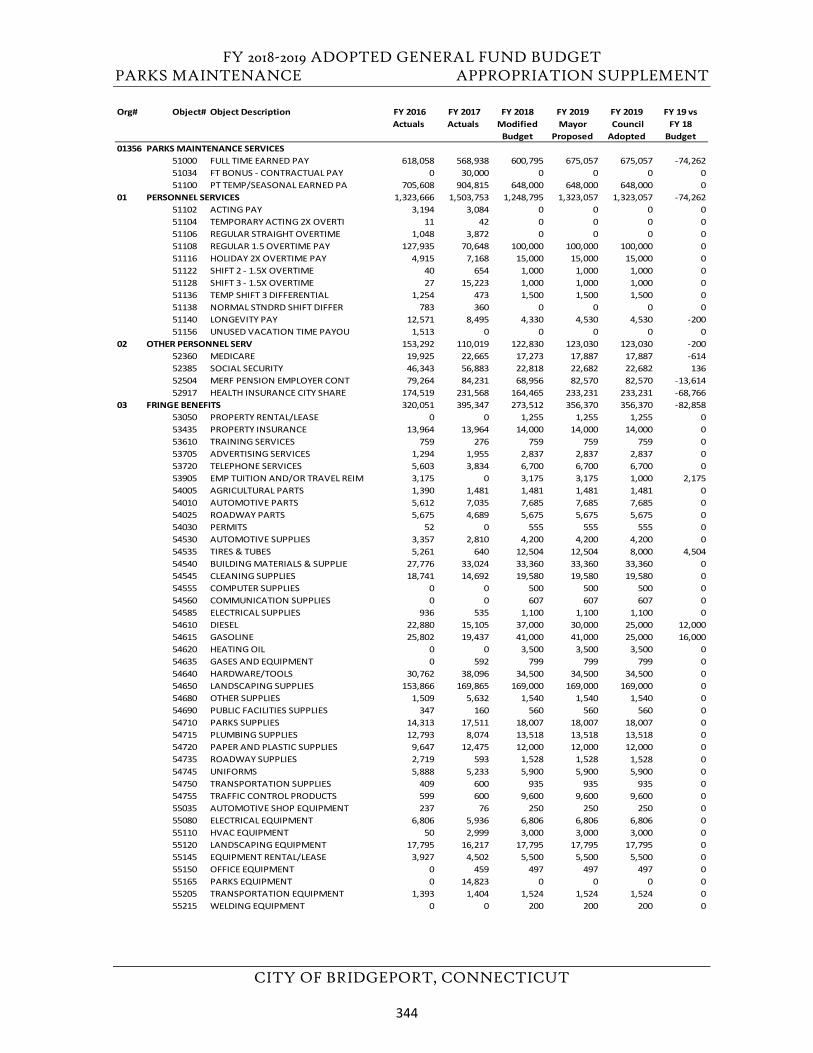
FY 2018-2019 ADOPTED GENERAL FUND BUDGET PARKS MAINTENANCE APPROPRIATION SUPPLEMENT
CITY OF BRIDGEPORT, CONNECTICUT
Org# Object# Object Description FY 2016 Actuals
FY 2017 Actuals
FY 2018 Modified
Budget
FY 2019Mayor
Proposed
FY 2019 Council Adopted
FY 19 vs FY 18
Budget01356 PARKS MAINTENANCE SERVICES
51000 FULL TIME EARNED PAY 618,058 568,938 600,795 675,057 675,057 -74,26251034 FT BONUS - CONTRACTUAL PAY 0 30,000 0 0 0 051100 PT TEMP/SEASONAL EARNED PA 705,608 904,815 648,000 648,000 648,000 0
01 PERSONNEL SERVICES 1,323,666 1,503,753 1,248,795 1,323,057 1,323,057 -74,26251102 ACTING PAY 3,194 3,084 0 0 0 051104 TEMPORARY ACTING 2X OVERTI 11 42 0 0 0 051106 REGULAR STRAIGHT OVERTIME 1,048 3,872 0 0 0 051108 REGULAR 1.5 OVERTIME PAY 127,935 70,648 100,000 100,000 100,000 051116 HOLIDAY 2X OVERTIME PAY 4,915 7,168 15,000 15,000 15,000 051122 SHIFT 2 - 1.5X OVERTIME 40 654 1,000 1,000 1,000 051128 SHIFT 3 - 1.5X OVERTIME 27 15,223 1,000 1,000 1,000 051136 TEMP SHIFT 3 DIFFERENTIAL 1,254 473 1,500 1,500 1,500 051138 NORMAL STNDRD SHIFT DIFFER 783 360 0 0 0 051140 LONGEVITY PAY 12,571 8,495 4,330 4,530 4,530 -20051156 UNUSED VACATION TIME PAYOU 1,513 0 0 0 0 0
02 OTHER PERSONNEL SERV 153,292 110,019 122,830 123,030 123,030 -20052360 MEDICARE 19,925 22,665 17,273 17,887 17,887 -61452385 SOCIAL SECURITY 46,343 56,883 22,818 22,682 22,682 13652504 MERF PENSION EMPLOYER CONT 79,264 84,231 68,956 82,570 82,570 -13,61452917 HEALTH INSURANCE CITY SHARE 174,519 231,568 164,465 233,231 233,231 -68,766
03 FRINGE BENEFITS 320,051 395,347 273,512 356,370 356,370 -82,85853050 PROPERTY RENTAL/LEASE 0 0 1,255 1,255 1,255 053435 PROPERTY INSURANCE 13,964 13,964 14,000 14,000 14,000 053610 TRAINING SERVICES 759 276 759 759 759 053705 ADVERTISING SERVICES 1,294 1,955 2,837 2,837 2,837 053720 TELEPHONE SERVICES 5,603 3,834 6,700 6,700 6,700 053905 EMP TUITION AND/OR TRAVEL REIM 3,175 0 3,175 3,175 1,000 2,17554005 AGRICULTURAL PARTS 1,390 1,481 1,481 1,481 1,481 054010 AUTOMOTIVE PARTS 5,612 7,035 7,685 7,685 7,685 054025 ROADWAY PARTS 5,675 4,689 5,675 5,675 5,675 054030 PERMITS 52 0 555 555 555 054530 AUTOMOTIVE SUPPLIES 3,357 2,810 4,200 4,200 4,200 054535 TIRES & TUBES 5,261 640 12,504 12,504 8,000 4,50454540 BUILDING MATERIALS & SUPPLIE 27,776 33,024 33,360 33,360 33,360 054545 CLEANING SUPPLIES 18,741 14,692 19,580 19,580 19,580 054555 COMPUTER SUPPLIES 0 0 500 500 500 054560 COMMUNICATION SUPPLIES 0 0 607 607 607 054585 ELECTRICAL SUPPLIES 936 535 1,100 1,100 1,100 054610 DIESEL 22,880 15,105 37,000 30,000 25,000 12,00054615 GASOLINE 25,802 19,437 41,000 41,000 25,000 16,00054620 HEATING OIL 0 0 3,500 3,500 3,500 054635 GASES AND EQUIPMENT 0 592 799 799 799 054640 HARDWARE/TOOLS 30,762 38,096 34,500 34,500 34,500 054650 LANDSCAPING SUPPLIES 153,866 169,865 169,000 169,000 169,000 054680 OTHER SUPPLIES 1,509 5,632 1,540 1,540 1,540 054690 PUBLIC FACILITIES SUPPLIES 347 160 560 560 560 054710 PARKS SUPPLIES 14,313 17,511 18,007 18,007 18,007 054715 PLUMBING SUPPLIES 12,793 8,074 13,518 13,518 13,518 054720 PAPER AND PLASTIC SUPPLIES 9,647 12,475 12,000 12,000 12,000 054735 ROADWAY SUPPLIES 2,719 593 1,528 1,528 1,528 054745 UNIFORMS 5,888 5,233 5,900 5,900 5,900 054750 TRANSPORTATION SUPPLIES 409 600 935 935 935 054755 TRAFFIC CONTROL PRODUCTS 599 600 9,600 9,600 9,600 055035 AUTOMOTIVE SHOP EQUIPMENT 237 76 250 250 250 055080 ELECTRICAL EQUIPMENT 6,806 5,936 6,806 6,806 6,806 055110 HVAC EQUIPMENT 50 2,999 3,000 3,000 3,000 055120 LANDSCAPING EQUIPMENT 17,795 16,217 17,795 17,795 17,795 055145 EQUIPMENT RENTAL/LEASE 3,927 4,502 5,500 5,500 5,500 055150 OFFICE EQUIPMENT 0 459 497 497 497 055165 PARKS EQUIPMENT 0 14,823 0 0 0 055205 TRANSPORTATION EQUIPMENT 1,393 1,404 1,524 1,524 1,524 055215 WELDING EQUIPMENT 0 0 200 200 200 0
344
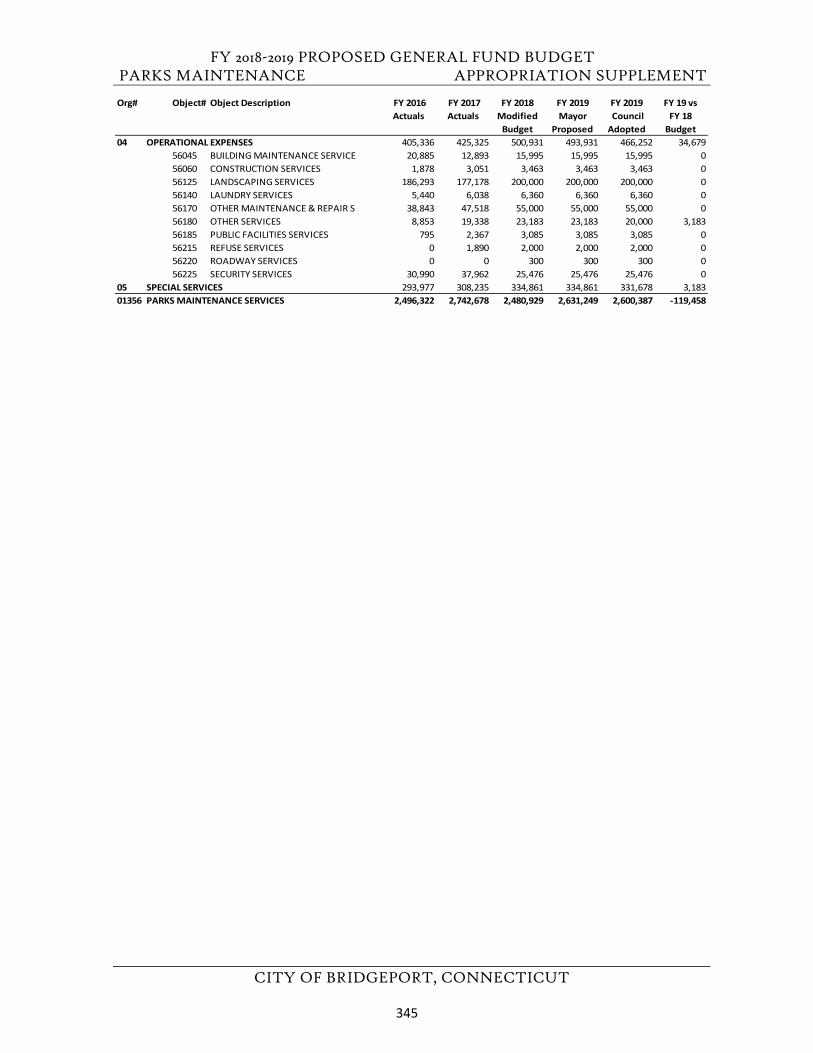
FY 2018-2019 PROPOSED GENERAL FUND BUDGET PARKS MAINTENANCE APPROPRIATION SUPPLEMENT
CITY OF BRIDGEPORT, CONNECTICUT
Org# Object# Object Description FY 2016 Actuals
FY 2017 Actuals
FY 2018 Modified
Budget
FY 2019Mayor
Proposed
FY 2019 Council Adopted
FY 19 vs FY 18
Budget04 OPERATIONAL EXPENSES 405,336 425,325 500,931 493,931 466,252 34,679
56045 BUILDING MAINTENANCE SERVICE 20,885 12,893 15,995 15,995 15,995 056060 CONSTRUCTION SERVICES 1,878 3,051 3,463 3,463 3,463 056125 LANDSCAPING SERVICES 186,293 177,178 200,000 200,000 200,000 056140 LAUNDRY SERVICES 5,440 6,038 6,360 6,360 6,360 056170 OTHER MAINTENANCE & REPAIR S 38,843 47,518 55,000 55,000 55,000 056180 OTHER SERVICES 8,853 19,338 23,183 23,183 20,000 3,18356185 PUBLIC FACILITIES SERVICES 795 2,367 3,085 3,085 3,085 056215 REFUSE SERVICES 0 1,890 2,000 2,000 2,000 056220 ROADWAY SERVICES 0 0 300 300 300 056225 SECURITY SERVICES 30,990 37,962 25,476 25,476 25,476 0
05 SPECIAL SERVICES 293,977 308,235 334,861 334,861 331,678 3,18301356 PARKS MAINTENANCE SERVICES 2,496,322 2,742,678 2,480,929 2,631,249 2,600,387 -119,458
345

FY 2018-2019 ADOPTED GENERAL FUND BUDGET
CITY OF BRIDGEPORT, CONNECTICUT
This page left blank intentionally.
346
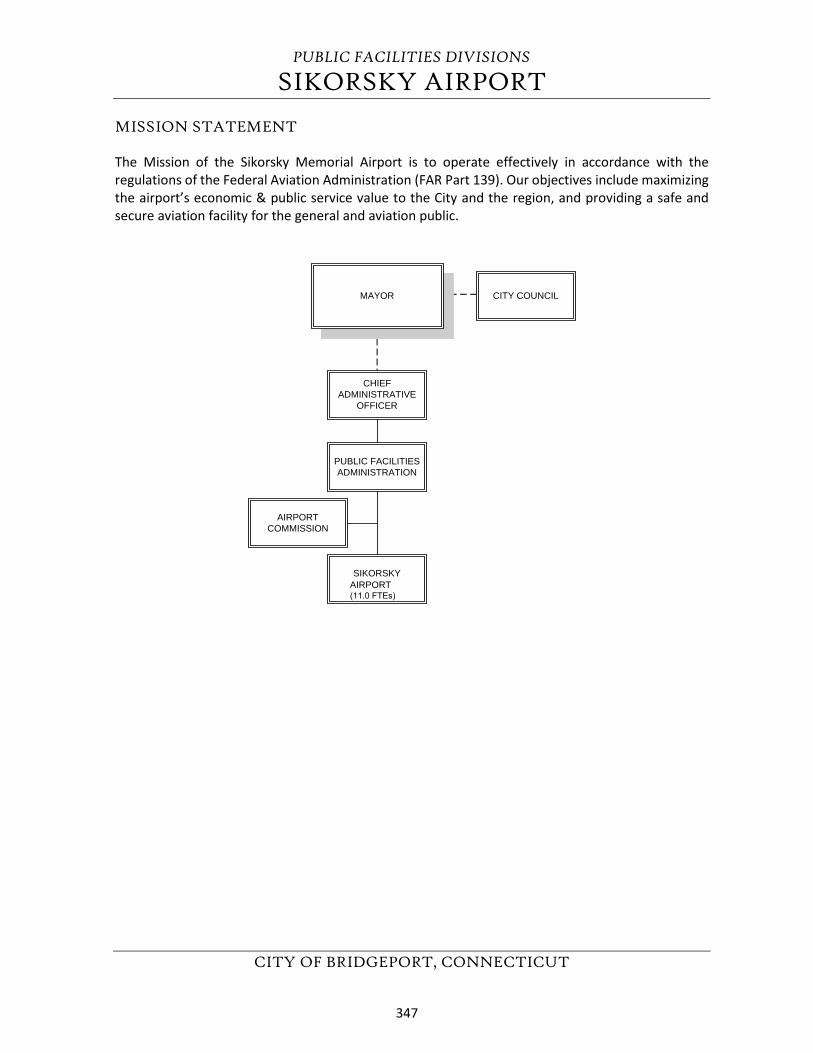
PUBLIC FACILITIES DIVISIONS
SIKORSKY AIRPORT
CITY OF BRIDGEPORT, CONNECTICUT
MISSION STATEMENT
The Mission of the Sikorsky Memorial Airport is to operate effectively in accordance with the regulations of the Federal Aviation Administration (FAR Part 139). Our objectives include maximizing the airport’s economic & public service value to the City and the region, and providing a safe and secure aviation facility for the general and aviation public.
CHIEFADMINISTRATIVE
OFFICER
PUBLIC FACILITIESADMINISTRATION
SIKORSKYAIRPORT(11.0 FTEs)
MAYOR CITY COUNCIL
AIRPORTCOMMISSION
347
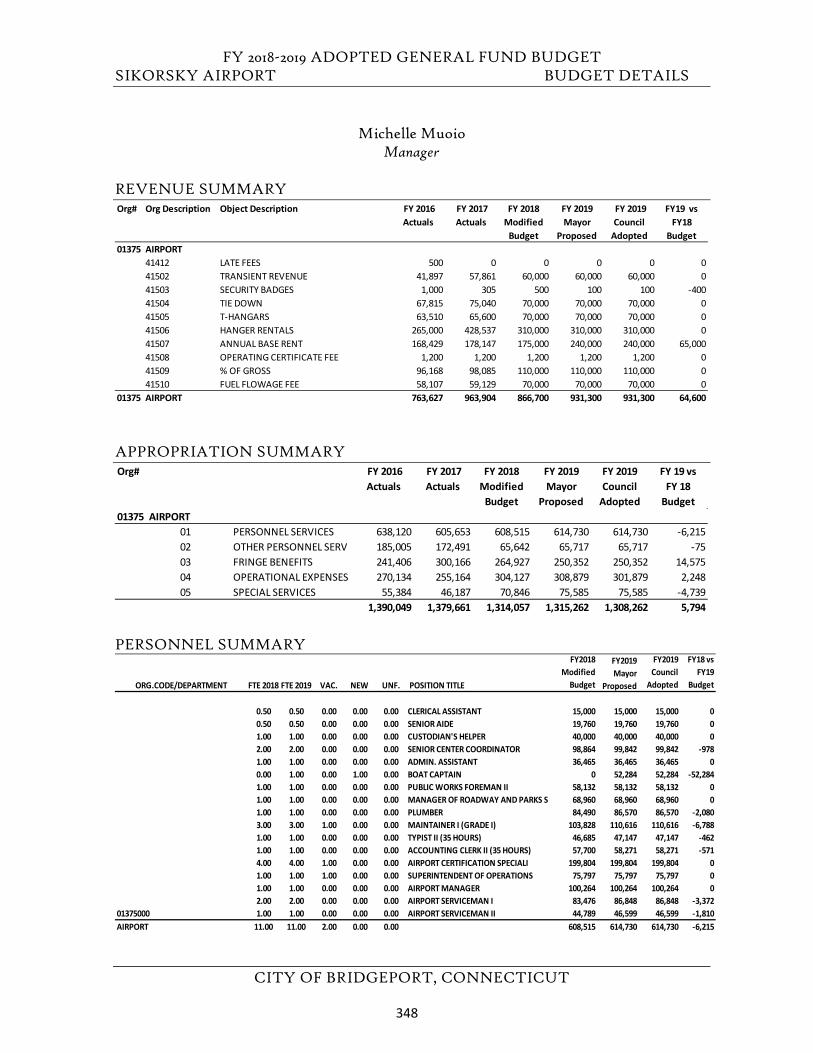
FY 2018-2019 ADOPTED GENERAL FUND BUDGET SIKORSKY AIRPORT BUDGET DETAILS
CITY OF BRIDGEPORT, CONNECTICUT
Michelle Muoio Manager
REVENUE SUMMARY
APPROPRIATION SUMMARY
PERSONNEL SUMMARY
Org# Org Description Object Description FY 2016 Actuals
FY 2017 Actuals
FY 2018 Modified
Budget
FY 2019 Mayor
Proposed
FY 2019 Council
Adopted
FY19 vs FY18
Budget01375 AIRPORT
41412 LATE FEES 500 0 0 0 0 041502 TRANSIENT REVENUE 41,897 57,861 60,000 60,000 60,000 041503 SECURITY BADGES 1,000 305 500 100 100 -40041504 TIE DOWN 67,815 75,040 70,000 70,000 70,000 041505 T-HANGARS 63,510 65,600 70,000 70,000 70,000 041506 HANGER RENTALS 265,000 428,537 310,000 310,000 310,000 041507 ANNUAL BASE RENT 168,429 178,147 175,000 240,000 240,000 65,00041508 OPERATING CERTIFICATE FEE 1,200 1,200 1,200 1,200 1,200 041509 % OF GROSS 96,168 98,085 110,000 110,000 110,000 041510 FUEL FLOWAGE FEE 58,107 59,129 70,000 70,000 70,000 0
01375 AIRPORT 763,627 963,904 866,700 931,300 931,300 64,600
Org# FY 2016 Actuals
FY 2017 Actuals
FY 2018 Modified
Budget
FY 2019 Mayor
Proposed
FY 2019 Council
Adopted
FY 19 vs FY 18
Budget01375 AIRPORT
01 PERSONNEL SERVICES 638,120 605,653 608,515 614,730 614,730 -6,21502 OTHER PERSONNEL SERV 185,005 172,491 65,642 65,717 65,717 -7503 FRINGE BENEFITS 241,406 300,166 264,927 250,352 250,352 14,57504 OPERATIONAL EXPENSES 270,134 255,164 304,127 308,879 301,879 2,24805 SPECIAL SERVICES 55,384 46,187 70,846 75,585 75,585 -4,739
1,390,049 1,379,661 1,314,057 1,315,262 1,308,262 5,794
ORG.CODE/DEPARTMENT FTE 2018 FTE 2019 VAC. NEW UNF. POSITION TITLE
FY2018 Modified
Budget
FY2019 Mayor
Proposed
FY2019 Council
Adopted
FY18 vs FY19
Budget
0.50 0.50 0.00 0.00 0.00 CLERICAL ASSISTANT 15,000 15,000 15,000 00.50 0.50 0.00 0.00 0.00 SENIOR AIDE 19,760 19,760 19,760 01.00 1.00 0.00 0.00 0.00 CUSTODIAN'S HELPER 40,000 40,000 40,000 02.00 2.00 0.00 0.00 0.00 SENIOR CENTER COORDINATOR 98,864 99,842 99,842 -9781.00 1.00 0.00 0.00 0.00 ADMIN. ASSISTANT 36,465 36,465 36,465 00.00 1.00 0.00 1.00 0.00 BOAT CAPTAIN 0 52,284 52,284 -52,2841.00 1.00 0.00 0.00 0.00 PUBLIC WORKS FOREMAN II 58,132 58,132 58,132 01.00 1.00 0.00 0.00 0.00 MANAGER OF ROADWAY AND PARKS S 68,960 68,960 68,960 01.00 1.00 0.00 0.00 0.00 PLUMBER 84,490 86,570 86,570 -2,0803.00 3.00 1.00 0.00 0.00 MAINTAINER I (GRADE I) 103,828 110,616 110,616 -6,7881.00 1.00 0.00 0.00 0.00 TYPIST II (35 HOURS) 46,685 47,147 47,147 -4621.00 1.00 0.00 0.00 0.00 ACCOUNTING CLERK II (35 HOURS) 57,700 58,271 58,271 -5714.00 4.00 1.00 0.00 0.00 AIRPORT CERTIFICATION SPECIALI 199,804 199,804 199,804 01.00 1.00 1.00 0.00 0.00 SUPERINTENDENT OF OPERATIONS 75,797 75,797 75,797 01.00 1.00 0.00 0.00 0.00 AIRPORT MANAGER 100,264 100,264 100,264 02.00 2.00 0.00 0.00 0.00 AIRPORT SERVICEMAN I 83,476 86,848 86,848 -3,372
01375000 1.00 1.00 0.00 0.00 0.00 AIRPORT SERVICEMAN II 44,789 46,599 46,599 -1,810AIRPORT 11.00 11.00 2.00 0.00 0.00 608,515 614,730 614,730 -6,215
348
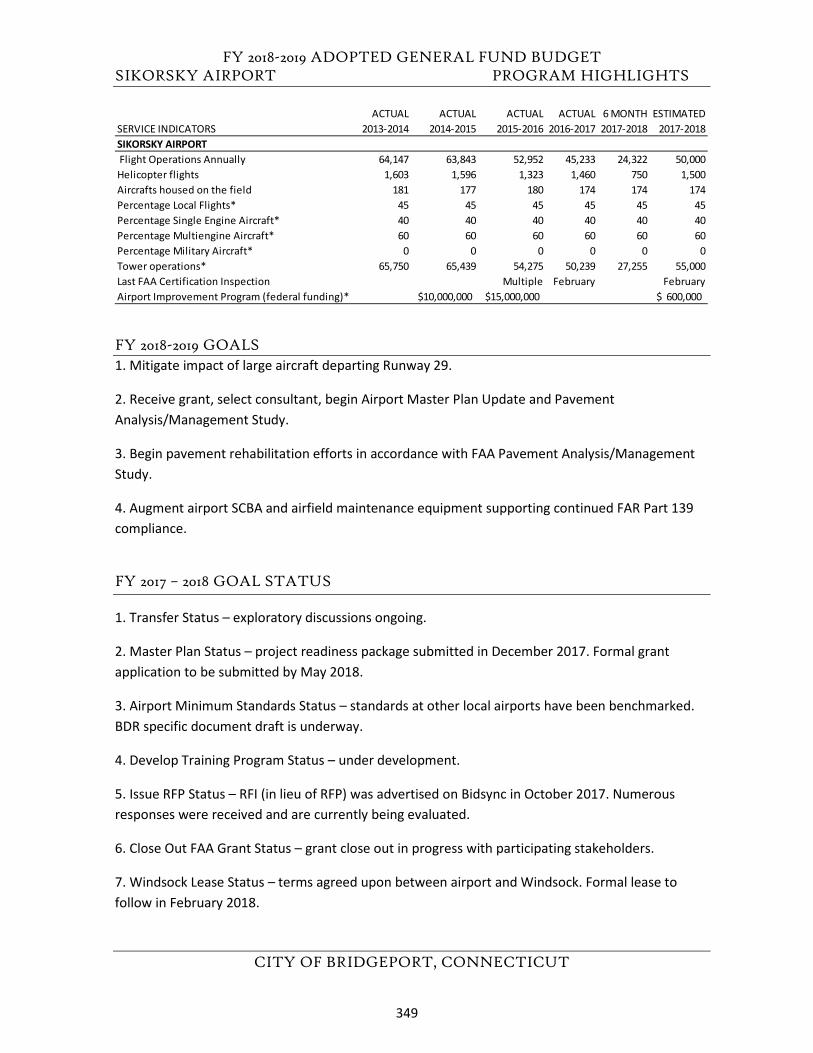
FY 2018-2019 ADOPTED GENERAL FUND BUDGET SIKORSKY AIRPORT PROGRAM HIGHLIGHTS
CITY OF BRIDGEPORT, CONNECTICUT
FY 2018-2019 GOALS 1. Mitigate impact of large aircraft departing Runway 29.
2. Receive grant, select consultant, begin Airport Master Plan Update and PavementAnalysis/Management Study.
3. Begin pavement rehabilitation efforts in accordance with FAA Pavement Analysis/ManagementStudy.
4. Augment airport SCBA and airfield maintenance equipment supporting continued FAR Part 139compliance.
FY 2017 – 2018 GOAL STATUS
1. Transfer Status – exploratory discussions ongoing.
2. Master Plan Status – project readiness package submitted in December 2017. Formal grantapplication to be submitted by May 2018.
3. Airport Minimum Standards Status – standards at other local airports have been benchmarked.BDR specific document draft is underway.
4. Develop Training Program Status – under development.
5. Issue RFP Status – RFI (in lieu of RFP) was advertised on Bidsync in October 2017. Numerousresponses were received and are currently being evaluated.
6. Close Out FAA Grant Status – grant close out in progress with participating stakeholders.
7. Windsock Lease Status – terms agreed upon between airport and Windsock. Formal lease tofollow in February 2018.
ACTUAL ACTUAL ACTUAL ACTUAL 6 MONTH ESTIMATEDSERVICE INDICATORS 2013-2014 2014-2015 2015-2016 2016-2017 2017-2018 2017-2018SIKORSKY AIRPORT Flight Operations Annually 64,147 63,843 52,952 45,233 24,322 50,000Helicopter flights 1,603 1,596 1,323 1,460 750 1,500Aircrafts housed on the field 181 177 180 174 174 174Percentage Local Flights* 45 45 45 45 45 45Percentage Single Engine Aircraft* 40 40 40 40 40 40Percentage Multiengine Aircraft* 60 60 60 60 60 60Percentage Military Aircraft* 0 0 0 0 0 0Tower operations* 65,750 65,439 54,275 50,239 27,255 55,000Last FAA Certification Inspection Multiple February FebruaryAirport Improvement Program (federal funding)* 10,000,000$ 15,000,000$ 600,000$
349
FY 2018-2019 ADOPTED GENERAL FUND BUDGET SIKORSKY AIRPORT PROGRAM HIGHLIGHTS
CITY OF BRIDGEPORT, CONNECTICUT
8. Rehabilitate Runway 11/29 Status – a Pavement Analysis/Management grant application will befiled with the Airport Master Plan grant application to obtain the required quantitative data neededto prioritize required rehabilitation.
FY 2017 – 2018 ADDITIONAL ACCOMPLISHMENTS
1. Air carrier limitations on Runway 6-24 removed by FAA in November 2017.
2. Runway 6 Precision Approach Path Indicator (PAPI) relocated in August 2017 (resolving a majordiscrepancy from the runway 6-24 construction project).
3. Segmented Circle and Primary/Supplemental Windcones relocated per FAA standards. Theseitems are the final construction item from the runway 6-24 construction project.
4. Runway 6-24 restriping in September 2017.
5. Various other airport marking updates in Summer of 2017.
6. Collaborated with Stratford and Bridgeport Fire Department to augment water rescueprocedures.
7. Security badge and access system updated in September 2017.
350
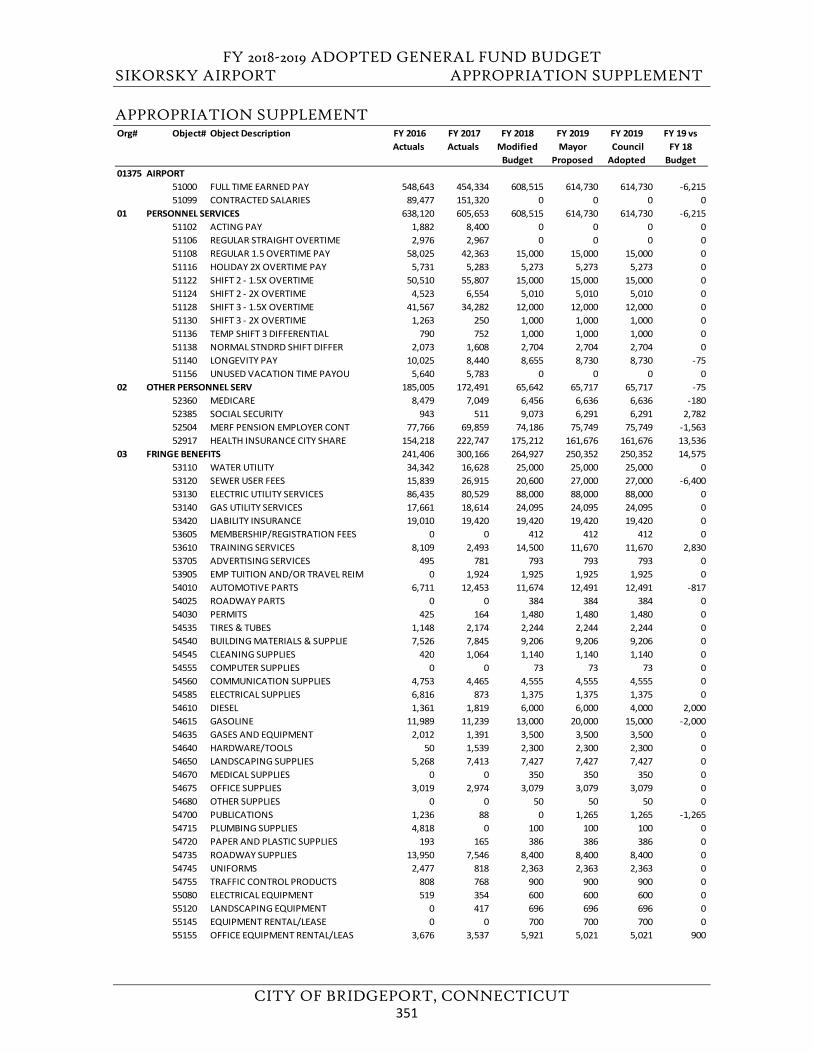
FY 2018-2019 ADOPTED GENERAL FUND BUDGET SIKORSKY AIRPORT APPROPRIATION SUPPLEMENT
CITY OF BRIDGEPORT, CONNECTICUT
APPROPRIATION SUPPLEMENT Org# Object# Object Description FY 2016
Actuals FY 2017 Actuals
FY 2018 Modified
Budget
FY 2019Mayor
Proposed
FY 2019 Council Adopted
FY 19 vs FY 18
Budget01375 AIRPORT
51000 FULL TIME EARNED PAY 548,643 454,334 608,515 614,730 614,730 -6,21551099 CONTRACTED SALARIES 89,477 151,320 0 0 0 0
01 PERSONNEL SERVICES 638,120 605,653 608,515 614,730 614,730 -6,21551102 ACTING PAY 1,882 8,400 0 0 0 051106 REGULAR STRAIGHT OVERTIME 2,976 2,967 0 0 0 051108 REGULAR 1.5 OVERTIME PAY 58,025 42,363 15,000 15,000 15,000 051116 HOLIDAY 2X OVERTIME PAY 5,731 5,283 5,273 5,273 5,273 051122 SHIFT 2 - 1.5X OVERTIME 50,510 55,807 15,000 15,000 15,000 051124 SHIFT 2 - 2X OVERTIME 4,523 6,554 5,010 5,010 5,010 051128 SHIFT 3 - 1.5X OVERTIME 41,567 34,282 12,000 12,000 12,000 051130 SHIFT 3 - 2X OVERTIME 1,263 250 1,000 1,000 1,000 051136 TEMP SHIFT 3 DIFFERENTIAL 790 752 1,000 1,000 1,000 051138 NORMAL STNDRD SHIFT DIFFER 2,073 1,608 2,704 2,704 2,704 051140 LONGEVITY PAY 10,025 8,440 8,655 8,730 8,730 -7551156 UNUSED VACATION TIME PAYOU 5,640 5,783 0 0 0 0
02 OTHER PERSONNEL SERV 185,005 172,491 65,642 65,717 65,717 -7552360 MEDICARE 8,479 7,049 6,456 6,636 6,636 -18052385 SOCIAL SECURITY 943 511 9,073 6,291 6,291 2,78252504 MERF PENSION EMPLOYER CONT 77,766 69,859 74,186 75,749 75,749 -1,56352917 HEALTH INSURANCE CITY SHARE 154,218 222,747 175,212 161,676 161,676 13,536
03 FRINGE BENEFITS 241,406 300,166 264,927 250,352 250,352 14,57553110 WATER UTILITY 34,342 16,628 25,000 25,000 25,000 053120 SEWER USER FEES 15,839 26,915 20,600 27,000 27,000 -6,40053130 ELECTRIC UTILITY SERVICES 86,435 80,529 88,000 88,000 88,000 053140 GAS UTILITY SERVICES 17,661 18,614 24,095 24,095 24,095 053420 LIABILITY INSURANCE 19,010 19,420 19,420 19,420 19,420 053605 MEMBERSHIP/REGISTRATION FEES 0 0 412 412 412 053610 TRAINING SERVICES 8,109 2,493 14,500 11,670 11,670 2,83053705 ADVERTISING SERVICES 495 781 793 793 793 053905 EMP TUITION AND/OR TRAVEL REIM 0 1,924 1,925 1,925 1,925 054010 AUTOMOTIVE PARTS 6,711 12,453 11,674 12,491 12,491 -81754025 ROADWAY PARTS 0 0 384 384 384 054030 PERMITS 425 164 1,480 1,480 1,480 054535 TIRES & TUBES 1,148 2,174 2,244 2,244 2,244 054540 BUILDING MATERIALS & SUPPLIE 7,526 7,845 9,206 9,206 9,206 054545 CLEANING SUPPLIES 420 1,064 1,140 1,140 1,140 054555 COMPUTER SUPPLIES 0 0 73 73 73 054560 COMMUNICATION SUPPLIES 4,753 4,465 4,555 4,555 4,555 054585 ELECTRICAL SUPPLIES 6,816 873 1,375 1,375 1,375 054610 DIESEL 1,361 1,819 6,000 6,000 4,000 2,00054615 GASOLINE 11,989 11,239 13,000 20,000 15,000 -2,00054635 GASES AND EQUIPMENT 2,012 1,391 3,500 3,500 3,500 054640 HARDWARE/TOOLS 50 1,539 2,300 2,300 2,300 054650 LANDSCAPING SUPPLIES 5,268 7,413 7,427 7,427 7,427 054670 MEDICAL SUPPLIES 0 0 350 350 350 054675 OFFICE SUPPLIES 3,019 2,974 3,079 3,079 3,079 054680 OTHER SUPPLIES 0 0 50 50 50 054700 PUBLICATIONS 1,236 88 0 1,265 1,265 -1,26554715 PLUMBING SUPPLIES 4,818 0 100 100 100 054720 PAPER AND PLASTIC SUPPLIES 193 165 386 386 386 054735 ROADWAY SUPPLIES 13,950 7,546 8,400 8,400 8,400 054745 UNIFORMS 2,477 818 2,363 2,363 2,363 054755 TRAFFIC CONTROL PRODUCTS 808 768 900 900 900 055080 ELECTRICAL EQUIPMENT 519 354 600 600 600 055120 LANDSCAPING EQUIPMENT 0 417 696 696 696 055145 EQUIPMENT RENTAL/LEASE 0 0 700 700 700 055155 OFFICE EQUIPMENT RENTAL/LEAS 3,676 3,537 5,921 5,021 5,021 900
351
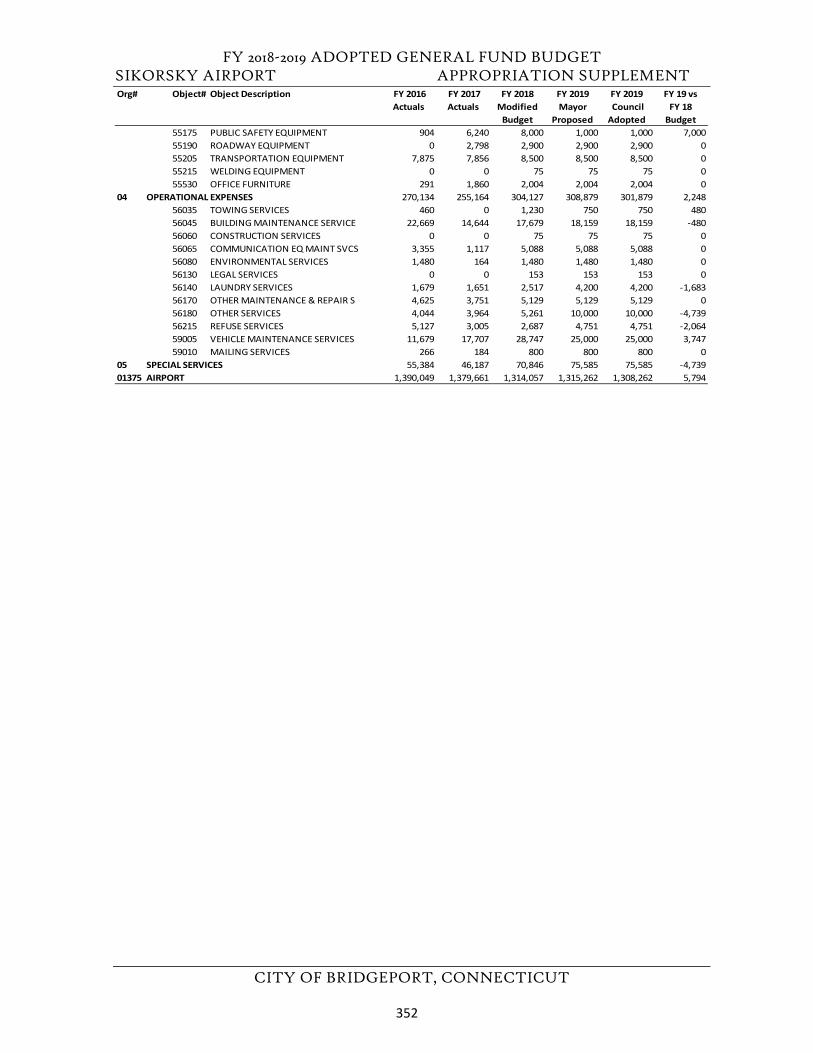
FY 2018-2019 ADOPTED GENERAL FUND BUDGET SIKORSKY AIRPORT APPROPRIATION SUPPLEMENT
CITY OF BRIDGEPORT, CONNECTICUT
Org# Object# Object Description FY 2016 Actuals
FY 2017 Actuals
FY 2018 Modified
Budget
FY 2019Mayor
Proposed
FY 2019 Council Adopted
FY 19 vs FY 18
Budget55175 PUBLIC SAFETY EQUIPMENT 904 6,240 8,000 1,000 1,000 7,00055190 ROADWAY EQUIPMENT 0 2,798 2,900 2,900 2,900 055205 TRANSPORTATION EQUIPMENT 7,875 7,856 8,500 8,500 8,500 055215 WELDING EQUIPMENT 0 0 75 75 75 055530 OFFICE FURNITURE 291 1,860 2,004 2,004 2,004 0
04 OPERATIONAL EXPENSES 270,134 255,164 304,127 308,879 301,879 2,24856035 TOWING SERVICES 460 0 1,230 750 750 48056045 BUILDING MAINTENANCE SERVICE 22,669 14,644 17,679 18,159 18,159 -48056060 CONSTRUCTION SERVICES 0 0 75 75 75 056065 COMMUNICATION EQ MAINT SVCS 3,355 1,117 5,088 5,088 5,088 056080 ENVIRONMENTAL SERVICES 1,480 164 1,480 1,480 1,480 056130 LEGAL SERVICES 0 0 153 153 153 056140 LAUNDRY SERVICES 1,679 1,651 2,517 4,200 4,200 -1,68356170 OTHER MAINTENANCE & REPAIR S 4,625 3,751 5,129 5,129 5,129 056180 OTHER SERVICES 4,044 3,964 5,261 10,000 10,000 -4,73956215 REFUSE SERVICES 5,127 3,005 2,687 4,751 4,751 -2,06459005 VEHICLE MAINTENANCE SERVICES 11,679 17,707 28,747 25,000 25,000 3,74759010 MAILING SERVICES 266 184 800 800 800 0
05 SPECIAL SERVICES 55,384 46,187 70,846 75,585 75,585 -4,73901375 AIRPORT 1,390,049 1,379,661 1,314,057 1,315,262 1,308,262 5,794
352
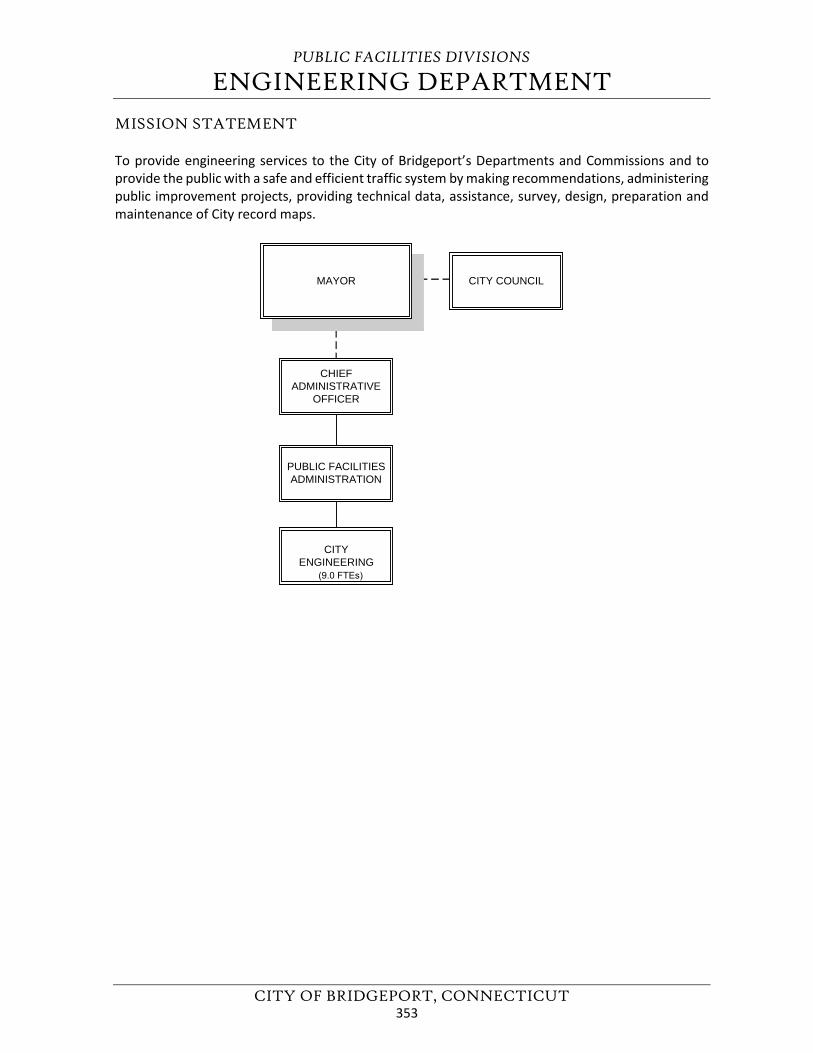
PUBLIC FACILITIES DIVISIONS
ENGINEERING DEPARTMENT
CITY OF BRIDGEPORT, CONNECTICUT
MISSION STATEMENT
To provide engineering services to the City of Bridgeport’s Departments and Commissions and to provide the public with a safe and efficient traffic system by making recommendations, administering public improvement projects, providing technical data, assistance, survey, design, preparation and maintenance of City record maps.
CHIEFADMINISTRATIVE
OFFICER
PUBLIC FACILITIESADMINISTRATION
CITYENGINEERING
(9.0 FTEs)
MAYOR CITY COUNCIL
353
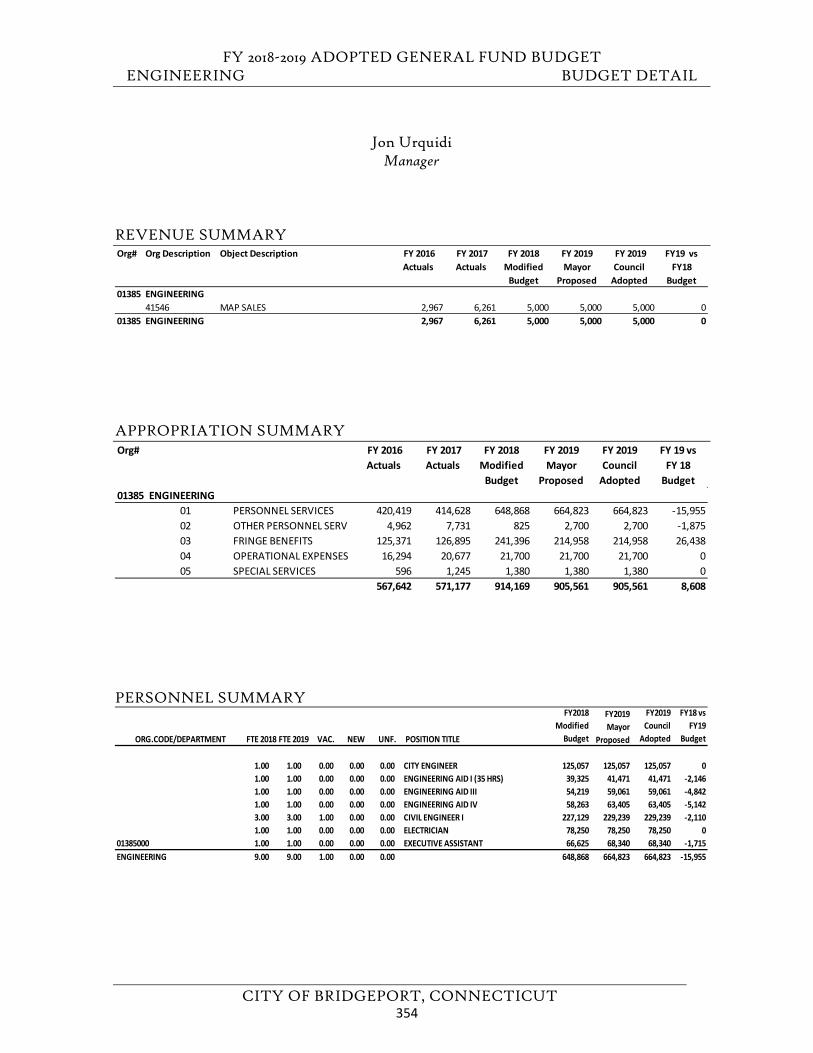
FY 2018-2019 ADOPTED GENERAL FUND BUDGET ENGINEERING BUDGET DETAIL
CITY OF BRIDGEPORT, CONNECTICUT
Jon Urquidi Manager
REVENUE SUMMARY
APPROPRIATION SUMMARY
PERSONNEL SUMMARY
Org# Org Description Object Description FY 2016 Actuals
FY 2017 Actuals
FY 2018 Modified
Budget
FY 2019 Mayor
Proposed
FY 2019 Council
Adopted
FY19 vs FY18
Budget01385 ENGINEERING
41546 MAP SALES 2,967 6,261 5,000 5,000 5,000 001385 ENGINEERING 2,967 6,261 5,000 5,000 5,000 0
Org# FY 2016 Actuals
FY 2017 Actuals
FY 2018 Modified
Budget
FY 2019 Mayor
Proposed
FY 2019 Council
Adopted
FY 19 vs FY 18
Budget01385 ENGINEERING
01 PERSONNEL SERVICES 420,419 414,628 648,868 664,823 664,823 -15,95502 OTHER PERSONNEL SERV 4,962 7,731 825 2,700 2,700 -1,87503 FRINGE BENEFITS 125,371 126,895 241,396 214,958 214,958 26,43804 OPERATIONAL EXPENSES 16,294 20,677 21,700 21,700 21,700 005 SPECIAL SERVICES 596 1,245 1,380 1,380 1,380 0
567,642 571,177 914,169 905,561 905,561 8,608
ORG.CODE/DEPARTMENT FTE 2018 FTE 2019 VAC. NEW UNF. POSITION TITLE
FY2018 Modified
Budget
FY2019 Mayor
Proposed
FY2019 Council
Adopted
FY18 vs FY19
Budget
1.00 1.00 0.00 0.00 0.00 CITY ENGINEER 125,057 125,057 125,057 01.00 1.00 0.00 0.00 0.00 ENGINEERING AID I (35 HRS) 39,325 41,471 41,471 -2,1461.00 1.00 0.00 0.00 0.00 ENGINEERING AID III 54,219 59,061 59,061 -4,8421.00 1.00 0.00 0.00 0.00 ENGINEERING AID IV 58,263 63,405 63,405 -5,1423.00 3.00 1.00 0.00 0.00 CIVIL ENGINEER I 227,129 229,239 229,239 -2,1101.00 1.00 0.00 0.00 0.00 ELECTRICIAN 78,250 78,250 78,250 0
01385000 1.00 1.00 0.00 0.00 0.00 EXECUTIVE ASSISTANT 66,625 68,340 68,340 -1,715ENGINEERING 9.00 9.00 1.00 0.00 0.00 648,868 664,823 664,823 -15,955
354
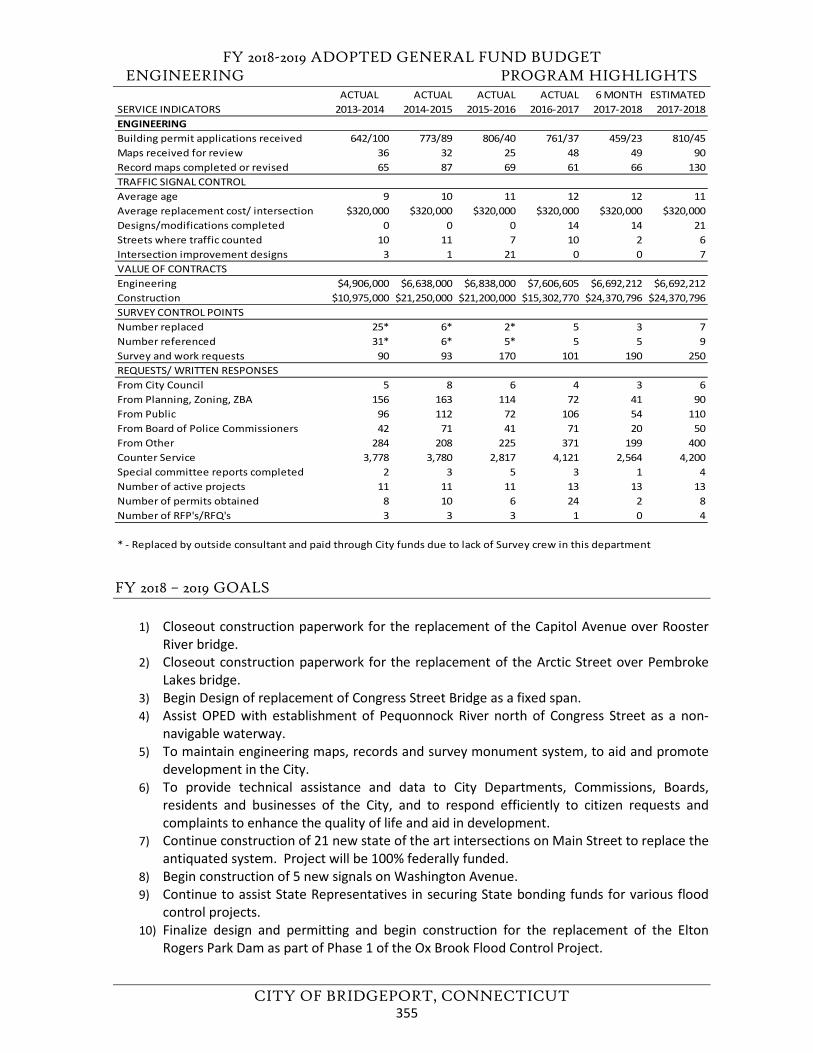
FY 2018-2019 ADOPTED GENERAL FUND BUDGET ENGINEERING PROGRAM HIGHLIGHTS
CITY OF BRIDGEPORT, CONNECTICUT
FY 2018 – 2019 GOALS
1) Closeout construction paperwork for the replacement of the Capitol Avenue over RoosterRiver bridge.
2) Closeout construction paperwork for the replacement of the Arctic Street over PembrokeLakes bridge.
3) Begin Design of replacement of Congress Street Bridge as a fixed span.4) Assist OPED with establishment of Pequonnock River north of Congress Street as a non-
navigable waterway.5) To maintain engineering maps, records and survey monument system, to aid and promote
development in the City.6) To provide technical assistance and data to City Departments, Commissions, Boards,
residents and businesses of the City, and to respond efficiently to citizen requests andcomplaints to enhance the quality of life and aid in development.
7) Continue construction of 21 new state of the art intersections on Main Street to replace theantiquated system. Project will be 100% federally funded.
8) Begin construction of 5 new signals on Washington Avenue.9) Continue to assist State Representatives in securing State bonding funds for various flood
control projects.10) Finalize design and permitting and begin construction for the replacement of the Elton
Rogers Park Dam as part of Phase 1 of the Ox Brook Flood Control Project.
ACTUAL ACTUAL ACTUAL ACTUAL 6 MONTH ESTIMATEDSERVICE INDICATORS 2013-2014 2014-2015 2015-2016 2016-2017 2017-2018 2017-2018ENGINEERINGBuilding permit applications received 642/100 773/89 806/40 761/37 459/23 810/45Maps received for review 36 32 25 48 49 90Record maps completed or revised 65 87 69 61 66 130TRAFFIC SIGNAL CONTROLAverage age 9 10 11 12 12 11Average replacement cost/ intersection $320,000 $320,000 $320,000 $320,000 $320,000 $320,000Designs/modifications completed 0 0 0 14 14 21Streets where traffic counted 10 11 7 10 2 6Intersection improvement designs 3 1 21 0 0 7VALUE OF CONTRACTSEngineering $4,906,000 $6,638,000 $6,838,000 $7,606,605 $6,692,212 $6,692,212Construction $10,975,000 $21,250,000 $21,200,000 $15,302,770 $24,370,796 $24,370,796SURVEY CONTROL POINTSNumber replaced 25* 6* 2* 5 3 7Number referenced 31* 6* 5* 5 5 9Survey and work requests 90 93 170 101 190 250REQUESTS/ WRITTEN RESPONSESFrom City Council 5 8 6 4 3 6From Planning, Zoning, ZBA 156 163 114 72 41 90From Public 96 112 72 106 54 110From Board of Police Commissioners 42 71 41 71 20 50From Other 284 208 225 371 199 400Counter Service 3,778 3,780 2,817 4,121 2,564 4,200Special committee reports completed 2 3 5 3 1 4Number of active projects 11 11 11 13 13 13Number of permits obtained 8 10 6 24 2 8Number of RFP's/RFQ's 3 3 3 1 0 4
* - Replaced by outside consultant and paid through City funds due to lack of Survey crew in this department
355
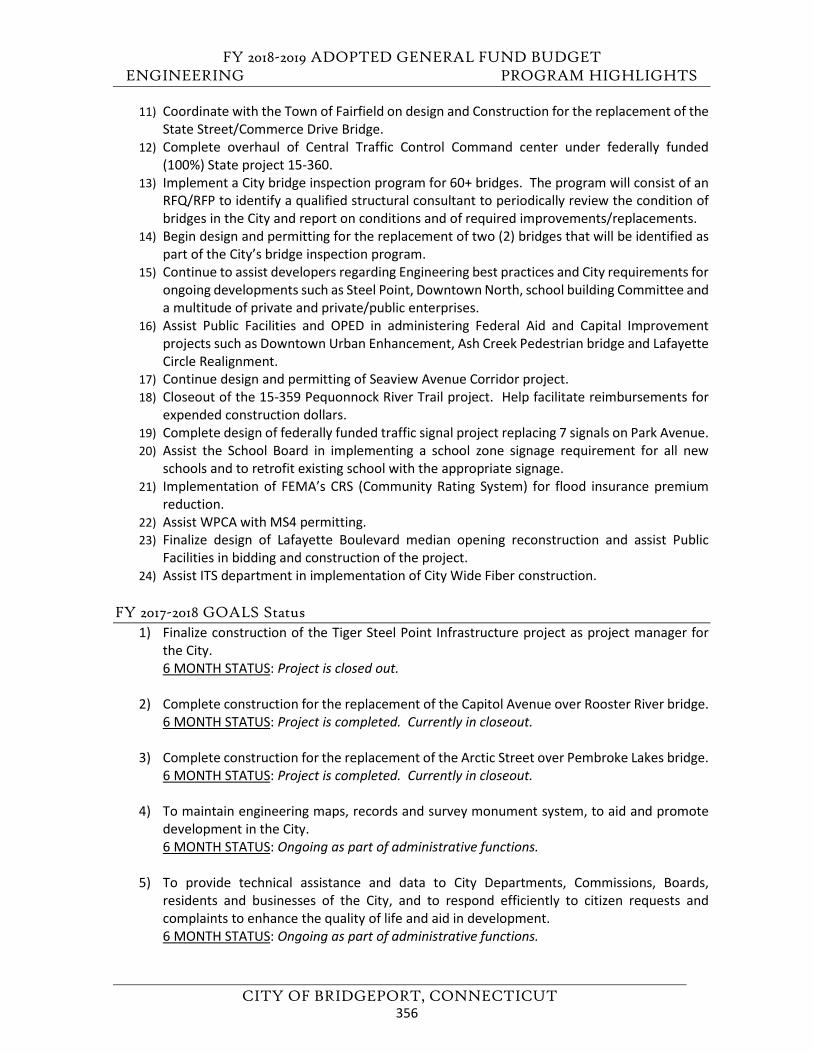
FY 2018-2019 ADOPTED GENERAL FUND BUDGET ENGINEERING PROGRAM HIGHLIGHTS
CITY OF BRIDGEPORT, CONNECTICUT
11) Coordinate with the Town of Fairfield on design and Construction for the replacement of theState Street/Commerce Drive Bridge.
12) Complete overhaul of Central Traffic Control Command center under federally funded(100%) State project 15-360.
13) Implement a City bridge inspection program for 60+ bridges. The program will consist of anRFQ/RFP to identify a qualified structural consultant to periodically review the condition ofbridges in the City and report on conditions and of required improvements/replacements.
14) Begin design and permitting for the replacement of two (2) bridges that will be identified aspart of the City’s bridge inspection program.
15) Continue to assist developers regarding Engineering best practices and City requirements forongoing developments such as Steel Point, Downtown North, school building Committee and a multitude of private and private/public enterprises.
16) Assist Public Facilities and OPED in administering Federal Aid and Capital Improvementprojects such as Downtown Urban Enhancement, Ash Creek Pedestrian bridge and LafayetteCircle Realignment.
17) Continue design and permitting of Seaview Avenue Corridor project.18) Closeout of the 15-359 Pequonnock River Trail project. Help facilitate reimbursements for
expended construction dollars.19) Complete design of federally funded traffic signal project replacing 7 signals on Park Avenue.20) Assist the School Board in implementing a school zone signage requirement for all new
schools and to retrofit existing school with the appropriate signage.21) Implementation of FEMA’s CRS (Community Rating System) for flood insurance premium
reduction.22) Assist WPCA with MS4 permitting.23) Finalize design of Lafayette Boulevard median opening reconstruction and assist Public
Facilities in bidding and construction of the project.24) Assist ITS department in implementation of City Wide Fiber construction.
FY 2017-2018 GOALS Status 1) Finalize construction of the Tiger Steel Point Infrastructure project as project manager for
the City.6 MONTH STATUS: Project is closed out.
2) Complete construction for the replacement of the Capitol Avenue over Rooster River bridge.6 MONTH STATUS: Project is completed. Currently in closeout.
3) Complete construction for the replacement of the Arctic Street over Pembroke Lakes bridge.6 MONTH STATUS: Project is completed. Currently in closeout.
4) To maintain engineering maps, records and survey monument system, to aid and promotedevelopment in the City.6 MONTH STATUS: Ongoing as part of administrative functions.
5) To provide technical assistance and data to City Departments, Commissions, Boards,residents and businesses of the City, and to respond efficiently to citizen requests andcomplaints to enhance the quality of life and aid in development.6 MONTH STATUS: Ongoing as part of administrative functions.
356
FY 2018-2019 ADOPTED GENERAL FUND BUDGET ENGINEERING PROGRAM HIGHLIGHTS
CITY OF BRIDGEPORT, CONNECTICUT
6) Continue construction of 21 new state of the art intersections on Main Street to replace theantiquated system. Engineering will oversee all construction activities and make fielddecisions based on design. Project will be 100% federally funded.6 MONTH STATUS: Project is under construction.
7) Continue construction of 5 new signals on Washington Avenue6 MONTH STATUS: State DOT run project. Project is delayed by State due to funding.Construction will begin late 2018 or 2019.
8) Continue to assist State Representatives in securing State bonding funds for various floodcontrol projects.6 MONTH STATUS: Met with State representatives and Senators and assisted with bondapplications. Ox Brook Flood control project- Phase 1 has been bonded.
9) Finalize design and permitting and begin construction for the replacement of the EltonRogers Park Dam as part of Phase 1 of the Ox Brook Flood Control Project.6 MONTH STATUS: Project is in final design and permitting. Will begin construction in 2018.
10) Coordinate with the Town of Fairfield for the design and Construction for the replacementof the State Street/Commerce Drive Bridge.6 MONTH STATUS: Project has been funded for State LOTCIP funding. Fairfield and Bridgeport working on interlocal agreement. Design will begin in spring 2018.
11) Complete overhaul of Central Traffic Control Command center under federally funded(100%) State project 15-360.6 MONTH STATUS: Project is in construction.
12) Implement a City bridge inspection program for the approximately 40 bridges. The programwill consist of an RFQ/RFP to identify a qualified structural consultant to periodically reviewthe condition of bridges in the City and report on conditions and of requiredimprovements/replacements.6 MONTH STATUS: Compiling lists of bridges and have identified more than 60 bridges. Listwill include conditions and historical data. RFQ/RFP will go out in early 2018 for priority list.
13) Begin design and permitting for the replacement of two (2) bridges that will be identified aspart of the City’s bridge inspection program.6 MONTH STATUS: RFQs for design in late 2018.
14) Continue to assist developers regarding Engineering best practices and City requirements forongoing developments such as Steel Point, Downtown North, school building Committee and a multitude of private and private/public enterprises.6 MONTH STATUS: Ongoing as part of administrative functions.
15) Assist Public Facilities and OPED in administering Federal Aid and Capital Improvementprojects such as Downtown Urban Enhancement, Ash Creek Pedestrian bridge and LafayetteCircle Realignment
357
FY 2018-2019 ADOPTED GENERAL FUND BUDGET ENGINEERING PROGRAM HIGHLIGHTS
CITY OF BRIDGEPORT, CONNECTICUT
6 MONTH STATUS: Projects in various stages of design, preconstruction, construction and post construction. Ongoing technical assistance.
16) Continue to assist Public Facilities Maintenance in standardizing City traffic signal equipment.6 MONTH STATUS: Ongoing. Public Facilities has started process to transfer maintenancefunctions of traffic signal network to Engineering through budgeted positions. Positions arein process of being filled.
17) Continue design and permitting of Seaview Avenue Corridor project6 MONTH STATUS: Project is commencing Semi Final design.
18) Assist Public Facilities and the State DOT with the closeout of the 15-359 Pequonnock RiverTrail project. Help facilitate reimbursements for expended construction dollars.6 MONTH STATUS: Project is in final closeout. State will release reimbursable funds once finalchange orders are complete. Expected in Spring of 2018.
19) Begin design of federally funded traffic signal project replacing 7 signals on Park Avenue6 MONTH STATUS: Finalizing selection of design consultant. Design will be completed in 2018 with construction in 2019-2020.
20) Assist the School Board in implementing a school zone signage requirement for all newschools and to retrofit existing school with the appropriate signage.6 MONTH STATUS: Ongoing as part of school construction and as part of administrativefunctions related to the Board of Police Commissioners.
21) Implementation of FEMA’s CRS (Community Rating System for flood insurance premiumreduction.6 MONTH STATUS: Approved through City Council. Application will be reviewed in Spring2018 by FEMA.
22) Assist WPCA with MS4 permitting.6 MONTH STATUS: Ongoing as part of WPCA’s continued effort to stay in compliance withthe MS4 permit requirements.
FY 2017-2018 ADDITIONAL ACCOMPLISHMENTS 1) Creation of new standard details and permitting requirements for City of Bridgeport roadway
and sidewalk work.2) Member of City ITS Technical Committee working on policies to standardize city security
systems, communication and IT infrastructure systems.3) Design of reconstruction of Lafayette Boulevard median openings to facilitate through traffic
on side streets.4) Assistance with many City bike trail projects.5) Modification of City Storm water regulations in conformance with MS4 requirements.6) Assisted Public Facilities with permitting for Transfer station.7) Digitization of legal addresses given by Engineering to help facilitate a GIS enabled address
point layer for use in several new City software packages.
358
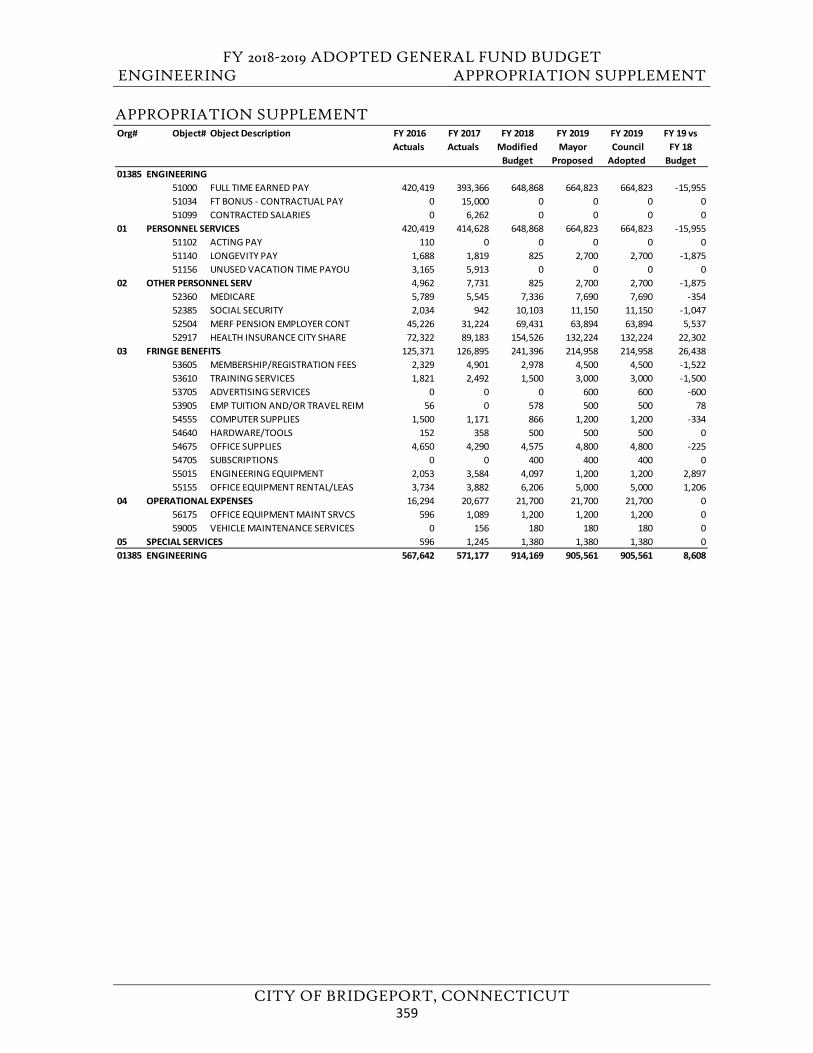
FY 2018-2019 ADOPTED GENERAL FUND BUDGET ENGINEERING APPROPRIATION SUPPLEMENT
CITY OF BRIDGEPORT, CONNECTICUT
APPROPRIATION SUPPLEMENT Org# Object# Object Description FY 2016
Actuals FY 2017 Actuals
FY 2018 Modified
Budget
FY 2019Mayor
Proposed
FY 2019 Council Adopted
FY 19 vs FY 18
Budget01385 ENGINEERING
51000 FULL TIME EARNED PAY 420,419 393,366 648,868 664,823 664,823 -15,95551034 FT BONUS - CONTRACTUAL PAY 0 15,000 0 0 0 051099 CONTRACTED SALARIES 0 6,262 0 0 0 0
01 PERSONNEL SERVICES 420,419 414,628 648,868 664,823 664,823 -15,95551102 ACTING PAY 110 0 0 0 0 051140 LONGEVITY PAY 1,688 1,819 825 2,700 2,700 -1,87551156 UNUSED VACATION TIME PAYOU 3,165 5,913 0 0 0 0
02 OTHER PERSONNEL SERV 4,962 7,731 825 2,700 2,700 -1,87552360 MEDICARE 5,789 5,545 7,336 7,690 7,690 -35452385 SOCIAL SECURITY 2,034 942 10,103 11,150 11,150 -1,04752504 MERF PENSION EMPLOYER CONT 45,226 31,224 69,431 63,894 63,894 5,53752917 HEALTH INSURANCE CITY SHARE 72,322 89,183 154,526 132,224 132,224 22,302
03 FRINGE BENEFITS 125,371 126,895 241,396 214,958 214,958 26,43853605 MEMBERSHIP/REGISTRATION FEES 2,329 4,901 2,978 4,500 4,500 -1,52253610 TRAINING SERVICES 1,821 2,492 1,500 3,000 3,000 -1,50053705 ADVERTISING SERVICES 0 0 0 600 600 -60053905 EMP TUITION AND/OR TRAVEL REIM 56 0 578 500 500 7854555 COMPUTER SUPPLIES 1,500 1,171 866 1,200 1,200 -33454640 HARDWARE/TOOLS 152 358 500 500 500 054675 OFFICE SUPPLIES 4,650 4,290 4,575 4,800 4,800 -22554705 SUBSCRIPTIONS 0 0 400 400 400 055015 ENGINEERING EQUIPMENT 2,053 3,584 4,097 1,200 1,200 2,89755155 OFFICE EQUIPMENT RENTAL/LEAS 3,734 3,882 6,206 5,000 5,000 1,206
04 OPERATIONAL EXPENSES 16,294 20,677 21,700 21,700 21,700 056175 OFFICE EQUIPMENT MAINT SRVCS 596 1,089 1,200 1,200 1,200 059005 VEHICLE MAINTENANCE SERVICES 0 156 180 180 180 0
05 SPECIAL SERVICES 596 1,245 1,380 1,380 1,380 001385 ENGINEERING 567,642 571,177 914,169 905,561 905,561 8,608
359

FY 2018-2019 ADOPTED GENERAL FUND BUDGET
CITY OF BRIDGEPORT, CONNECTICUT
This page left blank intentionally.
360
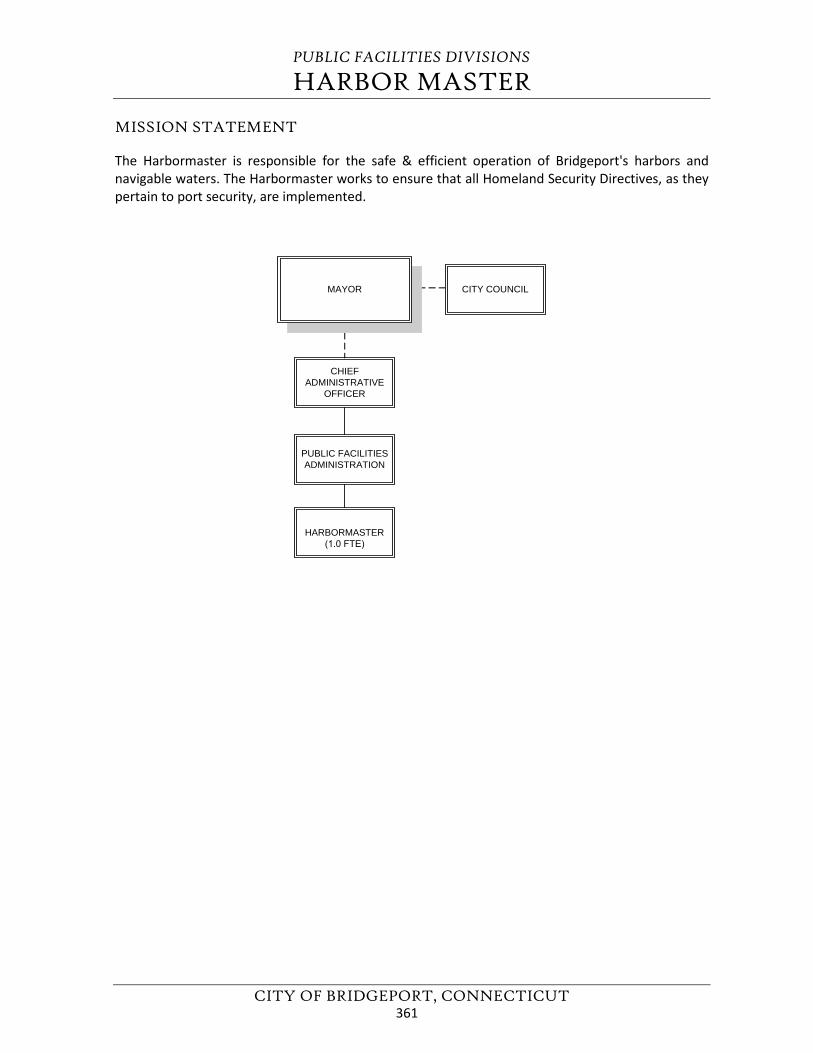
PUBLIC FACILITIES DIVISIONS
HARBOR MASTER
CITY OF BRIDGEPORT, CONNECTICUT
MISSION STATEMENT
The Harbormaster is responsible for the safe & efficient operation of Bridgeport's harbors and navigable waters. The Harbormaster works to ensure that all Homeland Security Directives, as they pertain to port security, are implemented.
CHIEFADMINISTRATIVE
OFFICER
PUBLIC FACILITIESADMINISTRATION
HARBORMASTER(1.0 FTE)
MAYOR CITY COUNCIL
361
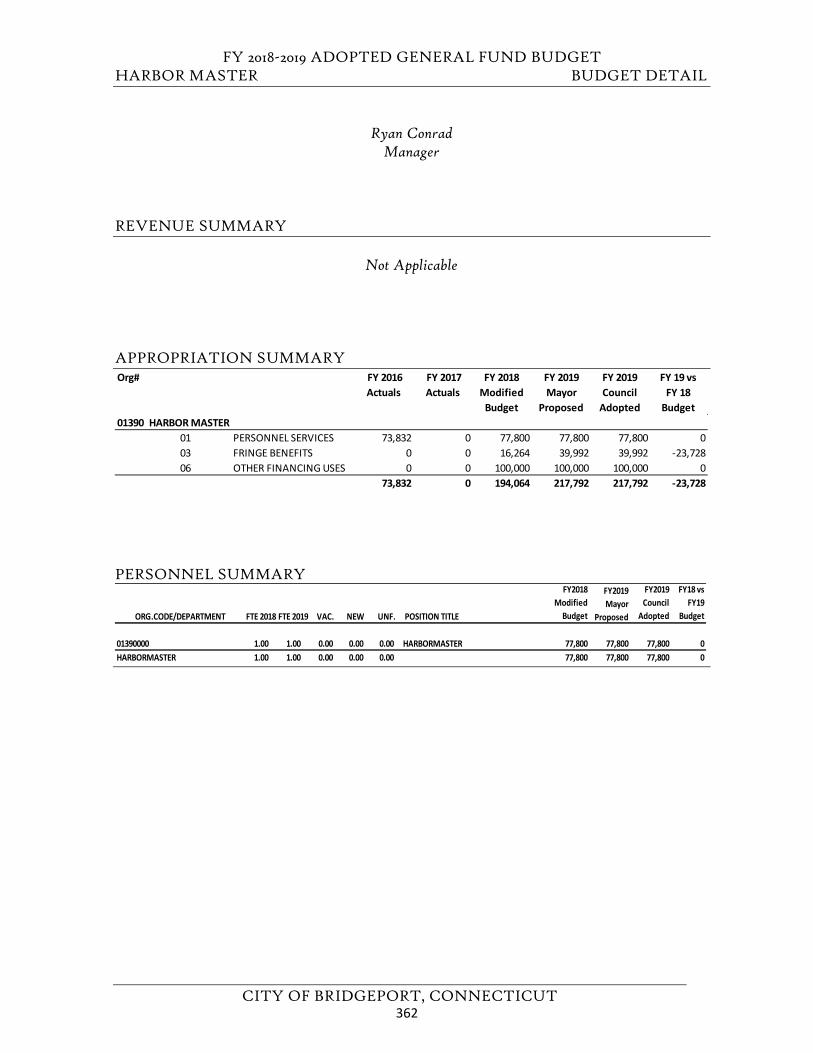
FY 2018-2019 ADOPTED GENERAL FUND BUDGET HARBOR MASTER BUDGET DETAIL
CITY OF BRIDGEPORT, CONNECTICUT
Ryan Conrad Manager
REVENUE SUMMARY
Not Applicable
APPROPRIATION SUMMARY
PERSONNEL SUMMARY
Org# FY 2016 Actuals
FY 2017 Actuals
FY 2018 Modified
Budget
FY 2019 Mayor
Proposed
FY 2019 Council
Adopted
FY 19 vs FY 18
Budget01390 HARBOR MASTER
01 PERSONNEL SERVICES 73,832 0 77,800 77,800 77,800 003 FRINGE BENEFITS 0 0 16,264 39,992 39,992 -23,72806 OTHER FINANCING USES 0 0 100,000 100,000 100,000 0
73,832 0 194,064 217,792 217,792 -23,728
ORG.CODE/DEPARTMENT FTE 2018 FTE 2019 VAC. NEW UNF. POSITION TITLE
FY2018 Modified
Budget
FY2019 Mayor
Proposed
FY2019 Council
Adopted
FY18 vs FY19
Budget
01390000 1.00 1.00 0.00 0.00 0.00 HARBORMASTER 77,800 77,800 77,800 0HARBORMASTER 1.00 1.00 0.00 0.00 0.00 77,800 77,800 77,800 0
362
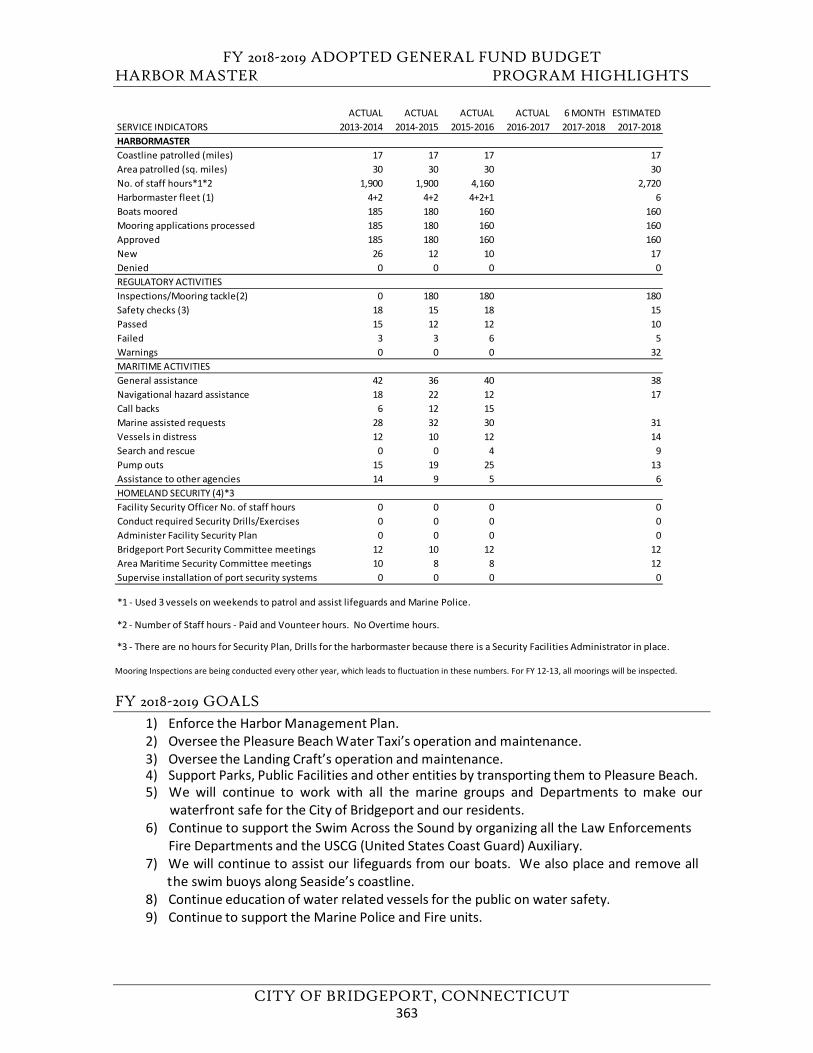
FY 2018-2019 ADOPTED GENERAL FUND BUDGET HARBOR MASTER PROGRAM HIGHLIGHTS
CITY OF BRIDGEPORT, CONNECTICUT
Mooring Inspections are being conducted every other year, which leads to fluctuation in these numbers. For FY 12-13, all moorings will be inspected.
FY 2018-2019 GOALS 1) Enforce the Harbor Management Plan.2) Oversee the Pleasure Beach Water Taxi’s operation and maintenance.3) Oversee the Landing Craft’s operation and maintenance.4) Support Parks, Public Facilities and other entities by transporting them to Pleasure Beach.5) We will continue to work with all the marine groups and Departments to make our
waterfront safe for the City of Bridgeport and our residents.6) Continue to support the Swim Across the Sound by organizing all the Law Enforcements
Fire Departments and the USCG (United States Coast Guard) Auxiliary.7) We will continue to assist our lifeguards from our boats. We also place and remove all
the swim buoys along Seaside’s coastline.8) Continue education of water related vessels for the public on water safety.9) Continue to support the Marine Police and Fire units.
ACTUAL ACTUAL ACTUAL ACTUAL 6 MONTH ESTIMATEDSERVICE INDICATORS 2013-2014 2014-2015 2015-2016 2016-2017 2017-2018 2017-2018HARBORMASTER Coastline patrolled (miles) 17 17 17 17Area patrolled (sq. miles) 30 30 30 30No. of staff hours*1*2 1,900 1,900 4,160 2,720Harbormaster fleet (1) 4+2 4+2 4+2+1 6Boats moored 185 180 160 160Mooring applications processed 185 180 160 160Approved 185 180 160 160New 26 12 10 17Denied 0 0 0 0REGULATORY ACTIVITIESInspections/Mooring tackle(2) 0 180 180 180Safety checks (3) 18 15 18 15Passed 15 12 12 10Failed 3 3 6 5Warnings 0 0 0 32MARITIME ACTIVITIESGeneral assistance 42 36 40 38Navigational hazard assistance 18 22 12 17Call backs 6 12 15Marine assisted requests 28 32 30 31Vessels in distress 12 10 12 14Search and rescue 0 0 4 9Pump outs 15 19 25 13Assistance to other agencies 14 9 5 6HOMELAND SECURITY (4)*3Facility Security Officer No. of staff hours 0 0 0 0Conduct required Security Drills/Exercises 0 0 0 0Administer Facility Security Plan 0 0 0 0Bridgeport Port Security Committee meetings 12 10 12 12Area Maritime Security Committee meetings 10 8 8 12Supervise installation of port security systems 0 0 0 0
*1 - Used 3 vessels on weekends to patrol and assist lifeguards and Marine Police.
*2 - Number of Staff hours - Paid and Vounteer hours. No Overtime hours.
*3 - There are no hours for Security Plan, Drills for the harbormaster because there is a Security Facilities Administrator in place.
363
FY 2018-2019 ADOPTED GENERAL FUND BUDGET HARBOR MASTER PROGRAM HIGHLIGHTS
CITY OF BRIDGEPORT, CONNECTICUT
10) We will continue to work with Region 1 ConOps-LIS to obtain Homeland Security Grantsand Training.
11) Work with USCG (United States Coast Guard) updating Search and Rescue methods.12) Continue to support the Pump Out Program.13) Continue to maintain 6 vessels.14) Work with USCG, The City, Tug and Barge Companies and Commercial Ports planning
the removal of the Pleasure Beach Bridge.15) Work with the Port Authority and the city’s Planning Department.
FY 2017-2018 GOAL STATUS 1) Oversee the Pleasure Beach Water Taxi’s operation and maintenance.6 MONTH STATUS: We took over 22,000 people to Pleasure Beach. Because we had to takeeveryone off the island the taxis actually transported over 44,000 people.
2) Oversee the Landing Craft’s operation and maintenance.6 MONTH STATUS: Last year we made over 40 trips transporting trucks, bucket trucks,loaders, picnic tables, machinery, ATV’s and all supplies needed to keep island running seamlessly.
3) Support Parks, Public Facilities and other entities by transporting them to Pleasure Beach.6 MONTH STATUS: Transportation of employees and equipment to maintain island.
4) We will continue to work with all the marine groups and Departments to make our waterfrontsafe for the City of Bridgeport and our residents. 6 MONTH STATUS: It is an ongoing year- r ou nd o per at ion working with our Marine division and the USCG (United States Coast Guard).
5) Continue to support the Swim Across the Sound by organizing all the Law Enforcements FireDepartments and the USCG (United States Coast Guard) Auxiliary.6 MONTH STATUS: I was able to recruit 24 Law Enforcement Departments, Fire Departments,Auxiliary USCG and Harbormasters to protect the swim from Long Island to Black Rock Harbor.We had 31 vessels this year keeping the swimmers safe from oncoming threats.
6) We will continue to assist our lifeguards from our boats. We also place and remove all theswim buoys along Seaside’s coastline.6 MONTH STATUS: We did put out all the swim buoys at Seaside Park and Pleasure Beach.
7) Continue education of water related vessels for the public on water safety.6 MONTH STATUS: We have handouts we give boaters explaining boater safety.
8) Continue to support the Marine Police and Fire units.6 MONTH STATUS: We are always in communication with Police and Fire Departments concerningSafety, grants, Training and Dock Maintenance.
9) We will continue to work with Region 1 ConOps-LIS to obtain Homeland Security Grants andTraining.6 MONTH STATUS: We are continually attending the ConOps meetings to stay on top of grantsoffered and communication with the USCG.
10) Work with USCG (United States Coast Guard) updating Search and Rescue methods.6 MONTH STATUS: We are always in contact with the USCG concerning safety andnavigation hazards.
364
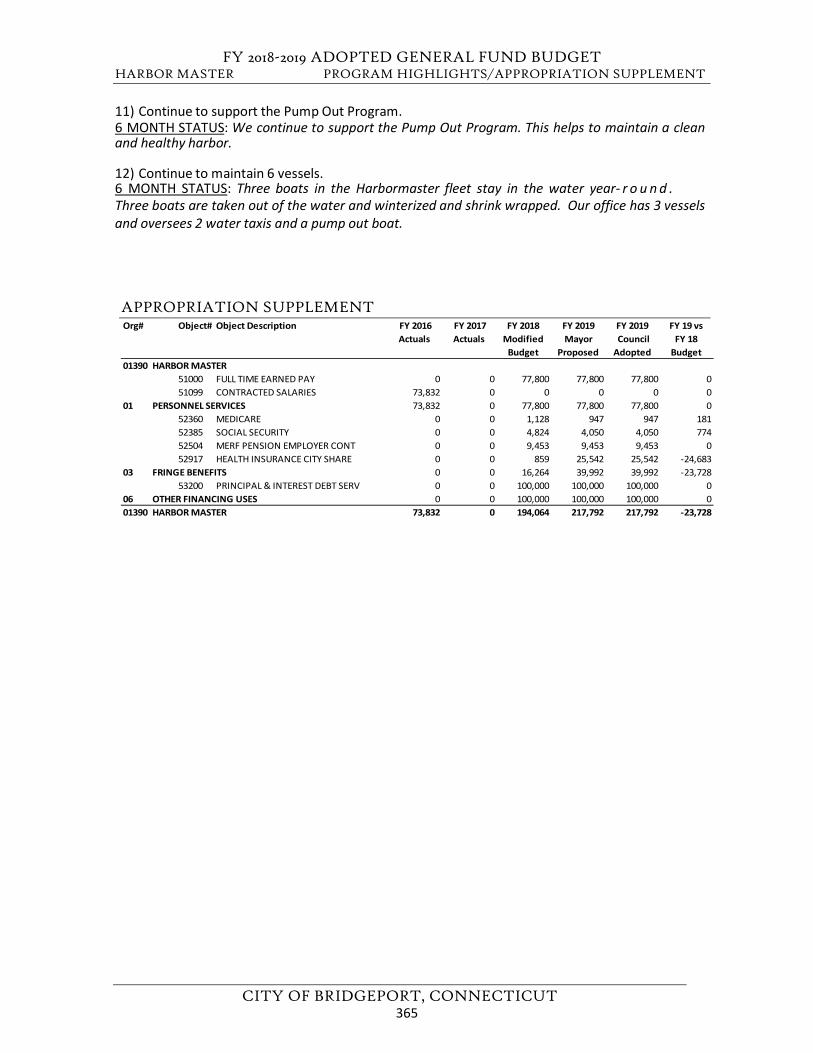
FY 2018-2019 ADOPTED GENERAL FUND BUDGET HARBOR MASTER PROGRAM HIGHLIGHTS/APPROPRIATION SUPPLEMENT
CITY OF BRIDGEPORT, CONNECTICUT
11) Continue to support the Pump Out Program.6 MONTH STATUS: We continue to support the Pump Out Program. This helps to maintain a cleanand healthy harbor.
12) Continue to maintain 6 vessels.6 MONTH STATUS: Three boats in the Harbormaster fleet stay in the water year- r o u n d .Three boats are taken out of the water and winterized and shrink wrapped. Our office has 3 vesselsand oversees 2 water taxis and a pump out boat.
APPROPRIATION SUPPLEMENT Org# Object# Object Description FY 2016
Actuals FY 2017 Actuals
FY 2018 Modified
Budget
FY 2019Mayor
Proposed
FY 2019 Council Adopted
FY 19 vs FY 18
Budget01390 HARBOR MASTER
51000 FULL TIME EARNED PAY 0 0 77,800 77,800 77,800 051099 CONTRACTED SALARIES 73,832 0 0 0 0 0
01 PERSONNEL SERVICES 73,832 0 77,800 77,800 77,800 052360 MEDICARE 0 0 1,128 947 947 18152385 SOCIAL SECURITY 0 0 4,824 4,050 4,050 77452504 MERF PENSION EMPLOYER CONT 0 0 9,453 9,453 9,453 052917 HEALTH INSURANCE CITY SHARE 0 0 859 25,542 25,542 -24,683
03 FRINGE BENEFITS 0 0 16,264 39,992 39,992 -23,72853200 PRINCIPAL & INTEREST DEBT SERV 0 0 100,000 100,000 100,000 0
06 OTHER FINANCING USES 0 0 100,000 100,000 100,000 001390 HARBOR MASTER 73,832 0 194,064 217,792 217,792 -23,728
365

FY 2018-2019 ADOPTED GENERAL FUND BUDGET
CITY OF BRIDGEPORT, CONNECTICUT
This page left blank intentionally.
366
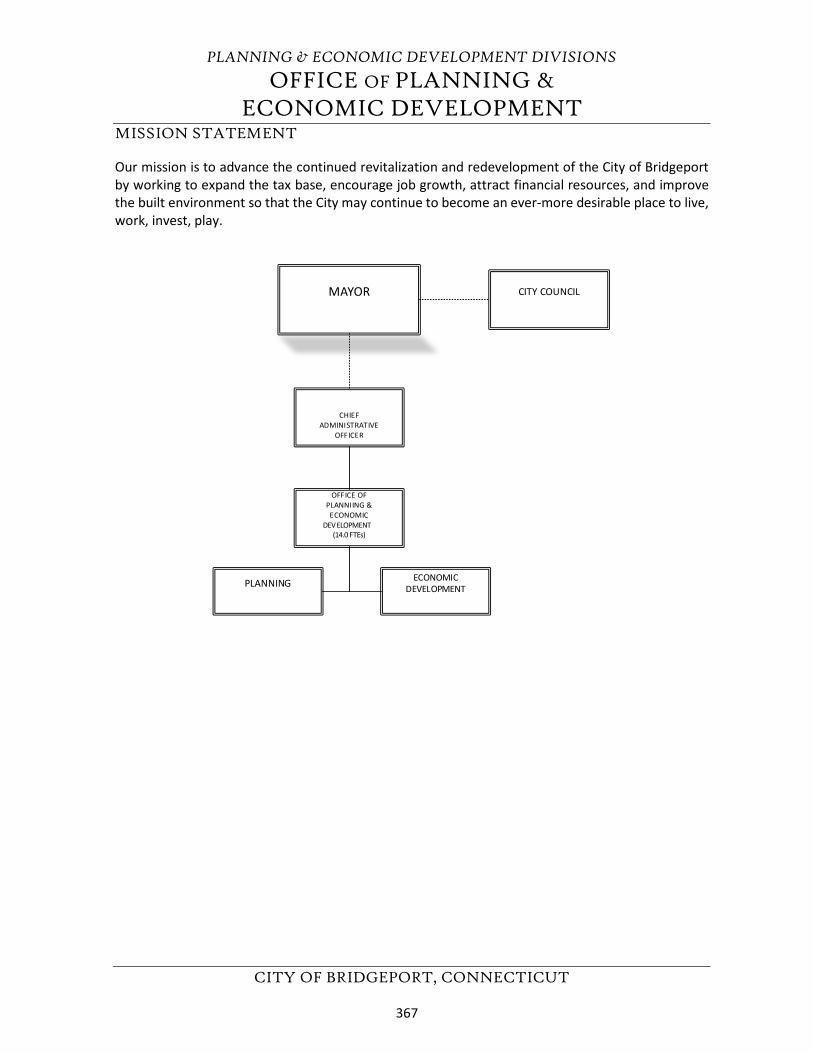
PLANNING & ECONOMIC DEVELOPMENT DIVISIONS
OFFICE OF PLANNING &ECONOMIC DEVELOPMENT
CITY OF BRIDGEPORT, CONNECTICUT
MISSION STATEMENT
Our mission is to advance the continued revitalization and redevelopment of the City of Bridgeport by working to expand the tax base, encourage job growth, attract financial resources, and improve the built environment so that the City may continue to become an ever-more desirable place to live, work, invest, play.
MAYOR
CHIEF ADMINISTRATIVE
OFFICER
CITY COUNCIL
OFFICE OF PLANNIING & ECONOMIC
DEVELOPMENT(14.0 FTEs)
PLANNING ECONOMIC DEVELOPMENT
367
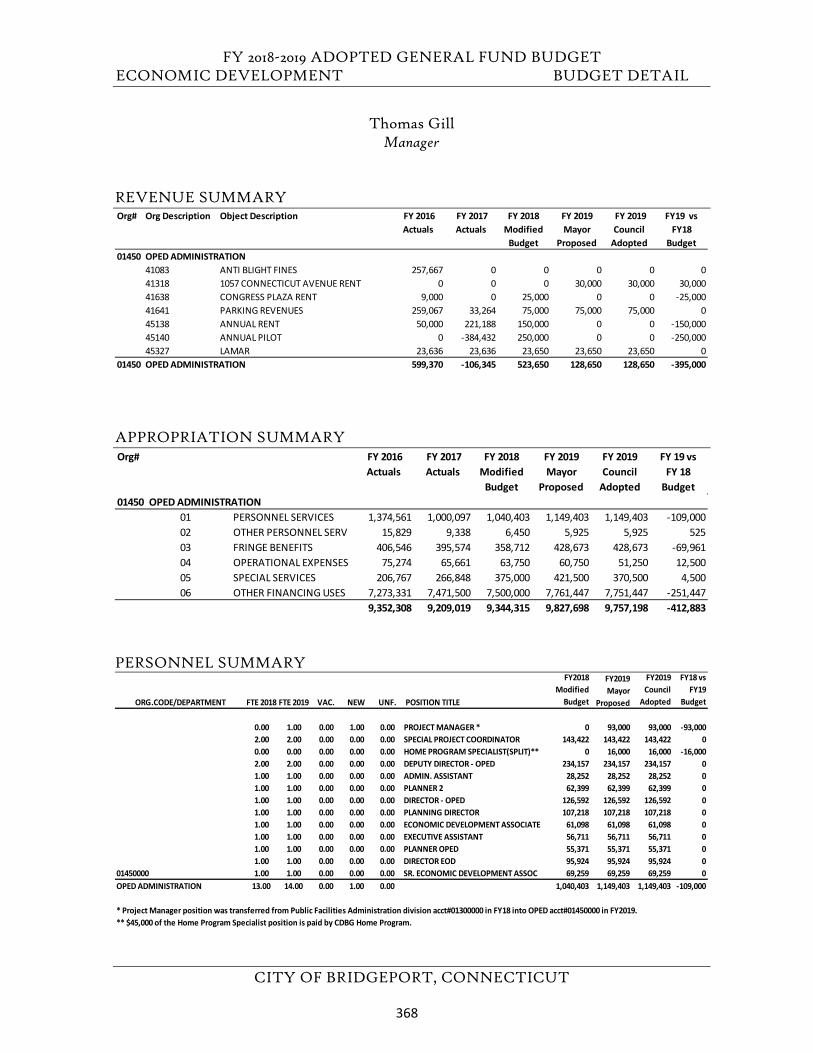
FY 2018-2019 ADOPTED GENERAL FUND BUDGET ECONOMIC DEVELOPMENT BUDGET DETAIL
CITY OF BRIDGEPORT, CONNECTICUT
Thomas Gill Manager
REVENUE SUMMARY
APPROPRIATION SUMMARY
PERSONNEL SUMMARY
Org# Org Description Object Description FY 2016 Actuals
FY 2017 Actuals
FY 2018 Modified
Budget
FY 2019 Mayor
Proposed
FY 2019 Council
Adopted
FY19 vs FY18
Budget01450 OPED ADMINISTRATION
41083 ANTI BLIGHT FINES 257,667 0 0 0 0 041318 1057 CONNECTICUT AVENUE RENT 0 0 0 30,000 30,000 30,00041638 CONGRESS PLAZA RENT 9,000 0 25,000 0 0 -25,00041641 PARKING REVENUES 259,067 33,264 75,000 75,000 75,000 045138 ANNUAL RENT 50,000 221,188 150,000 0 0 -150,00045140 ANNUAL PILOT 0 -384,432 250,000 0 0 -250,00045327 LAMAR 23,636 23,636 23,650 23,650 23,650 0
01450 OPED ADMINISTRATION 599,370 -106,345 523,650 128,650 128,650 -395,000
Org# FY 2016 Actuals
FY 2017 Actuals
FY 2018 Modified
Budget
FY 2019 Mayor
Proposed
FY 2019 Council
Adopted
FY 19 vs FY 18
Budget01450 OPED ADMINISTRATION
01 PERSONNEL SERVICES 1,374,561 1,000,097 1,040,403 1,149,403 1,149,403 -109,00002 OTHER PERSONNEL SERV 15,829 9,338 6,450 5,925 5,925 52503 FRINGE BENEFITS 406,546 395,574 358,712 428,673 428,673 -69,96104 OPERATIONAL EXPENSES 75,274 65,661 63,750 60,750 51,250 12,50005 SPECIAL SERVICES 206,767 266,848 375,000 421,500 370,500 4,50006 OTHER FINANCING USES 7,273,331 7,471,500 7,500,000 7,761,447 7,751,447 -251,447
9,352,308 9,209,019 9,344,315 9,827,698 9,757,198 -412,883
ORG.CODE/DEPARTMENT FTE 2018 FTE 2019 VAC. NEW UNF. POSITION TITLE
FY2018 Modified
Budget
FY2019 Mayor
Proposed
FY2019 Council
Adopted
FY18 vs FY19
Budget
0.00 1.00 0.00 1.00 0.00 PROJECT MANAGER * 0 93,000 93,000 -93,0002.00 2.00 0.00 0.00 0.00 SPECIAL PROJECT COORDINATOR 143,422 143,422 143,422 00.00 0.00 0.00 0.00 0.00 HOME PROGRAM SPECIALIST(SPLIT)** 0 16,000 16,000 -16,0002.00 2.00 0.00 0.00 0.00 DEPUTY DIRECTOR - OPED 234,157 234,157 234,157 01.00 1.00 0.00 0.00 0.00 ADMIN. ASSISTANT 28,252 28,252 28,252 01.00 1.00 0.00 0.00 0.00 PLANNER 2 62,399 62,399 62,399 01.00 1.00 0.00 0.00 0.00 DIRECTOR - OPED 126,592 126,592 126,592 01.00 1.00 0.00 0.00 0.00 PLANNING DIRECTOR 107,218 107,218 107,218 01.00 1.00 0.00 0.00 0.00 ECONOMIC DEVELOPMENT ASSOCIATE 61,098 61,098 61,098 01.00 1.00 0.00 0.00 0.00 EXECUTIVE ASSISTANT 56,711 56,711 56,711 01.00 1.00 0.00 0.00 0.00 PLANNER OPED 55,371 55,371 55,371 01.00 1.00 0.00 0.00 0.00 DIRECTOR EOD 95,924 95,924 95,924 0
01450000 1.00 1.00 0.00 0.00 0.00 SR. ECONOMIC DEVELOPMENT ASSOC 69,259 69,259 69,259 0OPED ADMINISTRATION 13.00 14.00 0.00 1.00 0.00 1,040,403 1,149,403 1,149,403 -109,000
* Project Manager position was transferred from Public Facilities Administration division acct#01300000 in FY18 into OPED acct#01450000 in FY2019.** $45,000 of the Home Program Specialist position is paid by CDBG Home Program.
368
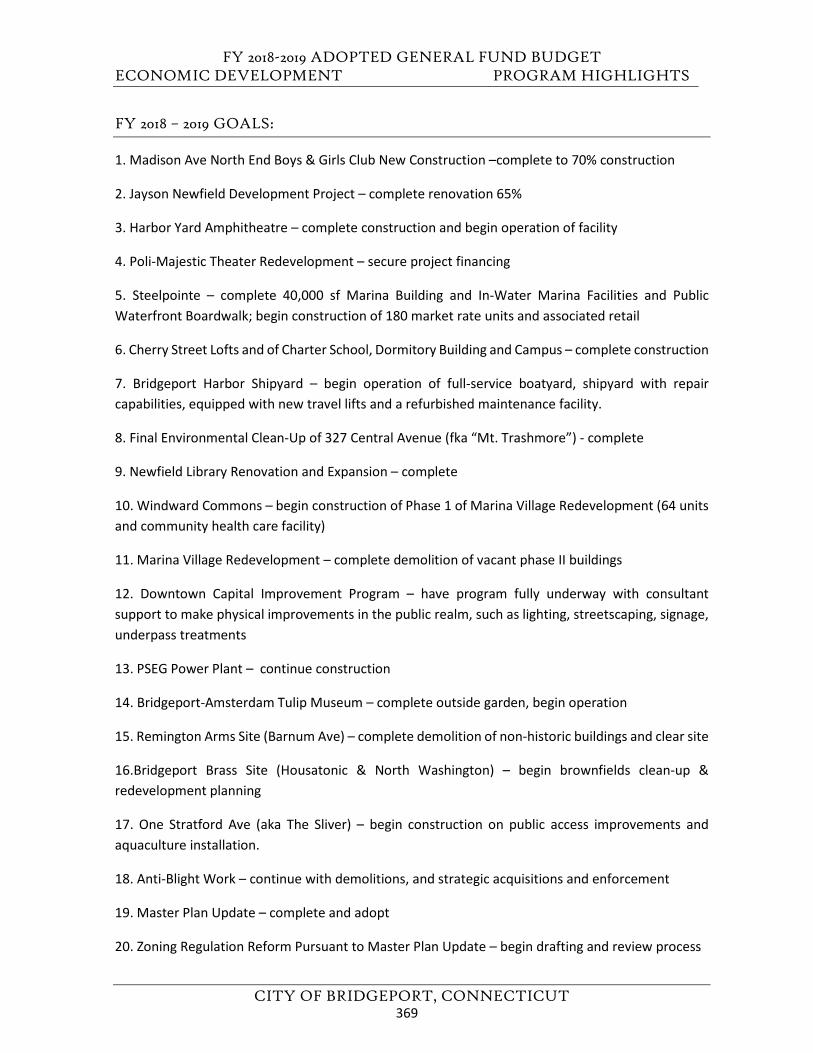
FY 2018-2019 ADOPTED GENERAL FUND BUDGET ECONOMIC DEVELOPMENT PROGRAM HIGHLIGHTS
CITY OF BRIDGEPORT, CONNECTICUT
FY 2018 – 2019 GOALS:
1. Madison Ave North End Boys & Girls Club New Construction –complete to 70% construction
2. Jayson Newfield Development Project – complete renovation 65%
3. Harbor Yard Amphitheatre – complete construction and begin operation of facility
4. Poli-Majestic Theater Redevelopment – secure project financing
5. Steelpointe – complete 40,000 sf Marina Building and In-Water Marina Facilities and PublicWaterfront Boardwalk; begin construction of 180 market rate units and associated retail
6. Cherry Street Lofts and of Charter School, Dormitory Building and Campus – complete construction
7. Bridgeport Harbor Shipyard – begin operation of full-service boatyard, shipyard with repaircapabilities, equipped with new travel lifts and a refurbished maintenance facility.
8. Final Environmental Clean-Up of 327 Central Avenue (fka “Mt. Trashmore”) - complete
9. Newfield Library Renovation and Expansion – complete
10. Windward Commons – begin construction of Phase 1 of Marina Village Redevelopment (64 unitsand community health care facility)
11. Marina Village Redevelopment – complete demolition of vacant phase II buildings
12. Downtown Capital Improvement Program – have program fully underway with consultantsupport to make physical improvements in the public realm, such as lighting, streetscaping, signage,underpass treatments
13. PSEG Power Plant – continue construction
14. Bridgeport-Amsterdam Tulip Museum – complete outside garden, begin operation
15. Remington Arms Site (Barnum Ave) – complete demolition of non-historic buildings and clear site
16.Bridgeport Brass Site (Housatonic & North Washington) – begin brownfields clean-up &redevelopment planning
17. One Stratford Ave (aka The Sliver) – begin construction on public access improvements andaquaculture installation.
18. Anti-Blight Work – continue with demolitions, and strategic acquisitions and enforcement
19. Master Plan Update – complete and adopt
20. Zoning Regulation Reform Pursuant to Master Plan Update – begin drafting and review process
369
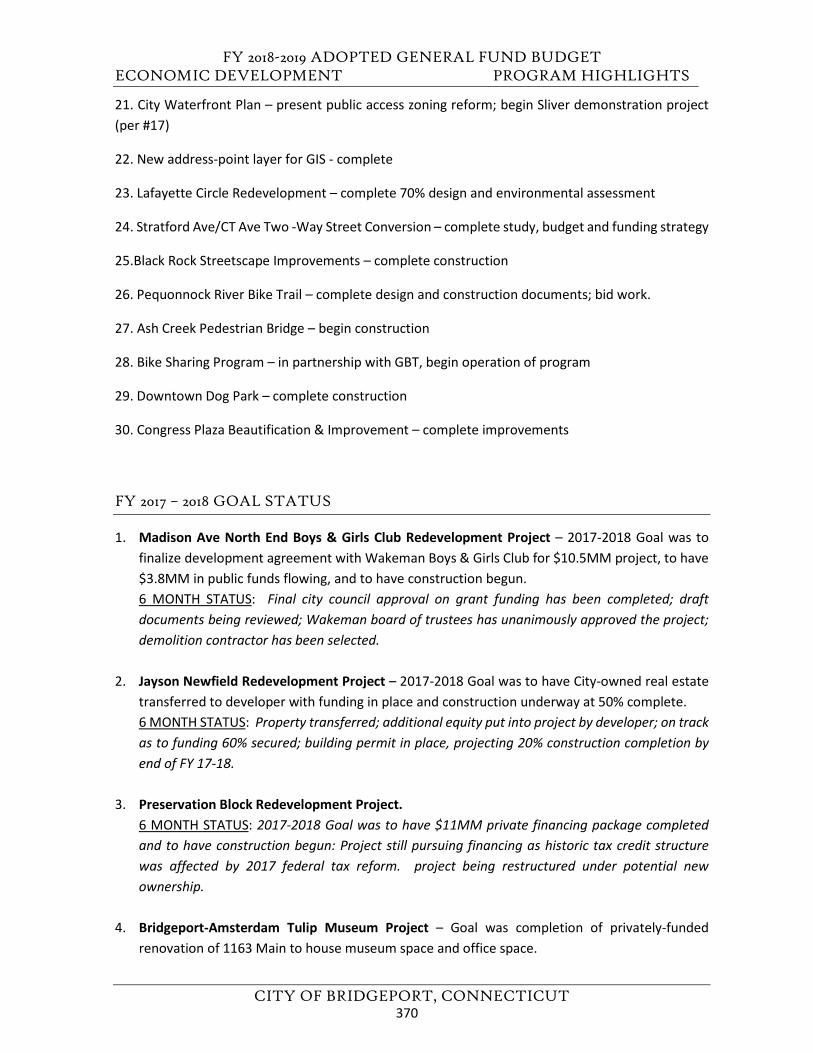
FY 2018-2019 ADOPTED GENERAL FUND BUDGET ECONOMIC DEVELOPMENT PROGRAM HIGHLIGHTS
CITY OF BRIDGEPORT, CONNECTICUT
21. City Waterfront Plan – present public access zoning reform; begin Sliver demonstration project(per #17)
22. New address-point layer for GIS - complete
23. Lafayette Circle Redevelopment – complete 70% design and environmental assessment
24. Stratford Ave/CT Ave Two -Way Street Conversion – complete study, budget and funding strategy
25.Black Rock Streetscape Improvements – complete construction
26. Pequonnock River Bike Trail – complete design and construction documents; bid work.
27. Ash Creek Pedestrian Bridge – begin construction
28. Bike Sharing Program – in partnership with GBT, begin operation of program
29. Downtown Dog Park – complete construction
30. Congress Plaza Beautification & Improvement – complete improvements
FY 2017 – 2018 GOAL STATUS
1. Madison Ave North End Boys & Girls Club Redevelopment Project – 2017-2018 Goal was tofinalize development agreement with Wakeman Boys & Girls Club for $10.5MM project, to have$3.8MM in public funds flowing, and to have construction begun.6 MONTH STATUS: Final city council approval on grant funding has been completed; draftdocuments being reviewed; Wakeman board of trustees has unanimously approved the project;demolition contractor has been selected.
2. Jayson Newfield Redevelopment Project – 2017-2018 Goal was to have City-owned real estatetransferred to developer with funding in place and construction underway at 50% complete.6 MONTH STATUS: Property transferred; additional equity put into project by developer; on trackas to funding 60% secured; building permit in place, projecting 20% construction completion byend of FY 17-18.
3. Preservation Block Redevelopment Project.6 MONTH STATUS: 2017-2018 Goal was to have $11MM private financing package completedand to have construction begun: Project still pursuing financing as historic tax credit structurewas affected by 2017 federal tax reform. project being restructured under potential newownership.
4. Bridgeport-Amsterdam Tulip Museum Project – Goal was completion of privately-fundedrenovation of 1163 Main to house museum space and office space.
370
FY 2018-2019 ADOPTED GENERAL FUND BUDGET ECONOMIC DEVELOPMENT PROGRAM HIGHLIGHTS
CITY OF BRIDGEPORT, CONNECTICUT
6 MONTH STATUS: Status of 1163 main street it that renovation has been completed as projected. complementary goal was completion of demolition of adjacent structure at 1149 main street to allow for parking and outdoor garden. Status of 1149 main street is that demolition is currently being bid and will be completed as projected in FY 18.
5. Davidson Block Redevelopment Project – Goal was to have property transferred, designapproved and financing in place.6 MONTH STATUS: Is that OPED has decided that the developer was not making sufficientprogress and consequently notified the developer that OPED would grant it no furtherdevelopment rights to the project. OPED is currently marketing the site.
6. Downtown Office Development – Goal was to reach a development agreement relevant to asignificant new office development in the northern area of downtown.6 MONTH STATUS: Status is that, while OPED did not land an office use per se, OPED did negotiateand execute a development agreement that would bring a significant commercial presence (inthe form of a hotel) to the theater buildings in “Downtown North.”
7. Redevelopment of AGI Site at 141 Stratford Avenue -Goal was to demolish and clear thisabandoned factory site to prepare it for redevelopment as a desirable location situated on theedge of downtown next to Steelepointe.6 MONTH STATUS: status is that demolition and clearance have been completed and phase IIIenvironmental investigations and environmental clean-up planning is proceeding as projected.
8. Downtown North and I-95 Beautification Program – Goal was to make beautificationimprovements and to enforce anti-blight measures at: Congress Plaza Parking Area: TheaterBuilding Façade; 1565 RR Avenue; Cherry Street Lofts Phase II; U-Haul Building.6 MONTH STATUS: Is that work has been accomplished on schedule with Theater Facadescompleted, U-Haul Facade improvements completed with private funding; cherry street loftsboarded and painted and property transferred to private ownership; 1565 RR avenue boardedand painted with demolition and property transfer to follow; congress plaza improved at theentrance with garden wall and planting completed, with more work to come.
9. Downtown Capital Improvement Program – Goal was to have this bond-funded program underconsultant management and moving forward.6 MONTH STATUS: Status is that OPED has selected a consulting firm and has contracted withthat firm as projected and has concurrently managed the program forward with key investmentcommitments in public private development partnerships, such as with respect to the Harbor Yard Amphitheatre development.
371
FY 2018-2019 ADOPTED GENERAL FUND BUDGET ECONOMIC DEVELOPMENT PROGRAM HIGHLIGHTS
CITY OF BRIDGEPORT, CONNECTICUT
10. Newfield Library Redevelopment (formerly known as Civic Block Library Development). Goal was to have construction begun. 6 MONTH STATUS: Status is that the $5.5mm renovation and expansion of the Newfield library is on track as projected for the commencement of construction.
11. Seaview Plaza Development. Goal was to have construction begun.
6 MONTH STATUS: Status is that the project as orginally designed and approved by the planning and zoning commission is currently being reconsidered in light of MGM’S interest in this site for the location of a proposed MGM-Bridgeport Casino Resort.
FY 2017 – 2018 ADDITIONAL ACCOMPLISHMENTS
1. Issued eight (8) RFP and RFQs and made selections for Development: Water-Dependent Shipyard Redevelopment; Harbor Yard Redevelopment; Poli-Majestic Theater Building and Adjacent Downtown Properties; One Stratford Avenue Water-Dependent Use (aka “The Sliver”); Downtown Capital Improvement Program Consultant; Environmental Assessment & Remediation Consultant; GIS Consultant Services; Master Plan Update
2. Completed Development and Operating Agreement for Renovation of Harbor Yard Ballpark into $15MM Harbor Yard Amphitheater to be developed by Live Nation and Harbor Yard Amphitheatre.
3. Commencement of Construction on Cherry Street Lofts Project – Conversion of former Bassick facility into approximately 150 units along Railroad Avenue, approximately $50MM.
4. Complettion of Crescent Crossings Phase II – 84 units, East Side, $34 MM.
5. Completion of Security Building (HSW Complex) Renovation by Spinnaker- $11MM
6. Completion of McLevy Square Redevelopment by Forstone Capital - $18MM
7. Worked Closely with University of Bridgeport, Sacred Heart University, Housatonic Community College in support of their developments
8. Supported public-private partnership with JHM for financing of Windward Commons (64 units and community health care facility) as part of Marina Village Redevelopment
9. Supported Steelepointe Marina Building Development (35,000 sf)
10. Supported BNT with HOME funding on 515 West Avenue New Construction (48 units, $11MM)
11. Continued to support funding applications and business development plan for thermal loop project in South End.
12. Worked closely with PSEG relative to building permits and staging areas for $550MM Natural Gas Turbine Power Plant in association with decommissioning of coal plant.
372
FY 2018-2019 ADOPTED GENERAL FUND BUDGET ECONOMIC DEVELOPMENT PROGRAM HIGHLIGHTS
CITY OF BRIDGEPORT, CONNECTICUT
13. Supported Ginsburg Development Corporation in refinancing to allow for new capital investment at City Trust, Arcade, 144 Golden Hill.
14. Supported Private-Sector Completion of Historic Renovation of 1163 Main Street (for future Bridgeport-Amsterdam Tulip Museum)
15. Congress Street Bridge - Secured City Bonding of $12MM; applied for and received Coast Guard approval of advanced-permit; introducing a bill through Congress to decommission channel on Pequonnock River to allow for fixed replacement bridge.
16. Worked with Finance Department, Office of Policy Management in support of City presentation to Bonding Rating Agencies
17. Worked with Public Facilities and Anti-Blight Committee to complete 12 anti-blight demolitions.
18. Continued to support specific business retention and expansion efforts, including managing the City’s Enterprise Zone Program which has resulted to date in the retention or creation of approximately 2000 jobs.
19. Oversaw and supported Bridgeport Port Authority operations including managing the Shipyard RFP and negotiating the lease and/or sale of Port Authority property.
373
FY 2018-2019 ADOPTED GENERAL FUND BUDGET ECONOMIC DEVELOPMENT APPROPRIATION SUPPLEMENT
CITY OF BRIDGEPORT, CONNECTICUT
APPROPRIATION SUPPLEMENT Org# Object# Object Description FY 2016
Actuals FY 2017 Actuals
FY 2018 Modified
Budget
FY 2019Mayor
Proposed
FY 2019 Council Adopted
FY 19 vs FY 18
Budget01450 OPED ADMINISTRATION
51000 FULL TIME EARNED PAY 1,359,075 970,097 1,040,403 1,149,403 1,149,403 -109,00051034 FT BONUS - CONTRACTUAL PAY 0 30,000 0 0 0 051099 CONTRACTED SALARIES 15,486 0 0 0 0 0
01 PERSONNEL SERVICES 1,374,561 1,000,097 1,040,403 1,149,403 1,149,403 -109,00051140 LONGEVITY PAY 9,038 9,338 6,450 5,925 5,925 52551156 UNUSED VACATION TIME PAYOU 6,792 0 0 0 0 0
02 OTHER PERSONNEL SERV 15,829 9,338 6,450 5,925 5,925 52552360 MEDICARE 17,967 13,629 14,017 15,160 15,160 -1,14352385 SOCIAL SECURITY 5,663 -77 3,096 8,041 8,041 -4,94552399 UNIFORM ALLOWANCE 400 200 400 400 400 052504 MERF PENSION EMPLOYER CONT 134,770 106,877 127,193 140,374 140,374 -13,18152917 HEALTH INSURANCE CITY SHARE 247,746 274,945 214,006 264,698 264,698 -50,692
03 FRINGE BENEFITS 406,546 395,574 358,712 428,673 428,673 -69,96153050 PROPERTY RENTAL/LEASE 40,000 25,000 0 0 0 053605 MEMBERSHIP/REGISTRATION FEES 5,000 3,683 4,000 5,000 5,000 -1,00053610 TRAINING SERVICES 514 1,669 2,500 2,500 2,500 053705 ADVERTISING SERVICES 15,872 15,270 25,000 25,000 20,000 5,00053750 TRAVEL EXPENSES -352 30 1,000 5,000 3,000 -2,00053905 EMP TUITION AND/OR TRAVEL REIM 1,710 3,339 4,000 5,000 2,500 1,50054555 COMPUTER SUPPLIES 0 0 500 500 500 054640 HARDWARE/TOOLS 164 295 750 750 750 054675 OFFICE SUPPLIES 6,666 11,651 13,000 7,000 7,000 6,00054705 SUBSCRIPTIONS 95 0 0 0 0 055155 OFFICE EQUIPMENT RENTAL/LEAS 5,605 4,724 13,000 10,000 10,000 3,000
04 OPERATIONAL EXPENSES 75,274 65,661 63,750 60,750 51,250 12,50056010 ENGINEERING SERVICES 14,021 23,555 40,000 30,000 30,000 10,00056085 FOOD SERVICES 7,376 2,526 6,000 3,000 3,000 3,00056095 APPRAISAL SERVICES 6,173 25,675 30,000 50,000 50,000 -20,00056110 FINANCIAL SERVICES 1,578 0 46,000 56,000 45,000 1,00056130 LEGAL SERVICES 9,167 0 0 0 0 056160 MARKETING SERVICES 74,718 142,896 175,000 210,000 170,000 5,00056165 MANAGEMENT SERVICES 2,841 0 0 0 0 056175 OFFICE EQUIPMENT MAINT SRVCS 7,712 5,069 7,000 4,000 4,000 3,00056180 OTHER SERVICES 78,871 66,344 64,000 65,000 65,000 -1,00059010 MAILING SERVICES 924 783 2,000 1,000 1,000 1,00059015 PRINTING SERVICES 3,387 0 5,000 2,500 2,500 2,500
05 SPECIAL SERVICES 206,767 266,848 375,000 421,500 370,500 4,50053200 PRINCIPAL & INTEREST DEBT SERV 7,203,618 7,390,000 7,390,000 7,651,447 7,651,447 -261,44759500 SUPPORTIVE CONTRIBUTIONS 69,713 81,500 110,000 110,000 100,000 10,000
06 OTHER FINANCING USES 7,273,331 7,471,500 7,500,000 7,761,447 7,751,447 -251,44701450 OPED ADMINISTRATION 9,352,308 9,209,019 9,344,315 9,827,698 9,757,198 -412,883
374
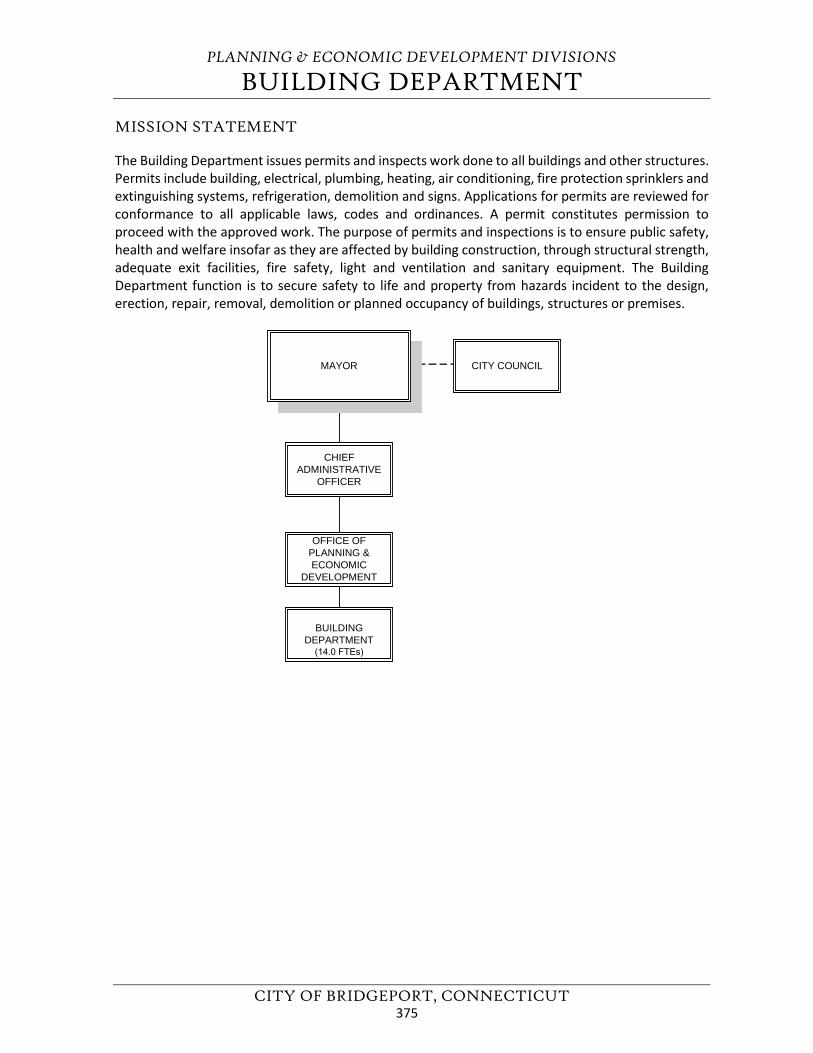
PLANNING & ECONOMIC DEVELOPMENT DIVISIONS
BUILDING DEPARTMENT
CITY OF BRIDGEPORT, CONNECTICUT
MISSION STATEMENT
The Building Department issues permits and inspects work done to all buildings and other structures. Permits include building, electrical, plumbing, heating, air conditioning, fire protection sprinklers and extinguishing systems, refrigeration, demolition and signs. Applications for permits are reviewed for conformance to all applicable laws, codes and ordinances. A permit constitutes permission to proceed with the approved work. The purpose of permits and inspections is to ensure public safety, health and welfare insofar as they are affected by building construction, through structural strength, adequate exit facilities, fire safety, light and ventilation and sanitary equipment. The Building Department function is to secure safety to life and property from hazards incident to the design, erection, repair, removal, demolition or planned occupancy of buildings, structures or premises.
CHIEFADMINISTRATIVE
OFFICER
OFFICE OFPLANNING &ECONOMIC
DEVELOPMENT
MAYOR CITY COUNCIL
BUILDINGDEPARTMENT
(14.0 FTEs)
375
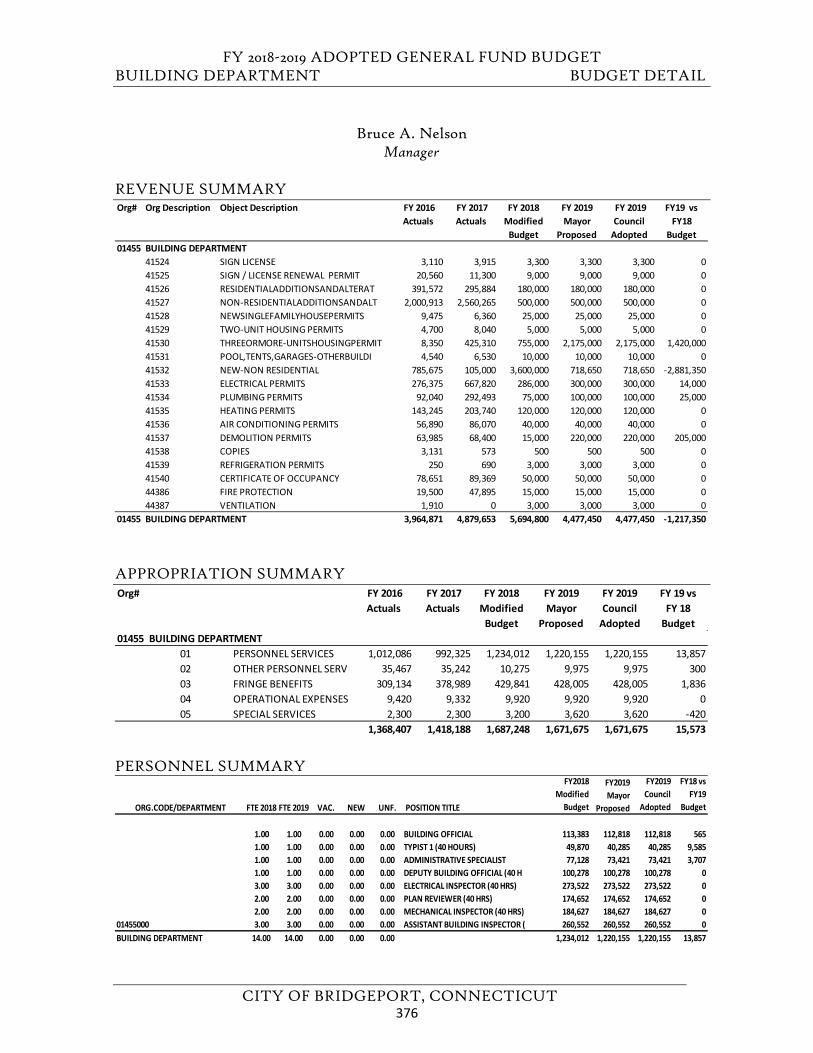
FY 2018-2019 ADOPTED GENERAL FUND BUDGET BUILDING DEPARTMENT BUDGET DETAIL
CITY OF BRIDGEPORT, CONNECTICUT
Bruce A. Nelson Manager
REVENUE SUMMARY
APPROPRIATION SUMMARY
PERSONNEL SUMMARY
Org# Org Description Object Description FY 2016 Actuals
FY 2017 Actuals
FY 2018 Modified
Budget
FY 2019 Mayor
Proposed
FY 2019 Council
Adopted
FY19 vs FY18
Budget01455 BUILDING DEPARTMENT
41524 SIGN LICENSE 3,110 3,915 3,300 3,300 3,300 041525 SIGN / LICENSE RENEWAL PERMIT 20,560 11,300 9,000 9,000 9,000 041526 RESIDENTIALADDITIONSANDALTERAT 391,572 295,884 180,000 180,000 180,000 041527 NON-RESIDENTIALADDITIONSANDALT 2,000,913 2,560,265 500,000 500,000 500,000 041528 NEWSINGLEFAMILYHOUSEPERMITS 9,475 6,360 25,000 25,000 25,000 041529 TWO-UNIT HOUSING PERMITS 4,700 8,040 5,000 5,000 5,000 041530 THREEORMORE-UNITSHOUSINGPERMIT 8,350 425,310 755,000 2,175,000 2,175,000 1,420,00041531 POOL,TENTS,GARAGES-OTHERBUILDI 4,540 6,530 10,000 10,000 10,000 041532 NEW-NON RESIDENTIAL 785,675 105,000 3,600,000 718,650 718,650 -2,881,35041533 ELECTRICAL PERMITS 276,375 667,820 286,000 300,000 300,000 14,00041534 PLUMBING PERMITS 92,040 292,493 75,000 100,000 100,000 25,00041535 HEATING PERMITS 143,245 203,740 120,000 120,000 120,000 041536 AIR CONDITIONING PERMITS 56,890 86,070 40,000 40,000 40,000 041537 DEMOLITION PERMITS 63,985 68,400 15,000 220,000 220,000 205,00041538 COPIES 3,131 573 500 500 500 041539 REFRIGERATION PERMITS 250 690 3,000 3,000 3,000 041540 CERTIFICATE OF OCCUPANCY 78,651 89,369 50,000 50,000 50,000 044386 FIRE PROTECTION 19,500 47,895 15,000 15,000 15,000 044387 VENTILATION 1,910 0 3,000 3,000 3,000 0
01455 BUILDING DEPARTMENT 3,964,871 4,879,653 5,694,800 4,477,450 4,477,450 -1,217,350
Org# FY 2016 Actuals
FY 2017 Actuals
FY 2018 Modified
Budget
FY 2019 Mayor
Proposed
FY 2019 Council
Adopted
FY 19 vs FY 18
Budget01455 BUILDING DEPARTMENT
01 PERSONNEL SERVICES 1,012,086 992,325 1,234,012 1,220,155 1,220,155 13,85702 OTHER PERSONNEL SERV 35,467 35,242 10,275 9,975 9,975 30003 FRINGE BENEFITS 309,134 378,989 429,841 428,005 428,005 1,83604 OPERATIONAL EXPENSES 9,420 9,332 9,920 9,920 9,920 005 SPECIAL SERVICES 2,300 2,300 3,200 3,620 3,620 -420
1,368,407 1,418,188 1,687,248 1,671,675 1,671,675 15,573
ORG.CODE/DEPARTMENT FTE 2018 FTE 2019 VAC. NEW UNF. POSITION TITLE
FY2018 Modified
Budget
FY2019 Mayor
Proposed
FY2019 Council
Adopted
FY18 vs FY19
Budget
1.00 1.00 0.00 0.00 0.00 BUILDING OFFICIAL 113,383 112,818 112,818 5651.00 1.00 0.00 0.00 0.00 TYPIST 1 (40 HOURS) 49,870 40,285 40,285 9,5851.00 1.00 0.00 0.00 0.00 ADMINISTRATIVE SPECIALIST 77,128 73,421 73,421 3,7071.00 1.00 0.00 0.00 0.00 DEPUTY BUILDING OFFICIAL (40 H 100,278 100,278 100,278 03.00 3.00 0.00 0.00 0.00 ELECTRICAL INSPECTOR (40 HRS) 273,522 273,522 273,522 02.00 2.00 0.00 0.00 0.00 PLAN REVIEWER (40 HRS) 174,652 174,652 174,652 02.00 2.00 0.00 0.00 0.00 MECHANICAL INSPECTOR (40 HRS) 184,627 184,627 184,627 0
01455000 3.00 3.00 0.00 0.00 0.00 ASSISTANT BUILDING INSPECTOR ( 260,552 260,552 260,552 0BUILDING DEPARTMENT 14.00 14.00 0.00 0.00 0.00 1,234,012 1,220,155 1,220,155 13,857
376
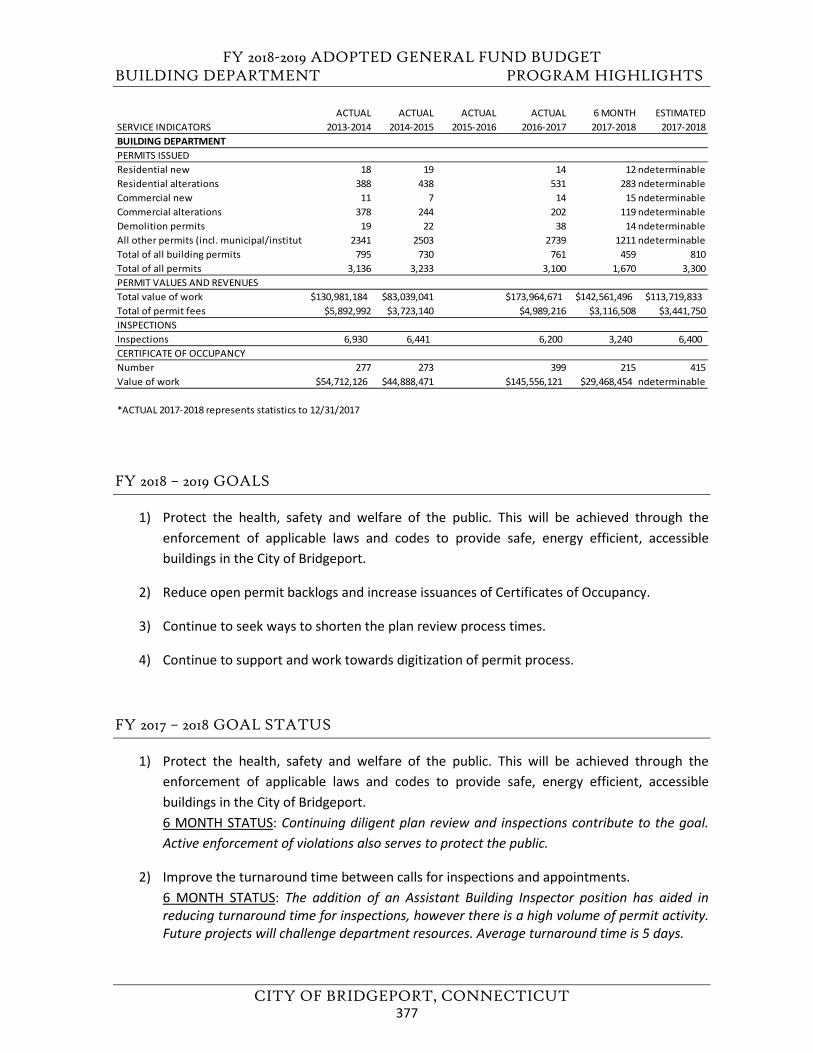
FY 2018-2019 ADOPTED GENERAL FUND BUDGET BUILDING DEPARTMENT PROGRAM HIGHLIGHTS
CITY OF BRIDGEPORT, CONNECTICUT
FY 2018 – 2019 GOALS
1) Protect the health, safety and welfare of the public. This will be achieved through theenforcement of applicable laws and codes to provide safe, energy efficient, accessiblebuildings in the City of Bridgeport.
2) Reduce open permit backlogs and increase issuances of Certificates of Occupancy.
3) Continue to seek ways to shorten the plan review process times.
4) Continue to support and work towards digitization of permit process.
FY 2017 – 2018 GOAL STATUS
1) Protect the health, safety and welfare of the public. This will be achieved through theenforcement of applicable laws and codes to provide safe, energy efficient, accessiblebuildings in the City of Bridgeport.6 MONTH STATUS: Continuing diligent plan review and inspections contribute to the goal.Active enforcement of violations also serves to protect the public.
2) Improve the turnaround time between calls for inspections and appointments.6 MONTH STATUS: The addition of an Assistant Building Inspector position has aided inreducing turnaround time for inspections, however there is a high volume of permit activity.Future projects will challenge department resources. Average turnaround time is 5 days.
ACTUAL ACTUAL ACTUAL ACTUAL 6 MONTH ESTIMATEDSERVICE INDICATORS 2013-2014 2014-2015 2015-2016 2016-2017 2017-2018 2017-2018BUILDING DEPARTMENTPERMITS ISSUEDResidential new 18 19 14 12 ndeterminableResidential alterations 388 438 531 283 ndeterminableCommercial new 11 7 14 15 ndeterminableCommercial alterations 378 244 202 119 ndeterminableDemolition permits 19 22 38 14 ndeterminableAll other permits (incl. municipal/instituti 2341 2503 2739 1211 ndeterminableTotal of all building permits 795 730 761 459 810Total of all permits 3,136 3,233 3,100 1,670 3,300PERMIT VALUES AND REVENUESTotal value of work $130,981,184 $83,039,041 $173,964,671 $142,561,496 $113,719,833Total of permit fees $5,892,992 $3,723,140 $4,989,216 $3,116,508 $3,441,750INSPECTIONS Inspections 6,930 6,441 6,200 3,240 6,400 CERTIFICATE OF OCCUPANCY Number 277 273 399 215 415Value of work $54,712,126 $44,888,471 $145,556,121 $29,468,454 ndeterminable
*ACTUAL 2017-2018 represents statistics to 12/31/2017
377
FY 2018-2019 ADOPTED GENERAL FUND BUDGET BUILDING DEPARTMENT PROGRAM HIGHLIGHTS
CITY OF BRIDGEPORT, CONNECTICUT
3) Reduce open permit backlogs and increase issuances of Certificates of Occupancy.6 MONTH STATUS: The Building Department has endeavored to reduce open permit backlogsand issue certificates of occupancy. The department has closed approximately 100 permits inaddition to Certificate of Occupancy’s issued. Permits are chosen weekly for follow-up finalinspection appointments. The necessity of having the Deputy Building Official perform planreview duties has reduced the ability to perform the necessary functions to generateadditional certificates.
4) Continue to seek ways to shorten the plan review process times.6 MONTH STATUS: The Building Department performs plan reviews in the order theapplications are received in the office. This is the only fair and equitable method however toavoid smaller projects such as pools, sheds, garages roofing and siding are reviewed weeklyto avoid delays behind larger projects.
5) Continue to support and work towards digitization of permit process.6 MONTH STATUS: The Building Department has participated in numerous meetings andprovided departmental input concerning the implementation of the proposed permittingsoftware.
FY 2017 – 2018 ADDITIONAL ACCOMPLISHMENTS
1) Responded to approximately 1200 title search/ FOI requests.2) Responded to approximately 80 complaints.
378
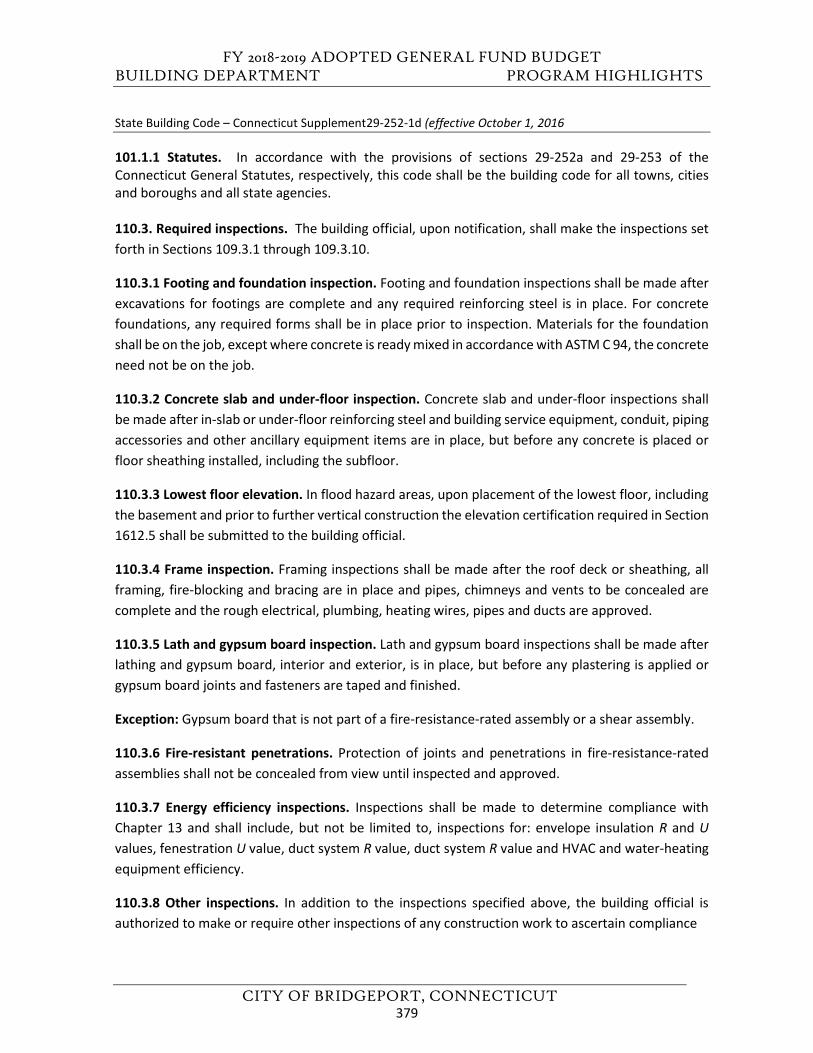
FY 2018-2019 ADOPTED GENERAL FUND BUDGET BUILDING DEPARTMENT PROGRAM HIGHLIGHTS
CITY OF BRIDGEPORT, CONNECTICUT
State Building Code – Connecticut Supplement29-252-1d (effective October 1, 2016
101.1.1 Statutes. In accordance with the provisions of sections 29-252a and 29-253 of the Connecticut General Statutes, respectively, this code shall be the building code for all towns, cities and boroughs and all state agencies.
110.3. Required inspections. The building official, upon notification, shall make the inspections set forth in Sections 109.3.1 through 109.3.10.
110.3.1 Footing and foundation inspection. Footing and foundation inspections shall be made after excavations for footings are complete and any required reinforcing steel is in place. For concrete foundations, any required forms shall be in place prior to inspection. Materials for the foundation shall be on the job, except where concrete is ready mixed in accordance with ASTM C 94, the concrete need not be on the job.
110.3.2 Concrete slab and under-floor inspection. Concrete slab and under-floor inspections shall be made after in-slab or under-floor reinforcing steel and building service equipment, conduit, piping accessories and other ancillary equipment items are in place, but before any concrete is placed or floor sheathing installed, including the subfloor.
110.3.3 Lowest floor elevation. In flood hazard areas, upon placement of the lowest floor, including the basement and prior to further vertical construction the elevation certification required in Section 1612.5 shall be submitted to the building official.
110.3.4 Frame inspection. Framing inspections shall be made after the roof deck or sheathing, all framing, fire-blocking and bracing are in place and pipes, chimneys and vents to be concealed are complete and the rough electrical, plumbing, heating wires, pipes and ducts are approved.
110.3.5 Lath and gypsum board inspection. Lath and gypsum board inspections shall be made after lathing and gypsum board, interior and exterior, is in place, but before any plastering is applied or gypsum board joints and fasteners are taped and finished.
Exception: Gypsum board that is not part of a fire-resistance-rated assembly or a shear assembly.
110.3.6 Fire-resistant penetrations. Protection of joints and penetrations in fire-resistance-rated assemblies shall not be concealed from view until inspected and approved.
110.3.7 Energy efficiency inspections. Inspections shall be made to determine compliance with Chapter 13 and shall include, but not be limited to, inspections for: envelope insulation R and U values, fenestration U value, duct system R value, duct system R value and HVAC and water-heating equipment efficiency.
110.3.8 Other inspections. In addition to the inspections specified above, the building official is authorized to make or require other inspections of any construction work to ascertain compliance
379
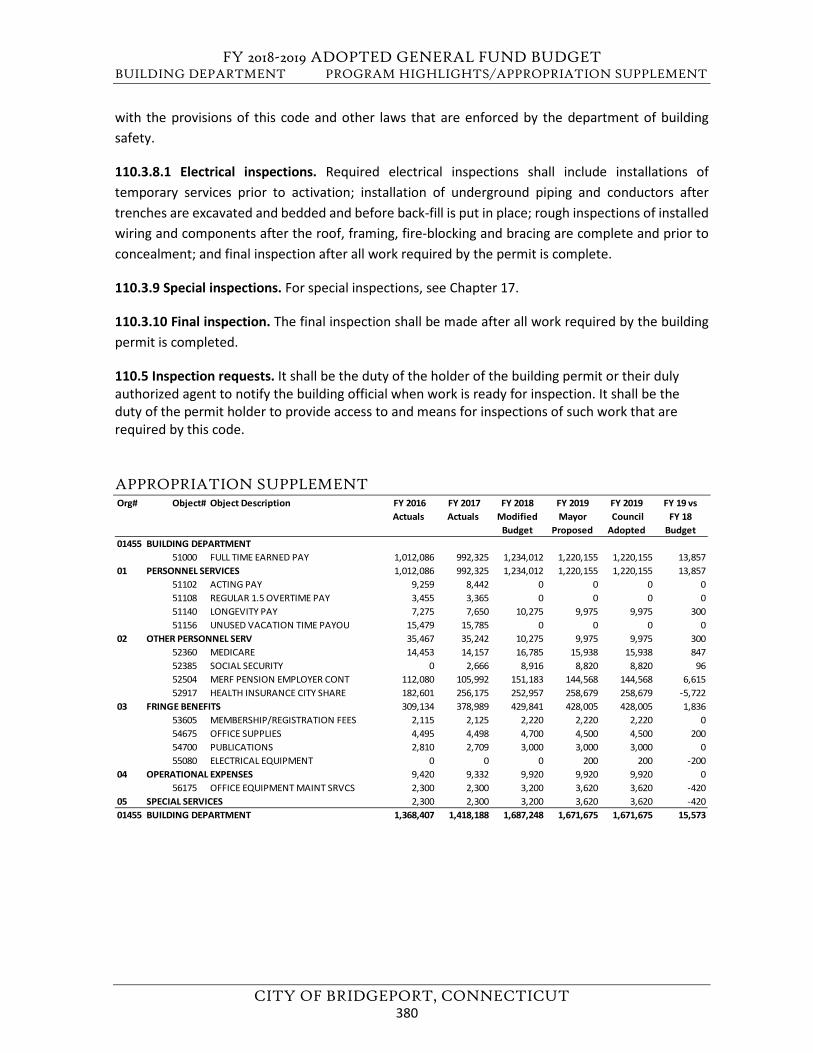
FY 2018-2019 ADOPTED GENERAL FUND BUDGET BUILDING DEPARTMENT PROGRAM HIGHLIGHTS/APPROPRIATION SUPPLEMENT
CITY OF BRIDGEPORT, CONNECTICUT
with the provisions of this code and other laws that are enforced by the department of building safety.
110.3.8.1 Electrical inspections. Required electrical inspections shall include installations of temporary services prior to activation; installation of underground piping and conductors after trenches are excavated and bedded and before back-fill is put in place; rough inspections of installed wiring and components after the roof, framing, fire-blocking and bracing are complete and prior to concealment; and final inspection after all work required by the permit is complete.
110.3.9 Special inspections. For special inspections, see Chapter 17.
110.3.10 Final inspection. The final inspection shall be made after all work required by the building permit is completed.
110.5 Inspection requests. It shall be the duty of the holder of the building permit or their duly authorized agent to notify the building official when work is ready for inspection. It shall be the duty of the permit holder to provide access to and means for inspections of such work that are required by this code.
APPROPRIATION SUPPLEMENT Org# Object# Object Description FY 2016
Actuals FY 2017 Actuals
FY 2018 Modified
Budget
FY 2019Mayor
Proposed
FY 2019 Council Adopted
FY 19 vs FY 18
Budget01455 BUILDING DEPARTMENT
51000 FULL TIME EARNED PAY 1,012,086 992,325 1,234,012 1,220,155 1,220,155 13,85701 PERSONNEL SERVICES 1,012,086 992,325 1,234,012 1,220,155 1,220,155 13,857
51102 ACTING PAY 9,259 8,442 0 0 0 051108 REGULAR 1.5 OVERTIME PAY 3,455 3,365 0 0 0 051140 LONGEVITY PAY 7,275 7,650 10,275 9,975 9,975 30051156 UNUSED VACATION TIME PAYOU 15,479 15,785 0 0 0 0
02 OTHER PERSONNEL SERV 35,467 35,242 10,275 9,975 9,975 30052360 MEDICARE 14,453 14,157 16,785 15,938 15,938 84752385 SOCIAL SECURITY 0 2,666 8,916 8,820 8,820 9652504 MERF PENSION EMPLOYER CONT 112,080 105,992 151,183 144,568 144,568 6,61552917 HEALTH INSURANCE CITY SHARE 182,601 256,175 252,957 258,679 258,679 -5,722
03 FRINGE BENEFITS 309,134 378,989 429,841 428,005 428,005 1,83653605 MEMBERSHIP/REGISTRATION FEES 2,115 2,125 2,220 2,220 2,220 054675 OFFICE SUPPLIES 4,495 4,498 4,700 4,500 4,500 20054700 PUBLICATIONS 2,810 2,709 3,000 3,000 3,000 055080 ELECTRICAL EQUIPMENT 0 0 0 200 200 -200
04 OPERATIONAL EXPENSES 9,420 9,332 9,920 9,920 9,920 056175 OFFICE EQUIPMENT MAINT SRVCS 2,300 2,300 3,200 3,620 3,620 -420
05 SPECIAL SERVICES 2,300 2,300 3,200 3,620 3,620 -42001455 BUILDING DEPARTMENT 1,368,407 1,418,188 1,687,248 1,671,675 1,671,675 15,573
380
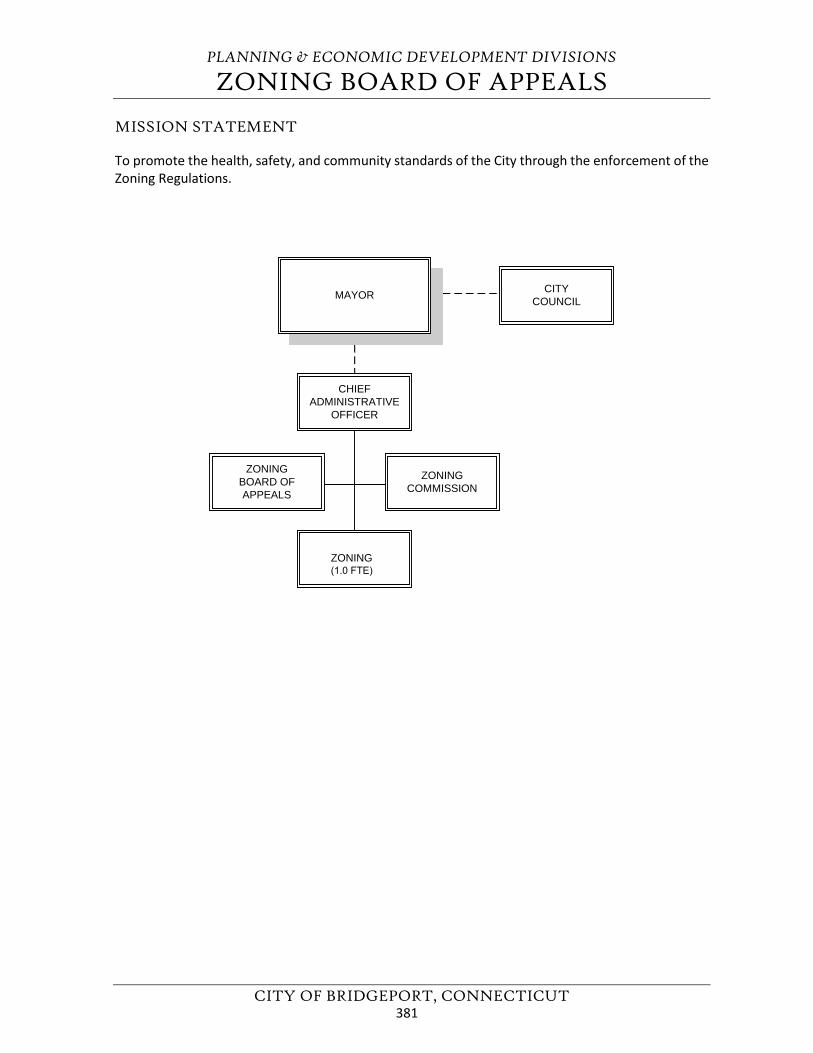
PLANNING & ECONOMIC DEVELOPMENT DIVISIONS
ZONING BOARD OF APPEALS
CITY OF BRIDGEPORT, CONNECTICUT
MISSION STATEMENT
To promote the health, safety, and community standards of the City through the enforcement of the Zoning Regulations.
CHIEFADMINISTRATIVE
OFFICER
MAYOR CITYCOUNCIL
ZONING(1.0 FTE)
ZONINGBOARD OFAPPEALS
ZONINGCOMMISSION
381
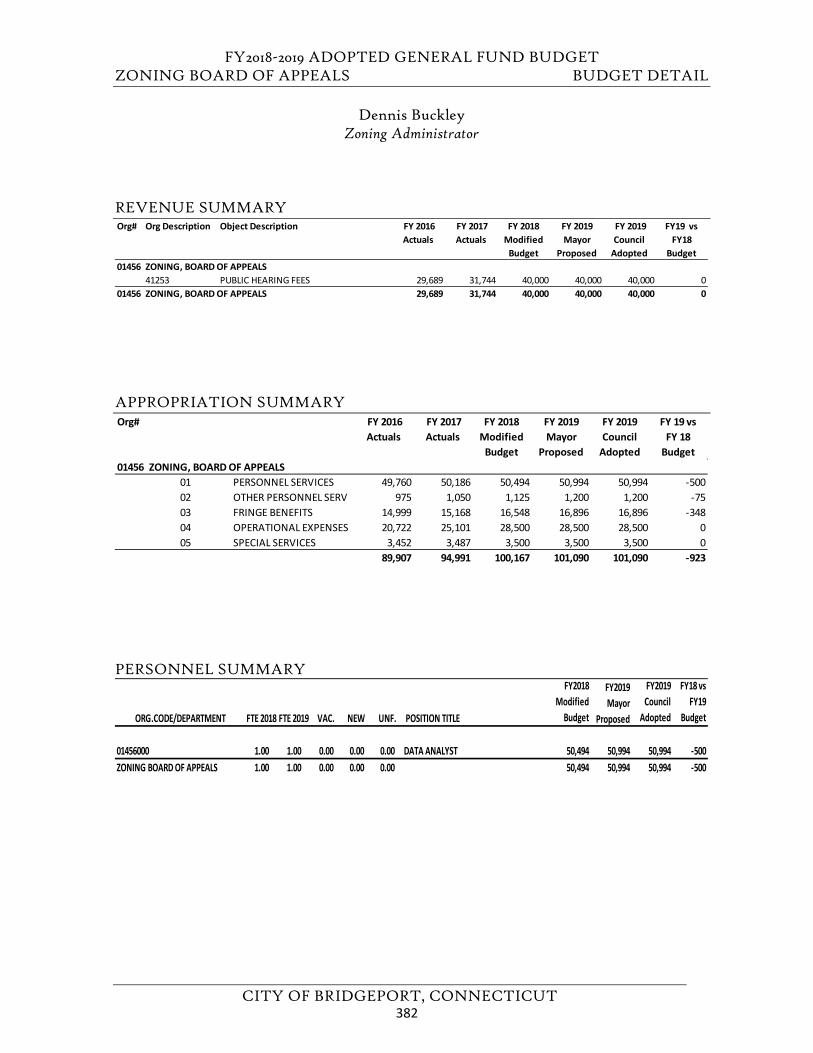
FY2018-2019 ADOPTED GENERAL FUND BUDGET ZONING BOARD OF APPEALS BUDGET DETAIL
CITY OF BRIDGEPORT, CONNECTICUT
Dennis Buckley Zoning Administrator
REVENUE SUMMARY
APPROPRIATION SUMMARY
PERSONNEL SUMMARY
Org# Org Description Object Description FY 2016 Actuals
FY 2017 Actuals
FY 2018 Modified
Budget
FY 2019 Mayor
Proposed
FY 2019 Council
Adopted
FY19 vs FY18
Budget01456 ZONING, BOARD OF APPEALS
41253 PUBLIC HEARING FEES 29,689 31,744 40,000 40,000 40,000 001456 ZONING, BOARD OF APPEALS 29,689 31,744 40,000 40,000 40,000 0
Org# FY 2016 Actuals
FY 2017 Actuals
FY 2018 Modified
Budget
FY 2019 Mayor
Proposed
FY 2019 Council
Adopted
FY 19 vs FY 18
Budget01456 ZONING, BOARD OF APPEALS
01 PERSONNEL SERVICES 49,760 50,186 50,494 50,994 50,994 -50002 OTHER PERSONNEL SERV 975 1,050 1,125 1,200 1,200 -7503 FRINGE BENEFITS 14,999 15,168 16,548 16,896 16,896 -34804 OPERATIONAL EXPENSES 20,722 25,101 28,500 28,500 28,500 005 SPECIAL SERVICES 3,452 3,487 3,500 3,500 3,500 0
89,907 94,991 100,167 101,090 101,090 -923
ORG.CODE/DEPARTMENT FTE 2018 FTE 2019 VAC. NEW UNF. POSITION TITLE
FY2018 Modified
Budget
FY2019 Mayor
Proposed
FY2019 Council
Adopted
FY18 vs FY19
Budget
01456000 1.00 1.00 0.00 0.00 0.00 DATA ANALYST 50,494 50,994 50,994 -500ZONING BOARD OF APPEALS 1.00 1.00 0.00 0.00 0.00 50,494 50,994 50,994 -500
382
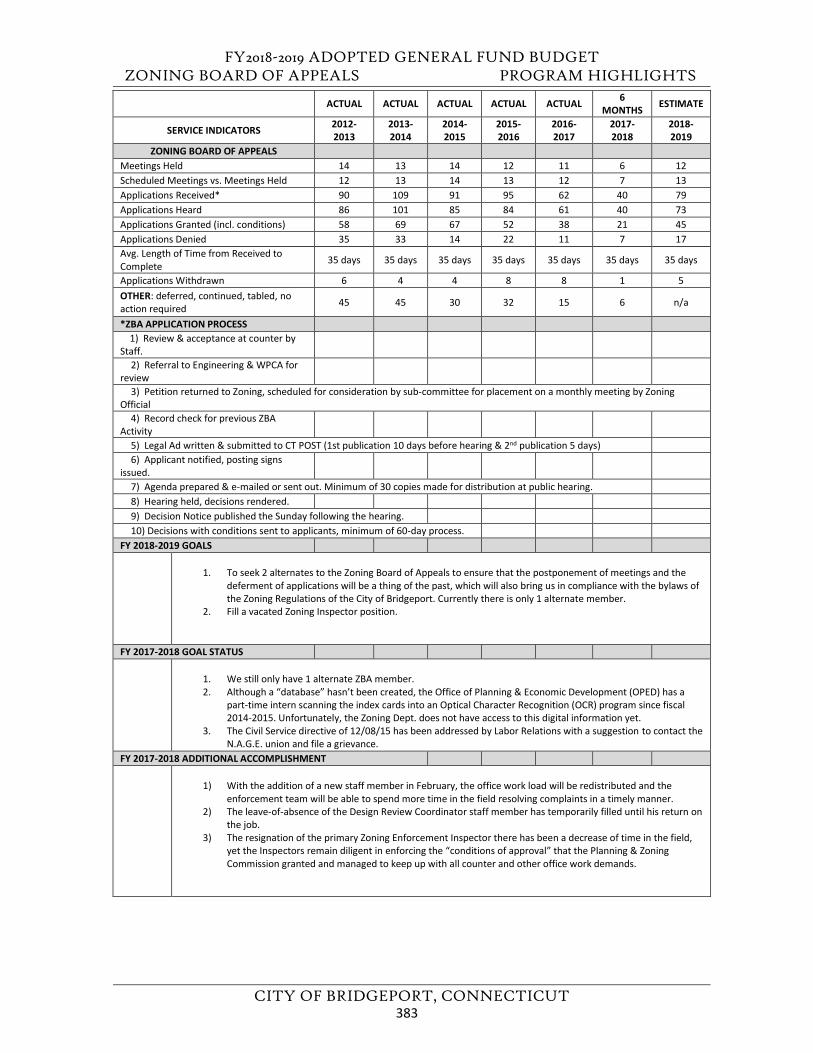
FY2018-2019 ADOPTED GENERAL FUND BUDGET ZONING BOARD OF APPEALS PROGRAM HIGHLIGHTS
CITY OF BRIDGEPORT, CONNECTICUT
ACTUAL ACTUAL ACTUAL ACTUAL ACTUAL 6 MONTHS ESTIMATE
SERVICE INDICATORS 2012-2013
2013-2014
2014-2015
2015-2016
2016-2017
2017-2018
2018-2019
ZONING BOARD OF APPEALS Meetings Held 14 13 14 12 11 6 12 Scheduled Meetings vs. Meetings Held 12 13 14 13 12 7 13 Applications Received* 90 109 91 95 62 40 79 Applications Heard 86 101 85 84 61 40 73 Applications Granted (incl. conditions) 58 69 67 52 38 21 45 Applications Denied 35 33 14 22 11 7 17 Avg. Length of Time from Received to Complete 35 days 35 days 35 days 35 days 35 days 35 days 35 days
Applications Withdrawn 6 4 4 8 8 1 5 OTHER: deferred, continued, tabled, no action required 45 45 30 32 15 6 n/a
*ZBA APPLICATION PROCESS 1) Review & acceptance at counter by
Staff. 2) Referral to Engineering & WPCA for
review 3) Petition returned to Zoning, scheduled for consideration by sub-committee for placement on a monthly meeting by Zoning
Official 4) Record check for previous ZBA
Activity 5) Legal Ad written & submitted to CT POST (1st publication 10 days before hearing & 2nd publication 5 days)6) Applicant notified, posting signs
issued. 7) Agenda prepared & e-mailed or sent out. Minimum of 30 copies made for distribution at public hearing.8) Hearing held, decisions rendered.9) Decision Notice published the Sunday following the hearing.10) Decisions with conditions sent to applicants, minimum of 60-day process.
FY 2018-2019 GOALS
1. To seek 2 alternates to the Zoning Board of Appeals to ensure that the postponement of meetings and the deferment of applications will be a thing of the past, which will also bring us in compliance with the bylaws of the Zoning Regulations of the City of Bridgeport. Currently there is only 1 alternate member.
2. Fill a vacated Zoning Inspector position.
FY 2017-2018 GOAL STATUS
1. We still only have 1 alternate ZBA member. 2. Although a “database” hasn’t been created, the Office of Planning & Economic Development (OPED) has a
part-time intern scanning the index cards into an Optical Character Recognition (OCR) program since fiscal 2014-2015. Unfortunately, the Zoning Dept. does not have access to this digital information yet.
3. The Civil Service directive of 12/08/15 has been addressed by Labor Relations with a suggestion to contact the N.A.G.E. union and file a grievance.
FY 2017-2018 ADDITIONAL ACCOMPLISHMENT
1) With the addition of a new staff member in February, the office work load will be redistributed and the enforcement team will be able to spend more time in the field resolving complaints in a timely manner.
2) The leave-of-absence of the Design Review Coordinator staff member has temporarily filled until his return on the job.
3) The resignation of the primary Zoning Enforcement Inspector there has been a decrease of time in the field,yet the Inspectors remain diligent in enforcing the “conditions of approval” that the Planning & Zoning Commission granted and managed to keep up with all counter and other office work demands.
383
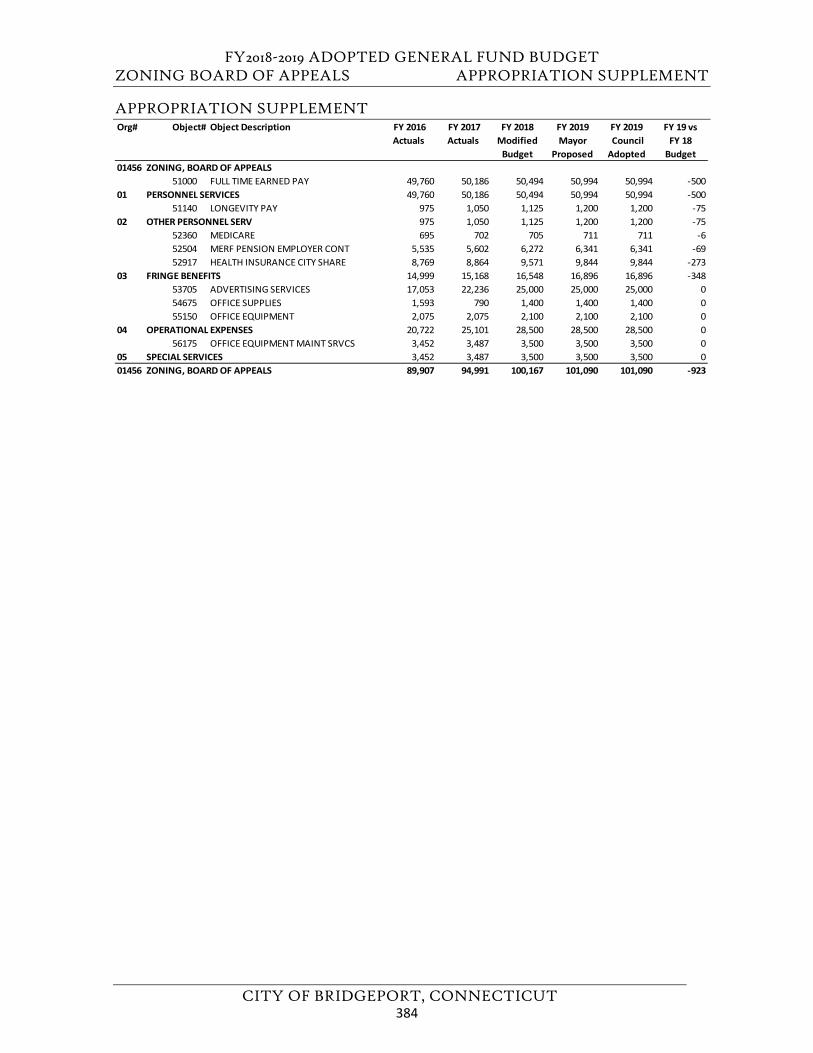
FY2018-2019 ADOPTED GENERAL FUND BUDGET ZONING BOARD OF APPEALS APPROPRIATION SUPPLEMENT
CITY OF BRIDGEPORT, CONNECTICUT
APPROPRIATION SUPPLEMENT Org# Object# Object Description FY 2016
Actuals FY 2017 Actuals
FY 2018 Modified
Budget
FY 2019Mayor
Proposed
FY 2019 Council Adopted
FY 19 vs FY 18
Budget01456 ZONING, BOARD OF APPEALS
51000 FULL TIME EARNED PAY 49,760 50,186 50,494 50,994 50,994 -50001 PERSONNEL SERVICES 49,760 50,186 50,494 50,994 50,994 -500
51140 LONGEVITY PAY 975 1,050 1,125 1,200 1,200 -7502 OTHER PERSONNEL SERV 975 1,050 1,125 1,200 1,200 -75
52360 MEDICARE 695 702 705 711 711 -652504 MERF PENSION EMPLOYER CONT 5,535 5,602 6,272 6,341 6,341 -6952917 HEALTH INSURANCE CITY SHARE 8,769 8,864 9,571 9,844 9,844 -273
03 FRINGE BENEFITS 14,999 15,168 16,548 16,896 16,896 -34853705 ADVERTISING SERVICES 17,053 22,236 25,000 25,000 25,000 054675 OFFICE SUPPLIES 1,593 790 1,400 1,400 1,400 055150 OFFICE EQUIPMENT 2,075 2,075 2,100 2,100 2,100 0
04 OPERATIONAL EXPENSES 20,722 25,101 28,500 28,500 28,500 056175 OFFICE EQUIPMENT MAINT SRVCS 3,452 3,487 3,500 3,500 3,500 0
05 SPECIAL SERVICES 3,452 3,487 3,500 3,500 3,500 001456 ZONING, BOARD OF APPEALS 89,907 94,991 100,167 101,090 101,090 -923
384
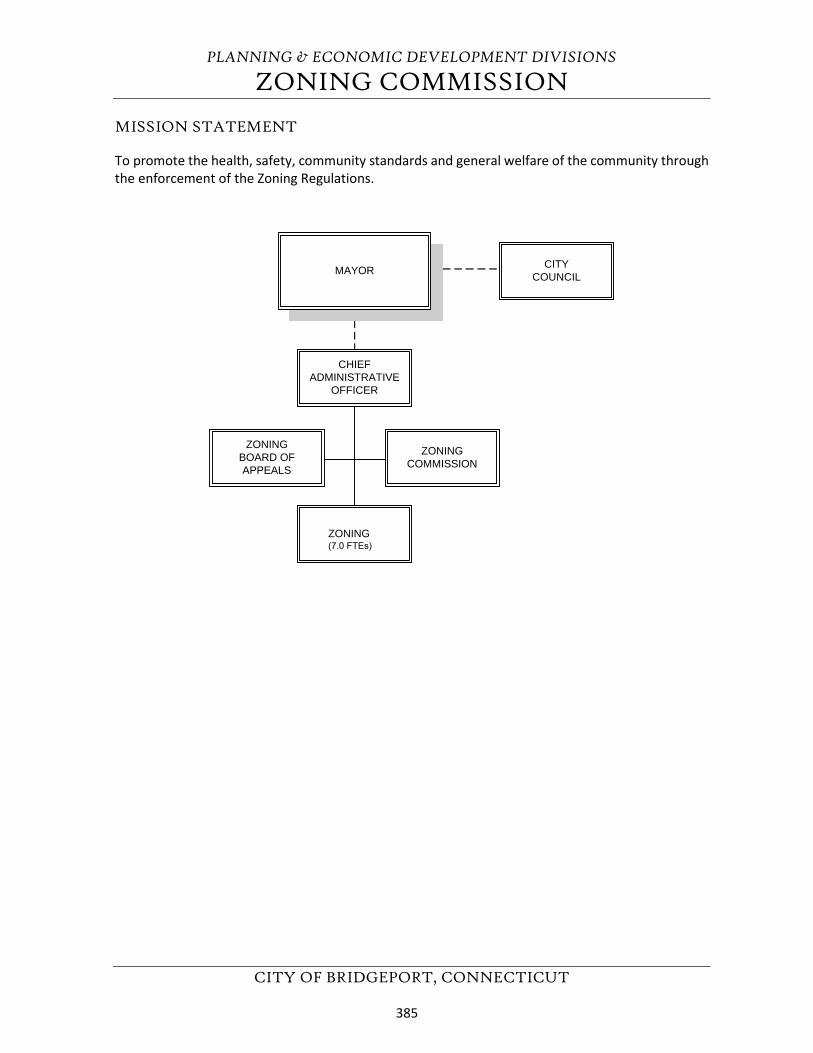
PLANNING & ECONOMIC DEVELOPMENT DIVISIONS
ZONING COMMISSION
CITY OF BRIDGEPORT, CONNECTICUT
MISSION STATEMENT
To promote the health, safety, community standards and general welfare of the community through the enforcement of the Zoning Regulations.
CHIEFADMINISTRATIVE
OFFICER
MAYOR CITYCOUNCIL
ZONING(7.0 FTEs)
ZONINGBOARD OFAPPEALS
ZONINGCOMMISSION
385
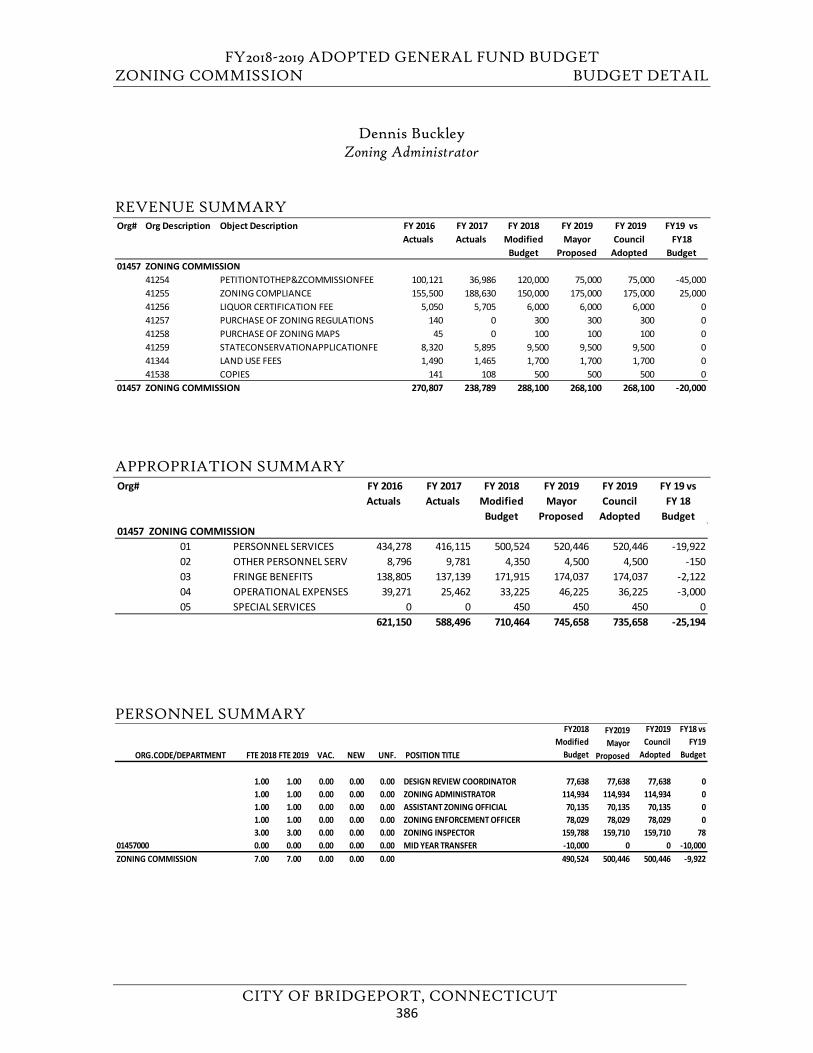
FY2018-2019 ADOPTED GENERAL FUND BUDGET ZONING COMMISSION BUDGET DETAIL
CITY OF BRIDGEPORT, CONNECTICUT
Dennis Buckley Zoning Administrator
REVENUE SUMMARY
APPROPRIATION SUMMARY
PERSONNEL SUMMARY
Org# Org Description Object Description FY 2016 Actuals
FY 2017 Actuals
FY 2018 Modified
Budget
FY 2019 Mayor
Proposed
FY 2019 Council
Adopted
FY19 vs FY18
Budget01457 ZONING COMMISSION
41254 PETITIONTOTHEP&ZCOMMISSIONFEE 100,121 36,986 120,000 75,000 75,000 -45,00041255 ZONING COMPLIANCE 155,500 188,630 150,000 175,000 175,000 25,00041256 LIQUOR CERTIFICATION FEE 5,050 5,705 6,000 6,000 6,000 041257 PURCHASE OF ZONING REGULATIONS 140 0 300 300 300 041258 PURCHASE OF ZONING MAPS 45 0 100 100 100 041259 STATECONSERVATIONAPPLICATIONFE 8,320 5,895 9,500 9,500 9,500 041344 LAND USE FEES 1,490 1,465 1,700 1,700 1,700 041538 COPIES 141 108 500 500 500 0
01457 ZONING COMMISSION 270,807 238,789 288,100 268,100 268,100 -20,000
Org# FY 2016 Actuals
FY 2017 Actuals
FY 2018 Modified
Budget
FY 2019 Mayor
Proposed
FY 2019 Council
Adopted
FY 19 vs FY 18
Budget01457 ZONING COMMISSION
01 PERSONNEL SERVICES 434,278 416,115 500,524 520,446 520,446 -19,92202 OTHER PERSONNEL SERV 8,796 9,781 4,350 4,500 4,500 -15003 FRINGE BENEFITS 138,805 137,139 171,915 174,037 174,037 -2,12204 OPERATIONAL EXPENSES 39,271 25,462 33,225 46,225 36,225 -3,00005 SPECIAL SERVICES 0 0 450 450 450 0
621,150 588,496 710,464 745,658 735,658 -25,194
ORG.CODE/DEPARTMENT FTE 2018 FTE 2019 VAC. NEW UNF. POSITION TITLE
FY2018 Modified
Budget
FY2019 Mayor
Proposed
FY2019 Council
Adopted
FY18 vs FY19
Budget
1.00 1.00 0.00 0.00 0.00 DESIGN REVIEW COORDINATOR 77,638 77,638 77,638 01.00 1.00 0.00 0.00 0.00 ZONING ADMINISTRATOR 114,934 114,934 114,934 01.00 1.00 0.00 0.00 0.00 ASSISTANT ZONING OFFICIAL 70,135 70,135 70,135 01.00 1.00 0.00 0.00 0.00 ZONING ENFORCEMENT OFFICER 78,029 78,029 78,029 03.00 3.00 0.00 0.00 0.00 ZONING INSPECTOR 159,788 159,710 159,710 78
01457000 0.00 0.00 0.00 0.00 0.00 MID YEAR TRANSFER -10,000 0 0 -10,000ZONING COMMISSION 7.00 7.00 0.00 0.00 0.00 490,524 500,446 500,446 -9,922
386
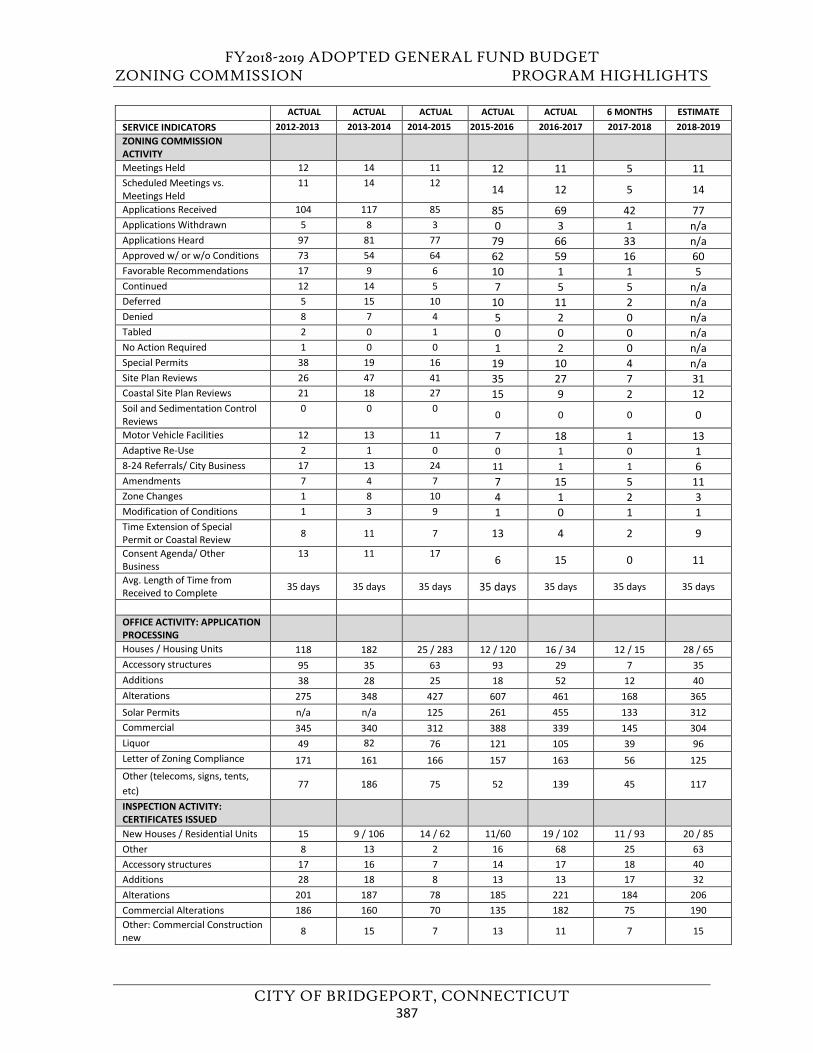
FY2018-2019 ADOPTED GENERAL FUND BUDGET ZONING COMMISSION PROGRAM HIGHLIGHTS
CITY OF BRIDGEPORT, CONNECTICUT
ACTUAL ACTUAL ACTUAL ACTUAL ACTUAL 6 MONTHS ESTIMATE SERVICE INDICATORS 2012-2013 2013-2014 2014-2015 2015-2016 2016-2017 2017-2018 2018-2019 ZONING COMMISSION ACTIVITY Meetings Held 12 14 11 12 11 5 11 Scheduled Meetings vs. Meetings Held
11 14 12 14 12 5 14
Applications Received 104 117 85 85 69 42 77 Applications Withdrawn 5 8 3 0 3 1 n/a Applications Heard 97 81 77 79 66 33 n/a Approved w/ or w/o Conditions 73 54 64 62 59 16 60 Favorable Recommendations 17 9 6 10 1 1 5 Continued 12 14 5 7 5 5 n/a Deferred 5 15 10 10 11 2 n/a Denied 8 7 4 5 2 0 n/a Tabled 2 0 1 0 0 0 n/a No Action Required 1 0 0 1 2 0 n/a Special Permits 38 19 16 19 10 4 n/a Site Plan Reviews 26 47 41 35 27 7 31 Coastal Site Plan Reviews 21 18 27 15 9 2 12 Soil and Sedimentation Control Reviews
0 0 0 0 0 0 0
Motor Vehicle Facilities 12 13 11 7 18 1 13 Adaptive Re-Use 2 1 0 0 1 0 1 8-24 Referrals/ City Business 17 13 24 11 1 1 6 Amendments 7 4 7 7 15 5 11 Zone Changes 1 8 10 4 1 2 3 Modification of Conditions 1 3 9 1 0 1 1 Time Extension of Special Permit or Coastal Review 8 11 7 13 4 2 9
Consent Agenda/ Other Business
13 11 17 6 15 0 11
Avg. Length of Time from Received to Complete 35 days 35 days 35 days 35 days 35 days 35 days 35 days
OFFICE ACTIVITY: APPLICATION PROCESSING Houses / Housing Units 118 182 25 / 283 12 / 120 16 / 34 12 / 15 28 / 65 Accessory structures 95 35 63 93 29 7 35 Additions 38 28 25 18 52 12 40 Alterations 275 348 427 607 461 168 365 Solar Permits n/a n/a 125 261 455 133 312 Commercial 345 340 312 388 339 145 304 Liquor 49 82 76 121 105 39 96 Letter of Zoning Compliance 171 161 166 157 163 56 125 Other (telecoms, signs, tents, etc) 77 186 75 52 139 45 117
INSPECTION ACTIVITY: CERTIFICATES ISSUED New Houses / Residential Units 15 9 / 106 14 / 62 11/60 19 / 102 11 / 93 20 / 85 Other 8 13 2 16 68 25 63 Accessory structures 17 16 7 14 17 18 40 Additions 28 18 8 13 13 17 32 Alterations 201 187 78 185 221 184 206 Commercial Alterations 186 160 70 135 182 75 190 Other: Commercial Construction new 8 15 7 13 11 7 15
387
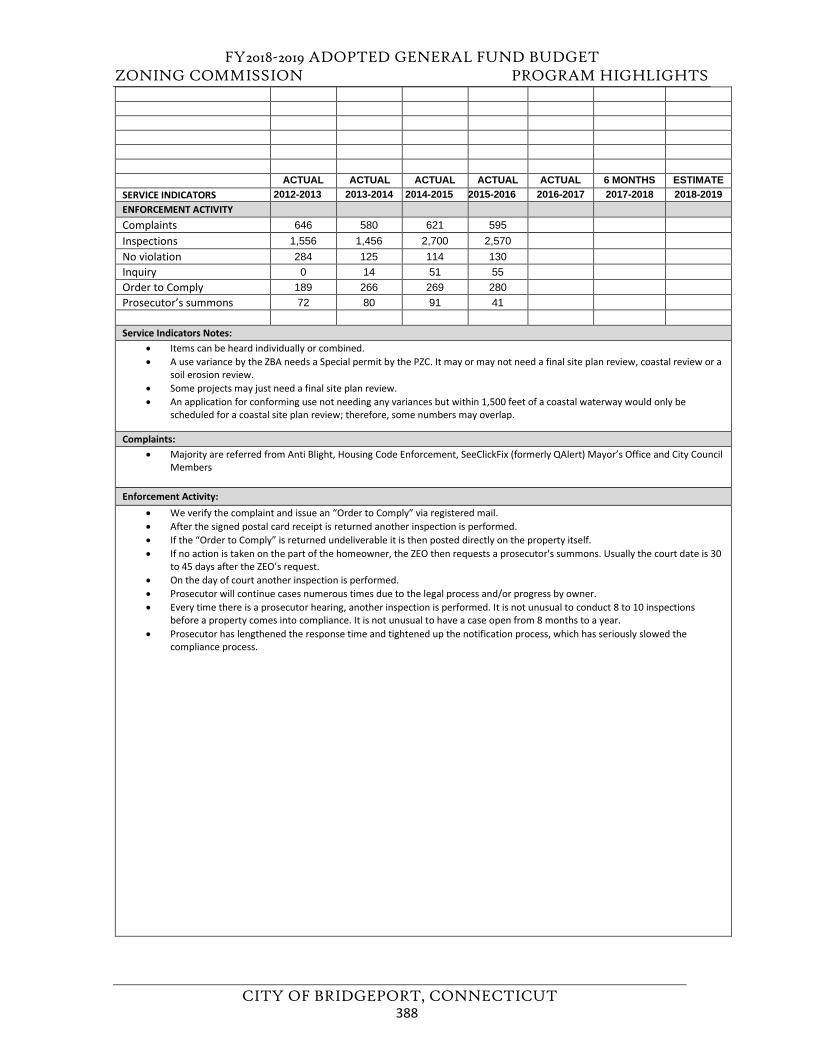
FY2018-2019 ADOPTED GENERAL FUND BUDGET ZONING COMMISSION PROGRAM HIGHLIGHTS
CITY OF BRIDGEPORT, CONNECTICUT
ACTUAL ACTUAL ACTUAL ACTUAL ACTUAL 6 MONTHS ESTIMATE SERVICE INDICATORS 2012-2013 2013-2014 2014-2015 2015-2016 2016-2017 2017-2018 2018-2019 ENFORCEMENT ACTIVITY Complaints 646 580 621 595 Inspections 1,556 1,456 2,700 2,570 No violation 284 125 114 130 Inquiry 0 14 51 55 Order to Comply 189 266 269 280 Prosecutor’s summons 72 80 91 41
Service Indicators Notes: • Items can be heard individually or combined.• A use variance by the ZBA needs a Special permit by the PZC. It may or may not need a final site plan review, coastal review or a
soil erosion review. • Some projects may just need a final site plan review.• An application for conforming use not needing any variances but within 1,500 feet of a coastal waterway would only be
scheduled for a coastal site plan review; therefore, some numbers may overlap.
Complaints: • Majority are referred from Anti Blight, Housing Code Enforcement, SeeClickFix (formerly QAlert) Mayor’s Office and City Council
Members
Enforcement Activity: • We verify the complaint and issue an “Order to Comply” via registered mail.• After the signed postal card receipt is returned another inspection is performed.• If the “Order to Comply” is returned undeliverable it is then posted directly on the property itself.• If no action is taken on the part of the homeowner, the ZEO then requests a prosecutor's summons. Usually the court date is 30
to 45 days after the ZEO’s request. • On the day of court another inspection is performed.• Prosecutor will continue cases numerous times due to the legal process and/or progress by owner.• Every time there is a prosecutor hearing, another inspection is performed. It is not unusual to conduct 8 to 10 inspections
before a property comes into compliance. It is not unusual to have a case open from 8 months to a year. • Prosecutor has lengthened the response time and tightened up the notification process, which has seriously slowed the
compliance process.
388
FY2018-2019 ADOPTED GENERAL FUND BUDGET ZONING COMMISSION PROGRAM HIGHLIGHTS
CITY OF BRIDGEPORT, CONNECTICUT
FY 2018 -2019 GOALS
2) Fill the vacated Zoning Inspector position.
FY 2017-2018 GOAL STATUS
1) Instead of 1 regular Commissioner 3 alternate Commissioners have been appointed.
2) The Civil Service directive of 12/08/15 has been addressed by Labor Relations with asuggestion to contact the N.A.G.E union and file a grievance.
FY 2017-2018 ADDITIONAL ACCOMPLISHMENTS
1) With the addition of a new staff member in February, the office work load will beredistributed and the enforcement team will be able to spend more time in the fieldresolving complaints in a timely manner.
2) The leave-of-absence of the Design Review Coordinator staff member has temporarily filleduntil his return on the job.
3) The resignation of the primary Zoning Enforcement Inspector there has been a decrease oftime in the field, yet the Inspectors remain diligent in enforcing the “conditions ofapproval” that the Planning & Zoning Commission granted and managed to keep up with allcounter and other office work demands.
1) Seeking 2 regular Commissioner and 2 alternate Commissioners to eliminate postponementof meetings and the deferment of applications due to the lack of quorums.
375389
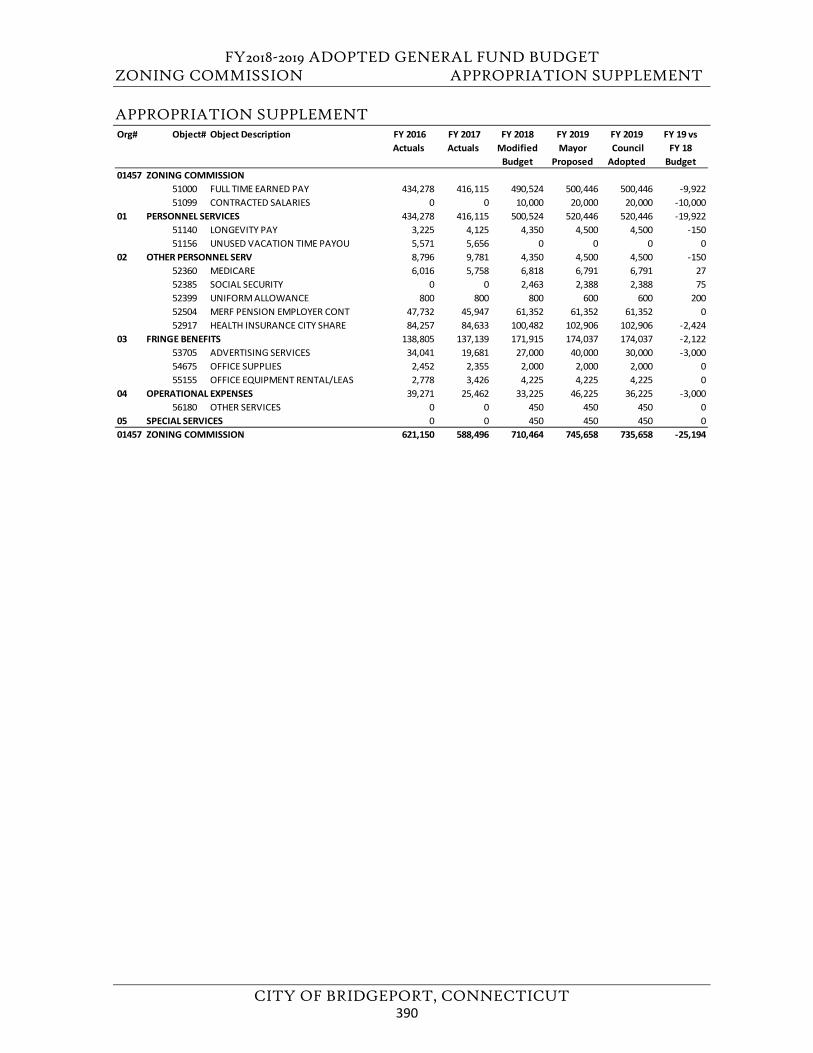
FY2018-2019 ADOPTED GENERAL FUND BUDGET ZONING COMMISSION APPROPRIATION SUPPLEMENT
CITY OF BRIDGEPORT, CONNECTICUT
APPROPRIATION SUPPLEMENT Org# Object# Object Description FY 2016
Actuals FY 2017 Actuals
FY 2018 Modified
Budget
FY 2019Mayor
Proposed
FY 2019 Council Adopted
FY 19 vs FY 18
Budget01457 ZONING COMMISSION
51000 FULL TIME EARNED PAY 434,278 416,115 490,524 500,446 500,446 -9,92251099 CONTRACTED SALARIES 0 0 10,000 20,000 20,000 -10,000
01 PERSONNEL SERVICES 434,278 416,115 500,524 520,446 520,446 -19,92251140 LONGEVITY PAY 3,225 4,125 4,350 4,500 4,500 -15051156 UNUSED VACATION TIME PAYOU 5,571 5,656 0 0 0 0
02 OTHER PERSONNEL SERV 8,796 9,781 4,350 4,500 4,500 -15052360 MEDICARE 6,016 5,758 6,818 6,791 6,791 2752385 SOCIAL SECURITY 0 0 2,463 2,388 2,388 7552399 UNIFORM ALLOWANCE 800 800 800 600 600 20052504 MERF PENSION EMPLOYER CONT 47,732 45,947 61,352 61,352 61,352 052917 HEALTH INSURANCE CITY SHARE 84,257 84,633 100,482 102,906 102,906 -2,424
03 FRINGE BENEFITS 138,805 137,139 171,915 174,037 174,037 -2,12253705 ADVERTISING SERVICES 34,041 19,681 27,000 40,000 30,000 -3,00054675 OFFICE SUPPLIES 2,452 2,355 2,000 2,000 2,000 055155 OFFICE EQUIPMENT RENTAL/LEAS 2,778 3,426 4,225 4,225 4,225 0
04 OPERATIONAL EXPENSES 39,271 25,462 33,225 46,225 36,225 -3,00056180 OTHER SERVICES 0 0 450 450 450 0
05 SPECIAL SERVICES 0 0 450 450 450 001457 ZONING COMMISSION 621,150 588,496 710,464 745,658 735,658 -25,194
390
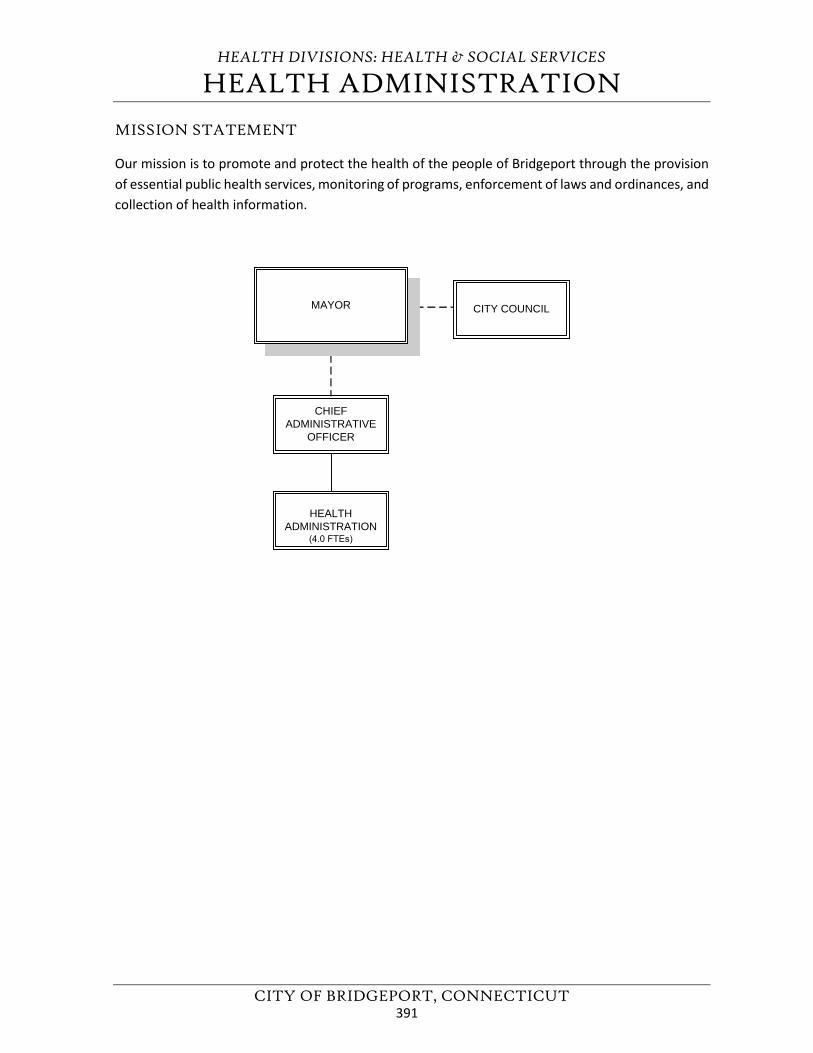
HEALTH DIVISIONS: HEALTH & SOCIAL SERVICES
HEALTH ADMINISTRATION
CITY OF BRIDGEPORT, CONNECTICUT
MISSION STATEMENT
Our mission is to promote and protect the health of the people of Bridgeport through the provision of essential public health services, monitoring of programs, enforcement of laws and ordinances, and collection of health information.
CHIEFADMINISTRATIVE
OFFICER
HEALTH ADMINISTRATION
(4.0 FTEs)
MAYOR CITY COUNCIL
391
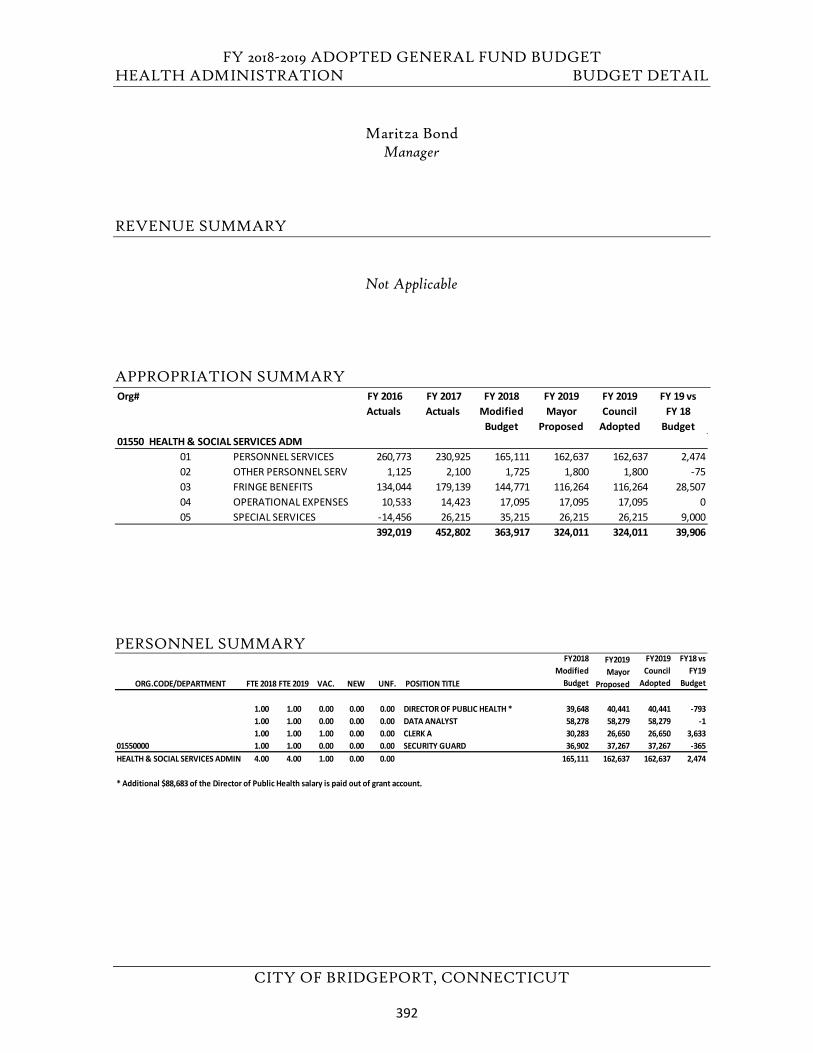
FY 2018-2019 ADOPTED GENERAL FUND BUDGET HEALTH ADMINISTRATION BUDGET DETAIL
CITY OF BRIDGEPORT, CONNECTICUT
Maritza Bond Manager
REVENUE SUMMARY
Not Applicable
APPROPRIATION SUMMARY
PERSONNEL SUMMARY
Org# FY 2016 Actuals
FY 2017 Actuals
FY 2018 Modified
Budget
FY 2019 Mayor
Proposed
FY 2019 Council
Adopted
FY 19 vs FY 18
Budget01550 HEALTH & SOCIAL SERVICES ADM
01 PERSONNEL SERVICES 260,773 230,925 165,111 162,637 162,637 2,47402 OTHER PERSONNEL SERV 1,125 2,100 1,725 1,800 1,800 -7503 FRINGE BENEFITS 134,044 179,139 144,771 116,264 116,264 28,50704 OPERATIONAL EXPENSES 10,533 14,423 17,095 17,095 17,095 005 SPECIAL SERVICES -14,456 26,215 35,215 26,215 26,215 9,000
392,019 452,802 363,917 324,011 324,011 39,906
ORG.CODE/DEPARTMENT FTE 2018 FTE 2019 VAC. NEW UNF. POSITION TITLE
FY2018 Modified
Budget
FY2019 Mayor
Proposed
FY2019 Council
Adopted
FY18 vs FY19
Budget
1.00 1.00 0.00 0.00 0.00 DIRECTOR OF PUBLIC HEALTH * 39,648 40,441 40,441 -7931.00 1.00 0.00 0.00 0.00 DATA ANALYST 58,278 58,279 58,279 -11.00 1.00 1.00 0.00 0.00 CLERK A 30,283 26,650 26,650 3,633
01550000 1.00 1.00 0.00 0.00 0.00 SECURITY GUARD 36,902 37,267 37,267 -365HEALTH & SOCIAL SERVICES ADMIN 4.00 4.00 1.00 0.00 0.00 165,111 162,637 162,637 2,474
* Additional $88,683 of the Director of Public Health salary is paid out of grant account.
392
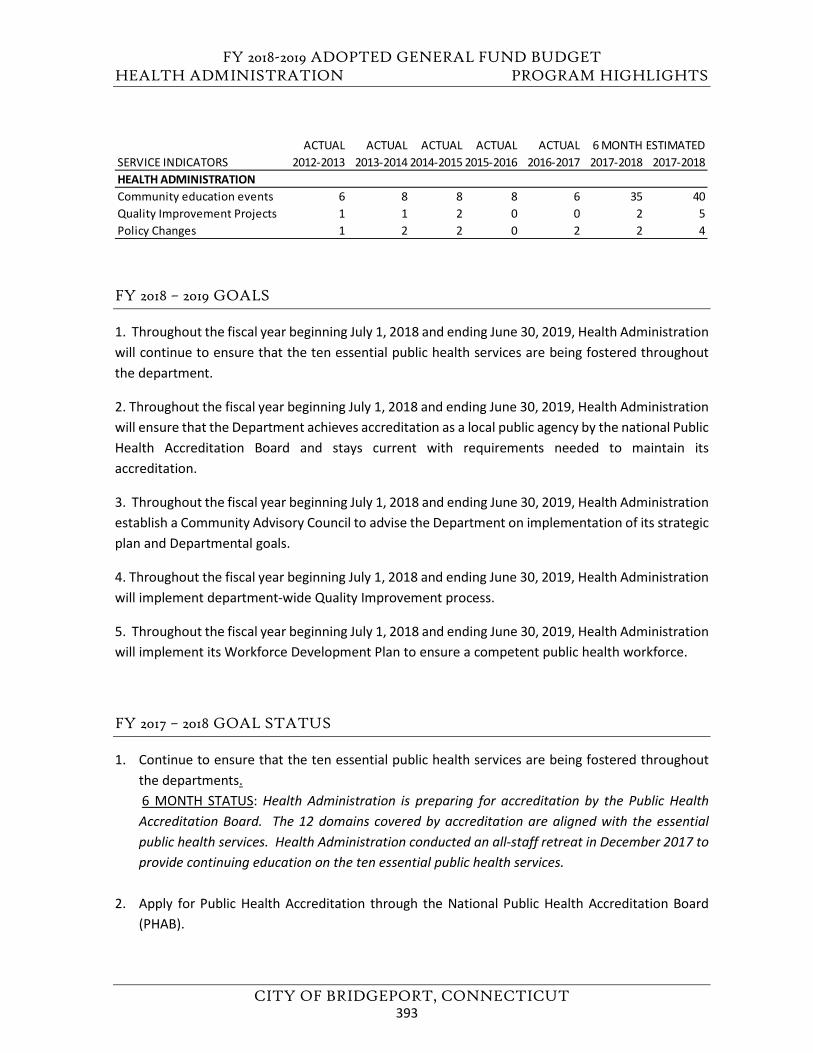
FY 2018-2019 ADOPTED GENERAL FUND BUDGET HEALTH ADMINISTRATION PROGRAM HIGHLIGHTS
CITY OF BRIDGEPORT, CONNECTICUT
FY 2018 – 2019 GOALS
1. Throughout the fiscal year beginning July 1, 2018 and ending June 30, 2019, Health Administrationwill continue to ensure that the ten essential public health services are being fostered throughoutthe department.
2. Throughout the fiscal year beginning July 1, 2018 and ending June 30, 2019, Health Administrationwill ensure that the Department achieves accreditation as a local public agency by the national PublicHealth Accreditation Board and stays current with requirements needed to maintain itsaccreditation.
3. Throughout the fiscal year beginning July 1, 2018 and ending June 30, 2019, Health Administrationestablish a Community Advisory Council to advise the Department on implementation of its strategicplan and Departmental goals.
4. Throughout the fiscal year beginning July 1, 2018 and ending June 30, 2019, Health Administrationwill implement department-wide Quality Improvement process.
5. Throughout the fiscal year beginning July 1, 2018 and ending June 30, 2019, Health Administrationwill implement its Workforce Development Plan to ensure a competent public health workforce.
FY 2017 – 2018 GOAL STATUS
1. Continue to ensure that the ten essential public health services are being fostered throughoutthe departments.6 MONTH STATUS: Health Administration is preparing for accreditation by the Public HealthAccreditation Board. The 12 domains covered by accreditation are aligned with the essentialpublic health services. Health Administration conducted an all-staff retreat in December 2017 toprovide continuing education on the ten essential public health services.
2. Apply for Public Health Accreditation through the National Public Health Accreditation Board(PHAB).
ACTUAL ACTUAL ACTUAL ACTUAL ACTUAL 6 MONTH ESTIMATEDSERVICE INDICATORS 2012-2013 2013-2014 2014-2015 2015-2016 2016-2017 2017-2018 2017-2018HEALTH ADMINISTRATIONCommunity education events 6 8 8 8 6 35 40Quality Improvement Projects 1 1 2 0 0 2 5Policy Changes 1 2 2 0 2 2 4
393
FY 2018-2019 ADOPTED GENERAL FUND BUDGET HEALTH ADMINISTRATION PROGRAM HIGHLIGHTS
CITY OF BRIDGEPORT, CONNECTICUT
6 MONTH STATUS: A departmental Accreditation Team was established to coordinate the accreditation process. Plans, policies, procedures/protocols and other documents are being identified, revised, developed and annotated in preparation for uploading to the e-PHAB site for submission in April 2018.
3. Incorporate Community Health Needs Assessment and Community Health Improvement Plan within the five-year strategic plan. 6 MONTH STATUS: A summary of the Greater Bridgeport Community Health Needs Assessment was included as part of the environmental scan section of the five-year strategic plan, which was approved in July 2017.
4. Establish a subcommittee to assess current workforce and create a workforce development plan.
6 MONTH STATUS: As part of the accreditation process, a workforce development assessment was completed in May 2017. The workforce development plan is scheduled for review and approval by department leadership in March 2018.
5. Engage in at least two quality improvement initiatives that will aid with streamlining efforts
throughout the departments. 6 MONTH STATUS: One quality improvement initiative was the improvement of the Food & Beverage Establishment License Renewal process. To achieve efficiency and effectiveness, a set of new workflows was developed. The procedure is posted on the department’s website. A second quality improvement initiative is the implementation of a customer satisfaction survey process for the department. Customer service survey cards are provided to customers at all departmental sites. Once completed, cards are placed in a secure box for retrieval and analysis by management.
394
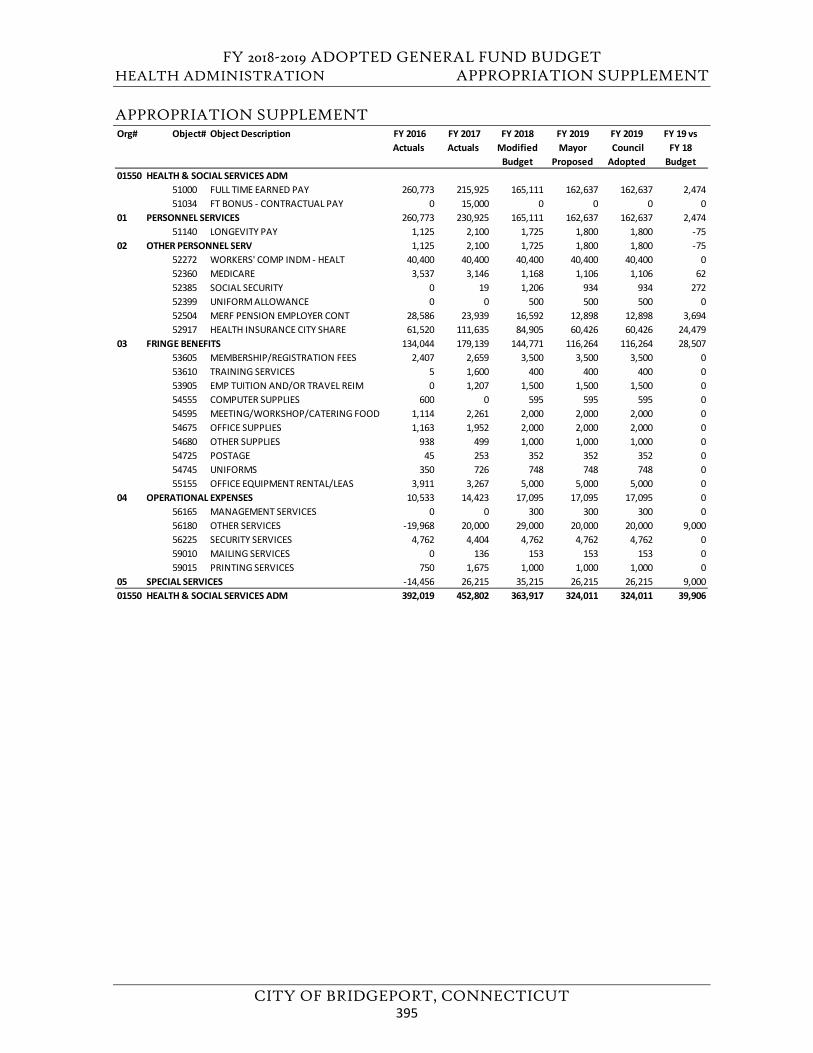
FY 2018-2019 ADOPTED GENERAL FUND BUDGET HEALTH ADMINISTRATION APPROPRIATION SUPPLEMENT
CITY OF BRIDGEPORT, CONNECTICUT
APPROPRIATION SUPPLEMENT Org# Object# Object Description FY 2016
Actuals FY 2017 Actuals
FY 2018 Modified
Budget
FY 2019Mayor
Proposed
FY 2019 Council Adopted
FY 19 vs FY 18
Budget01550 HEALTH & SOCIAL SERVICES ADM
51000 FULL TIME EARNED PAY 260,773 215,925 165,111 162,637 162,637 2,47451034 FT BONUS - CONTRACTUAL PAY 0 15,000 0 0 0 0
01 PERSONNEL SERVICES 260,773 230,925 165,111 162,637 162,637 2,47451140 LONGEVITY PAY 1,125 2,100 1,725 1,800 1,800 -75
02 OTHER PERSONNEL SERV 1,125 2,100 1,725 1,800 1,800 -7552272 WORKERS' COMP INDM - HEALT 40,400 40,400 40,400 40,400 40,400 052360 MEDICARE 3,537 3,146 1,168 1,106 1,106 6252385 SOCIAL SECURITY 0 19 1,206 934 934 27252399 UNIFORM ALLOWANCE 0 0 500 500 500 052504 MERF PENSION EMPLOYER CONT 28,586 23,939 16,592 12,898 12,898 3,69452917 HEALTH INSURANCE CITY SHARE 61,520 111,635 84,905 60,426 60,426 24,479
03 FRINGE BENEFITS 134,044 179,139 144,771 116,264 116,264 28,50753605 MEMBERSHIP/REGISTRATION FEES 2,407 2,659 3,500 3,500 3,500 053610 TRAINING SERVICES 5 1,600 400 400 400 053905 EMP TUITION AND/OR TRAVEL REIM 0 1,207 1,500 1,500 1,500 054555 COMPUTER SUPPLIES 600 0 595 595 595 054595 MEETING/WORKSHOP/CATERING FOOD 1,114 2,261 2,000 2,000 2,000 054675 OFFICE SUPPLIES 1,163 1,952 2,000 2,000 2,000 054680 OTHER SUPPLIES 938 499 1,000 1,000 1,000 054725 POSTAGE 45 253 352 352 352 054745 UNIFORMS 350 726 748 748 748 055155 OFFICE EQUIPMENT RENTAL/LEAS 3,911 3,267 5,000 5,000 5,000 0
04 OPERATIONAL EXPENSES 10,533 14,423 17,095 17,095 17,095 056165 MANAGEMENT SERVICES 0 0 300 300 300 056180 OTHER SERVICES -19,968 20,000 29,000 20,000 20,000 9,00056225 SECURITY SERVICES 4,762 4,404 4,762 4,762 4,762 059010 MAILING SERVICES 0 136 153 153 153 059015 PRINTING SERVICES 750 1,675 1,000 1,000 1,000 0
05 SPECIAL SERVICES -14,456 26,215 35,215 26,215 26,215 9,00001550 HEALTH & SOCIAL SERVICES ADM 392,019 452,802 363,917 324,011 324,011 39,906
395
FY 2018-2019 ADOPTED GENERAL FUND BUDGET
CITY OF BRIDGEPORT, CONNECTICUT
This page left blank intentionally.
396
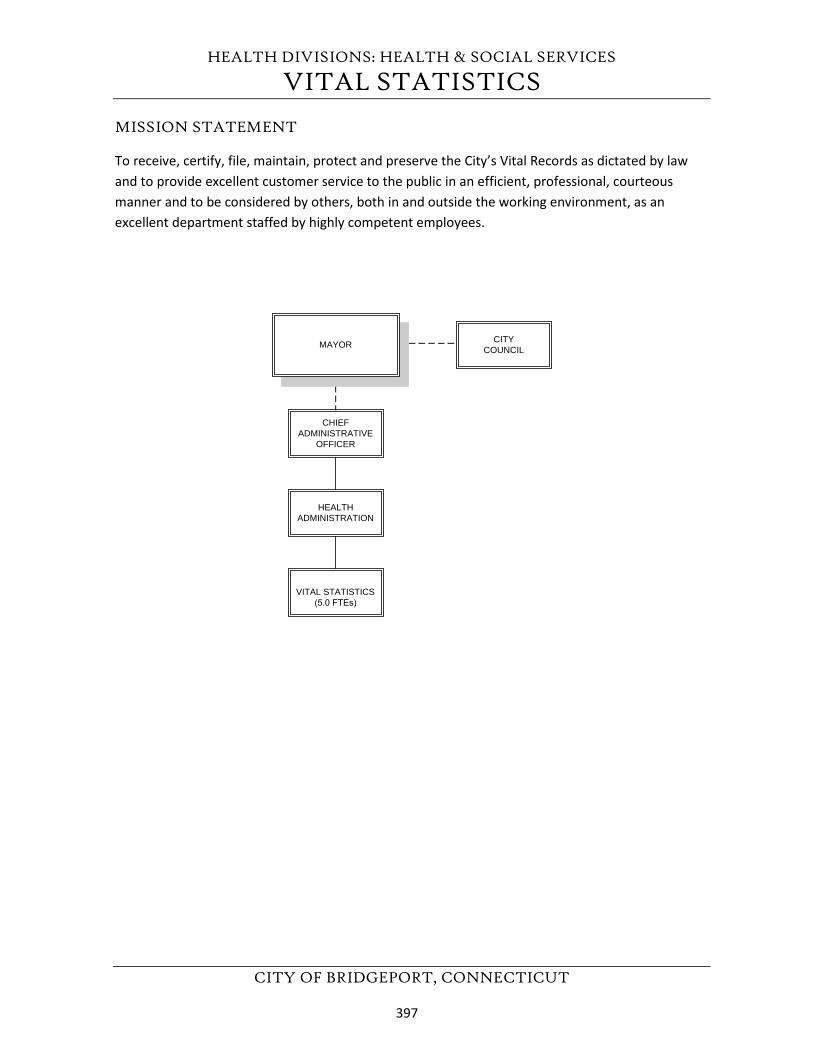
HEALTH DIVISIONS: HEALTH & SOCIAL SERVICES
VITAL STATISTICS
CITY OF BRIDGEPORT, CONNECTICUT
MISSION STATEMENT
To receive, certify, file, maintain, protect and preserve the City’s Vital Records as dictated by law and to provide excellent customer service to the public in an efficient, professional, courteous manner and to be considered by others, both in and outside the working environment, as an excellent department staffed by highly competent employees.
CHIEFADMINISTRATIVE
OFFICER
HEALTHADMINISTRATION
VITAL STATISTICS(5.0 FTEs)
MAYOR CITYCOUNCIL
397
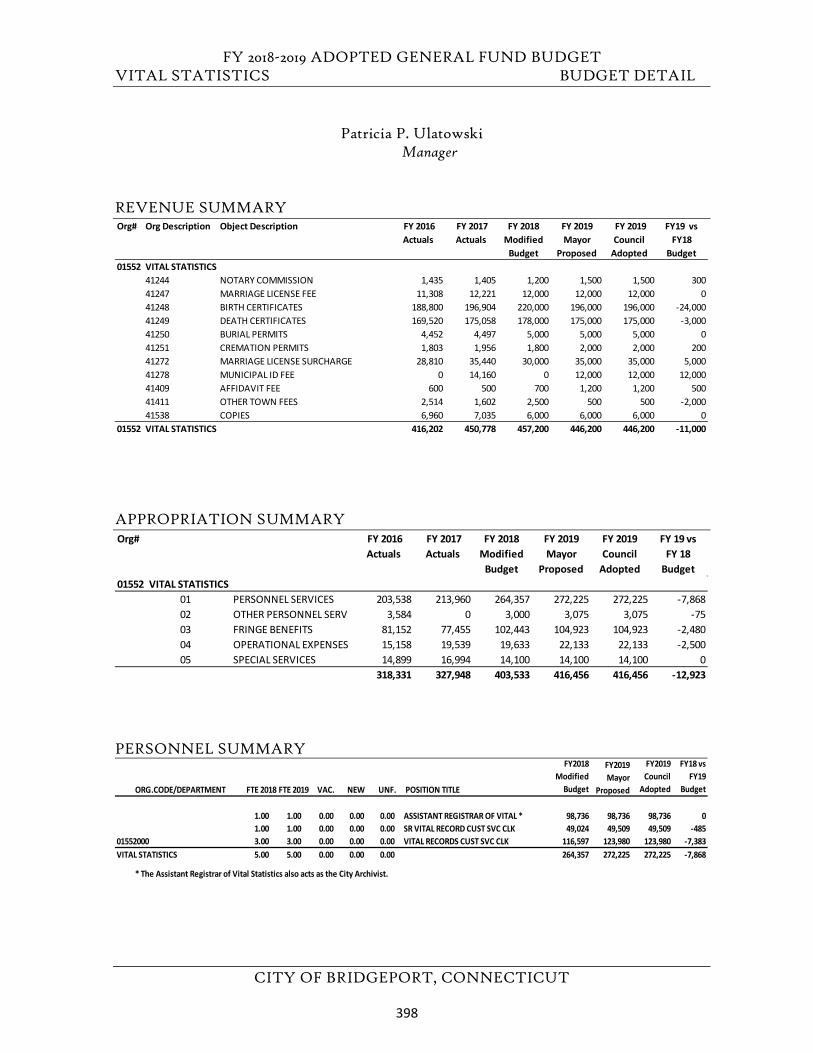
FY 2018-2019 ADOPTED GENERAL FUND BUDGET VITAL STATISTICS BUDGET DETAIL
CITY OF BRIDGEPORT, CONNECTICUT
Patricia P. Ulatowski Manager
REVENUE SUMMARY
APPROPRIATION SUMMARY
PERSONNEL SUMMARY
Org# Org Description Object Description FY 2016 Actuals
FY 2017 Actuals
FY 2018 Modified
Budget
FY 2019 Mayor
Proposed
FY 2019 Council
Adopted
FY19 vs FY18
Budget01552 VITAL STATISTICS
41244 NOTARY COMMISSION 1,435 1,405 1,200 1,500 1,500 30041247 MARRIAGE LICENSE FEE 11,308 12,221 12,000 12,000 12,000 041248 BIRTH CERTIFICATES 188,800 196,904 220,000 196,000 196,000 -24,00041249 DEATH CERTIFICATES 169,520 175,058 178,000 175,000 175,000 -3,00041250 BURIAL PERMITS 4,452 4,497 5,000 5,000 5,000 041251 CREMATION PERMITS 1,803 1,956 1,800 2,000 2,000 20041272 MARRIAGE LICENSE SURCHARGE 28,810 35,440 30,000 35,000 35,000 5,00041278 MUNICIPAL ID FEE 0 14,160 0 12,000 12,000 12,00041409 AFFIDAVIT FEE 600 500 700 1,200 1,200 50041411 OTHER TOWN FEES 2,514 1,602 2,500 500 500 -2,00041538 COPIES 6,960 7,035 6,000 6,000 6,000 0
01552 VITAL STATISTICS 416,202 450,778 457,200 446,200 446,200 -11,000
Org# FY 2016 Actuals
FY 2017 Actuals
FY 2018 Modified
Budget
FY 2019 Mayor
Proposed
FY 2019 Council
Adopted
FY 19 vs FY 18
Budget01552 VITAL STATISTICS
01 PERSONNEL SERVICES 203,538 213,960 264,357 272,225 272,225 -7,86802 OTHER PERSONNEL SERV 3,584 0 3,000 3,075 3,075 -7503 FRINGE BENEFITS 81,152 77,455 102,443 104,923 104,923 -2,48004 OPERATIONAL EXPENSES 15,158 19,539 19,633 22,133 22,133 -2,50005 SPECIAL SERVICES 14,899 16,994 14,100 14,100 14,100 0
318,331 327,948 403,533 416,456 416,456 -12,923
ORG.CODE/DEPARTMENT FTE 2018 FTE 2019 VAC. NEW UNF. POSITION TITLE
FY2018 Modified
Budget
FY2019 Mayor
Proposed
FY2019 Council
Adopted
FY18 vs FY19
Budget
1.00 1.00 0.00 0.00 0.00 ASSISTANT REGISTRAR OF VITAL * 98,736 98,736 98,736 01.00 1.00 0.00 0.00 0.00 SR VITAL RECORD CUST SVC CLK 49,024 49,509 49,509 -485
01552000 3.00 3.00 0.00 0.00 0.00 VITAL RECORDS CUST SVC CLK 116,597 123,980 123,980 -7,383VITAL STATISTICS 5.00 5.00 0.00 0.00 0.00 264,357 272,225 272,225 -7,868
* The Assistant Registrar of Vital Statistics also acts as the City Archivist.
398
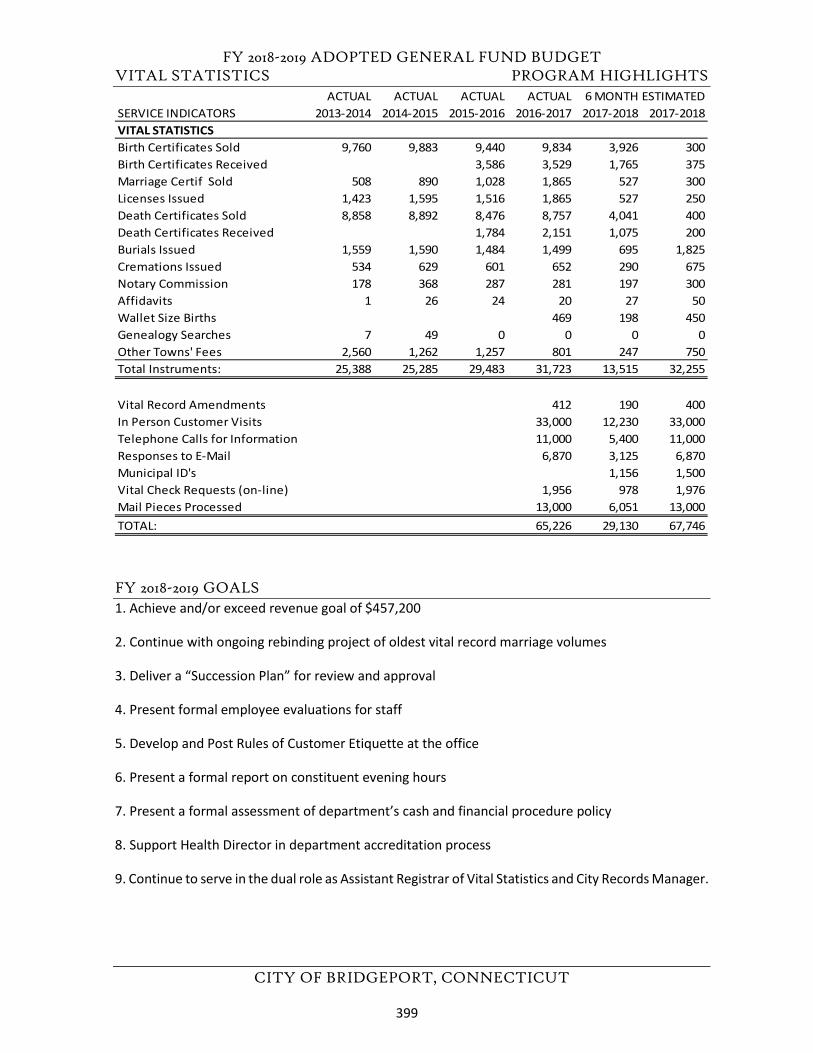
FY 2018-2019 ADOPTED GENERAL FUND BUDGET VITAL STATISTICS PROGRAM HIGHLIGHTS
CITY OF BRIDGEPORT, CONNECTICUT
FY 2018-2019 GOALS 1. Achieve and/or exceed revenue goal of $457,200
2. Continue with ongoing rebinding project of oldest vital record marriage volumes
3. Deliver a “Succession Plan” for review and approval
4. Present formal employee evaluations for staff
5. Develop and Post Rules of Customer Etiquette at the office
6. Present a formal report on constituent evening hours
7. Present a formal assessment of department’s cash and financial procedure policy
8. Support Health Director in department accreditation process
9. Continue to serve in the dual role as Assistant Registrar of Vital Statistics and City Records Manager.
ACTUAL ACTUAL ACTUAL ACTUAL 6 MONTH ESTIMATEDSERVICE INDICATORS 2013-2014 2014-2015 2015-2016 2016-2017 2017-2018 2017-2018VITAL STATISTICSBirth Certificates Sold 9,760 9,883 9,440 9,834 3,926 300Birth Certificates Received 3,586 3,529 1,765 375Marriage Certif Sold 508 890 1,028 1,865 527 300Licenses Issued 1,423 1,595 1,516 1,865 527 250Death Certificates Sold 8,858 8,892 8,476 8,757 4,041 400Death Certificates Received 1,784 2,151 1,075 200Burials Issued 1,559 1,590 1,484 1,499 695 1,825Cremations Issued 534 629 601 652 290 675Notary Commission 178 368 287 281 197 300Affidavits 1 26 24 20 27 50Wallet Size Births 469 198 450Genealogy Searches 7 49 0 0 0 0Other Towns' Fees 2,560 1,262 1,257 801 247 750Total Instruments: 25,388 25,285 29,483 31,723 13,515 32,255
Vital Record Amendments 412 190 400In Person Customer Visits 33,000 12,230 33,000Telephone Calls for Information 11,000 5,400 11,000Responses to E-Mail 6,870 3,125 6,870Municipal ID's 1,156 1,500Vital Check Requests (on-line) 1,956 978 1,976Mail Pieces Processed 13,000 6,051 13,000TOTAL: 65,226 29,130 67,746
399
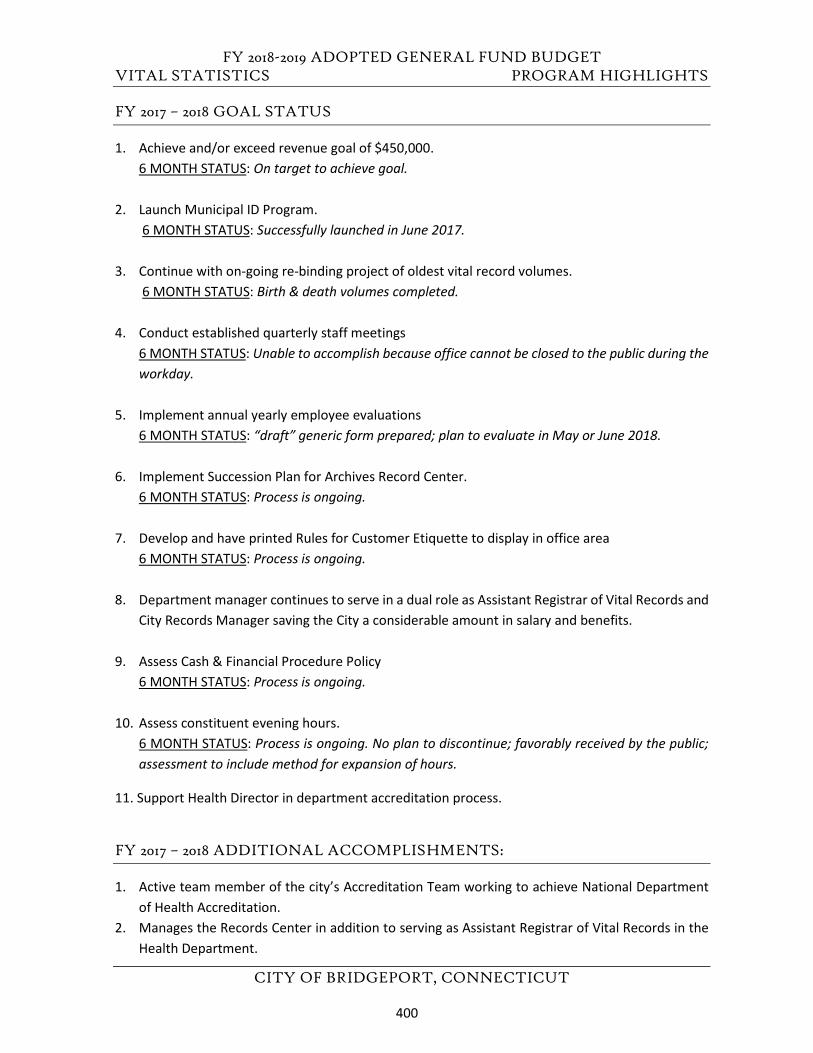
FY 2018-2019 ADOPTED GENERAL FUND BUDGET VITAL STATISTICS PROGRAM HIGHLIGHTS
CITY OF BRIDGEPORT, CONNECTICUT
FY 2017 – 2018 GOAL STATUS
1. Achieve and/or exceed revenue goal of $450,000. 6 MONTH STATUS: On target to achieve goal.
2. Launch Municipal ID Program. 6 MONTH STATUS: Successfully launched in June 2017.
3. Continue with on-going re-binding project of oldest vital record volumes. 6 MONTH STATUS: Birth & death volumes completed.
4. Conduct established quarterly staff meetings 6 MONTH STATUS: Unable to accomplish because office cannot be closed to the public during the workday.
5. Implement annual yearly employee evaluations 6 MONTH STATUS: “draft” generic form prepared; plan to evaluate in May or June 2018.
6. Implement Succession Plan for Archives Record Center. 6 MONTH STATUS: Process is ongoing.
7. Develop and have printed Rules for Customer Etiquette to display in office area 6 MONTH STATUS: Process is ongoing.
8. Department manager continues to serve in a dual role as Assistant Registrar of Vital Records and City Records Manager saving the City a considerable amount in salary and benefits.
9. Assess Cash & Financial Procedure Policy 6 MONTH STATUS: Process is ongoing.
10. Assess constituent evening hours. 6 MONTH STATUS: Process is ongoing. No plan to discontinue; favorably received by the public; assessment to include method for expansion of hours.
11. Support Health Director in department accreditation process.
FY 2017 – 2018 ADDITIONAL ACCOMPLISHMENTS:
1. Active team member of the city’s Accreditation Team working to achieve National Department of Health Accreditation.
2. Manages the Records Center in addition to serving as Assistant Registrar of Vital Records in the Health Department.
400
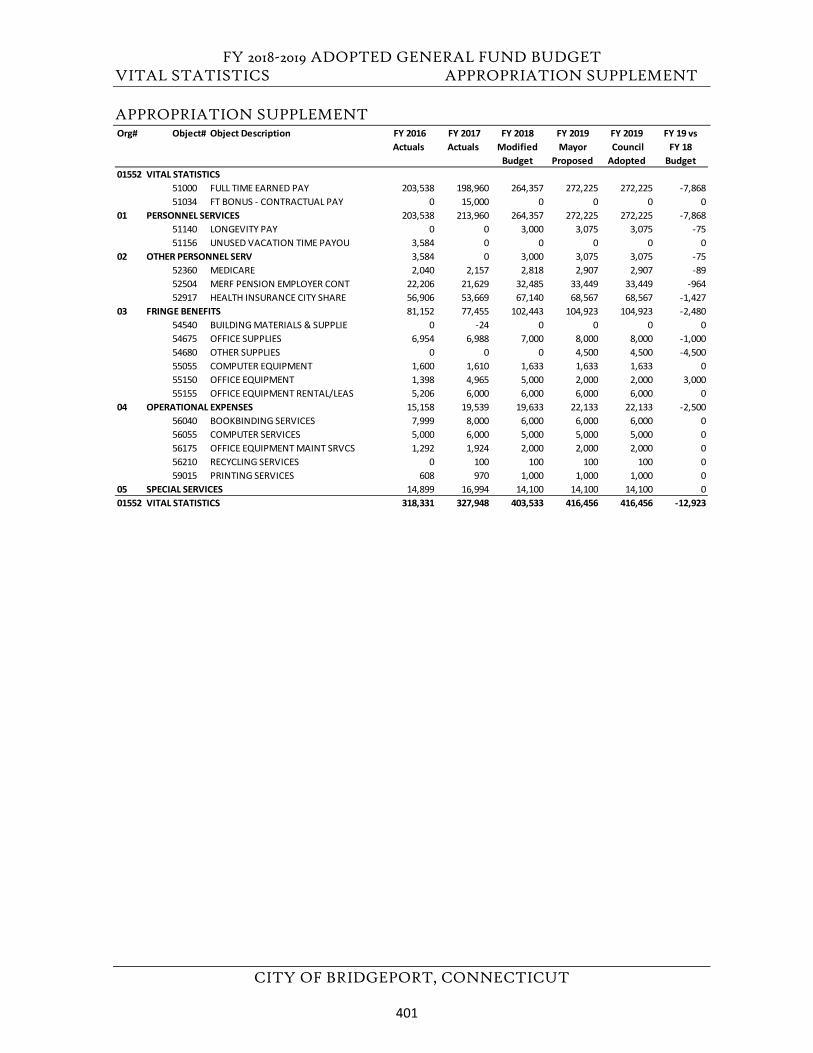
FY 2018-2019 ADOPTED GENERAL FUND BUDGET VITAL STATISTICS APPROPRIATION SUPPLEMENT
CITY OF BRIDGEPORT, CONNECTICUT
APPROPRIATION SUPPLEMENT Org# Object# Object Description FY 2016
Actuals FY 2017 Actuals
FY 2018 Modified
Budget
FY 2019Mayor
Proposed
FY 2019 Council Adopted
FY 19 vs FY 18
Budget01552 VITAL STATISTICS
51000 FULL TIME EARNED PAY 203,538 198,960 264,357 272,225 272,225 -7,86851034 FT BONUS - CONTRACTUAL PAY 0 15,000 0 0 0 0
01 PERSONNEL SERVICES 203,538 213,960 264,357 272,225 272,225 -7,86851140 LONGEVITY PAY 0 0 3,000 3,075 3,075 -7551156 UNUSED VACATION TIME PAYOU 3,584 0 0 0 0 0
02 OTHER PERSONNEL SERV 3,584 0 3,000 3,075 3,075 -7552360 MEDICARE 2,040 2,157 2,818 2,907 2,907 -8952504 MERF PENSION EMPLOYER CONT 22,206 21,629 32,485 33,449 33,449 -96452917 HEALTH INSURANCE CITY SHARE 56,906 53,669 67,140 68,567 68,567 -1,427
03 FRINGE BENEFITS 81,152 77,455 102,443 104,923 104,923 -2,48054540 BUILDING MATERIALS & SUPPLIE 0 -24 0 0 0 054675 OFFICE SUPPLIES 6,954 6,988 7,000 8,000 8,000 -1,00054680 OTHER SUPPLIES 0 0 0 4,500 4,500 -4,50055055 COMPUTER EQUIPMENT 1,600 1,610 1,633 1,633 1,633 055150 OFFICE EQUIPMENT 1,398 4,965 5,000 2,000 2,000 3,00055155 OFFICE EQUIPMENT RENTAL/LEAS 5,206 6,000 6,000 6,000 6,000 0
04 OPERATIONAL EXPENSES 15,158 19,539 19,633 22,133 22,133 -2,50056040 BOOKBINDING SERVICES 7,999 8,000 6,000 6,000 6,000 056055 COMPUTER SERVICES 5,000 6,000 5,000 5,000 5,000 056175 OFFICE EQUIPMENT MAINT SRVCS 1,292 1,924 2,000 2,000 2,000 056210 RECYCLING SERVICES 0 100 100 100 100 059015 PRINTING SERVICES 608 970 1,000 1,000 1,000 0
05 SPECIAL SERVICES 14,899 16,994 14,100 14,100 14,100 001552 VITAL STATISTICS 318,331 327,948 403,533 416,456 416,456 -12,923
401

FY 2018-2019 ADOPTED GENERAL FUND BUDGET
CITY OF BRIDGEPORT, CONNECTICUT
This page left blank intentionally.
402
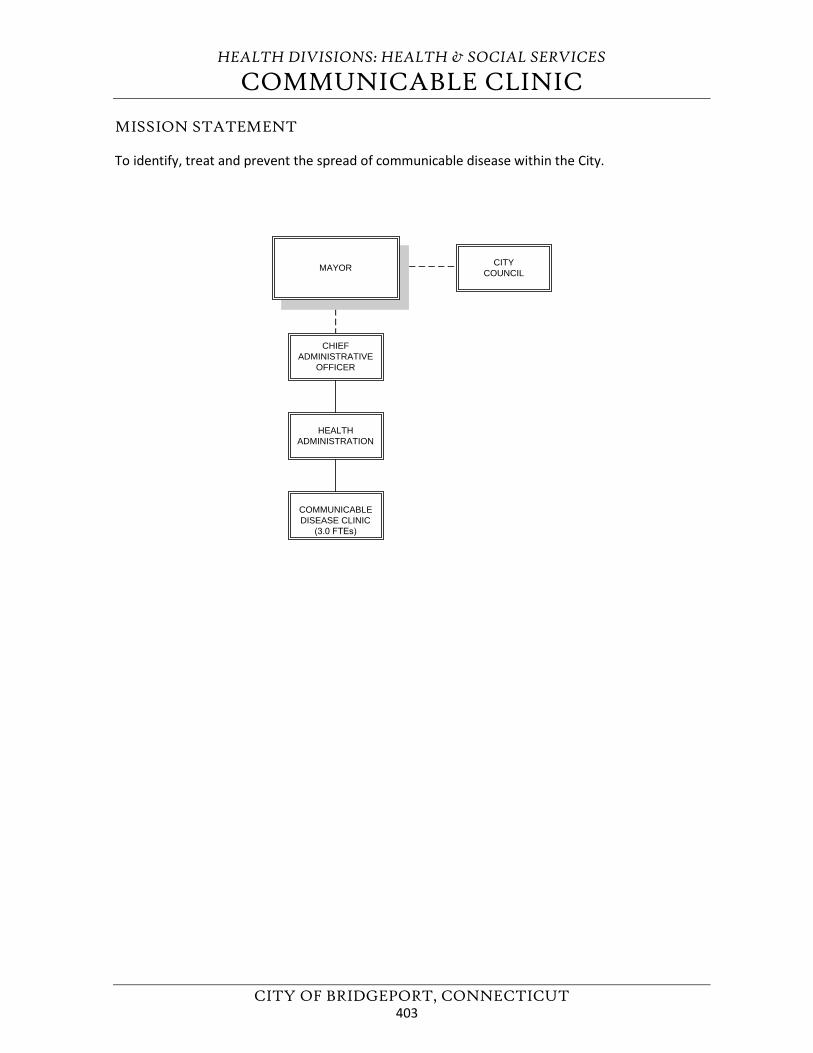
HEALTH DIVISIONS: HEALTH & SOCIAL SERVICES
COMMUNICABLE CLINIC
CITY OF BRIDGEPORT, CONNECTICUT
MISSION STATEMENT
To identify, treat and prevent the spread of communicable disease within the City.
CHIEFADMINISTRATIVE
OFFICER
HEALTHADMINISTRATION
COMMUNICABLEDISEASE CLINIC
(3.0 FTEs)
MAYOR CITYCOUNCIL
403
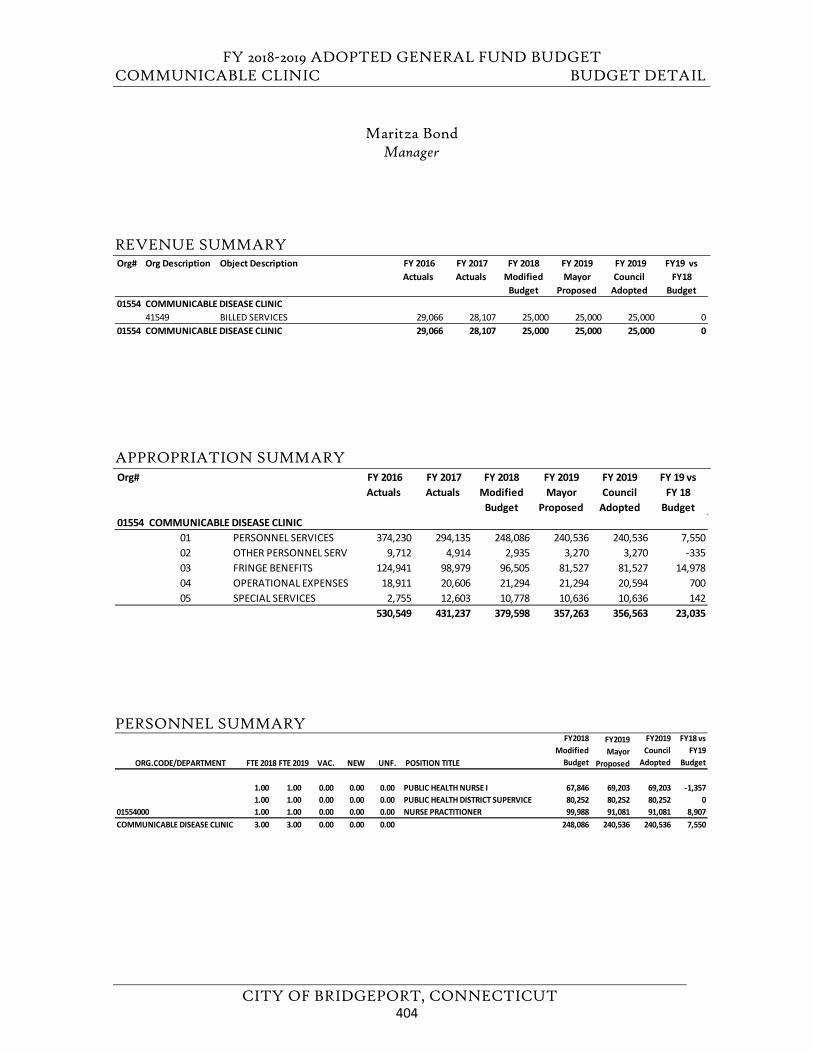
FY 2018-2019 ADOPTED GENERAL FUND BUDGET COMMUNICABLE CLINIC BUDGET DETAIL
CITY OF BRIDGEPORT, CONNECTICUT
Maritza Bond Manager
REVENUE SUMMARY
APPROPRIATION SUMMARY
PERSONNEL SUMMARY
Org# Org Description Object Description FY 2016 Actuals
FY 2017 Actuals
FY 2018 Modified
Budget
FY 2019 Mayor
Proposed
FY 2019 Council
Adopted
FY19 vs FY18
Budget01554 COMMUNICABLE DISEASE CLINIC
41549 BILLED SERVICES 29,066 28,107 25,000 25,000 25,000 001554 COMMUNICABLE DISEASE CLINIC 29,066 28,107 25,000 25,000 25,000 0
Org# FY 2016 Actuals
FY 2017 Actuals
FY 2018 Modified
Budget
FY 2019 Mayor
Proposed
FY 2019 Council
Adopted
FY 19 vs FY 18
Budget01554 COMMUNICABLE DISEASE CLINIC
01 PERSONNEL SERVICES 374,230 294,135 248,086 240,536 240,536 7,55002 OTHER PERSONNEL SERV 9,712 4,914 2,935 3,270 3,270 -33503 FRINGE BENEFITS 124,941 98,979 96,505 81,527 81,527 14,97804 OPERATIONAL EXPENSES 18,911 20,606 21,294 21,294 20,594 70005 SPECIAL SERVICES 2,755 12,603 10,778 10,636 10,636 142
530,549 431,237 379,598 357,263 356,563 23,035
ORG.CODE/DEPARTMENT FTE 2018 FTE 2019 VAC. NEW UNF. POSITION TITLE
FY2018 Modified
Budget
FY2019 Mayor
Proposed
FY2019 Council
Adopted
FY18 vs FY19
Budget
1.00 1.00 0.00 0.00 0.00 PUBLIC HEALTH NURSE I 67,846 69,203 69,203 -1,3571.00 1.00 0.00 0.00 0.00 PUBLIC HEALTH DISTRICT SUPERVICE 80,252 80,252 80,252 0
01554000 1.00 1.00 0.00 0.00 0.00 NURSE PRACTITIONER 99,988 91,081 91,081 8,907COMMUNICABLE DISEASE CLINIC 3.00 3.00 0.00 0.00 0.00 248,086 240,536 240,536 7,550
404
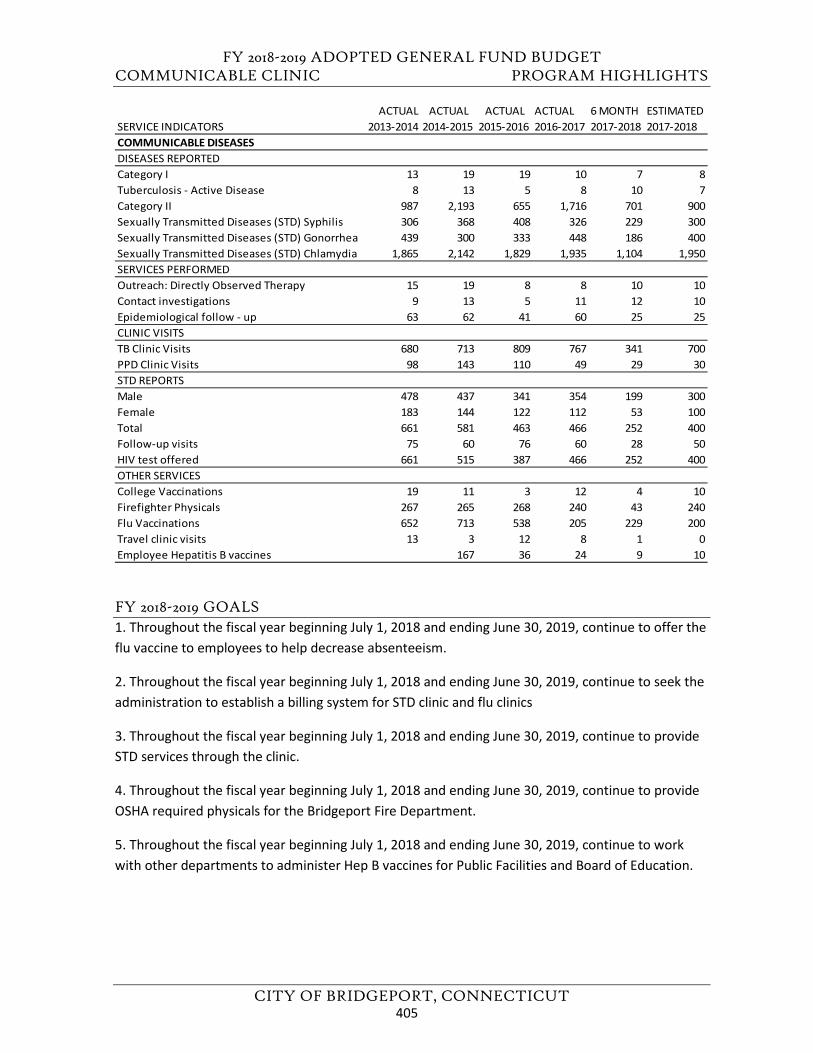
FY 2018-2019 ADOPTED GENERAL FUND BUDGET COMMUNICABLE CLINIC PROGRAM HIGHLIGHTS
CITY OF BRIDGEPORT, CONNECTICUT
FY 2018-2019 GOALS 1. Throughout the fiscal year beginning July 1, 2018 and ending June 30, 2019, continue to offer theflu vaccine to employees to help decrease absenteeism.
2. Throughout the fiscal year beginning July 1, 2018 and ending June 30, 2019, continue to seek theadministration to establish a billing system for STD clinic and flu clinics
3. Throughout the fiscal year beginning July 1, 2018 and ending June 30, 2019, continue to provideSTD services through the clinic.
4. Throughout the fiscal year beginning July 1, 2018 and ending June 30, 2019, continue to provideOSHA required physicals for the Bridgeport Fire Department.
5. Throughout the fiscal year beginning July 1, 2018 and ending June 30, 2019, continue to workwith other departments to administer Hep B vaccines for Public Facilities and Board of Education.
ACTUAL ACTUAL ACTUAL ACTUAL 6 MONTH ESTIMATEDSERVICE INDICATORS 2013-2014 2014-2015 2015-2016 2016-2017 2017-2018 2017-2018COMMUNICABLE DISEASESDISEASES REPORTEDCategory I 13 19 19 10 7 8Tuberculosis - Active Disease 8 13 5 8 10 7Category II 987 2,193 655 1,716 701 900Sexually Transmitted Diseases (STD) Syphilis 306 368 408 326 229 300Sexually Transmitted Diseases (STD) Gonorrhea 439 300 333 448 186 400Sexually Transmitted Diseases (STD) Chlamydia 1,865 2,142 1,829 1,935 1,104 1,950SERVICES PERFORMEDOutreach: Directly Observed Therapy 15 19 8 8 10 10Contact investigations 9 13 5 11 12 10Epidemiological follow - up 63 62 41 60 25 25CLINIC VISITSTB Clinic Visits 680 713 809 767 341 700PPD Clinic Visits 98 143 110 49 29 30STD REPORTSMale 478 437 341 354 199 300Female 183 144 122 112 53 100Total 661 581 463 466 252 400Follow-up visits 75 60 76 60 28 50HIV test offered 661 515 387 466 252 400OTHER SERVICESCollege Vaccinations 19 11 3 12 4 10Firefighter Physicals 267 265 268 240 43 240Flu Vaccinations 652 713 538 205 229 200Travel clinic visits 13 3 12 8 1 0Employee Hepatitis B vaccines 167 36 24 9 10
405
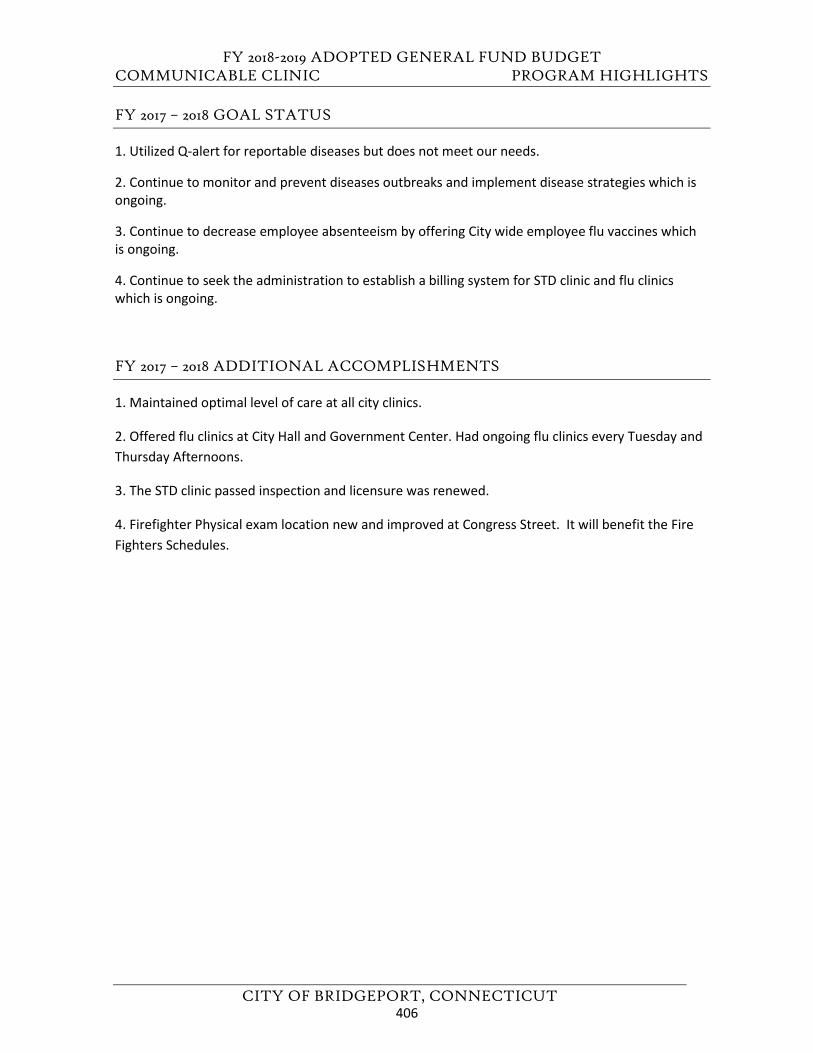
FY 2018-2019 ADOPTED GENERAL FUND BUDGET COMMUNICABLE CLINIC PROGRAM HIGHLIGHTS
CITY OF BRIDGEPORT, CONNECTICUT
FY 2017 – 2018 GOAL STATUS
1. Utilized Q-alert for reportable diseases but does not meet our needs.
2. Continue to monitor and prevent diseases outbreaks and implement disease strategies which isongoing.
3. Continue to decrease employee absenteeism by offering City wide employee flu vaccines whichis ongoing.
4. Continue to seek the administration to establish a billing system for STD clinic and flu clinicswhich is ongoing.
FY 2017 – 2018 ADDITIONAL ACCOMPLISHMENTS
1. Maintained optimal level of care at all city clinics.
2. Offered flu clinics at City Hall and Government Center. Had ongoing flu clinics every Tuesday andThursday Afternoons.
3. The STD clinic passed inspection and licensure was renewed.
4. Firefighter Physical exam location new and improved at Congress Street. It will benefit the FireFighters Schedules.
406
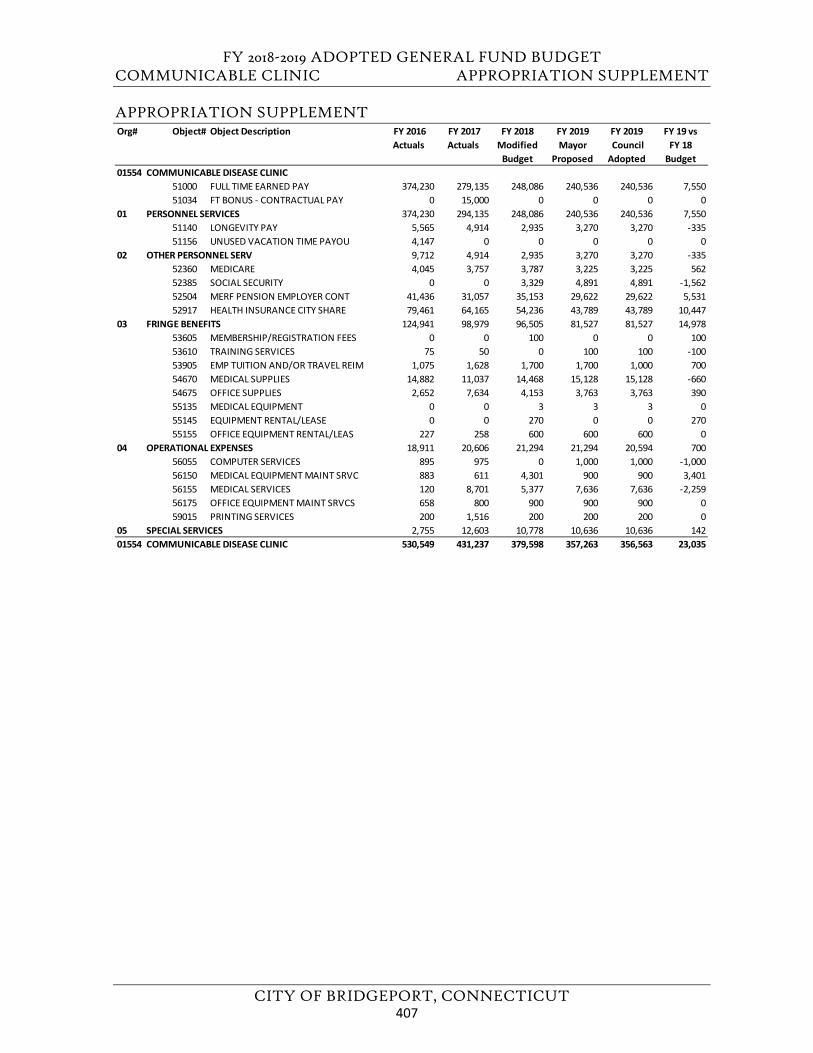
FY 2018-2019 ADOPTED GENERAL FUND BUDGET COMMUNICABLE CLINIC APPROPRIATION SUPPLEMENT
CITY OF BRIDGEPORT, CONNECTICUT
APPROPRIATION SUPPLEMENT Org# Object# Object Description FY 2016
Actuals FY 2017 Actuals
FY 2018 Modified
Budget
FY 2019Mayor
Proposed
FY 2019 Council Adopted
FY 19 vs FY 18
Budget01554 COMMUNICABLE DISEASE CLINIC
51000 FULL TIME EARNED PAY 374,230 279,135 248,086 240,536 240,536 7,55051034 FT BONUS - CONTRACTUAL PAY 0 15,000 0 0 0 0
01 PERSONNEL SERVICES 374,230 294,135 248,086 240,536 240,536 7,55051140 LONGEVITY PAY 5,565 4,914 2,935 3,270 3,270 -33551156 UNUSED VACATION TIME PAYOU 4,147 0 0 0 0 0
02 OTHER PERSONNEL SERV 9,712 4,914 2,935 3,270 3,270 -33552360 MEDICARE 4,045 3,757 3,787 3,225 3,225 56252385 SOCIAL SECURITY 0 0 3,329 4,891 4,891 -1,56252504 MERF PENSION EMPLOYER CONT 41,436 31,057 35,153 29,622 29,622 5,53152917 HEALTH INSURANCE CITY SHARE 79,461 64,165 54,236 43,789 43,789 10,447
03 FRINGE BENEFITS 124,941 98,979 96,505 81,527 81,527 14,97853605 MEMBERSHIP/REGISTRATION FEES 0 0 100 0 0 10053610 TRAINING SERVICES 75 50 0 100 100 -10053905 EMP TUITION AND/OR TRAVEL REIM 1,075 1,628 1,700 1,700 1,000 70054670 MEDICAL SUPPLIES 14,882 11,037 14,468 15,128 15,128 -66054675 OFFICE SUPPLIES 2,652 7,634 4,153 3,763 3,763 39055135 MEDICAL EQUIPMENT 0 0 3 3 3 055145 EQUIPMENT RENTAL/LEASE 0 0 270 0 0 27055155 OFFICE EQUIPMENT RENTAL/LEAS 227 258 600 600 600 0
04 OPERATIONAL EXPENSES 18,911 20,606 21,294 21,294 20,594 70056055 COMPUTER SERVICES 895 975 0 1,000 1,000 -1,00056150 MEDICAL EQUIPMENT MAINT SRVC 883 611 4,301 900 900 3,40156155 MEDICAL SERVICES 120 8,701 5,377 7,636 7,636 -2,25956175 OFFICE EQUIPMENT MAINT SRVCS 658 800 900 900 900 059015 PRINTING SERVICES 200 1,516 200 200 200 0
05 SPECIAL SERVICES 2,755 12,603 10,778 10,636 10,636 14201554 COMMUNICABLE DISEASE CLINIC 530,549 431,237 379,598 357,263 356,563 23,035
407

FY 2018-2019 ADOPTED GENERAL FUND BUDGET
CITY OF BRIDGEPORT, CONNECTICUT
This page left blank intentionally.
408
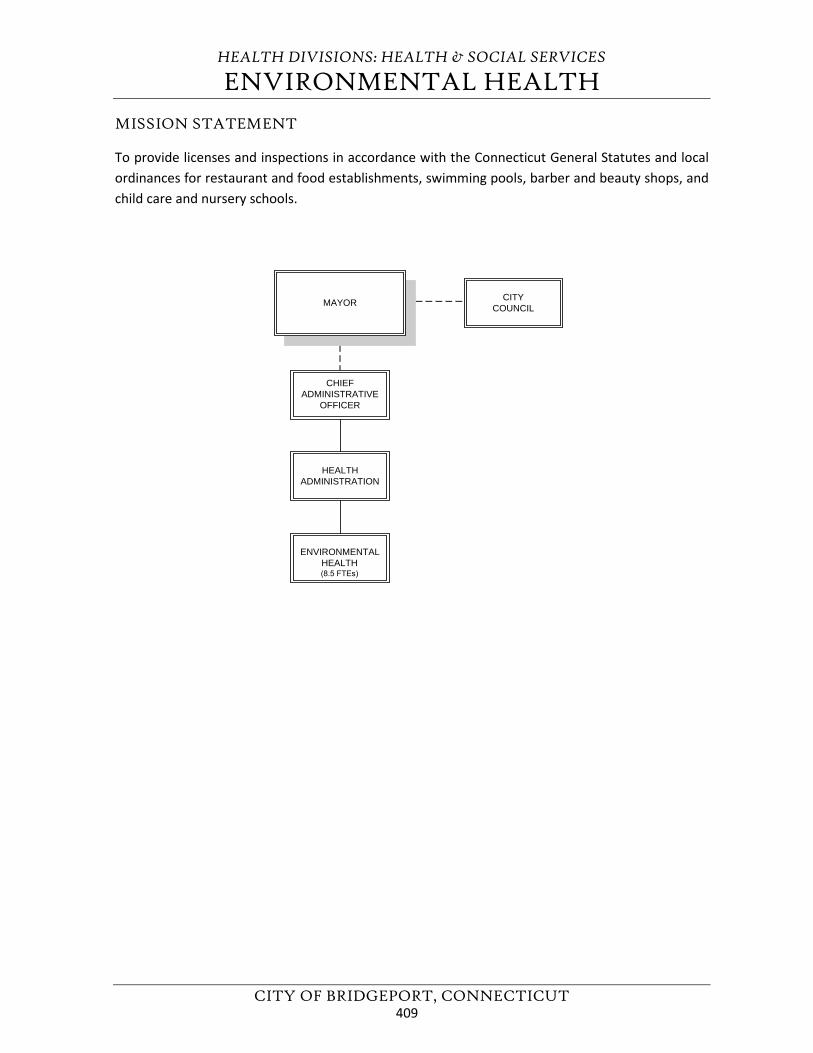
HEALTH DIVISIONS: HEALTH & SOCIAL SERVICES
ENVIRONMENTAL HEALTH
CITY OF BRIDGEPORT, CONNECTICUT
MISSION STATEMENT
To provide licenses and inspections in accordance with the Connecticut General Statutes and local ordinances for restaurant and food establishments, swimming pools, barber and beauty shops, and child care and nursery schools.
CHIEFADMINISTRATIVE
OFFICER
HEALTHADMINISTRATION
ENVIRONMENTALHEALTH (8.5 FTEs)
MAYOR CITYCOUNCIL
409
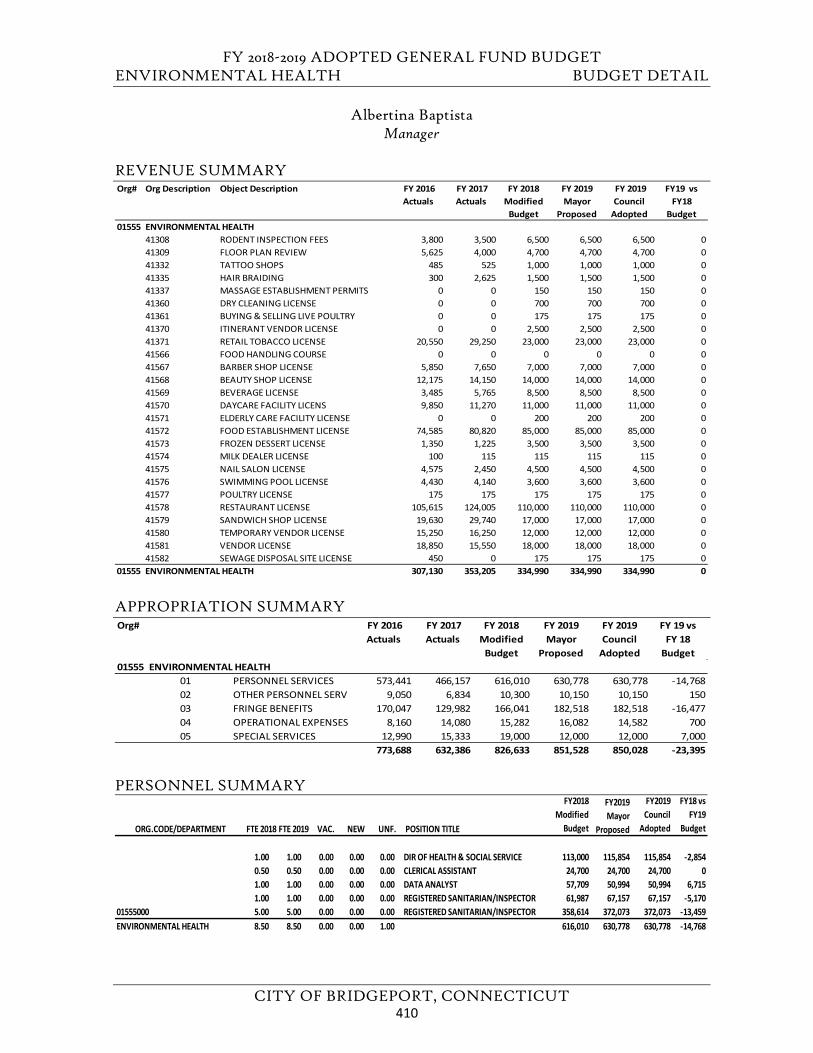
FY 2018-2019 ADOPTED GENERAL FUND BUDGET ENVIRONMENTAL HEALTH BUDGET DETAIL
CITY OF BRIDGEPORT, CONNECTICUT
Albertina Baptista Manager
REVENUE SUMMARY
APPROPRIATION SUMMARY
PERSONNEL SUMMARY
Org# Org Description Object Description FY 2016 Actuals
FY 2017 Actuals
FY 2018 Modified
Budget
FY 2019 Mayor
Proposed
FY 2019 Council
Adopted
FY19 vs FY18
Budget01555 ENVIRONMENTAL HEALTH
41308 RODENT INSPECTION FEES 3,800 3,500 6,500 6,500 6,500 041309 FLOOR PLAN REVIEW 5,625 4,000 4,700 4,700 4,700 041332 TATTOO SHOPS 485 525 1,000 1,000 1,000 041335 HAIR BRAIDING 300 2,625 1,500 1,500 1,500 041337 MASSAGE ESTABLISHMENT PERMITS 0 0 150 150 150 041360 DRY CLEANING LICENSE 0 0 700 700 700 041361 BUYING & SELLING LIVE POULTRY 0 0 175 175 175 041370 ITINERANT VENDOR LICENSE 0 0 2,500 2,500 2,500 041371 RETAIL TOBACCO LICENSE 20,550 29,250 23,000 23,000 23,000 041566 FOOD HANDLING COURSE 0 0 0 0 0 041567 BARBER SHOP LICENSE 5,850 7,650 7,000 7,000 7,000 041568 BEAUTY SHOP LICENSE 12,175 14,150 14,000 14,000 14,000 041569 BEVERAGE LICENSE 3,485 5,765 8,500 8,500 8,500 041570 DAYCARE FACILITY LICENS 9,850 11,270 11,000 11,000 11,000 041571 ELDERLY CARE FACILITY LICENSE 0 0 200 200 200 041572 FOOD ESTABLISHMENT LICENSE 74,585 80,820 85,000 85,000 85,000 041573 FROZEN DESSERT LICENSE 1,350 1,225 3,500 3,500 3,500 041574 MILK DEALER LICENSE 100 115 115 115 115 041575 NAIL SALON LICENSE 4,575 2,450 4,500 4,500 4,500 041576 SWIMMING POOL LICENSE 4,430 4,140 3,600 3,600 3,600 041577 POULTRY LICENSE 175 175 175 175 175 041578 RESTAURANT LICENSE 105,615 124,005 110,000 110,000 110,000 041579 SANDWICH SHOP LICENSE 19,630 29,740 17,000 17,000 17,000 041580 TEMPORARY VENDOR LICENSE 15,250 16,250 12,000 12,000 12,000 041581 VENDOR LICENSE 18,850 15,550 18,000 18,000 18,000 041582 SEWAGE DISPOSAL SITE LICENSE 450 0 175 175 175 0
01555 ENVIRONMENTAL HEALTH 307,130 353,205 334,990 334,990 334,990 0
Org# FY 2016 Actuals
FY 2017 Actuals
FY 2018 Modified
Budget
FY 2019 Mayor
Proposed
FY 2019 Council
Adopted
FY 19 vs FY 18
Budget01555 ENVIRONMENTAL HEALTH
01 PERSONNEL SERVICES 573,441 466,157 616,010 630,778 630,778 -14,76802 OTHER PERSONNEL SERV 9,050 6,834 10,300 10,150 10,150 15003 FRINGE BENEFITS 170,047 129,982 166,041 182,518 182,518 -16,47704 OPERATIONAL EXPENSES 8,160 14,080 15,282 16,082 14,582 70005 SPECIAL SERVICES 12,990 15,333 19,000 12,000 12,000 7,000
773,688 632,386 826,633 851,528 850,028 -23,395
ORG.CODE/DEPARTMENT FTE 2018 FTE 2019 VAC. NEW UNF. POSITION TITLE
FY2018 Modified
Budget
FY2019 Mayor
Proposed
FY2019 Council
Adopted
FY18 vs FY19
Budget
1.00 1.00 0.00 0.00 0.00 DIR OF HEALTH & SOCIAL SERVICE 113,000 115,854 115,854 -2,8540.50 0.50 0.00 0.00 0.00 CLERICAL ASSISTANT 24,700 24,700 24,700 01.00 1.00 0.00 0.00 0.00 DATA ANALYST 57,709 50,994 50,994 6,7151.00 1.00 0.00 0.00 0.00 REGISTERED SANITARIAN/INSPECTOR 61,987 67,157 67,157 -5,170
01555000 5.00 5.00 0.00 0.00 0.00 REGISTERED SANITARIAN/INSPECTOR 358,614 372,073 372,073 -13,459ENVIRONMENTAL HEALTH 8.50 8.50 0.00 0.00 1.00 616,010 630,778 630,778 -14,768
410
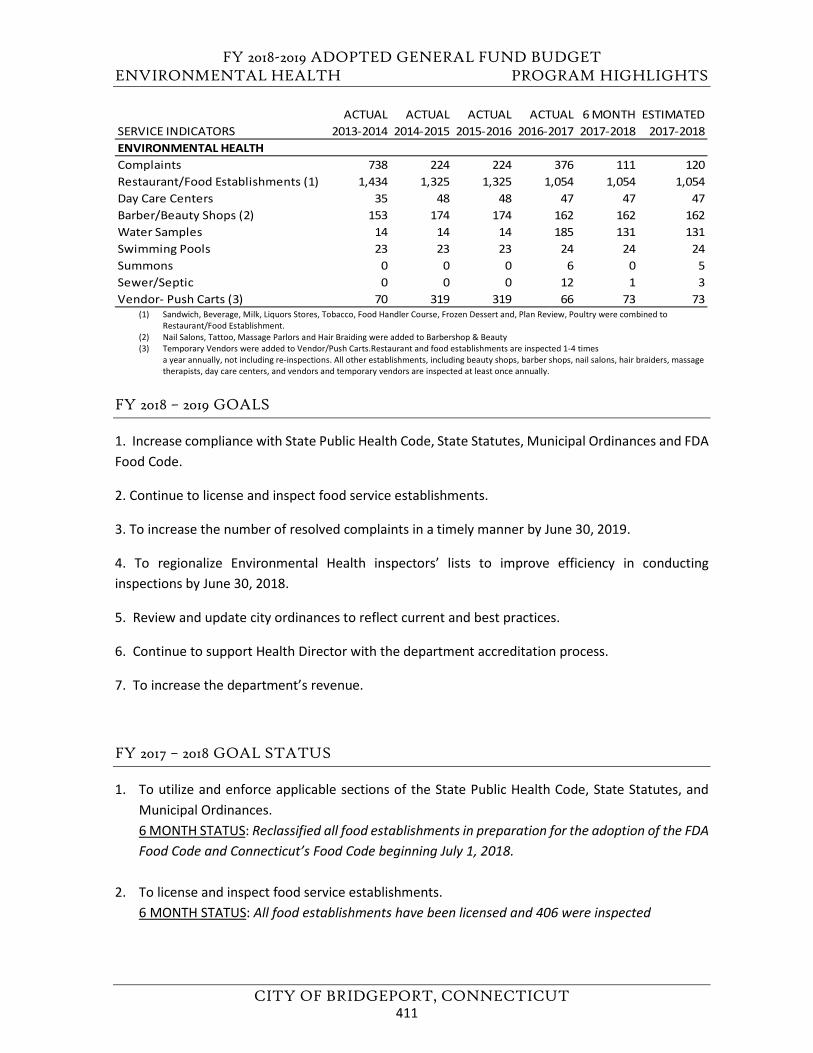
FY 2018-2019 ADOPTED GENERAL FUND BUDGET ENVIRONMENTAL HEALTH PROGRAM HIGHLIGHTS
CITY OF BRIDGEPORT, CONNECTICUT
(1) Sandwich, Beverage, Milk, Liquors Stores, Tobacco, Food Handler Course, Frozen Dessert and, Plan Review, Poultry were combined toRestaurant/Food Establishment.
(2) Nail Salons, Tattoo, Massage Parlors and Hair Braiding were added to Barbershop & Beauty(3) Temporary Vendors were added to Vendor/Push Carts.Restaurant and food establishments are inspected 1-4 times
a year annually, not including re-inspections. All other establishments, including beauty shops, barber shops, nail salons, hair braiders, massagetherapists, day care centers, and vendors and temporary vendors are inspected at least once annually.
FY 2018 – 2019 GOALS
1. Increase compliance with State Public Health Code, State Statutes, Municipal Ordinances and FDAFood Code.
2. Continue to license and inspect food service establishments.
3. To increase the number of resolved complaints in a timely manner by June 30, 2019.
4. To regionalize Environmental Health inspectors’ lists to improve efficiency in conductinginspections by June 30, 2018.
5. Review and update city ordinances to reflect current and best practices.
6. Continue to support Health Director with the department accreditation process.
7. To increase the department’s revenue.
FY 2017 – 2018 GOAL STATUS
1. To utilize and enforce applicable sections of the State Public Health Code, State Statutes, andMunicipal Ordinances.6 MONTH STATUS: Reclassified all food establishments in preparation for the adoption of the FDAFood Code and Connecticut’s Food Code beginning July 1, 2018.
2. To license and inspect food service establishments.6 MONTH STATUS: All food establishments have been licensed and 406 were inspected
ACTUAL ACTUAL ACTUAL ACTUAL 6 MONTH ESTIMATEDSERVICE INDICATORS 2013-2014 2014-2015 2015-2016 2016-2017 2017-2018 2017-2018ENVIRONMENTAL HEALTHComplaints 738 224 224 376 111 120Restaurant/Food Establishments (1) 1,434 1,325 1,325 1,054 1,054 1,054Day Care Centers 35 48 48 47 47 47Barber/Beauty Shops (2) 153 174 174 162 162 162Water Samples 14 14 14 185 131 131Swimming Pools 23 23 23 24 24 24Summons 0 0 0 6 0 5Sewer/Septic 0 0 0 12 1 3Vendor- Push Carts (3) 70 319 319 66 73 73
411
FY 2018-2019 ADOPTED GENERAL FUND BUDGET ENVIRONMENTAL HEALTH PROGRAM HIGHLIGHTS
CITY OF BRIDGEPORT, CONNECTICUT
3. To investigate and resolve public health nuisances and infractions of applicable statutes and/ orordinances.6 MONTH STATUS: A total of 176 nuisance complaints were inspected and resolved.
4. To inspect schools, daycare centers, senior centers and summer lunch feeding sites.6 MONTH STATUS: All 47 schools, 64 daycare centers and summer lunch feeding sites wereinspected.
5. To assist in preparing for and responding to public health emergencies.6 MONTH STATUS: All inspectors have completed the FEMA Incident Command System Coursesto be able to assist in preparing for, and responding to, public health emergencies.
FY 2017 – 2018 ADDITIONAL ACCOMPLISHMENTS
1. Streamlined the license renewal process to improve efficiency in collecting fees and issuinglicenses.
2. Data from Digital Health is now in Excel spreadsheet and shareable.
3. Created a temporary database in Access until Emergo is activated.
4. Modernized the Certified Food Handler Course to offer it online.
412
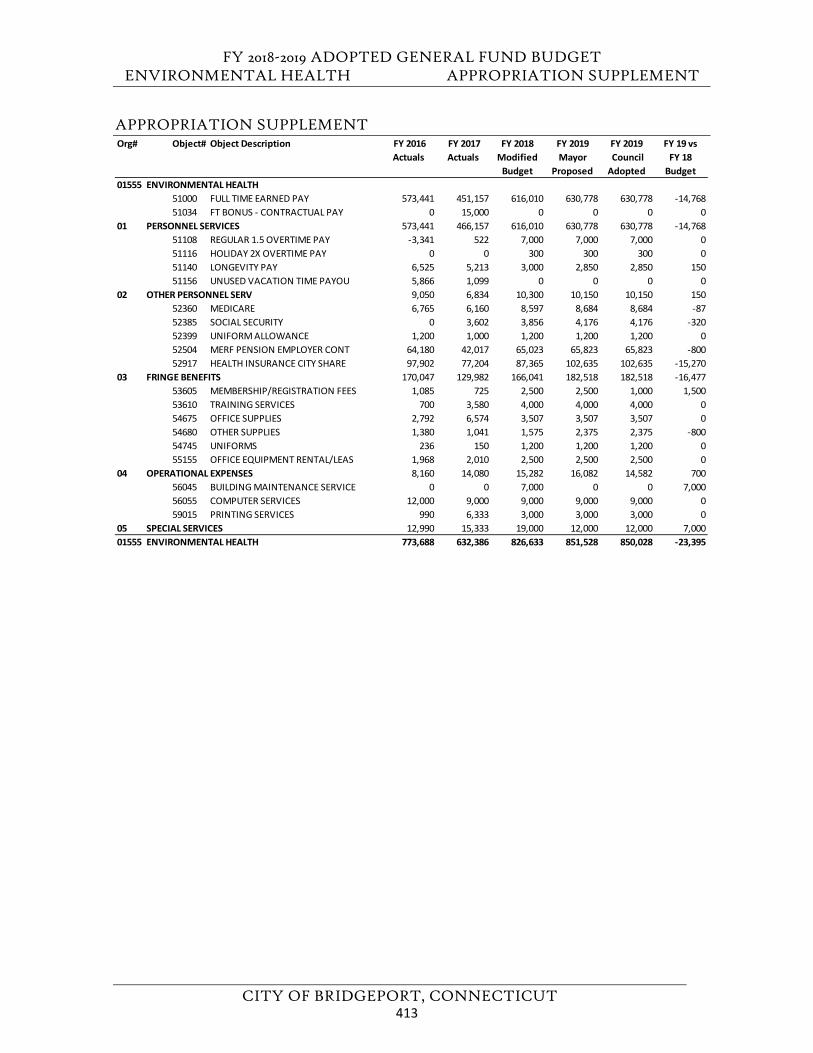
FY 2018-2019 ADOPTED GENERAL FUND BUDGET ENVIRONMENTAL HEALTH APPROPRIATION SUPPLEMENT
CITY OF BRIDGEPORT, CONNECTICUT
APPROPRIATION SUPPLEMENT Org# Object# Object Description FY 2016
Actuals FY 2017 Actuals
FY 2018 Modified
Budget
FY 2019Mayor
Proposed
FY 2019 Council Adopted
FY 19 vs FY 18
Budget01555 ENVIRONMENTAL HEALTH
51000 FULL TIME EARNED PAY 573,441 451,157 616,010 630,778 630,778 -14,76851034 FT BONUS - CONTRACTUAL PAY 0 15,000 0 0 0 0
01 PERSONNEL SERVICES 573,441 466,157 616,010 630,778 630,778 -14,76851108 REGULAR 1.5 OVERTIME PAY -3,341 522 7,000 7,000 7,000 051116 HOLIDAY 2X OVERTIME PAY 0 0 300 300 300 051140 LONGEVITY PAY 6,525 5,213 3,000 2,850 2,850 15051156 UNUSED VACATION TIME PAYOU 5,866 1,099 0 0 0 0
02 OTHER PERSONNEL SERV 9,050 6,834 10,300 10,150 10,150 15052360 MEDICARE 6,765 6,160 8,597 8,684 8,684 -8752385 SOCIAL SECURITY 0 3,602 3,856 4,176 4,176 -32052399 UNIFORM ALLOWANCE 1,200 1,000 1,200 1,200 1,200 052504 MERF PENSION EMPLOYER CONT 64,180 42,017 65,023 65,823 65,823 -80052917 HEALTH INSURANCE CITY SHARE 97,902 77,204 87,365 102,635 102,635 -15,270
03 FRINGE BENEFITS 170,047 129,982 166,041 182,518 182,518 -16,47753605 MEMBERSHIP/REGISTRATION FEES 1,085 725 2,500 2,500 1,000 1,50053610 TRAINING SERVICES 700 3,580 4,000 4,000 4,000 054675 OFFICE SUPPLIES 2,792 6,574 3,507 3,507 3,507 054680 OTHER SUPPLIES 1,380 1,041 1,575 2,375 2,375 -80054745 UNIFORMS 236 150 1,200 1,200 1,200 055155 OFFICE EQUIPMENT RENTAL/LEAS 1,968 2,010 2,500 2,500 2,500 0
04 OPERATIONAL EXPENSES 8,160 14,080 15,282 16,082 14,582 70056045 BUILDING MAINTENANCE SERVICE 0 0 7,000 0 0 7,00056055 COMPUTER SERVICES 12,000 9,000 9,000 9,000 9,000 059015 PRINTING SERVICES 990 6,333 3,000 3,000 3,000 0
05 SPECIAL SERVICES 12,990 15,333 19,000 12,000 12,000 7,00001555 ENVIRONMENTAL HEALTH 773,688 632,386 826,633 851,528 850,028 -23,395
413

FY 2018-2019 ADOPTED GENERAL FUND BUDGET
CITY OF BRIDGEPORT, CONNECTICUT
This page left blank intentionally.
414
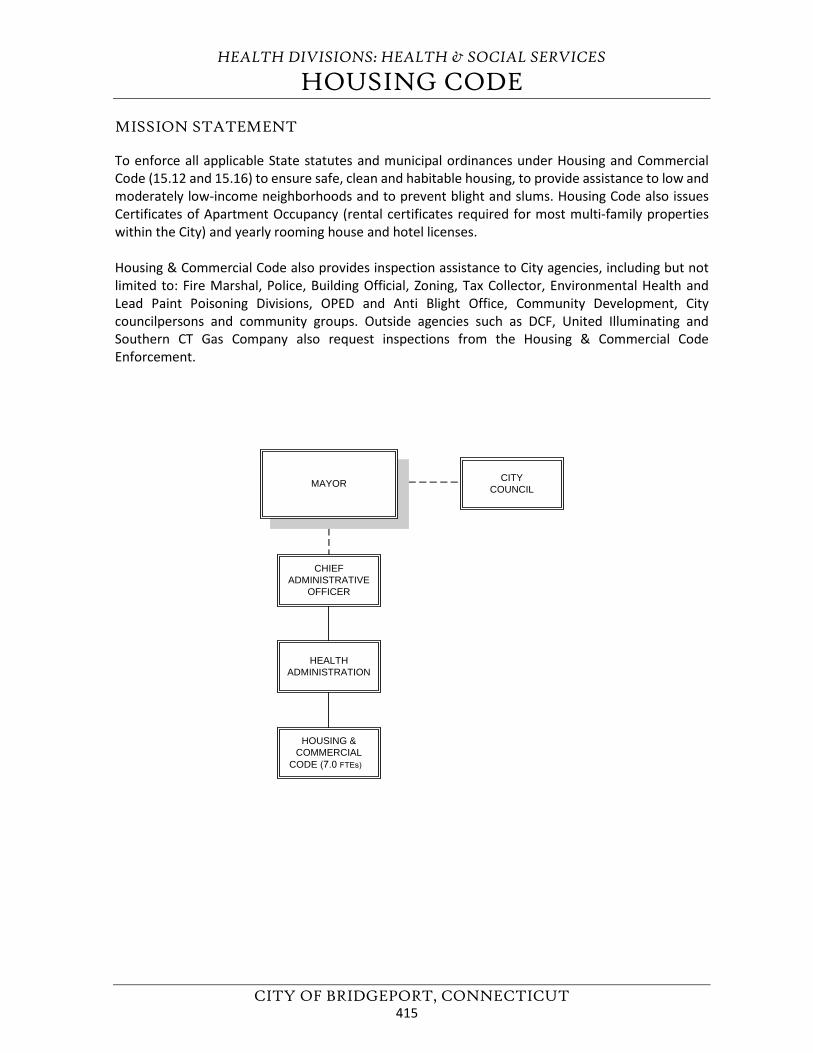
HEALTH DIVISIONS: HEALTH & SOCIAL SERVICES
HOUSING CODE
CITY OF BRIDGEPORT, CONNECTICUT
MISSION STATEMENT
To enforce all applicable State statutes and municipal ordinances under Housing and Commercial Code (15.12 and 15.16) to ensure safe, clean and habitable housing, to provide assistance to low and moderately low-income neighborhoods and to prevent blight and slums. Housing Code also issues Certificates of Apartment Occupancy (rental certificates required for most multi-family properties within the City) and yearly rooming house and hotel licenses.
Housing & Commercial Code also provides inspection assistance to City agencies, including but not limited to: Fire Marshal, Police, Building Official, Zoning, Tax Collector, Environmental Health and Lead Paint Poisoning Divisions, OPED and Anti Blight Office, Community Development, City councilpersons and community groups. Outside agencies such as DCF, United Illuminating and Southern CT Gas Company also request inspections from the Housing & Commercial Code Enforcement.
CHIEFADMINISTRATIVE
OFFICER
HEALTHADMINISTRATION
HOUSING &COMMERCIAL
CODE (7.0 FTEs)
MAYOR CITYCOUNCIL
415
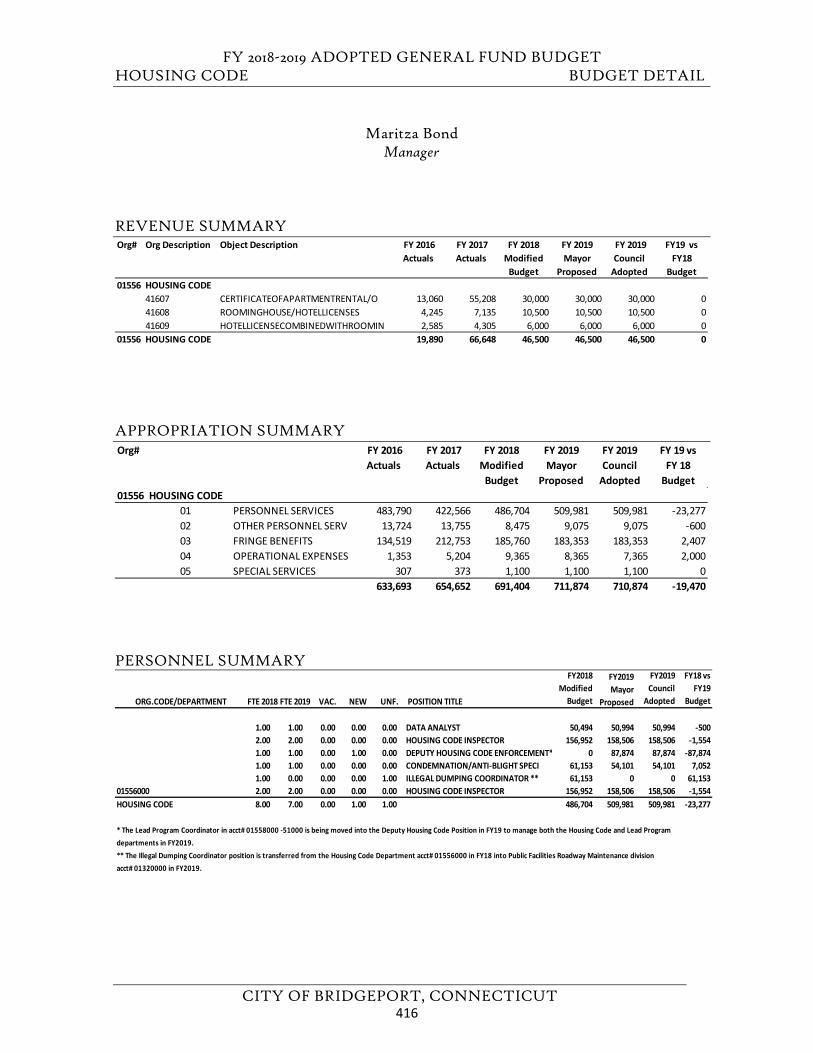
FY 2018-2019 ADOPTED GENERAL FUND BUDGET HOUSING CODE BUDGET DETAIL
CITY OF BRIDGEPORT, CONNECTICUT
Maritza Bond Manager
REVENUE SUMMARY
APPROPRIATION SUMMARY
PERSONNEL SUMMARY
Org# Org Description Object Description FY 2016 Actuals
FY 2017 Actuals
FY 2018 Modified
Budget
FY 2019 Mayor
Proposed
FY 2019 Council
Adopted
FY19 vs FY18
Budget01556 HOUSING CODE
41607 CERTIFICATEOFAPARTMENTRENTAL/O 13,060 55,208 30,000 30,000 30,000 041608 ROOMINGHOUSE/HOTELLICENSES 4,245 7,135 10,500 10,500 10,500 041609 HOTELLICENSECOMBINEDWITHROOMIN 2,585 4,305 6,000 6,000 6,000 0
01556 HOUSING CODE 19,890 66,648 46,500 46,500 46,500 0
Org# FY 2016 Actuals
FY 2017 Actuals
FY 2018 Modified
Budget
FY 2019 Mayor
Proposed
FY 2019 Council
Adopted
FY 19 vs FY 18
Budget01556 HOUSING CODE
01 PERSONNEL SERVICES 483,790 422,566 486,704 509,981 509,981 -23,27702 OTHER PERSONNEL SERV 13,724 13,755 8,475 9,075 9,075 -60003 FRINGE BENEFITS 134,519 212,753 185,760 183,353 183,353 2,40704 OPERATIONAL EXPENSES 1,353 5,204 9,365 8,365 7,365 2,00005 SPECIAL SERVICES 307 373 1,100 1,100 1,100 0
633,693 654,652 691,404 711,874 710,874 -19,470
ORG.CODE/DEPARTMENT FTE 2018 FTE 2019 VAC. NEW UNF. POSITION TITLE
FY2018 Modified
Budget
FY2019 Mayor
Proposed
FY2019 Council
Adopted
FY18 vs FY19
Budget
1.00 1.00 0.00 0.00 0.00 DATA ANALYST 50,494 50,994 50,994 -5002.00 2.00 0.00 0.00 0.00 HOUSING CODE INSPECTOR 156,952 158,506 158,506 -1,5541.00 1.00 0.00 1.00 0.00 DEPUTY HOUSING CODE ENFORCEMENT* 0 87,874 87,874 -87,8741.00 1.00 0.00 0.00 0.00 CONDEMNATION/ANTI-BLIGHT SPECI 61,153 54,101 54,101 7,0521.00 0.00 0.00 0.00 1.00 ILLEGAL DUMPING COORDINATOR ** 61,153 0 0 61,153
01556000 2.00 2.00 0.00 0.00 0.00 HOUSING CODE INSPECTOR 156,952 158,506 158,506 -1,554HOUSING CODE 8.00 7.00 0.00 1.00 1.00 486,704 509,981 509,981 -23,277
* The Lead Program Coordinator in acct# 01558000 -51000 is being moved into the Deputy Housing Code Position in FY19 to manage both the Housing Code and Lead Programdepartments in FY2019.** The Illegal Dumping Coordinator position is transferred from the Housing Code Department acct# 01556000 in FY18 into Public Facilities Roadway Maintenance division acct# 01320000 in FY2019.
416
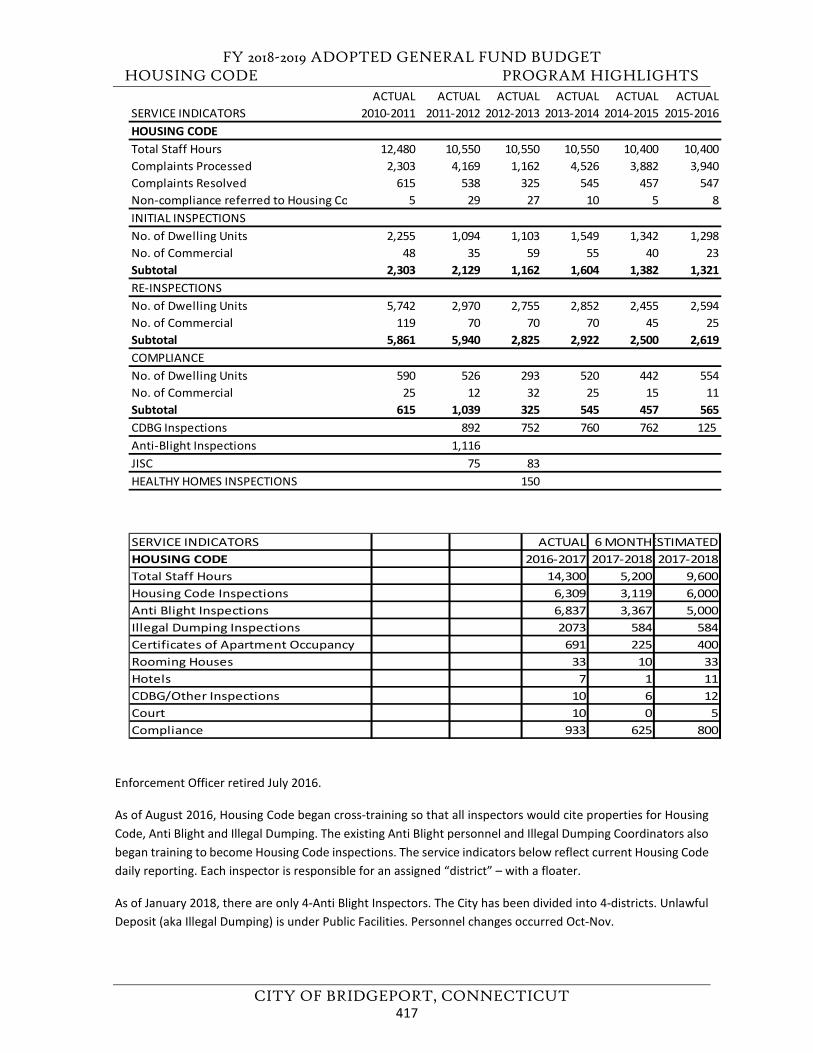
FY 2018-2019 ADOPTED GENERAL FUND BUDGET HOUSING CODE PROGRAM HIGHLIGHTS
CITY OF BRIDGEPORT, CONNECTICUT
Enforcement Officer retired July 2016.
As of August 2016, Housing Code began cross-training so that all inspectors would cite properties for Housing Code, Anti Blight and Illegal Dumping. The existing Anti Blight personnel and Illegal Dumping Coordinators also began training to become Housing Code inspections. The service indicators below reflect current Housing Code daily reporting. Each inspector is responsible for an assigned “district” – with a floater.
As of January 2018, there are only 4-Anti Blight Inspectors. The City has been divided into 4-districts. Unlawful Deposit (aka Illegal Dumping) is under Public Facilities. Personnel changes occurred Oct-Nov.
ACTUAL ACTUAL ACTUAL ACTUAL ACTUAL ACTUALSERVICE INDICATORS 2010-2011 2011-2012 2012-2013 2013-2014 2014-2015 2015-2016HOUSING CODETotal Staff Hours 12,480 10,550 10,550 10,550 10,400 10,400Complaints Processed 2,303 4,169 1,162 4,526 3,882 3,940Complaints Resolved 615 538 325 545 457 547Non-compliance referred to Housing Co 5 29 27 10 5 8INITIAL INSPECTIONSNo. of Dwelling Units 2,255 1,094 1,103 1,549 1,342 1,298No. of Commercial 48 35 59 55 40 23Subtotal 2,303 2,129 1,162 1,604 1,382 1,321RE-INSPECTIONSNo. of Dwelling Units 5,742 2,970 2,755 2,852 2,455 2,594No. of Commercial 119 70 70 70 45 25Subtotal 5,861 5,940 2,825 2,922 2,500 2,619COMPLIANCENo. of Dwelling Units 590 526 293 520 442 554No. of Commercial 25 12 32 25 15 11Subtotal 615 1,039 325 545 457 565CDBG Inspections 892 752 760 762 125 Anti-Blight Inspections 1,116JISC 75 83HEALTHY HOMES INSPECTIONS 150
SERVICE INDICATORS ACTUAL 6 MONTHESTIMATEDHOUSING CODE 2016-2017 2017-2018 2017-2018Total Staff Hours 14,300 5,200 9,600Housing Code Inspections 6,309 3,119 6,000Anti Blight Inspections 6,837 3,367 5,000Illegal Dumping Inspections 2073 584 584Certificates of Apartment Occupancy 691 225 400Rooming Houses 33 10 33Hotels 7 1 11CDBG/Other Inspections 10 6 12Court 10 0 5Compliance 933 625 800
417
FY 2018-2019 ADOPTED GENERAL FUND BUDGET HOUSING CODE PROGRAM HIGHLIGHTS
CITY OF BRIDGEPORT, CONNECTICUT
FY 2018 – 2019 GOALS
1. Increase revenue by enforcing Certificate of Apartment Occupancy Ordinance and RoomingHouse/Hotel Ordinance
2. Continue Anti Blight efforts by identifying, citing and bringing to hearing all blightedproperties and neighborhoods throughout the City
3. Continue to streamline process and participating in the integration of the Energov program
FY 2017 – 2018 GOAL STATUS
1. Increase revenue by enforcing Certificate of Apartment Occupancy Ordinance and RoomingHouse/Hotel Ordinance6-Month Status:• 225-Certificates of Apartment Occupancy applications/units; 10-Rooming House
applications/buildings; 1-Hotel application (the rest come due in April)• Enforcement letter to be sent to owners of Bridgeport Towers (55-Shell Street & 199 Yacht
Street) that 126-units need CAO’s.• Enforcement letter to be sent to new owners of large apartments buildings at 14-targeted
addresses• Will target delinquent Rooming House licenses
2. Continue to canvass districts to immediately confront blighted properties and illegal dumpingproblems and bring Housing Code complaints into compliance sooner6-Month Status:• 6,837 Anti Blight cases• 2,073 Illegal Dumping cases (to be continued under Public Facilities)• 7-Hearings since July 2017
3. Streamline process – including implementing uniform code compliance database – Energov andcross training between Housing Code and Environmental Health Data Analyst and reduction inextraneous steps in the procedures for both offices
6-Month Status:• All requested data and workflow process has been submitted for Energov• Housing Code & Environmental Health Data Analysts have finished cross-training. Anti-Blight
Admin has also been cross-trained in Housing Code and Environmental Health procedures• Inspectors capably use iPads, iPhones and desk computers to process their work
.
418
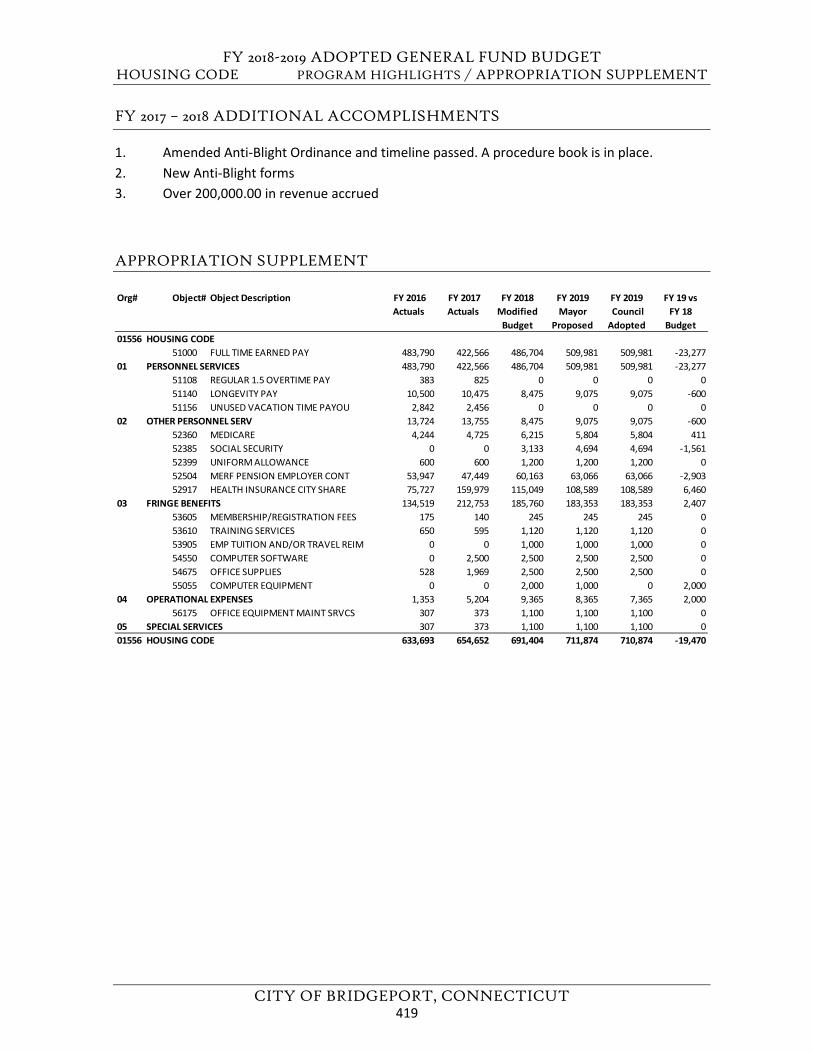
FY 2018-2019 ADOPTED GENERAL FUND BUDGET HOUSING CODE PROGRAM HIGHLIGHTS / APPROPRIATION SUPPLEMENT
CITY OF BRIDGEPORT, CONNECTICUT
FY 2017 – 2018 ADDITIONAL ACCOMPLISHMENTS
1. Amended Anti-Blight Ordinance and timeline passed. A procedure book is in place.2. New Anti-Blight forms3. Over 200,000.00 in revenue accrued
APPROPRIATION SUPPLEMENT
Org# Object# Object Description FY 2016 Actuals
FY 2017 Actuals
FY 2018 Modified
Budget
FY 2019Mayor
Proposed
FY 2019 Council Adopted
FY 19 vs FY 18
Budget01556 HOUSING CODE
51000 FULL TIME EARNED PAY 483,790 422,566 486,704 509,981 509,981 -23,27701 PERSONNEL SERVICES 483,790 422,566 486,704 509,981 509,981 -23,277
51108 REGULAR 1.5 OVERTIME PAY 383 825 0 0 0 051140 LONGEVITY PAY 10,500 10,475 8,475 9,075 9,075 -60051156 UNUSED VACATION TIME PAYOU 2,842 2,456 0 0 0 0
02 OTHER PERSONNEL SERV 13,724 13,755 8,475 9,075 9,075 -60052360 MEDICARE 4,244 4,725 6,215 5,804 5,804 41152385 SOCIAL SECURITY 0 0 3,133 4,694 4,694 -1,56152399 UNIFORM ALLOWANCE 600 600 1,200 1,200 1,200 052504 MERF PENSION EMPLOYER CONT 53,947 47,449 60,163 63,066 63,066 -2,90352917 HEALTH INSURANCE CITY SHARE 75,727 159,979 115,049 108,589 108,589 6,460
03 FRINGE BENEFITS 134,519 212,753 185,760 183,353 183,353 2,40753605 MEMBERSHIP/REGISTRATION FEES 175 140 245 245 245 053610 TRAINING SERVICES 650 595 1,120 1,120 1,120 053905 EMP TUITION AND/OR TRAVEL REIM 0 0 1,000 1,000 1,000 054550 COMPUTER SOFTWARE 0 2,500 2,500 2,500 2,500 054675 OFFICE SUPPLIES 528 1,969 2,500 2,500 2,500 055055 COMPUTER EQUIPMENT 0 0 2,000 1,000 0 2,000
04 OPERATIONAL EXPENSES 1,353 5,204 9,365 8,365 7,365 2,00056175 OFFICE EQUIPMENT MAINT SRVCS 307 373 1,100 1,100 1,100 0
05 SPECIAL SERVICES 307 373 1,100 1,100 1,100 001556 HOUSING CODE 633,693 654,652 691,404 711,874 710,874 -19,470
419

FY 2018-2019 ADOPTED GENERAL FUND BUDGET
CITY OF BRIDGEPORT, CONNECTICUT
This page left blank intentionally.
420
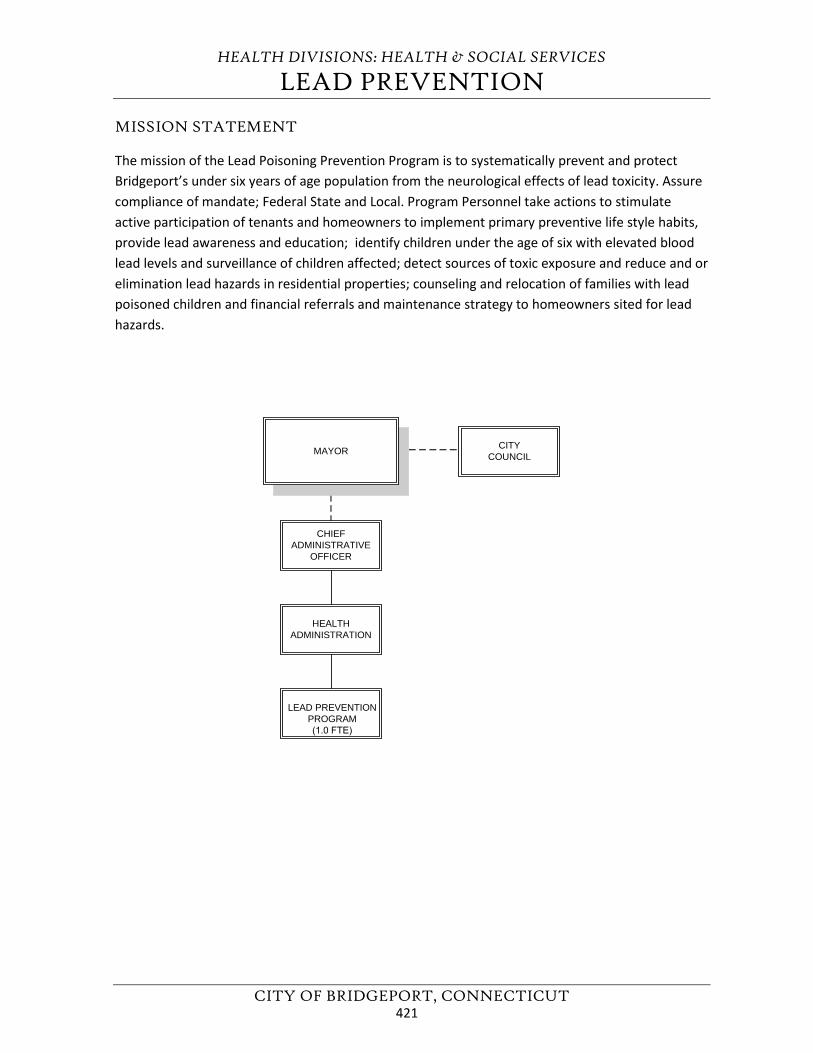
HEALTH DIVISIONS: HEALTH & SOCIAL SERVICES
LEAD PREVENTION
CITY OF BRIDGEPORT, CONNECTICUT
MISSION STATEMENT
The mission of the Lead Poisoning Prevention Program is to systematically prevent and protect Bridgeport’s under six years of age population from the neurological effects of lead toxicity. Assure compliance of mandate; Federal State and Local. Program Personnel take actions to stimulate active participation of tenants and homeowners to implement primary preventive life style habits, provide lead awareness and education; identify children under the age of six with elevated blood lead levels and surveillance of children affected; detect sources of toxic exposure and reduce and or elimination lead hazards in residential properties; counseling and relocation of families with lead poisoned children and financial referrals and maintenance strategy to homeowners sited for lead hazards.
CHIEFADMINISTRATIVE
OFFICER
HEALTHADMINISTRATION
LEAD PREVENTION PROGRAM (1.0 FTE)
MAYOR CITYCOUNCIL
421
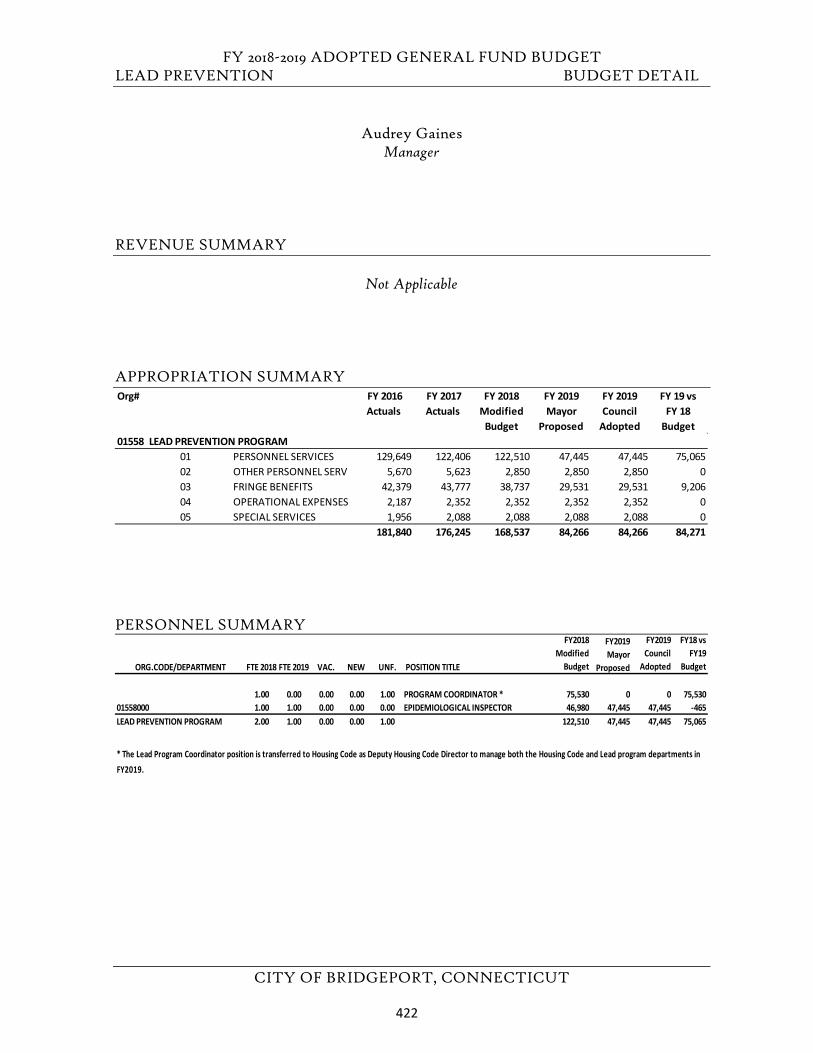
FY 2018-2019 ADOPTED GENERAL FUND BUDGET LEAD PREVENTION BUDGET DETAIL
CITY OF BRIDGEPORT, CONNECTICUT
Audrey Gaines Manager
REVENUE SUMMARY
Not Applicable
APPROPRIATION SUMMARY
PERSONNEL SUMMARY
Org# FY 2016 Actuals
FY 2017 Actuals
FY 2018 Modified
Budget
FY 2019 Mayor
Proposed
FY 2019 Council
Adopted
FY 19 vs FY 18
Budget01558 LEAD PREVENTION PROGRAM
01 PERSONNEL SERVICES 129,649 122,406 122,510 47,445 47,445 75,06502 OTHER PERSONNEL SERV 5,670 5,623 2,850 2,850 2,850 003 FRINGE BENEFITS 42,379 43,777 38,737 29,531 29,531 9,20604 OPERATIONAL EXPENSES 2,187 2,352 2,352 2,352 2,352 005 SPECIAL SERVICES 1,956 2,088 2,088 2,088 2,088 0
181,840 176,245 168,537 84,266 84,266 84,271
ORG.CODE/DEPARTMENT FTE 2018 FTE 2019 VAC. NEW UNF. POSITION TITLE
FY2018 Modified
Budget
FY2019 Mayor
Proposed
FY2019 Council
Adopted
FY18 vs FY19
Budget
1.00 0.00 0.00 0.00 1.00 PROGRAM COORDINATOR * 75,530 0 0 75,53001558000 1.00 1.00 0.00 0.00 0.00 EPIDEMIOLOGICAL INSPECTOR 46,980 47,445 47,445 -465LEAD PREVENTION PROGRAM 2.00 1.00 0.00 0.00 1.00 122,510 47,445 47,445 75,065
* The Lead Program Coordinator position is transferred to Housing Code as Deputy Housing Code Director to manage both the Housing Code and Lead program departments inFY2019.
422
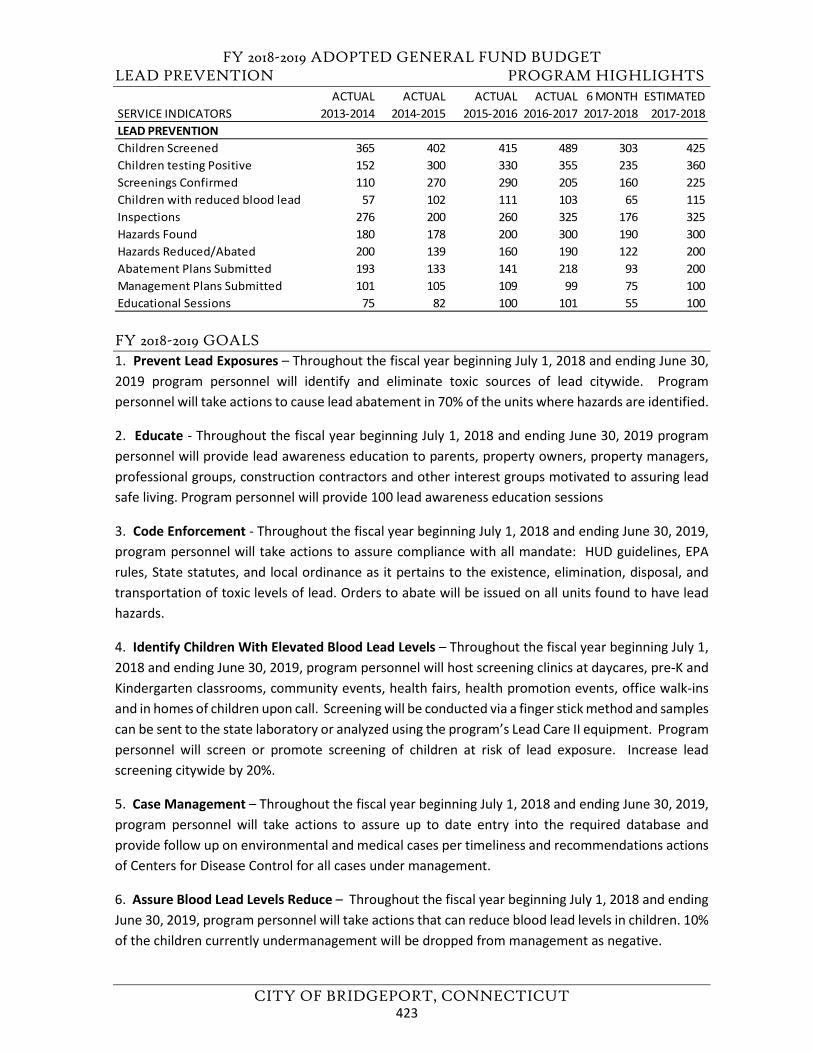
FY 2018-2019 ADOPTED GENERAL FUND BUDGET LEAD PREVENTION PROGRAM HIGHLIGHTS
CITY OF BRIDGEPORT, CONNECTICUT
FY 2018-2019 GOALS 1. Prevent Lead Exposures – Throughout the fiscal year beginning July 1, 2018 and ending June 30,2019 program personnel will identify and eliminate toxic sources of lead citywide. Program personnel will take actions to cause lead abatement in 70% of the units where hazards are identified.
2. Educate - Throughout the fiscal year beginning July 1, 2018 and ending June 30, 2019 programpersonnel will provide lead awareness education to parents, property owners, property managers,professional groups, construction contractors and other interest groups motivated to assuring leadsafe living. Program personnel will provide 100 lead awareness education sessions
3. Code Enforcement - Throughout the fiscal year beginning July 1, 2018 and ending June 30, 2019,program personnel will take actions to assure compliance with all mandate: HUD guidelines, EPArules, State statutes, and local ordinance as it pertains to the existence, elimination, disposal, andtransportation of toxic levels of lead. Orders to abate will be issued on all units found to have leadhazards.
4. Identify Children With Elevated Blood Lead Levels – Throughout the fiscal year beginning July 1,2018 and ending June 30, 2019, program personnel will host screening clinics at daycares, pre-K andKindergarten classrooms, community events, health fairs, health promotion events, office walk-insand in homes of children upon call. Screening will be conducted via a finger stick method and samples can be sent to the state laboratory or analyzed using the program’s Lead Care II equipment. Program personnel will screen or promote screening of children at risk of lead exposure. Increase leadscreening citywide by 20%.
5. Case Management – Throughout the fiscal year beginning July 1, 2018 and ending June 30, 2019,program personnel will take actions to assure up to date entry into the required database andprovide follow up on environmental and medical cases per timeliness and recommendations actionsof Centers for Disease Control for all cases under management.
6. Assure Blood Lead Levels Reduce – Throughout the fiscal year beginning July 1, 2018 and endingJune 30, 2019, program personnel will take actions that can reduce blood lead levels in children. 10%of the children currently undermanagement will be dropped from management as negative.
ACTUAL ACTUAL ACTUAL ACTUAL 6 MONTH ESTIMATEDSERVICE INDICATORS 2013-2014 2014-2015 2015-2016 2016-2017 2017-2018 2017-2018LEAD PREVENTIONChildren Screened 365 402 415 489 303 425Children testing Positive 152 300 330 355 235 360Screenings Confirmed 110 270 290 205 160 225Children with reduced blood lead 57 102 111 103 65 115Inspections 276 200 260 325 176 325Hazards Found 180 178 200 300 190 300Hazards Reduced/Abated 200 139 160 190 122 200Abatement Plans Submitted 193 133 141 218 93 200Management Plans Submitted 101 105 109 99 75 100Educational Sessions 75 82 100 101 55 100
423
FY 2018-2019 ADOPTED GENERAL FUND BUDGET LEAD PREVENTION PROGRAM HIGHLIGHTS
CITY OF BRIDGEPORT, CONNECTICUT
7. Assure Safe Hazard Removal – Throughout the fiscal year beginning July 1, 2018 and ending June30, 2019, program personnel will monitor lead abatement activates and assure safe removalmethods are applied citywide for all abatement activities.
8. Increase Revenue – Throughout the fiscal year beginning July 1, 2018 and ending June 30, 2019,program personnel will promote lead inspections for insurance and day cares to increase revenue.
9. Assure Current Public Announcements – Throughout the fiscal year beginning July 1, 2018 andending June 30, 2019, program personnel will provide updated lead awareness and lead safetyannouncements to be uploaded on the website for the City of Bridgeport and social media sites.
10. Become Accredited - Throughout the fiscal year beginning July 1, 2018 and ending June 30, 2019,the program Manager will take actions to secure accreditation.
FY2017-2018 GOAL STATUS
1. Prevent lead exposures - by identifying existing and potential lead hazards before childrenare affected. Conduct comprehensive lead inspection at all properties built prior to December 1978, where children dwell or frequent. From 7/1/17 thru 12/31/17, 111 inspections werecompleted
2. Educate – provide general lead awareness knowledge so that parents, property owners,property managers can identify lead hazards and the potential of lead hazards in their homes.Knowing the health effects elevated blood lead levels and how it affects the quality of life.Assist property owners and lead contractors with the selection of lead hazard control methods that are safe, effective, feasible and sustainable. From 7/1/17thru 12/31/17, 55 educationalsessions were completed
3. Code Enforcement - assure homeowners, contractors, and other parties subject to leadhazard control mandates achieve and maintain compliance. Assure compliance of HUDregulations, EPA rules, state statutes and local ordinances. From 7/1/17 thru 12/31/17, 105hazards were eliminated
4. Identify children with elevated blood lead levels - via blood screenings held in schools,homes, daycares, health promotion events and office walk-ins. Assure that children identified with positive lead screenings obtain a confirmatory lead test. From 7/1/17 thru 12/31/17,273 children were screened of which 160 were found to require follow up testing andmonitoring.
5. Case Management - environmental and medical actions, maintain surveillance Maven. From7/1/17 thru 12/31/17, case management was delivered on 489 cases.
424
FY 2018-2019 ADOPTED GENERAL FUND BUDGET LEAD PREVENTION PROGRAM HIGHLIGHTS
CITY OF BRIDGEPORT, CONNECTICUT
6. Assure blood lead levels reduce - elevated identified in a child will reduce annually. From7/1/17 thru 12/31/17, 62 children had reductions in their blood lead levels.
7. Assure safe hazard removal – of sources identified in homes where children dwell or locations they frequent. From 7/1/17 thru 12/31/17, 197 hazards were identified of which 86 wereeliminated.
8. Increase revenue - by increasing fee collection and incorporating medical billing. No newprogress. However, fee collection did increase for the previous annum.
9. Maintain web page - question and answer, events and updates. From 7/1/17 thru 12/31/17,webpage was updated. Updated data is being provided on the internet.
10. Finish the process of to become accredited - by applying to PHAB and completing thenecessary steps to be reviewed. From 7/1/17 thru 12/31/17, activities continued.
FY 2017 – 2018 ADDITIONAL ACCOMPLISHMENT
1. The program is enthused to administer the awarded HUD grant, Bridgeport Lead Hazard Control.The duration of the grant is 3 years and will be executed during fiscal 2018.
1) Finish the process to become accredited - by applying to PHAB and completing the necessary steps to be reviewed.
6 MONTH STATUS: From 7/1/17 thru 12/31/17, activities continued.
3 MONTH STATUS: From 1/1/18 thru 3/31/18, activities continue. It is expected that activities will continue thru 10/31/18
425
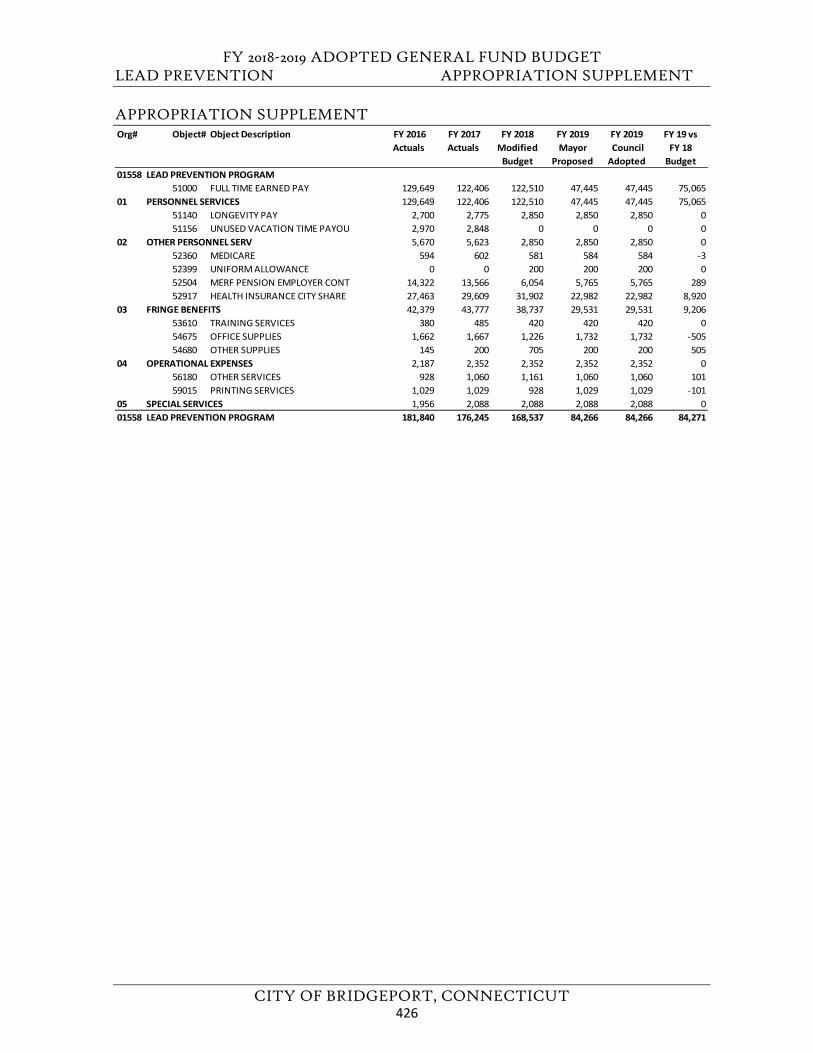
FY 2018-2019 ADOPTED GENERAL FUND BUDGET LEAD PREVENTION APPROPRIATION SUPPLEMENT
CITY OF BRIDGEPORT, CONNECTICUT
APPROPRIATION SUPPLEMENT Org# Object# Object Description FY 2016
Actuals FY 2017 Actuals
FY 2018 Modified
Budget
FY 2019Mayor
Proposed
FY 2019 Council Adopted
FY 19 vs FY 18
Budget01558 LEAD PREVENTION PROGRAM
51000 FULL TIME EARNED PAY 129,649 122,406 122,510 47,445 47,445 75,06501 PERSONNEL SERVICES 129,649 122,406 122,510 47,445 47,445 75,065
51140 LONGEVITY PAY 2,700 2,775 2,850 2,850 2,850 051156 UNUSED VACATION TIME PAYOU 2,970 2,848 0 0 0 0
02 OTHER PERSONNEL SERV 5,670 5,623 2,850 2,850 2,850 052360 MEDICARE 594 602 581 584 584 -352399 UNIFORM ALLOWANCE 0 0 200 200 200 052504 MERF PENSION EMPLOYER CONT 14,322 13,566 6,054 5,765 5,765 28952917 HEALTH INSURANCE CITY SHARE 27,463 29,609 31,902 22,982 22,982 8,920
03 FRINGE BENEFITS 42,379 43,777 38,737 29,531 29,531 9,20653610 TRAINING SERVICES 380 485 420 420 420 054675 OFFICE SUPPLIES 1,662 1,667 1,226 1,732 1,732 -50554680 OTHER SUPPLIES 145 200 705 200 200 505
04 OPERATIONAL EXPENSES 2,187 2,352 2,352 2,352 2,352 056180 OTHER SERVICES 928 1,060 1,161 1,060 1,060 10159015 PRINTING SERVICES 1,029 1,029 928 1,029 1,029 -101
05 SPECIAL SERVICES 1,956 2,088 2,088 2,088 2,088 001558 LEAD PREVENTION PROGRAM 181,840 176,245 168,537 84,266 84,266 84,271
426
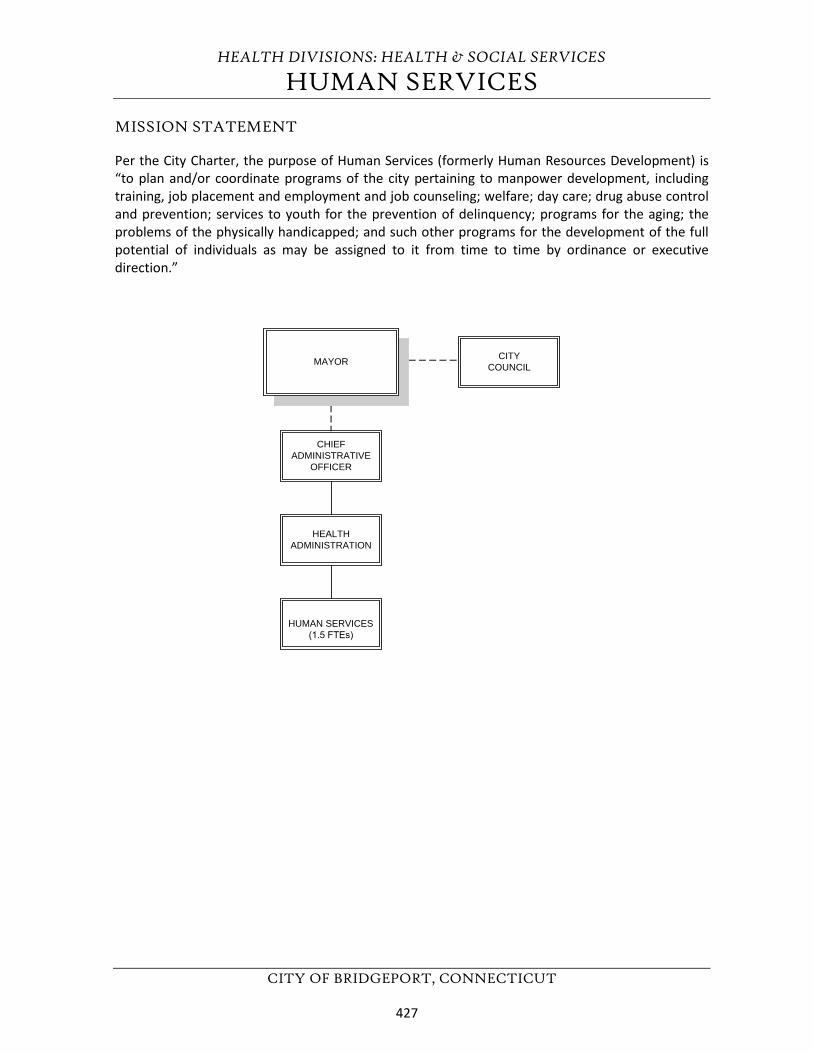
HEALTH DIVISIONS: HEALTH & SOCIAL SERVICES
HUMAN SERVICES
CITY OF BRIDGEPORT, CONNECTICUT
MISSION STATEMENT
Per the City Charter, the purpose of Human Services (formerly Human Resources Development) is “to plan and/or coordinate programs of the city pertaining to manpower development, including training, job placement and employment and job counseling; welfare; day care; drug abuse control and prevention; services to youth for the prevention of delinquency; programs for the aging; the problems of the physically handicapped; and such other programs for the development of the full potential of individuals as may be assigned to it from time to time by ordinance or executive direction.”
CHIEFADMINISTRATIVE
OFFICER
HEALTHADMINISTRATION
HUMAN SERVICES(1.5 FTEs)
MAYOR CITYCOUNCIL
427
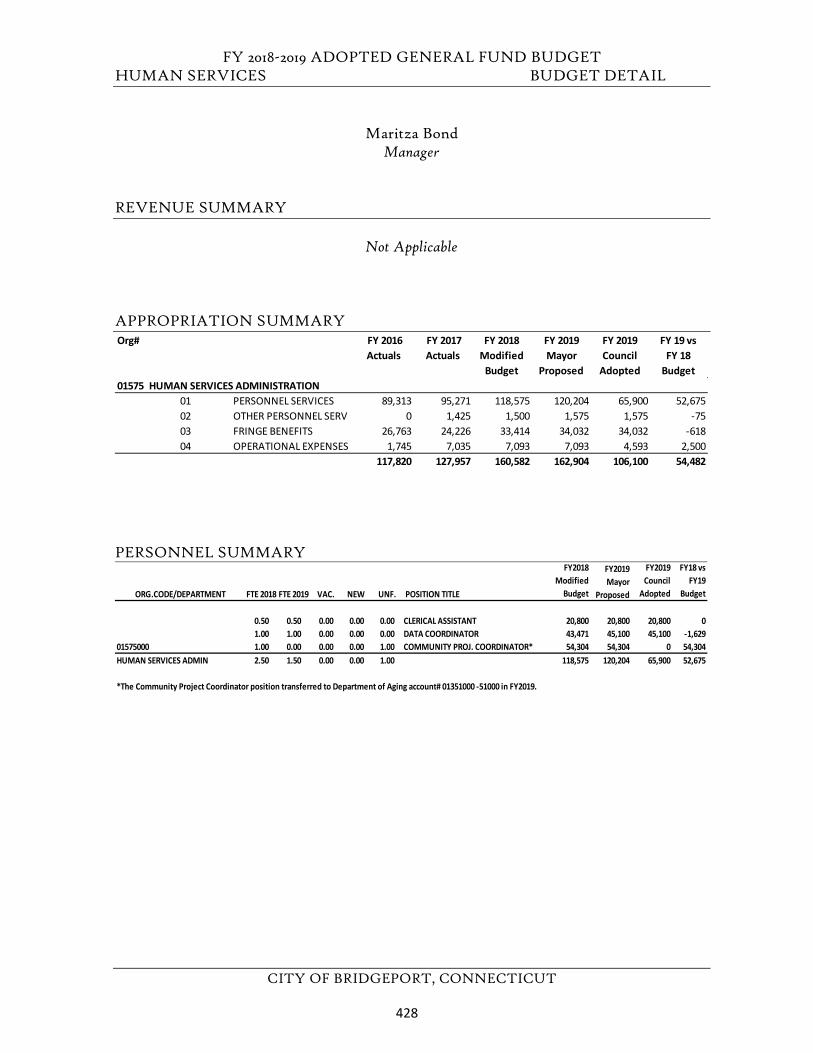
FY 2018-2019 ADOPTED GENERAL FUND BUDGET HUMAN SERVICES BUDGET DETAIL
CITY OF BRIDGEPORT, CONNECTICUT
Maritza Bond Manager
REVENUE SUMMARY
Not Applicable
APPROPRIATION SUMMARY
PERSONNEL SUMMARY
Org# FY 2016 Actuals
FY 2017 Actuals
FY 2018 Modified
Budget
FY 2019 Mayor
Proposed
FY 2019 Council
Adopted
FY 19 vs FY 18
Budget01575 HUMAN SERVICES ADMINISTRATION
01 PERSONNEL SERVICES 89,313 95,271 118,575 120,204 65,900 52,67502 OTHER PERSONNEL SERV 0 1,425 1,500 1,575 1,575 -7503 FRINGE BENEFITS 26,763 24,226 33,414 34,032 34,032 -61804 OPERATIONAL EXPENSES 1,745 7,035 7,093 7,093 4,593 2,500
117,820 127,957 160,582 162,904 106,100 54,482
ORG.CODE/DEPARTMENT FTE 2018 FTE 2019 VAC. NEW UNF. POSITION TITLE
FY2018 Modified
Budget
FY2019 Mayor
Proposed
FY2019 Council
Adopted
FY18 vs FY19
Budget
0.50 0.50 0.00 0.00 0.00 CLERICAL ASSISTANT 20,800 20,800 20,800 01.00 1.00 0.00 0.00 0.00 DATA COORDINATOR 43,471 45,100 45,100 -1,629
01575000 1.00 0.00 0.00 0.00 1.00 COMMUNITY PROJ. COORDINATOR* 54,304 54,304 0 54,304HUMAN SERVICES ADMIN 2.50 1.50 0.00 0.00 1.00 118,575 120,204 65,900 52,675
*The Community Project Coordinator position transferred to Department of Aging account# 01351000 -51000 in FY2019.
428
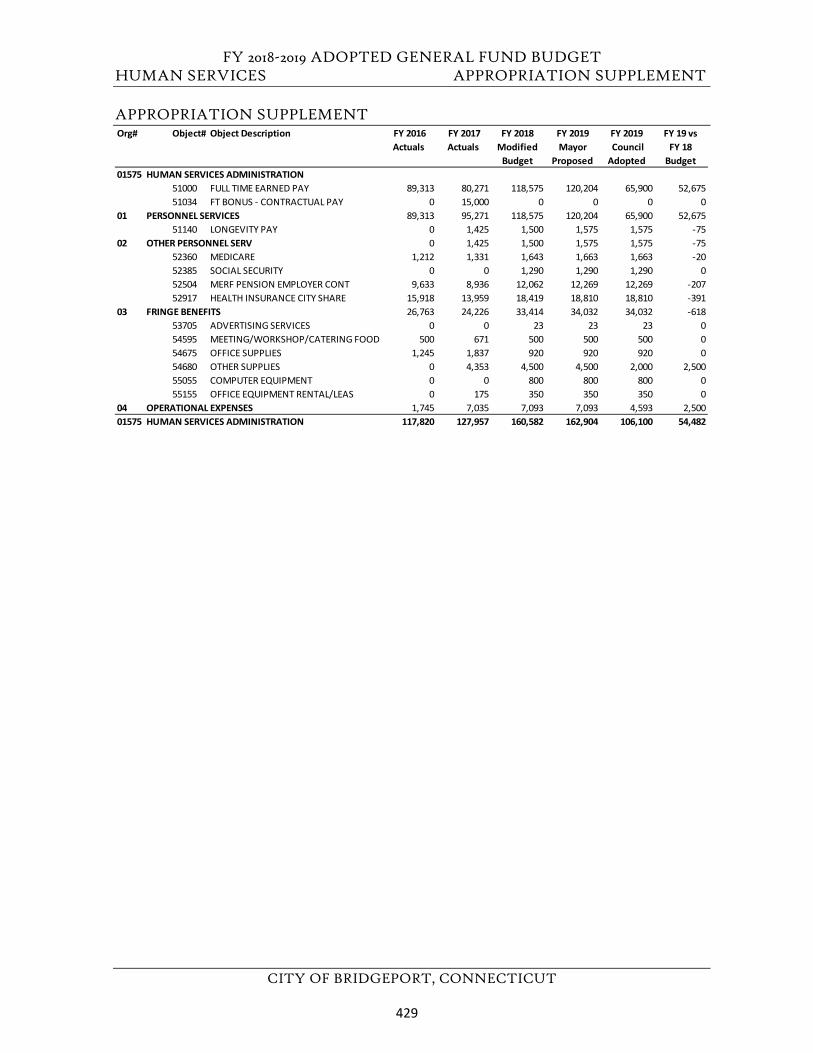
FY 2018-2019 ADOPTED GENERAL FUND BUDGET HUMAN SERVICES APPROPRIATION SUPPLEMENT
CITY OF BRIDGEPORT, CONNECTICUT
APPROPRIATION SUPPLEMENT Org# Object# Object Description FY 2016
Actuals FY 2017 Actuals
FY 2018 Modified
Budget
FY 2019Mayor
Proposed
FY 2019 Council Adopted
FY 19 vs FY 18
Budget01575 HUMAN SERVICES ADMINISTRATION
51000 FULL TIME EARNED PAY 89,313 80,271 118,575 120,204 65,900 52,67551034 FT BONUS - CONTRACTUAL PAY 0 15,000 0 0 0 0
01 PERSONNEL SERVICES 89,313 95,271 118,575 120,204 65,900 52,67551140 LONGEVITY PAY 0 1,425 1,500 1,575 1,575 -75
02 OTHER PERSONNEL SERV 0 1,425 1,500 1,575 1,575 -7552360 MEDICARE 1,212 1,331 1,643 1,663 1,663 -2052385 SOCIAL SECURITY 0 0 1,290 1,290 1,290 052504 MERF PENSION EMPLOYER CONT 9,633 8,936 12,062 12,269 12,269 -20752917 HEALTH INSURANCE CITY SHARE 15,918 13,959 18,419 18,810 18,810 -391
03 FRINGE BENEFITS 26,763 24,226 33,414 34,032 34,032 -61853705 ADVERTISING SERVICES 0 0 23 23 23 054595 MEETING/WORKSHOP/CATERING FOOD 500 671 500 500 500 054675 OFFICE SUPPLIES 1,245 1,837 920 920 920 054680 OTHER SUPPLIES 0 4,353 4,500 4,500 2,000 2,50055055 COMPUTER EQUIPMENT 0 0 800 800 800 055155 OFFICE EQUIPMENT RENTAL/LEAS 0 175 350 350 350 0
04 OPERATIONAL EXPENSES 1,745 7,035 7,093 7,093 4,593 2,50001575 HUMAN SERVICES ADMINISTRATION 117,820 127,957 160,582 162,904 106,100 54,482
429
FY 2018-2019 ADOPTED GENERAL FUND BUDGET
CITY OF BRIDGEPORT, CONNECTICUT
This page left blank intentionally
430
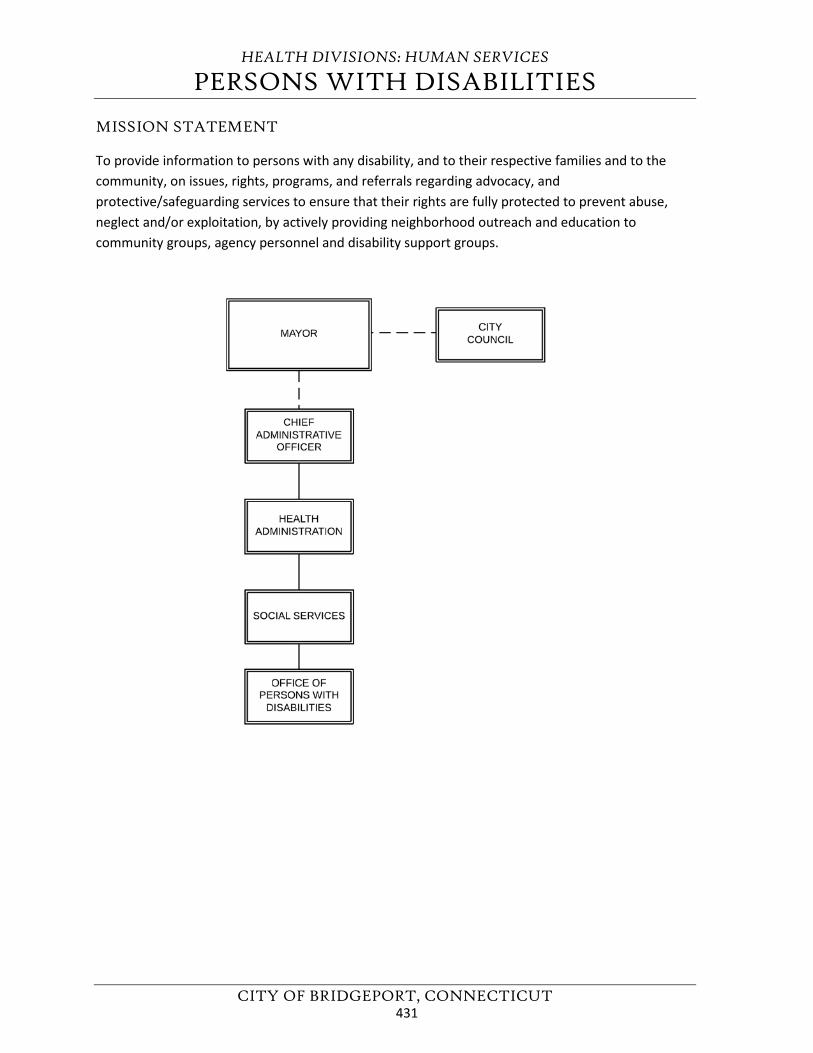
HEALTH DIVISIONS: HUMAN SERVICES
PERSONS WITH DISABILITIES
CITY OF BRIDGEPORT, CONNECTICUT
MISSION STATEMENT
To provide information to persons with any disability, and to their respective families and to the community, on issues, rights, programs, and referrals regarding advocacy, and protective/safeguarding services to ensure that their rights are fully protected to prevent abuse, neglect and/or exploitation, by actively providing neighborhood outreach and education to community groups, agency personnel and disability support groups.
431
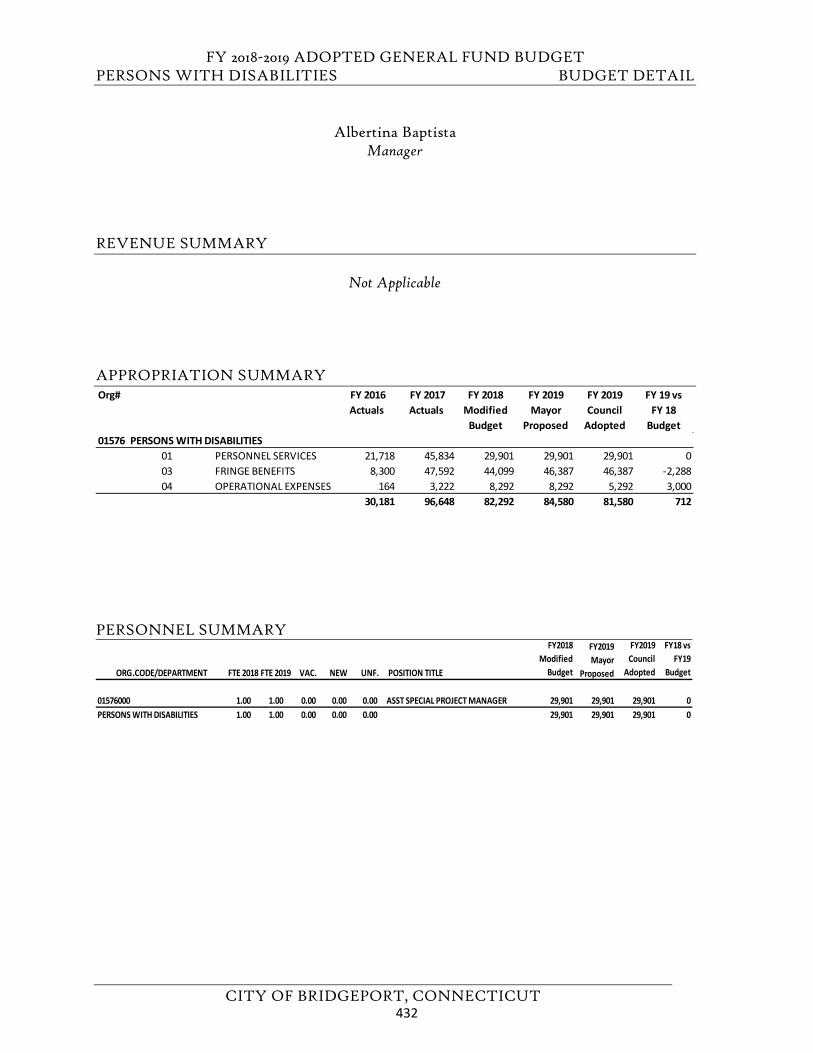
FY 2018-2019 ADOPTED GENERAL FUND BUDGET PERSONS WITH DISABILITIES BUDGET DETAIL
CITY OF BRIDGEPORT, CONNECTICUT
Albertina Baptista Manager
REVENUE SUMMARY
Not Applicable
APPROPRIATION SUMMARY
PERSONNEL SUMMARY
Org# FY 2016 Actuals
FY 2017 Actuals
FY 2018 Modified
Budget
FY 2019 Mayor
Proposed
FY 2019 Council
Adopted
FY 19 vs FY 18
Budget01576 PERSONS WITH DISABILITIES
01 PERSONNEL SERVICES 21,718 45,834 29,901 29,901 29,901 003 FRINGE BENEFITS 8,300 47,592 44,099 46,387 46,387 -2,28804 OPERATIONAL EXPENSES 164 3,222 8,292 8,292 5,292 3,000
30,181 96,648 82,292 84,580 81,580 712
ORG.CODE/DEPARTMENT FTE 2018 FTE 2019 VAC. NEW UNF. POSITION TITLE
FY2018 Modified
Budget
FY2019 Mayor
Proposed
FY2019 Council
Adopted
FY18 vs FY19
Budget
01576000 1.00 1.00 0.00 0.00 0.00 ASST SPECIAL PROJECT MANAGER 29,901 29,901 29,901 0PERSONS WITH DISABILITIES 1.00 1.00 0.00 0.00 0.00 29,901 29,901 29,901 0
432
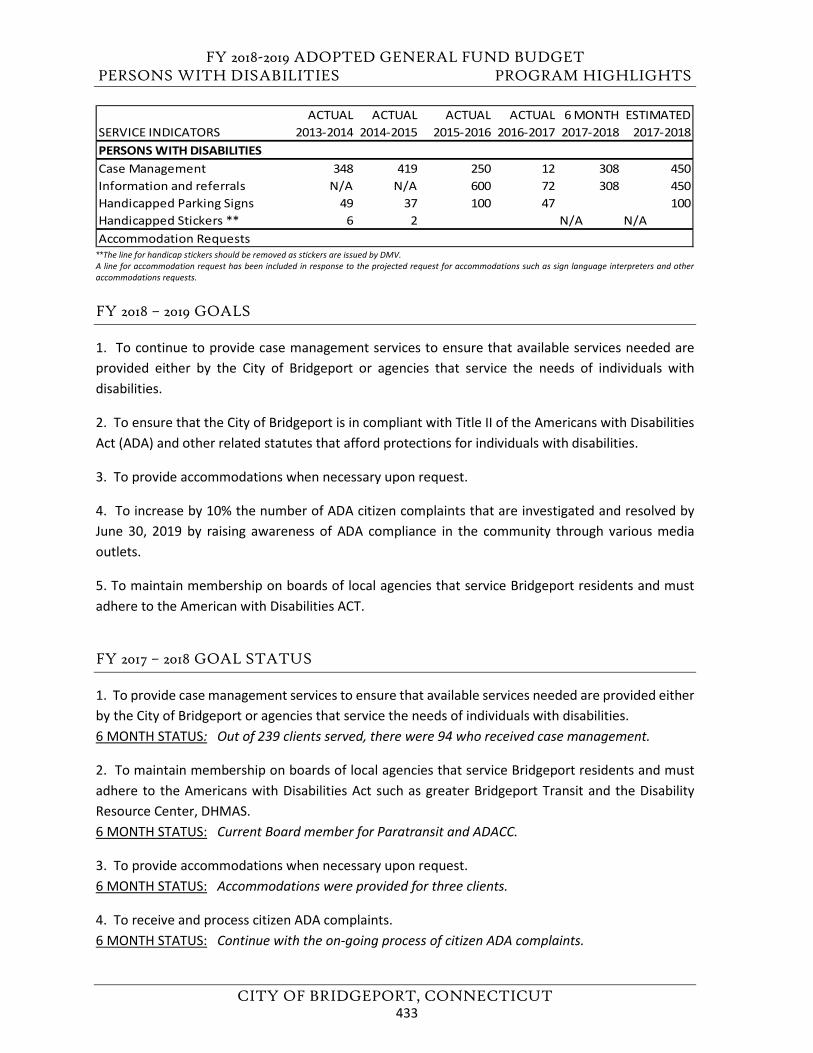
FY 2018-2019 ADOPTED GENERAL FUND BUDGET PERSONS WITH DISABILITIES PROGRAM HIGHLIGHTS
CITY OF BRIDGEPORT, CONNECTICUT
**The line for handicap stickers should be removed as stickers are issued by DMV. A line for accommodation request has been included in response to the projected request for accommodations such as sign language interpreters and other accommodations requests.
FY 2018 – 2019 GOALS
1. To continue to provide case management services to ensure that available services needed areprovided either by the City of Bridgeport or agencies that service the needs of individuals withdisabilities.
2. To ensure that the City of Bridgeport is in compliant with Title II of the Americans with DisabilitiesAct (ADA) and other related statutes that afford protections for individuals with disabilities.
3. To provide accommodations when necessary upon request.
4. To increase by 10% the number of ADA citizen complaints that are investigated and resolved byJune 30, 2019 by raising awareness of ADA compliance in the community through various mediaoutlets.
5. To maintain membership on boards of local agencies that service Bridgeport residents and mustadhere to the American with Disabilities ACT.
FY 2017 – 2018 GOAL STATUS
1. To provide case management services to ensure that available services needed are provided eitherby the City of Bridgeport or agencies that service the needs of individuals with disabilities.6 MONTH STATUS: Out of 239 clients served, there were 94 who received case management.
2. To maintain membership on boards of local agencies that service Bridgeport residents and mustadhere to the Americans with Disabilities Act such as greater Bridgeport Transit and the DisabilityResource Center, DHMAS.6 MONTH STATUS: Current Board member for Paratransit and ADACC.
3. To provide accommodations when necessary upon request.6 MONTH STATUS: Accommodations were provided for three clients.
4. To receive and process citizen ADA complaints.6 MONTH STATUS: Continue with the on-going process of citizen ADA complaints.
ACTUAL ACTUAL ACTUAL ACTUAL 6 MONTH ESTIMATEDSERVICE INDICATORS 2013-2014 2014-2015 2015-2016 2016-2017 2017-2018 2017-2018PERSONS WITH DISABILITIESCase Management 348 419 250 12 308 450Information and referrals N/A N/A 600 72 308 450Handicapped Parking Signs 49 37 100 47 100Handicapped Stickers ** 6 2 N/A N/AAccommodation Requests
433
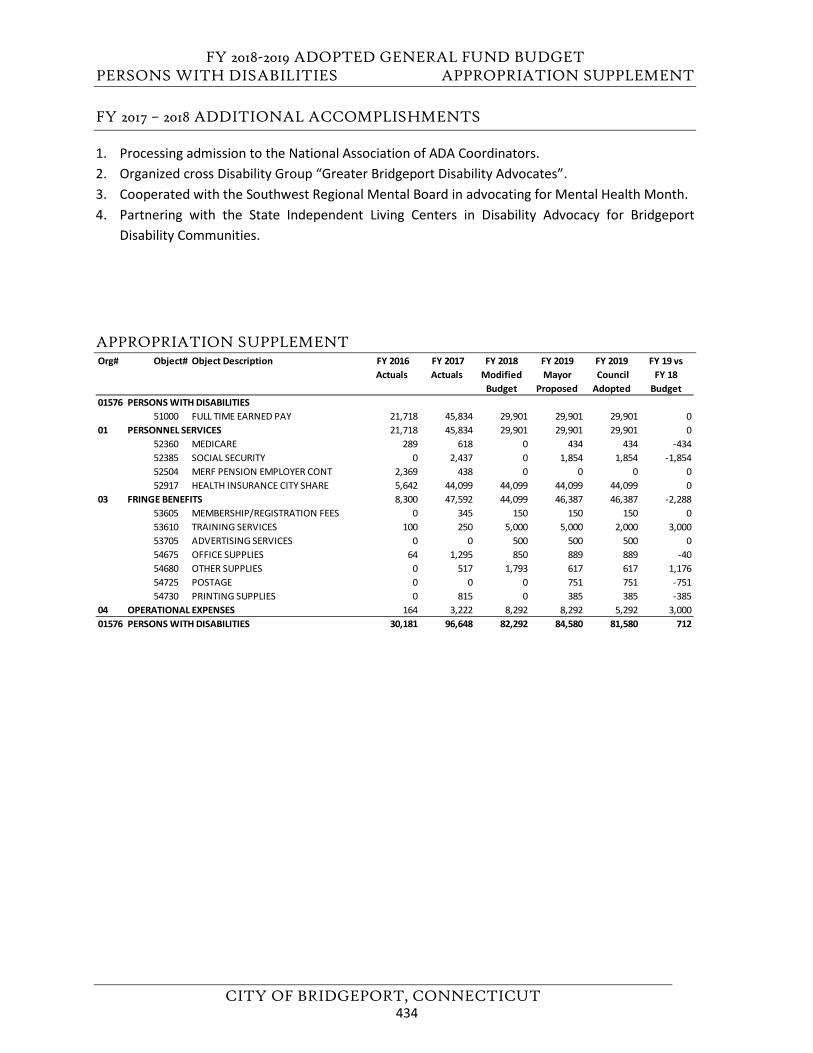
FY 2018-2019 ADOPTED GENERAL FUND BUDGET PERSONS WITH DISABILITIES APPROPRIATION SUPPLEMENT
CITY OF BRIDGEPORT, CONNECTICUT
FY 2017 – 2018 ADDITIONAL ACCOMPLISHMENTS
1. Processing admission to the National Association of ADA Coordinators.2. Organized cross Disability Group “Greater Bridgeport Disability Advocates”.3. Cooperated with the Southwest Regional Mental Board in advocating for Mental Health Month.4. Partnering with the State Independent Living Centers in Disability Advocacy for Bridgeport
Disability Communities.
APPROPRIATION SUPPLEMENT Org# Object# Object Description FY 2016
Actuals FY 2017 Actuals
FY 2018 Modified
Budget
FY 2019Mayor
Proposed
FY 2019 Council Adopted
FY 19 vs FY 18
Budget01576 PERSONS WITH DISABILITIES
51000 FULL TIME EARNED PAY 21,718 45,834 29,901 29,901 29,901 001 PERSONNEL SERVICES 21,718 45,834 29,901 29,901 29,901 0
52360 MEDICARE 289 618 0 434 434 -43452385 SOCIAL SECURITY 0 2,437 0 1,854 1,854 -1,85452504 MERF PENSION EMPLOYER CONT 2,369 438 0 0 0 052917 HEALTH INSURANCE CITY SHARE 5,642 44,099 44,099 44,099 44,099 0
03 FRINGE BENEFITS 8,300 47,592 44,099 46,387 46,387 -2,28853605 MEMBERSHIP/REGISTRATION FEES 0 345 150 150 150 053610 TRAINING SERVICES 100 250 5,000 5,000 2,000 3,00053705 ADVERTISING SERVICES 0 0 500 500 500 054675 OFFICE SUPPLIES 64 1,295 850 889 889 -4054680 OTHER SUPPLIES 0 517 1,793 617 617 1,17654725 POSTAGE 0 0 0 751 751 -75154730 PRINTING SUPPLIES 0 815 0 385 385 -385
04 OPERATIONAL EXPENSES 164 3,222 8,292 8,292 5,292 3,00001576 PERSONS WITH DISABILITIES 30,181 96,648 82,292 84,580 81,580 712
434
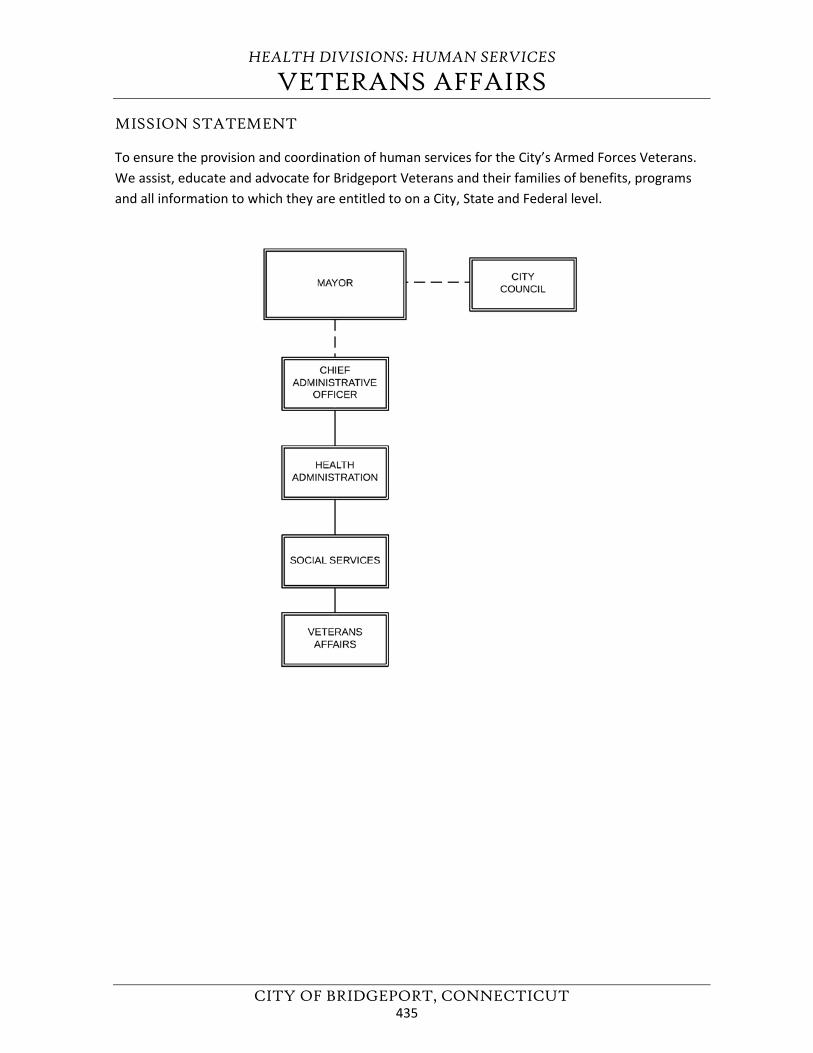
HEALTH DIVISIONS: HUMAN SERVICES
VETERANS AFFAIRS
CITY OF BRIDGEPORT, CONNECTICUT
MISSION STATEMENT
To ensure the provision and coordination of human services for the City’s Armed Forces Veterans. We assist, educate and advocate for Bridgeport Veterans and their families of benefits, programs and all information to which they are entitled to on a City, State and Federal level.
435
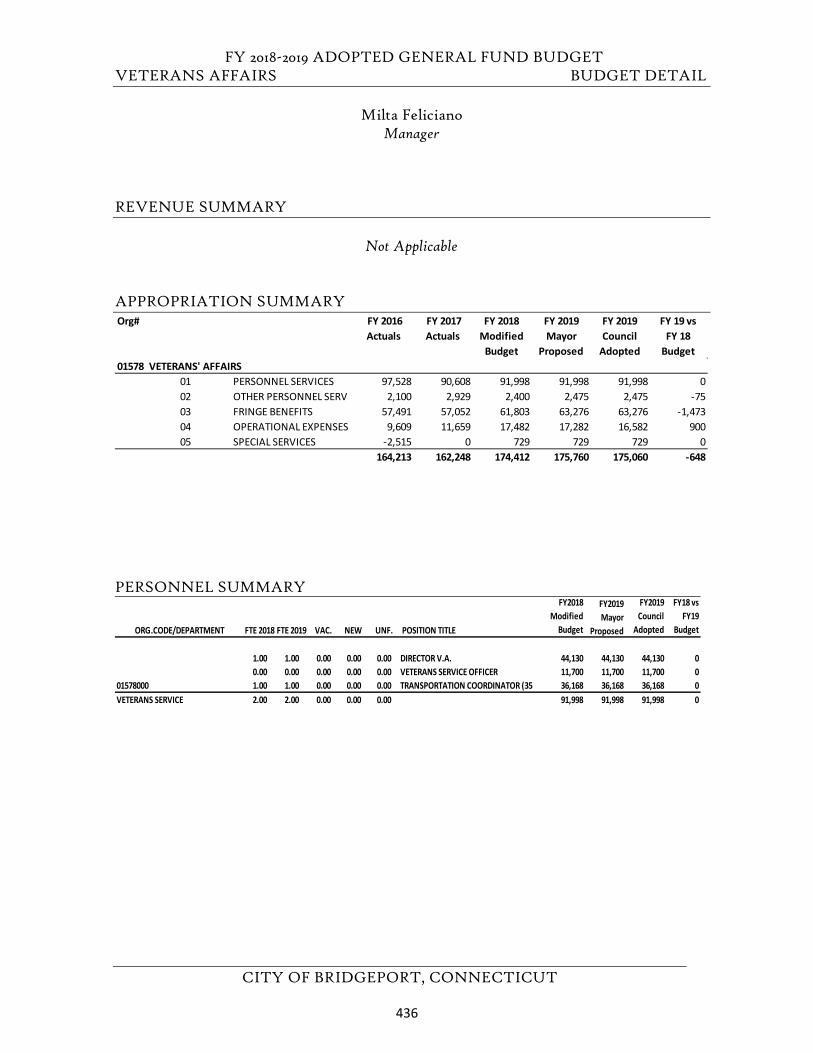
FY 2018-2019 ADOPTED GENERAL FUND BUDGET VETERANS AFFAIRS BUDGET DETAIL
CITY OF BRIDGEPORT, CONNECTICUT
Milta Feliciano Manager
REVENUE SUMMARY
Not Applicable
APPROPRIATION SUMMARY
PERSONNEL SUMMARY
Org# FY 2016 Actuals
FY 2017 Actuals
FY 2018 Modified
Budget
FY 2019 Mayor
Proposed
FY 2019 Council
Adopted
FY 19 vs FY 18
Budget01578 VETERANS' AFFAIRS
01 PERSONNEL SERVICES 97,528 90,608 91,998 91,998 91,998 002 OTHER PERSONNEL SERV 2,100 2,929 2,400 2,475 2,475 -7503 FRINGE BENEFITS 57,491 57,052 61,803 63,276 63,276 -1,47304 OPERATIONAL EXPENSES 9,609 11,659 17,482 17,282 16,582 90005 SPECIAL SERVICES -2,515 0 729 729 729 0
164,213 162,248 174,412 175,760 175,060 -648
ORG.CODE/DEPARTMENT FTE 2018 FTE 2019 VAC. NEW UNF. POSITION TITLE
FY2018 Modified
Budget
FY2019 Mayor
Proposed
FY2019 Council
Adopted
FY18 vs FY19
Budget
1.00 1.00 0.00 0.00 0.00 DIRECTOR V.A. 44,130 44,130 44,130 00.00 0.00 0.00 0.00 0.00 VETERANS SERVICE OFFICER 11,700 11,700 11,700 0
01578000 1.00 1.00 0.00 0.00 0.00 TRANSPORTATION COORDINATOR (35 36,168 36,168 36,168 0VETERANS SERVICE 2.00 2.00 0.00 0.00 0.00 91,998 91,998 91,998 0
436
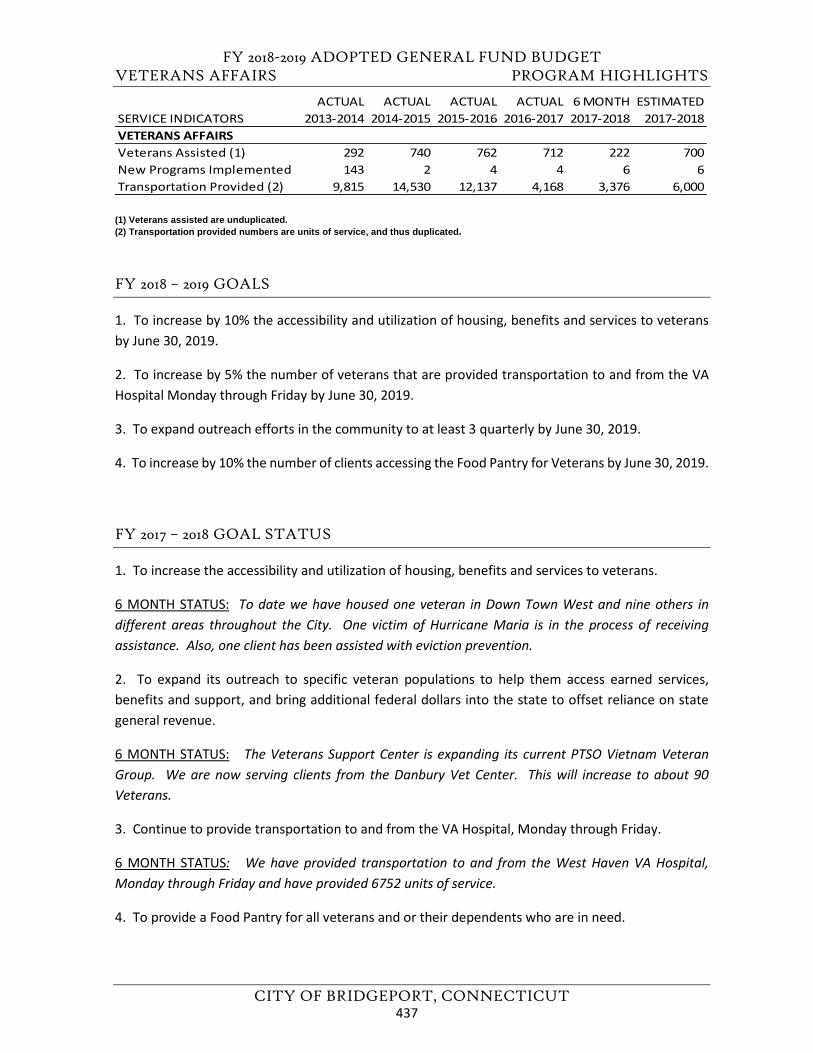
FY 2018-2019 ADOPTED GENERAL FUND BUDGET VETERANS AFFAIRS PROGRAM HIGHLIGHTS
CITY OF BRIDGEPORT, CONNECTICUT
(1) Veterans assisted are unduplicated.(2) Transportation provided numbers are units of service, and thus duplicated.
FY 2018 – 2019 GOALS
1. To increase by 10% the accessibility and utilization of housing, benefits and services to veteransby June 30, 2019.
2. To increase by 5% the number of veterans that are provided transportation to and from the VAHospital Monday through Friday by June 30, 2019.
3. To expand outreach efforts in the community to at least 3 quarterly by June 30, 2019.
4. To increase by 10% the number of clients accessing the Food Pantry for Veterans by June 30, 2019.
FY 2017 – 2018 GOAL STATUS
1. To increase the accessibility and utilization of housing, benefits and services to veterans.
6 MONTH STATUS: To date we have housed one veteran in Down Town West and nine others in different areas throughout the City. One victim of Hurricane Maria is in the process of receiving assistance. Also, one client has been assisted with eviction prevention.
2. To expand its outreach to specific veteran populations to help them access earned services,benefits and support, and bring additional federal dollars into the state to offset reliance on stategeneral revenue.
6 MONTH STATUS: The Veterans Support Center is expanding its current PTSO Vietnam Veteran Group. We are now serving clients from the Danbury Vet Center. This will increase to about 90 Veterans.
3. Continue to provide transportation to and from the VA Hospital, Monday through Friday.
6 MONTH STATUS: We have provided transportation to and from the West Haven VA Hospital, Monday through Friday and have provided 6752 units of service.
4. To provide a Food Pantry for all veterans and or their dependents who are in need.
ACTUAL ACTUAL ACTUAL ACTUAL 6 MONTH ESTIMATEDSERVICE INDICATORS 2013-2014 2014-2015 2015-2016 2016-2017 2017-2018 2017-2018VETERANS AFFAIRSVeterans Assisted (1) 292 740 762 712 222 700New Programs Implemented 143 2 4 4 6 6Transportation Provided (2) 9,815 14,530 12,137 4,168 3,376 6,000
437
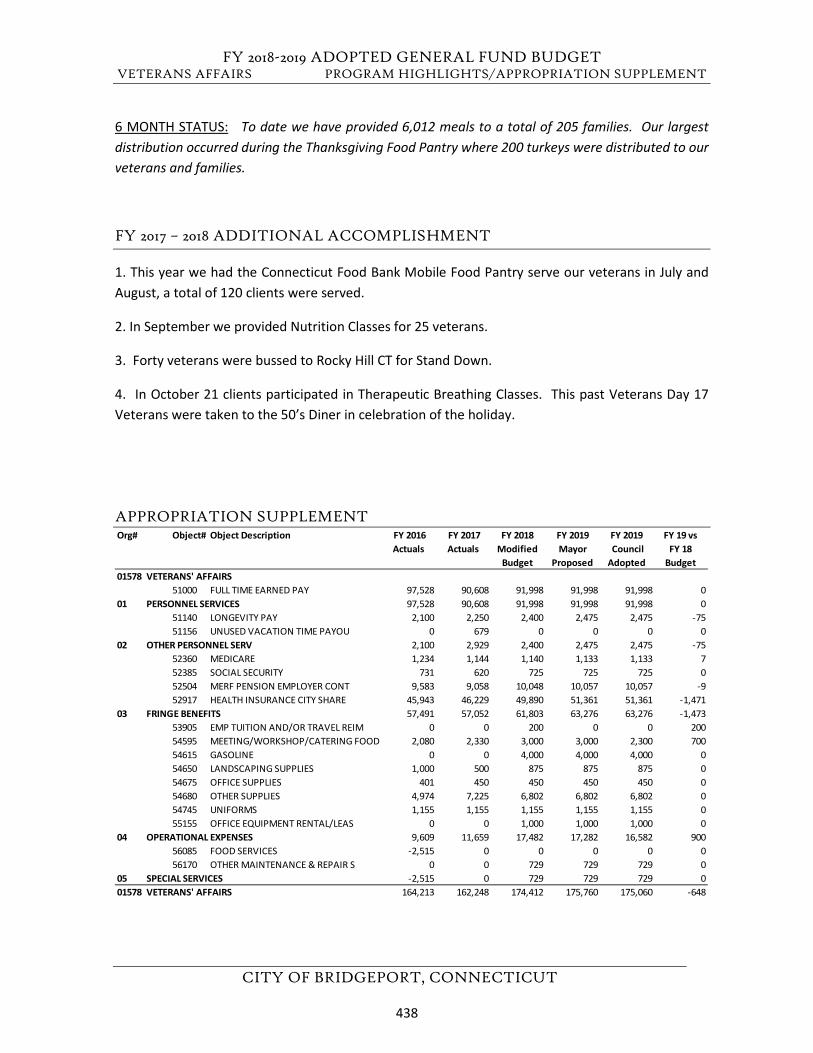
FY 2018-2019 ADOPTED GENERAL FUND BUDGET VETERANS AFFAIRS PROGRAM HIGHLIGHTS/APPROPRIATION SUPPLEMENT
CITY OF BRIDGEPORT, CONNECTICUT
6 MONTH STATUS: To date we have provided 6,012 meals to a total of 205 families. Our largest distribution occurred during the Thanksgiving Food Pantry where 200 turkeys were distributed to our veterans and families.
FY 2017 – 2018 ADDITIONAL ACCOMPLISHMENT
1. This year we had the Connecticut Food Bank Mobile Food Pantry serve our veterans in July andAugust, a total of 120 clients were served.
2. In September we provided Nutrition Classes for 25 veterans.
3. Forty veterans were bussed to Rocky Hill CT for Stand Down.
4. In October 21 clients participated in Therapeutic Breathing Classes. This past Veterans Day 17Veterans were taken to the 50’s Diner in celebration of the holiday.
APPROPRIATION SUPPLEMENT Org# Object# Object Description FY 2016
Actuals FY 2017 Actuals
FY 2018 Modified
Budget
FY 2019Mayor
Proposed
FY 2019 Council Adopted
FY 19 vs FY 18
Budget01578 VETERANS' AFFAIRS
51000 FULL TIME EARNED PAY 97,528 90,608 91,998 91,998 91,998 001 PERSONNEL SERVICES 97,528 90,608 91,998 91,998 91,998 0
51140 LONGEVITY PAY 2,100 2,250 2,400 2,475 2,475 -7551156 UNUSED VACATION TIME PAYOU 0 679 0 0 0 0
02 OTHER PERSONNEL SERV 2,100 2,929 2,400 2,475 2,475 -7552360 MEDICARE 1,234 1,144 1,140 1,133 1,133 752385 SOCIAL SECURITY 731 620 725 725 725 052504 MERF PENSION EMPLOYER CONT 9,583 9,058 10,048 10,057 10,057 -952917 HEALTH INSURANCE CITY SHARE 45,943 46,229 49,890 51,361 51,361 -1,471
03 FRINGE BENEFITS 57,491 57,052 61,803 63,276 63,276 -1,47353905 EMP TUITION AND/OR TRAVEL REIM 0 0 200 0 0 20054595 MEETING/WORKSHOP/CATERING FOOD 2,080 2,330 3,000 3,000 2,300 70054615 GASOLINE 0 0 4,000 4,000 4,000 054650 LANDSCAPING SUPPLIES 1,000 500 875 875 875 054675 OFFICE SUPPLIES 401 450 450 450 450 054680 OTHER SUPPLIES 4,974 7,225 6,802 6,802 6,802 054745 UNIFORMS 1,155 1,155 1,155 1,155 1,155 055155 OFFICE EQUIPMENT RENTAL/LEAS 0 0 1,000 1,000 1,000 0
04 OPERATIONAL EXPENSES 9,609 11,659 17,482 17,282 16,582 90056085 FOOD SERVICES -2,515 0 0 0 0 056170 OTHER MAINTENANCE & REPAIR S 0 0 729 729 729 0
05 SPECIAL SERVICES -2,515 0 729 729 729 001578 VETERANS' AFFAIRS 164,213 162,248 174,412 175,760 175,060 -648
438
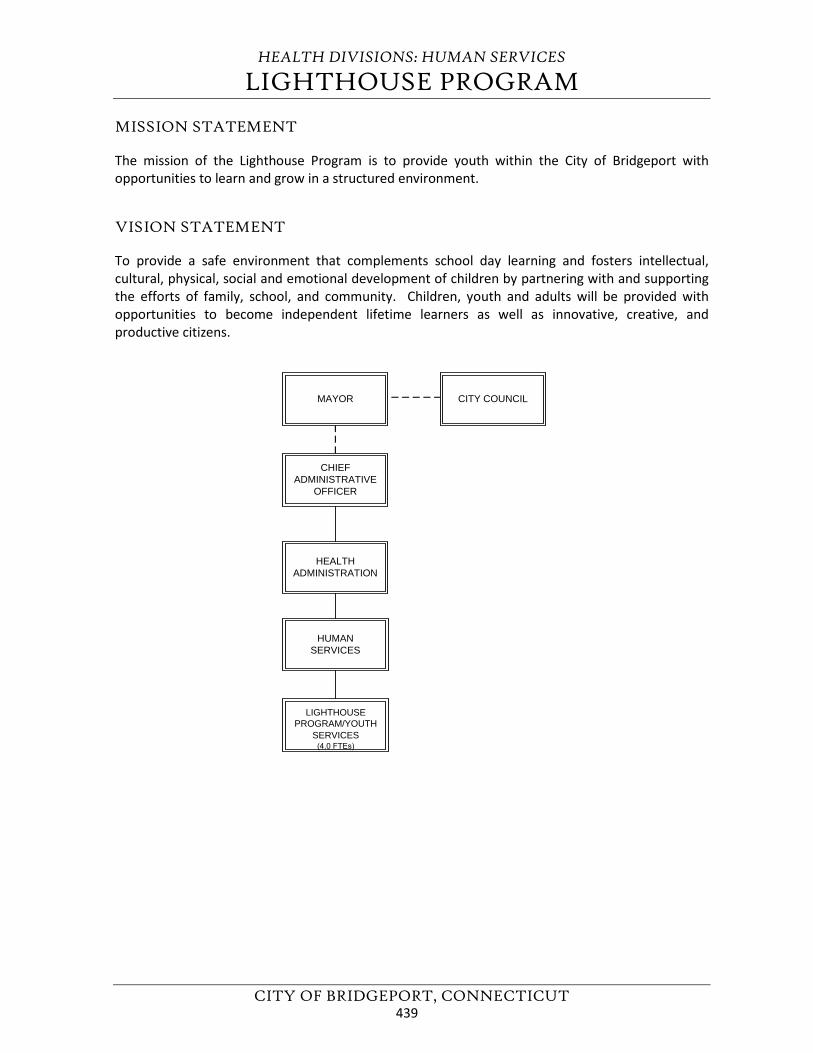
HEALTH DIVISIONS: HUMAN SERVICES
LIGHTHOUSE PROGRAM
CITY OF BRIDGEPORT, CONNECTICUT
MISSION STATEMENT
The mission of the Lighthouse Program is to provide youth within the City of Bridgeport with opportunities to learn and grow in a structured environment.
VISION STATEMENT
To provide a safe environment that complements school day learning and fosters intellectual, cultural, physical, social and emotional development of children by partnering with and supporting the efforts of family, school, and community. Children, youth and adults will be provided with opportunities to become independent lifetime learners as well as innovative, creative, and productive citizens.
CHIEFADMINISTRATIVE
OFFICER
HEALTHADMINISTRATION
MAYOR CITY COUNCIL
HUMANSERVICES
LIGHTHOUSE PROGRAM/YOUTH
SERVICES(4.0 FTEs)
439
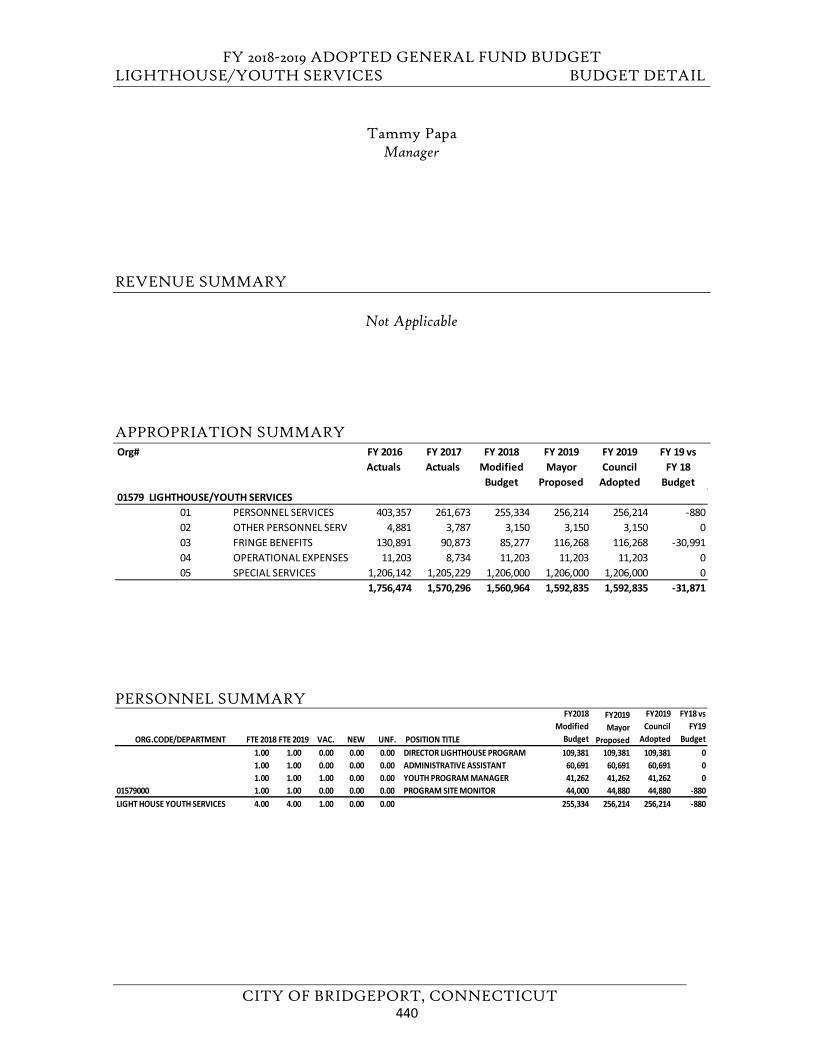
FY 2018-2019 ADOPTED GENERAL FUND BUDGET LIGHTHOUSE/YOUTH SERVICES BUDGET DETAIL
CITY OF BRIDGEPORT, CONNECTICUT
Tammy Papa Manager
REVENUE SUMMARY
Not Applicable
APPROPRIATION SUMMARY
PERSONNEL SUMMARY
Org# FY 2016 Actuals
FY 2017 Actuals
FY 2018 Modified
Budget
FY 2019 Mayor
Proposed
FY 2019 Council
Adopted
FY 19 vs FY 18
Budget01579 LIGHTHOUSE/YOUTH SERVICES
01 PERSONNEL SERVICES 403,357 261,673 255,334 256,214 256,214 -88002 OTHER PERSONNEL SERV 4,881 3,787 3,150 3,150 3,150 003 FRINGE BENEFITS 130,891 90,873 85,277 116,268 116,268 -30,99104 OPERATIONAL EXPENSES 11,203 8,734 11,203 11,203 11,203 005 SPECIAL SERVICES 1,206,142 1,205,229 1,206,000 1,206,000 1,206,000 0
1,756,474 1,570,296 1,560,964 1,592,835 1,592,835 -31,871
ORG.CODE/DEPARTMENT FTE 2018 FTE 2019 VAC. NEW UNF. POSITION TITLE
FY2018 Modified
Budget
FY2019 Mayor
Proposed
FY2019 Council
Adopted
FY18 vs FY19
Budget 1.00 1.00 0.00 0.00 0.00 DIRECTOR LIGHTHOUSE PROGRAM 109,381 109,381 109,381 01.00 1.00 0.00 0.00 0.00 ADMINISTRATIVE ASSISTANT 60,691 60,691 60,691 01.00 1.00 1.00 0.00 0.00 YOUTH PROGRAM MANAGER 41,262 41,262 41,262 0
01579000 1.00 1.00 0.00 0.00 0.00 PROGRAM SITE MONITOR 44,000 44,880 44,880 -880LIGHT HOUSE YOUTH SERVICES 4.00 4.00 1.00 0.00 0.00 255,334 256,214 256,214 -880
440
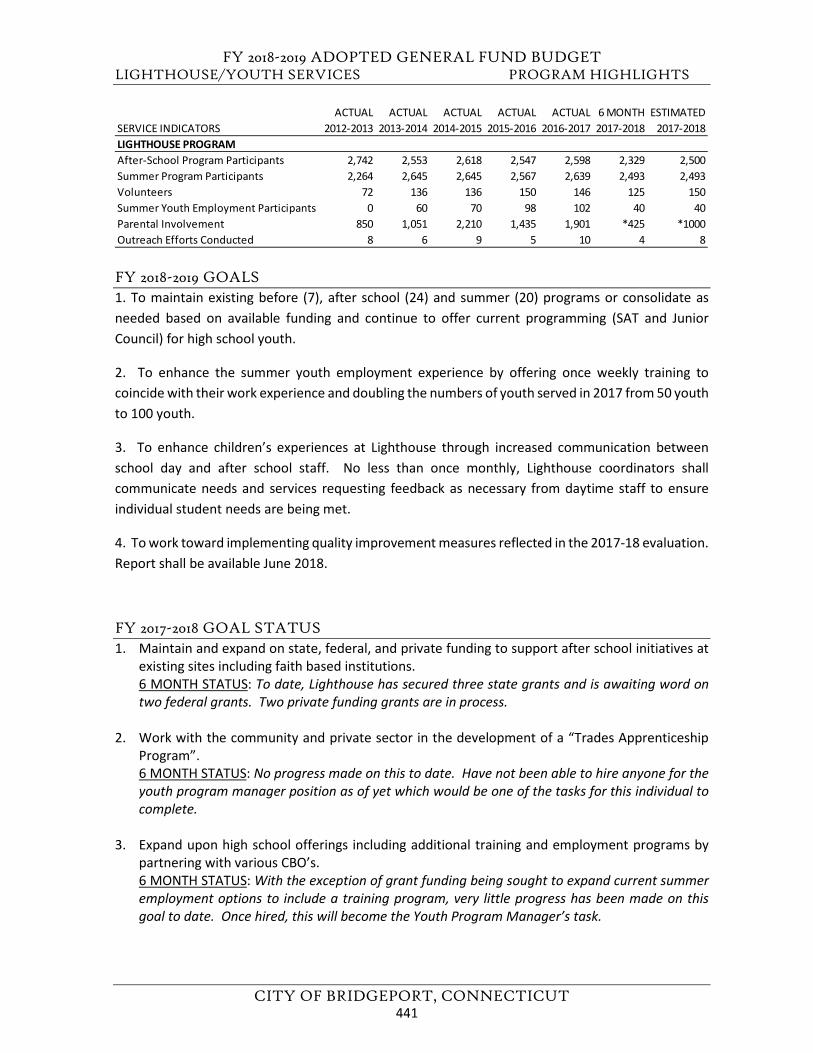
FY 2018-2019 ADOPTED GENERAL FUND BUDGET LIGHTHOUSE/YOUTH SERVICES PROGRAM HIGHLIGHTS
CITY OF BRIDGEPORT, CONNECTICUT
FY 2018-2019 GOALS 1. To maintain existing before (7), after school (24) and summer (20) programs or consolidate asneeded based on available funding and continue to offer current programming (SAT and JuniorCouncil) for high school youth.
2. To enhance the summer youth employment experience by offering once weekly training tocoincide with their work experience and doubling the numbers of youth served in 2017 from 50 youth to 100 youth.
3. To enhance children’s experiences at Lighthouse through increased communication betweenschool day and after school staff. No less than once monthly, Lighthouse coordinators shallcommunicate needs and services requesting feedback as necessary from daytime staff to ensureindividual student needs are being met.
4. To work toward implementing quality improvement measures reflected in the 2017-18 evaluation. Report shall be available June 2018.
FY 2017-2018 GOAL STATUS 1. Maintain and expand on state, federal, and private funding to support after school initiatives at
existing sites including faith based institutions.6 MONTH STATUS: To date, Lighthouse has secured three state grants and is awaiting word ontwo federal grants. Two private funding grants are in process.
2. Work with the community and private sector in the development of a “Trades ApprenticeshipProgram”.6 MONTH STATUS: No progress made on this to date. Have not been able to hire anyone for theyouth program manager position as of yet which would be one of the tasks for this individual tocomplete.
3. Expand upon high school offerings including additional training and employment programs bypartnering with various CBO’s.6 MONTH STATUS: With the exception of grant funding being sought to expand current summeremployment options to include a training program, very little progress has been made on thisgoal to date. Once hired, this will become the Youth Program Manager’s task.
ACTUAL ACTUAL ACTUAL ACTUAL ACTUAL 6 MONTH ESTIMATEDSERVICE INDICATORS 2012-2013 2013-2014 2014-2015 2015-2016 2016-2017 2017-2018 2017-2018LIGHTHOUSE PROGRAMAfter-School Program Participants 2,742 2,553 2,618 2,547 2,598 2,329 2,500Summer Program Participants 2,264 2,645 2,645 2,567 2,639 2,493 2,493Volunteers 72 136 136 150 146 125 150Summer Youth Employment Participants 0 60 70 98 102 40 40Parental Involvement 850 1,051 2,210 1,435 1,901 *425 *1000Outreach Efforts Conducted 8 6 9 5 10 4 8
441
FY 2018-2019 ADOPTED GENERAL FUND BUDGET LIGHTHOUSE/YOUTH SERVICES PROGRAM HIGHLIGHTS
CITY OF BRIDGEPORT, CONNECTICUT
4. Increase participation at all BYC programs located at Lighthouse sites.6 MONTH STATUS: Approximately 40% of sites offering a BYC program for 6th, 7th and 8th gradersare reporting status quo or increased numbers. Focus for all sites is on engaging this agepopulation in the selection of activities to increase enrollment.
5. Design and implement a quality assurance plan for site based record keeping in preparation foraudits6 MONTH STATUS: Lighthouse continues to review its site based record keeping makingappropriate updates to policies and procedures. In addition, significant emphasis is placed onstaff training to ensure all sites are maintaining records in the same manner. Fee based recordkeeping continues to absorb a significant amount of staff time making it critical to allow forelectronic payment processing in the very near future. Lighthouse will work with the FinanceDepartment and the city auditors to ensure we are still operating within the expectations of GAPP.
6. Work with OPM, Finance, Treasurer’s and Webster Bank to pilot electronic fee collection forLighthouse sites.6 MONTH STATUS: Despite repeated outreach by the Youth Services Manager, this has notoccurred yet.
7. Fully staff the Lighthouse office and cross train individuals.6 MONTH STATUS: Lighthouse continues to cross train current staff in most operational aspects.From time to time, the manager makes a conscious effort to delegate various responsibilities toat least two of the three full time staff to ensure they are knowledgeable about programoperations.
FY 2017-2018 ADDITIONAL ACCOMPLISHMENTS 1. January 2018 marks the 25th Anniversary of the Lighthouse Program’s service to the Bridgeportcommunity.
2. Absent direct grant funding for the months of November and December, managed to maintainservices at all 24 Lighthouse locations.
3. Absent a Youth Program Manager, managed to provide SAT support to high school students duringthe fall semester.
4. Absent staff to support professional development opportunities for after school, managed toprovide the critical PD opportunities for the fall semester.
442
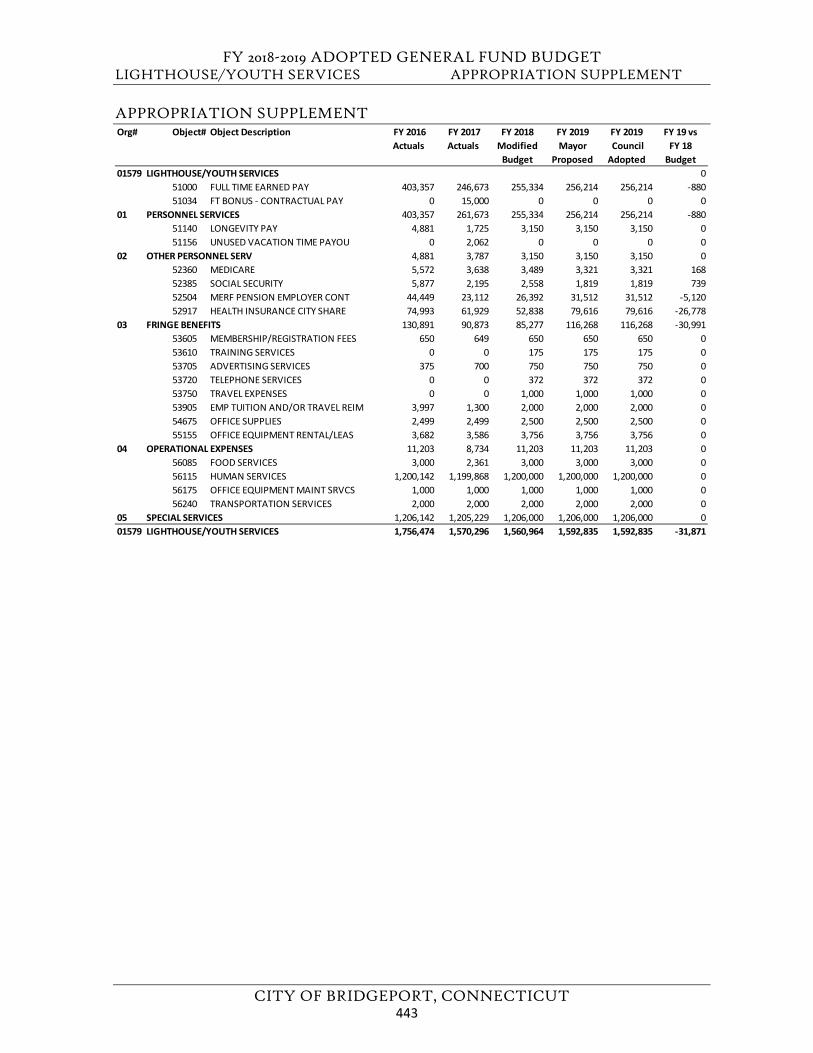
FY 2018-2019 ADOPTED GENERAL FUND BUDGET LIGHTHOUSE/YOUTH SERVICES APPROPRIATION SUPPLEMENT
CITY OF BRIDGEPORT, CONNECTICUT
APPROPRIATION SUPPLEMENT Org# Object# Object Description FY 2016
Actuals FY 2017 Actuals
FY 2018 Modified
Budget
FY 2019Mayor
Proposed
FY 2019 Council Adopted
FY 19 vs FY 18
Budget01579 LIGHTHOUSE/YOUTH SERVICES 0
51000 FULL TIME EARNED PAY 403,357 246,673 255,334 256,214 256,214 -88051034 FT BONUS - CONTRACTUAL PAY 0 15,000 0 0 0 0
01 PERSONNEL SERVICES 403,357 261,673 255,334 256,214 256,214 -88051140 LONGEVITY PAY 4,881 1,725 3,150 3,150 3,150 051156 UNUSED VACATION TIME PAYOU 0 2,062 0 0 0 0
02 OTHER PERSONNEL SERV 4,881 3,787 3,150 3,150 3,150 052360 MEDICARE 5,572 3,638 3,489 3,321 3,321 16852385 SOCIAL SECURITY 5,877 2,195 2,558 1,819 1,819 73952504 MERF PENSION EMPLOYER CONT 44,449 23,112 26,392 31,512 31,512 -5,12052917 HEALTH INSURANCE CITY SHARE 74,993 61,929 52,838 79,616 79,616 -26,778
03 FRINGE BENEFITS 130,891 90,873 85,277 116,268 116,268 -30,99153605 MEMBERSHIP/REGISTRATION FEES 650 649 650 650 650 053610 TRAINING SERVICES 0 0 175 175 175 053705 ADVERTISING SERVICES 375 700 750 750 750 053720 TELEPHONE SERVICES 0 0 372 372 372 053750 TRAVEL EXPENSES 0 0 1,000 1,000 1,000 053905 EMP TUITION AND/OR TRAVEL REIM 3,997 1,300 2,000 2,000 2,000 054675 OFFICE SUPPLIES 2,499 2,499 2,500 2,500 2,500 055155 OFFICE EQUIPMENT RENTAL/LEAS 3,682 3,586 3,756 3,756 3,756 0
04 OPERATIONAL EXPENSES 11,203 8,734 11,203 11,203 11,203 056085 FOOD SERVICES 3,000 2,361 3,000 3,000 3,000 056115 HUMAN SERVICES 1,200,142 1,199,868 1,200,000 1,200,000 1,200,000 056175 OFFICE EQUIPMENT MAINT SRVCS 1,000 1,000 1,000 1,000 1,000 056240 TRANSPORTATION SERVICES 2,000 2,000 2,000 2,000 2,000 0
05 SPECIAL SERVICES 1,206,142 1,205,229 1,206,000 1,206,000 1,206,000 001579 LIGHTHOUSE/YOUTH SERVICES 1,756,474 1,570,296 1,560,964 1,592,835 1,592,835 -31,871
443

FY 2018-2019 ADOPTED GENERAL FUND BUDGET
CITY OF BRIDGEPORT, CONNECTICUT
This page left blank intentionally.
444
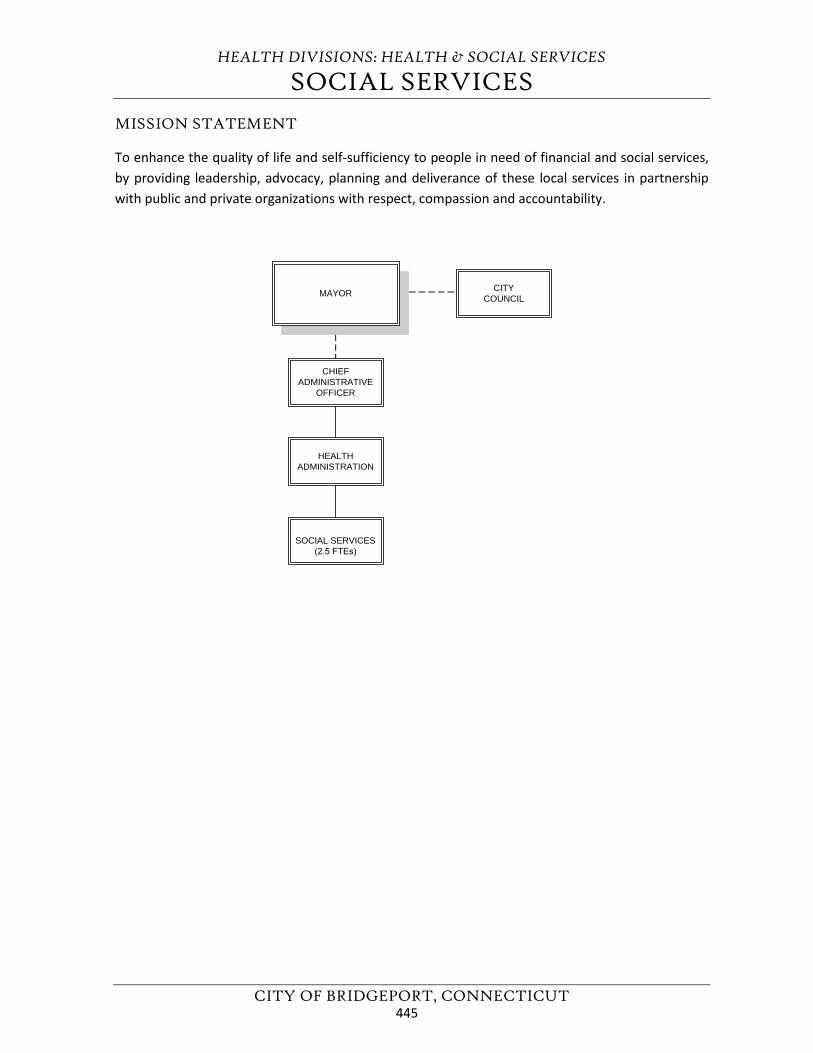
HEALTH DIVISIONS: HEALTH & SOCIAL SERVICES
SOCIAL SERVICES
CITY OF BRIDGEPORT, CONNECTICUT
MISSION STATEMENT
To enhance the quality of life and self-sufficiency to people in need of financial and social services, by providing leadership, advocacy, planning and deliverance of these local services in partnership with public and private organizations with respect, compassion and accountability.
CHIEFADMINISTRATIVE
OFFICER
HEALTHADMINISTRATION
SOCIAL SERVICES(2.5 FTEs)
MAYOR CITYCOUNCIL
445
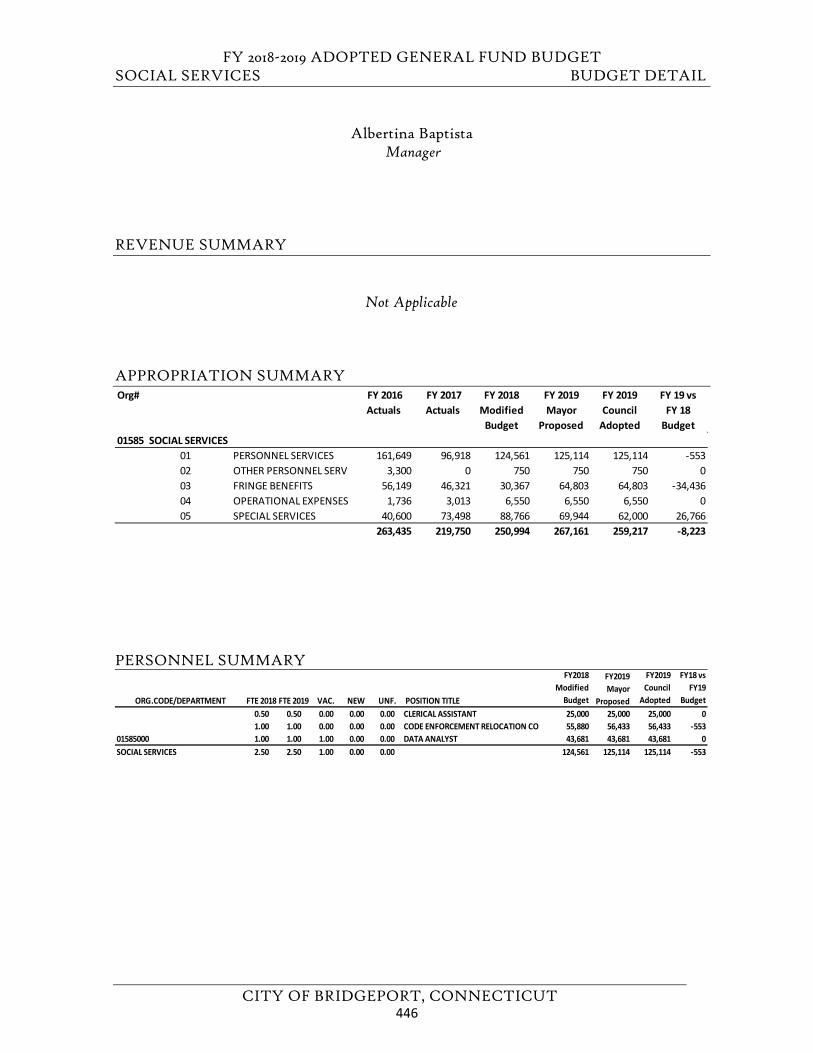
FY 2018-2019 ADOPTED GENERAL FUND BUDGET SOCIAL SERVICES BUDGET DETAIL
CITY OF BRIDGEPORT, CONNECTICUT
Albertina Baptista Manager
REVENUE SUMMARY
Not Applicable
APPROPRIATION SUMMARY
PERSONNEL SUMMARY
Org# FY 2016 Actuals
FY 2017 Actuals
FY 2018 Modified
Budget
FY 2019 Mayor
Proposed
FY 2019 Council
Adopted
FY 19 vs FY 18
Budget01585 SOCIAL SERVICES
01 PERSONNEL SERVICES 161,649 96,918 124,561 125,114 125,114 -55302 OTHER PERSONNEL SERV 3,300 0 750 750 750 003 FRINGE BENEFITS 56,149 46,321 30,367 64,803 64,803 -34,43604 OPERATIONAL EXPENSES 1,736 3,013 6,550 6,550 6,550 005 SPECIAL SERVICES 40,600 73,498 88,766 69,944 62,000 26,766
263,435 219,750 250,994 267,161 259,217 -8,223
ORG.CODE/DEPARTMENT FTE 2018 FTE 2019 VAC. NEW UNF. POSITION TITLE
FY2018 Modified
Budget
FY2019 Mayor
Proposed
FY2019 Council
Adopted
FY18 vs FY19
Budget 0.50 0.50 0.00 0.00 0.00 CLERICAL ASSISTANT 25,000 25,000 25,000 01.00 1.00 0.00 0.00 0.00 CODE ENFORCEMENT RELOCATION CO 55,880 56,433 56,433 -553
01585000 1.00 1.00 1.00 0.00 0.00 DATA ANALYST 43,681 43,681 43,681 0SOCIAL SERVICES 2.50 2.50 1.00 0.00 0.00 124,561 125,114 125,114 -553
446
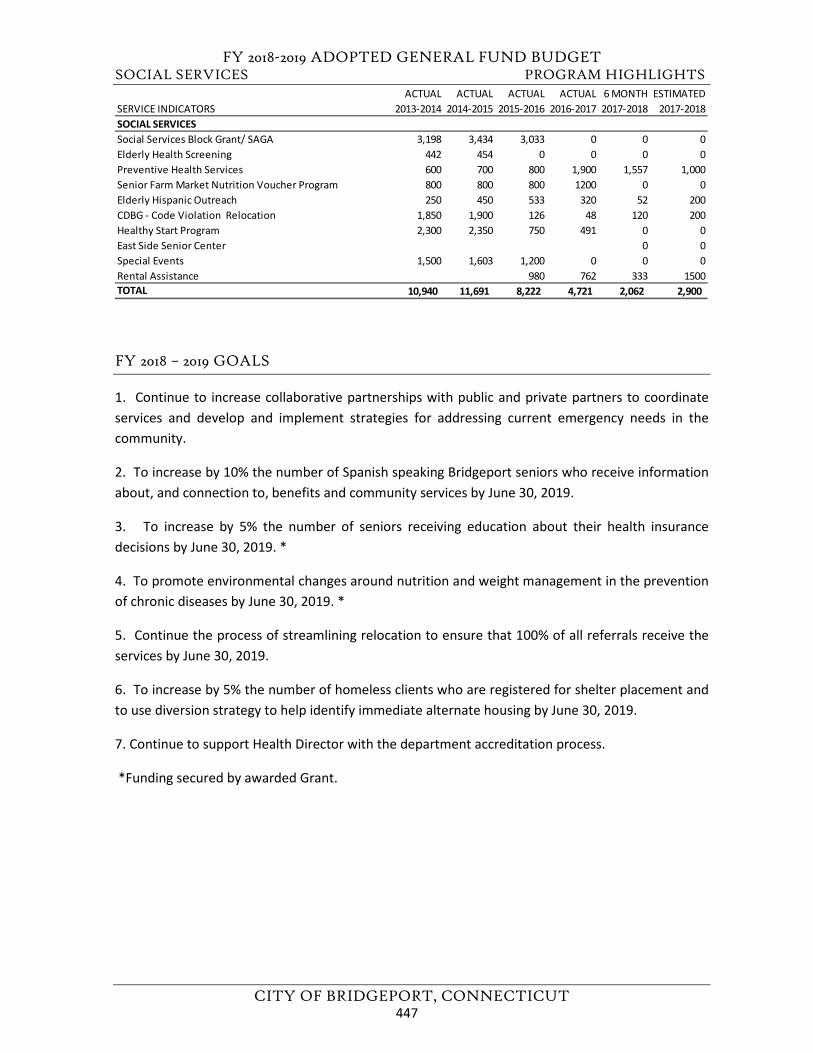
FY 2018-2019 ADOPTED GENERAL FUND BUDGET SOCIAL SERVICES PROGRAM HIGHLIGHTS
CITY OF BRIDGEPORT, CONNECTICUT
FY 2018 – 2019 GOALS
1. Continue to increase collaborative partnerships with public and private partners to coordinateservices and develop and implement strategies for addressing current emergency needs in thecommunity.
2. To increase by 10% the number of Spanish speaking Bridgeport seniors who receive informationabout, and connection to, benefits and community services by June 30, 2019.
3. To increase by 5% the number of seniors receiving education about their health insurancedecisions by June 30, 2019. *
4. To promote environmental changes around nutrition and weight management in the preventionof chronic diseases by June 30, 2019. *
5. Continue the process of streamlining relocation to ensure that 100% of all referrals receive theservices by June 30, 2019.
6. To increase by 5% the number of homeless clients who are registered for shelter placement andto use diversion strategy to help identify immediate alternate housing by June 30, 2019.
7. Continue to support Health Director with the department accreditation process.
*Funding secured by awarded Grant.
ACTUAL ACTUAL ACTUAL ACTUAL 6 MONTH ESTIMATEDSERVICE INDICATORS 2013-2014 2014-2015 2015-2016 2016-2017 2017-2018 2017-2018SOCIAL SERVICESSocial Services Block Grant/ SAGA 3,198 3,434 3,033 0 0 0Elderly Health Screening 442 454 0 0 0 0Preventive Health Services 600 700 800 1,900 1,557 1,000Senior Farm Market Nutrition Voucher Program 800 800 800 1200 0 0Elderly Hispanic Outreach 250 450 533 320 52 200CDBG - Code Violation Relocation 1,850 1,900 126 48 120 200Healthy Start Program 2,300 2,350 750 491 0 0East Side Senior Center 0 0Special Events 1,500 1,603 1,200 0 0 0Rental Assistance 980 762 333 1500TOTAL 10,940 11,691 8,222 4,721 2,062 2,900
447
FY 2018-2019 ADOPTED GENERAL FUND BUDGET SOCIAL SERVICES PROGRAM HIGHLIGHTS
CITY OF BRIDGEPORT, CONNECTICUT
FY 2017 – 2018 GOAL STATUS
1. To increase collaborative partnerships with public and private apartments to coordinate services and develop and implement strategies for addressing current emergency needs in the community. 6 MONTH STATUS: Continue partnerships with the broader community through the Fairfield County Continuum of Care, through collaboration with property owners, realtors, Visiting Nurses Association, Bridgeport Hospital, St. Vincent’s Hospital, Optimus, Southwest Community Health Center, Department of Social Services, Life Bridge Community Services and the Council of Churches.
2. To continue providing information and referral services (free of charge) on Medicare, Medigap, Medicare Managed Care, Long Term Care insurance and other related state and federal programs. 6 MONTH STATUS: Additional staff were trained to be Certified Choice Counselors for the continuation of providing information and referral services.
3. To increase the number of seniors receiving education about their health insurance decisions. 6 MONTH STATUS: Presentations had been conducted at several senior housing sites and 52 seniors received information about their insurance benefits through outreach in the community.
4. To continue empowering under-served women, infants and children and the elderly through health and wellness education. 6 MONTH STATUS: Grant funding for the Healthy Start Program ended on 6/30/17. 5. To streamline the relocation process to ensure that 100% of all referrals receive relocation services. 6 MONTH STATUS: Continue with the on-going process of streamlining for relocation.
FY 2017 – 2018 ADDITIONAL ACCOMPLISHMENTS
1. The department successfully diverted six families into permanent housing.
2. Provided safeguards in coordination with the State of Connecticut Protective Services for the Elderly.
3. Successfully provided fresh produce at our East Side farm stand, servicing 1,557 patrons and supported a local farmer.
4. Coordinated health fairs with Southwest Community Health Center and Bridgeport Mental Health that serviced over 100 people.
5. Supporting seven local corner stores in a joint effort to establish Healthy Corner Store Programs to increase the availability of affordable fresh produce to residents through CDBG grant funds.
448
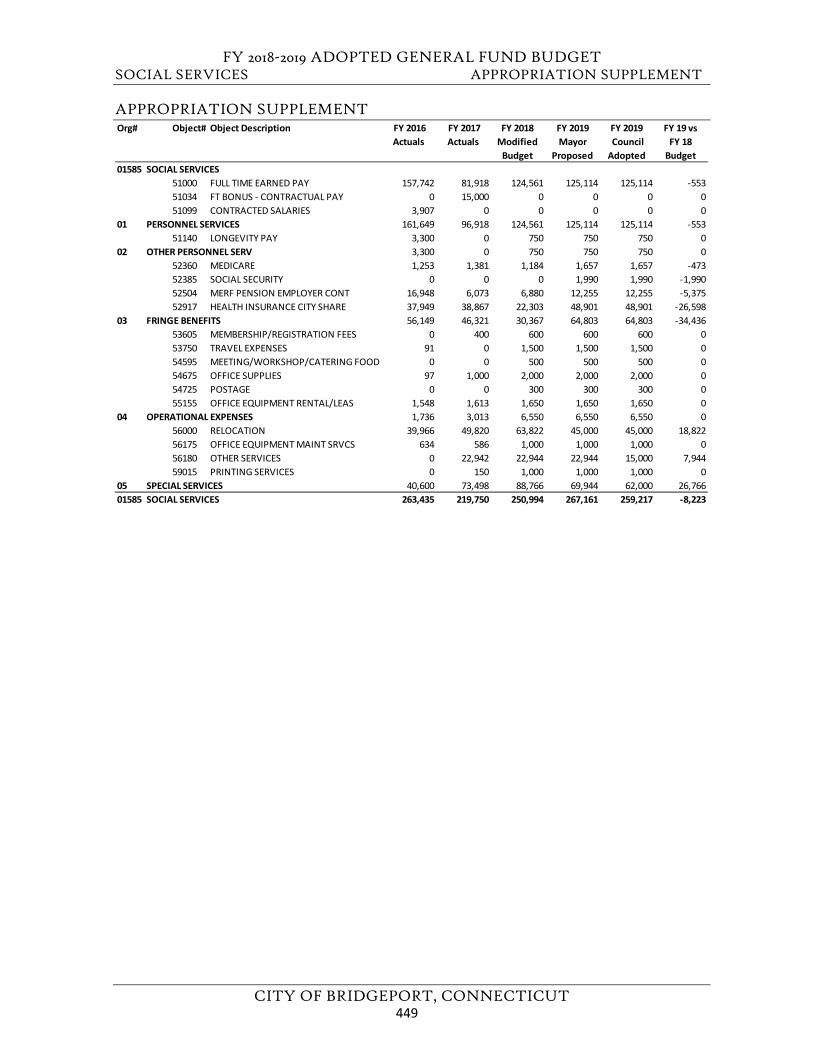
FY 2018-2019 ADOPTED GENERAL FUND BUDGET SOCIAL SERVICES APPROPRIATION SUPPLEMENT
CITY OF BRIDGEPORT, CONNECTICUT
APPROPRIATION SUPPLEMENT Org# Object# Object Description FY 2016
Actuals FY 2017 Actuals
FY 2018 Modified
Budget
FY 2019Mayor
Proposed
FY 2019 Council Adopted
FY 19 vs FY 18
Budget01585 SOCIAL SERVICES
51000 FULL TIME EARNED PAY 157,742 81,918 124,561 125,114 125,114 -55351034 FT BONUS - CONTRACTUAL PAY 0 15,000 0 0 0 051099 CONTRACTED SALARIES 3,907 0 0 0 0 0
01 PERSONNEL SERVICES 161,649 96,918 124,561 125,114 125,114 -55351140 LONGEVITY PAY 3,300 0 750 750 750 0
02 OTHER PERSONNEL SERV 3,300 0 750 750 750 052360 MEDICARE 1,253 1,381 1,184 1,657 1,657 -47352385 SOCIAL SECURITY 0 0 0 1,990 1,990 -1,99052504 MERF PENSION EMPLOYER CONT 16,948 6,073 6,880 12,255 12,255 -5,37552917 HEALTH INSURANCE CITY SHARE 37,949 38,867 22,303 48,901 48,901 -26,598
03 FRINGE BENEFITS 56,149 46,321 30,367 64,803 64,803 -34,43653605 MEMBERSHIP/REGISTRATION FEES 0 400 600 600 600 053750 TRAVEL EXPENSES 91 0 1,500 1,500 1,500 054595 MEETING/WORKSHOP/CATERING FOOD 0 0 500 500 500 054675 OFFICE SUPPLIES 97 1,000 2,000 2,000 2,000 054725 POSTAGE 0 0 300 300 300 055155 OFFICE EQUIPMENT RENTAL/LEAS 1,548 1,613 1,650 1,650 1,650 0
04 OPERATIONAL EXPENSES 1,736 3,013 6,550 6,550 6,550 056000 RELOCATION 39,966 49,820 63,822 45,000 45,000 18,82256175 OFFICE EQUIPMENT MAINT SRVCS 634 586 1,000 1,000 1,000 056180 OTHER SERVICES 0 22,942 22,944 22,944 15,000 7,94459015 PRINTING SERVICES 0 150 1,000 1,000 1,000 0
05 SPECIAL SERVICES 40,600 73,498 88,766 69,944 62,000 26,76601585 SOCIAL SERVICES 263,435 219,750 250,994 267,161 259,217 -8,223
449

FY 2018-2019 ADOPTED GENERAL FUND BUDGET
CITY OF BRIDGEPORT, CONNECTICUT
This page left blank intentionally.
450
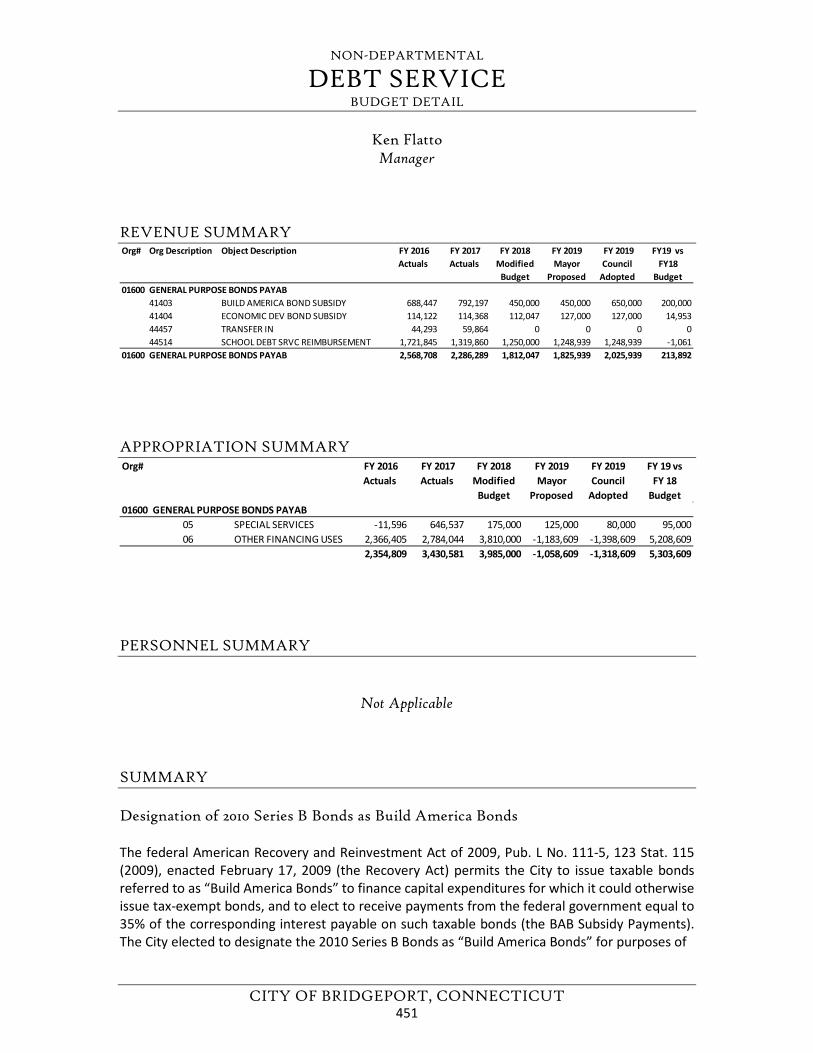
NON-DEPARTMENTAL
DEBT SERVICE BUDGET DETAIL
CITY OF BRIDGEPORT, CONNECTICUT
Ken Flatto Manager
REVENUE SUMMARY
APPROPRIATION SUMMARY
PERSONNEL SUMMARY
Not Applicable
SUMMARY
Designation of 2010 Series B Bonds as Build America Bonds
The federal American Recovery and Reinvestment Act of 2009, Pub. L No. 111-5, 123 Stat. 115 (2009), enacted February 17, 2009 (the Recovery Act) permits the City to issue taxable bonds referred to as “Build America Bonds” to finance capital expenditures for which it could otherwise issue tax-exempt bonds, and to elect to receive payments from the federal government equal to 35% of the corresponding interest payable on such taxable bonds (the BAB Subsidy Payments). The City elected to designate the 2010 Series B Bonds as “Build America Bonds” for purposes of
Org# Org Description Object Description FY 2016 Actuals
FY 2017 Actuals
FY 2018 Modified
Budget
FY 2019 Mayor
Proposed
FY 2019 Council
Adopted
FY19 vs FY18
Budget01600 GENERAL PURPOSE BONDS PAYAB
41403 BUILD AMERICA BOND SUBSIDY 688,447 792,197 450,000 450,000 650,000 200,00041404 ECONOMIC DEV BOND SUBSIDY 114,122 114,368 112,047 127,000 127,000 14,95344457 TRANSFER IN 44,293 59,864 0 0 0 044514 SCHOOL DEBT SRVC REIMBURSEMENT 1,721,845 1,319,860 1,250,000 1,248,939 1,248,939 -1,061
01600 GENERAL PURPOSE BONDS PAYAB 2,568,708 2,286,289 1,812,047 1,825,939 2,025,939 213,892
Org# FY 2016 Actuals
FY 2017 Actuals
FY 2018 Modified
Budget
FY 2019 Mayor
Proposed
FY 2019 Council
Adopted
FY 19 vs FY 18
Budget01600 GENERAL PURPOSE BONDS PAYAB
05 SPECIAL SERVICES -11,596 646,537 175,000 125,000 80,000 95,00006 OTHER FINANCING USES 2,366,405 2,784,044 3,810,000 -1,183,609 -1,398,609 5,208,609
2,354,809 3,430,581 3,985,000 -1,058,609 -1,318,609 5,303,609
451
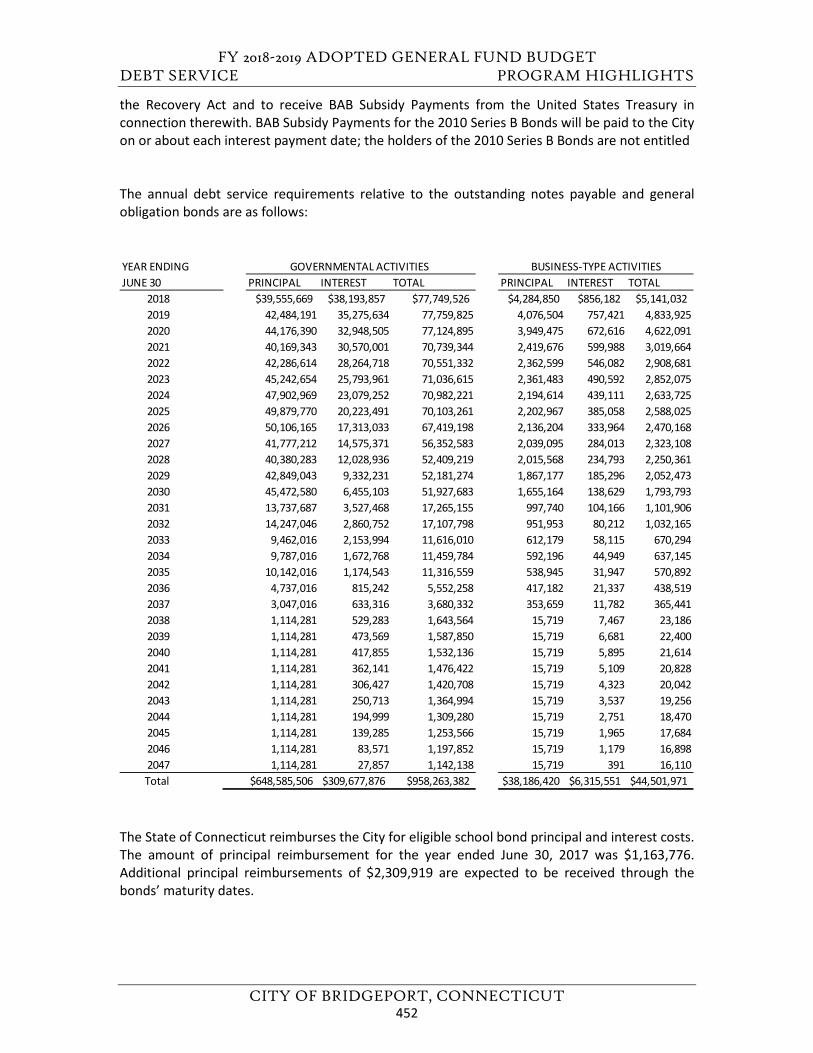
FY 2018-2019 ADOPTED GENERAL FUND BUDGET DEBT SERVICE PROGRAM HIGHLIGHTS
CITY OF BRIDGEPORT, CONNECTICUT
the Recovery Act and to receive BAB Subsidy Payments from the United States Treasury in connection therewith. BAB Subsidy Payments for the 2010 Series B Bonds will be paid to the City on or about each interest payment date; the holders of the 2010 Series B Bonds are not entitled
The annual debt service requirements relative to the outstanding notes payable and general obligation bonds are as follows:
The State of Connecticut reimburses the City for eligible school bond principal and interest costs. The amount of principal reimbursement for the year ended June 30, 2017 was $1,163,776. Additional principal reimbursements of $2,309,919 are expected to be received through the bonds’ maturity dates.
YEAR ENDING BUSINESS-TYPE ACTIVITIESJUNE 30 PRINCIPAL INTEREST TOTAL PRINCIPAL INTEREST TOTAL
2018 $39,555,669 $38,193,857 $77,749,526 $4,284,850 $856,182 $5,141,0322019 42,484,191 35,275,634 77,759,825 4,076,504 757,421 4,833,9252020 44,176,390 32,948,505 77,124,895 3,949,475 672,616 4,622,0912021 40,169,343 30,570,001 70,739,344 2,419,676 599,988 3,019,6642022 42,286,614 28,264,718 70,551,332 2,362,599 546,082 2,908,6812023 45,242,654 25,793,961 71,036,615 2,361,483 490,592 2,852,0752024 47,902,969 23,079,252 70,982,221 2,194,614 439,111 2,633,7252025 49,879,770 20,223,491 70,103,261 2,202,967 385,058 2,588,0252026 50,106,165 17,313,033 67,419,198 2,136,204 333,964 2,470,1682027 41,777,212 14,575,371 56,352,583 2,039,095 284,013 2,323,1082028 40,380,283 12,028,936 52,409,219 2,015,568 234,793 2,250,3612029 42,849,043 9,332,231 52,181,274 1,867,177 185,296 2,052,4732030 45,472,580 6,455,103 51,927,683 1,655,164 138,629 1,793,7932031 13,737,687 3,527,468 17,265,155 997,740 104,166 1,101,9062032 14,247,046 2,860,752 17,107,798 951,953 80,212 1,032,1652033 9,462,016 2,153,994 11,616,010 612,179 58,115 670,2942034 9,787,016 1,672,768 11,459,784 592,196 44,949 637,1452035 10,142,016 1,174,543 11,316,559 538,945 31,947 570,8922036 4,737,016 815,242 5,552,258 417,182 21,337 438,5192037 3,047,016 633,316 3,680,332 353,659 11,782 365,4412038 1,114,281 529,283 1,643,564 15,719 7,467 23,1862039 1,114,281 473,569 1,587,850 15,719 6,681 22,4002040 1,114,281 417,855 1,532,136 15,719 5,895 21,6142041 1,114,281 362,141 1,476,422 15,719 5,109 20,8282042 1,114,281 306,427 1,420,708 15,719 4,323 20,0422043 1,114,281 250,713 1,364,994 15,719 3,537 19,2562044 1,114,281 194,999 1,309,280 15,719 2,751 18,4702045 1,114,281 139,285 1,253,566 15,719 1,965 17,6842046 1,114,281 83,571 1,197,852 15,719 1,179 16,8982047 1,114,281 27,857 1,142,138 15,719 391 16,110Total $648,585,506 $309,677,876 $958,263,382 $38,186,420 $6,315,551 $44,501,971
GOVERNMENTAL ACTIVITIES
452
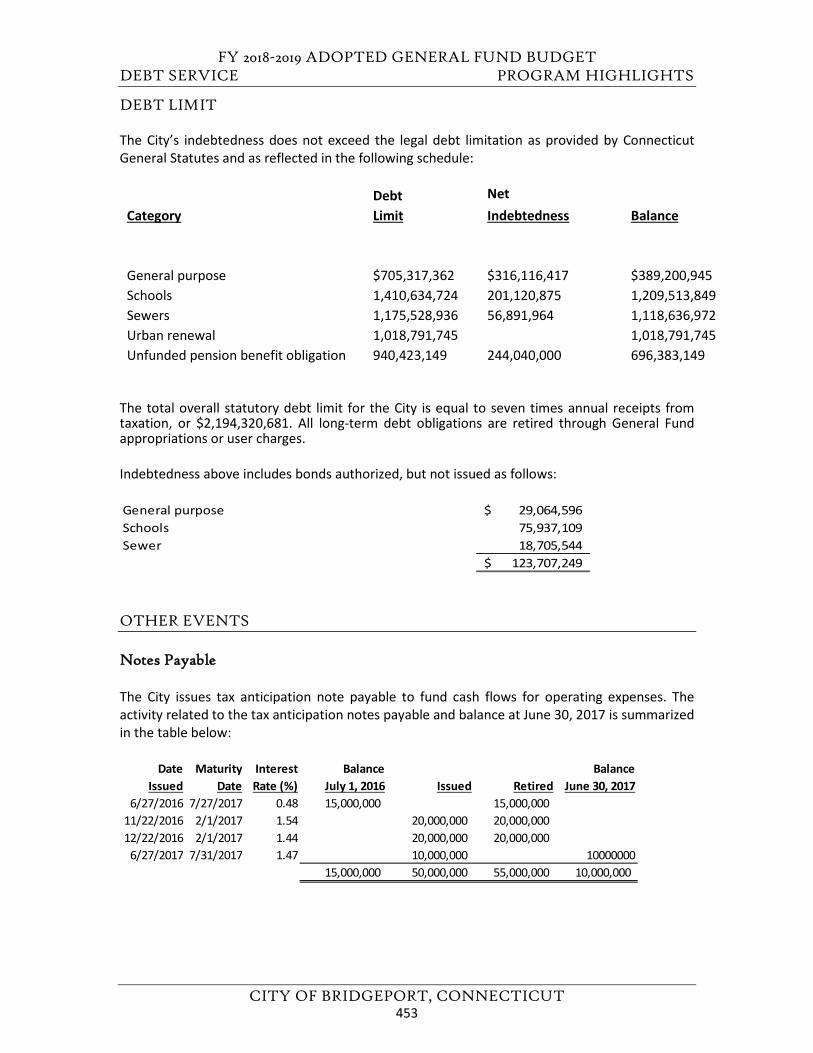
FY 2018-2019 ADOPTED GENERAL FUND BUDGET DEBT SERVICE PROGRAM HIGHLIGHTS
CITY OF BRIDGEPORT, CONNECTICUT
DEBT LIMIT
The City’s indebtedness does not exceed the legal debt limitation as provided by Connecticut General Statutes and as reflected in the following schedule:
Debt Net Category Limit Indebtedness Balance
General purpose $705,317,362 $316,116,417 $389,200,945 Schools 1,410,634,724 201,120,875 1,209,513,849 Sewers 1,175,528,936 56,891,964 1,118,636,972 Urban renewal 1,018,791,745 1,018,791,745 Unfunded pension benefit obligation 940,423,149 244,040,000 696,383,149
The total overall statutory debt limit for the City is equal to seven times annual receipts from taxation, or $2,194,320,681. All long-term debt obligations are retired through General Fund appropriations or user charges.
Indebtedness above includes bonds authorized, but not issued as follows:
OTHER EVENTS
Notes Payable
The City issues tax anticipation note payable to fund cash flows for operating expenses. The activity related to the tax anticipation notes payable and balance at June 30, 2017 is summarized in the table below:
General purpose 29,064,596$ Schools 75,937,109 Sewer 18,705,544
123,707,249$
Date Maturity Interest Balance BalanceIssued Date Rate (%) July 1, 2016 Issued Retired June 30, 2017
6/27/2016 7/27/2017 0.48 15,000,000 15,000,000 11/22/2016 2/1/2017 1.54 20,000,000 20,000,000 12/22/2016 2/1/2017 1.44 20,000,000 20,000,000
6/27/2017 7/31/2017 1.47 10,000,000 1000000015,000,000 50,000,000 55,000,000 10,000,000
453
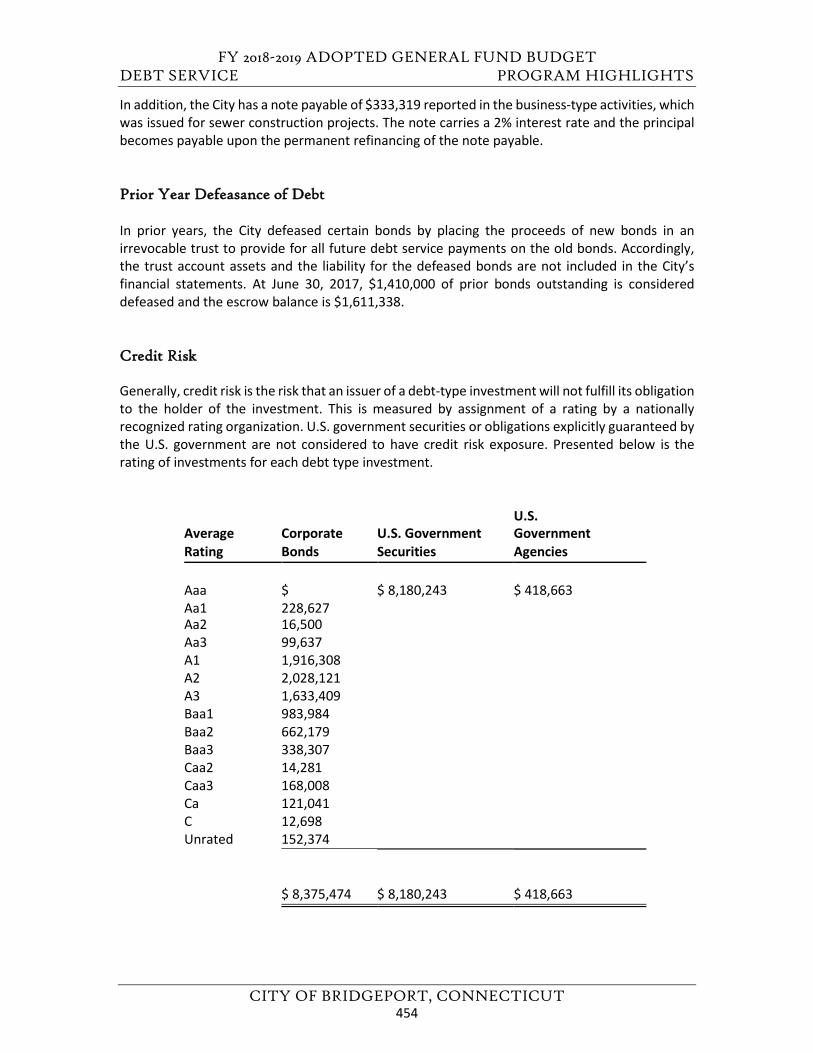
FY 2018-2019 ADOPTED GENERAL FUND BUDGET DEBT SERVICE PROGRAM HIGHLIGHTS
CITY OF BRIDGEPORT, CONNECTICUT
In addition, the City has a note payable of $333,319 reported in the business-type activities, which was issued for sewer construction projects. The note carries a 2% interest rate and the principal becomes payable upon the permanent refinancing of the note payable.
Prior Year Defeasance of Debt
In prior years, the City defeased certain bonds by placing the proceeds of new bonds in an irrevocable trust to provide for all future debt service payments on the old bonds. Accordingly, the trust account assets and the liability for the defeased bonds are not included in the City’s financial statements. At June 30, 2017, $1,410,000 of prior bonds outstanding is considered defeased and the escrow balance is $1,611,338.
Credit Risk
Generally, credit risk is the risk that an issuer of a debt-type investment will not fulfill its obligation to the holder of the investment. This is measured by assignment of a rating by a nationally recognized rating organization. U.S. government securities or obligations explicitly guaranteed by the U.S. government are not considered to have credit risk exposure. Presented below is the rating of investments for each debt type investment.
U.S. Average Corporate U.S. Government Government Rating Bonds Securities Agencies
Aaa Aa1
$ 228,627
$ 8,180,243 $ 418,663
Aa2 16,500 Aa3 99,637 A1 1,916,308 A2 2,028,121 A3 1,633,409 Baa1 983,984 Baa2 662,179 Baa3 338,307 Caa2 14,281 Caa3 168,008 Ca 121,041 C 12,698 Unrated 152,374
$ 8,375,474 $ 8,180,243 $ 418,663
454
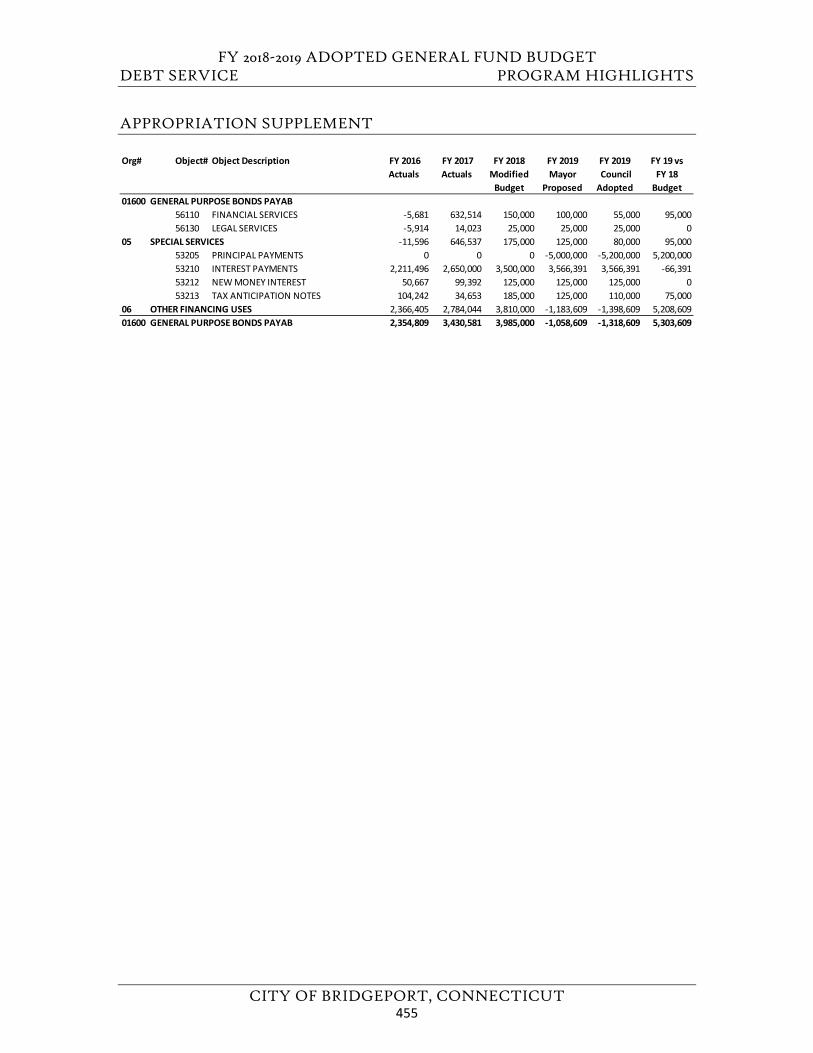
FY 2018-2019 ADOPTED GENERAL FUND BUDGET DEBT SERVICE PROGRAM HIGHLIGHTS
CITY OF BRIDGEPORT, CONNECTICUT
APPROPRIATION SUPPLEMENT
Org# Object# Object Description FY 2016 Actuals
FY 2017 Actuals
FY 2018 Modified
Budget
FY 2019Mayor
Proposed
FY 2019 Council Adopted
FY 19 vs FY 18
Budget01600 GENERAL PURPOSE BONDS PAYAB
56110 FINANCIAL SERVICES -5,681 632,514 150,000 100,000 55,000 95,00056130 LEGAL SERVICES -5,914 14,023 25,000 25,000 25,000 0
05 SPECIAL SERVICES -11,596 646,537 175,000 125,000 80,000 95,00053205 PRINCIPAL PAYMENTS 0 0 0 -5,000,000 -5,200,000 5,200,00053210 INTEREST PAYMENTS 2,211,496 2,650,000 3,500,000 3,566,391 3,566,391 -66,39153212 NEW MONEY INTEREST 50,667 99,392 125,000 125,000 125,000 053213 TAX ANTICIPATION NOTES 104,242 34,653 185,000 125,000 110,000 75,000
06 OTHER FINANCING USES 2,366,405 2,784,044 3,810,000 -1,183,609 -1,398,609 5,208,60901600 GENERAL PURPOSE BONDS PAYAB 2,354,809 3,430,581 3,985,000 -1,058,609 -1,318,609 5,303,609
455
FY 2018-2019 ADOPTED GENERAL FUND BUDGET
CITY OF BRIDGEPORT, CONNECTICUT
This page left blank intentionally.
456
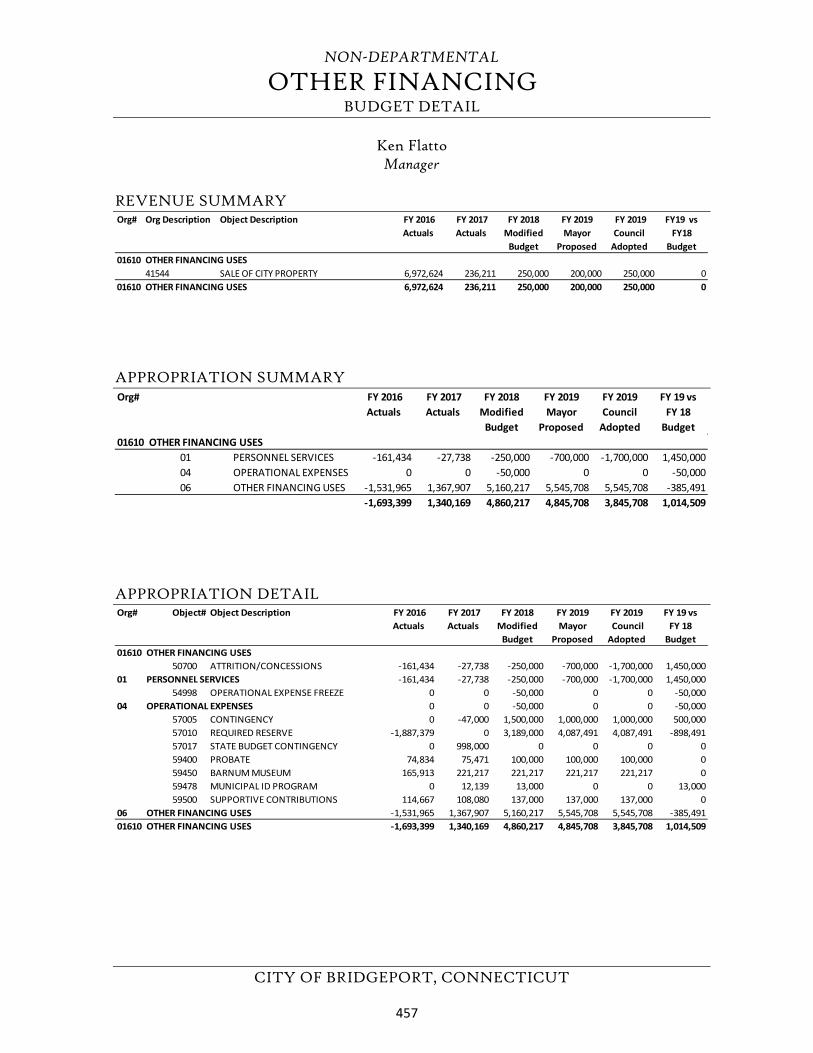
NON-DEPARTMENTAL
OTHER FINANCING BUDGET DETAIL
CITY OF BRIDGEPORT, CONNECTICUT
Ken Flatto Manager
REVENUE SUMMARY
APPROPRIATION SUMMARY
APPROPRIATION DETAIL
Org# Org Description Object Description FY 2016 Actuals
FY 2017 Actuals
FY 2018 Modified
Budget
FY 2019 Mayor
Proposed
FY 2019 Council
Adopted
FY19 vs FY18
Budget01610 OTHER FINANCING USES
41544 SALE OF CITY PROPERTY 6,972,624 236,211 250,000 200,000 250,000 001610 OTHER FINANCING USES 6,972,624 236,211 250,000 200,000 250,000 0
Org# FY 2016 Actuals
FY 2017 Actuals
FY 2018 Modified
Budget
FY 2019 Mayor
Proposed
FY 2019 Council
Adopted
FY 19 vs FY 18
Budget01610 OTHER FINANCING USES
01 PERSONNEL SERVICES -161,434 -27,738 -250,000 -700,000 -1,700,000 1,450,00004 OPERATIONAL EXPENSES 0 0 -50,000 0 0 -50,00006 OTHER FINANCING USES -1,531,965 1,367,907 5,160,217 5,545,708 5,545,708 -385,491
-1,693,399 1,340,169 4,860,217 4,845,708 3,845,708 1,014,509
Org# Object# Object Description FY 2016 Actuals
FY 2017 Actuals
FY 2018 Modified
Budget
FY 2019Mayor
Proposed
FY 2019 Council Adopted
FY 19 vs FY 18
Budget01610 OTHER FINANCING USES
50700 ATTRITION/CONCESSIONS -161,434 -27,738 -250,000 -700,000 -1,700,000 1,450,00001 PERSONNEL SERVICES -161,434 -27,738 -250,000 -700,000 -1,700,000 1,450,000
54998 OPERATIONAL EXPENSE FREEZE 0 0 -50,000 0 0 -50,00004 OPERATIONAL EXPENSES 0 0 -50,000 0 0 -50,000
57005 CONTINGENCY 0 -47,000 1,500,000 1,000,000 1,000,000 500,00057010 REQUIRED RESERVE -1,887,379 0 3,189,000 4,087,491 4,087,491 -898,49157017 STATE BUDGET CONTINGENCY 0 998,000 0 0 0 059400 PROBATE 74,834 75,471 100,000 100,000 100,000 059450 BARNUM MUSEUM 165,913 221,217 221,217 221,217 221,217 059478 MUNICIPAL ID PROGRAM 0 12,139 13,000 0 0 13,00059500 SUPPORTIVE CONTRIBUTIONS 114,667 108,080 137,000 137,000 137,000 0
06 OTHER FINANCING USES -1,531,965 1,367,907 5,160,217 5,545,708 5,545,708 -385,49101610 OTHER FINANCING USES -1,693,399 1,340,169 4,860,217 4,845,708 3,845,708 1,014,509
457

FY 2018-2019 ADOPTED GENERAL FUND BUDGET
CITY OF BRIDGEPORT, CONNECTICUT
This page left blank intentionally.
458
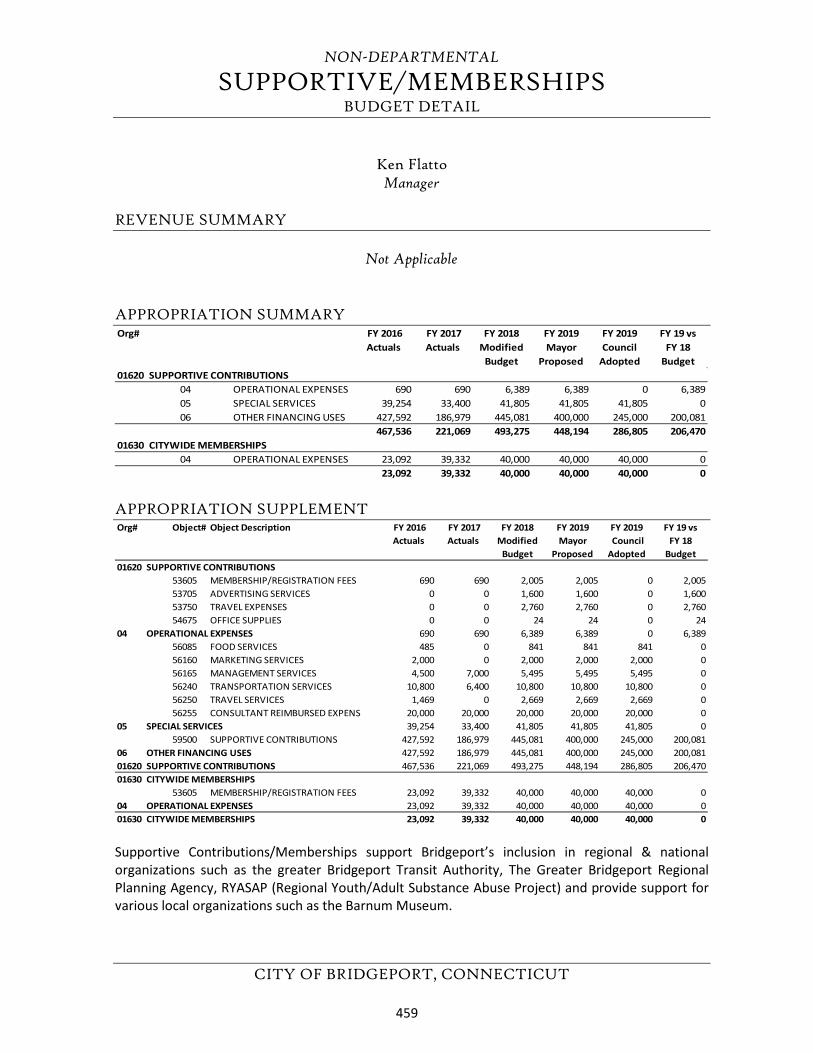
NON-DEPARTMENTAL
SUPPORTIVE/MEMBERSHIPS BUDGET DETAIL
CITY OF BRIDGEPORT, CONNECTICUT
Ken Flatto Manager
REVENUE SUMMARY
Not Applicable
APPROPRIATION SUMMARY
APPROPRIATION SUPPLEMENT
Supportive Contributions/Memberships support Bridgeport’s inclusion in regional & national organizations such as the greater Bridgeport Transit Authority, The Greater Bridgeport Regional Planning Agency, RYASAP (Regional Youth/Adult Substance Abuse Project) and provide support for various local organizations such as the Barnum Museum.
Org# FY 2016 Actuals
FY 2017 Actuals
FY 2018 Modified
Budget
FY 2019 Mayor
Proposed
FY 2019 Council
Adopted
FY 19 vs FY 18
Budget01620 SUPPORTIVE CONTRIBUTIONS
04 OPERATIONAL EXPENSES 690 690 6,389 6,389 0 6,38905 SPECIAL SERVICES 39,254 33,400 41,805 41,805 41,805 006 OTHER FINANCING USES 427,592 186,979 445,081 400,000 245,000 200,081
467,536 221,069 493,275 448,194 286,805 206,47001630 CITYWIDE MEMBERSHIPS
04 OPERATIONAL EXPENSES 23,092 39,332 40,000 40,000 40,000 023,092 39,332 40,000 40,000 40,000 0
Org# Object# Object Description FY 2016 Actuals
FY 2017 Actuals
FY 2018 Modified
Budget
FY 2019Mayor
Proposed
FY 2019 Council Adopted
FY 19 vs FY 18
Budget01620 SUPPORTIVE CONTRIBUTIONS
53605 MEMBERSHIP/REGISTRATION FEES 690 690 2,005 2,005 0 2,00553705 ADVERTISING SERVICES 0 0 1,600 1,600 0 1,60053750 TRAVEL EXPENSES 0 0 2,760 2,760 0 2,76054675 OFFICE SUPPLIES 0 0 24 24 0 24
04 OPERATIONAL EXPENSES 690 690 6,389 6,389 0 6,38956085 FOOD SERVICES 485 0 841 841 841 056160 MARKETING SERVICES 2,000 0 2,000 2,000 2,000 056165 MANAGEMENT SERVICES 4,500 7,000 5,495 5,495 5,495 056240 TRANSPORTATION SERVICES 10,800 6,400 10,800 10,800 10,800 056250 TRAVEL SERVICES 1,469 0 2,669 2,669 2,669 056255 CONSULTANT REIMBURSED EXPENS 20,000 20,000 20,000 20,000 20,000 0
05 SPECIAL SERVICES 39,254 33,400 41,805 41,805 41,805 059500 SUPPORTIVE CONTRIBUTIONS 427,592 186,979 445,081 400,000 245,000 200,081
06 OTHER FINANCING USES 427,592 186,979 445,081 400,000 245,000 200,08101620 SUPPORTIVE CONTRIBUTIONS 467,536 221,069 493,275 448,194 286,805 206,47001630 CITYWIDE MEMBERSHIPS
53605 MEMBERSHIP/REGISTRATION FEES 23,092 39,332 40,000 40,000 40,000 004 OPERATIONAL EXPENSES 23,092 39,332 40,000 40,000 40,000 001630 CITYWIDE MEMBERSHIPS 23,092 39,332 40,000 40,000 40,000 0
459

FY 2018-2019 ADOPTED GENERAL FUND BUDGET
CITY OF BRIDGEPORT, CONNECTICUT
This page left blank intentionally.
460
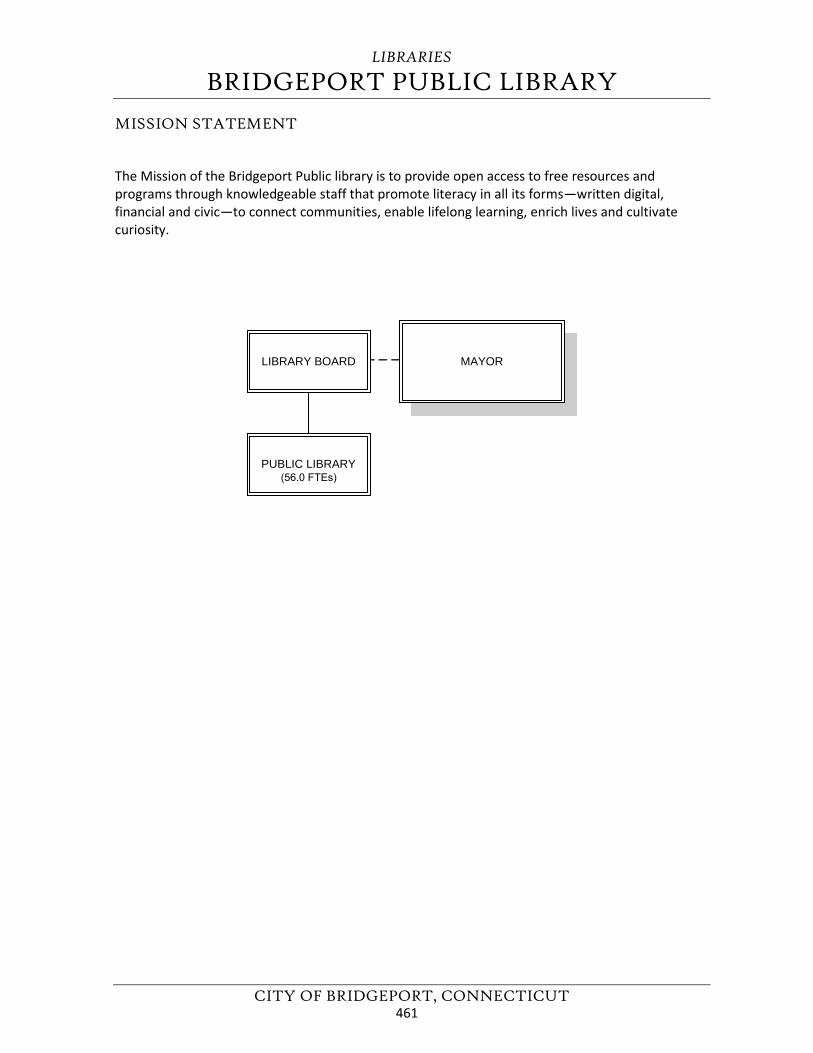
LIBRARIES
BRIDGEPORT PUBLIC LIBRARY
CITY OF BRIDGEPORT, CONNECTICUT
MISSION STATEMENT
The Mission of the Bridgeport Public library is to provide open access to free resources and programs through knowledgeable staff that promote literacy in all its forms—written digital, financial and civic—to connect communities, enable lifelong learning, enrich lives and cultivate curiosity.
PUBLIC LIBRARY(56.0 FTEs)
MAYORLIBRARY BOARD
461
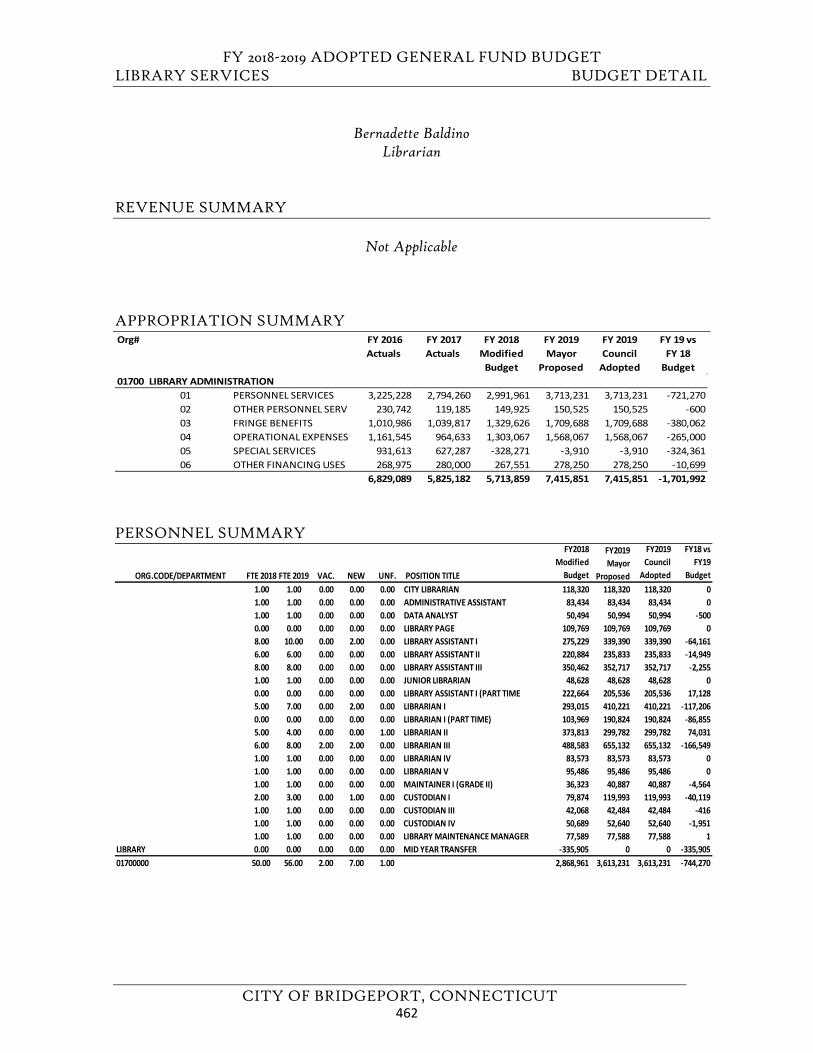
FY 2018-2019 ADOPTED GENERAL FUND BUDGET LIBRARY SERVICES BUDGET DETAIL
CITY OF BRIDGEPORT, CONNECTICUT
Bernadette Baldino Librarian
REVENUE SUMMARY
Not Applicable
APPROPRIATION SUMMARY
PERSONNEL SUMMARY
Org# FY 2016 Actuals
FY 2017 Actuals
FY 2018 Modified
Budget
FY 2019 Mayor
Proposed
FY 2019 Council
Adopted
FY 19 vs FY 18
Budget01700 LIBRARY ADMINISTRATION
01 PERSONNEL SERVICES 3,225,228 2,794,260 2,991,961 3,713,231 3,713,231 -721,27002 OTHER PERSONNEL SERV 230,742 119,185 149,925 150,525 150,525 -60003 FRINGE BENEFITS 1,010,986 1,039,817 1,329,626 1,709,688 1,709,688 -380,06204 OPERATIONAL EXPENSES 1,161,545 964,633 1,303,067 1,568,067 1,568,067 -265,00005 SPECIAL SERVICES 931,613 627,287 -328,271 -3,910 -3,910 -324,36106 OTHER FINANCING USES 268,975 280,000 267,551 278,250 278,250 -10,699
6,829,089 5,825,182 5,713,859 7,415,851 7,415,851 -1,701,992
ORG.CODE/DEPARTMENT FTE 2018 FTE 2019 VAC. NEW UNF. POSITION TITLE
FY2018 Modified
Budget
FY2019 Mayor
Proposed
FY2019 Council
Adopted
FY18 vs FY19
Budget 1.00 1.00 0.00 0.00 0.00 CITY LIBRARIAN 118,320 118,320 118,320 01.00 1.00 0.00 0.00 0.00 ADMINISTRATIVE ASSISTANT 83,434 83,434 83,434 01.00 1.00 0.00 0.00 0.00 DATA ANALYST 50,494 50,994 50,994 -5000.00 0.00 0.00 0.00 0.00 LIBRARY PAGE 109,769 109,769 109,769 08.00 10.00 0.00 2.00 0.00 LIBRARY ASSISTANT I 275,229 339,390 339,390 -64,1616.00 6.00 0.00 0.00 0.00 LIBRARY ASSISTANT II 220,884 235,833 235,833 -14,9498.00 8.00 0.00 0.00 0.00 LIBRARY ASSISTANT III 350,462 352,717 352,717 -2,2551.00 1.00 0.00 0.00 0.00 JUNIOR LIBRARIAN 48,628 48,628 48,628 00.00 0.00 0.00 0.00 0.00 LIBRARY ASSISTANT I (PART TIME 222,664 205,536 205,536 17,1285.00 7.00 0.00 2.00 0.00 LIBRARIAN I 293,015 410,221 410,221 -117,2060.00 0.00 0.00 0.00 0.00 LIBRARIAN I (PART TIME) 103,969 190,824 190,824 -86,8555.00 4.00 0.00 0.00 1.00 LIBRARIAN II 373,813 299,782 299,782 74,0316.00 8.00 2.00 2.00 0.00 LIBRARIAN III 488,583 655,132 655,132 -166,5491.00 1.00 0.00 0.00 0.00 LIBRARIAN IV 83,573 83,573 83,573 01.00 1.00 0.00 0.00 0.00 LIBRARIAN V 95,486 95,486 95,486 01.00 1.00 0.00 0.00 0.00 MAINTAINER I (GRADE II) 36,323 40,887 40,887 -4,5642.00 3.00 0.00 1.00 0.00 CUSTODIAN I 79,874 119,993 119,993 -40,1191.00 1.00 0.00 0.00 0.00 CUSTODIAN III 42,068 42,484 42,484 -4161.00 1.00 0.00 0.00 0.00 CUSTODIAN IV 50,689 52,640 52,640 -1,9511.00 1.00 0.00 0.00 0.00 LIBRARY MAINTENANCE MANAGER 77,589 77,588 77,588 1
LIBRARY 0.00 0.00 0.00 0.00 0.00 MID YEAR TRANSFER -335,905 0 0 -335,90501700000 50.00 56.00 2.00 7.00 1.00 2,868,961 3,613,231 3,613,231 -744,270
462
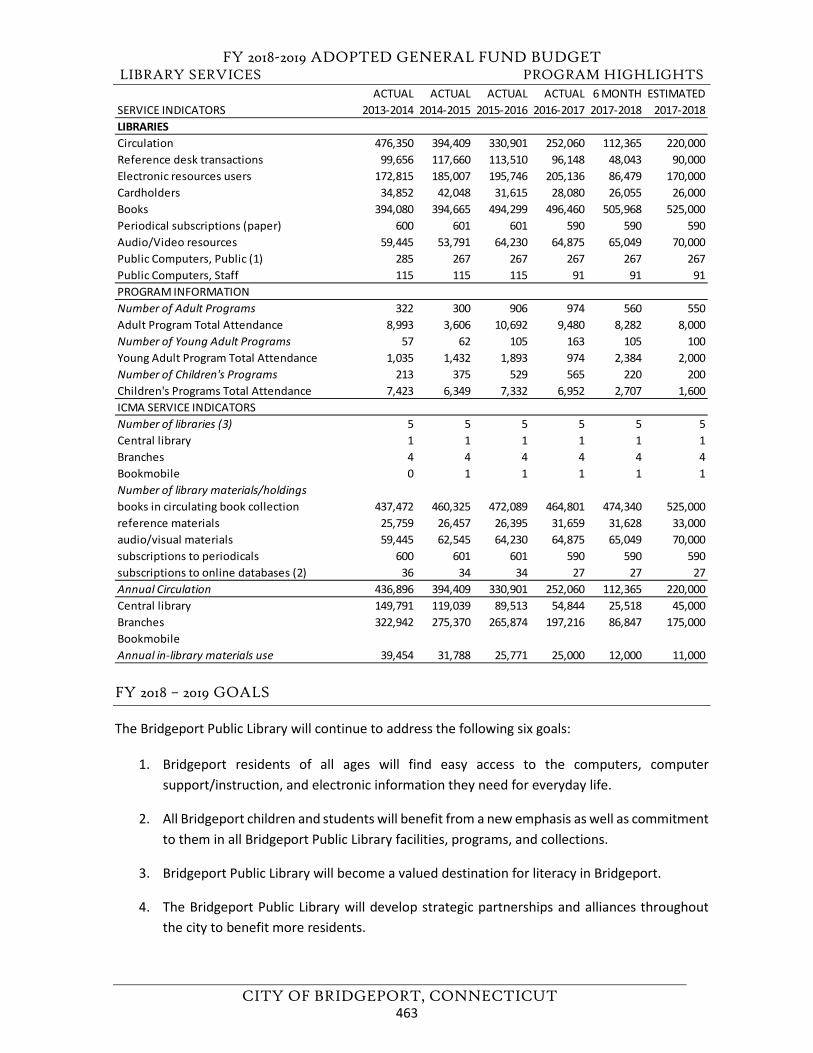
FY 2018-2019 ADOPTED GENERAL FUND BUDGET LIBRARY SERVICES PROGRAM HIGHLIGHTS
CITY OF BRIDGEPORT, CONNECTICUT
FY 2018 – 2019 GOALS
The Bridgeport Public Library will continue to address the following six goals:
1. Bridgeport residents of all ages will find easy access to the computers, computersupport/instruction, and electronic information they need for everyday life.
2. All Bridgeport children and students will benefit from a new emphasis as well as commitment to them in all Bridgeport Public Library facilities, programs, and collections.
3. Bridgeport Public Library will become a valued destination for literacy in Bridgeport.
4. The Bridgeport Public Library will develop strategic partnerships and alliances throughoutthe city to benefit more residents.
ACTUAL ACTUAL ACTUAL ACTUAL 6 MONTH ESTIMATEDSERVICE INDICATORS 2013-2014 2014-2015 2015-2016 2016-2017 2017-2018 2017-2018LIBRARIESCirculation 476,350 394,409 330,901 252,060 112,365 220,000Reference desk transactions 99,656 117,660 113,510 96,148 48,043 90,000Electronic resources users 172,815 185,007 195,746 205,136 86,479 170,000Cardholders 34,852 42,048 31,615 28,080 26,055 26,000Books 394,080 394,665 494,299 496,460 505,968 525,000Periodical subscriptions (paper) 600 601 601 590 590 590Audio/Video resources 59,445 53,791 64,230 64,875 65,049 70,000Public Computers, Public (1) 285 267 267 267 267 267Public Computers, Staff 115 115 115 91 91 91PROGRAM INFORMATIONNumber of Adult Programs 322 300 906 974 560 550Adult Program Total Attendance 8,993 3,606 10,692 9,480 8,282 8,000Number of Young Adult Programs 57 62 105 163 105 100Young Adult Program Total Attendance 1,035 1,432 1,893 974 2,384 2,000Number of Children's Programs 213 375 529 565 220 200Children's Programs Total Attendance 7,423 6,349 7,332 6,952 2,707 1,600ICMA SERVICE INDICATORSNumber of libraries (3) 5 5 5 5 5 5Central library 1 1 1 1 1 1Branches 4 4 4 4 4 4Bookmobile 0 1 1 1 1 1Number of library materials/holdingsbooks in circulating book collection 437,472 460,325 472,089 464,801 474,340 525,000reference materials 25,759 26,457 26,395 31,659 31,628 33,000audio/visual materials 59,445 62,545 64,230 64,875 65,049 70,000subscriptions to periodicals 600 601 601 590 590 590subscriptions to online databases (2) 36 34 34 27 27 27Annual Circulation 436,896 394,409 330,901 252,060 112,365 220,000Central library 149,791 119,039 89,513 54,844 25,518 45,000Branches 322,942 275,370 265,874 197,216 86,847 175,000BookmobileAnnual in-library materials use 39,454 31,788 25,771 25,000 12,000 11,000
463
FY 2018-2019 ADOPTED GENERAL FUND BUDGET LIBRARY SERVICES PROGRAM HIGHLIGHTS
CITY OF BRIDGEPORT, CONNECTICUT
5. Residents will become more aware of Bridgeport’s libraries and consider them to be vitalcommunity resources center.
6. Bridgeport Public Library facilities, collections, programs, and staff will be repositioned tohelp focus on building community, helping people, and changing lives.
FY 2017 – 2018 GOAL STATUS
6 MONTH STATUS: 1.) Bridgeport residents of all ages will find easy access to the computers, computer
support/instruction, and electronic information they need for everyday life.
• The Library has increased its activity on Social Media sites, with Facebook being the mostsuccessful. The BPL Facebook page has over 7,500 Likes and is regularly viewed by over 15,000 people per week. An entirely new web site has been created and through it patrons can moreeasily access online databases, ask questions, and download music, movies, e-books andaudio books as well as browse online magazines. An online shop can also be found on thewebsite, and all proceeds help support the library. The library also continues to distribute itsweekly electronic newsletter that is sent to over 14,000 subscribers.
• Envisionware software at all locations provides color and black and white printing as well asprinting from mobile devices, laptops, and from home to library printers.
• Scanners are available at all locations, including an advanced and very popular Book Scannerat the main Burroughs-Saden location.
6 MONTH STATUS: 2.) All Bridgeport children and students will benefit from a new emphasis as well as commitment
to them in all Bridgeport Public Library facilities, programs, and collections.
• The Library completed its citywide facilities master plan in 2014. In 2015, the Librarypurchased three sites located at 755 Central Avenue, 1174 East Main Street and 2534 EastMain Street. A potential site is being explored for feasibility as a mixed-use community libraryin the Trumbull Avenue area. The city council approved $13M in bonding for the first threelibrary facilities in August 2015. The timetable suggests that community engagementmeetings began in April 2016 and the Library has continued soliciting community input.Schematic designs for Newfield were completed in March 2017. The Library has partneredwith the City’s East End Civic Block Initiative and construction of Newfield will start by early2018. Construction of the upper 1174 East Main Street and 2534 East Main Street locationswill begin shortly thereafter. These new facilities will allow for expanded services in currentlyunderserved areas, to students, children and the larger community.
• Homework Help is offered at all Library locations.
464
FY 2018-2019 ADOPTED GENERAL FUND BUDGET LIBRARY SERVICES PROGRAM HIGHLIGHTS
CITY OF BRIDGEPORT, CONNECTICUT
• The library’s online collection and resources in the Children and Teen’s service areas continueto expand and include ABCMouse.com, free driving permit practice tests through Driving-Tests.org, E-prep for students seeking to prepare for exams as well as Mango & Transparentfor language learning.
• Early literacy efforts include continued Story Time at all branches, technology and makermovement initiatives.
• Library card drives continued to be conducted at several schools year-round.• Technology programming for youth included Hours of Code system-wide, Snap Circuits, Lego
Robotics, MakeyMakey, Lego Robotic, Codings and LittleBits Electronics.
6 MONTH STATUS: 3.) Bridgeport Public Library will become a valued destination for literacy in Bridgeport.
• In 2013, the Library established a strategic partnership with Literacy Volunteers of Bridgeport(LVBPT) to position itself as a literacy provider and to accomplish this goal. LVBPT website isup and running and well utilized.
• LVBPT continues to collaborate with 5 other Literacy offices to organize statewideprofessional development opportunities for tutors.
• LVBPT continues its partnership with the Bridgeport Adult Education Department as aNational External Diploma Program site (we are the only NEDP site in Bridgeport to servemale students).
• LVBPT continues to publish quarterly newsletters.• LVBPT collaborated with many community partners to serve our clients, including: CLICC,
Family Re-Entry, Ability Beyond, Bridgeport Towers, Burroughs Community Center, LifeBridge, Kennedy Center, CT Works.
• LVBPT assists with Lee Y Seras’ family literacy program.• LVBPT registered 146 students from 7/1/17 – 12/31/17 (70 English for Speakers of Other
Language (ESOL), 60 Basic Literacy, 16 National External Diploma Program (NEDP)).• 3 NEDP students earned diplomas from 7/1/17 – 12/31/17.• LVBPT provides English as a Second Oral Language (ESOL) instruction. Our students are adults
over the age of 18 who want to improve their reading, writing and English-speaking skills.They receive free tutoring in a small group setting 2 hours per week. LVBPT currently hasstudents from 58 different countries, speaking at least 30 different languages.
• 12 new volunteer tutors completed training from 7/1/17 – 12/31/17. LVBPT tutors are adultsover the age of 18 who volunteer their time to help others reach their learning goals. Tutorsmust have at least a high school diploma, must speak English clearly and are required to takea 15-hour training workshop. LVBPT provides free training and teaching materials for ourtutors.
• Additional community partners LVBPT has worked with this past year: Project Return, CareerResources, Homes With Hope, Goodwill, Project Longevity, Recovery Networks
465
FY 2018-2019 ADOPTED GENERAL FUND BUDGET LIBRARY SERVICES PROGRAM HIGHLIGHTS
CITY OF BRIDGEPORT, CONNECTICUT
6 MONTH STATUS: 4.) The Bridgeport Public Library will develop strategic partnerships and alliances throughout
the city to benefit more residents.
• As part of a community building strategy which conforms to the Library’s long range strategicplan, the Library has been able to cut programming costs by 50% by building partnershipswith external organizations that can provide no-cost workshops and activities, as well asutilizing inside talent to generate self-sustainable programs and funds provided by the Friends of the Bridgeport Public Library.
• There are opportunities for community members to serve in advisory capacities to the CityLibrarian and Board of Directors. All library board committees and monthly meetings are open to the public and noticed through the city clerk’s office. A more public presence is welcomedas the library moves forward.
• The City/Library has been awarded a second $1M dollar grant from the Connecticut StateLibrary’s State Public Library Construction Grant (2017-2018) for distressed municipalities.This grant will be used to help defray construction costs at the new Newfield Branch Library.
• With adequate staffing, the Bookmobile can be used to provide several city services includingbut not limited to registering to vote, getting a library card, city identification cards, payingtaxes, purchasing copies of vital records (birth, death, or marriage certificates), paying forparking tickets and permits, etc. This concept could generate revenue for the city that hasn’tbeen seen historically.
• A formal partnership with the Bridgeport Public Library and Bridgeport Public Schools isimperative. Hartford Public Library and the Hartford Public Schools launched an ambitiousmodel called “Boundless” that could be better duplicated in Bridgeport.
• The Library continues to partner with numerous community based organizations andbusinesses including but not limited to Access Health CT, Apt Foundation, Black Rock GardenClub, Bridgeport Area Youth Ministry, Bridgeport Housing Authority, Bridgeport PoliceAthletic League, Bridgeport Public Schools, Bridgeport Senior’s Services, Caribe Youth AthleticLeague, Center for Immigration Development, Connecticut Against Violence, ConnecticutCoalition for Environmental Justice, Discovery Museum, Downtown Special Services District,Fresh Connections, Ground Works Bridgeport, Horizons, Juneteenth of Fairfield County, Latino Advocacy Foundation, Literacy Volunteers, Mayor’s Office, Poets Realm, Rotary Club ofBridgeport, University of Bridgeport and Sacred Heart University.
6 MONTH STATUS: 5.) Residents will become more aware of Bridgeport’s libraries and consider them to be vital
community resources center.
• The Library is establishing a library foundation. It is a critical time for the library to launch anaggressive capital campaign to offset the costs of library construction, programming and overallsustainability.
466
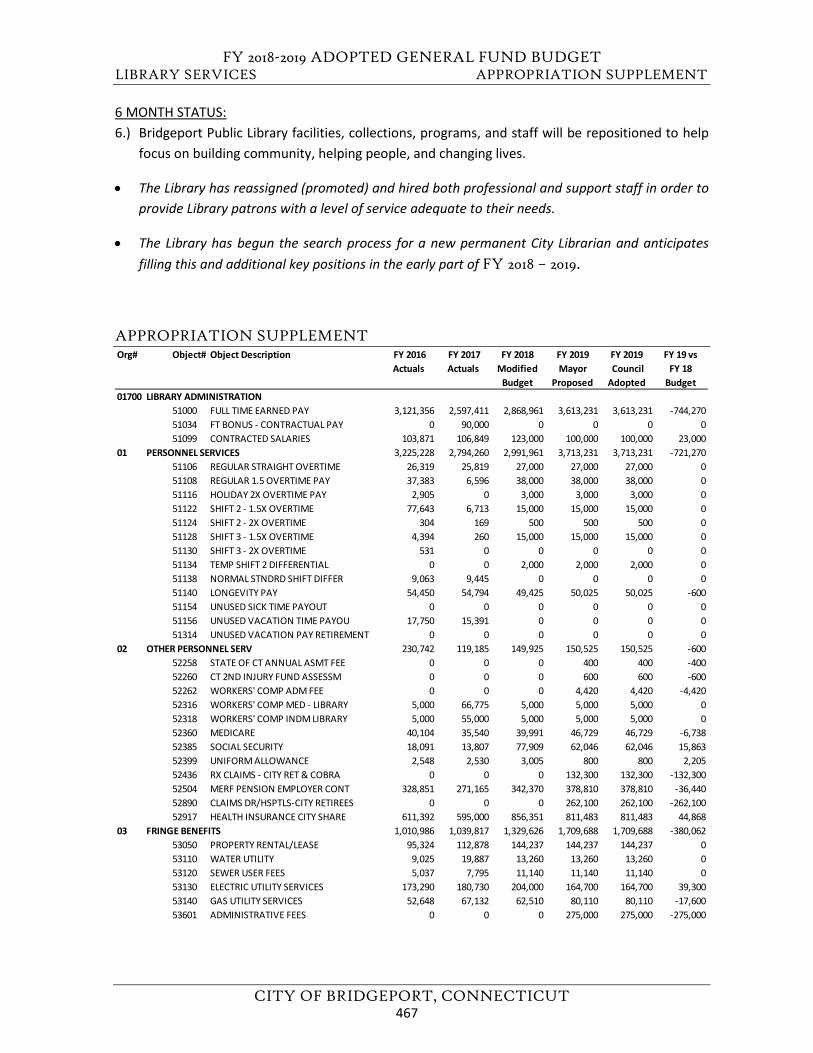
FY 2018-2019 ADOPTED GENERAL FUND BUDGET LIBRARY SERVICES APPROPRIATION SUPPLEMENT
CITY OF BRIDGEPORT, CONNECTICUT
6 MONTH STATUS: 6.) Bridgeport Public Library facilities, collections, programs, and staff will be repositioned to help
focus on building community, helping people, and changing lives.
• The Library has reassigned (promoted) and hired both professional and support staff in order toprovide Library patrons with a level of service adequate to their needs.
• The Library has begun the search process for a new permanent City Librarian and anticipatesfilling this and additional key positions in the early part of FY 2018 – 2019.
APPROPRIATION SUPPLEMENT Org# Object# Object Description FY 2016
Actuals FY 2017 Actuals
FY 2018 Modified
Budget
FY 2019Mayor
Proposed
FY 2019 Council Adopted
FY 19 vs FY 18
Budget01700 LIBRARY ADMINISTRATION
51000 FULL TIME EARNED PAY 3,121,356 2,597,411 2,868,961 3,613,231 3,613,231 -744,27051034 FT BONUS - CONTRACTUAL PAY 0 90,000 0 0 0 051099 CONTRACTED SALARIES 103,871 106,849 123,000 100,000 100,000 23,000
01 PERSONNEL SERVICES 3,225,228 2,794,260 2,991,961 3,713,231 3,713,231 -721,27051106 REGULAR STRAIGHT OVERTIME 26,319 25,819 27,000 27,000 27,000 051108 REGULAR 1.5 OVERTIME PAY 37,383 6,596 38,000 38,000 38,000 051116 HOLIDAY 2X OVERTIME PAY 2,905 0 3,000 3,000 3,000 051122 SHIFT 2 - 1.5X OVERTIME 77,643 6,713 15,000 15,000 15,000 051124 SHIFT 2 - 2X OVERTIME 304 169 500 500 500 051128 SHIFT 3 - 1.5X OVERTIME 4,394 260 15,000 15,000 15,000 051130 SHIFT 3 - 2X OVERTIME 531 0 0 0 0 051134 TEMP SHIFT 2 DIFFERENTIAL 0 0 2,000 2,000 2,000 051138 NORMAL STNDRD SHIFT DIFFER 9,063 9,445 0 0 0 051140 LONGEVITY PAY 54,450 54,794 49,425 50,025 50,025 -60051154 UNUSED SICK TIME PAYOUT 0 0 0 0 0 051156 UNUSED VACATION TIME PAYOU 17,750 15,391 0 0 0 051314 UNUSED VACATION PAY RETIREMENT 0 0 0 0 0 0
02 OTHER PERSONNEL SERV 230,742 119,185 149,925 150,525 150,525 -60052258 STATE OF CT ANNUAL ASMT FEE 0 0 0 400 400 -40052260 CT 2ND INJURY FUND ASSESSM 0 0 0 600 600 -60052262 WORKERS' COMP ADM FEE 0 0 0 4,420 4,420 -4,42052316 WORKERS' COMP MED - LIBRARY 5,000 66,775 5,000 5,000 5,000 052318 WORKERS' COMP INDM LIBRARY 5,000 55,000 5,000 5,000 5,000 052360 MEDICARE 40,104 35,540 39,991 46,729 46,729 -6,73852385 SOCIAL SECURITY 18,091 13,807 77,909 62,046 62,046 15,86352399 UNIFORM ALLOWANCE 2,548 2,530 3,005 800 800 2,20552436 RX CLAIMS - CITY RET & COBRA 0 0 0 132,300 132,300 -132,30052504 MERF PENSION EMPLOYER CONT 328,851 271,165 342,370 378,810 378,810 -36,44052890 CLAIMS DR/HSPTLS-CITY RETIREES 0 0 0 262,100 262,100 -262,10052917 HEALTH INSURANCE CITY SHARE 611,392 595,000 856,351 811,483 811,483 44,868
03 FRINGE BENEFITS 1,010,986 1,039,817 1,329,626 1,709,688 1,709,688 -380,06253050 PROPERTY RENTAL/LEASE 95,324 112,878 144,237 144,237 144,237 053110 WATER UTILITY 9,025 19,887 13,260 13,260 13,260 053120 SEWER USER FEES 5,037 7,795 11,140 11,140 11,140 053130 ELECTRIC UTILITY SERVICES 173,290 180,730 204,000 164,700 164,700 39,30053140 GAS UTILITY SERVICES 52,648 67,132 62,510 80,110 80,110 -17,60053601 ADMINISTRATIVE FEES 0 0 0 275,000 275,000 -275,000
467
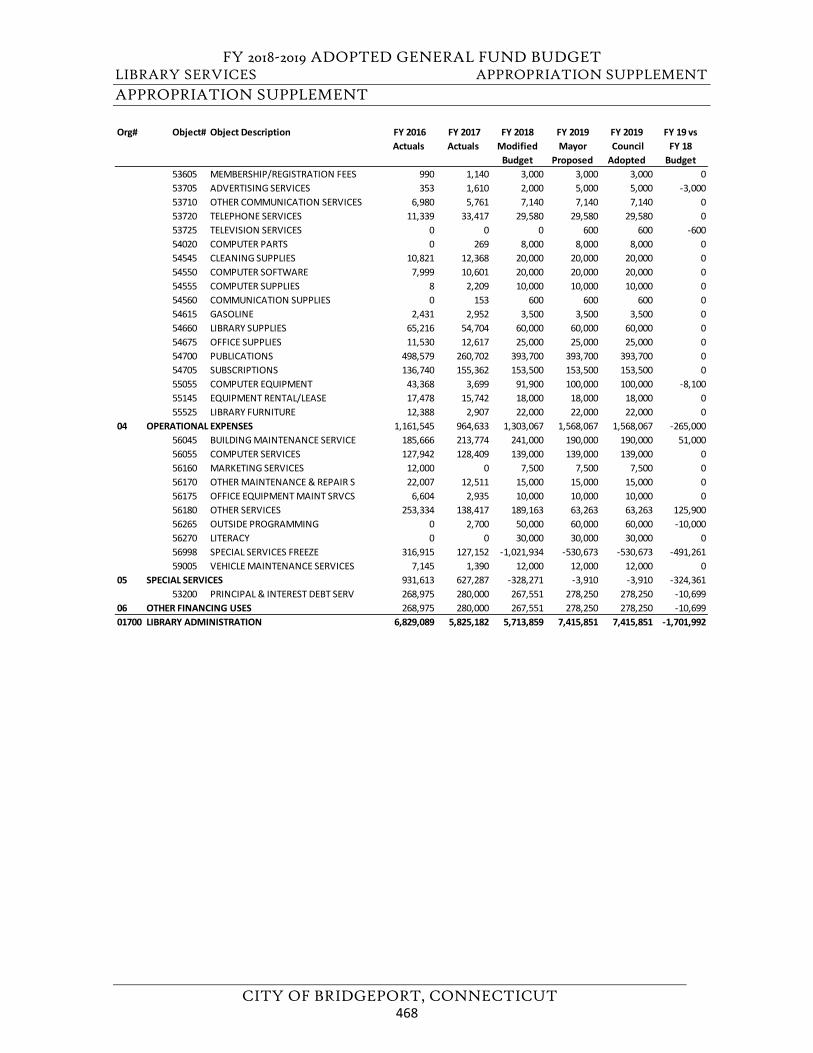
FY 2018-2019 ADOPTED GENERAL FUND BUDGET LIBRARY SERVICES APPROPRIATION SUPPLEMENT
CITY OF BRIDGEPORT, CONNECTICUT
APPROPRIATION SUPPLEMENT
Org# Object# Object Description FY 2016 Actuals
FY 2017 Actuals
FY 2018 Modified
Budget
FY 2019Mayor
Proposed
FY 2019 Council Adopted
FY 19 vs FY 18
Budget53605 MEMBERSHIP/REGISTRATION FEES 990 1,140 3,000 3,000 3,000 053705 ADVERTISING SERVICES 353 1,610 2,000 5,000 5,000 -3,00053710 OTHER COMMUNICATION SERVICES 6,980 5,761 7,140 7,140 7,140 053720 TELEPHONE SERVICES 11,339 33,417 29,580 29,580 29,580 053725 TELEVISION SERVICES 0 0 0 600 600 -60054020 COMPUTER PARTS 0 269 8,000 8,000 8,000 054545 CLEANING SUPPLIES 10,821 12,368 20,000 20,000 20,000 054550 COMPUTER SOFTWARE 7,999 10,601 20,000 20,000 20,000 054555 COMPUTER SUPPLIES 8 2,209 10,000 10,000 10,000 054560 COMMUNICATION SUPPLIES 0 153 600 600 600 054615 GASOLINE 2,431 2,952 3,500 3,500 3,500 054660 LIBRARY SUPPLIES 65,216 54,704 60,000 60,000 60,000 054675 OFFICE SUPPLIES 11,530 12,617 25,000 25,000 25,000 054700 PUBLICATIONS 498,579 260,702 393,700 393,700 393,700 054705 SUBSCRIPTIONS 136,740 155,362 153,500 153,500 153,500 055055 COMPUTER EQUIPMENT 43,368 3,699 91,900 100,000 100,000 -8,10055145 EQUIPMENT RENTAL/LEASE 17,478 15,742 18,000 18,000 18,000 055525 LIBRARY FURNITURE 12,388 2,907 22,000 22,000 22,000 0
04 OPERATIONAL EXPENSES 1,161,545 964,633 1,303,067 1,568,067 1,568,067 -265,00056045 BUILDING MAINTENANCE SERVICE 185,666 213,774 241,000 190,000 190,000 51,00056055 COMPUTER SERVICES 127,942 128,409 139,000 139,000 139,000 056160 MARKETING SERVICES 12,000 0 7,500 7,500 7,500 056170 OTHER MAINTENANCE & REPAIR S 22,007 12,511 15,000 15,000 15,000 056175 OFFICE EQUIPMENT MAINT SRVCS 6,604 2,935 10,000 10,000 10,000 056180 OTHER SERVICES 253,334 138,417 189,163 63,263 63,263 125,90056265 OUTSIDE PROGRAMMING 0 2,700 50,000 60,000 60,000 -10,00056270 LITERACY 0 0 30,000 30,000 30,000 056998 SPECIAL SERVICES FREEZE 316,915 127,152 -1,021,934 -530,673 -530,673 -491,26159005 VEHICLE MAINTENANCE SERVICES 7,145 1,390 12,000 12,000 12,000 0
05 SPECIAL SERVICES 931,613 627,287 -328,271 -3,910 -3,910 -324,36153200 PRINCIPAL & INTEREST DEBT SERV 268,975 280,000 267,551 278,250 278,250 -10,699
06 OTHER FINANCING USES 268,975 280,000 267,551 278,250 278,250 -10,69901700 LIBRARY ADMINISTRATION 6,829,089 5,825,182 5,713,859 7,415,851 7,415,851 -1,701,992
468
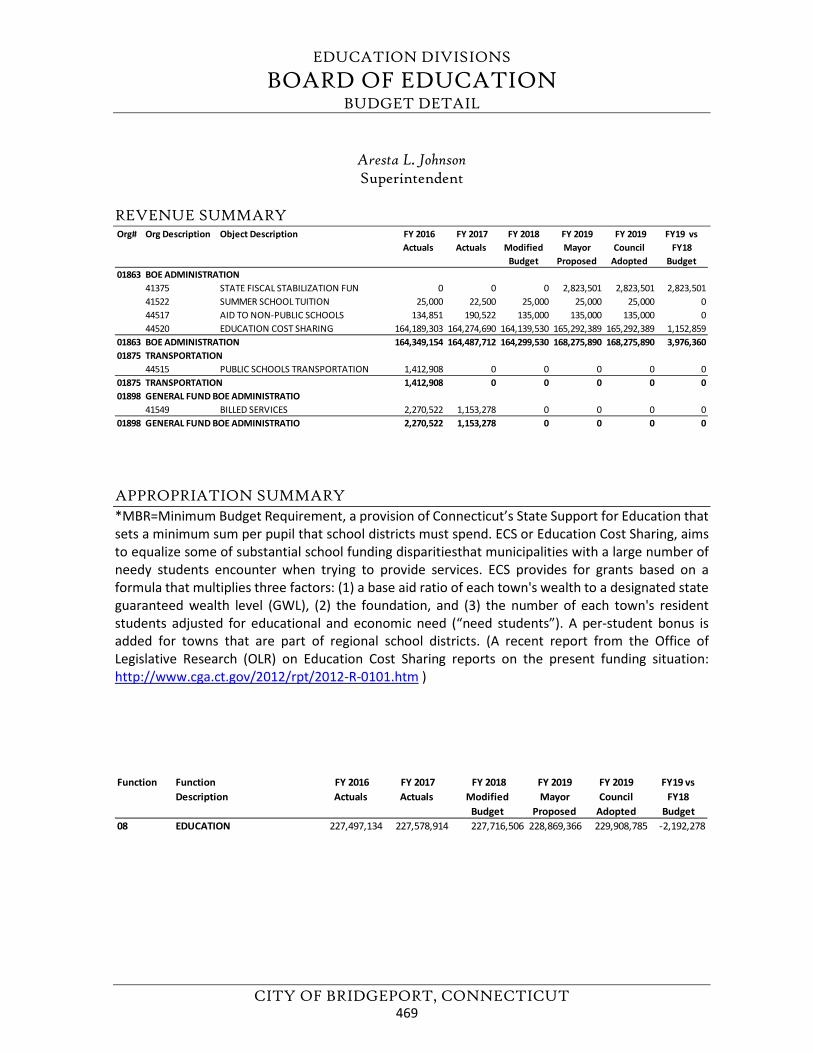
EDUCATION DIVISIONS
BOARD OF EDUCATION BUDGET DETAIL
CITY OF BRIDGEPORT, CONNECTICUT
Aresta L. Johnson Superintendent
REVENUE SUMMARY
APPROPRIATION SUMMARY *MBR=Minimum Budget Requirement, a provision of Connecticut’s State Support for Education thatsets a minimum sum per pupil that school districts must spend. ECS or Education Cost Sharing, aimsto equalize some of substantial school funding disparitiesthat municipalities with a large number ofneedy students encounter when trying to provide services. ECS provides for grants based on aformula that multiplies three factors: (1) a base aid ratio of each town's wealth to a designated stateguaranteed wealth level (GWL), (2) the foundation, and (3) the number of each town's residentstudents adjusted for educational and economic need (“need students”). A per-student bonus isadded for towns that are part of regional school districts. (A recent report from the Office ofLegislative Research (OLR) on Education Cost Sharing reports on the present funding situation:http://www.cga.ct.gov/2012/rpt/2012-R-0101.htm )
Org# Org Description Object Description FY 2016 Actuals
FY 2017 Actuals
FY 2018 Modified
Budget
FY 2019 Mayor
Proposed
FY 2019 Council
Adopted
FY19 vs FY18
Budget01863 BOE ADMINISTRATION
41375 STATE FISCAL STABILIZATION FUN 0 0 0 2,823,501 2,823,501 2,823,50141522 SUMMER SCHOOL TUITION 25,000 22,500 25,000 25,000 25,000 044517 AID TO NON-PUBLIC SCHOOLS 134,851 190,522 135,000 135,000 135,000 044520 EDUCATION COST SHARING 164,189,303 164,274,690 164,139,530 165,292,389 165,292,389 1,152,859
01863 BOE ADMINISTRATION 164,349,154 164,487,712 164,299,530 168,275,890 168,275,890 3,976,36001875 TRANSPORTATION
44515 PUBLIC SCHOOLS TRANSPORTATION 1,412,908 0 0 0 0 001875 TRANSPORTATION 1,412,908 0 0 0 0 001898 GENERAL FUND BOE ADMINISTRATIO
41549 BILLED SERVICES 2,270,522 1,153,278 0 0 0 001898 GENERAL FUND BOE ADMINISTRATIO 2,270,522 1,153,278 0 0 0 0
Function Function Description
FY 2016Actuals
FY 2017Actuals
FY 2018 Modified
Budget
FY 2019 Mayor
Proposed
FY 2019 Council
Adopted
FY19 vs FY18
Budget08 EDUCATION 227,497,134 227,578,914 227,716,506 228,869,366 229,908,785 -2,192,278
469
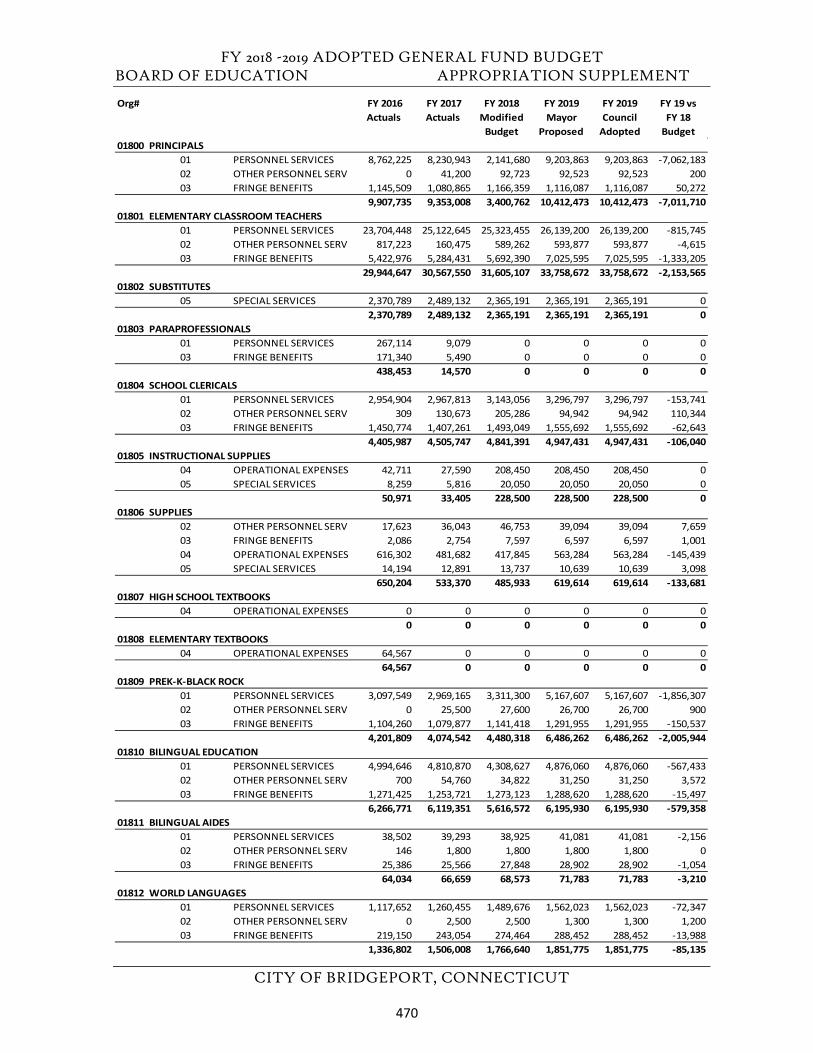
FY 2018 -2019 ADOPTED GENERAL FUND BUDGET BOARD OF EDUCATION APPROPRIATION SUPPLEMENT
CITY OF BRIDGEPORT, CONNECTICUT
Org# FY 2016 Actuals
FY 2017 Actuals
FY 2018 Modified
Budget
FY 2019 Mayor
Proposed
FY 2019 Council
Adopted
FY 19 vs FY 18
Budget01800 PRINCIPALS
01 PERSONNEL SERVICES 8,762,225 8,230,943 2,141,680 9,203,863 9,203,863 -7,062,18302 OTHER PERSONNEL SERV 0 41,200 92,723 92,523 92,523 20003 FRINGE BENEFITS 1,145,509 1,080,865 1,166,359 1,116,087 1,116,087 50,272
9,907,735 9,353,008 3,400,762 10,412,473 10,412,473 -7,011,71001801 ELEMENTARY CLASSROOM TEACHERS
01 PERSONNEL SERVICES 23,704,448 25,122,645 25,323,455 26,139,200 26,139,200 -815,74502 OTHER PERSONNEL SERV 817,223 160,475 589,262 593,877 593,877 -4,61503 FRINGE BENEFITS 5,422,976 5,284,431 5,692,390 7,025,595 7,025,595 -1,333,205
29,944,647 30,567,550 31,605,107 33,758,672 33,758,672 -2,153,56501802 SUBSTITUTES
05 SPECIAL SERVICES 2,370,789 2,489,132 2,365,191 2,365,191 2,365,191 02,370,789 2,489,132 2,365,191 2,365,191 2,365,191 0
01803 PARAPROFESSIONALS01 PERSONNEL SERVICES 267,114 9,079 0 0 0 003 FRINGE BENEFITS 171,340 5,490 0 0 0 0
438,453 14,570 0 0 0 001804 SCHOOL CLERICALS
01 PERSONNEL SERVICES 2,954,904 2,967,813 3,143,056 3,296,797 3,296,797 -153,74102 OTHER PERSONNEL SERV 309 130,673 205,286 94,942 94,942 110,34403 FRINGE BENEFITS 1,450,774 1,407,261 1,493,049 1,555,692 1,555,692 -62,643
4,405,987 4,505,747 4,841,391 4,947,431 4,947,431 -106,04001805 INSTRUCTIONAL SUPPLIES
04 OPERATIONAL EXPENSES 42,711 27,590 208,450 208,450 208,450 005 SPECIAL SERVICES 8,259 5,816 20,050 20,050 20,050 0
50,971 33,405 228,500 228,500 228,500 001806 SUPPLIES
02 OTHER PERSONNEL SERV 17,623 36,043 46,753 39,094 39,094 7,65903 FRINGE BENEFITS 2,086 2,754 7,597 6,597 6,597 1,00104 OPERATIONAL EXPENSES 616,302 481,682 417,845 563,284 563,284 -145,43905 SPECIAL SERVICES 14,194 12,891 13,737 10,639 10,639 3,098
650,204 533,370 485,933 619,614 619,614 -133,68101807 HIGH SCHOOL TEXTBOOKS
04 OPERATIONAL EXPENSES 0 0 0 0 0 00 0 0 0 0 0
01808 ELEMENTARY TEXTBOOKS04 OPERATIONAL EXPENSES 64,567 0 0 0 0 0
64,567 0 0 0 0 001809 PREK-K-BLACK ROCK
01 PERSONNEL SERVICES 3,097,549 2,969,165 3,311,300 5,167,607 5,167,607 -1,856,30702 OTHER PERSONNEL SERV 0 25,500 27,600 26,700 26,700 90003 FRINGE BENEFITS 1,104,260 1,079,877 1,141,418 1,291,955 1,291,955 -150,537
4,201,809 4,074,542 4,480,318 6,486,262 6,486,262 -2,005,94401810 BILINGUAL EDUCATION
01 PERSONNEL SERVICES 4,994,646 4,810,870 4,308,627 4,876,060 4,876,060 -567,43302 OTHER PERSONNEL SERV 700 54,760 34,822 31,250 31,250 3,57203 FRINGE BENEFITS 1,271,425 1,253,721 1,273,123 1,288,620 1,288,620 -15,497
6,266,771 6,119,351 5,616,572 6,195,930 6,195,930 -579,35801811 BILINGUAL AIDES
01 PERSONNEL SERVICES 38,502 39,293 38,925 41,081 41,081 -2,15602 OTHER PERSONNEL SERV 146 1,800 1,800 1,800 1,800 003 FRINGE BENEFITS 25,386 25,566 27,848 28,902 28,902 -1,054
64,034 66,659 68,573 71,783 71,783 -3,21001812 WORLD LANGUAGES
01 PERSONNEL SERVICES 1,117,652 1,260,455 1,489,676 1,562,023 1,562,023 -72,34702 OTHER PERSONNEL SERV 0 2,500 2,500 1,300 1,300 1,20003 FRINGE BENEFITS 219,150 243,054 274,464 288,452 288,452 -13,988
1,336,802 1,506,008 1,766,640 1,851,775 1,851,775 -85,135
470
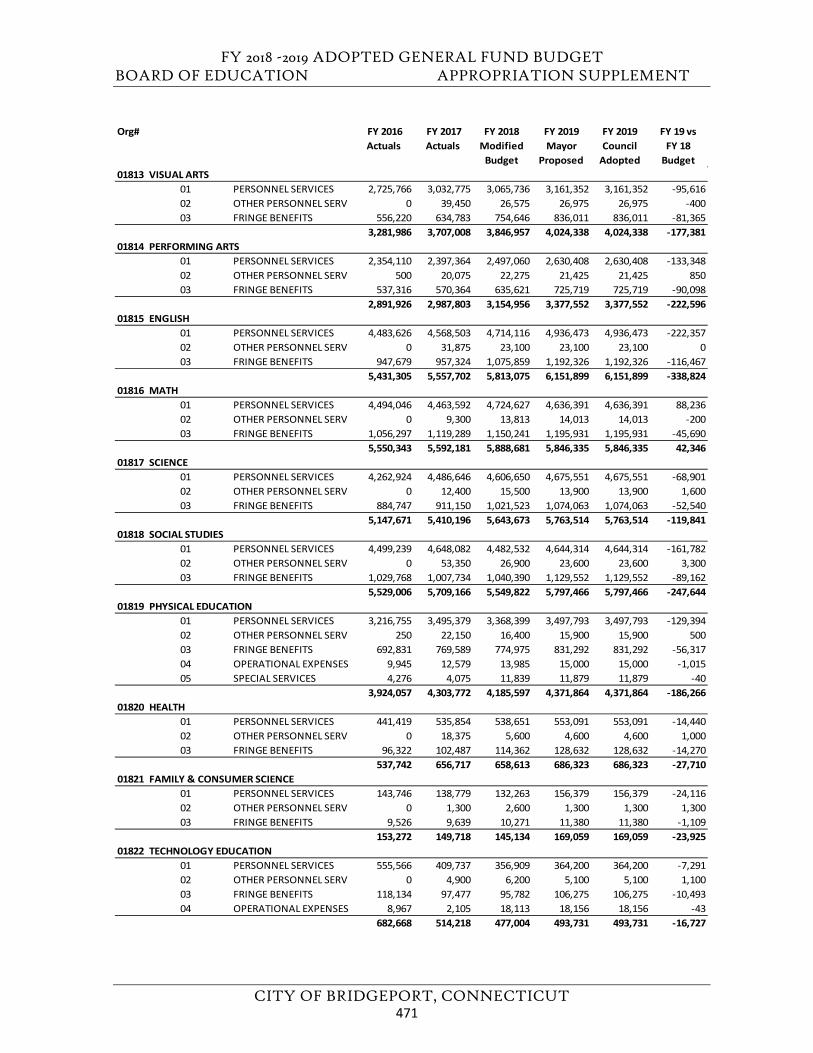
FY 2018 -2019 ADOPTED GENERAL FUND BUDGET BOARD OF EDUCATION APPROPRIATION SUPPLEMENT
CITY OF BRIDGEPORT, CONNECTICUT
Org# FY 2016 Actuals
FY 2017 Actuals
FY 2018 Modified
Budget
FY 2019 Mayor
Proposed
FY 2019 Council
Adopted
FY 19 vs FY 18
Budget01813 VISUAL ARTS
01 PERSONNEL SERVICES 2,725,766 3,032,775 3,065,736 3,161,352 3,161,352 -95,61602 OTHER PERSONNEL SERV 0 39,450 26,575 26,975 26,975 -40003 FRINGE BENEFITS 556,220 634,783 754,646 836,011 836,011 -81,365
3,281,986 3,707,008 3,846,957 4,024,338 4,024,338 -177,38101814 PERFORMING ARTS
01 PERSONNEL SERVICES 2,354,110 2,397,364 2,497,060 2,630,408 2,630,408 -133,34802 OTHER PERSONNEL SERV 500 20,075 22,275 21,425 21,425 85003 FRINGE BENEFITS 537,316 570,364 635,621 725,719 725,719 -90,098
2,891,926 2,987,803 3,154,956 3,377,552 3,377,552 -222,59601815 ENGLISH
01 PERSONNEL SERVICES 4,483,626 4,568,503 4,714,116 4,936,473 4,936,473 -222,35702 OTHER PERSONNEL SERV 0 31,875 23,100 23,100 23,100 003 FRINGE BENEFITS 947,679 957,324 1,075,859 1,192,326 1,192,326 -116,467
5,431,305 5,557,702 5,813,075 6,151,899 6,151,899 -338,82401816 MATH
01 PERSONNEL SERVICES 4,494,046 4,463,592 4,724,627 4,636,391 4,636,391 88,23602 OTHER PERSONNEL SERV 0 9,300 13,813 14,013 14,013 -20003 FRINGE BENEFITS 1,056,297 1,119,289 1,150,241 1,195,931 1,195,931 -45,690
5,550,343 5,592,181 5,888,681 5,846,335 5,846,335 42,34601817 SCIENCE
01 PERSONNEL SERVICES 4,262,924 4,486,646 4,606,650 4,675,551 4,675,551 -68,90102 OTHER PERSONNEL SERV 0 12,400 15,500 13,900 13,900 1,60003 FRINGE BENEFITS 884,747 911,150 1,021,523 1,074,063 1,074,063 -52,540
5,147,671 5,410,196 5,643,673 5,763,514 5,763,514 -119,84101818 SOCIAL STUDIES
01 PERSONNEL SERVICES 4,499,239 4,648,082 4,482,532 4,644,314 4,644,314 -161,78202 OTHER PERSONNEL SERV 0 53,350 26,900 23,600 23,600 3,30003 FRINGE BENEFITS 1,029,768 1,007,734 1,040,390 1,129,552 1,129,552 -89,162
5,529,006 5,709,166 5,549,822 5,797,466 5,797,466 -247,64401819 PHYSICAL EDUCATION
01 PERSONNEL SERVICES 3,216,755 3,495,379 3,368,399 3,497,793 3,497,793 -129,39402 OTHER PERSONNEL SERV 250 22,150 16,400 15,900 15,900 50003 FRINGE BENEFITS 692,831 769,589 774,975 831,292 831,292 -56,31704 OPERATIONAL EXPENSES 9,945 12,579 13,985 15,000 15,000 -1,01505 SPECIAL SERVICES 4,276 4,075 11,839 11,879 11,879 -40
3,924,057 4,303,772 4,185,597 4,371,864 4,371,864 -186,26601820 HEALTH
01 PERSONNEL SERVICES 441,419 535,854 538,651 553,091 553,091 -14,44002 OTHER PERSONNEL SERV 0 18,375 5,600 4,600 4,600 1,00003 FRINGE BENEFITS 96,322 102,487 114,362 128,632 128,632 -14,270
537,742 656,717 658,613 686,323 686,323 -27,71001821 FAMILY & CONSUMER SCIENCE
01 PERSONNEL SERVICES 143,746 138,779 132,263 156,379 156,379 -24,11602 OTHER PERSONNEL SERV 0 1,300 2,600 1,300 1,300 1,30003 FRINGE BENEFITS 9,526 9,639 10,271 11,380 11,380 -1,109
153,272 149,718 145,134 169,059 169,059 -23,92501822 TECHNOLOGY EDUCATION
01 PERSONNEL SERVICES 555,566 409,737 356,909 364,200 364,200 -7,29102 OTHER PERSONNEL SERV 0 4,900 6,200 5,100 5,100 1,10003 FRINGE BENEFITS 118,134 97,477 95,782 106,275 106,275 -10,49304 OPERATIONAL EXPENSES 8,967 2,105 18,113 18,156 18,156 -43
682,668 514,218 477,004 493,731 493,731 -16,727
471
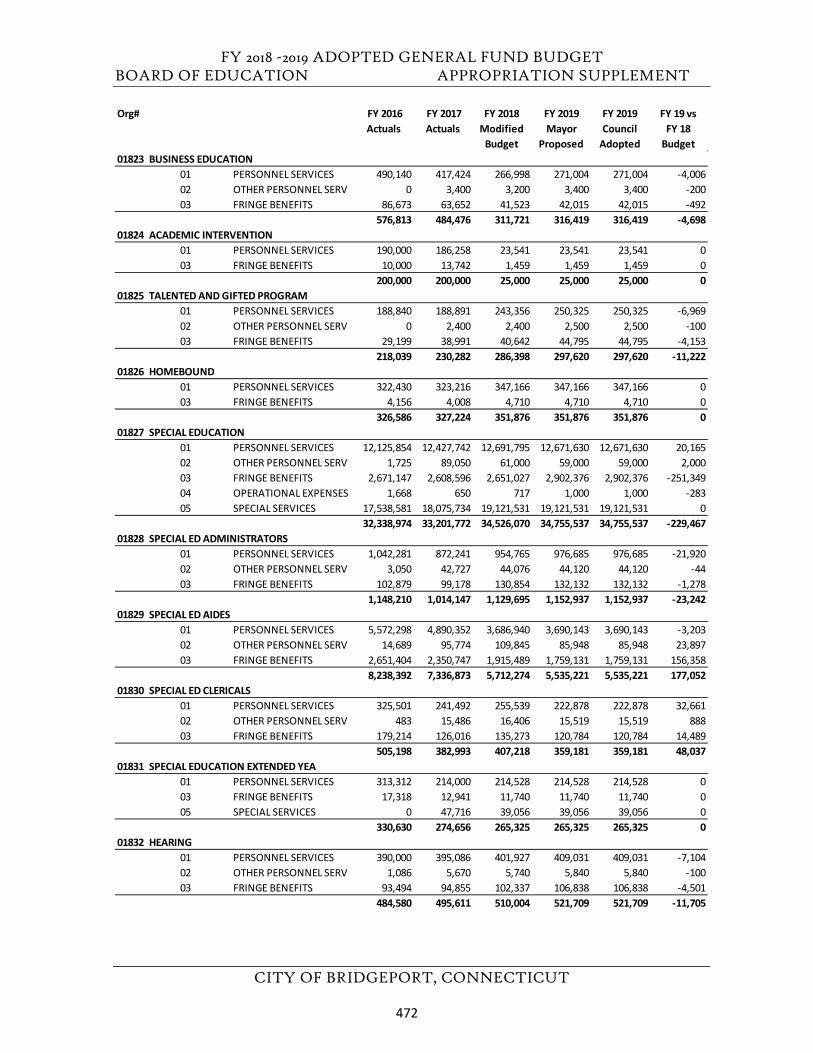
FY 2018 -2019 ADOPTED GENERAL FUND BUDGET BOARD OF EDUCATION APPROPRIATION SUPPLEMENT
CITY OF BRIDGEPORT, CONNECTICUT
Org# FY 2016 Actuals
FY 2017 Actuals
FY 2018 Modified
Budget
FY 2019 Mayor
Proposed
FY 2019 Council
Adopted
FY 19 vs FY 18
Budget01823 BUSINESS EDUCATION
01 PERSONNEL SERVICES 490,140 417,424 266,998 271,004 271,004 -4,00602 OTHER PERSONNEL SERV 0 3,400 3,200 3,400 3,400 -20003 FRINGE BENEFITS 86,673 63,652 41,523 42,015 42,015 -492
576,813 484,476 311,721 316,419 316,419 -4,69801824 ACADEMIC INTERVENTION
01 PERSONNEL SERVICES 190,000 186,258 23,541 23,541 23,541 003 FRINGE BENEFITS 10,000 13,742 1,459 1,459 1,459 0
200,000 200,000 25,000 25,000 25,000 001825 TALENTED AND GIFTED PROGRAM
01 PERSONNEL SERVICES 188,840 188,891 243,356 250,325 250,325 -6,96902 OTHER PERSONNEL SERV 0 2,400 2,400 2,500 2,500 -10003 FRINGE BENEFITS 29,199 38,991 40,642 44,795 44,795 -4,153
218,039 230,282 286,398 297,620 297,620 -11,22201826 HOMEBOUND
01 PERSONNEL SERVICES 322,430 323,216 347,166 347,166 347,166 003 FRINGE BENEFITS 4,156 4,008 4,710 4,710 4,710 0
326,586 327,224 351,876 351,876 351,876 001827 SPECIAL EDUCATION
01 PERSONNEL SERVICES 12,125,854 12,427,742 12,691,795 12,671,630 12,671,630 20,16502 OTHER PERSONNEL SERV 1,725 89,050 61,000 59,000 59,000 2,00003 FRINGE BENEFITS 2,671,147 2,608,596 2,651,027 2,902,376 2,902,376 -251,34904 OPERATIONAL EXPENSES 1,668 650 717 1,000 1,000 -28305 SPECIAL SERVICES 17,538,581 18,075,734 19,121,531 19,121,531 19,121,531 0
32,338,974 33,201,772 34,526,070 34,755,537 34,755,537 -229,46701828 SPECIAL ED ADMINISTRATORS
01 PERSONNEL SERVICES 1,042,281 872,241 954,765 976,685 976,685 -21,92002 OTHER PERSONNEL SERV 3,050 42,727 44,076 44,120 44,120 -4403 FRINGE BENEFITS 102,879 99,178 130,854 132,132 132,132 -1,278
1,148,210 1,014,147 1,129,695 1,152,937 1,152,937 -23,24201829 SPECIAL ED AIDES
01 PERSONNEL SERVICES 5,572,298 4,890,352 3,686,940 3,690,143 3,690,143 -3,20302 OTHER PERSONNEL SERV 14,689 95,774 109,845 85,948 85,948 23,89703 FRINGE BENEFITS 2,651,404 2,350,747 1,915,489 1,759,131 1,759,131 156,358
8,238,392 7,336,873 5,712,274 5,535,221 5,535,221 177,05201830 SPECIAL ED CLERICALS
01 PERSONNEL SERVICES 325,501 241,492 255,539 222,878 222,878 32,66102 OTHER PERSONNEL SERV 483 15,486 16,406 15,519 15,519 88803 FRINGE BENEFITS 179,214 126,016 135,273 120,784 120,784 14,489
505,198 382,993 407,218 359,181 359,181 48,03701831 SPECIAL EDUCATION EXTENDED YEA
01 PERSONNEL SERVICES 313,312 214,000 214,528 214,528 214,528 003 FRINGE BENEFITS 17,318 12,941 11,740 11,740 11,740 005 SPECIAL SERVICES 0 47,716 39,056 39,056 39,056 0
330,630 274,656 265,325 265,325 265,325 001832 HEARING
01 PERSONNEL SERVICES 390,000 395,086 401,927 409,031 409,031 -7,10402 OTHER PERSONNEL SERV 1,086 5,670 5,740 5,840 5,840 -10003 FRINGE BENEFITS 93,494 94,855 102,337 106,838 106,838 -4,501
484,580 495,611 510,004 521,709 521,709 -11,705
472
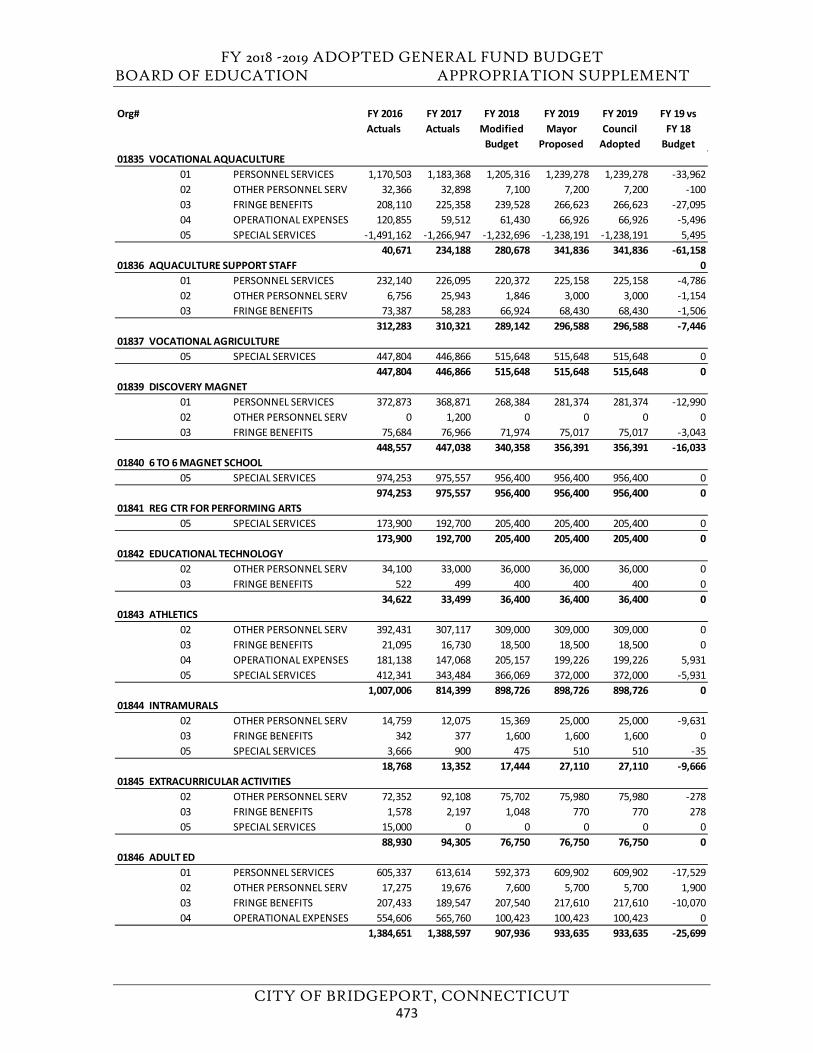
FY 2018 -2019 ADOPTED GENERAL FUND BUDGET BOARD OF EDUCATION APPROPRIATION SUPPLEMENT
CITY OF BRIDGEPORT, CONNECTICUT
Org# FY 2016 Actuals
FY 2017 Actuals
FY 2018 Modified
Budget
FY 2019 Mayor
Proposed
FY 2019 Council
Adopted
FY 19 vs FY 18
Budget01835 VOCATIONAL AQUACULTURE
01 PERSONNEL SERVICES 1,170,503 1,183,368 1,205,316 1,239,278 1,239,278 -33,96202 OTHER PERSONNEL SERV 32,366 32,898 7,100 7,200 7,200 -10003 FRINGE BENEFITS 208,110 225,358 239,528 266,623 266,623 -27,09504 OPERATIONAL EXPENSES 120,855 59,512 61,430 66,926 66,926 -5,49605 SPECIAL SERVICES -1,491,162 -1,266,947 -1,232,696 -1,238,191 -1,238,191 5,495
40,671 234,188 280,678 341,836 341,836 -61,15801836 AQUACULTURE SUPPORT STAFF 0
01 PERSONNEL SERVICES 232,140 226,095 220,372 225,158 225,158 -4,78602 OTHER PERSONNEL SERV 6,756 25,943 1,846 3,000 3,000 -1,15403 FRINGE BENEFITS 73,387 58,283 66,924 68,430 68,430 -1,506
312,283 310,321 289,142 296,588 296,588 -7,44601837 VOCATIONAL AGRICULTURE
05 SPECIAL SERVICES 447,804 446,866 515,648 515,648 515,648 0447,804 446,866 515,648 515,648 515,648 0
01839 DISCOVERY MAGNET01 PERSONNEL SERVICES 372,873 368,871 268,384 281,374 281,374 -12,99002 OTHER PERSONNEL SERV 0 1,200 0 0 0 003 FRINGE BENEFITS 75,684 76,966 71,974 75,017 75,017 -3,043
448,557 447,038 340,358 356,391 356,391 -16,03301840 6 TO 6 MAGNET SCHOOL
05 SPECIAL SERVICES 974,253 975,557 956,400 956,400 956,400 0974,253 975,557 956,400 956,400 956,400 0
01841 REG CTR FOR PERFORMING ARTS05 SPECIAL SERVICES 173,900 192,700 205,400 205,400 205,400 0
173,900 192,700 205,400 205,400 205,400 001842 EDUCATIONAL TECHNOLOGY
02 OTHER PERSONNEL SERV 34,100 33,000 36,000 36,000 36,000 003 FRINGE BENEFITS 522 499 400 400 400 0
34,622 33,499 36,400 36,400 36,400 001843 ATHLETICS
02 OTHER PERSONNEL SERV 392,431 307,117 309,000 309,000 309,000 003 FRINGE BENEFITS 21,095 16,730 18,500 18,500 18,500 004 OPERATIONAL EXPENSES 181,138 147,068 205,157 199,226 199,226 5,93105 SPECIAL SERVICES 412,341 343,484 366,069 372,000 372,000 -5,931
1,007,006 814,399 898,726 898,726 898,726 001844 INTRAMURALS
02 OTHER PERSONNEL SERV 14,759 12,075 15,369 25,000 25,000 -9,63103 FRINGE BENEFITS 342 377 1,600 1,600 1,600 005 SPECIAL SERVICES 3,666 900 475 510 510 -35
18,768 13,352 17,444 27,110 27,110 -9,66601845 EXTRACURRICULAR ACTIVITIES
02 OTHER PERSONNEL SERV 72,352 92,108 75,702 75,980 75,980 -27803 FRINGE BENEFITS 1,578 2,197 1,048 770 770 27805 SPECIAL SERVICES 15,000 0 0 0 0 0
88,930 94,305 76,750 76,750 76,750 001846 ADULT ED
01 PERSONNEL SERVICES 605,337 613,614 592,373 609,902 609,902 -17,52902 OTHER PERSONNEL SERV 17,275 19,676 7,600 5,700 5,700 1,90003 FRINGE BENEFITS 207,433 189,547 207,540 217,610 217,610 -10,07004 OPERATIONAL EXPENSES 554,606 565,760 100,423 100,423 100,423 0
1,384,651 1,388,597 907,936 933,635 933,635 -25,699
473
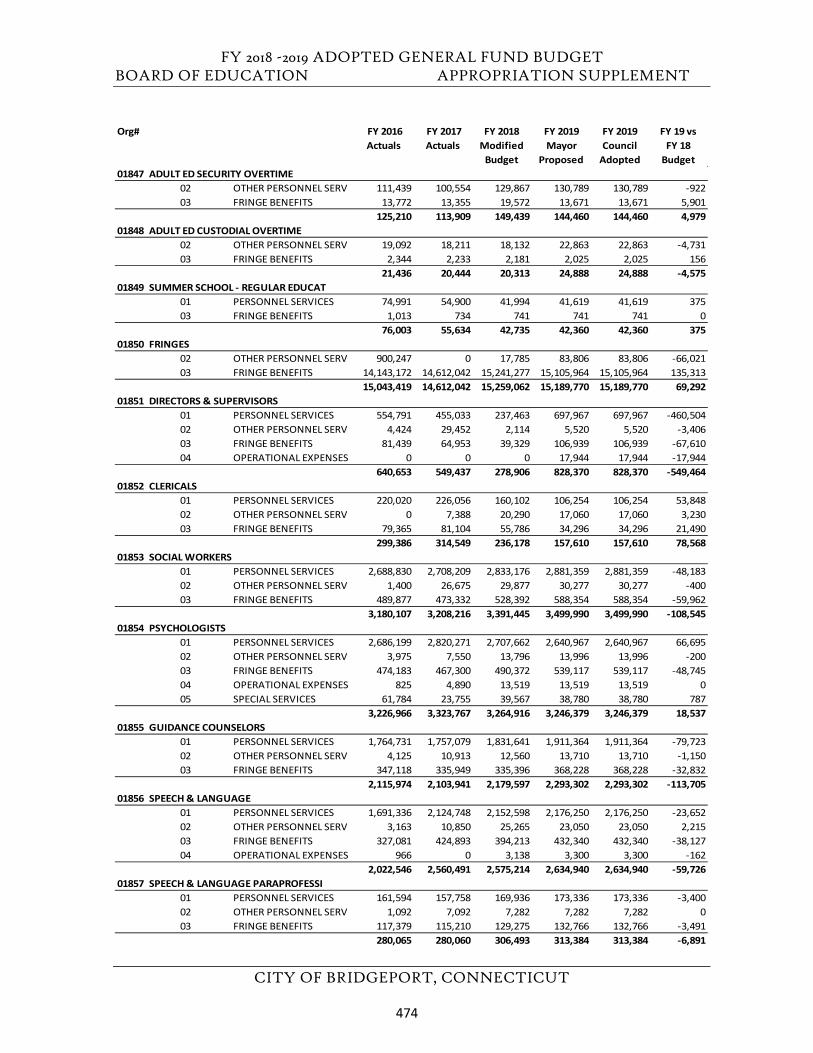
FY 2018 -2019 ADOPTED GENERAL FUND BUDGET BOARD OF EDUCATION APPROPRIATION SUPPLEMENT
CITY OF BRIDGEPORT, CONNECTICUT
Org# FY 2016 Actuals
FY 2017 Actuals
FY 2018 Modified
Budget
FY 2019 Mayor
Proposed
FY 2019 Council
Adopted
FY 19 vs FY 18
Budget01847 ADULT ED SECURITY OVERTIME
02 OTHER PERSONNEL SERV 111,439 100,554 129,867 130,789 130,789 -92203 FRINGE BENEFITS 13,772 13,355 19,572 13,671 13,671 5,901
125,210 113,909 149,439 144,460 144,460 4,97901848 ADULT ED CUSTODIAL OVERTIME
02 OTHER PERSONNEL SERV 19,092 18,211 18,132 22,863 22,863 -4,73103 FRINGE BENEFITS 2,344 2,233 2,181 2,025 2,025 156
21,436 20,444 20,313 24,888 24,888 -4,57501849 SUMMER SCHOOL - REGULAR EDUCAT
01 PERSONNEL SERVICES 74,991 54,900 41,994 41,619 41,619 37503 FRINGE BENEFITS 1,013 734 741 741 741 0
76,003 55,634 42,735 42,360 42,360 37501850 FRINGES
02 OTHER PERSONNEL SERV 900,247 0 17,785 83,806 83,806 -66,02103 FRINGE BENEFITS 14,143,172 14,612,042 15,241,277 15,105,964 15,105,964 135,313
15,043,419 14,612,042 15,259,062 15,189,770 15,189,770 69,29201851 DIRECTORS & SUPERVISORS
01 PERSONNEL SERVICES 554,791 455,033 237,463 697,967 697,967 -460,50402 OTHER PERSONNEL SERV 4,424 29,452 2,114 5,520 5,520 -3,40603 FRINGE BENEFITS 81,439 64,953 39,329 106,939 106,939 -67,61004 OPERATIONAL EXPENSES 0 0 0 17,944 17,944 -17,944
640,653 549,437 278,906 828,370 828,370 -549,46401852 CLERICALS
01 PERSONNEL SERVICES 220,020 226,056 160,102 106,254 106,254 53,84802 OTHER PERSONNEL SERV 0 7,388 20,290 17,060 17,060 3,23003 FRINGE BENEFITS 79,365 81,104 55,786 34,296 34,296 21,490
299,386 314,549 236,178 157,610 157,610 78,56801853 SOCIAL WORKERS
01 PERSONNEL SERVICES 2,688,830 2,708,209 2,833,176 2,881,359 2,881,359 -48,18302 OTHER PERSONNEL SERV 1,400 26,675 29,877 30,277 30,277 -40003 FRINGE BENEFITS 489,877 473,332 528,392 588,354 588,354 -59,962
3,180,107 3,208,216 3,391,445 3,499,990 3,499,990 -108,54501854 PSYCHOLOGISTS
01 PERSONNEL SERVICES 2,686,199 2,820,271 2,707,662 2,640,967 2,640,967 66,69502 OTHER PERSONNEL SERV 3,975 7,550 13,796 13,996 13,996 -20003 FRINGE BENEFITS 474,183 467,300 490,372 539,117 539,117 -48,74504 OPERATIONAL EXPENSES 825 4,890 13,519 13,519 13,519 005 SPECIAL SERVICES 61,784 23,755 39,567 38,780 38,780 787
3,226,966 3,323,767 3,264,916 3,246,379 3,246,379 18,53701855 GUIDANCE COUNSELORS
01 PERSONNEL SERVICES 1,764,731 1,757,079 1,831,641 1,911,364 1,911,364 -79,72302 OTHER PERSONNEL SERV 4,125 10,913 12,560 13,710 13,710 -1,15003 FRINGE BENEFITS 347,118 335,949 335,396 368,228 368,228 -32,832
2,115,974 2,103,941 2,179,597 2,293,302 2,293,302 -113,70501856 SPEECH & LANGUAGE
01 PERSONNEL SERVICES 1,691,336 2,124,748 2,152,598 2,176,250 2,176,250 -23,65202 OTHER PERSONNEL SERV 3,163 10,850 25,265 23,050 23,050 2,21503 FRINGE BENEFITS 327,081 424,893 394,213 432,340 432,340 -38,12704 OPERATIONAL EXPENSES 966 0 3,138 3,300 3,300 -162
2,022,546 2,560,491 2,575,214 2,634,940 2,634,940 -59,72601857 SPEECH & LANGUAGE PARAPROFESSI
01 PERSONNEL SERVICES 161,594 157,758 169,936 173,336 173,336 -3,40002 OTHER PERSONNEL SERV 1,092 7,092 7,282 7,282 7,282 003 FRINGE BENEFITS 117,379 115,210 129,275 132,766 132,766 -3,491
280,065 280,060 306,493 313,384 313,384 -6,891
474
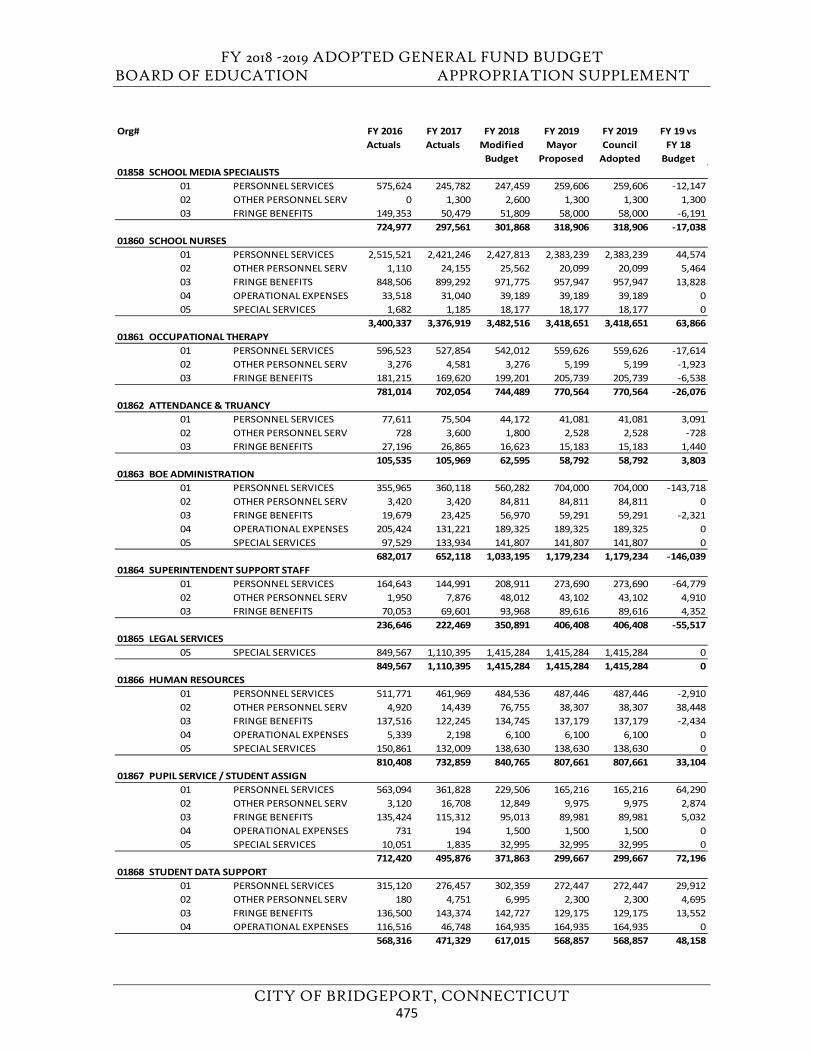
FY 2018 -2019 ADOPTED GENERAL FUND BUDGET BOARD OF EDUCATION APPROPRIATION SUPPLEMENT
CITY OF BRIDGEPORT, CONNECTICUT
Org# FY 2016 Actuals
FY 2017 Actuals
FY 2018 Modified
Budget
FY 2019 Mayor
Proposed
FY 2019 Council
Adopted
FY 19 vs FY 18
Budget01858 SCHOOL MEDIA SPECIALISTS
01 PERSONNEL SERVICES 575,624 245,782 247,459 259,606 259,606 -12,14702 OTHER PERSONNEL SERV 0 1,300 2,600 1,300 1,300 1,30003 FRINGE BENEFITS 149,353 50,479 51,809 58,000 58,000 -6,191
724,977 297,561 301,868 318,906 318,906 -17,03801860 SCHOOL NURSES
01 PERSONNEL SERVICES 2,515,521 2,421,246 2,427,813 2,383,239 2,383,239 44,57402 OTHER PERSONNEL SERV 1,110 24,155 25,562 20,099 20,099 5,46403 FRINGE BENEFITS 848,506 899,292 971,775 957,947 957,947 13,82804 OPERATIONAL EXPENSES 33,518 31,040 39,189 39,189 39,189 005 SPECIAL SERVICES 1,682 1,185 18,177 18,177 18,177 0
3,400,337 3,376,919 3,482,516 3,418,651 3,418,651 63,86601861 OCCUPATIONAL THERAPY
01 PERSONNEL SERVICES 596,523 527,854 542,012 559,626 559,626 -17,61402 OTHER PERSONNEL SERV 3,276 4,581 3,276 5,199 5,199 -1,92303 FRINGE BENEFITS 181,215 169,620 199,201 205,739 205,739 -6,538
781,014 702,054 744,489 770,564 770,564 -26,07601862 ATTENDANCE & TRUANCY
01 PERSONNEL SERVICES 77,611 75,504 44,172 41,081 41,081 3,09102 OTHER PERSONNEL SERV 728 3,600 1,800 2,528 2,528 -72803 FRINGE BENEFITS 27,196 26,865 16,623 15,183 15,183 1,440
105,535 105,969 62,595 58,792 58,792 3,80301863 BOE ADMINISTRATION
01 PERSONNEL SERVICES 355,965 360,118 560,282 704,000 704,000 -143,71802 OTHER PERSONNEL SERV 3,420 3,420 84,811 84,811 84,811 003 FRINGE BENEFITS 19,679 23,425 56,970 59,291 59,291 -2,32104 OPERATIONAL EXPENSES 205,424 131,221 189,325 189,325 189,325 005 SPECIAL SERVICES 97,529 133,934 141,807 141,807 141,807 0
682,017 652,118 1,033,195 1,179,234 1,179,234 -146,03901864 SUPERINTENDENT SUPPORT STAFF
01 PERSONNEL SERVICES 164,643 144,991 208,911 273,690 273,690 -64,77902 OTHER PERSONNEL SERV 1,950 7,876 48,012 43,102 43,102 4,91003 FRINGE BENEFITS 70,053 69,601 93,968 89,616 89,616 4,352
236,646 222,469 350,891 406,408 406,408 -55,51701865 LEGAL SERVICES
05 SPECIAL SERVICES 849,567 1,110,395 1,415,284 1,415,284 1,415,284 0849,567 1,110,395 1,415,284 1,415,284 1,415,284 0
01866 HUMAN RESOURCES01 PERSONNEL SERVICES 511,771 461,969 484,536 487,446 487,446 -2,91002 OTHER PERSONNEL SERV 4,920 14,439 76,755 38,307 38,307 38,44803 FRINGE BENEFITS 137,516 122,245 134,745 137,179 137,179 -2,43404 OPERATIONAL EXPENSES 5,339 2,198 6,100 6,100 6,100 005 SPECIAL SERVICES 150,861 132,009 138,630 138,630 138,630 0
810,408 732,859 840,765 807,661 807,661 33,10401867 PUPIL SERVICE / STUDENT ASSIGN
01 PERSONNEL SERVICES 563,094 361,828 229,506 165,216 165,216 64,29002 OTHER PERSONNEL SERV 3,120 16,708 12,849 9,975 9,975 2,87403 FRINGE BENEFITS 135,424 115,312 95,013 89,981 89,981 5,03204 OPERATIONAL EXPENSES 731 194 1,500 1,500 1,500 005 SPECIAL SERVICES 10,051 1,835 32,995 32,995 32,995 0
712,420 495,876 371,863 299,667 299,667 72,19601868 STUDENT DATA SUPPORT
01 PERSONNEL SERVICES 315,120 276,457 302,359 272,447 272,447 29,91202 OTHER PERSONNEL SERV 180 4,751 6,995 2,300 2,300 4,69503 FRINGE BENEFITS 136,500 143,374 142,727 129,175 129,175 13,55204 OPERATIONAL EXPENSES 116,516 46,748 164,935 164,935 164,935 0
568,316 471,329 617,015 568,857 568,857 48,158
475
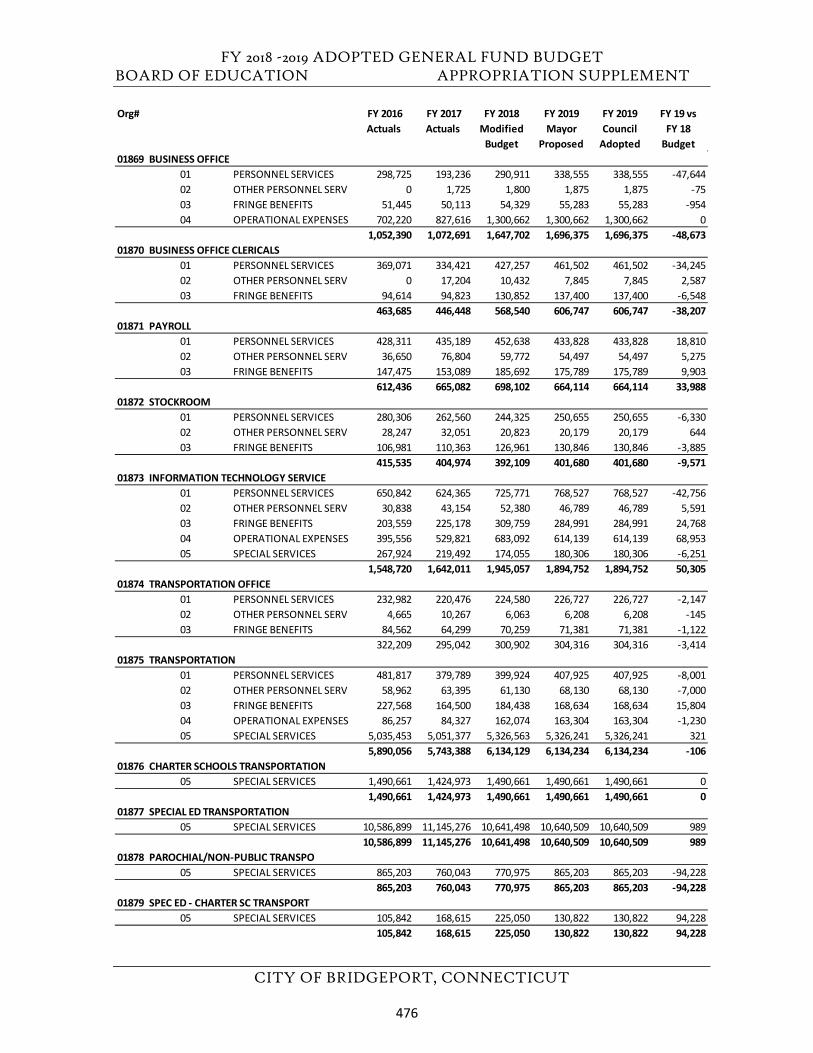
FY 2018 -2019 ADOPTED GENERAL FUND BUDGET BOARD OF EDUCATION APPROPRIATION SUPPLEMENT
CITY OF BRIDGEPORT, CONNECTICUT
Org# FY 2016 Actuals
FY 2017 Actuals
FY 2018 Modified
Budget
FY 2019 Mayor
Proposed
FY 2019 Council
Adopted
FY 19 vs FY 18
Budget01869 BUSINESS OFFICE
01 PERSONNEL SERVICES 298,725 193,236 290,911 338,555 338,555 -47,64402 OTHER PERSONNEL SERV 0 1,725 1,800 1,875 1,875 -7503 FRINGE BENEFITS 51,445 50,113 54,329 55,283 55,283 -95404 OPERATIONAL EXPENSES 702,220 827,616 1,300,662 1,300,662 1,300,662 0
1,052,390 1,072,691 1,647,702 1,696,375 1,696,375 -48,67301870 BUSINESS OFFICE CLERICALS
01 PERSONNEL SERVICES 369,071 334,421 427,257 461,502 461,502 -34,24502 OTHER PERSONNEL SERV 0 17,204 10,432 7,845 7,845 2,58703 FRINGE BENEFITS 94,614 94,823 130,852 137,400 137,400 -6,548
463,685 446,448 568,540 606,747 606,747 -38,20701871 PAYROLL
01 PERSONNEL SERVICES 428,311 435,189 452,638 433,828 433,828 18,81002 OTHER PERSONNEL SERV 36,650 76,804 59,772 54,497 54,497 5,27503 FRINGE BENEFITS 147,475 153,089 185,692 175,789 175,789 9,903
612,436 665,082 698,102 664,114 664,114 33,98801872 STOCKROOM
01 PERSONNEL SERVICES 280,306 262,560 244,325 250,655 250,655 -6,33002 OTHER PERSONNEL SERV 28,247 32,051 20,823 20,179 20,179 64403 FRINGE BENEFITS 106,981 110,363 126,961 130,846 130,846 -3,885
415,535 404,974 392,109 401,680 401,680 -9,57101873 INFORMATION TECHNOLOGY SERVICE
01 PERSONNEL SERVICES 650,842 624,365 725,771 768,527 768,527 -42,75602 OTHER PERSONNEL SERV 30,838 43,154 52,380 46,789 46,789 5,59103 FRINGE BENEFITS 203,559 225,178 309,759 284,991 284,991 24,76804 OPERATIONAL EXPENSES 395,556 529,821 683,092 614,139 614,139 68,95305 SPECIAL SERVICES 267,924 219,492 174,055 180,306 180,306 -6,251
1,548,720 1,642,011 1,945,057 1,894,752 1,894,752 50,30501874 TRANSPORTATION OFFICE
01 PERSONNEL SERVICES 232,982 220,476 224,580 226,727 226,727 -2,14702 OTHER PERSONNEL SERV 4,665 10,267 6,063 6,208 6,208 -14503 FRINGE BENEFITS 84,562 64,299 70,259 71,381 71,381 -1,122
322,209 295,042 300,902 304,316 304,316 -3,41401875 TRANSPORTATION
01 PERSONNEL SERVICES 481,817 379,789 399,924 407,925 407,925 -8,00102 OTHER PERSONNEL SERV 58,962 63,395 61,130 68,130 68,130 -7,00003 FRINGE BENEFITS 227,568 164,500 184,438 168,634 168,634 15,80404 OPERATIONAL EXPENSES 86,257 84,327 162,074 163,304 163,304 -1,23005 SPECIAL SERVICES 5,035,453 5,051,377 5,326,563 5,326,241 5,326,241 321
5,890,056 5,743,388 6,134,129 6,134,234 6,134,234 -10601876 CHARTER SCHOOLS TRANSPORTATION
05 SPECIAL SERVICES 1,490,661 1,424,973 1,490,661 1,490,661 1,490,661 01,490,661 1,424,973 1,490,661 1,490,661 1,490,661 0
01877 SPECIAL ED TRANSPORTATION05 SPECIAL SERVICES 10,586,899 11,145,276 10,641,498 10,640,509 10,640,509 989
10,586,899 11,145,276 10,641,498 10,640,509 10,640,509 98901878 PAROCHIAL/NON-PUBLIC TRANSPO
05 SPECIAL SERVICES 865,203 760,043 770,975 865,203 865,203 -94,228865,203 760,043 770,975 865,203 865,203 -94,228
01879 SPEC ED - CHARTER SC TRANSPORT05 SPECIAL SERVICES 105,842 168,615 225,050 130,822 130,822 94,228
105,842 168,615 225,050 130,822 130,822 94,228
476
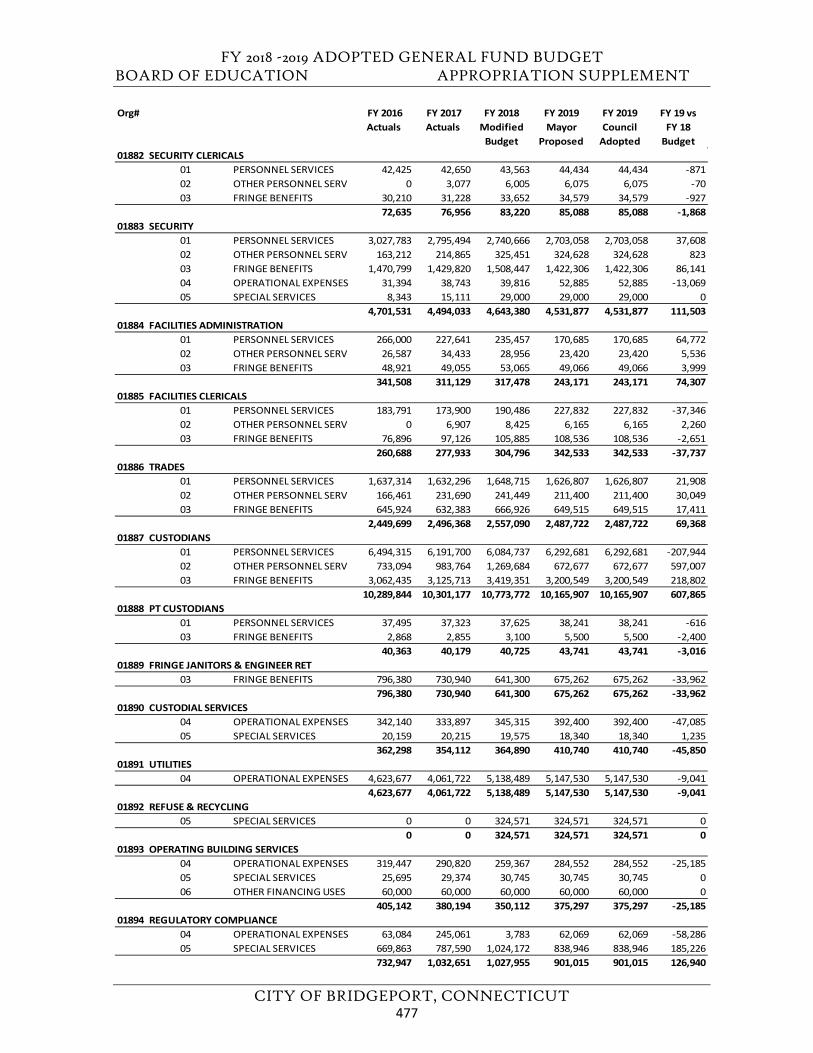
FY 2018 -2019 ADOPTED GENERAL FUND BUDGET BOARD OF EDUCATION APPROPRIATION SUPPLEMENT
CITY OF BRIDGEPORT, CONNECTICUT
Org# FY 2016 Actuals
FY 2017 Actuals
FY 2018 Modified
Budget
FY 2019 Mayor
Proposed
FY 2019 Council
Adopted
FY 19 vs FY 18
Budget01882 SECURITY CLERICALS
01 PERSONNEL SERVICES 42,425 42,650 43,563 44,434 44,434 -87102 OTHER PERSONNEL SERV 0 3,077 6,005 6,075 6,075 -7003 FRINGE BENEFITS 30,210 31,228 33,652 34,579 34,579 -927
72,635 76,956 83,220 85,088 85,088 -1,86801883 SECURITY
01 PERSONNEL SERVICES 3,027,783 2,795,494 2,740,666 2,703,058 2,703,058 37,60802 OTHER PERSONNEL SERV 163,212 214,865 325,451 324,628 324,628 82303 FRINGE BENEFITS 1,470,799 1,429,820 1,508,447 1,422,306 1,422,306 86,14104 OPERATIONAL EXPENSES 31,394 38,743 39,816 52,885 52,885 -13,06905 SPECIAL SERVICES 8,343 15,111 29,000 29,000 29,000 0
4,701,531 4,494,033 4,643,380 4,531,877 4,531,877 111,50301884 FACILITIES ADMINISTRATION
01 PERSONNEL SERVICES 266,000 227,641 235,457 170,685 170,685 64,77202 OTHER PERSONNEL SERV 26,587 34,433 28,956 23,420 23,420 5,53603 FRINGE BENEFITS 48,921 49,055 53,065 49,066 49,066 3,999
341,508 311,129 317,478 243,171 243,171 74,30701885 FACILITIES CLERICALS
01 PERSONNEL SERVICES 183,791 173,900 190,486 227,832 227,832 -37,34602 OTHER PERSONNEL SERV 0 6,907 8,425 6,165 6,165 2,26003 FRINGE BENEFITS 76,896 97,126 105,885 108,536 108,536 -2,651
260,688 277,933 304,796 342,533 342,533 -37,73701886 TRADES
01 PERSONNEL SERVICES 1,637,314 1,632,296 1,648,715 1,626,807 1,626,807 21,90802 OTHER PERSONNEL SERV 166,461 231,690 241,449 211,400 211,400 30,04903 FRINGE BENEFITS 645,924 632,383 666,926 649,515 649,515 17,411
2,449,699 2,496,368 2,557,090 2,487,722 2,487,722 69,36801887 CUSTODIANS
01 PERSONNEL SERVICES 6,494,315 6,191,700 6,084,737 6,292,681 6,292,681 -207,94402 OTHER PERSONNEL SERV 733,094 983,764 1,269,684 672,677 672,677 597,00703 FRINGE BENEFITS 3,062,435 3,125,713 3,419,351 3,200,549 3,200,549 218,802
10,289,844 10,301,177 10,773,772 10,165,907 10,165,907 607,86501888 PT CUSTODIANS
01 PERSONNEL SERVICES 37,495 37,323 37,625 38,241 38,241 -61603 FRINGE BENEFITS 2,868 2,855 3,100 5,500 5,500 -2,400
40,363 40,179 40,725 43,741 43,741 -3,01601889 FRINGE JANITORS & ENGINEER RET
03 FRINGE BENEFITS 796,380 730,940 641,300 675,262 675,262 -33,962796,380 730,940 641,300 675,262 675,262 -33,962
01890 CUSTODIAL SERVICES04 OPERATIONAL EXPENSES 342,140 333,897 345,315 392,400 392,400 -47,08505 SPECIAL SERVICES 20,159 20,215 19,575 18,340 18,340 1,235
362,298 354,112 364,890 410,740 410,740 -45,85001891 UTILITIES
04 OPERATIONAL EXPENSES 4,623,677 4,061,722 5,138,489 5,147,530 5,147,530 -9,0414,623,677 4,061,722 5,138,489 5,147,530 5,147,530 -9,041
01892 REFUSE & RECYCLING05 SPECIAL SERVICES 0 0 324,571 324,571 324,571 0
0 0 324,571 324,571 324,571 001893 OPERATING BUILDING SERVICES
04 OPERATIONAL EXPENSES 319,447 290,820 259,367 284,552 284,552 -25,18505 SPECIAL SERVICES 25,695 29,374 30,745 30,745 30,745 006 OTHER FINANCING USES 60,000 60,000 60,000 60,000 60,000 0
405,142 380,194 350,112 375,297 375,297 -25,18501894 REGULATORY COMPLIANCE
04 OPERATIONAL EXPENSES 63,084 245,061 3,783 62,069 62,069 -58,28605 SPECIAL SERVICES 669,863 787,590 1,024,172 838,946 838,946 185,226
732,947 1,032,651 1,027,955 901,015 901,015 126,940
477
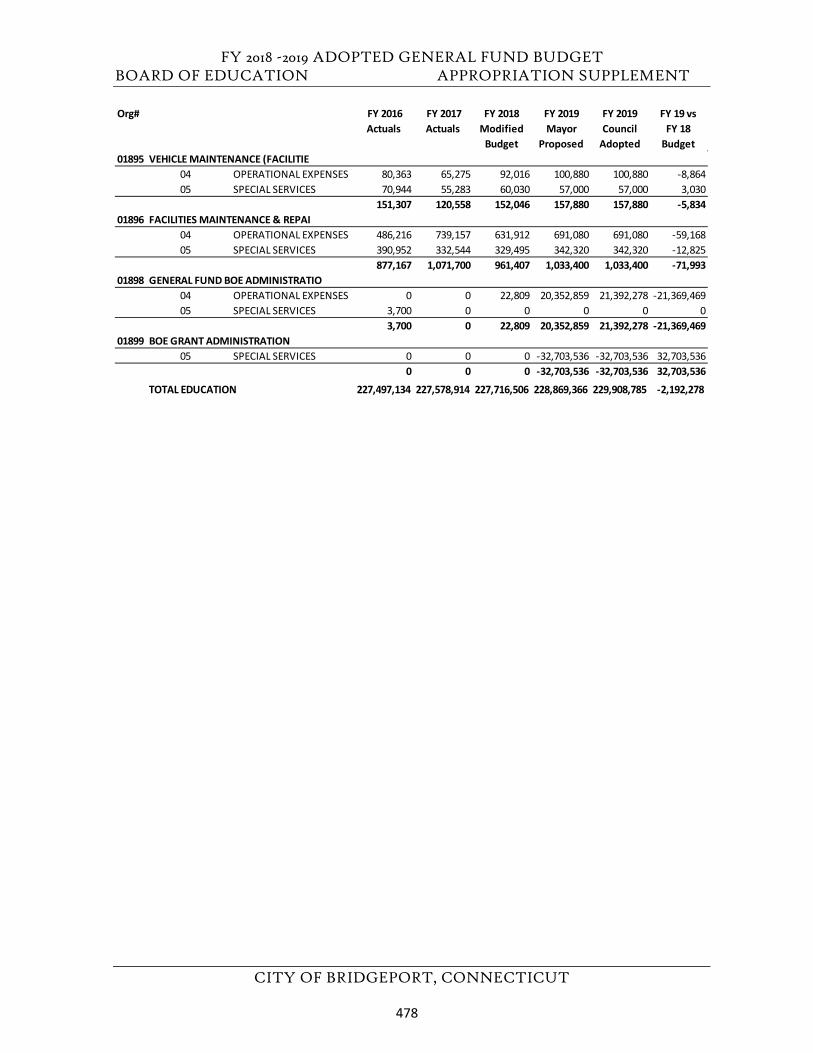
FY 2018 -2019 ADOPTED GENERAL FUND BUDGET BOARD OF EDUCATION APPROPRIATION SUPPLEMENT
CITY OF BRIDGEPORT, CONNECTICUT
Org# FY 2016 Actuals
FY 2017 Actuals
FY 2018 Modified
Budget
FY 2019 Mayor
Proposed
FY 2019 Council
Adopted
FY 19 vs FY 18
Budget01895 VEHICLE MAINTENANCE (FACILITIE
04 OPERATIONAL EXPENSES 80,363 65,275 92,016 100,880 100,880 -8,86405 SPECIAL SERVICES 70,944 55,283 60,030 57,000 57,000 3,030
151,307 120,558 152,046 157,880 157,880 -5,83401896 FACILITIES MAINTENANCE & REPAI
04 OPERATIONAL EXPENSES 486,216 739,157 631,912 691,080 691,080 -59,16805 SPECIAL SERVICES 390,952 332,544 329,495 342,320 342,320 -12,825
877,167 1,071,700 961,407 1,033,400 1,033,400 -71,99301898 GENERAL FUND BOE ADMINISTRATIO
04 OPERATIONAL EXPENSES 0 0 22,809 20,352,859 21,392,278 -21,369,46905 SPECIAL SERVICES 3,700 0 0 0 0 0
3,700 0 22,809 20,352,859 21,392,278 -21,369,46901899 BOE GRANT ADMINISTRATION
05 SPECIAL SERVICES 0 0 0 -32,703,536 -32,703,536 32,703,5360 0 0 -32,703,536 -32,703,536 32,703,536
TOTAL EDUCATION 227,497,134 227,578,914 227,716,506 228,869,366 229,908,785 -2,192,278
478
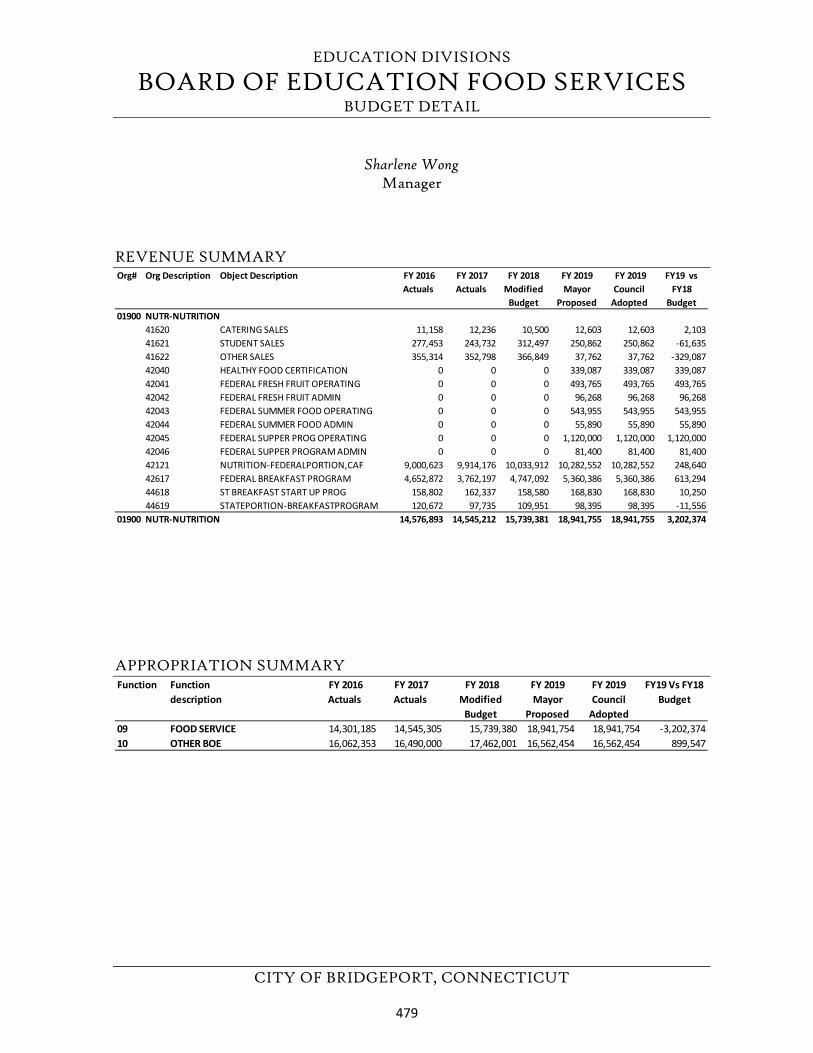
EDUCATION DIVISIONS
BOARD OF EDUCATION FOOD SERVICES BUDGET DETAIL
CITY OF BRIDGEPORT, CONNECTICUT
Sharlene Wong Manager
REVENUE SUMMARY
APPROPRIATION SUMMARY
Org# Org Description Object Description FY 2016 Actuals
FY 2017 Actuals
FY 2018 Modified
Budget
FY 2019 Mayor
Proposed
FY 2019 Council
Adopted
FY19 vs FY18
Budget01900 NUTR-NUTRITION
41620 CATERING SALES 11,158 12,236 10,500 12,603 12,603 2,10341621 STUDENT SALES 277,453 243,732 312,497 250,862 250,862 -61,63541622 OTHER SALES 355,314 352,798 366,849 37,762 37,762 -329,08742040 HEALTHY FOOD CERTIFICATION 0 0 0 339,087 339,087 339,08742041 FEDERAL FRESH FRUIT OPERATING 0 0 0 493,765 493,765 493,76542042 FEDERAL FRESH FRUIT ADMIN 0 0 0 96,268 96,268 96,26842043 FEDERAL SUMMER FOOD OPERATING 0 0 0 543,955 543,955 543,95542044 FEDERAL SUMMER FOOD ADMIN 0 0 0 55,890 55,890 55,89042045 FEDERAL SUPPER PROG OPERATING 0 0 0 1,120,000 1,120,000 1,120,00042046 FEDERAL SUPPER PROGRAM ADMIN 0 0 0 81,400 81,400 81,40042121 NUTRITION-FEDERALPORTION,CAF 9,000,623 9,914,176 10,033,912 10,282,552 10,282,552 248,64042617 FEDERAL BREAKFAST PROGRAM 4,652,872 3,762,197 4,747,092 5,360,386 5,360,386 613,29444618 ST BREAKFAST START UP PROG 158,802 162,337 158,580 168,830 168,830 10,25044619 STATEPORTION-BREAKFASTPROGRAM 120,672 97,735 109,951 98,395 98,395 -11,556
01900 NUTR-NUTRITION 14,576,893 14,545,212 15,739,381 18,941,755 18,941,755 3,202,374
Function Function description
FY 2016Actuals
FY 2017Actuals
FY 2018 Modified
Budget
FY 2019 Mayor
Proposed
FY 2019 Council
Adopted
FY19 Vs FY18 Budget
09 FOOD SERVICE 14,301,185 14,545,305 15,739,380 18,941,754 18,941,754 -3,202,37410 OTHER BOE 16,062,353 16,490,000 17,462,001 16,562,454 16,562,454 899,547
479
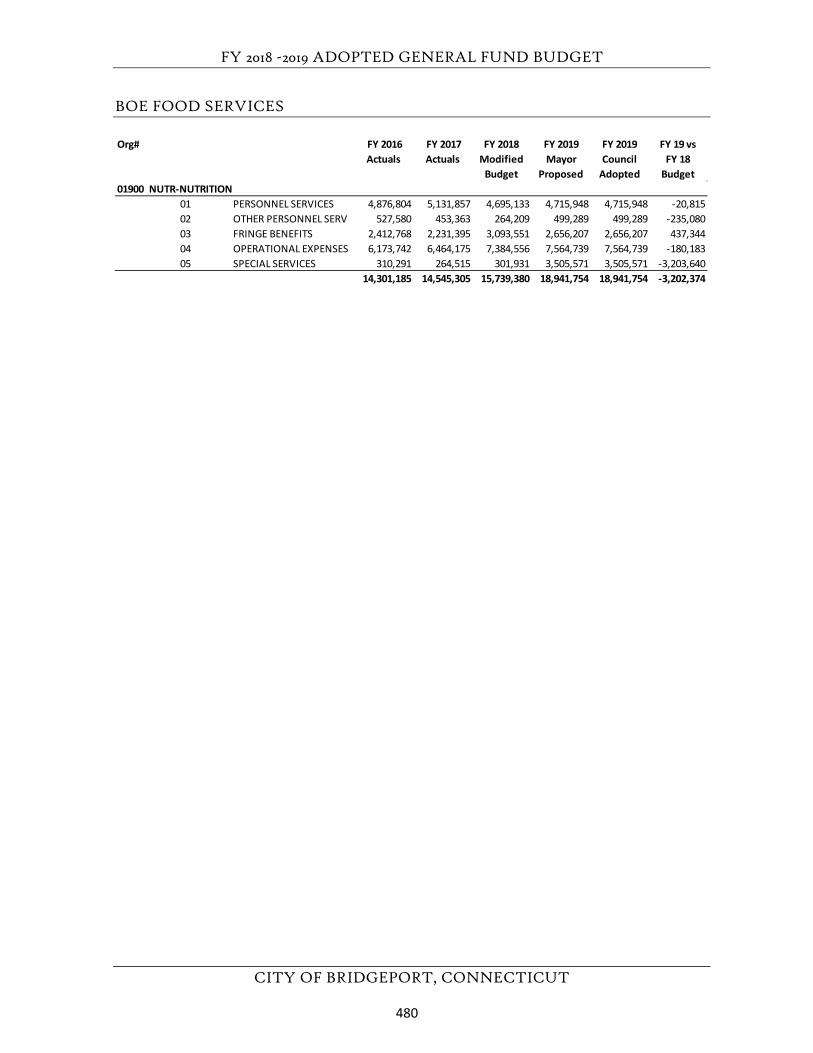
FY 2018 -2019 ADOPTED GENERAL FUND BUDGET
CITY OF BRIDGEPORT, CONNECTICUT
BOE FOOD SERVICES
Org# FY 2016 Actuals
FY 2017 Actuals
FY 2018 Modified
Budget
FY 2019 Mayor
Proposed
FY 2019 Council
Adopted
FY 19 vs FY 18
Budget01900 NUTR-NUTRITION
01 PERSONNEL SERVICES 4,876,804 5,131,857 4,695,133 4,715,948 4,715,948 -20,81502 OTHER PERSONNEL SERV 527,580 453,363 264,209 499,289 499,289 -235,08003 FRINGE BENEFITS 2,412,768 2,231,395 3,093,551 2,656,207 2,656,207 437,34404 OPERATIONAL EXPENSES 6,173,742 6,464,175 7,384,556 7,564,739 7,564,739 -180,18305 SPECIAL SERVICES 310,291 264,515 301,931 3,505,571 3,505,571 -3,203,640
14,301,185 14,545,305 15,739,380 18,941,754 18,941,754 -3,202,374
480
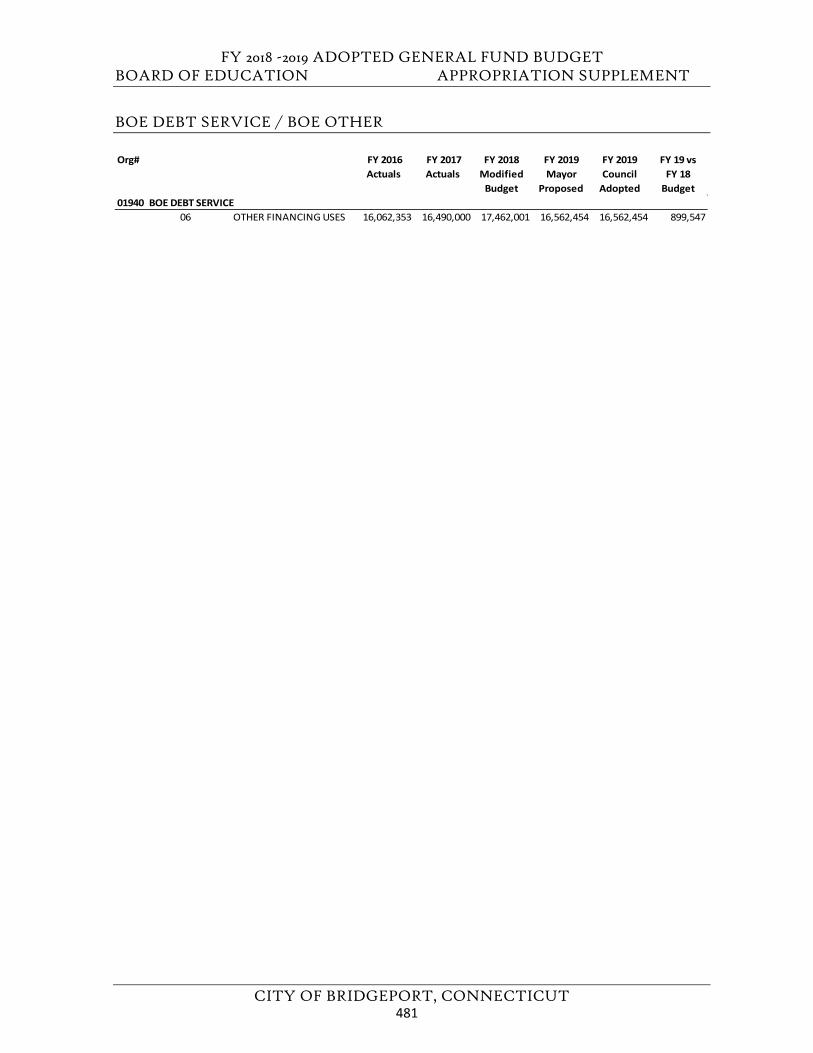
FY 2018 -2019 ADOPTED GENERAL FUND BUDGET BOARD OF EDUCATION APPROPRIATION SUPPLEMENT
CITY OF BRIDGEPORT, CONNECTICUT
BOE DEBT SERVICE / BOE OTHER
Org# FY 2016 Actuals
FY 2017 Actuals
FY 2018 Modified
Budget
FY 2019 Mayor
Proposed
FY 2019 Council
Adopted
FY 19 vs FY 18
Budget01940 BOE DEBT SERVICE
06 OTHER FINANCING USES 16,062,353 16,490,000 17,462,001 16,562,454 16,562,454 899,547
481
FY 2018 -2019 ADOPTED GENERAL FUND BUDGET
CITY OF BRIDGEPORT, CONNECTICUT
This page left blank intentionally.
482
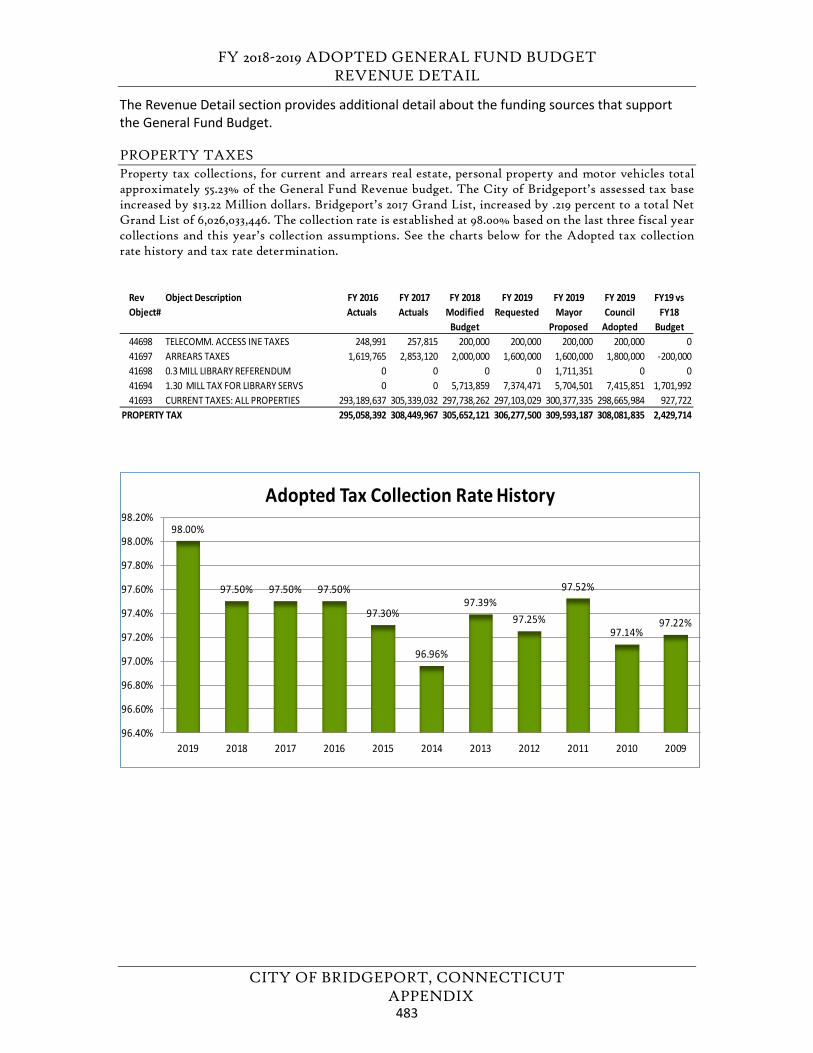
FY 2018-2019 ADOPTED GENERAL FUND BUDGET REVENUE DETAIL
CITY OF BRIDGEPORT, CONNECTICUT APPENDIX
The Revenue Detail section provides additional detail about the funding sources that support the General Fund Budget.
PROPERTY TAXES Property tax collections, for current and arrears real estate, personal property and motor vehicles total approximately 55.23% of the General Fund Revenue budget. The City of Bridgeport’s assessed tax base increased by $13.22 Million dollars. Bridgeport’s 2017 Grand List, increased by .219 percent to a total Net Grand List of 6,026,033,446. The collection rate is established at 98.00% based on the last three fiscal year collections and this year’s collection assumptions. See the charts below for the Adopted tax collection rate history and tax rate determination.
ReRev Object#
Object Description FY 2016 Actuals
FY 2017 Actuals
FY 2018 Modified
Budget
FY 2019 Requested
FY 2019 Mayor
Proposed
FY 2019 Council
Adopted
FY19 vs FY18
Budget44698 TELECOMM. ACCESS INE TAXES 248,991 257,815 200,000 200,000 200,000 200,000 041697 ARREARS TAXES 1,619,765 2,853,120 2,000,000 1,600,000 1,600,000 1,800,000 -200,00041698 0.3 MILL LIBRARY REFERENDUM 0 0 0 0 1,711,351 0 041694 1.30 MILL TAX FOR LIBRARY SERVS 0 0 5,713,859 7,374,471 5,704,501 7,415,851 1,701,99241693 CURRENT TAXES: ALL PROPERTIES 293,189,637 305,339,032 297,738,262 297,103,029 300,377,335 298,665,984 927,722
PROPERTY TAX 295,058,392 308,449,967 305,652,121 306,277,500 309,593,187 308,081,835 2,429,714
98.00%
97.50% 97.50% 97.50%
97.30%
96.96%
97.39%97.25%
97.52%
97.14%97.22%
96.40%
96.60%
96.80%
97.00%
97.20%
97.40%
97.60%
97.80%
98.00%
98.20%
2019 2018 2017 2016 2015 2014 2013 2012 2011 2010 2009
Adopted Tax Collection Rate History
483
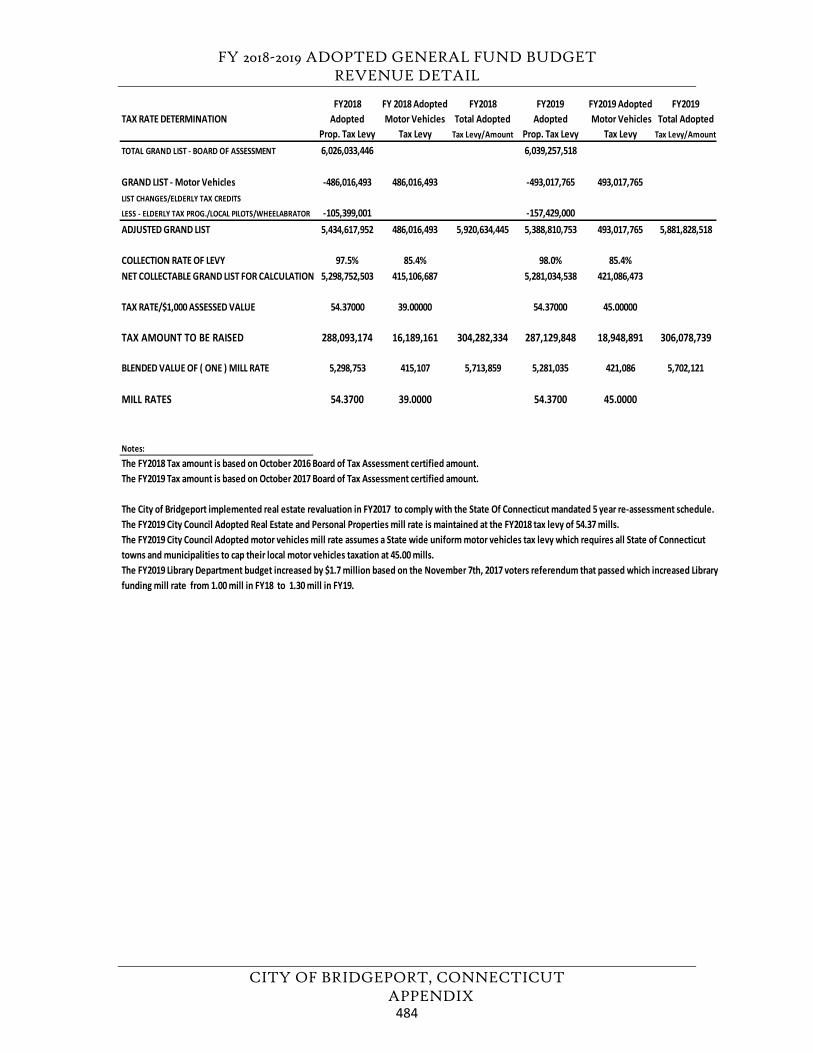
FY 2018-2019 ADOPTED GENERAL FUND BUDGET REVENUE DETAIL
CITY OF BRIDGEPORT, CONNECTICUT APPENDIX
FY2018 FY 2018 Adopted FY2018 FY2019 FY2019 Adopted FY2019TAX RATE DETERMINATION Adopted Motor Vehicles Total Adopted Adopted Motor Vehicles Total Adopted
Prop. Tax Levy Tax Levy Tax Levy/Amount Prop. Tax Levy Tax Levy Tax Levy/Amount
TOTAL GRAND LIST - BOARD OF ASSESSMENT 6,026,033,446 6,039,257,518
GRAND LIST - Motor Vehicles -486,016,493 486,016,493 -493,017,765 493,017,765LIST CHANGES/ELDERLY TAX CREDITS
LESS - ELDERLY TAX PROG./LOCAL PILOTS/WHEELABRATOR -105,399,001 -157,429,000ADJUSTED GRAND LIST 5,434,617,952 486,016,493 5,920,634,445 5,388,810,753 493,017,765 5,881,828,518
COLLECTION RATE OF LEVY 97.5% 85.4% 98.0% 85.4%NET COLLECTABLE GRAND LIST FOR CALCULATION 5,298,752,503 415,106,687 5,281,034,538 421,086,473
TAX RATE/$1,000 ASSESSED VALUE 54.37000 39.00000 54.37000 45.00000
TAX AMOUNT TO BE RAISED 288,093,174 16,189,161 304,282,334 287,129,848 18,948,891 306,078,739
BLENDED VALUE OF ( ONE ) MILL RATE 5,298,753 415,107 5,713,859 5,281,035 421,086 5,702,121
MILL RATES 54.3700 39.0000 54.3700 45.0000
Notes:The FY2018 Tax amount is based on October 2016 Board of Tax Assessment certified amount.The FY2019 Tax amount is based on October 2017 Board of Tax Assessment certified amount.
The City of Bridgeport implemented real estate revaluation in FY2017 to comply with the State Of Connecticut mandated 5 year re-assessment schedule.The FY2019 City Council Adopted Real Estate and Personal Properties mill rate is maintained at the FY2018 tax levy of 54.37 mills.The FY2019 City Council Adopted motor vehicles mill rate assumes a State wide uniform motor vehicles tax levy which requires all State of Connecticut towns and municipalities to cap their local motor vehicles taxation at 45.00 mills. The FY2019 Library Department budget increased by $1.7 million based on the November 7th, 2017 voters referendum that passed which increased Library funding mill rate from 1.00 mill in FY18 to 1.30 mill in FY19.
484
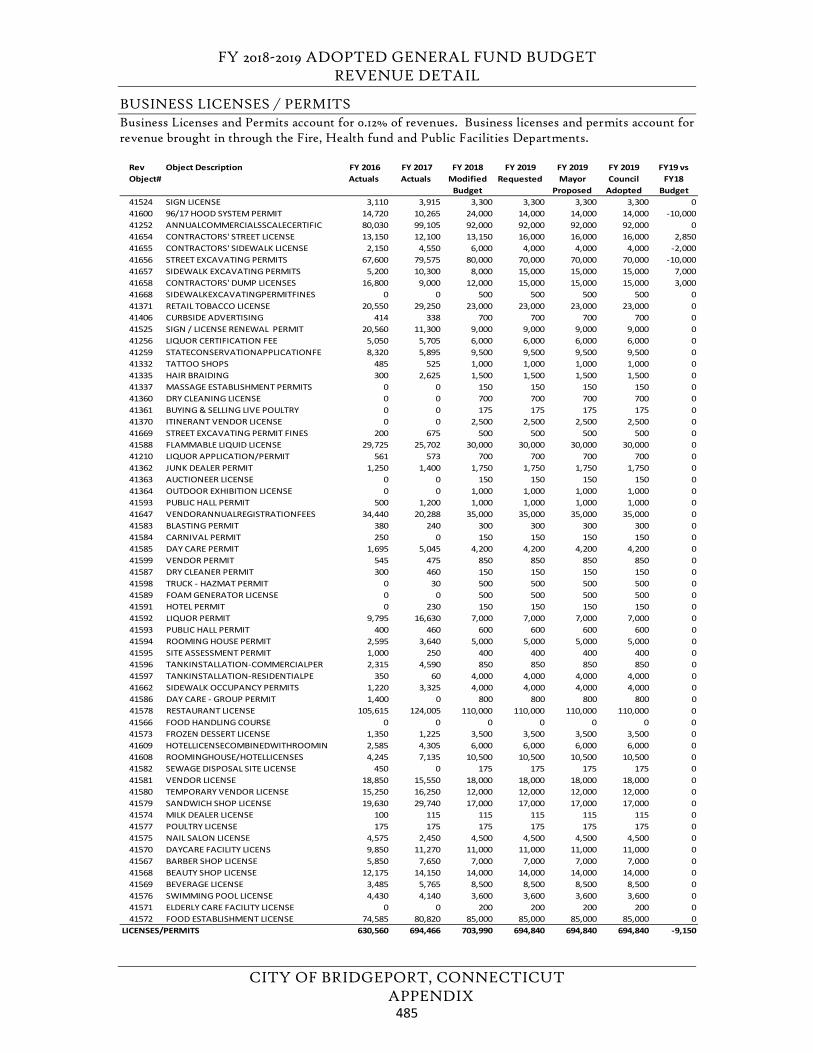
FY 2018-2019 ADOPTED GENERAL FUND BUDGET REVENUE DETAIL
CITY OF BRIDGEPORT, CONNECTICUT APPENDIX
BUSINESS LICENSES / PERMITS Business Licenses and Permits account for 0.12% of revenues. Business licenses and permits account for revenue brought in through the Fire, Health fund and Public Facilities Departments.
R Rev Object#
Object Description FY 2016 Actuals
FY 2017 Actuals
FY 2018 Modified
Budget
FY 2019 Requested
FY 2019 Mayor
Proposed
FY 2019 Council
Adopted
FY19 vs FY18
Budget41524 SIGN LICENSE 3,110 3,915 3,300 3,300 3,300 3,300 041600 96/17 HOOD SYSTEM PERMIT 14,720 10,265 24,000 14,000 14,000 14,000 -10,00041252 ANNUALCOMMERCIALSSCALECERTIFIC 80,030 99,105 92,000 92,000 92,000 92,000 041654 CONTRACTORS' STREET LICENSE 13,150 12,100 13,150 16,000 16,000 16,000 2,85041655 CONTRACTORS' SIDEWALK LICENSE 2,150 4,550 6,000 4,000 4,000 4,000 -2,00041656 STREET EXCAVATING PERMITS 67,600 79,575 80,000 70,000 70,000 70,000 -10,00041657 SIDEWALK EXCAVATING PERMITS 5,200 10,300 8,000 15,000 15,000 15,000 7,00041658 CONTRACTORS' DUMP LICENSES 16,800 9,000 12,000 15,000 15,000 15,000 3,00041668 SIDEWALKEXCAVATINGPERMITFINES 0 0 500 500 500 500 041371 RETAIL TOBACCO LICENSE 20,550 29,250 23,000 23,000 23,000 23,000 041406 CURBSIDE ADVERTISING 414 338 700 700 700 700 041525 SIGN / LICENSE RENEWAL PERMIT 20,560 11,300 9,000 9,000 9,000 9,000 041256 LIQUOR CERTIFICATION FEE 5,050 5,705 6,000 6,000 6,000 6,000 041259 STATECONSERVATIONAPPLICATIONFE 8,320 5,895 9,500 9,500 9,500 9,500 041332 TATTOO SHOPS 485 525 1,000 1,000 1,000 1,000 041335 HAIR BRAIDING 300 2,625 1,500 1,500 1,500 1,500 041337 MASSAGE ESTABLISHMENT PERMITS 0 0 150 150 150 150 041360 DRY CLEANING LICENSE 0 0 700 700 700 700 041361 BUYING & SELLING LIVE POULTRY 0 0 175 175 175 175 041370 ITINERANT VENDOR LICENSE 0 0 2,500 2,500 2,500 2,500 041669 STREET EXCAVATING PERMIT FINES 200 675 500 500 500 500 041588 FLAMMABLE LIQUID LICENSE 29,725 25,702 30,000 30,000 30,000 30,000 041210 LIQUOR APPLICATION/PERMIT 561 573 700 700 700 700 041362 JUNK DEALER PERMIT 1,250 1,400 1,750 1,750 1,750 1,750 041363 AUCTIONEER LICENSE 0 0 150 150 150 150 041364 OUTDOOR EXHIBITION LICENSE 0 0 1,000 1,000 1,000 1,000 041593 PUBLIC HALL PERMIT 500 1,200 1,000 1,000 1,000 1,000 041647 VENDORANNUALREGISTRATIONFEES 34,440 20,288 35,000 35,000 35,000 35,000 041583 BLASTING PERMIT 380 240 300 300 300 300 041584 CARNIVAL PERMIT 250 0 150 150 150 150 041585 DAY CARE PERMIT 1,695 5,045 4,200 4,200 4,200 4,200 041599 VENDOR PERMIT 545 475 850 850 850 850 041587 DRY CLEANER PERMIT 300 460 150 150 150 150 041598 TRUCK - HAZMAT PERMIT 0 30 500 500 500 500 041589 FOAM GENERATOR LICENSE 0 0 500 500 500 500 041591 HOTEL PERMIT 0 230 150 150 150 150 041592 LIQUOR PERMIT 9,795 16,630 7,000 7,000 7,000 7,000 041593 PUBLIC HALL PERMIT 400 460 600 600 600 600 041594 ROOMING HOUSE PERMIT 2,595 3,640 5,000 5,000 5,000 5,000 041595 SITE ASSESSMENT PERMIT 1,000 250 400 400 400 400 041596 TANKINSTALLATION-COMMERCIALPER 2,315 4,590 850 850 850 850 041597 TANKINSTALLATION-RESIDENTIALPE 350 60 4,000 4,000 4,000 4,000 041662 SIDEWALK OCCUPANCY PERMITS 1,220 3,325 4,000 4,000 4,000 4,000 041586 DAY CARE - GROUP PERMIT 1,400 0 800 800 800 800 041578 RESTAURANT LICENSE 105,615 124,005 110,000 110,000 110,000 110,000 041566 FOOD HANDLING COURSE 0 0 0 0 0 0 041573 FROZEN DESSERT LICENSE 1,350 1,225 3,500 3,500 3,500 3,500 041609 HOTELLICENSECOMBINEDWITHROOMIN 2,585 4,305 6,000 6,000 6,000 6,000 041608 ROOMINGHOUSE/HOTELLICENSES 4,245 7,135 10,500 10,500 10,500 10,500 041582 SEWAGE DISPOSAL SITE LICENSE 450 0 175 175 175 175 041581 VENDOR LICENSE 18,850 15,550 18,000 18,000 18,000 18,000 041580 TEMPORARY VENDOR LICENSE 15,250 16,250 12,000 12,000 12,000 12,000 041579 SANDWICH SHOP LICENSE 19,630 29,740 17,000 17,000 17,000 17,000 041574 MILK DEALER LICENSE 100 115 115 115 115 115 041577 POULTRY LICENSE 175 175 175 175 175 175 041575 NAIL SALON LICENSE 4,575 2,450 4,500 4,500 4,500 4,500 041570 DAYCARE FACILITY LICENS 9,850 11,270 11,000 11,000 11,000 11,000 041567 BARBER SHOP LICENSE 5,850 7,650 7,000 7,000 7,000 7,000 041568 BEAUTY SHOP LICENSE 12,175 14,150 14,000 14,000 14,000 14,000 041569 BEVERAGE LICENSE 3,485 5,765 8,500 8,500 8,500 8,500 041576 SWIMMING POOL LICENSE 4,430 4,140 3,600 3,600 3,600 3,600 041571 ELDERLY CARE FACILITY LICENSE 0 0 200 200 200 200 041572 FOOD ESTABLISHMENT LICENSE 74,585 80,820 85,000 85,000 85,000 85,000 0
LICENSES/PERMITS 630,560 694,466 703,990 694,840 694,840 694,840 -9,150
485
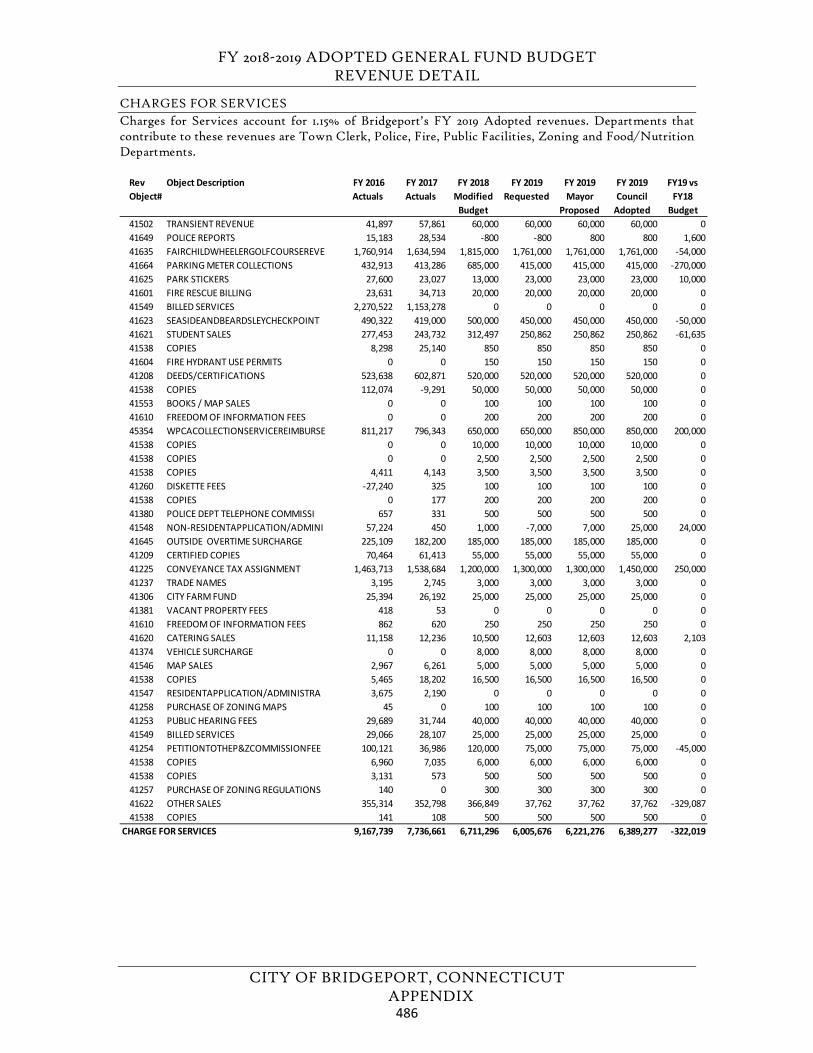
FY 2018-2019 ADOPTED GENERAL FUND BUDGET REVENUE DETAIL
CITY OF BRIDGEPORT, CONNECTICUT APPENDIX
CHARGES FOR SERVICES Charges for Services account for 1.15% of Bridgeport’s FY 2019 Adopted revenues. Departments that contribute to these revenues are Town Clerk, Police, Fire, Public Facilities, Zoning and Food/Nutrition Departments.
R Rev Object#
Object Description FY 2016 Actuals
FY 2017 Actuals
FY 2018 Modified
Budget
FY 2019 Requested
FY 2019 Mayor
Proposed
FY 2019 Council
Adopted
FY19 vs FY18
Budget41502 TRANSIENT REVENUE 41,897 57,861 60,000 60,000 60,000 60,000 041649 POLICE REPORTS 15,183 28,534 -800 -800 800 800 1,60041635 FAIRCHILDWHEELERGOLFCOURSEREVE 1,760,914 1,634,594 1,815,000 1,761,000 1,761,000 1,761,000 -54,00041664 PARKING METER COLLECTIONS 432,913 413,286 685,000 415,000 415,000 415,000 -270,00041625 PARK STICKERS 27,600 23,027 13,000 23,000 23,000 23,000 10,00041601 FIRE RESCUE BILLING 23,631 34,713 20,000 20,000 20,000 20,000 041549 BILLED SERVICES 2,270,522 1,153,278 0 0 0 0 041623 SEASIDEANDBEARDSLEYCHECKPOINT 490,322 419,000 500,000 450,000 450,000 450,000 -50,00041621 STUDENT SALES 277,453 243,732 312,497 250,862 250,862 250,862 -61,63541538 COPIES 8,298 25,140 850 850 850 850 041604 FIRE HYDRANT USE PERMITS 0 0 150 150 150 150 041208 DEEDS/CERTIFICATIONS 523,638 602,871 520,000 520,000 520,000 520,000 041538 COPIES 112,074 -9,291 50,000 50,000 50,000 50,000 041553 BOOKS / MAP SALES 0 0 100 100 100 100 041610 FREEDOM OF INFORMATION FEES 0 0 200 200 200 200 045354 WPCACOLLECTIONSERVICEREIMBURSE 811,217 796,343 650,000 650,000 850,000 850,000 200,00041538 COPIES 0 0 10,000 10,000 10,000 10,000 041538 COPIES 0 0 2,500 2,500 2,500 2,500 041538 COPIES 4,411 4,143 3,500 3,500 3,500 3,500 041260 DISKETTE FEES -27,240 325 100 100 100 100 041538 COPIES 0 177 200 200 200 200 041380 POLICE DEPT TELEPHONE COMMISSI 657 331 500 500 500 500 041548 NON-RESIDENTAPPLICATION/ADMINI 57,224 450 1,000 -7,000 7,000 25,000 24,00041645 OUTSIDE OVERTIME SURCHARGE 225,109 182,200 185,000 185,000 185,000 185,000 041209 CERTIFIED COPIES 70,464 61,413 55,000 55,000 55,000 55,000 041225 CONVEYANCE TAX ASSIGNMENT 1,463,713 1,538,684 1,200,000 1,300,000 1,300,000 1,450,000 250,00041237 TRADE NAMES 3,195 2,745 3,000 3,000 3,000 3,000 041306 CITY FARM FUND 25,394 26,192 25,000 25,000 25,000 25,000 041381 VACANT PROPERTY FEES 418 53 0 0 0 0 041610 FREEDOM OF INFORMATION FEES 862 620 250 250 250 250 041620 CATERING SALES 11,158 12,236 10,500 12,603 12,603 12,603 2,10341374 VEHICLE SURCHARGE 0 0 8,000 8,000 8,000 8,000 041546 MAP SALES 2,967 6,261 5,000 5,000 5,000 5,000 041538 COPIES 5,465 18,202 16,500 16,500 16,500 16,500 041547 RESIDENTAPPLICATION/ADMINISTRA 3,675 2,190 0 0 0 0 041258 PURCHASE OF ZONING MAPS 45 0 100 100 100 100 041253 PUBLIC HEARING FEES 29,689 31,744 40,000 40,000 40,000 40,000 041549 BILLED SERVICES 29,066 28,107 25,000 25,000 25,000 25,000 041254 PETITIONTOTHEP&ZCOMMISSIONFEE 100,121 36,986 120,000 75,000 75,000 75,000 -45,00041538 COPIES 6,960 7,035 6,000 6,000 6,000 6,000 041538 COPIES 3,131 573 500 500 500 500 041257 PURCHASE OF ZONING REGULATIONS 140 0 300 300 300 300 041622 OTHER SALES 355,314 352,798 366,849 37,762 37,762 37,762 -329,08741538 COPIES 141 108 500 500 500 500 0
CHARGE FOR SERVICES 9,167,739 7,736,661 6,711,296 6,005,676 6,221,276 6,389,277 -322,019
486
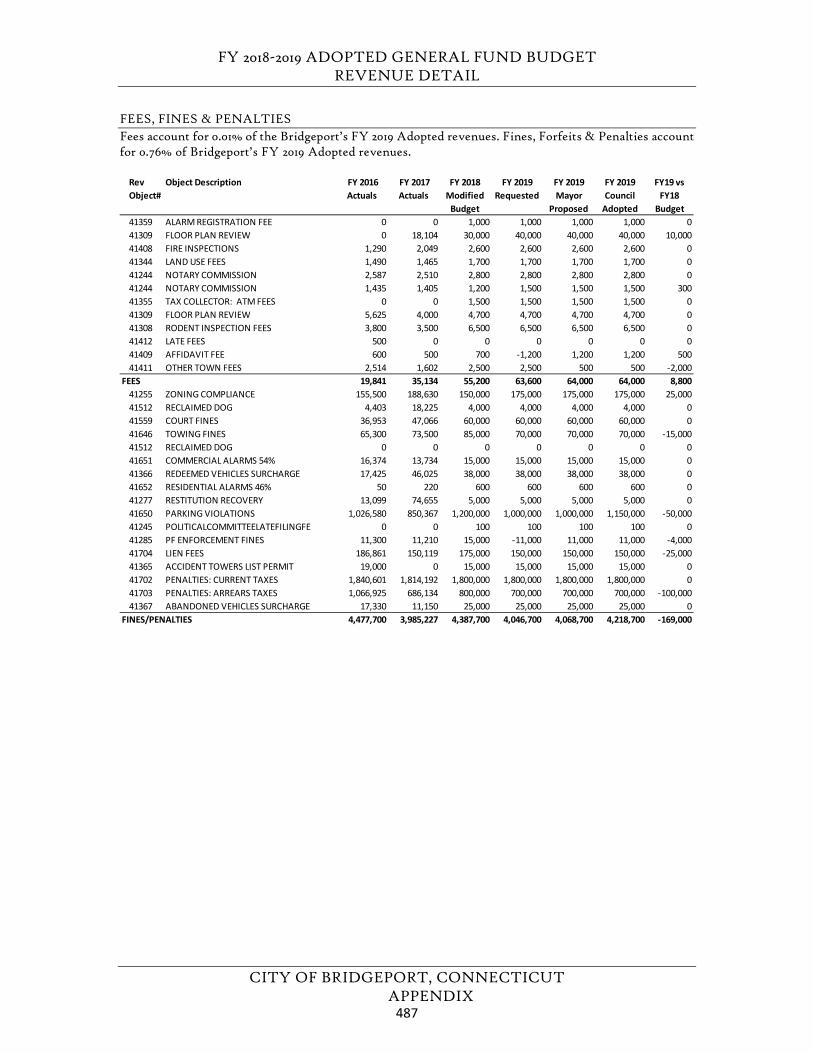
FY 2018-2019 ADOPTED GENERAL FUND BUDGET REVENUE DETAIL
CITY OF BRIDGEPORT, CONNECTICUT APPENDIX
FEES, FINES & PENALTIES Fees account for 0.01% of the Bridgeport’s FY 2019 Adopted revenues. Fines, Forfeits & Penalties account for 0.76% of Bridgeport’s FY 2019 Adopted revenues.
R Rev Object#
Object Description FY 2016 Actuals
FY 2017 Actuals
FY 2018 Modified
Budget
FY 2019 Requested
FY 2019 Mayor
Proposed
FY 2019 Council
Adopted
FY19 vs FY18
Budget41359 ALARM REGISTRATION FEE 0 0 1,000 1,000 1,000 1,000 041309 FLOOR PLAN REVIEW 0 18,104 30,000 40,000 40,000 40,000 10,00041408 FIRE INSPECTIONS 1,290 2,049 2,600 2,600 2,600 2,600 041344 LAND USE FEES 1,490 1,465 1,700 1,700 1,700 1,700 041244 NOTARY COMMISSION 2,587 2,510 2,800 2,800 2,800 2,800 041244 NOTARY COMMISSION 1,435 1,405 1,200 1,500 1,500 1,500 30041355 TAX COLLECTOR: ATM FEES 0 0 1,500 1,500 1,500 1,500 041309 FLOOR PLAN REVIEW 5,625 4,000 4,700 4,700 4,700 4,700 041308 RODENT INSPECTION FEES 3,800 3,500 6,500 6,500 6,500 6,500 041412 LATE FEES 500 0 0 0 0 0 041409 AFFIDAVIT FEE 600 500 700 -1,200 1,200 1,200 50041411 OTHER TOWN FEES 2,514 1,602 2,500 2,500 500 500 -2,000
FEES 19,841 35,134 55,200 63,600 64,000 64,000 8,80041255 ZONING COMPLIANCE 155,500 188,630 150,000 175,000 175,000 175,000 25,00041512 RECLAIMED DOG 4,403 18,225 4,000 4,000 4,000 4,000 041559 COURT FINES 36,953 47,066 60,000 60,000 60,000 60,000 041646 TOWING FINES 65,300 73,500 85,000 70,000 70,000 70,000 -15,00041512 RECLAIMED DOG 0 0 0 0 0 0 041651 COMMERCIAL ALARMS 54% 16,374 13,734 15,000 15,000 15,000 15,000 041366 REDEEMED VEHICLES SURCHARGE 17,425 46,025 38,000 38,000 38,000 38,000 041652 RESIDENTIAL ALARMS 46% 50 220 600 600 600 600 041277 RESTITUTION RECOVERY 13,099 74,655 5,000 5,000 5,000 5,000 041650 PARKING VIOLATIONS 1,026,580 850,367 1,200,000 1,000,000 1,000,000 1,150,000 -50,00041245 POLITICALCOMMITTEELATEFILINGFE 0 0 100 100 100 100 041285 PF ENFORCEMENT FINES 11,300 11,210 15,000 -11,000 11,000 11,000 -4,00041704 LIEN FEES 186,861 150,119 175,000 150,000 150,000 150,000 -25,00041365 ACCIDENT TOWERS LIST PERMIT 19,000 0 15,000 15,000 15,000 15,000 041702 PENALTIES: CURRENT TAXES 1,840,601 1,814,192 1,800,000 1,800,000 1,800,000 1,800,000 041703 PENALTIES: ARREARS TAXES 1,066,925 686,134 800,000 700,000 700,000 700,000 -100,00041367 ABANDONED VEHICLES SURCHARGE 17,330 11,150 25,000 25,000 25,000 25,000 0
FINES/PENALTIES 4,477,700 3,985,227 4,387,700 4,046,700 4,068,700 4,218,700 -169,000
487
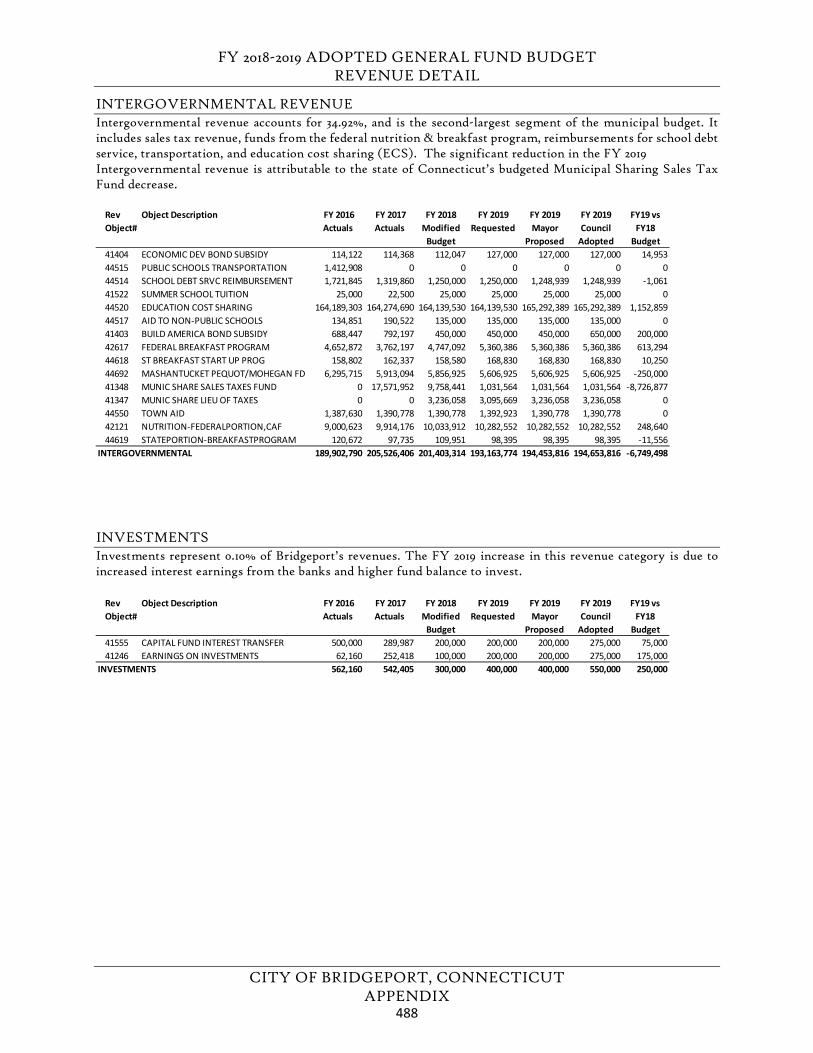
FY 2018-2019 ADOPTED GENERAL FUND BUDGET REVENUE DETAIL
CITY OF BRIDGEPORT, CONNECTICUT APPENDIX
INTERGOVERNMENTAL REVENUE Intergovernmental revenue accounts for 34.92%, and is the second-largest segment of the municipal budget. It includes sales tax revenue, funds from the federal nutrition & breakfast program, reimbursements for school debt service, transportation, and education cost sharing (ECS). The significant reduction in the FY 2019 Intergovernmental revenue is attributable to the state of Connecticut’s budgeted Municipal Sharing Sales Tax Fund decrease.
INVESTMENTS Investments represent 0.10% of Bridgeport’s revenues. The FY 2019 increase in this revenue category is due to increased interest earnings from the banks and higher fund balance to invest.
ReRev Object#
Object Description FY 2016 Actuals
FY 2017 Actuals
FY 2018 Modified
Budget
FY 2019 Requested
FY 2019 Mayor
Proposed
FY 2019 Council
Adopted
FY19 vs FY18
Budget41404 ECONOMIC DEV BOND SUBSIDY 114,122 114,368 112,047 127,000 127,000 127,000 14,95344515 PUBLIC SCHOOLS TRANSPORTATION 1,412,908 0 0 0 0 0 044514 SCHOOL DEBT SRVC REIMBURSEMENT 1,721,845 1,319,860 1,250,000 1,250,000 1,248,939 1,248,939 -1,06141522 SUMMER SCHOOL TUITION 25,000 22,500 25,000 25,000 25,000 25,000 044520 EDUCATION COST SHARING 164,189,303 164,274,690 164,139,530 164,139,530 165,292,389 165,292,389 1,152,85944517 AID TO NON-PUBLIC SCHOOLS 134,851 190,522 135,000 135,000 135,000 135,000 041403 BUILD AMERICA BOND SUBSIDY 688,447 792,197 450,000 450,000 450,000 650,000 200,00042617 FEDERAL BREAKFAST PROGRAM 4,652,872 3,762,197 4,747,092 5,360,386 5,360,386 5,360,386 613,29444618 ST BREAKFAST START UP PROG 158,802 162,337 158,580 168,830 168,830 168,830 10,25044692 MASHANTUCKET PEQUOT/MOHEGAN FD 6,295,715 5,913,094 5,856,925 5,606,925 5,606,925 5,606,925 -250,00041348 MUNIC SHARE SALES TAXES FUND 0 17,571,952 9,758,441 1,031,564 1,031,564 1,031,564 -8,726,87741347 MUNIC SHARE LIEU OF TAXES 0 0 3,236,058 3,095,669 3,236,058 3,236,058 044550 TOWN AID 1,387,630 1,390,778 1,390,778 1,392,923 1,390,778 1,390,778 042121 NUTRITION-FEDERALPORTION,CAF 9,000,623 9,914,176 10,033,912 10,282,552 10,282,552 10,282,552 248,64044619 STATEPORTION-BREAKFASTPROGRAM 120,672 97,735 109,951 98,395 98,395 98,395 -11,556
INTERGOVERNMENTAL 189,902,790 205,526,406 201,403,314 193,163,774 194,453,816 194,653,816 -6,749,498
ReRev Object#
Object Description FY 2016 Actuals
FY 2017 Actuals
FY 2018 Modified
Budget
FY 2019 Requested
FY 2019 Mayor
Proposed
FY 2019 Council
Adopted
FY19 vs FY18
Budget41555 CAPITAL FUND INTEREST TRANSFER 500,000 289,987 200,000 200,000 200,000 275,000 75,00041246 EARNINGS ON INVESTMENTS 62,160 252,418 100,000 200,000 200,000 275,000 175,000
INVESTMENTS 562,160 542,405 300,000 400,000 400,000 550,000 250,000
488
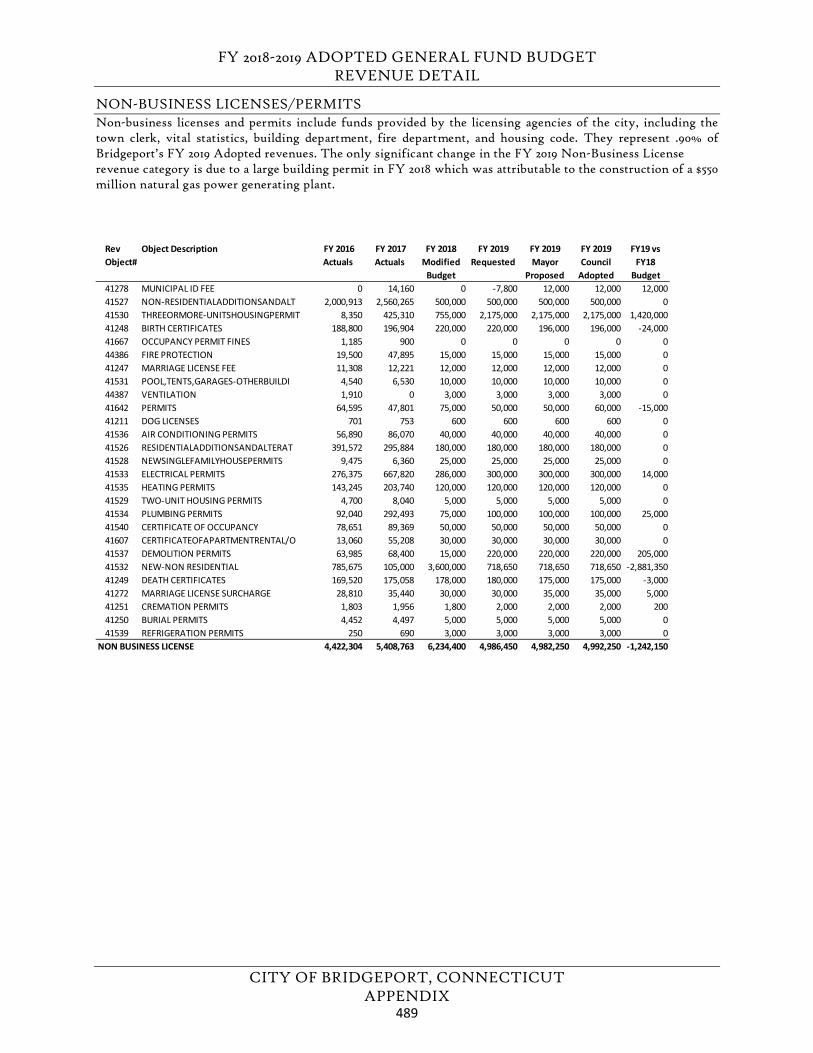
FY 2018-2019 ADOPTED GENERAL FUND BUDGET REVENUE DETAIL
CITY OF BRIDGEPORT, CONNECTICUT APPENDIX
NON-BUSINESS LICENSES/PERMITS Non-business licenses and permits include funds provided by the licensing agencies of the city, including the town clerk, vital statistics, building department, fire department, and housing code. They represent .90% of Bridgeport’s FY 2019 Adopted revenues. The only significant change in the FY 2019 Non-Business License revenue category is due to a large building permit in FY 2018 which was attributable to the construction of a $550 million natural gas power generating plant.
ReRev Object#
Object Description FY 2016 Actuals
FY 2017 Actuals
FY 2018 Modified
Budget
FY 2019 Requested
FY 2019 Mayor
Proposed
FY 2019 Council
Adopted
FY19 vs FY18
Budget41278 MUNICIPAL ID FEE 0 14,160 0 -7,800 12,000 12,000 12,00041527 NON-RESIDENTIALADDITIONSANDALT 2,000,913 2,560,265 500,000 500,000 500,000 500,000 041530 THREEORMORE-UNITSHOUSINGPERMIT 8,350 425,310 755,000 2,175,000 2,175,000 2,175,000 1,420,00041248 BIRTH CERTIFICATES 188,800 196,904 220,000 220,000 196,000 196,000 -24,00041667 OCCUPANCY PERMIT FINES 1,185 900 0 0 0 0 044386 FIRE PROTECTION 19,500 47,895 15,000 15,000 15,000 15,000 041247 MARRIAGE LICENSE FEE 11,308 12,221 12,000 12,000 12,000 12,000 041531 POOL,TENTS,GARAGES-OTHERBUILDI 4,540 6,530 10,000 10,000 10,000 10,000 044387 VENTILATION 1,910 0 3,000 3,000 3,000 3,000 041642 PERMITS 64,595 47,801 75,000 50,000 50,000 60,000 -15,00041211 DOG LICENSES 701 753 600 600 600 600 041536 AIR CONDITIONING PERMITS 56,890 86,070 40,000 40,000 40,000 40,000 041526 RESIDENTIALADDITIONSANDALTERAT 391,572 295,884 180,000 180,000 180,000 180,000 041528 NEWSINGLEFAMILYHOUSEPERMITS 9,475 6,360 25,000 25,000 25,000 25,000 041533 ELECTRICAL PERMITS 276,375 667,820 286,000 300,000 300,000 300,000 14,00041535 HEATING PERMITS 143,245 203,740 120,000 120,000 120,000 120,000 041529 TWO-UNIT HOUSING PERMITS 4,700 8,040 5,000 5,000 5,000 5,000 041534 PLUMBING PERMITS 92,040 292,493 75,000 100,000 100,000 100,000 25,00041540 CERTIFICATE OF OCCUPANCY 78,651 89,369 50,000 50,000 50,000 50,000 041607 CERTIFICATEOFAPARTMENTRENTAL/O 13,060 55,208 30,000 30,000 30,000 30,000 041537 DEMOLITION PERMITS 63,985 68,400 15,000 220,000 220,000 220,000 205,00041532 NEW-NON RESIDENTIAL 785,675 105,000 3,600,000 718,650 718,650 718,650 -2,881,35041249 DEATH CERTIFICATES 169,520 175,058 178,000 180,000 175,000 175,000 -3,00041272 MARRIAGE LICENSE SURCHARGE 28,810 35,440 30,000 30,000 35,000 35,000 5,00041251 CREMATION PERMITS 1,803 1,956 1,800 2,000 2,000 2,000 20041250 BURIAL PERMITS 4,452 4,497 5,000 5,000 5,000 5,000 041539 REFRIGERATION PERMITS 250 690 3,000 3,000 3,000 3,000 0
NON BUSINESS LICENSE 4,422,304 5,408,763 6,234,400 4,986,450 4,982,250 4,992,250 -1,242,150
489
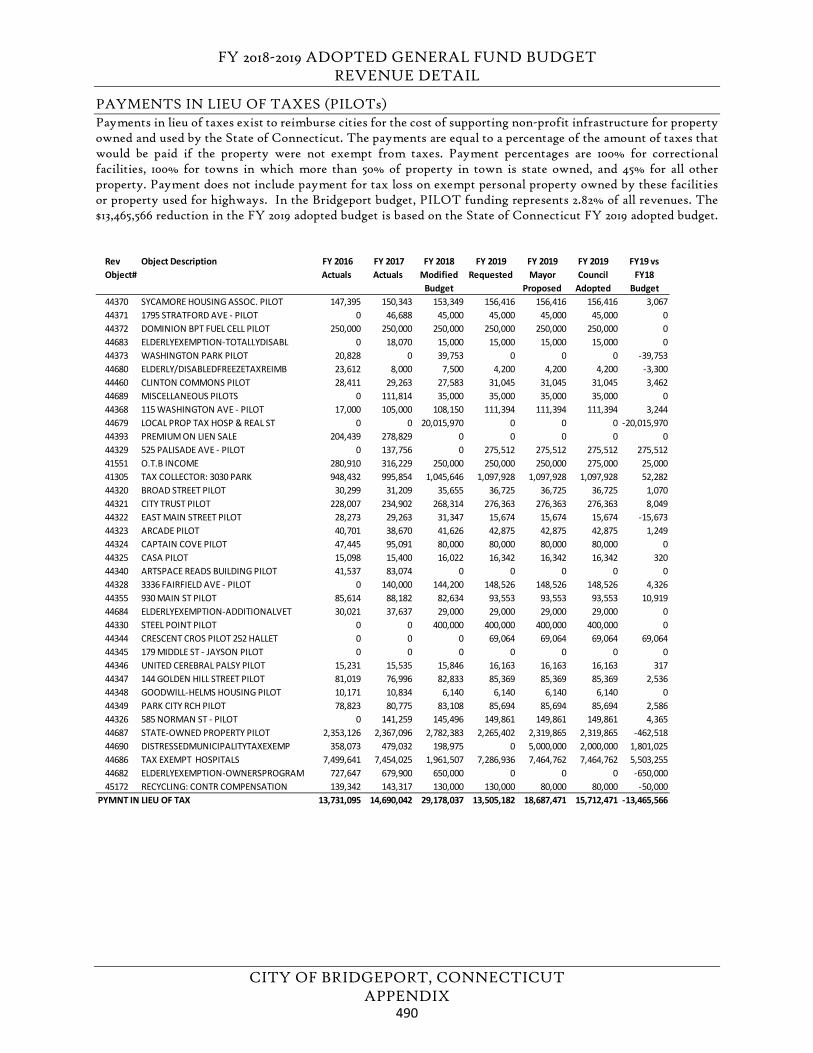
FY 2018-2019 ADOPTED GENERAL FUND BUDGET REVENUE DETAIL
CITY OF BRIDGEPORT, CONNECTICUT APPENDIX
PAYMENTS IN LIEU OF TAXES (PILOTs) Payments in lieu of taxes exist to reimburse cities for the cost of supporting non-profit infrastructure for property owned and used by the State of Connecticut. The payments are equal to a percentage of the amount of taxes that would be paid if the property were not exempt from taxes. Payment percentages are 100% for correctional facilities, 100% for towns in which more than 50% of property in town is state owned, and 45% for all other property. Payment does not include payment for tax loss on exempt personal property owned by these facilities or property used for highways. In the Bridgeport budget, PILOT funding represents 2.82% of all revenues. The $13,465,566 reduction in the FY 2019 adopted budget is based on the State of Connecticut FY 2019 adopted budget.
R Rev Object#
Object Description FY 2016 Actuals
FY 2017 Actuals
FY 2018 Modified
Budget
FY 2019 Requested
FY 2019 Mayor
Proposed
FY 2019 Council
Adopted
FY19 vs FY18
Budget44370 SYCAMORE HOUSING ASSOC. PILOT 147,395 150,343 153,349 156,416 156,416 156,416 3,06744371 1795 STRATFORD AVE - PILOT 0 46,688 45,000 45,000 45,000 45,000 044372 DOMINION BPT FUEL CELL PILOT 250,000 250,000 250,000 250,000 250,000 250,000 044683 ELDERLYEXEMPTION-TOTALLYDISABL 0 18,070 15,000 15,000 15,000 15,000 044373 WASHINGTON PARK PILOT 20,828 0 39,753 0 0 0 -39,75344680 ELDERLY/DISABLEDFREEZETAXREIMB 23,612 8,000 7,500 4,200 4,200 4,200 -3,30044460 CLINTON COMMONS PILOT 28,411 29,263 27,583 31,045 31,045 31,045 3,46244689 MISCELLANEOUS PILOTS 0 111,814 35,000 35,000 35,000 35,000 044368 115 WASHINGTON AVE - PILOT 17,000 105,000 108,150 111,394 111,394 111,394 3,24444679 LOCAL PROP TAX HOSP & REAL ST 0 0 20,015,970 0 0 0 -20,015,97044393 PREMIUM ON LIEN SALE 204,439 278,829 0 0 0 0 044329 525 PALISADE AVE - PILOT 0 137,756 0 275,512 275,512 275,512 275,51241551 O.T.B INCOME 280,910 316,229 250,000 250,000 250,000 275,000 25,00041305 TAX COLLECTOR: 3030 PARK 948,432 995,854 1,045,646 1,097,928 1,097,928 1,097,928 52,28244320 BROAD STREET PILOT 30,299 31,209 35,655 36,725 36,725 36,725 1,07044321 CITY TRUST PILOT 228,007 234,902 268,314 276,363 276,363 276,363 8,04944322 EAST MAIN STREET PILOT 28,273 29,263 31,347 15,674 15,674 15,674 -15,67344323 ARCADE PILOT 40,701 38,670 41,626 42,875 42,875 42,875 1,24944324 CAPTAIN COVE PILOT 47,445 95,091 80,000 80,000 80,000 80,000 044325 CASA PILOT 15,098 15,400 16,022 16,342 16,342 16,342 32044340 ARTSPACE READS BUILDING PILOT 41,537 83,074 0 0 0 0 044328 3336 FAIRFIELD AVE - PILOT 0 140,000 144,200 148,526 148,526 148,526 4,32644355 930 MAIN ST PILOT 85,614 88,182 82,634 93,553 93,553 93,553 10,91944684 ELDERLYEXEMPTION-ADDITIONALVET 30,021 37,637 29,000 29,000 29,000 29,000 044330 STEEL POINT PILOT 0 0 400,000 400,000 400,000 400,000 044344 CRESCENT CROS PILOT 252 HALLET 0 0 0 69,064 69,064 69,064 69,06444345 179 MIDDLE ST - JAYSON PILOT 0 0 0 0 0 0 044346 UNITED CEREBRAL PALSY PILOT 15,231 15,535 15,846 16,163 16,163 16,163 31744347 144 GOLDEN HILL STREET PILOT 81,019 76,996 82,833 85,369 85,369 85,369 2,53644348 GOODWILL-HELMS HOUSING PILOT 10,171 10,834 6,140 6,140 6,140 6,140 044349 PARK CITY RCH PILOT 78,823 80,775 83,108 85,694 85,694 85,694 2,58644326 585 NORMAN ST - PILOT 0 141,259 145,496 149,861 149,861 149,861 4,36544687 STATE-OWNED PROPERTY PILOT 2,353,126 2,367,096 2,782,383 2,265,402 2,319,865 2,319,865 -462,51844690 DISTRESSEDMUNICIPALITYTAXEXEMP 358,073 479,032 198,975 0 5,000,000 2,000,000 1,801,02544686 TAX EXEMPT HOSPITALS 7,499,641 7,454,025 1,961,507 7,286,936 7,464,762 7,464,762 5,503,25544682 ELDERLYEXEMPTION-OWNERSPROGRAM 727,647 679,900 650,000 0 0 0 -650,00045172 RECYCLING: CONTR COMPENSATION 139,342 143,317 130,000 130,000 80,000 80,000 -50,000
PYMNT IN LIEU OF TAX 13,731,095 14,690,042 29,178,037 13,505,182 18,687,471 15,712,471 -13,465,566
490
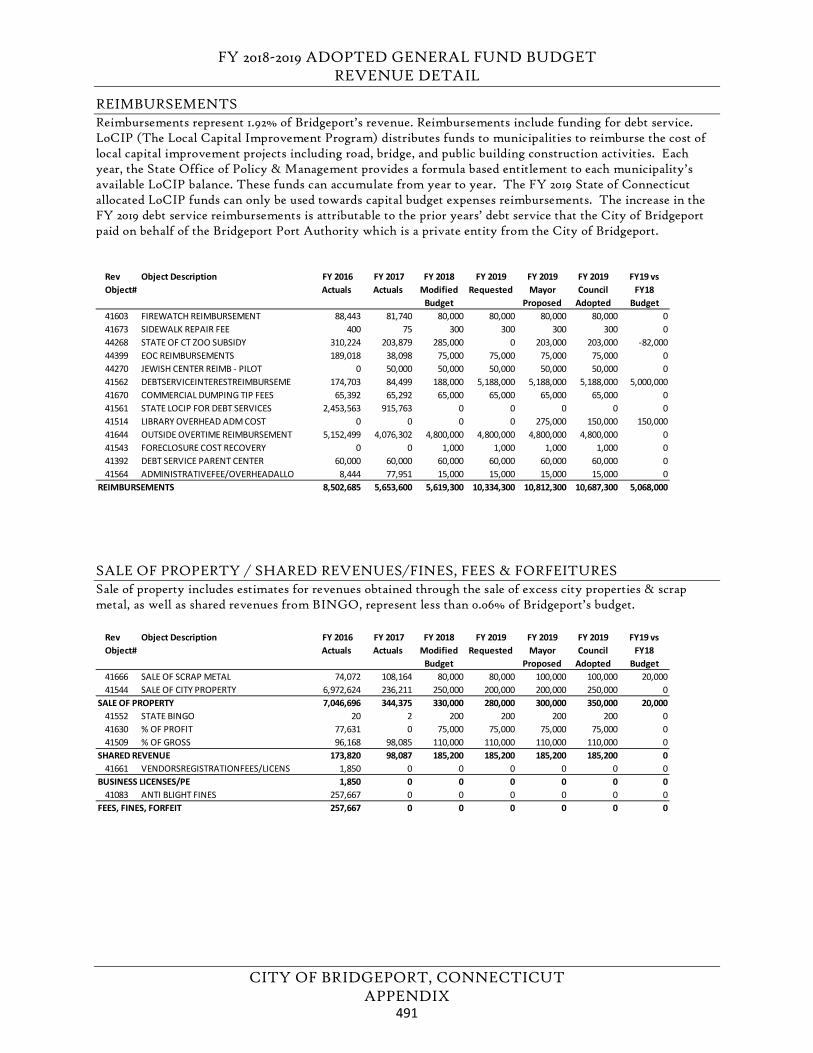
FY 2018-2019 ADOPTED GENERAL FUND BUDGET REVENUE DETAIL
CITY OF BRIDGEPORT, CONNECTICUT APPENDIX
REIMBURSEMENTS Reimbursements represent 1.92% of Bridgeport’s revenue. Reimbursements include funding for debt service. LoCIP (The Local Capital Improvement Program) distributes funds to municipalities to reimburse the cost of local capital improvement projects including road, bridge, and public building construction activities. Each year, the State Office of Policy & Management provides a formula based entitlement to each municipality’s available LoCIP balance. These funds can accumulate from year to year. The FY 2019 State of Connecticut allocated LoCIP funds can only be used towards capital budget expenses reimbursements. The increase in the FY 2019 debt service reimbursements is attributable to the prior years’ debt service that the City of Bridgeport paid on behalf of the Bridgeport Port Authority which is a private entity from the City of Bridgeport.
SALE OF PROPERTY / SHARED REVENUES/FINES, FEES & FORFEITURES Sale of property includes estimates for revenues obtained through the sale of excess city properties & scrap metal, as well as shared revenues from BINGO, represent less than 0.06% of Bridgeport’s budget.
ReRev Object#
Object Description FY 2016 Actuals
FY 2017 Actuals
FY 2018 Modified
Budget
FY 2019 Requested
FY 2019 Mayor
Proposed
FY 2019 Council
Adopted
FY19 vs FY18
Budget41603 FIREWATCH REIMBURSEMENT 88,443 81,740 80,000 80,000 80,000 80,000 041673 SIDEWALK REPAIR FEE 400 75 300 300 300 300 044268 STATE OF CT ZOO SUBSIDY 310,224 203,879 285,000 0 203,000 203,000 -82,00044399 EOC REIMBURSEMENTS 189,018 38,098 75,000 75,000 75,000 75,000 044270 JEWISH CENTER REIMB - PILOT 0 50,000 50,000 50,000 50,000 50,000 041562 DEBTSERVICEINTERESTREIMBURSEME 174,703 84,499 188,000 5,188,000 5,188,000 5,188,000 5,000,00041670 COMMERCIAL DUMPING TIP FEES 65,392 65,292 65,000 65,000 65,000 65,000 041561 STATE LOCIP FOR DEBT SERVICES 2,453,563 915,763 0 0 0 0 041514 LIBRARY OVERHEAD ADM COST 0 0 0 0 275,000 150,000 150,00041644 OUTSIDE OVERTIME REIMBURSEMENT 5,152,499 4,076,302 4,800,000 4,800,000 4,800,000 4,800,000 041543 FORECLOSURE COST RECOVERY 0 0 1,000 1,000 1,000 1,000 041392 DEBT SERVICE PARENT CENTER 60,000 60,000 60,000 60,000 60,000 60,000 041564 ADMINISTRATIVEFEE/OVERHEADALLO 8,444 77,951 15,000 15,000 15,000 15,000 0
REIMBURSEMENTS 8,502,685 5,653,600 5,619,300 10,334,300 10,812,300 10,687,300 5,068,000
R Rev Object#
Object Description FY 2016 Actuals
FY 2017 Actuals
FY 2018 Modified
Budget
FY 2019 Requested
FY 2019 Mayor
Proposed
FY 2019 Council
Adopted
FY19 vs FY18
Budget41666 SALE OF SCRAP METAL 74,072 108,164 80,000 80,000 100,000 100,000 20,00041544 SALE OF CITY PROPERTY 6,972,624 236,211 250,000 200,000 200,000 250,000 0
SALE OF PROPERTY 7,046,696 344,375 330,000 280,000 300,000 350,000 20,00041552 STATE BINGO 20 2 200 200 200 200 041630 % OF PROFIT 77,631 0 75,000 75,000 75,000 75,000 041509 % OF GROSS 96,168 98,085 110,000 110,000 110,000 110,000 0
SHARED REVENUE 173,820 98,087 185,200 185,200 185,200 185,200 041661 VENDORSREGISTRATIONFEES/LICENS 1,850 0 0 0 0 0 0
BUSINESS LICENSES/PE 1,850 0 0 0 0 0 041083 ANTI BLIGHT FINES 257,667 0 0 0 0 0 0
FEES, FINES, FORFEIT 257,667 0 0 0 0 0 0
491
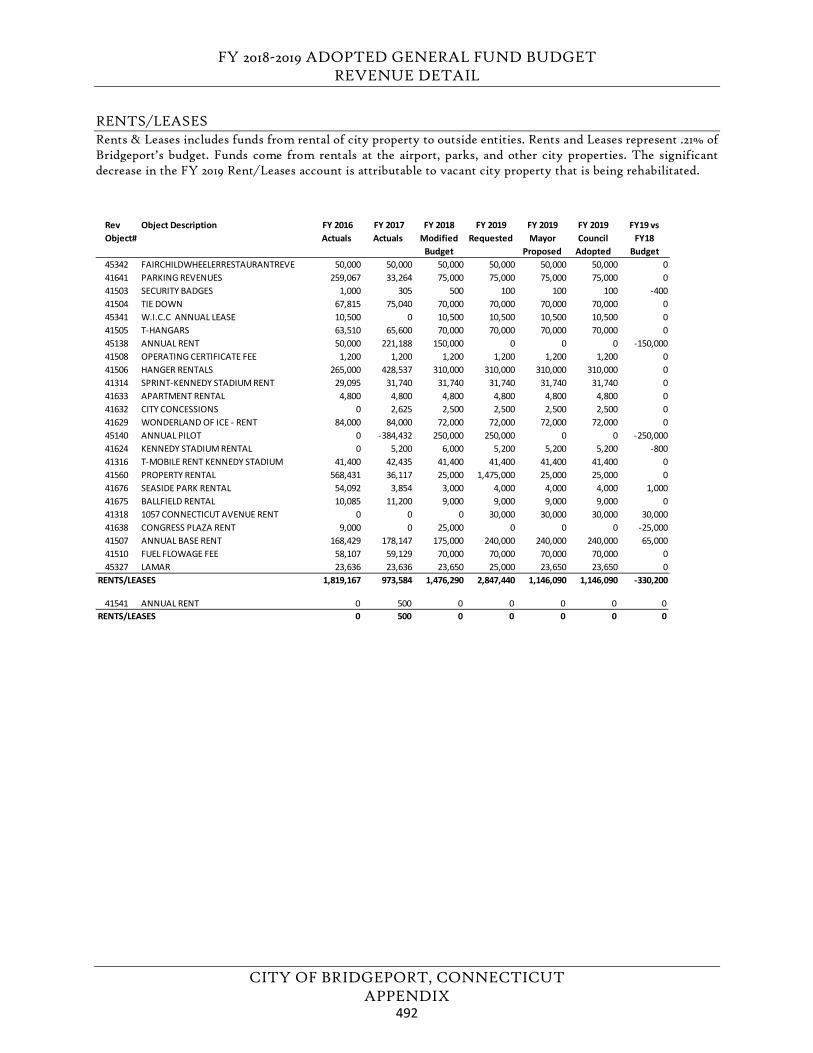
FY 2018-2019 ADOPTED GENERAL FUND BUDGET REVENUE DETAIL
CITY OF BRIDGEPORT, CONNECTICUT APPENDIX
RENTS/LEASES Rents & Leases includes funds from rental of city property to outside entities. Rents and Leases represent .21% of Bridgeport’s budget. Funds come from rentals at the airport, parks, and other city properties. The significant decrease in the FY 2019 Rent/Leases account is attributable to vacant city property that is being rehabilitated.
ReRev Object#
Object Description FY 2016 Actuals
FY 2017 Actuals
FY 2018 Modified
Budget
FY 2019 Requested
FY 2019 Mayor
Proposed
FY 2019 Council
Adopted
FY19 vs FY18
Budget45342 FAIRCHILDWHEELERRESTAURANTREVE 50,000 50,000 50,000 50,000 50,000 50,000 041641 PARKING REVENUES 259,067 33,264 75,000 75,000 75,000 75,000 041503 SECURITY BADGES 1,000 305 500 100 100 100 -40041504 TIE DOWN 67,815 75,040 70,000 70,000 70,000 70,000 045341 W.I.C.C ANNUAL LEASE 10,500 0 10,500 10,500 10,500 10,500 041505 T-HANGARS 63,510 65,600 70,000 70,000 70,000 70,000 045138 ANNUAL RENT 50,000 221,188 150,000 0 0 0 -150,00041508 OPERATING CERTIFICATE FEE 1,200 1,200 1,200 1,200 1,200 1,200 041506 HANGER RENTALS 265,000 428,537 310,000 310,000 310,000 310,000 041314 SPRINT-KENNEDY STADIUM RENT 29,095 31,740 31,740 31,740 31,740 31,740 041633 APARTMENT RENTAL 4,800 4,800 4,800 4,800 4,800 4,800 041632 CITY CONCESSIONS 0 2,625 2,500 2,500 2,500 2,500 041629 WONDERLAND OF ICE - RENT 84,000 84,000 72,000 72,000 72,000 72,000 045140 ANNUAL PILOT 0 -384,432 250,000 250,000 0 0 -250,00041624 KENNEDY STADIUM RENTAL 0 5,200 6,000 5,200 5,200 5,200 -80041316 T-MOBILE RENT KENNEDY STADIUM 41,400 42,435 41,400 41,400 41,400 41,400 041560 PROPERTY RENTAL 568,431 36,117 25,000 1,475,000 25,000 25,000 041676 SEASIDE PARK RENTAL 54,092 3,854 3,000 4,000 4,000 4,000 1,00041675 BALLFIELD RENTAL 10,085 11,200 9,000 9,000 9,000 9,000 041318 1057 CONNECTICUT AVENUE RENT 0 0 0 30,000 30,000 30,000 30,00041638 CONGRESS PLAZA RENT 9,000 0 25,000 0 0 0 -25,00041507 ANNUAL BASE RENT 168,429 178,147 175,000 240,000 240,000 240,000 65,00041510 FUEL FLOWAGE FEE 58,107 59,129 70,000 70,000 70,000 70,000 045327 LAMAR 23,636 23,636 23,650 25,000 23,650 23,650 0
RENTS/LEASES 1,819,167 973,584 1,476,290 2,847,440 1,146,090 1,146,090 -330,200
41541 ANNUAL RENT 0 500 0 0 0 0 0RENTS/LEASES 0 500 0 0 0 0 0
492
FY 2018-2019 ADOPTED GENERAL FUND BUDGET APPENDIX CAPITAL BUDGET POLICIES
CITY OF BRIDGEPORT, CONNECTICUT APPENDIX
CAPITAL IMPROVEMENT PROGRAM OVERVIEW & PROCEDURES
All Capital Equipment purchases are governed by Capital Procedures. Preparing and maintaining the Capital Budget is an imperative part of the City's management effort. Central to this management effort is providing accurate and thorough justifications for proposed capital projects, making the capital budgeting cycle transparent and straightforward. Specific criteria that guide Capital budgeting decisions are outlined below:
1) The City administration will develop a process for ensuring that capital investments provide the maximum community benefit and that appropriate supporting policies are implemented.
2) The City shall allocate a percentage of its general operating revenue for capital investment for the next five (5) fiscal years.
3) The City shall budget an increasing percentage of its CDBG allocations for the next five (5) years for capital.
4) All redevelopment and economic development projects shall include plans for specific returns (investment and leverage).
5) Priority will be given to those investments/projects that foster achievement of City Executive Committee goals and objectives, aid in the implementation of approved City plans, and conform to the following ideals: • Foster Economic Growth; • Foster Neighborhood Growth; • Foster Urban Conservation; • Conform to the City's five (5) year plan; • Replace or renovate existing obsolete or deteriorated elements of the City's property rather
than providing additional facilities; • Reduce the cost of operations or result in a net increase in general revenues; • Are mandated by governmental agencies; • Do not duplicate other public and/or private services; • Reduce energy consumption; • Benefit low and moderate-income persons and/or slow economic blight; • Are located in targeted neighborhoods and economic development areas, i.e. (enterprise
zone); and • Improve the safety and security of citizens.
DEFINING CAPITAL EQUIPMENT & CAPITAL PROJECTS Capital Equipment is defined as any item that has an expected life of five (5) years or more and a purchase price in excess of $500.00. Items costing less than $500.00 and lasting less than five (5) years are to be purchased from material and supply accounts. The purchase price includes any costs of acquisition or transportation of the item or other costs associated with the installation or placing it into service. The expected life for a piece of equipment is that period of time for which it will be useful in carrying out operations without major repair to its physical condition. Generally, capital equipment includes, but is not limited to, furniture and fixtures, machinery and motor vehicles. Capital equipment excludes commodities that are converted in the process of construction, or that are used to form a minor part of equipment or fixed property. In addition, repairs will normally not be capitalized regardless of the cost of repair or the extent of repair relative to the cost of a new item. The
493
FY 2018-2019 ADOPTED GENERAL FUND BUDGET APPENDIX CAPITAL BUDGET POLICIES
CITY OF BRIDGEPORT, CONNECTICUT APPENDIX
following examples occur frequently and are intended to serve as a guide in deciding whether or not to capitalize an item.
• Calculators - will not be capitalized. • All furniture costing more than $500.00 will be capitalized.
The Capital improvement program is defined as a plan for capital expenditures over a multi-year period to meet identified improvements in the infrastructure. The Capital Budget is the first year of a five-year plan for capital expenditures to be incurred over a given fiscal year from funds appropriated by the City Council for project scheduled in the same year. Capital Projects are the improvements that make up the capital budget. Each project has a specific purpose, justification and cost. Projects propose physical improvements in different elements of the City's infrastructure. Improvements include but are not limited to: construction, reconstruction, rehabilitation, modification, renovation, expansion, replacement, extension of streets, bridges, buildings, sidewalks, playgrounds, traffic signals, ramps, lights and acquisition of land, buildings with associated relocation, demolition and improvements such as landscaping, fencing and paving.
CAPITAL IMPROVEMENT PROGRAM REQUESTS
All Capital Projects under Consideration must be accompanied by a description including the following detail and descriptive information:
1) PROJECT TITLE: Enter the title best describing the project. Be concise, but as descriptive as possible.
2) SUBMITTED BY: Enter the Department, and division, if applicable. 3) CONTACT PERSON: Enter the name and telephone number of the person who can best answer
detailed questions about this project. 4) PROJECT DESCRIPTION: Give a full, detailed description of the project. The description must
contain enough information to allow for a detailed project cost estimate. If the project is construction of a building, specify the following: size; use; type of building; utility type; etc. If it is a street project, specify the following: length; width; whether it is new construction, reconstruction or resurfacing; whether it involves new signals, sewers, and/or sidewalks; etc. Any project with insufficient information to develop a cost estimate will not be considered.
5) PROJECT JUSTIFICATION: Support the need for this project. Some of the questions you might want to consider follow: • Does the project meet established standards and/or codes? • Does it eliminate a health, fire or safety hazard? • Does it serve a segment of the community not currently served? • Does it foster private investment? How much? • Does it create jobs? How many? What type? • What will happen if the City does not undertake this project? • Use the above and the Capital Allocation Checklist as a guide in submitting justifications.
6) PROJECT LOCATION AND SERVICE AREA: Give a brief description of the community impact the project will have as well as the area it will serve.
7) SIGNATURE: The Department Director must sign the bottom of the form and date it. The signature indicates that the director approves of the submission of the project and agrees with the information provided.
494
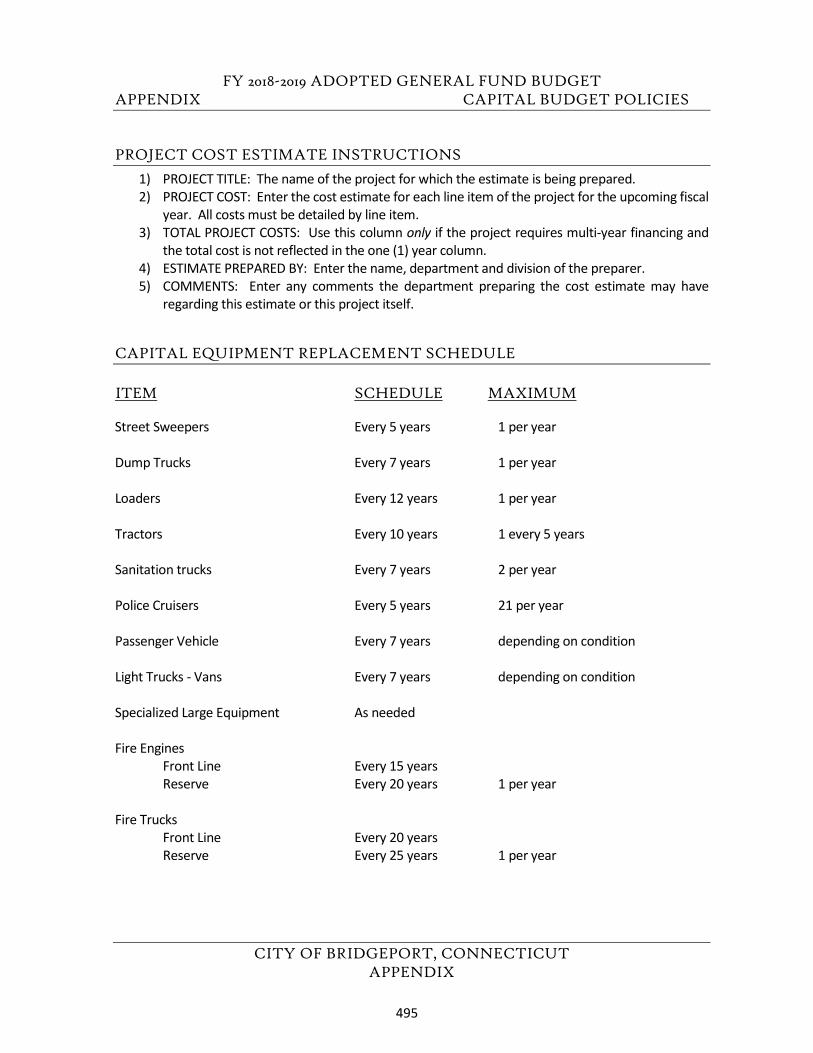
FY 2018-2019 ADOPTED GENERAL FUND BUDGET APPENDIX CAPITAL BUDGET POLICIES
CITY OF BRIDGEPORT, CONNECTICUT APPENDIX
PROJECT COST ESTIMATE INSTRUCTIONS
1) PROJECT TITLE: The name of the project for which the estimate is being prepared. 2) PROJECT COST: Enter the cost estimate for each line item of the project for the upcoming fiscal
year. All costs must be detailed by line item. 3) TOTAL PROJECT COSTS: Use this column only if the project requires multi-year financing and
the total cost is not reflected in the one (1) year column. 4) ESTIMATE PREPARED BY: Enter the name, department and division of the preparer. 5) COMMENTS: Enter any comments the department preparing the cost estimate may have
regarding this estimate or this project itself.
CAPITAL EQUIPMENT REPLACEMENT SCHEDULE ITEM SCHEDULE MAXIMUM Street Sweepers Every 5 years 1 per year Dump Trucks Every 7 years 1 per year Loaders Every 12 years 1 per year Tractors Every 10 years 1 every 5 years Sanitation trucks Every 7 years 2 per year Police Cruisers Every 5 years 21 per year Passenger Vehicle Every 7 years depending on condition Light Trucks - Vans Every 7 years depending on condition Specialized Large Equipment As needed Fire Engines Front Line Every 15 years Reserve Every 20 years 1 per year Fire Trucks Front Line Every 20 years Reserve Every 25 years 1 per year
495
FY 2018-2019 ADOPTED GENERAL FUND BUDGET APPENDIX CAPITAL BUDGET POLICIES
CITY OF BRIDGEPORT, CONNECTICUT APPENDIX
The following policies have been established to encourage the replacement of outdated capital equipment, realizing limitations of funding. In all cases, the equipment requested shall be of the type and quality necessary for the efficient accomplishment of the departments' service functions.
• EQUIPMENT FOR EQUIPMENT REPLACEMENT Example: Two-for-one trades will have preference over one-for-one trades.
• EQUIPMENT FOR DIRECT COST SAVINGS Example: Capital equipment proposals that offer direct cost savings to the City will have preference.
• EQUIPMENT FOR POSITION(S) REPLACEMENT Example: Proposals from departments for abolishing position(s) in return for equipment will have preference.
All capital equipment rollovers will be monitored for performance as the City expects increased turnover to dramatically reduce manpower time and equipment idle (repair) time.
CAPITAL IMPROVEMENT PROGRAM PROCEDURES
PROCESS Who decides: the City Council, through the budget and appropriation committee, provides the final approval of all Capital Improvement Programs, budgets and projects. The Mayor recommends the Capital Program by way of two committees:
Technical Review Committee: Reviews department submissions for priority ranking and capability. Capital Finance Committee: Reviews the recommendations of the Technical Review Committee and determines the project need by evaluating the following:
o Technical Review Committee priority; o Economic & community need/impact; o and Financial accessibility.
HOW DO PROJECTS GET CONSIDERED?
STEP I - SUBMISSION
Per the budget schedule, the Office of Policy and Management requests capital project proposals from the Department Directors. These proposals contain a project description, its justification and location. The Capital Allocation Checklist must be used by departments and review boards in developing and justifying capital submissions.
STEP II - TECHNICAL EVALUATION
After projects are submitted, the Office of Policy and Management will convene the Technical Review Board. This committee, made up of the City Engineer, City Planning Director, Public Works Director and two representatives of the Office of Policy & Management (OPM), evaluate the impact of each project based on the provided description and justification. Impacts are measured against the approved technical criteria. During this process, projects which are similar are consolidated, projects already financed or which should be requested as part of an operating budget are eliminated. This results in a final recommended priority list.
496
FY 2018-2019 ADOPTED GENERAL FUND BUDGET APPENDIX CAPITAL BUDGET POLICIES
CITY OF BRIDGEPORT, CONNECTICUT APPENDIX
STEP III - CAPITAL FINANCE COMMITTEE SELECTION
The prioritized list of submissions is presented to the Capital Finance Committee for an initial cut. Using the technical evaluation as the basis of the decision, this committee will select those projects which merit further consideration and eliminate those with lower priorities.
STEP IV - NOTIFICATION TO DEPARTMENTS
Once the Capital Finance Committee selects the projects, OPM sends a letter to all departments informing them of the decisions. The notification letter contains several items:
• A list of projects that will be considered. Each department is responsible for preparing the cost estimate;
• A list of projects that have been eliminated; • A description of the appeal process; • Cost estimate forms; • And copies of all project descriptions still in consideration.
Departments are to provide any updated information on the project descriptions and develop a cost estimate to be submitted to OPM.
STEP V - APPEAL
Each department is given one (1) week to review the disposition of each project they originally submitted. They may appeal any of those projects. This is done by submitting a written letter of justification that they wish to be reconsidered or a program that should be eliminated. All justifications are reviewed by the Capital Finance Committee and the department director will be invited to a meeting to answer any questions members may have. Based on the justifications presented the Capital Finance Committee will make a final determination. Departments will be notified the following week.
STEP VI - COST ESTIMATES
For all projects still in consideration, a cost estimate will be developed. These will be submitted to Office of Policy and Management.
STEP VII - FINAL EVALUATION OF PROJECTS
The Executive Committee, appointed by the Mayor, reviews all of the recommended projects and evaluates those for final presentation to the City Council. The final list will be evaluated from the priority list and available resources and submitted no later than the first Tuesday in March preceding the next fiscal year start.
STEP VIII - FINAL APPROVAL
Final approval to proceed will be given by the City Council. This is done through the voting of the council no later than the first Tuesday in May preceding the next fiscal year start.
STEP IX - NOTIFICATION OF SELECTED PROJECTS
After the Capital Improvement Plan is developed, the Office of Policy and Management will notify departments whose Capital Projects were adopted and will publish the Capital Budget. The document will contain the details of the selected projects as follows:
• Project descriptions; • Funded amounts;
497
FY 2018-2019 ADOPTED GENERAL FUND BUDGET APPENDIX CAPITAL BUDGET POLICIES
CITY OF BRIDGEPORT, CONNECTICUT APPENDIX
• Funding sources; • and the Responsible agency.
AMENDING THE CAPITAL IMPROVEMENT PROGRAM
From time to time during the year changes must be made in the Capital Improvement Program (CIP). These changes are made through a CIP Amendment request. A CIP Amendment is required under the following conditions:
• Financing a project not previously considered. This may result from emergencies that may occur during the year, or a change as needed.
• Increasing the funded amount of an existing project. These may arise from unanticipated inflation, change in the original project description or bids which come in higher than the original cost estimate.
A CIP Amendment is processed as follows: 1) The department responsible for the project makes an initial determination that additional funds are
required for a specific purpose. 2) A written request by the Director is submitted to OPM. The request will include:
A) Name of Project; B) Additional funds requested; C) Total current cost of the project; and D) Justification of request.
3) The Office of Policy and Management will make a recommendation to the Capital Finance Committee which approves or disapproves the request.
4) If the request is approved, OPM will prepare a report and resolution for approval from the City's City Council. The report will be placed on the earliest possible agenda of the City Council.
5) Upon approval of the City Council, OPM will request the Comptroller's Office to establish an account number or increase the original appropriation.
6) The Department proceeds with the project after steps 1-5 have been performed. They will be notified by OPM.
ACCOUNTING PROCEDURES
After all the projects have been approved by City Council the Comptroller's Office will begin the process of establishing accounts for the approved programs. All appropriations will be established based upon the approved project cost and prepared by using the line item criteria established by the cost estimate forms. In addition, the Comptroller's Office will be responsible for the following:
1) Maintaining grant agreements; 2) Maintaining audit records; 3) Receiving and recording revenues; 4) Distributing payments; 5) Reconciling the general ledger; 6) Reconciling bank statements and investments; and 7) Monitoring department performance.
498
FY 2018-2019 ADOPTED GENERAL FUND BUDGET APPENDIX CAPITAL BUDGET POLICIES
CITY OF BRIDGEPORT, CONNECTICUT APPENDIX
The Department Director or Project Manager will be responsible for the following: 1) Creating monthly project status reports; 2) Creating and maintaining project timetables; 3) Explaining project changes and/or cost overruns; 4) Providing updates to the City Council; 5) Presenting projects to committee and the City Council; 6) Completing data detail for the Comptroller's Office; and 7) Estimating costs and/or staffing requirements.
499
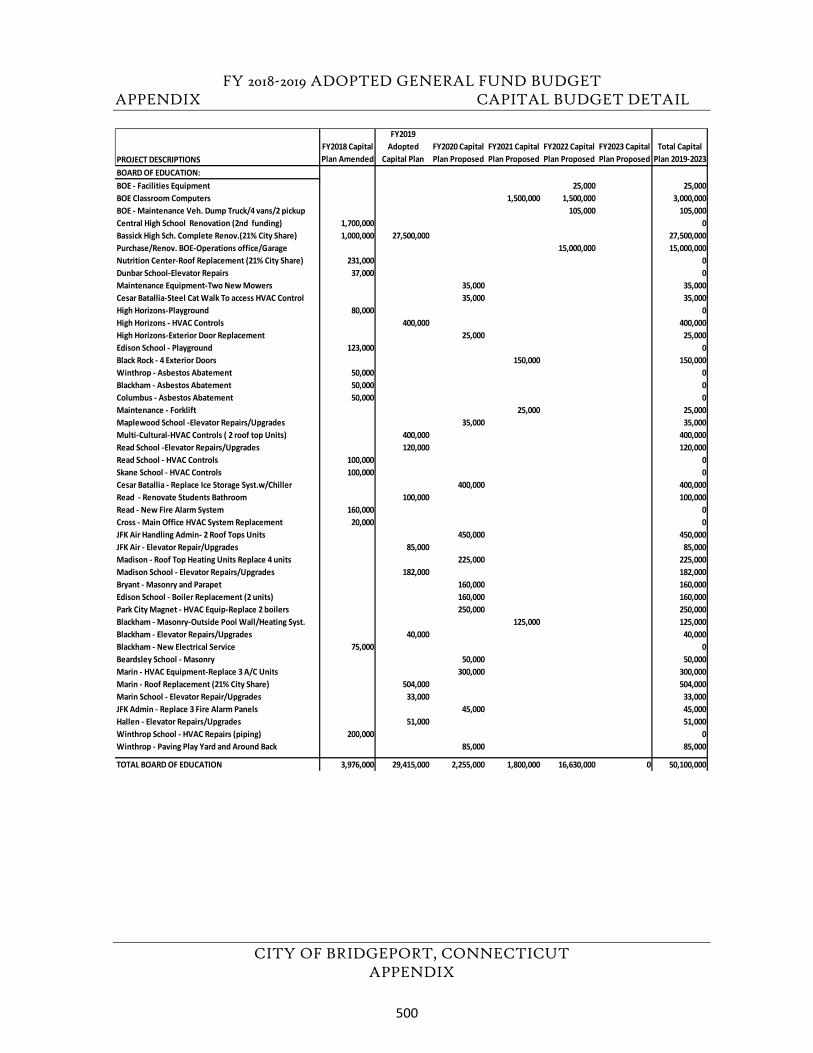
FY 2018-2019 ADOPTED GENERAL FUND BUDGET APPENDIX CAPITAL BUDGET DETAIL
CITY OF BRIDGEPORT, CONNECTICUT APPENDIX
PROJECT DESCRIPTIONSFY2018 Capital Plan Amended
FY2019 Adopted
Capital PlanFY2020 Capital Plan Proposed
FY2021 Capital Plan Proposed
FY2022 Capital Plan Proposed
FY2023 Capital Plan Proposed
Total Capital Plan 2019-2023
BOARD OF EDUCATION:BOE - Facilities Equipment 25,000 25,000BOE Classroom Computers 1,500,000 1,500,000 3,000,000BOE - Maintenance Veh. Dump Truck/4 vans/2 pickup 105,000 105,000Central High School Renovation (2nd funding) 1,700,000 0Bassick High Sch. Complete Renov.(21% City Share) 1,000,000 27,500,000 27,500,000Purchase/Renov. BOE-Operations office/Garage 15,000,000 15,000,000Nutrition Center-Roof Replacement (21% City Share) 231,000 0Dunbar School-Elevator Repairs 37,000 0Maintenance Equipment-Two New Mowers 35,000 35,000Cesar Batallia-Steel Cat Walk To access HVAC Control 35,000 35,000High Horizons-Playground 80,000 0High Horizons - HVAC Controls 400,000 400,000High Horizons-Exterior Door Replacement 25,000 25,000Edison School - Playground 123,000 0Black Rock - 4 Exterior Doors 150,000 150,000Winthrop - Asbestos Abatement 50,000 0Blackham - Asbestos Abatement 50,000 0Columbus - Asbestos Abatement 50,000 0Maintenance - Forklift 25,000 25,000Maplewood School -Elevator Repairs/Upgrades 35,000 35,000Multi-Cultural-HVAC Controls ( 2 roof top Units) 400,000 400,000Read School -Elevator Repairs/Upgrades 120,000 120,000Read School - HVAC Controls 100,000 0Skane School - HVAC Controls 100,000 0Cesar Batallia - Replace Ice Storage Syst.w/Chiller 400,000 400,000Read - Renovate Students Bathroom 100,000 100,000Read - New Fire Alarm System 160,000 0Cross - Main Office HVAC System Replacement 20,000 0JFK Air Handling Admin- 2 Roof Tops Units 450,000 450,000JFK Air - Elevator Repair/Upgrades 85,000 85,000Madison - Roof Top Heating Units Replace 4 units 225,000 225,000Madison School - Elevator Repairs/Upgrades 182,000 182,000Bryant - Masonry and Parapet 160,000 160,000Edison School - Boiler Replacement (2 units) 160,000 160,000Park City Magnet - HVAC Equip-Replace 2 boilers 250,000 250,000Blackham - Masonry-Outside Pool Wall/Heating Syst. 125,000 125,000Blackham - Elevator Repairs/Upgrades 40,000 40,000Blackham - New Electrical Service 75,000 0Beardsley School - Masonry 50,000 50,000Marin - HVAC Equipment-Replace 3 A/C Units 300,000 300,000Marin - Roof Replacement (21% City Share) 504,000 504,000Marin School - Elevator Repair/Upgrades 33,000 33,000JFK Admin - Replace 3 Fire Alarm Panels 45,000 45,000Hallen - Elevator Repairs/Upgrades 51,000 51,000Winthrop School - HVAC Repairs (piping) 200,000 0Winthrop - Paving Play Yard and Around Back 85,000 85,000
TOTAL BOARD OF EDUCATION 3,976,000 29,415,000 2,255,000 1,800,000 16,630,000 0 50,100,000
500
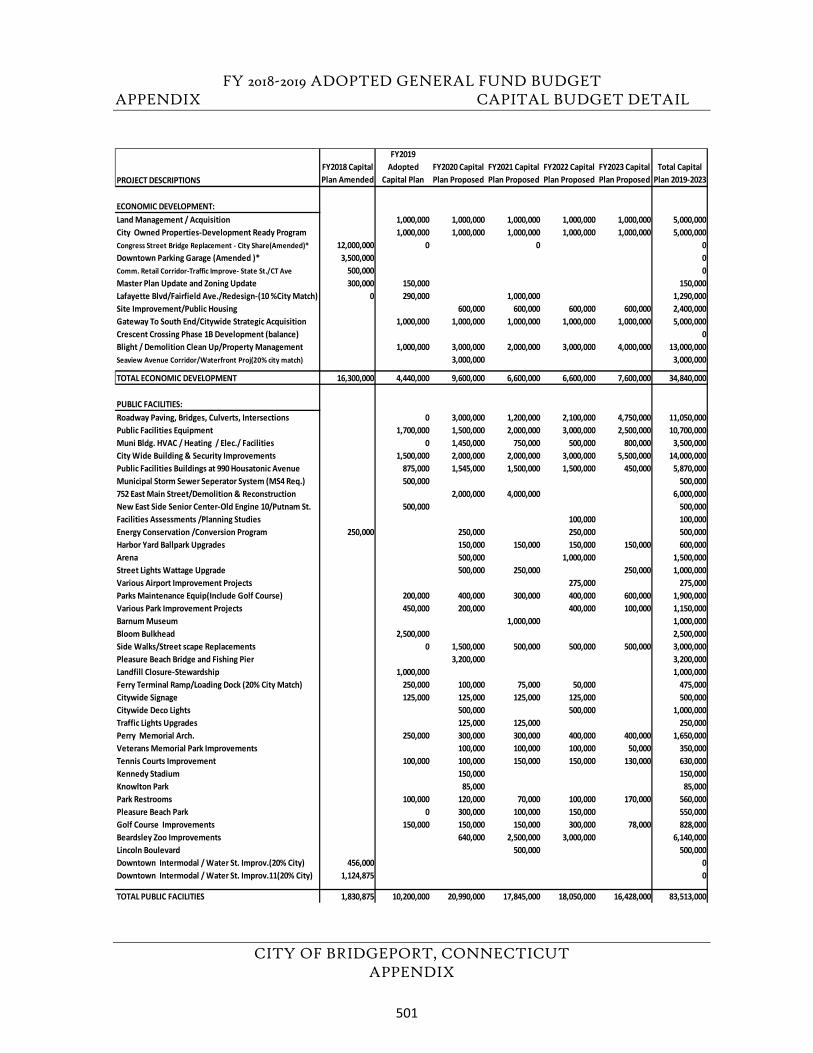
FY 2018-2019 ADOPTED GENERAL FUND BUDGET APPENDIX CAPITAL BUDGET DETAIL
CITY OF BRIDGEPORT, CONNECTICUT APPENDIX
PROJECT DESCRIPTIONSFY2018 Capital Plan Amended
FY2019 Adopted
Capital PlanFY2020 Capital Plan Proposed
FY2021 Capital Plan Proposed
FY2022 Capital Plan Proposed
FY2023 Capital Plan Proposed
Total Capital Plan 2019-2023
ECONOMIC DEVELOPMENT:Land Management / Acquisition 1,000,000 1,000,000 1,000,000 1,000,000 1,000,000 5,000,000City Owned Properties-Development Ready Program 1,000,000 1,000,000 1,000,000 1,000,000 1,000,000 5,000,000Congress Street Bridge Replacement - City Share(Amended)* 12,000,000 0 0 0Downtown Parking Garage (Amended )* 3,500,000 0Comm. Retail Corridor-Traffic Improve- State St./CT Ave 500,000 0Master Plan Update and Zoning Update 300,000 150,000 150,000Lafayette Blvd/Fairfield Ave./Redesign-(10 %City Match) 0 290,000 1,000,000 1,290,000Site Improvement/Public Housing 600,000 600,000 600,000 600,000 2,400,000Gateway To South End/Citywide Strategic Acquisition 1,000,000 1,000,000 1,000,000 1,000,000 1,000,000 5,000,000Crescent Crossing Phase 1B Development (balance) 0Blight / Demolition Clean Up/Property Management 1,000,000 3,000,000 2,000,000 3,000,000 4,000,000 13,000,000Seaview Avenue Corridor/Waterfront Proj(20% city match) 3,000,000 3,000,000
TOTAL ECONOMIC DEVELOPMENT 16,300,000 4,440,000 9,600,000 6,600,000 6,600,000 7,600,000 34,840,000
PUBLIC FACILITIES:Roadway Paving, Bridges, Culverts, Intersections 0 3,000,000 1,200,000 2,100,000 4,750,000 11,050,000Public Facilities Equipment 1,700,000 1,500,000 2,000,000 3,000,000 2,500,000 10,700,000Muni Bldg. HVAC / Heating / Elec./ Facilities 0 1,450,000 750,000 500,000 800,000 3,500,000City Wide Building & Security Improvements 1,500,000 2,000,000 2,000,000 3,000,000 5,500,000 14,000,000Public Facilities Buildings at 990 Housatonic Avenue 875,000 1,545,000 1,500,000 1,500,000 450,000 5,870,000Municipal Storm Sewer Seperator System (MS4 Req.) 500,000 500,000752 East Main Street/Demolition & Reconstruction 2,000,000 4,000,000 6,000,000New East Side Senior Center-Old Engine 10/Putnam St. 500,000 500,000Facilities Assessments /Planning Studies 100,000 100,000Energy Conservation /Conversion Program 250,000 250,000 250,000 500,000Harbor Yard Ballpark Upgrades 150,000 150,000 150,000 150,000 600,000Arena 500,000 1,000,000 1,500,000Street Lights Wattage Upgrade 500,000 250,000 250,000 1,000,000Various Airport Improvement Projects 275,000 275,000Parks Maintenance Equip(Include Golf Course) 200,000 400,000 300,000 400,000 600,000 1,900,000Various Park Improvement Projects 450,000 200,000 400,000 100,000 1,150,000Barnum Museum 1,000,000 1,000,000Bloom Bulkhead 2,500,000 2,500,000Side Walks/Street scape Replacements 0 1,500,000 500,000 500,000 500,000 3,000,000Pleasure Beach Bridge and Fishing Pier 3,200,000 3,200,000Landfill Closure-Stewardship 1,000,000 1,000,000Ferry Terminal Ramp/Loading Dock (20% City Match) 250,000 100,000 75,000 50,000 475,000Citywide Signage 125,000 125,000 125,000 125,000 500,000Citywide Deco Lights 500,000 500,000 1,000,000Traffic Lights Upgrades 125,000 125,000 250,000Perry Memorial Arch. 250,000 300,000 300,000 400,000 400,000 1,650,000Veterans Memorial Park Improvements 100,000 100,000 100,000 50,000 350,000Tennis Courts Improvement 100,000 100,000 150,000 150,000 130,000 630,000Kennedy Stadium 150,000 150,000Knowlton Park 85,000 85,000Park Restrooms 100,000 120,000 70,000 100,000 170,000 560,000Pleasure Beach Park 0 300,000 100,000 150,000 550,000Golf Course Improvements 150,000 150,000 150,000 300,000 78,000 828,000Beardsley Zoo Improvements 640,000 2,500,000 3,000,000 6,140,000Lincoln Boulevard 500,000 500,000Downtown Intermodal / Water St. Improv.(20% City) 456,000 0Downtown Intermodal / Water St. Improv.11(20% City) 1,124,875 0
TOTAL PUBLIC FACILITIES 1,830,875 10,200,000 20,990,000 17,845,000 18,050,000 16,428,000 83,513,000
501
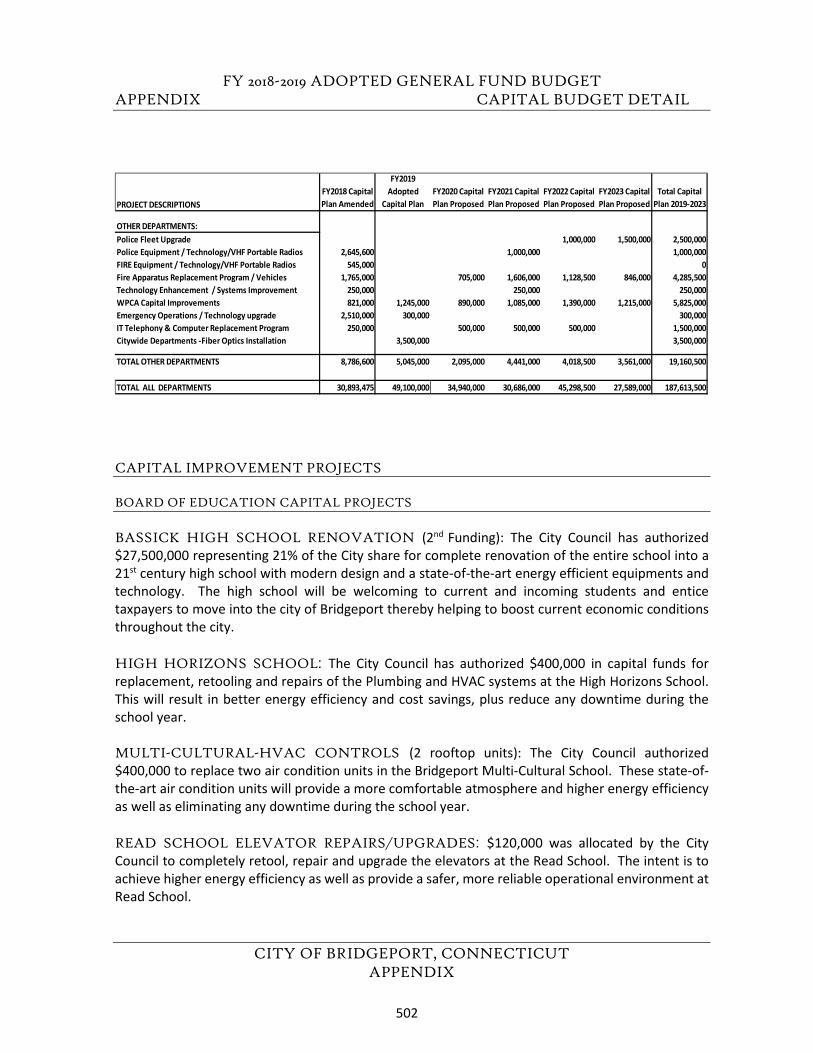
FY 2018-2019 ADOPTED GENERAL FUND BUDGET APPENDIX CAPITAL BUDGET DETAIL
CITY OF BRIDGEPORT, CONNECTICUT APPENDIX
CAPITAL IMPROVEMENT PROJECTS
BOARD OF EDUCATION CAPITAL PROJECTS
BASSICK HIGH SCHOOL RENOVATION (2nd Funding): The City Council has authorized $27,500,000 representing 21% of the City share for complete renovation of the entire school into a 21st century high school with modern design and a state-of-the-art energy efficient equipments and technology. The high school will be welcoming to current and incoming students and entice taxpayers to move into the city of Bridgeport thereby helping to boost current economic conditions throughout the city.
HIGH HORIZONS SCHOOL: The City Council has authorized $400,000 in capital funds for replacement, retooling and repairs of the Plumbing and HVAC systems at the High Horizons School. This will result in better energy efficiency and cost savings, plus reduce any downtime during the school year.
MULTI-CULTURAL-HVAC CONTROLS (2 rooftop units): The City Council authorized $400,000 to replace two air condition units in the Bridgeport Multi-Cultural School. These state-of-the-art air condition units will provide a more comfortable atmosphere and higher energy efficiency as well as eliminating any downtime during the school year.
READ SCHOOL ELEVATOR REPAIRS/UPGRADES: $120,000 was allocated by the City Council to completely retool, repair and upgrade the elevators at the Read School. The intent is to achieve higher energy efficiency as well as provide a safer, more reliable operational environment at Read School.
PROJECT DESCRIPTIONSFY2018 Capital Plan Amended
FY2019 Adopted
Capital PlanFY2020 Capital Plan Proposed
FY2021 Capital Plan Proposed
FY2022 Capital Plan Proposed
FY2023 Capital Plan Proposed
Total Capital Plan 2019-2023
OTHER DEPARTMENTS:Police Fleet Upgrade 1,000,000 1,500,000 2,500,000Police Equipment / Technology/VHF Portable Radios 2,645,600 1,000,000 1,000,000FIRE Equipment / Technology/VHF Portable Radios 545,000 0Fire Apparatus Replacement Program / Vehicles 1,765,000 705,000 1,606,000 1,128,500 846,000 4,285,500Technology Enhancement / Systems Improvement 250,000 250,000 250,000WPCA Capital Improvements 821,000 1,245,000 890,000 1,085,000 1,390,000 1,215,000 5,825,000Emergency Operations / Technology upgrade 2,510,000 300,000 300,000IT Telephony & Computer Replacement Program 250,000 500,000 500,000 500,000 1,500,000Citywide Departments -Fiber Optics Installation 3,500,000 3,500,000
TOTAL OTHER DEPARTMENTS 8,786,600 5,045,000 2,095,000 4,441,000 4,018,500 3,561,000 19,160,500
TOTAL ALL DEPARTMENTS 30,893,475 49,100,000 34,940,000 30,686,000 45,298,500 27,589,000 187,613,500
502
FY 2018-2019 ADOPTED GENERAL FUND BUDGET APPENDIX CAPITAL BUDGET DETAIL
CITY OF BRIDGEPORT, CONNECTICUT APPENDIX
READ SCHOOL – RENOVATE STUDENTS BATHROOM: $100,000 was authorized by the City Council for full renovation of students’ bathrooms to include plumbing upgrade, retrofit toilets, sinks and tiles as well as to provide better lighting and handicap safety handrails. All these renovations are intended to provide a safer environment and improve the experience and well-being of pupils and teachers at the Read School.
JFK AIR – ELEVATOR REPAIR UPGRADES: $85,000 was allocated by the City Council to completely retool, repair and upgrade the elevators at the JFK AIR School. The intent is to achieve higher energy efficiency as well as provide a safer and more reliable operational environment at JFK School.
MADISON SCHOOL – ELEVATOR REPAIRS/UPGRADES: $182,000 000 was allocated by the City Council to completely retool, repair and upgrade the elevators at the Madison School. The intent is to achieve higher energy efficiency as well as provide a safer and more reliable operational environment at the Madison School.
BLACKHAM – ELEVATOR REPAIR/UPGRADES: $40,000 was allocated by the City Council to completely retool, repair and upgrade the elevators at the Blackham School. The intent is to achieve higher energy efficiency as well as provide a safer and more reliable operational environment at the Blackham School.
MARIN – ROOF REPLACEMENT: The City Council authorized $504,000 for complete replacement of the entire Marin School roof with state-of-the-art modern and highly energy efficient roofing materials, as well as healthier school environment.
MARIN SCHOOL – ELEVATOR REPAIR/UPGRADES: $33,000 has been allocated by the City Council for elevator repairs and upgrades to modern code standards. This will increase the safety of children and staff at the Marin School, as well as reduce any potential liabilities in the school environment.
HALLEN – ELEVATOR REPAIRS/UPGRADES: $51,000 was allocated by the City Council to completely retool, repair and upgrade the elevators at the Hallen School. The intent is to achieve higher energy efficiency as well as provide a safer and more reliable operational environment at the Hallen School.
ECONOMIC DEVELOPMENT
LAND MANAGEMENT/ACQUISTION: $1,000,000. The City of Bridgeport has a 5-year plan of spending $1 million each year on economically strategic areas for development in partnership with real estate developers who want to infuse and foster further economic development in Bridgeport which will yield growth in the Bridgeport taxable Grand List.
503
FY 2018-2019 ADOPTED GENERAL FUND BUDGET APPENDIX CAPITAL BUDGET DETAIL
CITY OF BRIDGEPORT, CONNECTICUT APPENDIX
CITY OWNED PROPERTIES-DEVELOPMENT READY PROGRAM: $1,000,000. The City of Bridgeport will spend $1 million each year to get city-owned properties in economically strategic locations development-ready for viable investors who would like to invest in the City of Bridgeport and thereby increase the taxable Grand List.
MASTER PLAN UPDATE AND ZONING UPDATE: $150,000. The City Council authorized $150,000 in the FY19 capital budget, is to complete the economic and zoning development master plans which are geared towards welcoming additional investors into the City of Bridgeport, based on the 21st Century investment options.
LAFAYETTE BLVD/FAIRFIELD AVE/ REDESIGN (10% CITY MATCH): $290,000. The City Council has allocated $290,000 to the redesign and reconstruction of the Lafayette boulevard intersection. This is a 90% federally funded project enabling a major road re-design of downtown within the City of Bridgeport. The ultimate goal of this project is to ease the flow of traffic into downtown Bridgeport and improve economic flow as well as bolster business activities within the downtown area of the City of Bridgeport.
GATEWAY TO SOUTH END/CITYWIDE STRATEGIC ACQUISITION: $1,000,000. An authorized amount of $1 million each year for the next 5 years by the City Council, is aimed at economic development and business partnerships with investors in the south-end area of Bridgeport and is ultimately geared towards attracting business activities thereby increasing economic development and taxable Grand List growth within the south-end area of Bridgeport.
BLIGHT /DEMOLITION CLEANUP/PROPERTY MANAGEMENT: $1,000,000. The Blight Demolition capital allocation is for cleanup of large abandoned non-revenue generating land areas in partnership with major development companies from various industries with the ultimate goal of achieving increased employment, real estate building, commercial and manufacturing companies amongst targeted areas within Bridgeport. The ultimate goal is to sustain and increase the taxable Grand List base within the City of Bridgeport.
PUBLIC FACILITIES EQUIPMENT
PUBLIC FACILITIES EQUIPMENT: $1,700,000. The City Council Authorized $1.7 million towards the purchasing of new garbage trucks, bulldozers and equipment trucks to replenish the older fleet of equipment which are becoming more expensive to maintain and repair. Purchase of new equipment will be more economical and operationally efficient through less downtime and reduced pollution.
CITY-WIDE BUILDING & SECURITY IMPROVEMENTS: $1,500,000. An allocated $1.5 million is authorized for city-wide building maintenance and purchase of street cameras and illegal dumping cameras. The preventative maintenance on city buildings will save the city money in repairs and reduced liabilities. The Street-cameras will be used for surveillance of crime scenes by the police department thereby enabling them to solve crimes much more efficiently with evidence proof and less police investigative hours. The Illegal-dumping cameras will be used for surveillance and reporting of illegal dumping in hotspot areas of the city. The police department estimates that the
504
FY 2018-2019 ADOPTED GENERAL FUND BUDGET APPENDIX CAPITAL BUDGET DETAIL
CITY OF BRIDGEPORT, CONNECTICUT APPENDIX
surveillance cameras will save the city approximately $400,000 annually in police personnel costs. The Public facilities department estimates that the Illegal-Dumping cameras will save the city approximately $100,000 annually in personnel and equipment use.
PUBLIC FACILITIES BUILDINGS AT 990 HOUSATONIC AVENUE: $875,000 is authorized for the city’s public facilities building at 990 Housatonic Avenue to retrofit the public facilities garage into a state-of-the-art maintenance garage which will bring more efficiency around the maintenance program of vehicle equipment fleets.
MUNICIPAL STORM SEWER SEPERATOR SYSTEM (MS4 REQ): $500,000. The City Council authorized $500k is a requirement of the Connecticut Department of Environmental Protection (DEP) that municipalities conduct a complete survey of all combined storm drainage pipes and sewer drainage systems within its territories. The DEP’s ultimate goal is to have municipalities separate storm water from sewer water over the next ten years.
NEW EAST SIDE SENIOR CENTER-OLD ENGINE 10/PUTNAM STREET: $500,000. The $500k is allocated for converting and retrofitting the old Engine 10 firehouse into a state-of-the-art recreational senior center which is intended for improved social conditions and well-living of seniors in the City of Bridgeport.
PARKS MAINTENANCE EQUIP (INCLUDE GOLF COURSE): $200,000. The City of Bridgeport owns and operates the Fairchild Wheeler Golf Course. The $200k capital allocation is to purchase new electric golf carts which are environmentally friendly and do not produce air pollution. Some of the funds will be used to purchase new lawn mowing equipment. The new lawn mowing equipment will have less maintenance costs, less downtime and less repairs. The ultimate goal is to improve overall golf course playing experience which will also increase revenue due to increased attendance.
VARIOUS PARK IMPROVEMENT PROJECTS: $450,000. The City of Bridgeport has a total 44 parks within its territory hence its name “The Park City”. The City Council has allocated $450,000 for the improvement of these parks located in different neighborhoods. The City Council’s ultimate intent is to make most of these parks family friendly for leisure activities, exercise, picnics and other activities for the residents of Bridgeport.
BLOOM BULKHEAD: $2,500,000. The City Council allocated $2.5 million for construction of a water-barrier piling in the Bloom shellfish fishing area located in the fishing arena of the City of Bridgeport. The reinforcement of the barrier piling/bulkhead will eliminate the city’s potential liability as well as bring fishing economic value in Bridgeport. The construction of the Bloom bulkhead will expand and sustain the fishing industries in the waters of Bridgeport as well as retention of restaurants in the Bridgeport area.
505
FY 2018-2019 ADOPTED GENERAL FUND BUDGET APPENDIX CAPITAL BUDGET DETAIL
CITY OF BRIDGEPORT, CONNECTICUT APPENDIX
LANDFILL CLOSURE-STEWARDSHIP: $1,000,000. The allocated amount of $1 million dollars is to permanently close and cap an old landfill site located at Seaside Park Bridgeport due to environmental reasons as per state DEP requirements. The permanent closure/cap will make land usable for other developmental purposes by investors. i.e. mass installation of solar panels on site for energy generation.
FERRY TERMINAL RAMP/LOADING DOCK (20% CITY MATCH): $250,000. The Ferry Terminal Ramp and Loading Dock is located downtown within the commercial fishing area of Bridgeport. The city is required to provide a twenty percent (20%) match towards the rebuilding of the Ferry Dock Terminal which will result in more commercial boats using this dock. These increased activities will be good for the overall Bridgeport commercial fishing.
CITY-WIDE SIGNAGE: $125,000. The allocated amounts of $125k by the City Council is for the replacement of worn-out directory signs within the City of Bridgeport. The intention is to provide ease in locating streets and directories within the Bridgeport metropolitan area.
PERRY MEMORIAL ARCH: $250,000. This historic gate is the leading entrance to the Bridgeport Seaside Park. The allocated dollars are for the historical restoration of this arch thereby restoring and preserving the original beauty of the gate and part of Bridgeport’s rich history.
TENNIS COURTS IMPROVEMENT: $100,000. The amounts allocated of $100k are geared towards the improvement of city owned tennis courts within the South and East end of Bridgeport. The improvement is intended to encourage and promote residents exercising and engaging in more productive social and sporting activities which will ultimately increase Bridgeport residency, as well as economic boost to the city.
PARK RESTROOMS: $100,000. The allocated amounts of $100k are intended for the remodeling of the five restrooms at Seaside Park of Bridgeport into much more modern and efficient bathrooms for residence use.
GOLF COURSE IMPROVEMENTS: $150,000. The $150k is allocated for the improvement of irrigation and lawn maintenance for a better golf course and golfing experience at the Fairchild Wheeler Golf Course. The anticipation is to have improved revenue through increased attendance and more golf round plays.
506
FY 2018-2019 ADOPTED GENERAL FUND BUDGET APPENDIX CAPITAL BUDGET DETAIL
CITY OF BRIDGEPORT, CONNECTICUT APPENDIX
OTHER DEPARTMENTS:
WATER POLLUTION CONTROL AUTHORITY CPITAL IMPROVEMENTS: $1,245,000 for continuation of the Water Pollution Control Authority infrastructure replacement program targeting improvements to equipments used in sewer waste treatment. The new equipment will be more energy efficient and environmentally friendly.
EMERGENCY OPERATIONS/TECHNOLOGY UPGRADE: $300,000. This amount is for upgrading the 911 radio frequency and radio antennas for better reception call frequency thereby reducing city liability due to more accurate and efficient transmission.
CITYWIDE DEPARTMENTS -FIBRE OPTICS INSTALLATION: $3,500,000. A $3.5 million for installing city-wide Fiber Optics for use in city-owned buildings and operation. The installation of Fiber Optics will make the city self-sufficient in providing Fiber Optic needs and not have to pay outside providers to supply this service. The City of Bridgeport anticipates approximate savings of $350k per year after the Fiber Optics installation or a ten (10) year return on investments.
507

FY 2018-2019 ADOPTED GENERAL FUND BUDGET
CITY OF BRIDGEPORT, CONNECTICUT
This page left blank intentionally.
508
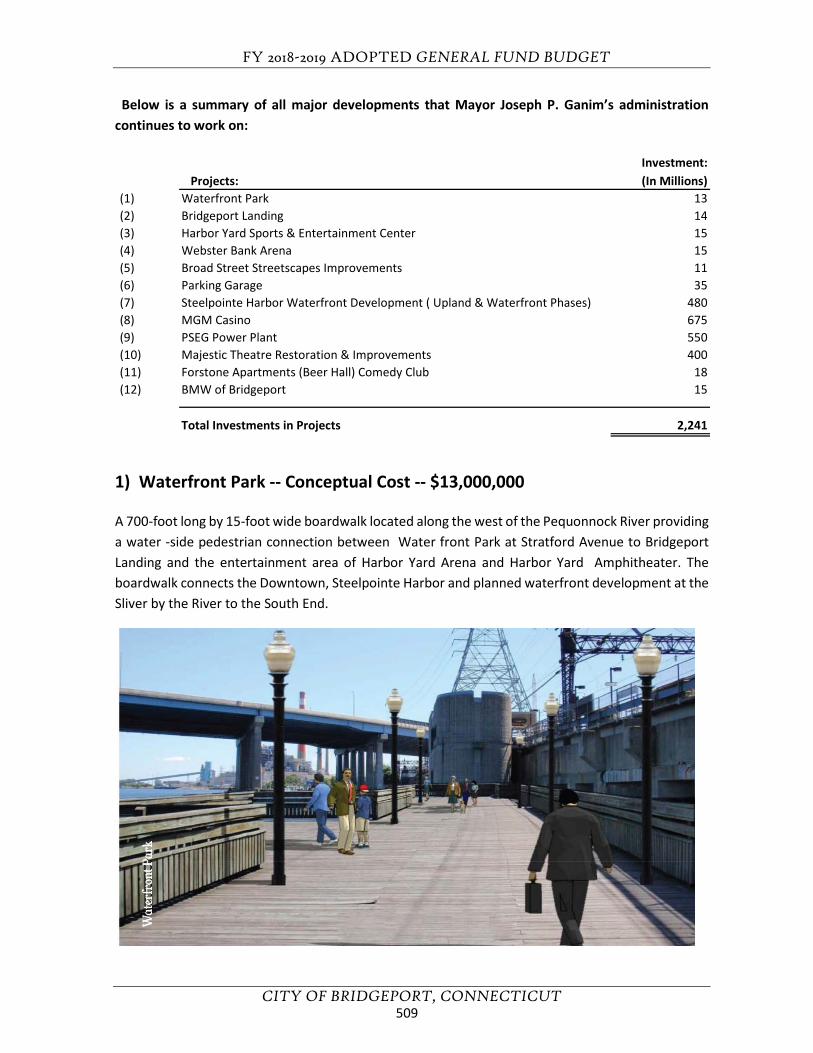
FY 2018-2019 ADOPTED GENERAL FUND BUDGET
CITY OF BRIDGEPORT, CONNECTICUT
Below is a summary of all major developments that Mayor Joseph P. Ganim’s administration continues to work on:
1) Waterfront Park -- Conceptual Cost -- $13,000,000
A 700-foot long by 15-foot wide boardwalk located along the west of the Pequonnock River providing a water -side pedestrian connection between Water front Park at Stratford Avenue to Bridgeport Landing and the entertainment area of Harbor Yard Arena and Harbor Yard Amphitheater. The boardwalk connects the Downtown, Steelpointe Harbor and planned waterfront development at the Sliver by the River to the South End.
Investment:Projects: (In Millions)
(1) Waterfront Park 13(2) Bridgeport Landing 14(3) Harbor Yard Sports & Entertainment Center 15(4) Webster Bank Arena 15(5) Broad Street Streetscapes Improvements 11(6) Parking Garage 35(7) Steelpointe Harbor Waterfront Development ( Upland & Waterfront Phases) 480(8) MGM Casino 675(9) PSEG Power Plant 550(10) Majestic Theatre Restoration & Improvements 400(11) Forstone Apartments (Beer Hall) Comedy Club 18(12) BMW of Bridgeport 15
Total Investments in Projects 2,241
509
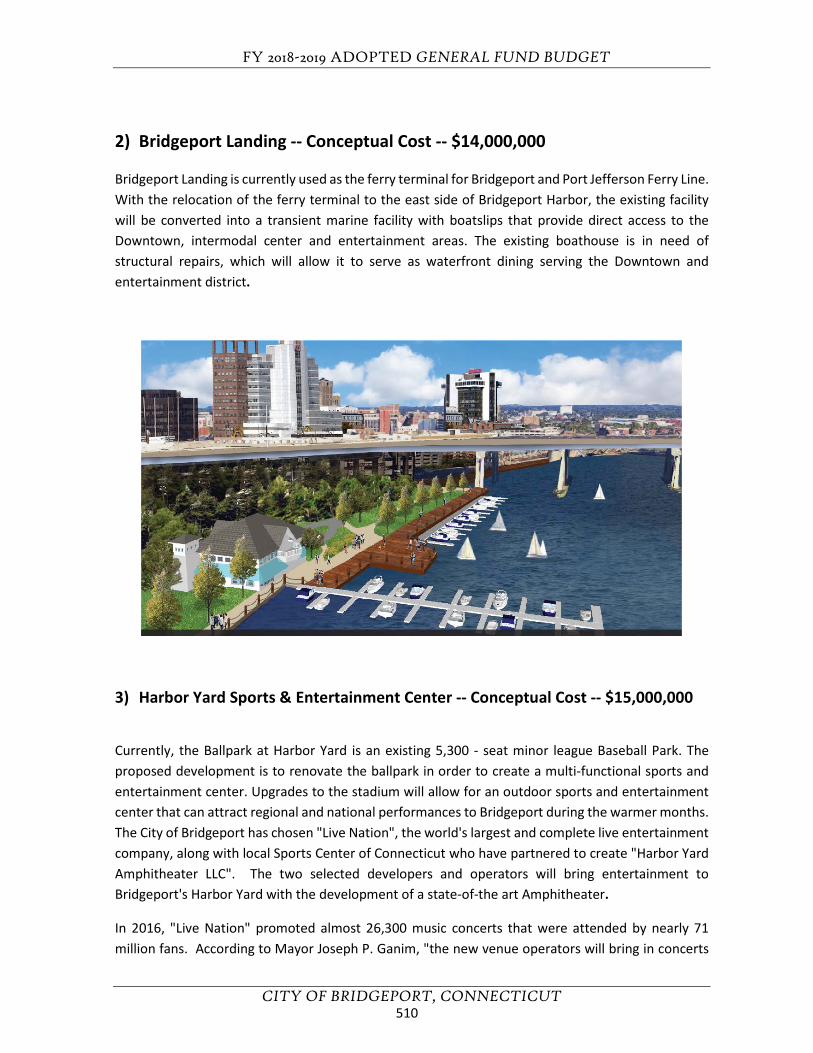
FY 2018-2019 ADOPTED GENERAL FUND BUDGET
CITY OF BRIDGEPORT, CONNECTICUT
2) Bridgeport Landing -- Conceptual Cost -- $14,000,000
Bridgeport Landing is currently used as the ferry terminal for Bridgeport and Port Jefferson Ferry Line. With the relocation of the ferry terminal to the east side of Bridgeport Harbor, the existing facility will be converted into a transient marine facility with boatslips that provide direct access to the Downtown, intermodal center and entertainment areas. The existing boathouse is in need of structural repairs, which will allow it to serve as waterfront dining serving the Downtown and entertainment district.
3) Harbor Yard Sports & Entertainment Center -- Conceptual Cost -- $15,000,000
Currently, the Ballpark at Harbor Yard is an existing 5,300 - seat minor league Baseball Park. The proposed development is to renovate the ballpark in order to create a multi-functional sports and entertainment center. Upgrades to the stadium will allow for an outdoor sports and entertainment center that can attract regional and national performances to Bridgeport during the warmer months. The City of Bridgeport has chosen "Live Nation", the world's largest and complete live entertainment company, along with local Sports Center of Connecticut who have partnered to create "Harbor Yard Amphitheater LLC". The two selected developers and operators will bring entertainment to Bridgeport's Harbor Yard with the development of a state-of-the art Amphitheater.
In 2016, "Live Nation" promoted almost 26,300 music concerts that were attended by nearly 71 million fans. According to Mayor Joseph P. Ganim, "the new venue operators will bring in concerts
510
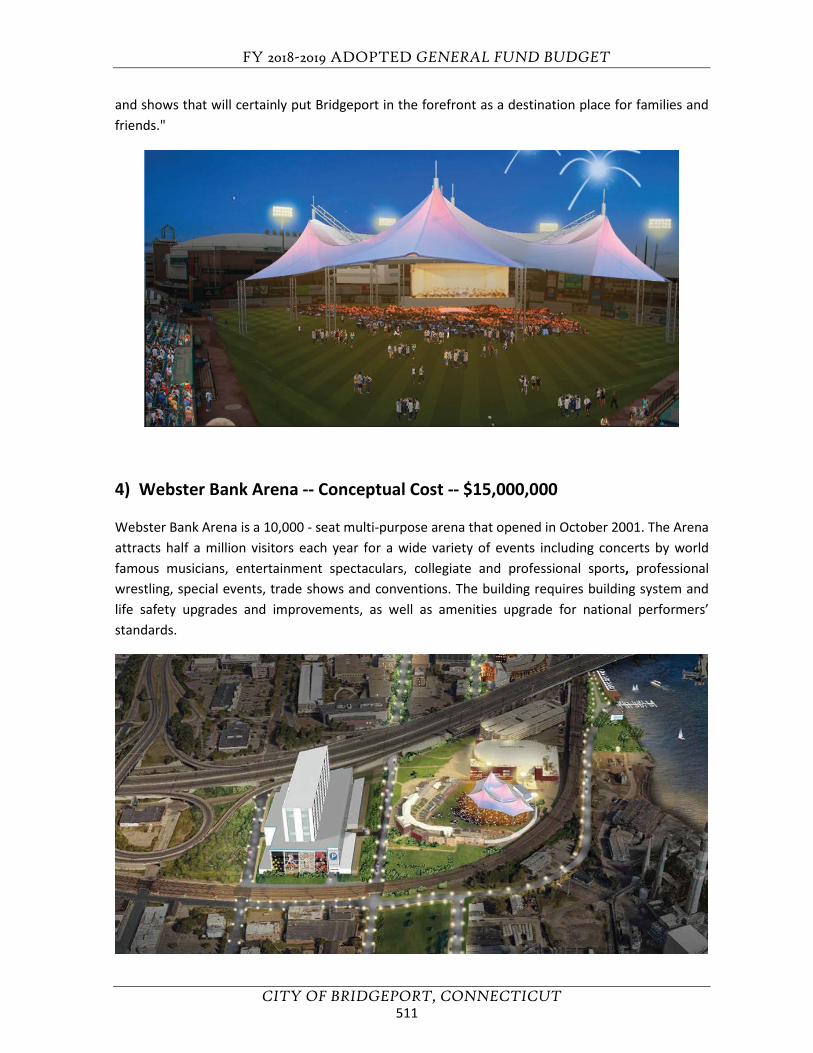
FY 2018-2019 ADOPTED GENERAL FUND BUDGET
CITY OF BRIDGEPORT, CONNECTICUT
and shows that will certainly put Bridgeport in the forefront as a destination place for families and friends."
4) Webster Bank Arena -- Conceptual Cost -- $15,000,000
Webster Bank Arena is a 10,000 - seat multi-purpose arena that opened in October 2001. The Arena attracts half a million visitors each year for a wide variety of events including concerts by world famous musicians, entertainment spectaculars, collegiate and professional sports, professional wrestling, special events, trade shows and conventions. The building requires building system and life safety upgrades and improvements, as well as amenities upgrade for national performers’ standards.
511
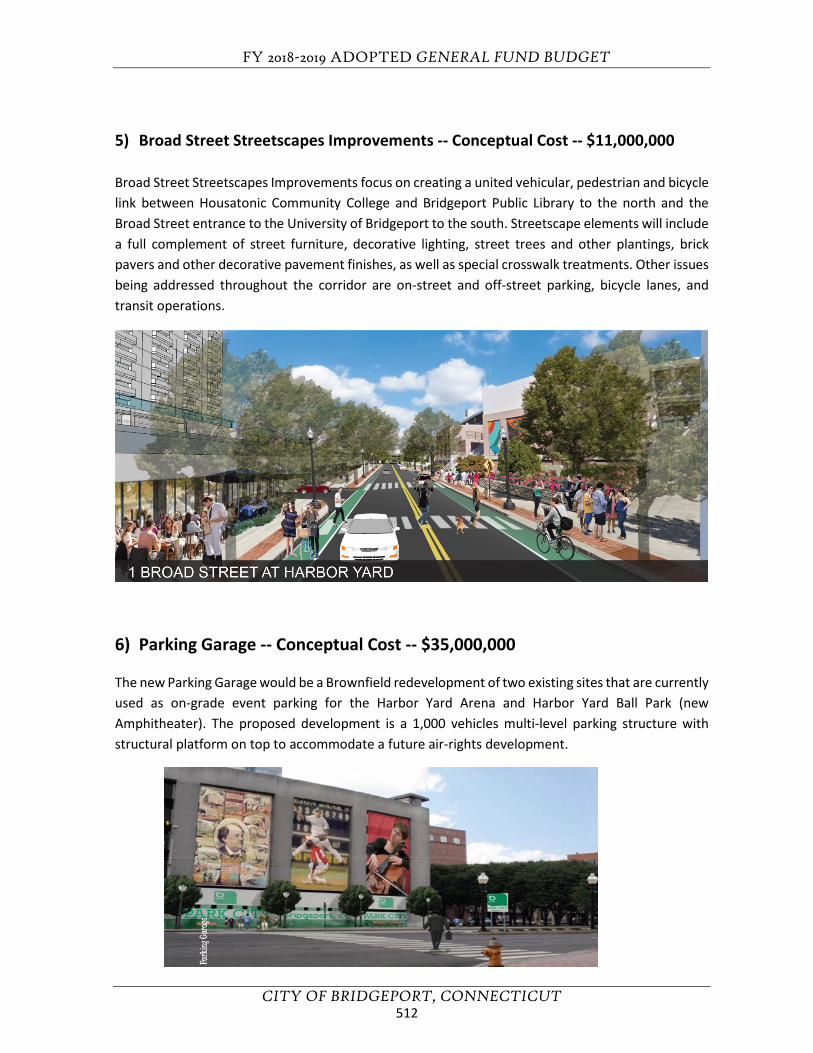
FY 2018-2019 ADOPTED GENERAL FUND BUDGET
CITY OF BRIDGEPORT, CONNECTICUT
5) Broad Street Streetscapes Improvements -- Conceptual Cost -- $11,000,000
Broad Street Streetscapes Improvements focus on creating a united vehicular, pedestrian and bicycle link between Housatonic Community College and Bridgeport Public Library to the north and the Broad Street entrance to the University of Bridgeport to the south. Streetscape elements will include a full complement of street furniture, decorative lighting, street trees and other plantings, brick pavers and other decorative pavement finishes, as well as special crosswalk treatments. Other issues being addressed throughout the corridor are on-street and off-street parking, bicycle lanes, and transit operations.
6) Parking Garage -- Conceptual Cost -- $35,000,000
The new Parking Garage would be a Brownfield redevelopment of two existing sites that are currently used as on-grade event parking for the Harbor Yard Arena and Harbor Yard Ball Park (new Amphitheater). The proposed development is a 1,000 vehicles multi-level parking structure with structural platform on top to accommodate a future air-rights development.
512
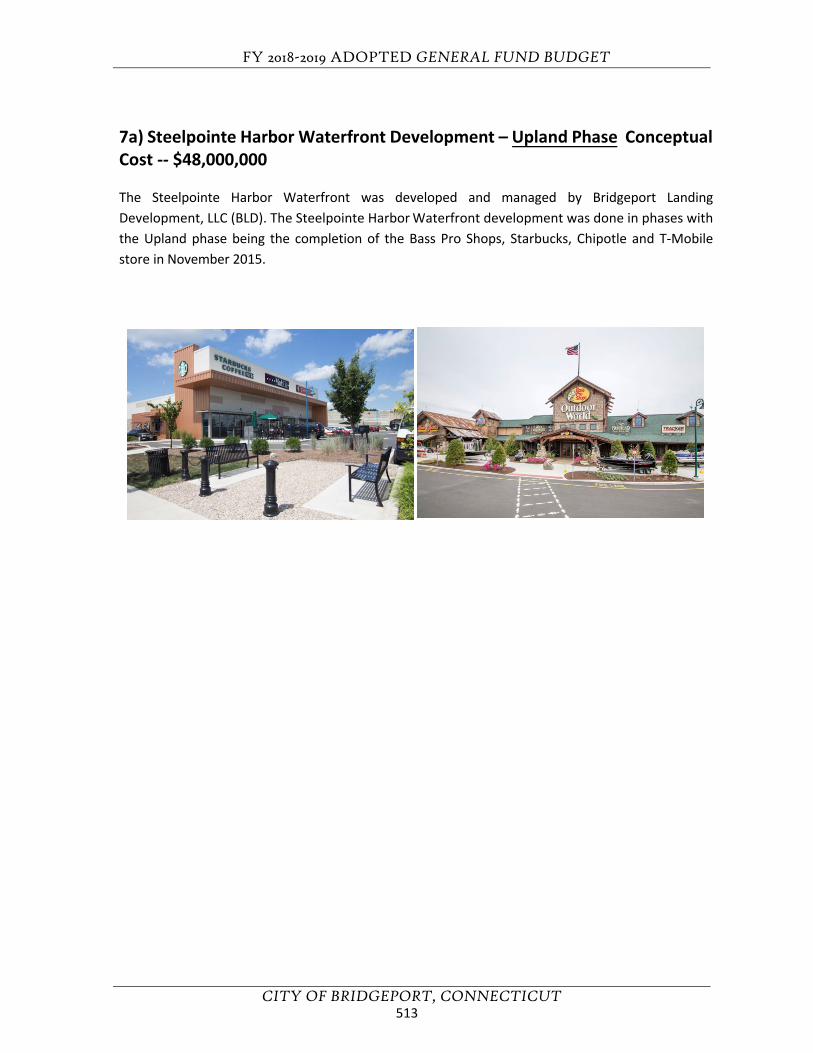
FY 2018-2019 ADOPTED GENERAL FUND BUDGET
CITY OF BRIDGEPORT, CONNECTICUT
7a) Steelpointe Harbor Waterfront Development – Upland Phase Conceptual Cost -- $48,000,000
The Steelpointe Harbor Waterfront was developed and managed by Bridgeport Landing Development, LLC (BLD). The Steelpointe Harbor Waterfront development was done in phases with the Upland phase being the completion of the Bass Pro Shops, Starbucks, Chipotle and T-Mobile store in November 2015.
513
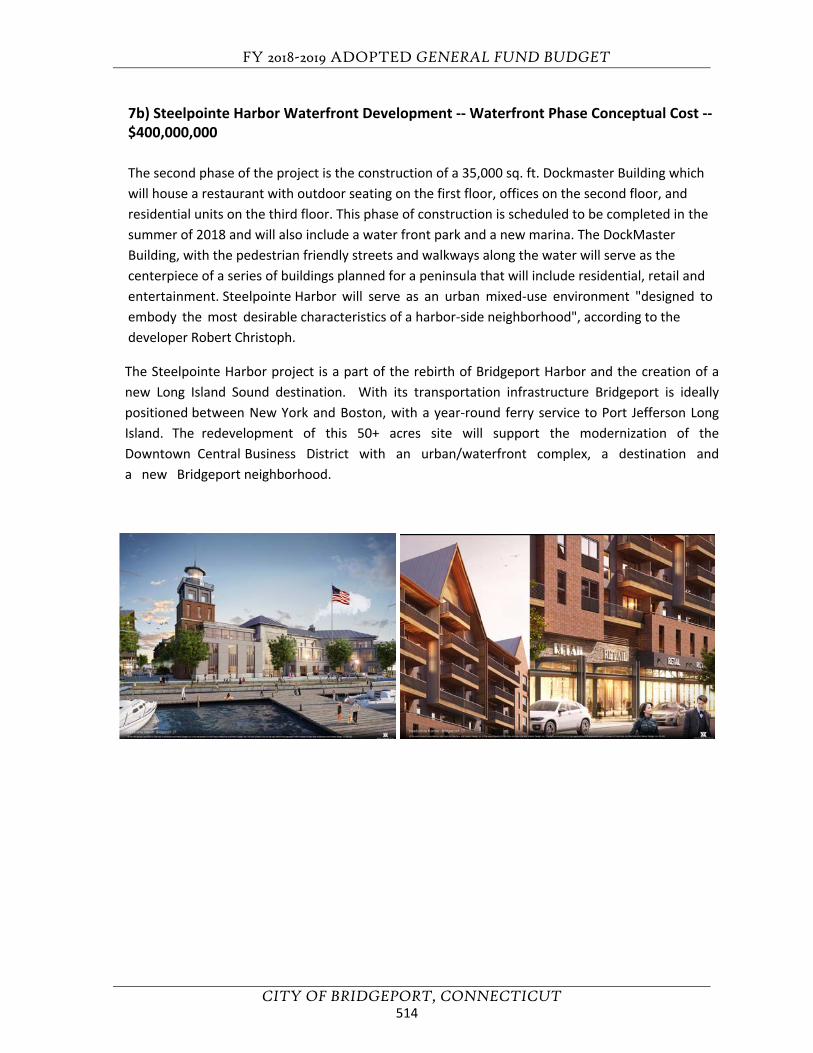
FY 2018-2019 ADOPTED GENERAL FUND BUDGET
CITY OF BRIDGEPORT, CONNECTICUT
7b) Steelpointe Harbor Waterfront Development -- Waterfront Phase Conceptual Cost -- $400,000,000
The second phase of the project is the construction of a 35,000 sq. ft. Dockmaster Building which will house a restaurant with outdoor seating on the first floor, offices on the second floor, and residential units on the third floor. This phase of construction is scheduled to be completed in the summer of 2018 and will also include a water front park and a new marina. The DockMaster Building, with the pedestrian friendly streets and walkways along the water will serve as the centerpiece of a series of buildings planned for a peninsula that will include residential, retail and entertainment. Steelpointe Harbor will serve as an urban mixed-use environment "designed to embody the most desirable characteristics of a harbor-side neighborhood", according to the developer Robert Christoph.
The Steelpointe Harbor project is a part of the rebirth of Bridgeport Harbor and the creation of a new Long Island Sound destination. With its transportation infrastructure Bridgeport is ideally positioned between New York and Boston, with a year-round ferry service to Port Jefferson Long Island. The redevelopment of this 50+ acres site will support the modernization of the Downtown Central Business District with an urban/waterfront complex, a destination and a new Bridgeport neighborhood.
514
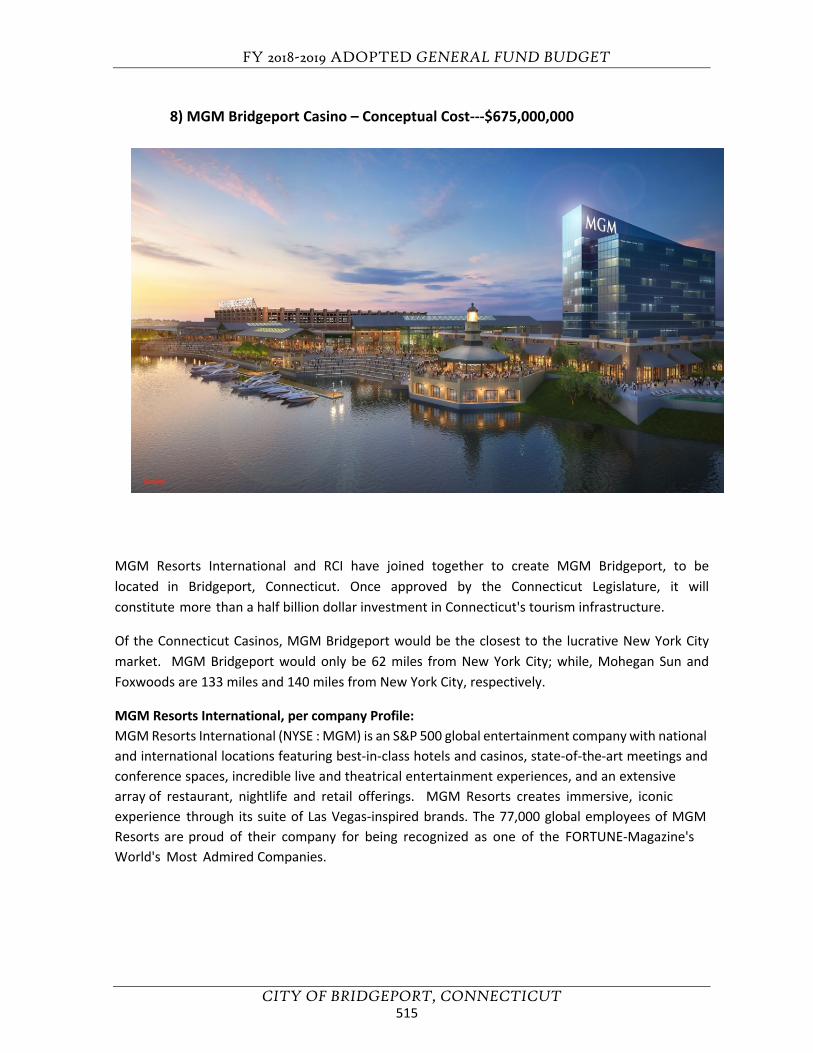
FY 2018-2019 ADOPTED GENERAL FUND BUDGET
CITY OF BRIDGEPORT, CONNECTICUT
MGM Resorts International and RCI have joined together to create MGM Bridgeport, to be located in Bridgeport, Connecticut. Once approved by the Connecticut Legislature, it will constitute more than a half billion dollar investment in Connecticut's tourism infrastructure.
Of the Connecticut Casinos, MGM Bridgeport would be the closest to the lucrative New York City market. MGM Bridgeport would only be 62 miles from New York City; while, Mohegan Sun and Foxwoods are 133 miles and 140 miles from New York City, respectively.
MGM Resorts International, per company Profile: MGM Resorts International (NYSE : MGM) is an S&P 500 global entertainment company with national and international locations featuring best-in-class hotels and casinos, state-of-the-art meetings and conference spaces, incredible live and theatrical entertainment experiences, and an extensive array of restaurant, nightlife and retail offerings. MGM Resorts creates immersive, iconic experience through its suite of Las Vegas-inspired brands. The 77,000 global employees of MGM Resorts are proud of their company for being recognized as one of the FORTUNE-Magazine's World's Most Admired Companies.
8) MGM Bridgeport Casino – Conceptual Cost---$675,000,000
515
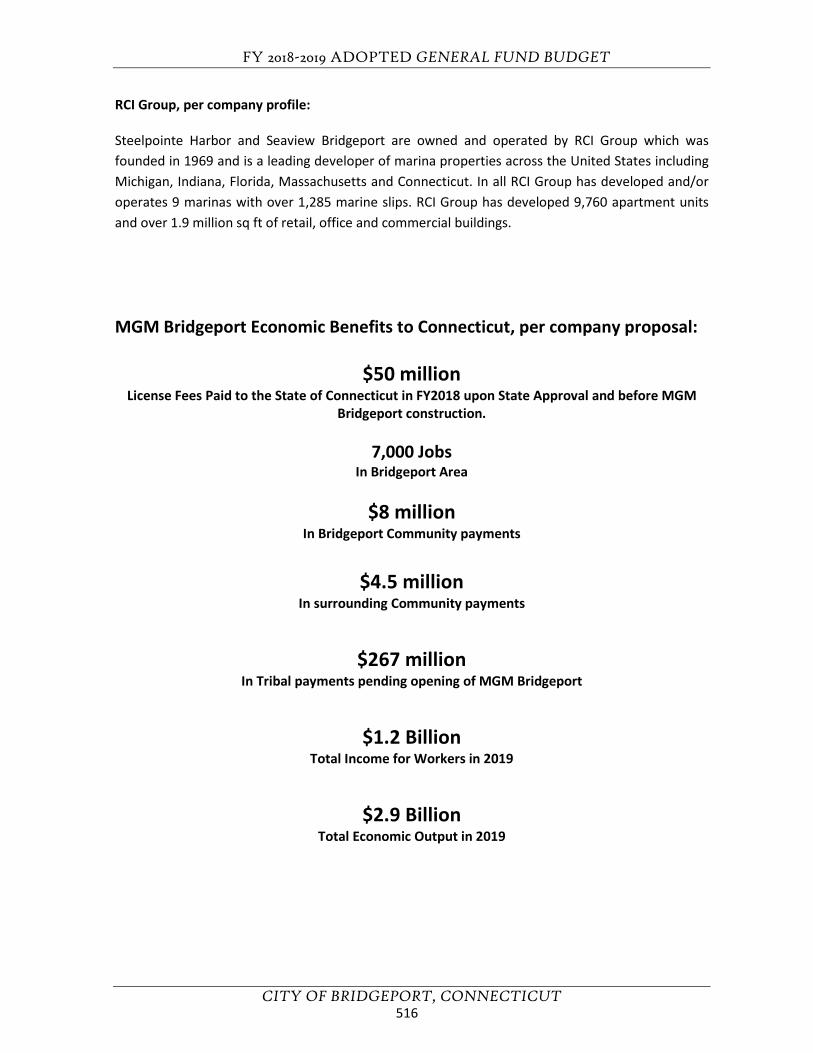
FY 2018-2019 ADOPTED GENERAL FUND BUDGET
CITY OF BRIDGEPORT, CONNECTICUT
RCI Group, per company profile:
Steelpointe Harbor and Seaview Bridgeport are owned and operated by RCI Group which was founded in 1969 and is a leading developer of marina properties across the United States including Michigan, Indiana, Florida, Massachusetts and Connecticut. In all RCI Group has developed and/or operates 9 marinas with over 1,285 marine slips. RCI Group has developed 9,760 apartment units and over 1.9 million sq ft of retail, office and commercial buildings.
MGM Bridgeport Economic Benefits to Connecticut, per company proposal:
$50 million License Fees Paid to the State of Connecticut in FY2018 upon State Approval and before MGM
Bridgeport construction.
7,000 Jobs In Bridgeport Area
$8 million In Bridgeport Community payments
$4.5 million In surrounding Community payments
$267 million In Tribal payments pending opening of MGM Bridgeport
$1.2 Billion Total Income for Workers in 2019
$2.9 Billion Total Economic Output in 2019
516
FY 2018-2019 ADOPTED GENERAL FUND BUDGET
CITY OF BRIDGEPORT, CONNECTICUT
MGM Bridgeport proposed projects:
Multiple Dining Options
60,860 sq ft Restaurant and Lounge Offerings 5 Fine Dining/casual Restaurants ( 1,200 indoor and outdoor Seats) 6 Bar/Lounge Outlets (412 Seats)
Live Entertainment Offerings
20,000 sq ft Entertainment Venue Flex Meeting Space 700 Seat Theater
Unique Retail Offerings
30,000 sq ft Pedestrian Designed Retail Space Popular Brand Offerings Boardwalk Retail
Hotel Accommodations
300 Guest Rooms MGM Brand Standards Pool/Spa/Fitness
World Class Casino Floor
100,000 sq ft Casino Area 2,000 Slot Machines 160 Table Games
517
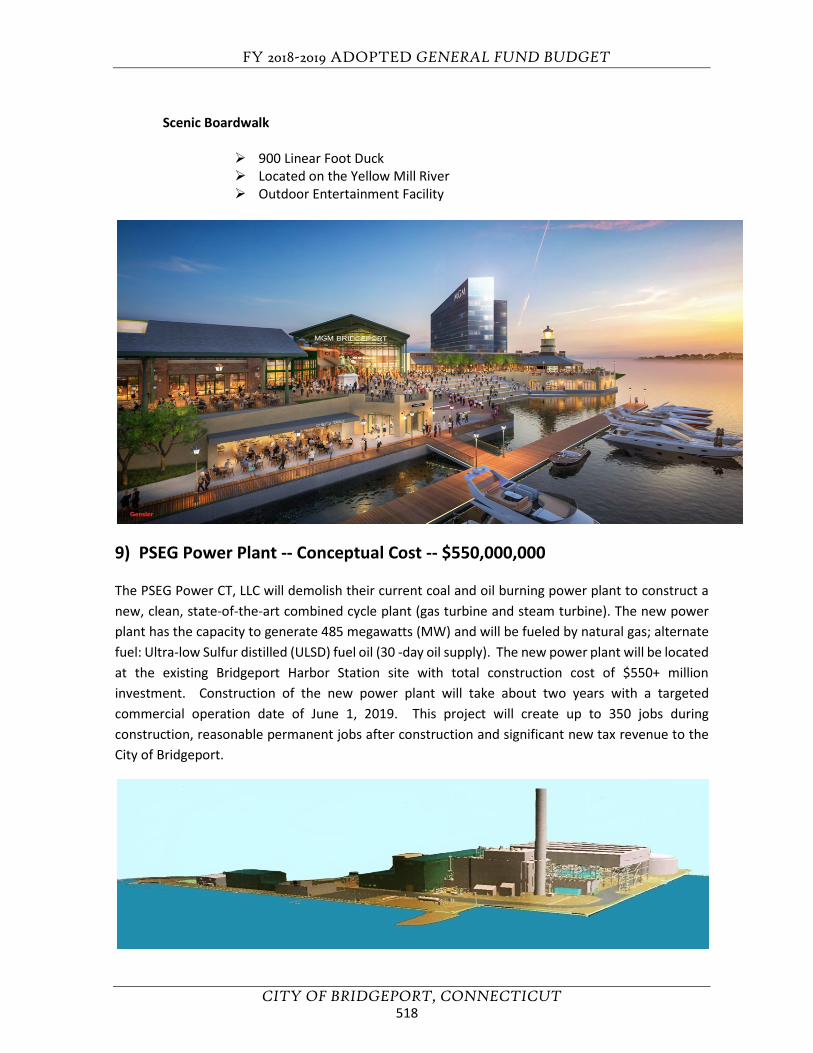
FY 2018-2019 ADOPTED GENERAL FUND BUDGET
CITY OF BRIDGEPORT, CONNECTICUT
Scenic Boardwalk
900 Linear Foot Duck Located on the Yellow Mill River Outdoor Entertainment Facility
9) PSEG Power Plant -- Conceptual Cost -- $550,000,000
The PSEG Power CT, LLC will demolish their current coal and oil burning power plant to construct a new, clean, state-of-the-art combined cycle plant (gas turbine and steam turbine). The new power plant has the capacity to generate 485 megawatts (MW) and will be fueled by natural gas; alternate fuel: Ultra-low Sulfur distilled (ULSD) fuel oil (30 -day oil supply). The new power plant will be located at the existing Bridgeport Harbor Station site with total construction cost of $550+ million investment. Construction of the new power plant will take about two years with a targeted commercial operation date of June 1, 2019. This project will create up to 350 jobs during construction, reasonable permanent jobs after construction and significant new tax revenue to the City of Bridgeport.
518
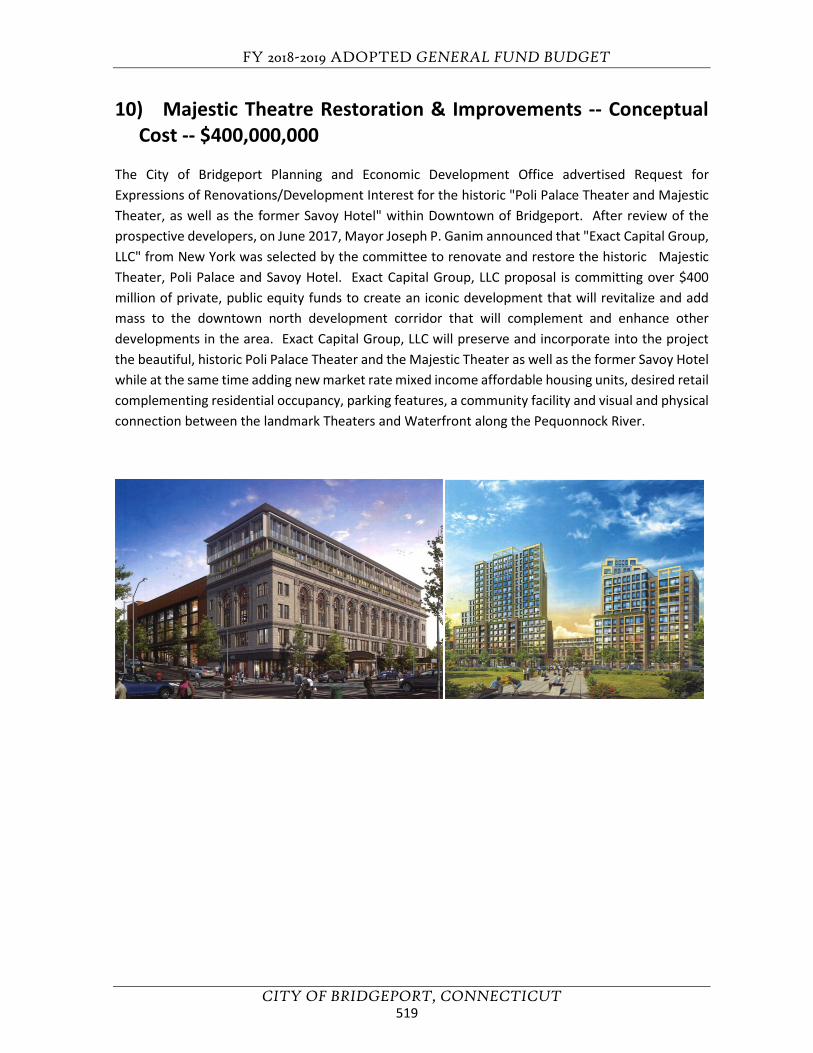
FY 2018-2019 ADOPTED GENERAL FUND BUDGET
CITY OF BRIDGEPORT, CONNECTICUT
10) Majestic Theatre Restoration & Improvements -- ConceptualCost -- $400,000,000
The City of Bridgeport Planning and Economic Development Office advertised Request for Expressions of Renovations/Development Interest for the historic "Poli Palace Theater and Majestic Theater, as well as the former Savoy Hotel" within Downtown of Bridgeport. After review of the prospective developers, on June 2017, Mayor Joseph P. Ganim announced that "Exact Capital Group, LLC" from New York was selected by the committee to renovate and restore the historic Majestic Theater, Poli Palace and Savoy Hotel. Exact Capital Group, LLC proposal is committing over $400 million of private, public equity funds to create an iconic development that will revitalize and add mass to the downtown north development corridor that will complement and enhance other developments in the area. Exact Capital Group, LLC will preserve and incorporate into the project the beautiful, historic Poli Palace Theater and the Majestic Theater as well as the former Savoy Hotel while at the same time adding new market rate mixed income affordable housing units, desired retail complementing residential occupancy, parking features, a community facility and visual and physical connection between the landmark Theaters and Waterfront along the Pequonnock River.
519
FY 2018-2019 ADOPTED GENERAL FUND BUDGET
CITY OF BRIDGEPORT, CONNECTICUT
The historic building at 177-189 State Street collectively features 32 one- and two-bedroom units, many of which overlook the city’s McLevy Green. In addition to providing beautiful views of the park and the city throughout the year, every unit features oversized windows that let in plenty of natural sunlight throughout the interior of each space. Each unit includes a washer and dryer, air-conditioner, dishwasher, stainless steel appliances and granite counter-tops. Harlan Has German-style beer hall was built at the historic site of People’s Bank at 155 State St. The 7,000-square-footspace incorporates many historical elements, including a curved teller bank wall. The menu features traditional Bavarian dishes such as sausages, sauerkraut, schnitzel, soft pretzels and linzer torte as well as American favorites including burgers, fries, salads and sandwiches. Designed as a social environment where people can gather, the restaurant features communal, long picnic and high-top tables. Owned by Stephen Lewandowski who owns Harlan Social in Stamford and Harlan Publick in Norwalk. Stress Factory Comedy Club was constructed at the former Playhouse on the Green, located at 167 State St. Owned by Vinnie Brand, the Stress Factory has been entertaining in New Jersey for more than 20 years; this will be The Stress Factory’s second location and only in Connecticut. The club attracts some of the top comedians from around the country.
11) Forstone Apartments | Beer Hall | Comedy Club – Conceptual Cost --$18,000,000
520
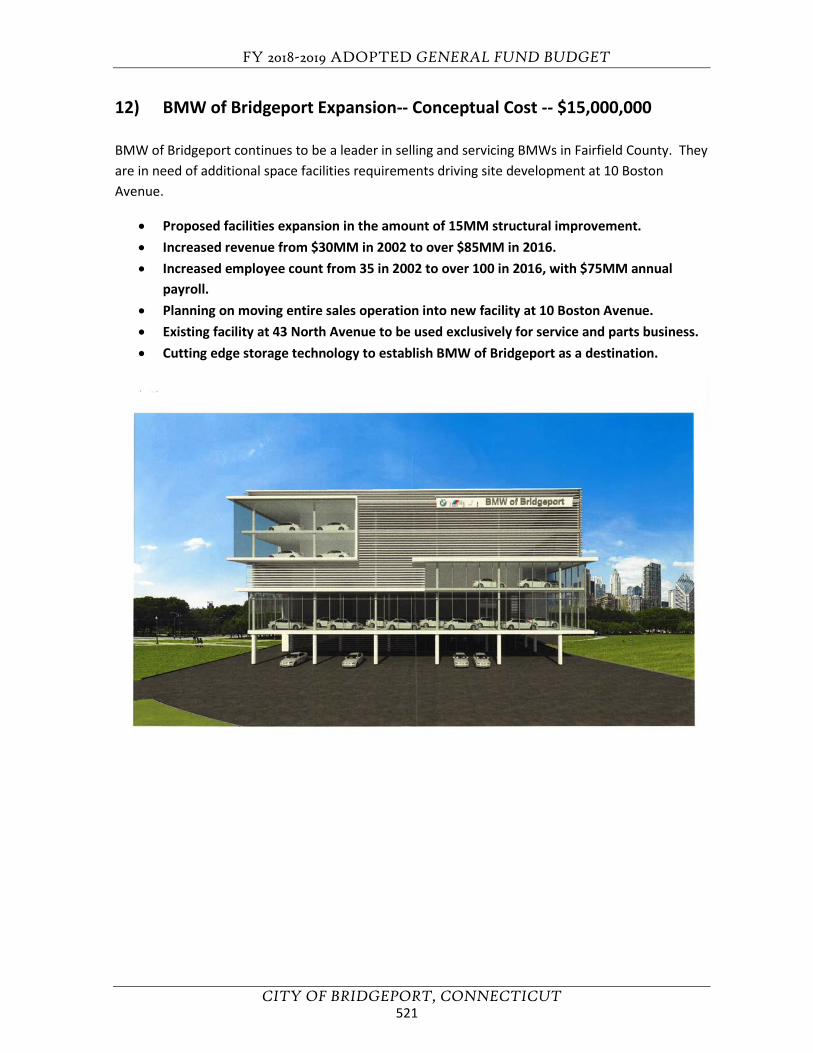
FY 2018-2019 ADOPTED GENERAL FUND BUDGET
CITY OF BRIDGEPORT, CONNECTICUT
12) BMW of Bridgeport Expansion-- Conceptual Cost -- $15,000,000
BMW of Bridgeport continues to be a leader in selling and servicing BMWs in Fairfield County. They are in need of additional space facilities requirements driving site development at 10 Boston Avenue.
• Proposed facilities expansion in the amount of 15MM structural improvement.• Increased revenue from $30MM in 2002 to over $85MM in 2016.• Increased employee count from 35 in 2002 to over 100 in 2016, with $75MM annual
payroll.• Planning on moving entire sales operation into new facility at 10 Boston Avenue.• Existing facility at 43 North Avenue to be used exclusively for service and parts business.• Cutting edge storage technology to establish BMW of Bridgeport as a destination.
521
FY 2018-2019 ADOPTED GENERAL FUND BUDGET
CITY OF BRIDGEPORT, CONNECTICUT
This page left blank intentionally.
522
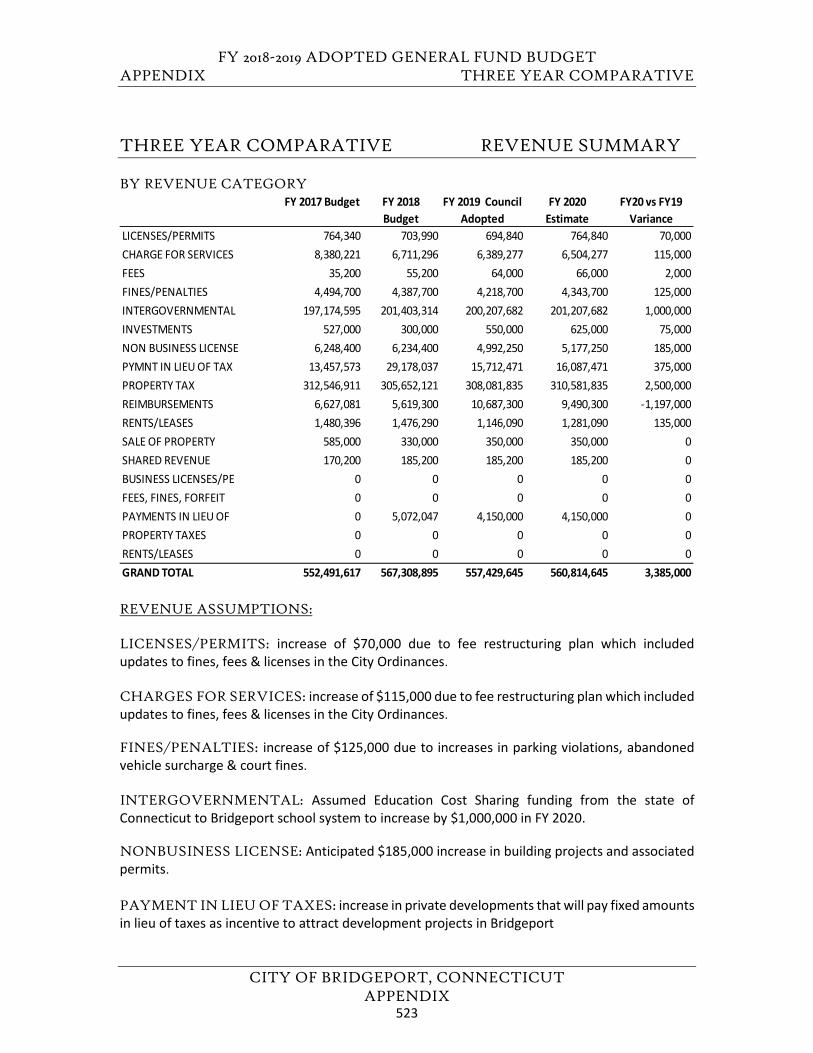
FY 2018-2019 ADOPTED GENERAL FUND BUDGET APPENDIX THREE YEAR COMPARATIVE
CITY OF BRIDGEPORT, CONNECTICUT APPENDIX
THREE YEAR COMPARATIVE REVENUE SUMMARY BY REVENUE CATEGORY
REVENUE ASSUMPTIONS: LICENSES/PERMITS: increase of $70,000 due to fee restructuring plan which included updates to fines, fees & licenses in the City Ordinances. CHARGES FOR SERVICES: increase of $115,000 due to fee restructuring plan which included updates to fines, fees & licenses in the City Ordinances. FINES/PENALTIES: increase of $125,000 due to increases in parking violations, abandoned vehicle surcharge & court fines. INTERGOVERNMENTAL: Assumed Education Cost Sharing funding from the state of Connecticut to Bridgeport school system to increase by $1,000,000 in FY 2020. NONBUSINESS LICENSE: Anticipated $185,000 increase in building projects and associated permits. PAYMENT IN LIEU OF TAXES: increase in private developments that will pay fixed amounts in lieu of taxes as incentive to attract development projects in Bridgeport
FY 2017 Budget FY 2018 Budget
FY 2019 Council Adopted
FY 2020 Estimate
FY20 vs FY19 Variance
LICENSES/PERMITS 764,340 703,990 694,840 764,840 70,000CHARGE FOR SERVICES 8,380,221 6,711,296 6,389,277 6,504,277 115,000FEES 35,200 55,200 64,000 66,000 2,000FINES/PENALTIES 4,494,700 4,387,700 4,218,700 4,343,700 125,000INTERGOVERNMENTAL 197,174,595 201,403,314 200,207,682 201,207,682 1,000,000INVESTMENTS 527,000 300,000 550,000 625,000 75,000NON BUSINESS LICENSE 6,248,400 6,234,400 4,992,250 5,177,250 185,000PYMNT IN LIEU OF TAX 13,457,573 29,178,037 15,712,471 16,087,471 375,000PROPERTY TAX 312,546,911 305,652,121 308,081,835 310,581,835 2,500,000REIMBURSEMENTS 6,627,081 5,619,300 10,687,300 9,490,300 -1,197,000RENTS/LEASES 1,480,396 1,476,290 1,146,090 1,281,090 135,000SALE OF PROPERTY 585,000 330,000 350,000 350,000 0SHARED REVENUE 170,200 185,200 185,200 185,200 0BUSINESS LICENSES/PE 0 0 0 0 0FEES, FINES, FORFEIT 0 0 0 0 0PAYMENTS IN LIEU OF 0 5,072,047 4,150,000 4,150,000 0PROPERTY TAXES 0 0 0 0 0RENTS/LEASES 0 0 0 0 0GRAND TOTAL 552,491,617 567,308,895 557,429,645 560,814,645 3,385,000
523
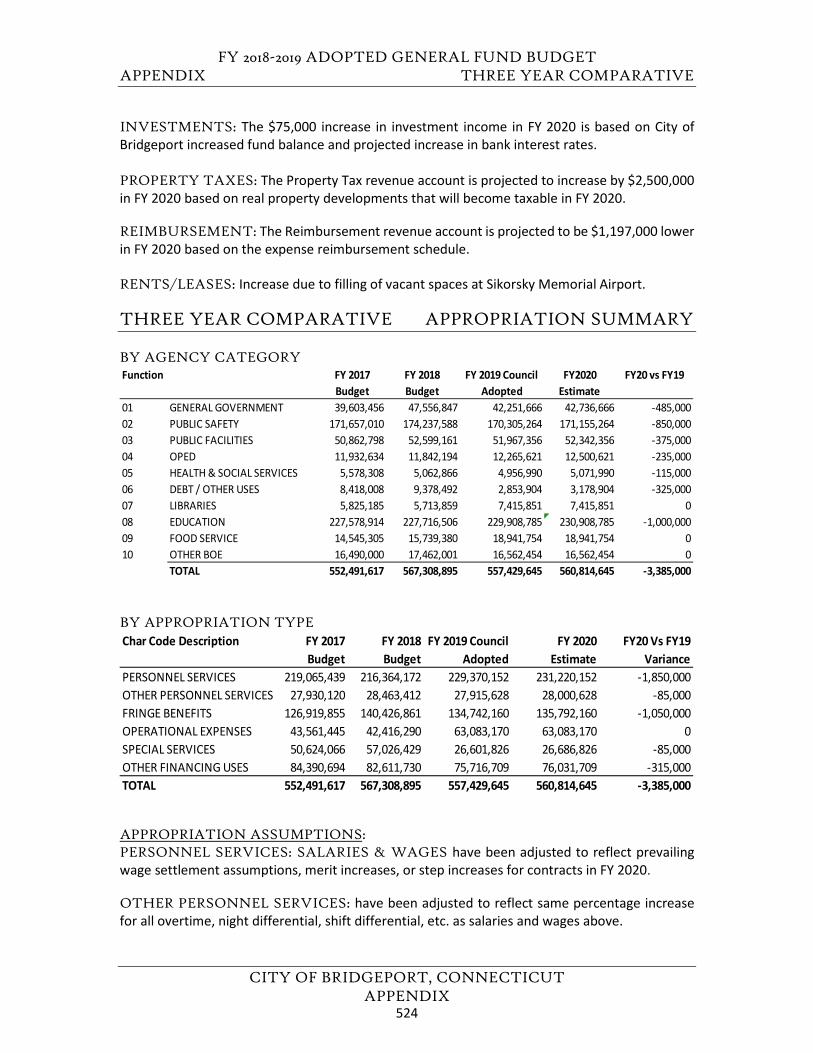
FY 2018-2019 ADOPTED GENERAL FUND BUDGET APPENDIX THREE YEAR COMPARATIVE
CITY OF BRIDGEPORT, CONNECTICUT APPENDIX
INVESTMENTS: The $75,000 increase in investment income in FY 2020 is based on City of Bridgeport increased fund balance and projected increase in bank interest rates. PROPERTY TAXES: The Property Tax revenue account is projected to increase by $2,500,000 in FY 2020 based on real property developments that will become taxable in FY 2020. REIMBURSEMENT: The Reimbursement revenue account is projected to be $1,197,000 lower in FY 2020 based on the expense reimbursement schedule. RENTS/LEASES: Increase due to filling of vacant spaces at Sikorsky Memorial Airport. THREE YEAR COMPARATIVE APPROPRIATION SUMMARY BY AGENCY CATEGORY
BY APPROPRIATION TYPE
APPROPRIATION ASSUMPTIONS: PERSONNEL SERVICES: SALARIES & WAGES have been adjusted to reflect prevailing wage settlement assumptions, merit increases, or step increases for contracts in FY 2020. OTHER PERSONNEL SERVICES: have been adjusted to reflect same percentage increase for all overtime, night differential, shift differential, etc. as salaries and wages above.
Function FY 2017 Budget
FY 2018 Budget
FY 2019 Council Adopted
FY2020 Estimate
FY20 vs FY19
01 GENERAL GOVERNMENT 39,603,456 47,556,847 42,251,666 42,736,666 -485,00002 PUBLIC SAFETY 171,657,010 174,237,588 170,305,264 171,155,264 -850,00003 PUBLIC FACILITIES 50,862,798 52,599,161 51,967,356 52,342,356 -375,00004 OPED 11,932,634 11,842,194 12,265,621 12,500,621 -235,00005 HEALTH & SOCIAL SERVICES 5,578,308 5,062,866 4,956,990 5,071,990 -115,00006 DEBT / OTHER USES 8,418,008 9,378,492 2,853,904 3,178,904 -325,00007 LIBRARIES 5,825,185 5,713,859 7,415,851 7,415,851 008 EDUCATION 227,578,914 227,716,506 229,908,785 230,908,785 -1,000,00009 FOOD SERVICE 14,545,305 15,739,380 18,941,754 18,941,754 010 OTHER BOE 16,490,000 17,462,001 16,562,454 16,562,454 0
TOTAL 552,491,617 567,308,895 557,429,645 560,814,645 -3,385,000
Char Code Description FY 2017 Budget
FY 2018 Budget
FY 2019 Council Adopted
FY 2020 Estimate
FY20 Vs FY19 Variance
PERSONNEL SERVICES 219,065,439 216,364,172 229,370,152 231,220,152 -1,850,000OTHER PERSONNEL SERVICES 27,930,120 28,463,412 27,915,628 28,000,628 -85,000FRINGE BENEFITS 126,919,855 140,426,861 134,742,160 135,792,160 -1,050,000OPERATIONAL EXPENSES 43,561,445 42,416,290 63,083,170 63,083,170 0SPECIAL SERVICES 50,624,066 57,026,429 26,601,826 26,686,826 -85,000OTHER FINANCING USES 84,390,694 82,611,730 75,716,709 76,031,709 -315,000TOTAL 552,491,617 567,308,895 557,429,645 560,814,645 -3,385,000
524
FY 2018-2019 ADOPTED GENERAL FUND BUDGET APPENDIX THREE YEAR COMPARATIVE
CITY OF BRIDGEPORT, CONNECTICUT APPENDIX
FRINGE BENEFITS: Although the budget will be determined through an audit or actuary evaluation, health benefits have been estimated to increase by $1,050,000 based on administrative estimates. OPERATIONAL EXPENSES: No change, the city will contain operating expenses in the 2018 budget. SPECIAL SERVICES: Majority of this increase is to reflect management of cost of living increases by the City. OTHER FINANCING USES: Majority of this increase is full funding of budgetary reserves and fiduciary obligations and anticipated debt.
525
FY 2018-2019 ADOPTED GENERAL FUND BUDGET
CITY OF BRIDGEPORT, CONNECTICUT APPENDIX
This page left blank intentionally.
526
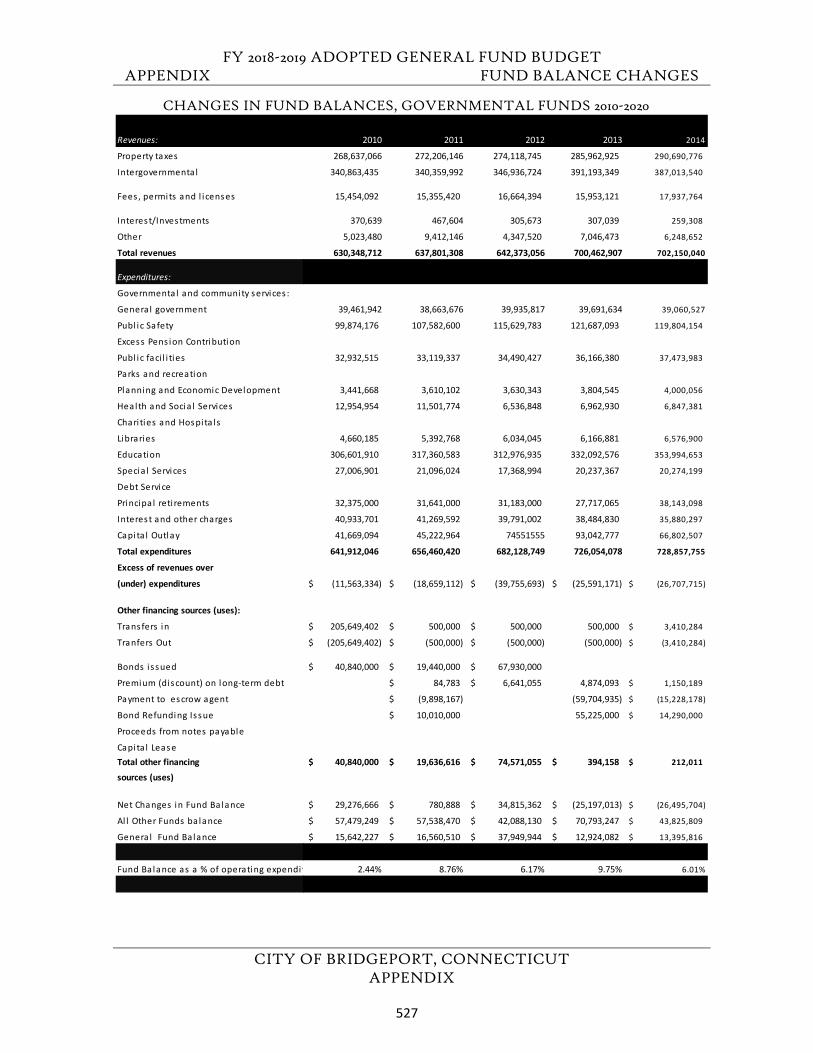
FY 2018-2019 ADOPTED GENERAL FUND BUDGET APPENDIX FUND BALANCE CHANGES
CITY OF BRIDGEPORT, CONNECTICUT APPENDIX
CHANGES IN FUND BALANCES, GOVERNMENTAL FUNDS 2010-2020
Revenues: 2010 2011 2012 2013 2014
Property taxes 268,637,066 272,206,146 274,118,745 285,962,925 290,690,776
Intergovernmenta l 340,863,435 340,359,992 346,936,724 391,193,349 387,013,540
Fees , permits and l i censes 15,454,092 15,355,420 16,664,394 15,953,121 17,937,764
Interest/Investments 370,639 467,604 305,673 307,039 259,308
Other 5,023,480 9,412,146 4,347,520 7,046,473 6,248,652
Total revenues 630,348,712 637,801,308 642,373,056 700,462,907 702,150,040
Expenditures:
Governmenta l and community services :
Genera l government 39,461,942 38,663,676 39,935,817 39,691,634 39,060,527
Publ ic Safety 99,874,176 107,582,600 115,629,783 121,687,093 119,804,154
Excess Pens ion Contribution
Publ ic faci l i ties 32,932,515 33,119,337 34,490,427 36,166,380 37,473,983
Parks and recreation
Planning and Economic Development 3,441,668 3,610,102 3,630,343 3,804,545 4,000,056
Heal th and Socia l Services 12,954,954 11,501,774 6,536,848 6,962,930 6,847,381
Chari ties and Hospi ta ls
Libraries 4,660,185 5,392,768 6,034,045 6,166,881 6,576,900
Education 306,601,910 317,360,583 312,976,935 332,092,576 353,994,653
Specia l Services 27,006,901 21,096,024 17,368,994 20,237,367 20,274,199
Debt Service
Principa l reti rements 32,375,000 31,641,000 31,183,000 27,717,065 38,143,098
Interest and other charges 40,933,701 41,269,592 39,791,002 38,484,830 35,880,297
Capi ta l Outlay 41,669,094 45,222,964 74551555 93,042,777 66,802,507
Total expenditures 641,912,046 656,460,420 682,128,749 726,054,078 728,857,755
Excess of revenues over
(under) expenditures (11,563,334)$ (18,659,112)$ (39,755,693)$ (25,591,171)$ (26,707,715)$
Other financing sources (uses):
Transfers in 205,649,402$ 500,000$ 500,000$ 500,000 3,410,284$
Tranfers Out (205,649,402)$ (500,000)$ (500,000)$ (500,000) (3,410,284)$
Bonds i ssued 40,840,000$ 19,440,000$ 67,930,000$
Premium (discount) on long-term debt 84,783$ 6,641,055$ 4,874,093 1,150,189$
Payment to escrow agent (9,898,167)$ (59,704,935) (15,228,178)$
Bond Refunding Issue 10,010,000$ 55,225,000 14,290,000$
Proceeds from notes payable
Capita l LeaseTotal other financing 40,840,000$ 19,636,616$ 74,571,055$ 394,158$ 212,011$
sources (uses)
Net Changes in Fund Balance 29,276,666$ 780,888$ 34,815,362$ (25,197,013)$ (26,495,704)$
Al l Other Funds ba lance 57,479,249$ 57,538,470$ 42,088,130$ 70,793,247$ 43,825,809$
Genera l Fund Balance 15,642,227$ 16,560,510$ 37,949,944$ 12,924,082$ 13,395,816$
Fund Ba lance as a % of operating expendit 2.44% 8.76% 6.17% 9.75% 6.01%
527
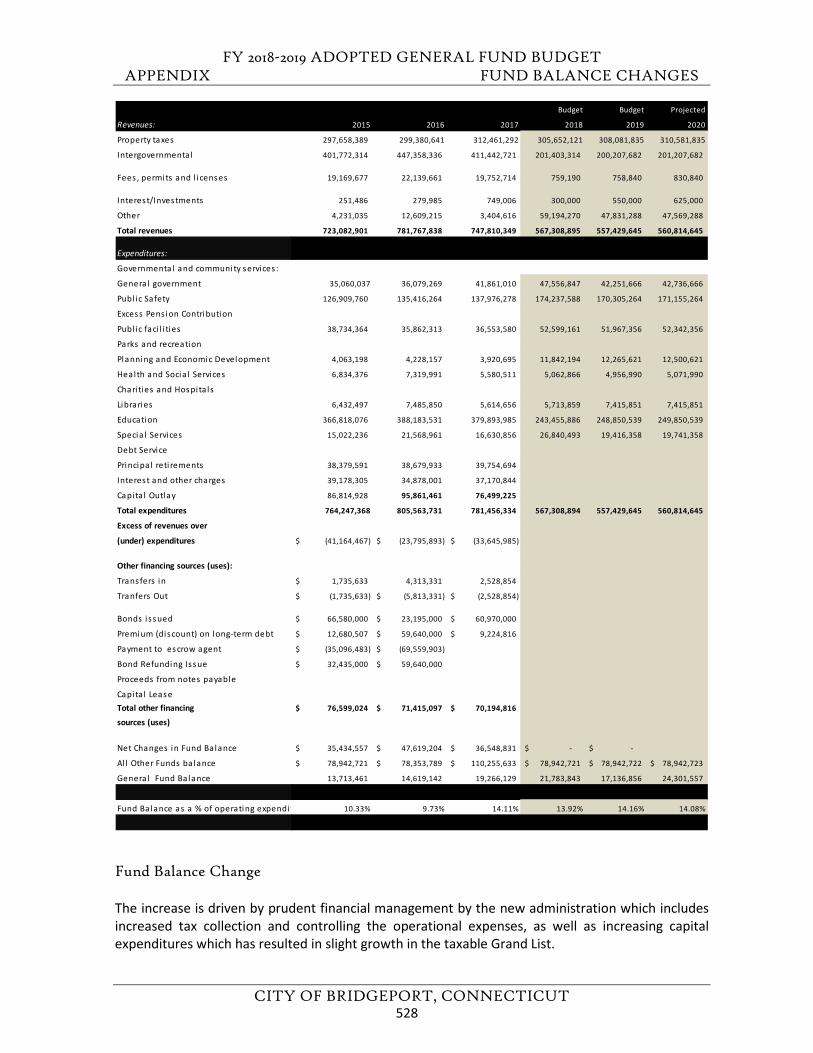
FY 2018-2019 ADOPTED GENERAL FUND BUDGET APPENDIX FUND BALANCE CHANGES
CITY OF BRIDGEPORT, CONNECTICUT
Fund Balance Change The increase is driven by prudent financial management by the new administration which includes increased tax collection and controlling the operational expenses, as well as increasing capital expenditures which has resulted in slight growth in the taxable Grand List.
Budget Budget Projected
Revenues: 2015 2016 2017 2018 2019 2020
Property taxes 297,658,389 299,380,641 312,461,292 305,652,121 308,081,835 310,581,835
Intergovernmenta l 401,772,314 447,358,336 411,442,721 201,403,314 200,207,682 201,207,682
Fees , permits and l i censes 19,169,677 22,139,661 19,752,714 759,190 758,840 830,840
Interest/Investments 251,486 279,985 749,006 300,000 550,000 625,000
Other 4,231,035 12,609,215 3,404,616 59,194,270 47,831,288 47,569,288
Total revenues 723,082,901 781,767,838 747,810,349 567,308,895 557,429,645 560,814,645
Expenditures:
Governmenta l and community services :
Genera l government 35,060,037 36,079,269 41,861,010 47,556,847 42,251,666 42,736,666
Publ ic Safety 126,909,760 135,416,264 137,976,278 174,237,588 170,305,264 171,155,264
Excess Pens ion Contribution
Publ ic faci l i ties 38,734,364 35,862,313 36,553,580 52,599,161 51,967,356 52,342,356
Parks and recreation
Planning and Economic Development 4,063,198 4,228,157 3,920,695 11,842,194 12,265,621 12,500,621
Heal th and Socia l Services 6,834,376 7,319,991 5,580,511 5,062,866 4,956,990 5,071,990
Chari ties and Hospi ta ls
Libraries 6,432,497 7,485,850 5,614,656 5,713,859 7,415,851 7,415,851
Education 366,818,076 388,183,531 379,893,985 243,455,886 248,850,539 249,850,539
Specia l Services 15,022,236 21,568,961 16,630,856 26,840,493 19,416,358 19,741,358
Debt Service
Principa l reti rements 38,379,591 38,679,933 39,754,694
Interest and other charges 39,178,305 34,878,001 37,170,844
Capi ta l Outlay 86,814,928 95,861,461 76,499,225
Total expenditures 764,247,368 805,563,731 781,456,334 567,308,894 557,429,645 560,814,645
Excess of revenues over
(under) expenditures (41,164,467)$ (23,795,893)$ (33,645,985)$
Other financing sources (uses):
Transfers in 1,735,633$ 4,313,331 2,528,854
Tranfers Out (1,735,633)$ (5,813,331)$ (2,528,854)$
Bonds i ssued 66,580,000$ 23,195,000$ 60,970,000$
Premium (discount) on long-term debt 12,680,507$ 59,640,000$ 9,224,816$
Payment to escrow agent (35,096,483)$ (69,559,903)$
Bond Refunding Issue 32,435,000$ 59,640,000$
Proceeds from notes payable
Capita l LeaseTotal other financing 76,599,024$ 71,415,097$ 70,194,816$
sources (uses)
Net Changes in Fund Balance 35,434,557$ 47,619,204$ 36,548,831$ -$ -$
Al l Other Funds ba lance 78,942,721$ 78,353,789$ 110,255,633$ 78,942,721$ 78,942,722$ 78,942,723$
Genera l Fund Balance 13,713,461 14,619,142 19,266,129 21,783,843 17,136,856 24,301,557
Fund Ba lance as a % of operating expendit 10.33% 9.73% 14.11% 13.92% 14.16% 14.08%
528
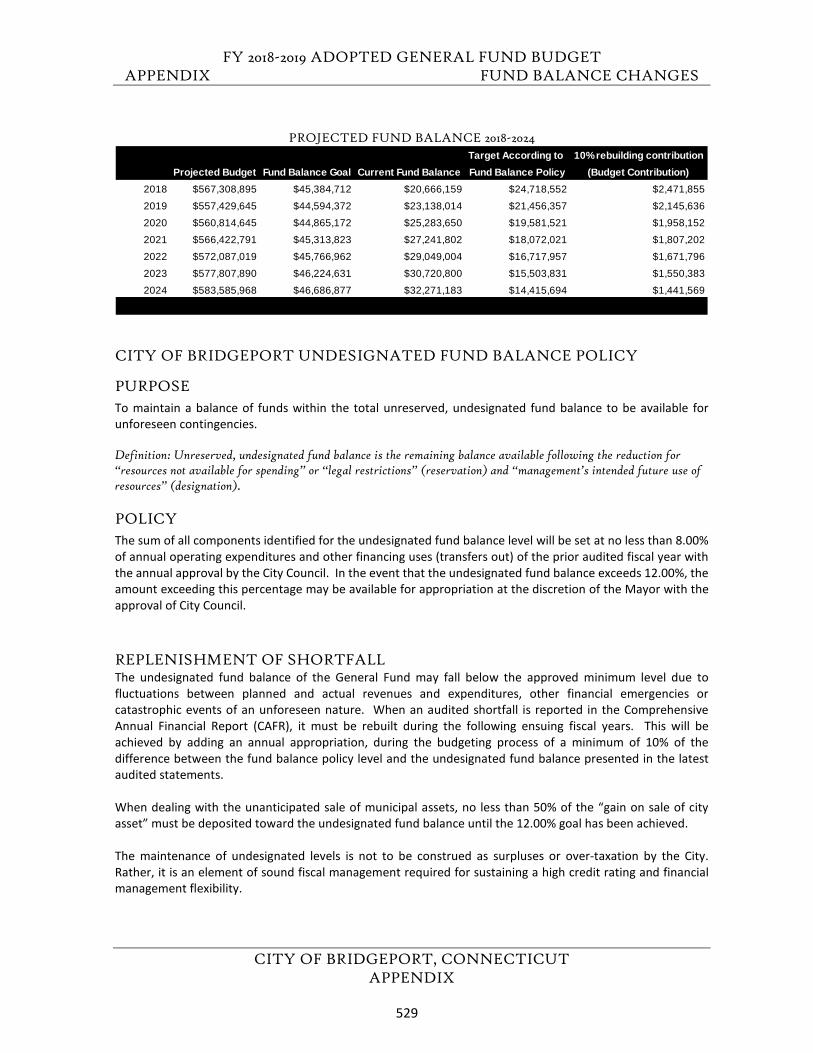
FY 2018-2019 ADOPTED GENERAL FUND BUDGET APPENDIX FUND BALANCE CHANGES
CITY OF BRIDGEPORT, CONNECTICUT APPENDIX
PROJECTED FUND BALANCE 2018-2024
CITY OF BRIDGEPORT UNDESIGNATED FUND BALANCE POLICY
PURPOSE To maintain a balance of funds within the total unreserved, undesignated fund balance to be available for unforeseen contingencies. Definition: Unreserved, undesignated fund balance is the remaining balance available following the reduction for “resources not available for spending” or “legal restrictions” (reservation) and “management’s intended future use of resources” (designation).
POLICY The sum of all components identified for the undesignated fund balance level will be set at no less than 8.00% of annual operating expenditures and other financing uses (transfers out) of the prior audited fiscal year with the annual approval by the City Council. In the event that the undesignated fund balance exceeds 12.00%, the amount exceeding this percentage may be available for appropriation at the discretion of the Mayor with the approval of City Council. REPLENISHMENT OF SHORTFALL The undesignated fund balance of the General Fund may fall below the approved minimum level due to fluctuations between planned and actual revenues and expenditures, other financial emergencies or catastrophic events of an unforeseen nature. When an audited shortfall is reported in the Comprehensive Annual Financial Report (CAFR), it must be rebuilt during the following ensuing fiscal years. This will be achieved by adding an annual appropriation, during the budgeting process of a minimum of 10% of the difference between the fund balance policy level and the undesignated fund balance presented in the latest audited statements. When dealing with the unanticipated sale of municipal assets, no less than 50% of the “gain on sale of city asset” must be deposited toward the undesignated fund balance until the 12.00% goal has been achieved. The maintenance of undesignated levels is not to be construed as surpluses or over-taxation by the City. Rather, it is an element of sound fiscal management required for sustaining a high credit rating and financial management flexibility.
Target According to 10% rebuilding contributionProjected Budget Fund Balance Goal Current Fund Balance Fund Balance Policy (Budget Contribution)
2018 $567,308,895 $45,384,712 $20,666,159 $24,718,552 $2,471,855
2019 $557,429,645 $44,594,372 $23,138,014 $21,456,357 $2,145,636
2020 $560,814,645 $44,865,172 $25,283,650 $19,581,521 $1,958,152
2021 $566,422,791 $45,313,823 $27,241,802 $18,072,021 $1,807,202
2022 $572,087,019 $45,766,962 $29,049,004 $16,717,957 $1,671,796
2023 $577,807,890 $46,224,631 $30,720,800 $15,503,831 $1,550,383
2024 $583,585,968 $46,686,877 $32,271,183 $14,415,694 $1,441,569
529

FY 2018-2019 ADOPTED GENERAL FUND BUDGET
CITY OF BRIDGEPORT, CONNECTICUT
This page left blank intentionally.
530
FY 2018-2019 ADOPTED GENERAL FUND BUDGET APPENDIX GLOSSARY
CITY OF BRIDGEPORT, CONNECTICUT
ACCOUNTING SYSTEM: A total set of records that are used to record, classify, and report information on the financial status and operation of an entity.
ADA: Americans with Disabilities Act. The ADA prohibits discrimination in all employment practices, including job application procedures, hiring, firing, advancement, compensation, training, and other terms, conditions, and privileges of employment. It applies to recruitment, advertising, tenure, layoff, leave, fringe benefits, and all other employment-related activities.
ADOPTED BUDGET: The budget for the ensuing fiscal year that has been approved by the City Council & the Mayor. AED: An automated external defibrillator is a portable electronic device that automatically diagnoses cardiac arrhythmias in patients and is able to treat them through defibrillation, which is the application of electrical therapy which stops the arrhythmia.
ALLOCATED COSTS (indirect cost rate): The concept of overhead budgeting is used primarily In Grant / Special Revenue Services and for Educational In-Kind reporting purposes. It is employed as a device to spread administrative costs to operating accounts in different funds to get a more accurate picture of true costs. Allocated costs can include both managerial and clerical salaries, as well as benefits, sick and annual leave, pensions and insurances of all the employees who work directly on a particular service or project.
AMACS: Information Technology requests filed when workers need their computers added, moved or changed. APPROPRIATION: A legal authorization granted by the City Council to make expenditures and to incur obligations for specific purposes. An appropriation usually is limited in amount and time it may be expended.
ASSESSED VALUE (TAXABLE): As used in this document represents the total taxable book value of property in the City for Municipal purposes only. It is established each year by the filing of the Grand List with the State of Connecticut by the City Assessor.
Asset: A resource with economic value that an individual or organization owns or controls with the expectation that it will provide future benefit.
ATTRITION: A reduction in the City’s workforces as a result of resignations, retirements and/or terminations.
AUDIT: A study of the City’s accounting system to ensure that financial records are accurate and in compliance with all legal requirements for handling of public funds, including those set forth by state law & City Charter.
AZA: Association of Zoos and Aquariums.
BALANCED BUDGET: a budget projected wherein the projected expenditures are equal to the projected revenues. The Charter of the City of Bridgeport mandates a balanced budget.
BERC: The Bridgeport Economic Resource Center. BERC provides assistance and information to businesses wishing to relocate to or expand within the Greater Bridgeport, Connecticut area.
531
FY 2018-2019 ADOPTED GENERAL FUND BUDGET APPENDIX GLOSSARY
CITY OF BRIDGEPORT, CONNECTICUT
BERC is a privately funded, non-profit organization created by a partnership of Greater Bridgeport businesses, utilities, institutions, city and state government.
BOE: Board of Education.
BOND: A written promise to pay a specific sum of money at a specified future date (maturity date) along with periodic interest paid at a specified percentage of the principal (interest rate). Bonds are used typically to manage long-term debt.
BOOTFINDER: The BootFinder, a hand-held device that looks like a radar gun and reads both moving and stationary license plates while searching for vehicles on which taxes are owed and those that are stolen. The BootFinder, named after the lock placed on the wheel of a scofflaw's car or truck, is connected to the city's motor vehicle tax records and its list of stolen vehicles and license plates. It is also attached to a laptop computer that alerts the user to ''a hit'' with an audio and visual signal.
BUDGET: A plan for the accomplishment of programs related to objectives and goals within a definite time period, including an estimate or resources required, together with an estimate of resources available.
BULKHEAD: A retaining wall or structure of timber, steel, or reinforced concrete, used for shore protection and in harbor works.
BUSINESS-TYPE ACTIVITES: provide the same type of services as a private entity, involve exchange relationships - that is, a fee is charged for services rendered and there is a direct relationship between the services provided and the fee charged for the services, and the entity is often a separate, legally constituted, self-sufficient organization although it may be subsidized by a government.
Capital: refers to financial assets or their financial value, as well as the tangible factors of production and facilities. CAFR: An acronym that stands for Comprehensive Annual Financial Report. The CAFR is the industry standard financial report for local governments. The City’s CAFR is recognized as meeting the highest possible level of reporting excellence and complies completely with GAAP.
CAMA: Computer assisted mass appraisal system, a computer system for the appraisal of real property, assessment administration and tax collection for a revaluation of property.
CAPITAL IMPROVEMENT PLAN (CIP): A plan for capital expenditures to be incurred each year over a five-year period setting forth each capital project, the duration of the project, and the amount to be expended in each year of financing those projects.
CATEGORY (OF REVENUE OR APPROPRIATIONS): Grouping of similar line items. Refer to Budget Summary, Categorical Descriptions.
CBD: Central Business District.
CBO: Community Based Organizations CERT: Community Emergency Response Team
CCTV: Closed circuit television. CCTV is the use of video cameras to transmit signals to a specific set of monitors. Often used for surveillance in areas where security is critical, such as banks, casinos, airports and other public spaces.
532
FY 2018-2019 ADOPTED GENERAL FUND BUDGET APPENDIX GLOSSARY
CITY OF BRIDGEPORT, CONNECTICUT
CDBG: Community Development Block Grant, a federal program that supports the development of housing and community projects.
City Charter: a legal document (charter) establishing a municipality such as a city or town. City Council: The City Council is the Legislative branch of government of the City of Bridgeport. Two major responsibilities of the council are enacting ordinances necessary to ensure the welfare and good order of the city, and, adopting the city's annual budget. COBRA: An acronym that stands for Consolidated Omnibus Budget Reconciliation Act, which provides certain former employees, retirees, spouses, former spouses, and dependent children the right to temporary continuation of health coverage at group rates. This coverage, however, is only available when coverage is lost due to certain specific events. Group health coverage for COBRA participants is usually more expensive than health coverage for active employees, since usually the employer pays a part of the premium for active employees while COBRA participants generally pay the entire premium themselves. It is ordinarily less expensive, though, than individual health coverage. See http://www.dol.gov/ebsa/faqs/faq_consumer_cobra.HTML for more information on the program.
CPPB: Certified Professional Public Buyer.
CRRA: Connecticut Resources Recovery Authority, the quasi-public agency that manages the municipal waste and recycling for the State of Connecticut.
CRS: Community Rating System. The National Flood Insurance Program's (NFIP) Community Rating System (CRS) is a voluntary incentive program that recognizes and encourages community floodplain management activities that exceed the minimum NFIP requirements. It is a program sponsored by the Federal Emergency Management Agency.
DEBT SERVICE: Principal and interest payment on bonds issued by the City to fund Capital and Other Projects. This includes debt service on past bond issues, as well as those anticipated in the current year of Capital Improvement Projects (C.I.P).
DECD: Department of Economic and Community Development.
DEEP: Department of Energy & Environmental Protection. DEP: Department of Environmental Protection.
DEPRECIATION: a decrease or loss in value.
DMV: Department of Motor Vehicles.
ECS: ECS or Education Cost Sharing, aims to equalize some of school funding disparities that municipalities with a large number of needy students encounter when trying to provide services. ECS provides grants based on a formula that multiplies three factors: (1) a base aid ratio of each town's wealth to a designated state guaranteed wealth level (GWL), (2) the foundation, and (3) the number of each town's resident students adjusted for educational and economic need (“need students”). A per-student bonus is added for towns that are part of regional school districts. (The Governor appointed a task force to re-visit the funding formula this year, and recommendations are outlined here: http://www.sde.ct.gov/sde/lib/sde/PDF/dgm/report1/ECSEntit.pdf
533
FY 2018-2019 ADOPTED GENERAL FUND BUDGET APPENDIX GLOSSARY
CITY OF BRIDGEPORT, CONNECTICUT
ENTERPRISE FUNDS: A fund established to account for operations that are financed and operated in a manner similar to private business enterprises. The intent is that the full cost of providing the goods or services be financed primarily through charges and fees thus removing the expenses from the tax rate.
EOC: Emergency Operations Center. A central location that serves as a center for coordination and control of emergency preparedness and response for the region.
EOC VEOCi: An emergency and crisis management platform to streamline emergency management team notifications and information sharing before, during and after incidents.
EPA: Environmental Protection Agency, a federal agency.
ESU: Emergency Services Unit. Similar to a SWAT Team, the ESU is a specially trained police unit that responds to critical incidents such as hostage situations.
EXPENDITURES: Total charges incurred for services received or assets purchased.
FEMA: Federal Emergency Management Agency.
FISCAL YEAR: a twelve-month period for which an organization plans the use of its funds. The City of Bridgeport’s fiscal year beings on July 1 and concludes on June 30.
FTA: Federal Transit Administration
FTE: An acronym that stands for full time equivalent. Employee counts represent the budgeted sum of permanent, temporary and part-time employees.
FUND BALANCE: Represents the undesignated fund balance or excess of current assets over liabilities available for use along with current revenues to fund the various operating budgets.
FUND: A fiscal and accounting entity with a self-balancing set of accounts in which cash and other financial resources, all related liabilities and residual entities, or balances (and changes therein) are recorded and segregated to carry on specific activities or attain certain objectives in accordance with specific regulations, restrictions or limitations.
FUND STRUCTURE: The City’s accounting system is organized and operated on the basis of funds or account groups, each of which is a separate accounting entity. Each fund is accounted for with a set of self-balancing accounts comprised of assets, liabilities, fund equity, revenues and expenditures or expenses, as appropriate. The three broad categories are GOVERNMENTAL FUNDS, PROPRIETARY FUNDS, and FIDUCIARY FUNDS. They are covered briefly here, and in greater detail in the budget summary, page 26 of this document. GIS: Geographic Information System
GOVERNMENTAL FUNDS: THE GENERAL FUND is used to account for the major general operations of the City, except those required to be accounted for in a separate fund. SPECIAL REVENUE FUNDS are used to account for revenues dedicated for a specific purpose as prescribed by Federal or State program guidelines regarding their use.
534
FY 2018-2019 ADOPTED GENERAL FUND BUDGET APPENDIX GLOSSARY
CITY OF BRIDGEPORT, CONNECTICUT
DEBT SERVICE FUND is used for the accumulation of resources for, and the payment of, long term bonded debt.
CAPITAL PROJECT FUNDS are used to account for the proceeds of general obligation bonds and other financing resources for the planning, acquisition and construction or improvement of major capital facilities such as new schools and urban renewal projects. PROPRIETARY FUNDS: ENTERPRISE FUND Enterprise funds are used to account for the operations of activities that are financed and operated in a manner similar to a private business enterprise. INTERNAL SERVICE FUND: The City, by Ordinance, established an Internal Service Fund to account for self-insured health benefit activities of the City, Board of Education (BOE) and all other departments. Governmental Accounting Standards allow for the use of Internal Service Funds for risk financing activities. FIDUCIARY FUNDS: TRUST AND AGENCY FUNDS are used to account for resources held for the benefit of parties outside the government. The City of Bridgeport has four pension trust funds that support the pensions of City employees.
FY: An abbreviation for fiscal year, a twelve-month period for which an organization plans the use of its funds. The City of Bridgeport’s fiscal year beings on July 1 and concludes on June 30.
GAAP ACCOUNTING: Standards established by the Governmental Accounting Standards Board, which the City must comply with.
GASB: An acronym that stands for Government Accounting Standards Board. GASB established standards for state and local governmental accounting in which financial reporting results in useful information for users.
GENERAL FUND: The major municipally owned fund, which is created with City receipts and which is charged with expenditures payable from such revenues.
GFOA: Government Finance Officers Association
GIS: Geographic Information System or geospatial information system. Designed to capture, store, analyze and manage data and associated information that is geographically referenced, GIS allows users to visualize data on a map.
GOVERNMENT-TYPE ACTIVITIES: Those activities used to account for financial resources used in the day-to-day operations of the government.
GPS: Global Positioning System.
GRAND LIST: The assessed value of all taxable property in the City.
HAZWOPER: Hazardous Waste Operations and Emergency Response Standard
HDPE: High-density polyethylene, a type of plastic.
535
FY 2018-2019 ADOPTED GENERAL FUND BUDGET APPENDIX GLOSSARY
CITY OF BRIDGEPORT, CONNECTICUT
HDPE: High-density polyethylene (HDPE) or polyethylene high-density (PEHD) plastic is one of the most common plastics used in manufacturing, HDPE is known for its durability and strength. HUD: Housing and Urban Development Agency.
Inter-Governmental: activities relating to two or more governments.
INTERFUND TRANSFER: Payments from one administrative budget to another, which result in the recording of a receipt and an expenditure.
INTERNAL SERVICE FUNDS: Used to account for and finance the City’s risk of loss for Employee Benefits, Workers Compensation, and other liabilities.
ISO New England: A regional transmission organization (RTO), serving Connecticut, Maine, Massachusetts, New Hampshire, Rhode Island and Vermont. ISO stands for independent service operators. It was developed at the behest of Congress and the Federal Energy Regulatory Commission (FERC) to enable restructuring of the electric power industry.
ITC: intermodal transportation center
LAN: Local Area Network
LED: Light-emitting diode. This light source has a higher initial purchase price, but over the long term has a lower cost because they require much less power to output the same amount of light as a similar incandescent bulb.
LIABILITY: Debt or other legal obligations arising out of transactions in the past, which must be liquidated, renewed, or refunded at some future date.
LONGEVITY: Monetary payments to permanent full-time employees who have been in the employ of the City for a set number of years.
MERS: Municipal Employee Retirement System. MUNIS: The financial reporting system used by the City of Bridgeport.
MACH: Music and Arts Center for Humanity, a Bridgeport Arts organization.
MBE: Minority Business Enterprise Program. This program aims to implement a race and gender-conscious program to correct historic discrimination. It aims to reduce and eliminate aspects of the city’s bidding and contracting processes that pose the greatest difficulties for Minority businesses.
MERF: the Municipal Employees Retirement Fund
MILL RATE: The Mill Rate is the rate of taxation levied on property subject to taxation under Connecticut General Statutes. One mill is equal to 1/1000 of a dollar. For example, a tax rate of 20 mills is equivalent to $20 per $1,000 of assessed value.
MODIFIED ACCRUAL: basis for accounting of all governmental funds and expendable trust and agency funds under which revenues are recorded when they become measurable and available. Expenditures are recorded when the liability is incurred, except for interest on general long-term obligations, which is recorded when due.
536
FY 2018-2019 ADOPTED GENERAL FUND BUDGET APPENDIX GLOSSARY
CITY OF BRIDGEPORT, CONNECTICUT
MRSA: Methicillin-resistant Staphylococcus aureus (MRSA) is a bacterium responsible for difficult-to-treat infections in humans. MRSA is a resistant variation of the common bacterium Staphylococcus aureus.
MULTI-CULTURAL: relating to or constituting several cultural or ethnic groups within a society NRZ: Neighborhood Revitalization Zones. NTOA: National Tactical Officer’s Association.
OPED: Office of Planning and Economic Development.
ORDINANCE: A law set forth by a governmental authority; a municipal regulation.
OSHA: Occupational Safety and Health Administration
PERF: Police Executive Research Forum. This national membership organization is comprised of police executives from the largest law enforcement agencies in the United States. They are dedicated to improving policing and advancing professionalism through research and public policy.
PETE: Polyethylene terephthalate, a type of plastic.
PILOT: An acronym that stands for payments in lieu of taxes. These property tax exemptions are granted to state-owned property, institutions of higher education & hospitals by the state of Connecticut. The payment is equal to a percentage of the amount of taxes that would be paid if the property were not exempt from taxation.
RECOMMENDED BUDGET: The proposed budget for the ensuing fiscal year that has been approved by the mayor and forwarded to the City Council for their review & approval.
REQUIRED RESERVE: The City of Bridgeport appropriates a $1 million budgetary reserve. This is a longstanding practice which is a positive factor in the City’s maintenance of its Bond Rating. All three rating agencies have acknowledged this budgetary practice.
REVENUES: (1) Increases in the net current assets of a governmental fund type from other than expenditure refunds and residual equity transfers; and (2) increase in the net total assets of a proprietary fund type from other than expense refunds, capital contributions and residual equity transfers.
RFP Depot: RFP Depot is an online bidding service designed to streamline the bidding process. RFP Depot offers an enhanced bidding process that allows bid solicitations via the internet. We anticipate the introduction of RFP Depot will simplify the bidding process for both vendors and departments.
RFP: Request for Proposal.
RFQ: Request for Quotation.
RMS: Recovery Management Support
537
FY 2018-2019 ADOPTED GENERAL FUND BUDGET APPENDIX GLOSSARY
CITY OF BRIDGEPORT, CONNECTICUT
RYASAP: Regional Youth/Adult Substance Abuse Project, a community development organization based in Bridgeport.
SBE: Small Business Enterprise.
SERVICE INDICATORS: A statement describing an activity conducted or performed by the department/division. A department or division usually has many Service Indicators. Service Indicators provide information on whether service objectives are being met.
Single Stream: a system in which all paper fibres, plastics, metals, and other containers are mixed in a collection truck, instead of being sorted by the depositor into separate commodities.
SLRB: State Labor Relations Board.
SPECIAL REVENUES: The use of these funds is prescribed by Federal or State program guidelines. Often, the source of these funds are federal and state grants that are to be used for specific projects.
STATEMENT 34: A proposed revision by the Governmental Accounting Standards Board (GASB) in GAAP Accounting, which requires changes in local government accounting and reporting.
STATE-OF-THE ART: The most recent stage in the development of a product, incorporating the newest ideas and the most up-to-date features.
SUBMITTED BUDGET: Departmental estimates of revenue and expenditures for the ensuing fiscal year, submitted to the Office of Policy & Management, which is reviewed and used in formulating the recommended budget.
SUPPLEMENTAL APPROPRIATION: Appropriations made by the City Council to cover expenditures that exceed the adopted appropriation level.
SURPLUS: That portion of prior year Undesignated Fund Balance to be used to offset current year tax revenues.
SWAT: a special police unit trained to perform dangerous operations.
SWEROC: Southwest Connecticut Regional Recycling Operating Committee.
TAX ABATEMENT: Legal reduction of cancellation of tax obligation.
TAX ANTICIPATION NOTES (TANS): Notes (or warrants) issued in anticipation of the collection of taxes, usually retirable only from tax collections, and frequently only from the proceeds of the tax levy whose collections they anticipate.
TAXABLE GRAND LIST: Reflects all property that is not subject to Section 12-81 of the Connecticut general Statutes which exempts from taxation federal, state, municipal, church, and school property if that property is used for the purpose for which the agent is exempted.
TOD: Transit Oriented Development
TRANSFERS IN/OUT: Transfers between city funds not technically considered revenues or expenses to either fund.
TRANSMITTAL LETTER: A document, in the form of a letter that accompanies the budget when it is presented to the City Council. It is written by the Mayor, in part to explain the considerations that went into the planning of the budget it is attached to.
538
FY 2018-2019 ADOPTED GENERAL FUND BUDGET APPENDIX GLOSSARY
CITY OF BRIDGEPORT, CONNECTICUT
TRUST FUND: Funds used to account for assets held by a government in a trustee capacity for individuals, private organizations, other governments and/or other funds.
TRANSITIONAL WORK PROGRAM: Transitional work, sometimes referred to as “light duty,” is an interim step in the physical recovery of an employee who suffers an occupational or a non-occupational injury or illness that prevents the employee from working in his/her current position. Transitional work is designed to use job tasks or a combination of tasks and functions that an individual with work restrictions may safely perform. Transitional work assignments are offered to those employees who have supplied Human Resources with temporary work restrictions. VPN: Virtual Private Network WAN: Wide area network, a computer network that covers a broad area.
WATER-BARRIER PILING: walls to contain falling debris, tools, etc. into a body of water such as lakes, rivers or harbor.
WIC: Women, Infants & Children, a federal nutritional program.
WPCA: Water Pollution Control Authority.
539
FY 2018-2019 ADOPTED GENERAL FUND BUDGET
CITY OF BRIDGEPORT, CONNECTICUT
This page left blank intentionally.
540