general fund proposed budget
TRANSCRIPT

Chabot – Las Positas Community College District
Annual Budget
Fiscal Year Beginning July 1, 2006
and Ending June 30, 2007

2
CHABOT - LAS POSITAS COMMUNITY COLLEGE DISTRICT
Board of Trustees
Mrs. Isobel F. Dvorsky—President Dr. Arnulfo Cedillo—Secretary Mr. Donald L. “Dobie” Gelles
Dr. Hal G. Gin Dr. Alison S. Lewis
Dr. Barbara F. Mertes Mr. Carlo Vecchiarelli
Administrative Officers
Dr. Susan A. Cota – Chancellor Dr. Joel L. Kinnamon – Vice Chancellor, Educational Services & Planning
Mr. Lorenzo Legaspi-Vice Chancellor, Business Services Ms. Judy Hutchinson – Budget Officer
Chabot College
Dr. Robert E. Carlson - President
Dr. Ronald C. Taylor - Vice President, Academic Services Ms. Melinda Matsuda - Vice President, Student Services
Mr. Ghalam Javaheripour - Vice President, Business Services
Las Positas College
Ms. Karen E. Halliday - President Dr. J. Laurel Jones - Vice President, Academic Services (Interim)
Ms. Pamela T. Luster - Vice President, Student Services Mr. Robert S. Kratochvil - Vice President, Business Services
Chabot - Las Positas Community College District District Offices
5020 Franklin Drive Pleasanton, CA 94588 Phone: (925) 485-5203 www.clpccd.cc.ca.us

3
Table of Contents Chabot - Las Positas Community Colleges
Annual Budget 2006 – 2007
Introduction
Summary of Adoption Budget General Fund 2006-2007 …………………. 5 SB 361, Funding Formula Reform …………………………………………… 8 Sound Fiscal Management, Self Assessment Checklist ………………….. 10
2006-2007 California Community College System Budget California Community Colleges State Budget Act…………………………… 13 California Community Colleges 2006-07 Growth Rate……………………… 15
2006-2007 Chabot-Las Positas Community College District Budget
Board of Trustees Priorities (2006-2008)…………………………………. 17 2006-2007 Major Revenue Assumptions…………………………………. 18 2006-2007 Major Expenditure Assumptions……………………………… 19 General Fund Proposed Budget Source of Funds …………………………………………………. 20 Use of Funds …………………………………………………….. 21 District Revenue—By Object……………………………………. 22 District Expenditures—By Object ……………………………… 23 Full-Time Equivalent Student (FTES) Enrollment……………………….. 25
Budget Highlights by College, District Services, Maintenance and Operations, and Contract Education/Economic Development
Chabot College Vision, Mission, and Value Statements..………………………. 28 Adoption Budget 2006-07……………………………………….. 29 Expenditure Percentage Comparison for 2006-07 and Compensation vs. All Other 2006-07…………………... 30 Las Positas College Statement of Purpose and Intent……………………………….. 32 Adoption Budget 2006-07……………………………………….. 33 Expenditure Percentage Comparison for 2006-07 and Compensation vs. All Other 2006-07………………….. 34
4
District Services, Maintenance and Operations, and Contract Education/ Economic Development District Services
Adoption Budget 2006-07……………………………………… 36 Expenditure Percentage Comparison for 2006-07 and Compensation vs. All Other 2006-07………………… 37
Maintenance and Operations Adoption Budget 2006-07…………………………………….. 38 Expenditure Percentage Comparison for 2006-07 and Compensation vs. All Other 2006-07……………….... 39 Contract Education/Economic Development Adoption Budget 2006-07……………………………………… 40 Expenditure Percentage Comparison for 2006-07 and Compensation vs. All Other 2006-07………………………… 41
Other District Funds
Other District Funds 2006-2007 Expenditures ………………………… 43 Budget Calendar and Glossary of Finance Terms Chabot-Las Positas Community College District Budget
Calendar 2006-07…………………………………………………………. 44
Glossary of Finance Terms……………………………………………… 46 Sources of Documents California Community Colleges State Chancellor’s Office Community Colleges League of California School Services of California

5
Chabot-Las Positas Community College District
Summary of Adoption Budget 2006-2007 On June 30, 2006, Governor Schwarzenegger signed the budget bill into law providing the first on-time budget in six years. The budget reflects significant increases in funding bringing the California community colleges share of Proposition 98 funds to 10.71%, the highest in fifteen years. Some of the highlights of the budget include: a cost of living adjustment (COLA) of 5.92% for general apportionment and most categorical programs; a reduction of the enrollment fee from $26 to $20 per credit unit effective with the upcoming spring term; and $159 million to fund the implementation of SB 361 (Scott)/Community Colleges Funding Formula Reform. It should be noted that this budget was developed using the old program-based funding (PBF) model which remains in effect until SB 361 is enacted. On the local front, district enrollment as a whole is projected at 16,869 or a 2.0% increase from the prior year. It is of paramount importance that enrollment is projected as accurately as possible. Even small fluctuations in the District's enrollment can mean tens of thousands of dollars in gained or lost income. District enrollment must be monitored and updated throughout the year. And, expenditures funded by enrollment growth must be adjusted accordingly. In addition, at the time of this writing, the District and the two employee groups had reached tentative agreements on collective bargaining for the 2006-07 and 2007-08 fiscal years. Salary schedule increases are at 8% and 6% for faculty and 8.8% and 6% for classified for the respective fiscal years. The remaining budget development assumptions are outlined below: REVENUES The three major classifications of revenue by source are State revenues, Local revenues and Federal revenues. State Revenues The largest source of District revenue is General Apportionment. General Apportionment Revenue is based on the program-based funding formula resulting from attendance of full time equivalent students (FTES) in credit and noncredit courses. The State General Apportionment equals General Apportionment Revenues less Property Taxes and 98% of Enrollment Fees. For 2006-07 the State General Apportionment is based on the following assumptions:

6
Growth revenues based on 331 FTES paid growth (2.00% x 16,538)
06-07 COLA at 5.92%
Equalization funding of $2,931,761
Other State Revenues - include estimates for on going programs and any programs for which the District/College has received funding notification. These revenue sources include both unrestricted and restricted funds.
Local Revenues Property Taxes
The estimated property taxes for 2006-07 is based on the current 2005-06 estimates plus 3 percent. Property taxes are one of the components that are deducted from the General Apportionment Revenues to determine State Apportionment Revenues.
Enrollment Fees
The estimated enrollment fees for 2006-07 is based on the 2005-06 actual revenue at P2, adjusted for projected growth less fee reduction due to 2006-2007 Budget Act. The Budget Act reduced the enrollment fees from $26 per unit to $20 per unit in the Spring 2007. 98% of enrollment fees is one of the components that are deducted from the General Apportionment Revenues to determine State Apportionment Revenues.
Other Local Revenues
Estimates for other local revenue are based on historical trends or projected activity. These revenue sources include both unrestricted and restricted revenues.
Federal Revenues Federal revenues include estimates for on going programs and any programs for which the District/College has received funding notification. These revenue sources include both unrestricted and restricted funds. EXPENDITURES The expenditure budget is the financial operating plan for the District. The two major classifications of the expenditure budget are unrestricted expenditures and restricted expenditures. Restricted expenditures are associated with revenues that are required to be spent for specific purposes. Unrestricted expenditures are associated with revenues that are, for the most part, discretionary. Below are expenditure assumptions related to employee compensation.
Cost of Living Adjustment (COLA) for all employees
Salary step/column and longevity advancement increases included
Medical benefit premiums increase for active employees is 10.2%
The PERS employer rate is projected at 9.12%
3 new faculty are included to meet the requirements of Title V. Replacement positions for retirement and resignations will be filled.
7
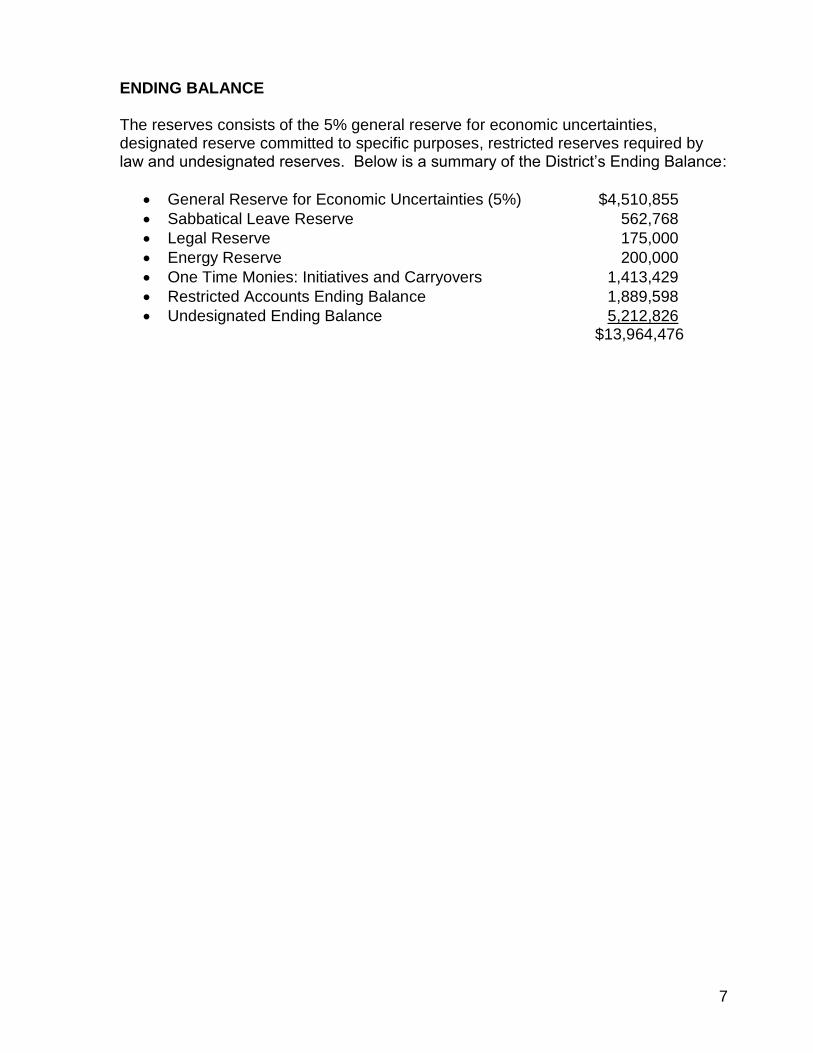
ENDING BALANCE The reserves consists of the 5% general reserve for economic uncertainties, designated reserve committed to specific purposes, restricted reserves required by law and undesignated reserves. Below is a summary of the District’s Ending Balance:
General Reserve for Economic Uncertainties (5%) $4,510,855
Sabbatical Leave Reserve 562,768
Legal Reserve 175,000
Energy Reserve 200,000
One Time Monies: Initiatives and Carryovers 1,413,429
Restricted Accounts Ending Balance 1,889,598
Undesignated Ending Balance 5,212,826 $13,964,476
8
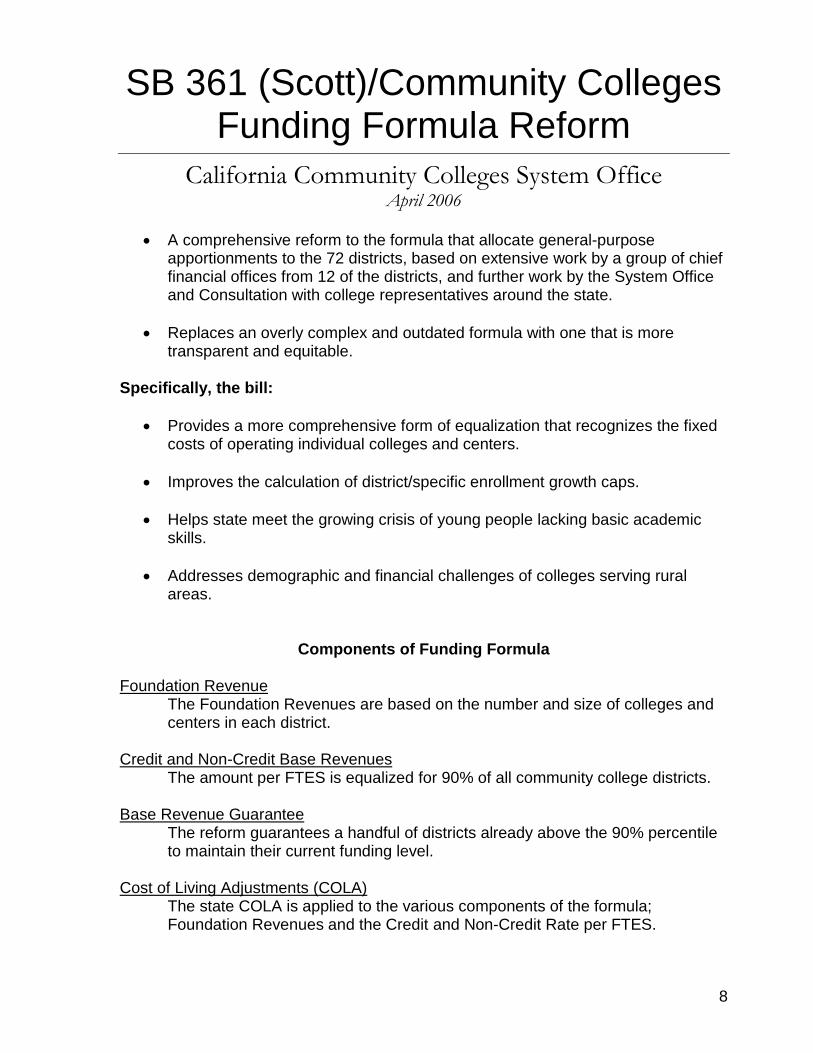
SB 361 (Scott)/Community Colleges Funding Formula Reform
California Community Colleges System Office April 2006
A comprehensive reform to the formula that allocate general-purpose apportionments to the 72 districts, based on extensive work by a group of chief financial offices from 12 of the districts, and further work by the System Office and Consultation with college representatives around the state.
Replaces an overly complex and outdated formula with one that is more transparent and equitable.
Specifically, the bill:
Provides a more comprehensive form of equalization that recognizes the fixed costs of operating individual colleges and centers.
Improves the calculation of district/specific enrollment growth caps.
Helps state meet the growing crisis of young people lacking basic academic skills.
Addresses demographic and financial challenges of colleges serving rural areas.
Components of Funding Formula Foundation Revenue
The Foundation Revenues are based on the number and size of colleges and centers in each district.
Credit and Non-Credit Base Revenues
The amount per FTES is equalized for 90% of all community college districts. Base Revenue Guarantee
The reform guarantees a handful of districts already above the 90% percentile to maintain their current funding level.
Cost of Living Adjustments (COLA)
The state COLA is applied to the various components of the formula; Foundation Revenues and the Credit and Non-Credit Rate per FTES.

9
SB 361 Simulation (Based on 05/06 P-2) for CLPCCD Foundation Revenue
Chabot College (>10,000 FTES) 3,500,000 Las Positas College (<10,000 FTES) 3,000,000
Credit-Non Credit Base Revenues
Credit FTES x Rate ($4,123) 65,607,402 Non-Credit FTES x Rate ($625.82) 1,551,408
SB 361 Base Revenue Guarantee 73,658,810 2006-07 COLA (5.92%)
Foundation COLA 384,800 Credit COLA 3,883,958 Non-Credit COLA 91,843
2006-07 Growth
District Growth Rate (1.43%) 1,015,125 Total Funding under SB 361 79,034,536

10
California Community Colleges
Sound Fiscal Management Self-Assessment Checklist
1. Deficit Spending – Is this area acceptable? Yes / No
Is the district spending within their revenue budget in the current year?
Has the district controlled deficit spending over multiple years?
Is deficit spending addressed by fund balance, ongoing revenue increases, or expenditure reductions?
Are district revenue estimates based upon past history?
Does the district automatically build in growth revenue estimates?
2. Fund Balance – Is this area acceptable? Yes / No
Is the district’s fund balance stable or consistently increasing?
Is the fund balance increasing due to on-going revenue increases and/or expenditure reductions?
3. Enrollment – Is this area acceptable? Yes / No
Has the district’s enrollment been increasing or stable for multiple years?
Are the district’s enrollment projections updated at least semi-annually?
Are staffing adjustments consistent with the enrollment trends?
Does the district analyze enrollment and full-time equivalent students (FTES) data?
Does the district track historical data to establish future trends between P-1 and Annual for projection purposes?
Has the district avoided stabilization funding?
4. Unrestricted General Fund Balance – Is this area acceptable? Yes / No Is the district’s unrestricted general fund balance consistently maintained at or above the
recommended minimum prudent level (5% of the total unrestricted general fund expenditures)?
Is the district’s unrestricted fund balance maintained throughout the year?
5. Cash Flow Borrowing – Is this area acceptable? Yes / No Can the district manage its cash flow without interfund borrowing?
Is the district repaying TRANS and/or borrowed funds within the required statutory period?
6. Bargaining Agreements – Is this area acceptable? Yes / No Has the district settled bargaining agreements within new revenue sources during the past
three years?
Did the district conduct a pre-settlement analysis identifying an ongoing revenue source to support the agreement?
Did the district correctly identify the related costs?
Did the district address budget reductions necessary to sustain the total compensation increase?
7. Unrestricted General Fund Staffing – Is this area acceptable? Yes / No Is the district ensuring it is not using one-time funds to pay for permanent staff or other
ongoing expenses?
Is the percentage of district general fund budget allocated to salaries and benefits at or less than the statewide average (i.e. the statewide average for 2003-04 is 85%)?

11
8. Internal Controls – Is this area acceptable? Yes / No Does the district have adequate internal controls to insure the integrity of the general ledger?
Does the district have adequate internal controls to safeguard the district’s assets?
9. Management Information Systems – Is this area acceptable? Yes / No Is the district data accurate and timely?
Are the county and state reports filed in a timely manner?
Are key fiscal reports readily available and understandable?
10. Position Control – Is this area acceptable? Yes / No Is position control integrated with payroll?
Does the district control unauthorized hiring?
Does the district have control over part-time academic staff hiring?
11. Budget Monitoring – Is this area acceptable? Yes / No Is there sufficient consideration to the budget, related to long-term bargaining agreements?
Are budget revisions completed in a timely manner?
Does the district openly discuss the impact of budget revisions at the board level?
Are budget revisions made or confirmed by the board in a timely manner after the collective bargaining agreements are ratified?
Has the district’s long-term debt decreased fro the prior fiscal year?
Has the district identified the repayment sources for the long-term debt?
Does the district compile annualized revenue and expenditure projections throughout the year?
12. Retiree Health Benefits – Is this area acceptable? Yes / No Has the district completed an actuarial calculation to determine the unfunded liability?
Does the district have a plan for addressing the retiree benefits liabilities?
13. Leadership/Stability – Is this area acceptable? Yes / No Has the district experienced recent turnover in its management team (including the Chief
Executive Officer, Chief Business Officer, and Board of Trustees)?
14. District Liability – Is this area acceptable? Yes / No Has the district performed the proper legal analysis regarding potential lawsuits that may
require the district to maintain increased reserve levels?
Has the district set up contingent liabilities for anticipated settlements, legal fees, etc?
15. Reporting – Is this area acceptable? Yes / No Has the district filed the annual audit report with the System Office on a timely basis?
Has the district taken appropriate actions to address material findings cited in their annual audit report?
Has the district met the requirements of the 50 percent law?
Have the Quarterly Financial Status Reports (CCFS-311Q), Annual Financial and Budget Reports (CCFS-311), and Apportionment Attendance Reports (CCFS-320) been submitted to the System Office on or before the stated deadlines?

12
2006 - 2007 California
Community College System Budget
13
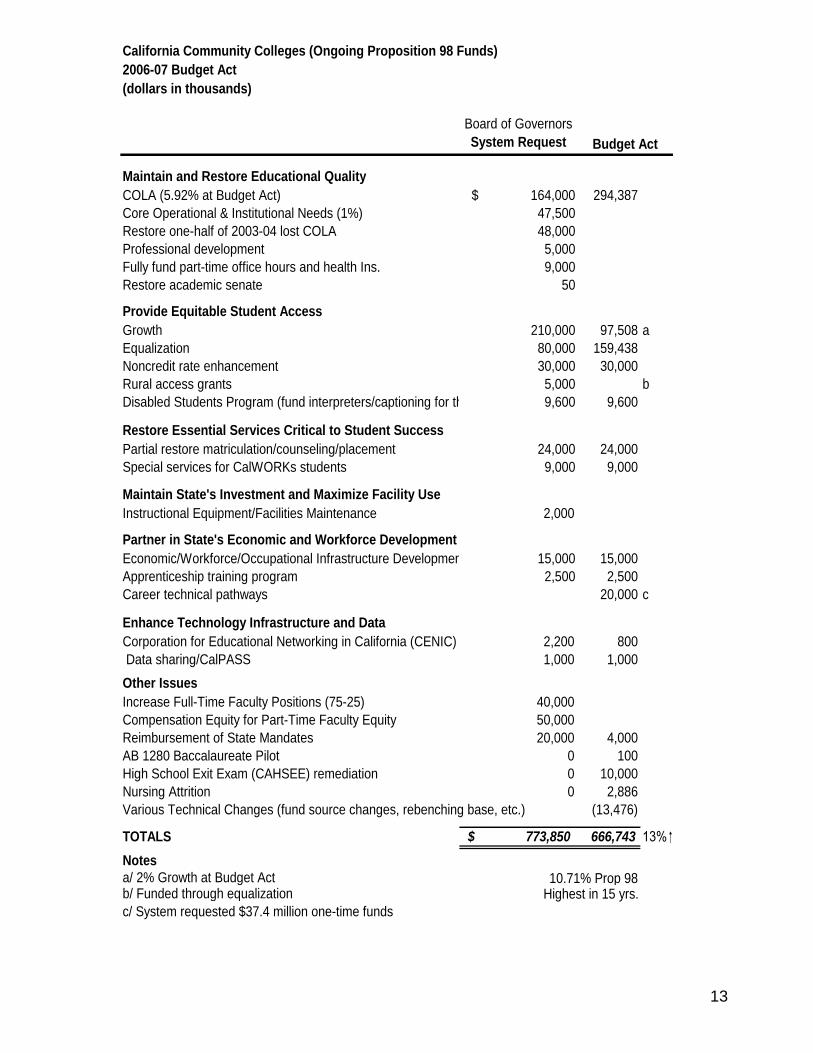
California Community Colleges (Ongoing Proposition 98 Funds)
2006-07 Budget Act
(dollars in thousands)
Board of Governors
System Request
Maintain and Restore Educational Quality
COLA (5.92% at Budget Act) $ 164,000 294,387
Core Operational & Institutional Needs (1%) 47,500
Restore one-half of 2003-04 lost COLA 48,000
Professional development 5,000
Fully fund part-time office hours and health Ins. 9,000
Restore academic senate 50
Provide Equitable Student Access
Growth 210,000 97,508 a
Equalization 80,000 159,438
Noncredit rate enhancement 30,000 30,000
Rural access grants 5,000 b
Disabled Students Program (fund interpreters/captioning for the deaf) 9,600 9,600
Restore Essential Services Critical to Student Success
Partial restore matriculation/counseling/placement 24,000 24,000
Special services for CalWORKs students 9,000 9,000
Maintain State's Investment and Maximize Facility Use
Instructional Equipment/Facilities Maintenance 2,000
Partner in State's Economic and Workforce Development
Economic/Workforce/Occupational Infrastructure Development program 15,000 15,000
Apprenticeship training program 2,500 2,500
Career technical pathways 20,000 c
Enhance Technology Infrastructure and Data
Corporation for Educational Networking in California (CENIC) 2,200 800
Data sharing/CalPASS 1,000 1,000
Other Issues
Increase Full-Time Faculty Positions (75-25) 40,000
Compensation Equity for Part-Time Faculty Equity 50,000
Reimbursement of State Mandates 20,000 4,000
AB 1280 Baccalaureate Pilot 0 100
High School Exit Exam (CAHSEE) remediation 0 10,000
Nursing Attrition 0 2,886
Various Technical Changes (fund source changes, rebenching base, etc.) (13,476)
TOTALS 773,850$ 666,743 13%
Notes
a/ 2% Growth at Budget Act 10.71% Prop 98b/ Funded through equalization
c/ System requested $37.4 million one-time funds
Budget Act
Highest in 15 yrs.

14
CALIFORNIA COMMUNITY COLLEGES 2006 - 2007 GROWTH RATES
District
Adult Population
Change
High School Grad
Change Blended
Rate
Under-served Area
New Facility
Rate Adjusted
Rate
Final Revised &
Adj Growth Rate
w/Minimums
Allan Hancock 1.97 3.67 2.82 0.00 0.00 2.82 2.82
Antelope Valley 3.67 3.61 3.67 0.00 0.00 3.67 3.67
Barstow -1.25 -0.79 -1.09 0.00 0.00 -1.09 4.28
Butte 1.64 3.16 2.42 0.00 3.88 6.30 6.30
Cabrillo 1.39 0.39 1.39 0.00 0.00 1.39 1.39
Cerritos 1.20 0.21 1.20 0.00 0.00 1.20 1.20
Chabot-Las Positas 1.73 2.56 2.17 0.00 0.00 2.17 2.17
Chaffey 2.17 4.00 3.14 1.06 0.00 4.20 4.20
Citrus 2.08 1.73 2.08 0.00 0.00 2.08 2.08
Coast 1.21 0.45 1.21 0.00 0.00 1.21 1.21
Compton 3.08 5.43 3.94 0.17 0.00 4.11 4.11
Contra Costa 1.39 3.14 2.40 0.00 0.00 2.40 2.40
Copper Mt. 5.65 2.30 5.65 0.08 0.00 5.73 7.39
Desert 6.78 4.93 6.78 0.92 0.00 7.70 7.70
El Camino 0.93 3.96 2.65 0.00 0.00 2.65 2.65
Feather River 1.81 -3.94 1.81 0.00 0.00 1.81 6.96
Foothill-DeAnza 0.59 0.92 0.74 0.00 2.86 3.60 3.60
Gavilan 1.82 0.77 1.82 0.01 0.00 1.83 2.10
Glendale 1.65 2.49 2.03 0.00 0.00 2.03 2.03
Grossmont 2.02 0.95 2.02 0.00 0.00 2.02 2.02
Hartnell 1.69 3.26 2.41 0.03 0.00 2.44 2.44
Imperial 3.64 0.22 3.64 0.00 0.00 3.64 3.64
Kern 2.43 3.22 2.84 0.08 0.00 2.92 2.92
Lake Tahoe 2.55 39.46 16.07 0.00 0.00 16.07 16.07
Lassen 2.60 9.45 6.06 0.30 0.00 6.36 6.36
Long Beach 1.67 4.82 3.18 0.08 0.00 3.26 3.26
Los Angeles 1.73 5.00 3.08 0.85 0.00 3.93 3.93
Los Rios 1.43 3.43 2.42 0.00 0.00 2.42 2.42
Marin 0.61 1.32 0.87 0.52 0.00 1.39 2.53
Mendocino-Lake 1.47 2.49 1.94 0.32 0.00 2.26 3.82
Merced 3.06 3.43 3.25 0.26 4.88 8.13 8.13
Mira Costa 1.56 2.76 2.19 0.67 0.00 2.86 2.86
Monterey 1.52 -2.52 1.52 0.00 0.00 1.52 1.52
Mt. San Antonio 2.39 2.75 2.58 0.00 0.00 2.58 2.58
Mt. San Jacinto 3.39 7.21 5.39 1.01 0.00 6.40 6.40
Napa Valley 1.61 4.42 2.77 0.00 0.00 2.77 2.77

15
CALIFORNIA COMMUNITY COLLEGES 2006 - 2007 GROWTH RATES
District
Adult Population
Change
High School Grad
Change Blended
Rate
Under-served Area
New Facility
Rate Adjusted
Rate
Final Revised &
Adj Growth Rate
w/Minimums
Ohlone 0.56 6.51 4.08 0.16 0.00 4.24 4.24
Palo Verde 0.56 5.19 1.59 0.00 3.04 4.63 6.37
Palomar 1.70 4.91 3.28 0.00 0.01 3.29 3.29
Pasadena Area 1.77 3.55 2.71 0.00 0.00 2.71 2.71
Peralta 0.80 1.63 1.06 0.02 0.00 1.08 1.08
Rancho Santiago 1.43 4.17 2.78 0.00 5.40 8.18 8.18
Redwoods 1.94 2.26 2.08 0.00 0.00 2.08 2.08
Rio Hondo 1.71 1.33 1.71 0.31 0.00 2.02 2.02
Riverside 1.61 4.92 3.56 0.00 0.00 3.56 3.56
San Bernardino 1.38 5.59 3.23 0.18 0.00 3.41 3.41
San Diego 1.38 -0.87 1.38 0.40 0.00 1.78 1.78
San Francisco 0.99 2.31 1.34 0.16 0.80 2.14 2.14
Sa Joaquin Delta 2.74 2.63 2.74 0.25 0.00 2.99 2.99
San Jose 1.43 0.75 1.43 1.12 1.24 2.67 2.67
San Luis Obispo 1.62 5.28 3.92 0.00 0.00 3.92 3.92
San Mateo 0.80 2.35 1.56 0.17 0.00 1.73 1.73
Santa Barbara 0.67 3.25 2.03 0.00 0.00 2.03 2.03
Santa Clarita 5.74 7.34 6.81 0.00 0.00 6.81 6.81
Santa Monica 1.54 4.40 3.10 0.00 0.00 3.10 3.10
Sequoias 3.15 1.54 3.15 0.37 0.00 3.52 3.52
Shasta 1.92 1.76 1.92 0.00 0.00 1.92 1.92
Sierra 5.23 3.46 5.23 0.00 0.00 5.23 5.23
Siskiyou 1.02 -6.21 1.02 0.00 0.00 1.02 4.19
Solano 1.58 0.87 1.58 0.40 0.00 1.98 1.98
Sonoma 1.15 1.99 1.54 0.00 0.00 1.54 1.54
South Orange 2.26 2.76 2.51 0.01 0.00 2.52 2.52
Southwestern 4.35 5.19 4.73 0.00 0.00 4.73 4.73
State Center 2.91 3.87 3.45 0.00 0.00 3.45 3.45
Ventura 1.28 2.08 1.76 0.00 0.00 1.76 1.76
Victor Valley 11.01 4.27 11.01 0.00 0.00 11.01 11.01
West Hills 1.91 2.13 2.02 0.00 0.00 2.02 2.02
West Kern -5.56 0.79 -2.69 0.00 0.00 -2.69 4.97
West Valley 1.00 2.70 1.81 0.00 0.00 1.81 1.81
Yosemite 2.51 4.23 3.50 0.16 0.00 3.66 3.66
Yuba -0.58 5.20 2.09 0.00 0.00 2.09 2.09

16
2006 - 2007 Chabot - Las Positas
Community College District Budget

17
Chabot-Las Positas Community College District
Board of Trustees Priorities (2006-2008) The Chabot-Las Positas Community College District’s Board of Trustees will work as an ethical and cohesive team in supporting the Chancellor’s maintenance of a fiscally sound and creative learning environment for students and a productive and rewarding environment for staff. The Board joins with the Chancellor in judging their effectiveness by:
1. Requiring regular and accurate fiscal reports that include all major expenditures which affect the economic health of the colleges and the District;
2. Adhering to Board Policies that require regular, timely and consistent
evaluations in order to improve staff and student performance;
3. Requiring all Board reports to be well documented, timely, and thoughtfully prepared with all appropriate and accurate legal information so that the Board Members will have a solid basis upon which to make fair decisions;
4. Operating in an open, honest, and ethical decision-making process;
5. Maintaining open communication channels with the local communities through
the formation of working partnerships with business, industry, education, and government;
6. Keeping informed on appropriate State and Federal policies affecting
community colleges. Adopted: 9/20/05

18
2006 - 2007 MAJOR REVENUE ASSUMPTIONS
Apportionment revenue is based on the Second Principal Apportionment and the 2006 - 2007 Budget Act signed by the Governor. For 2006-07 the State General Apportionment is based on the following assumptions:
Other Revenue: Lottery revenue per FTES is estimated at $129 per FTES.
Interest revenue is projected at $293,272.
Enrollment fees will be $26 per unit, reduced to $20 per unit in Spring 2007.
Non-resident tuition revenue is estimated to be $1,292,700.
General Apportionment Revenue: 2006 – 2007
Base apportionment $70,727,049
2006-2007 COLA, 5.92% 4,249,593
2006-2007 Growth, 2% 1,327,186
2006-2007 M&O Growth 100,845
Equalization Augmentation 2,931,761
TOTAL $79,336,434
Sources:
Property Taxes $25,146,206
Enrollment Fees 5,783,150
State General Apportionment
(Total Apportionment – Property Taxes -
98% Enrollment Fees)
$48,407,078
TOTAL $79,336,434

19
2006 - 2007 MAJOR EXPENDITURE ASSUMPTIONS 2006-2007 salary schedule increments resulting from the Collective Bargaining agreements have been included in the expenditure estimates. Percentage 1. Cost of living adjustment Salary Schedule Adjustments Faculty (Tentative Agreement) 8.00% Classified (Tentative Agreement) 8.80% 2. Statutory benefits are budgeted as follows:
State Teachers Retirement System 8.25%
Public Employees Retirement System 9.12%
OASDHI (Social Security) 6.20%
Medicare 1.45%
State Unemployment Insurance 0.05%
Workers Compensation 1.39%
STRS Cash Balance Plan (Hourly Academic) 4.00%
Alternate Retirement System (Hourly Non Academic) 3.75%
3. Step/column and longevity adjustments are including in the compensation expenditures. 4. Health and Welfare benefits (medical, dental, life insurance, vision) are
budgeted at an average cost per employee. Medical benefit costs reflect a 10.2% increase over 2005 - 2006.
5. Utilities – Increase of $432,000 from prior year level 6. Property and Liability Insurance increased by $58,288
7. Retiree Health Benefits budget of $3,098,189
8. Other Expenditures are budgeted at the prior year levels
20
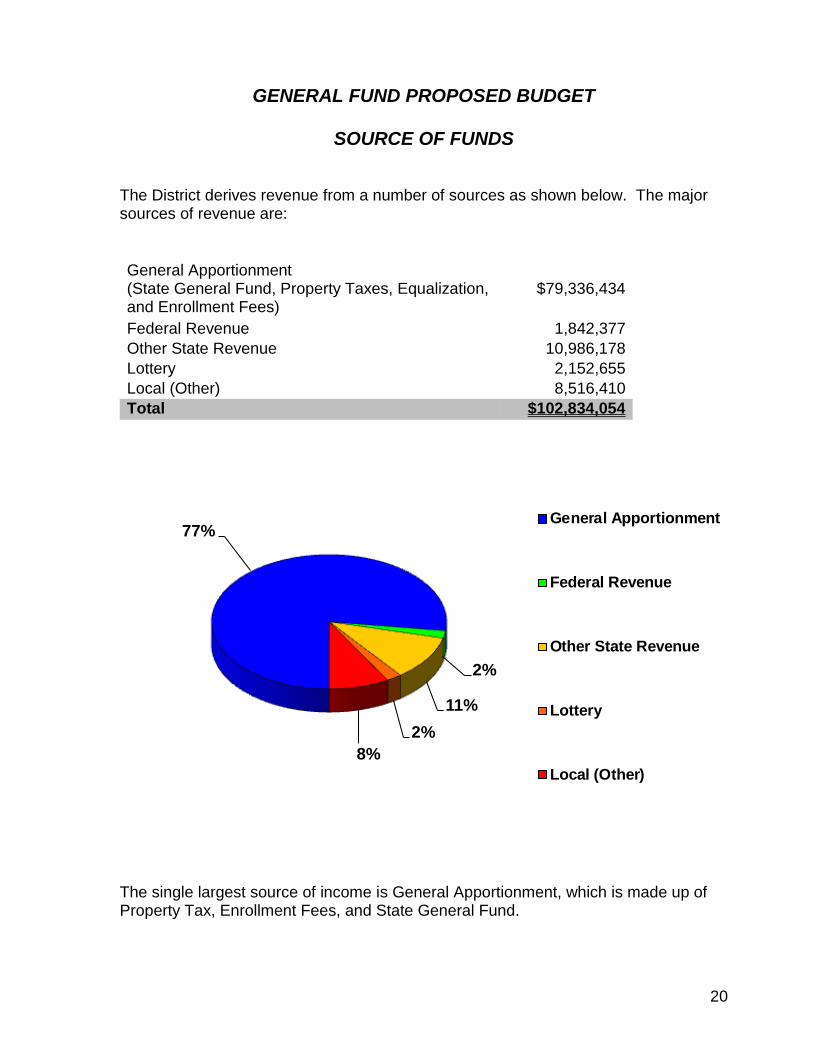
GENERAL FUND PROPOSED BUDGET
SOURCE OF FUNDS
The District derives revenue from a number of sources as shown below. The major sources of revenue are:
General Apportionment
(State General Fund, Property Taxes, Equalization, and Enrollment Fees)
$79,336,434
Federal Revenue 1,842,377
Other State Revenue 10,986,178
Lottery 2,152,655
Local (Other) 8,516,410
Total $102,834,054
77%
2%
11%
2%
8%
General Apportionment
Federal Revenue
Other State Revenue
Lottery
Local (Other)
The single largest source of income is General Apportionment, which is made up of Property Tax, Enrollment Fees, and State General Fund.

21
GENERAL FUND PROPOSED BUDGET
USE OF FUNDS
The District’s major expense categories are shown below. Salaries and benefits make up 86% of the District’s expenditures.
Academic Salaries $39,606,430
Classified Salaries 24,332,266
Benefits 19,253,960
Supplies 3,376,118
Other Operating Expenses and Services 10,748,707
Capital Outlay 3,405,499
Transfers and Other Outgo 1,210,697
Total $101,933,677
2%
17%
5%
31%
40%
5%
Classified Salaries
Benefits
Supplies
Other Expenses
and Services
Capital Outlay
Transfers and Other
Outgo

22
GENERAL FUND PROPOSED BUDGET
DISTRICT REVENUE - BY OBJECT
The following is a summary of income by account within each major category:
2006 – 2007 Proposed Budget Apportionment
8611 State General Apportionment $48,407,078
8810 Property Taxes 25,146,206
8874 Enrollment Fees 5,783,150
TOTAL APPORTIONMENT REVENUES $79,336,434
Federal Revenues
8100 Federal Revenues 1,842,377
TOTAL FEDERAL REVENUES $1,842,377
Other State Revenues
8612 Apprenticeship Allowance 416,408
8622 EOPS 846,702
8623 D.S.P. & S. 1,097,737
862502 CALWORKS 310,053
8626 TTIP 73,394
862906 CARE 130,535
862907 BFAP 574,441
862908 Matriculation (Credit) 762,002
862912 Instructional Equipment Grant 187,343
862913 Instructional Block Grant 187,360
862914 Nursing 112,692
862915 Part Time Faculty 729,253
8629 One Time Funds 3,851,679
8691 Mandated Cost Reimbursement 394,630
8695 Lottery Revenues 2,152,655
8690 Other State Revenues 1,311,949
TOTAL OTHER STATE REVENUES $13,138,833
Other Local Revenue
8830 Contract Services 2,408,828
8850 Facility Use Fees 416,000
8860 Interest on Deposit 293,272
8870 Other Student Fees 1,138,832
8880 Non Resident Tuition 1,292,700
8881 Parking Fees 900,000
8890 Other Local Revenue 2,066,778
TOTAL OTHER LOCAL REVENUES $8,516,410
Other Financing Sources
8900 Other Financing Sources $0
TOTAL OTHER FINANCING SOURCES $0
TOTAL REVENUES $102,834,054

23
GENERAL FUND PROPOSED BUDGET
DISTRICT EXPENDITURES - BY OBJECT
The following is a summary of expenditures by account within each major category:
2006 – 2007 Proposed Budget
1100 $18,790,492
1200 6,680,130
1300 11,185,961
1400 1,147,394
1xxx 2,054,803
$39,858,780
2100 $17,542,588
2200 979,821
2300 3,363,426
2400 322,418
2xxx 1,871,662
$24,079,915
3100 $2,103,520
3200 1,710,521
3300 1,810,720
3400 11,551,636
3500 24,805
3600 628,585
3700 38,683
3800 1,365,390
3900 20,100
$19,253,960
4300 $3,376,119
$3,376,119
Alternate Retirement System
SUPPLIES
Supplies
TOTAL SUPPLIES
Consolidated Benefits (Incl Increase due to Raise)
Other Benefits
TOTAL BENEFITS
STRS
PERS
Social Security & Medicare
Health & Welfare Benefits
State Unemployment Insurance
Workers’ Compensation Insurance
Instructional Assistants - Hourly
TOTAL CLASSIFIED SALARIES
Estimated Salary Increase
BENEFITS
Classified Regular
Instructional Assistants - Regular
Classified - Hourly
Non Teaching - Non Contract
TOTAL ACADEMIC SALARIES
CLASSIFIED SALARIES
Estimated Salary Increase
Teachers - Non Contract
2
Teachers - Contract
Management

24
GENERAL FUND PROPOSED BUDGET
DISTRICT EXPENDITURES - BY OBJECT
2006 – 2007 Proposed Budget
5100 Personal Services $2,536,703
5200 Travel & Conference Expenses 298,057
5300 Dues & Memberships 110,700
5400 Insurance 740,181
5500 Utilities & Housekeeping 2,755,740
5600 Rents, Leases & Repairs 1,128,982
5700 Legal, Election & Audit Fees 377,300
5800 Other Services & Expenses 2,801,044
$10,748,707
6100 Site Improvement 30,000
6200 Buildings 144,052
6300 Library Books 100,000
6400 Equipment 3,131,447
$3,405,499
7000 Transfers & Other Outgo 1,210,697
$1,210,697
$101,933,677
TOTAL CAPITAL OUTLAY
TRANSFERS AND OTHER OUTGO
TOTAL TRANSFERS & OTHER OUTGO
OTHER OPERATING EXPENSES & SERVICES
TOTAL OTHER OPERATING EXPENSES & SERVICES
CAPITAL OUTLAY
TOTAL

25
YEAR CHABOT
%
LPC
% %
Growth Growth TOTAL Growth
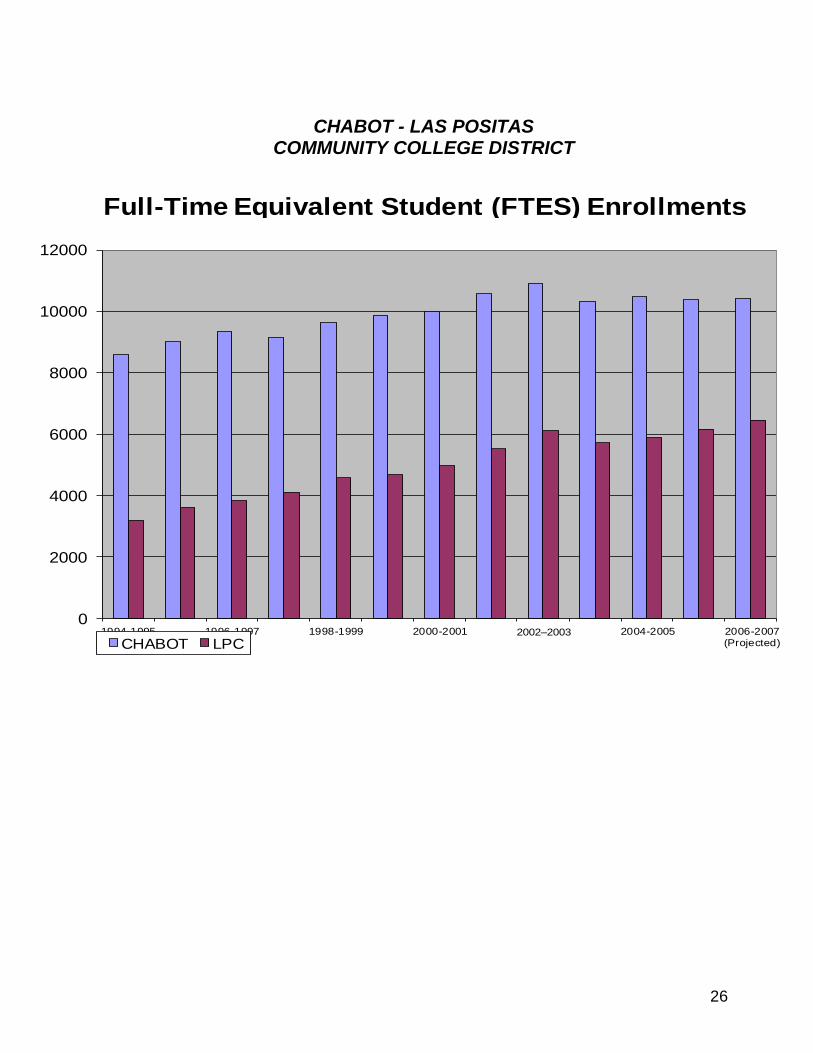
1994-1995 8,593 -7.0 3,197 -6.5 11,790 -7.2
1995-1996 9,007 4.8 3,603 12.7 12,610 7.0
1996-1997 9,354 3.9 3,820 6.0 13,174 4.5
1997-1998 9,171 -2.0 4,098 7.3 13,269 1.0
1998-1999 9,636 5.1 4,581 11.8 14,217 7.1
1999-2000 9,868 2.4 4,678 2.1 14,546 2.3
2000-2001 10,005 1.4 4,982 6.5 14,987 3.0
2001-2002 10,569 5.6 5,508 10.6 16,078 7.3
2002-2003 10,928 3.4 6,120 11.1 17,048 6.0
2003-2004 10,326 -5.8 5,707 -7.2 16,032 -6.3
2004-2005 10,477 1.4 5,886 3.0 16,363 2.0
2005-2006 10,367 -1.1 6,171 4.6 16,538 1.1
2006-2007 (Projected)
10,422 1.0 6,447 5.0 16,869 2.0
CHABOT - LAS POSITAS COMMUNITY COLLEGE DISTRICT
FULL-TIME EQUIVALENT STUDENT (FTES) ENROLLMENTS
26
CHABOT - LAS POSITAS COMMUNITY COLLEGE DISTRICT
0
2000
4000
6000
8000
10000
12000
1994-1995 1996-1997 1998-1999 2000-2001 2002–2003 2004-2005 2006-2007(Projected)CHABOT LPC
Full-Time Equivalent Student (FTES) Enrollments

27
25555 Hesperian Boulevard Hayward, California 94545
(510) 723-6600 www.chabot.cc.ca.us
CHABOT COLLEGE

28
Chabot College Vision, Mission, and Value Statements
Approved May 26, 2004 by Institutional Planning and Budget Council (IPBC)
Adopted July 1, 2004 by College Council
Vision
Chabot College is a learning-centered institution with a culture of thoughtfulness and academic excellence, committed to creating a vibrant community of life-Iong learners.
Mission Chabot College is a public comprehensive community college that prepares students to succeed in their education, progress in the workplace, and engage in the civic and cultural life of the global community. The college furthers student learning and responds to the educational needs of our local population and economy. The college serves as an educational leader, contributing its resources to the intellectual, cultural, physical, and economic vitality of the region. Recognizing that learning is a life-long journey, the college provides opportunities for the intellectual enrichment and physical well-being of all community members who can benefit.
Values
The college's vision and mission are supported by the following collective values: LEARNING AND TEACHING
supporting a variety of teaching philosophies and learning modalities
providing an environment conducive to intellectual curiosity and innovation
encouraging collaboration that fosters learning
engaging in ongoing reflection on learning, by students and by staff
cultivating critical thinking in various contexts
supporting the development of the whole person
COMMUNITY AND DIVERSITY
building a safe and supportive campus community
treating one another with respect, dignity, and integrity
practicing our work in an ethical and reflective manner
honoring and respecting cultural diversity
encouraging diversity in our curriculum and community of learners
INDIVIDUAL AND COLLECTIVE RESPONSIBILITY
taking individual responsibility for our own learning
cultivating a sense of social and individual responsibility
developing reflective, responsible and compassionate citizens
playing a leadership role in the larger community
embracing thoughtful change and innovation

29
General Fund 2005-06 2005-06 2006-07
Chabot College Adj Budget Unaudited Actual Budget
Estimated Revenues
State Revenues
General Apportionment 1,649,689$ 1,649,689$ -$
Other 4,065,120 3,351,498 3,568,290
Local Revenues
Property Taxes - - -
Enrollment Fees - - -
Other 2,677,266 2,606,685 2,881,355
Federal Revenues 1,051,087 800,426 1,200,309
Total Estimated Revenues 9,443,162$ 8,408,298$ 7,649,954$
Intrafund Transfers In
Admin/Athletic Ins/Sab Leave 200,000$ 200,000$ 210,000$
Revenue Allocations 34,239,354 34,239,354 35,758,619
Other 782,615 782,615 352,264
Total Intrafund Transfers In 35,221,969$ 35,221,969$ 36,320,883$
Total Estimated Revenues, Transfers 44,665,131$ 43,630,267$ 43,970,837$
Expenditures
Academic Salaries 24,672,835$ 24,055,496$ 23,973,855$
Classified Salaries 8,269,766 7,903,656 7,842,311
Benefits 7,606,478 7,582,861 7,098,001
Supplies 1,375,710 1,136,185 1,213,901
Services 2,458,696 1,608,801 2,284,872
Capital Outlay 551,385 316,071 569,790
Other Outgo - - -
Other Payments to Students 153,863 138,941 132,880
Interfund Transfers 680,899 674,323 563,914
Total Expenditures 45,769,632$ 43,416,334$ 43,679,524$
Intrafund Transfers Out
Admin/Athletic Ins/Sab Leave 239,530$ 239,530$ 204,766$
Other - - -
Total Intrafund Transfers Out 239,530$ 239,530$ 204,766$
Total Expenditures & Transfers 46,009,162$ 43,655,864$ 43,884,290$
Increase/(Decrease) in Fund Balance (1,344,031)$ (25,597)$ 86,546$
Beginning Balance 551,463$ 551,463$ 525,866$
Ending Balance (792,568)$ 525,866$ 612,412$
Budget as of 6/30/06
2005-2006 unaudited actual based on 8/18/06 Financial Status Report
Chabot-Las Positas Community College District
Adoption Budget
2006-07

30

Chabot College Expenditure Percentage Comparison for 2006-2007
55%
18%
16%
3%5%
2% 0%1%
Academic Salaries
Classified Salaries
Benefits
Supplies
Services
Capital Outlay
Other Outgo
Other Payments toStudents
Interfund Transfers
Chabot College Expenditures Compensation vs. All Other 2006-2007
89%
3%
5%
1%
0%
0%1%
Total Compensation
Supplies
Services
Capital Outlay
Other Outgo
Other Payments toStudents
Interfund Transfers

3033 Collier Canyon Road Livermore, California 94550
(925) 373-5800 www.laspositas.cc.ca.us
LAS POSITAS COLLEGE

33
Las Positas College Statements of Purpose and Intent
MISSION STATEMENT The Mission of Las Positas College is to foster growth and success, both in its students and in its community. The College strives to fulfill this Mission by offering high-quality, comprehensive educational programs and services. It augments and strengthens its Mission by partnering with local businesses and organizations to promote the welfare of its students and the economic and social health of its service area. Las Positas College:
Enables students to transfer to baccalaureate-granting institutions;
Prepares students for career entry and advancement;
Provides basic skills and English as a Second Language instruction;
Delivers quality, substantive student support services; and
Fosters student success through committed, exceptional faculty and staff. Las Positas College provides a strong instructional foundation for its students and aims to cultivate in them:
The ability to think critically;
An understanding and respect for difference and diversity;
The ability to make humane, informed, and ethical decisions;
The willingness to adapt to change in the workplace; and
The desire to participate in society as responsible citizens.
VALUES STATEMENT
Las Positas College thrives as a teaching and learning community committed to integrity and excellence. To nourish this environment and the communities served, we:
promote and celebrate lifelong learning;
anticipate and meet the needs of the ever-changing workplace;
demonstrate social and environmental responsibility;
promote tolerance and mutual respect in a diverse community;
foster a climate of discovery and creativity; and
hold firm to the belief that each of us makes an astonishing difference.

General Fund 2005-06 2005-06 2006-07
Las Positas College Adj Budget Unaudited Actual Budget
Estimated Revenues
State Revenues
General Apportionment 1,260,102$ 1,260,102$ -$
Other 2,341,028 2,203,348 2,144,296
Local Revenues
Property Taxes - - -
Enrollment Fees - - -
Other 1,452,761 1,399,404 1,667,519
Federal Revenues 818,571 749,670 642,068
Total Estimated Revenues 5,872,462$ 5,612,524$ 4,453,883$
Intrafund Transfers In
Admin/Athletic Ins/Sab Leave 200,000$ 200,000$ 210,000$
Revenue Allocations 19,354,298 19,354,298 20,747,396
Other 447,967 447,967 174,687
Total Intrafund Transfers In 20,002,265$ 20,002,265$ 21,132,083$
Total Estimated Revenues, Transfers 25,874,727$ 25,614,789$ 25,585,966$
Expenditures
Academic Salaries 13,657,416$ 13,656,572$ 13,201,959$
Classified Salaries 5,299,909 5,142,387 5,420,038
Benefits 4,211,878 4,215,559 4,319,780
Supplies 1,011,245 793,967 1,124,549
Services 1,474,845 1,209,891 1,142,614
Capital Outlay 403,451 381,814 116,586
Other Outgo - - -
Other Payments to Students 201,255 191,518 125,000
Interfund Transfers 5,731 5,731 -
Total Expenditures 26,265,730$ 25,597,439$ 25,450,526$
Intrafund Transfers Out
Admin/Athletic Ins/Sab Leave 120,026$ 120,026$ 104,393$
Other - - -
Total Intrafund Transfers Out 120,026$ 120,026$ 104,393$
Total Expenditures & Transfers 26,385,756$ 25,717,465$ 25,554,919$
Increase/(Decrease) in Fund Balance (511,029)$ (102,677)$ 31,048$
Beginning Balance 1,656,967$ 1,656,967$ 1,554,290$
Ending Balance 1,145,938$ 1,554,290$ 1,585,338$
Budget as of 6/30/06
2005-2006 unaudited actual based on 8/18/06 Financial Status Report
Chabot-Las Positas Community College District
Adoption Budget
2006-07

35

Las Positas College Expenditure Percentage Comparison for 2006-2007
52%
21%
17%
4%4%
1%0%
1%0%
Academic Salaries
Classified Salaries
Benefits
Supplies
Services
Capital Outlay
Other Outgo
Other Payments toStudents
Interfund Transfers
Las Positas College Expenditures Compensation vs. All Other 2006-2007
90%
4%4%
1%0%
1%0%
Total Compensation
Supplies
Services
Capital Outlay
Other Outgo
Other Payments toStudents
Interfund Transfers
5020 Franklin Drive Pleasanton, CA 94588
(925) 485-5208 www.clpccd.cc.ca.us
DISTRICT SERVICES
MAINTENANCE & OPERATIONS CONTRACT EDUCATION/
ECONOMIC DEVELOPMENT

38
General Fund 2005-06 2005-06 2006-07
District Services Adj Budget Unaudited Actual Budget
Estimated Revenues
State Revenues
General Apportionment 318,416$ 318,416$ -$
Other 1,061,723 907,227 3,303,217
Local Revenues
Property Taxes - - -
Enrollment Fees - - -
Other 1,364,388 1,354,142 1,474,599
Federal Revenues - - -
Total Estimated Revenues 2,744,527$ 2,579,785$ 4,777,816$
Intrafund Transfers In
Admin/Athletic Ins/Sab Leave 86,221$ 86,221$ 106,221$
Revenue Allocations 7,472,437 7,472,437 7,214,072
Other 196,628 196,628 -
Total Intrafund Transfers In 7,755,286$ 7,755,286$ 7,320,293$
Total Estimated Revenues, Transfers 10,499,813$ 10,335,071$ 12,098,109$
Expenditures
Academic Salaries 375,823$ 710,753$ 628,163$
Classified Salaries 4,571,680 4,065,699 4,878,349
Benefits 1,803,195 1,713,362 1,865,895
Supplies 235,355 238,354 452,474
Services 3,290,686 2,470,290 3,461,961
Capital Outlay 287,100 218,881 2,634,373
Other Outgo - - -
Other Payments to Students - - -
Interfund Transfers 978,234 980,136 388,903
Total Expenditures 11,542,073$ 10,397,475$ 14,310,118$
Intrafund Transfers Out
Admin/Athletic Ins/Sab Leave -$ -$ -$
Other - - -
Total Expenditures & Transfers 11,542,073$ 10,397,475$ 14,310,118$
Increase/(Decrease) in Fund Balance (1,042,260)$ (62,404)$ (2,212,009)$
Beginning Balance 3,880,877$ 3,880,877$ 3,818,473$
Ending Balance 2,838,617$ 3,818,473$ 1,606,464$
Budget as of 6/30/06
2005-2006 unaudited actual based on 8/18/06 Financial Status Report
Chabot-Las Positas Community College District
Adoption Budget
2006-07
0%0% 3%
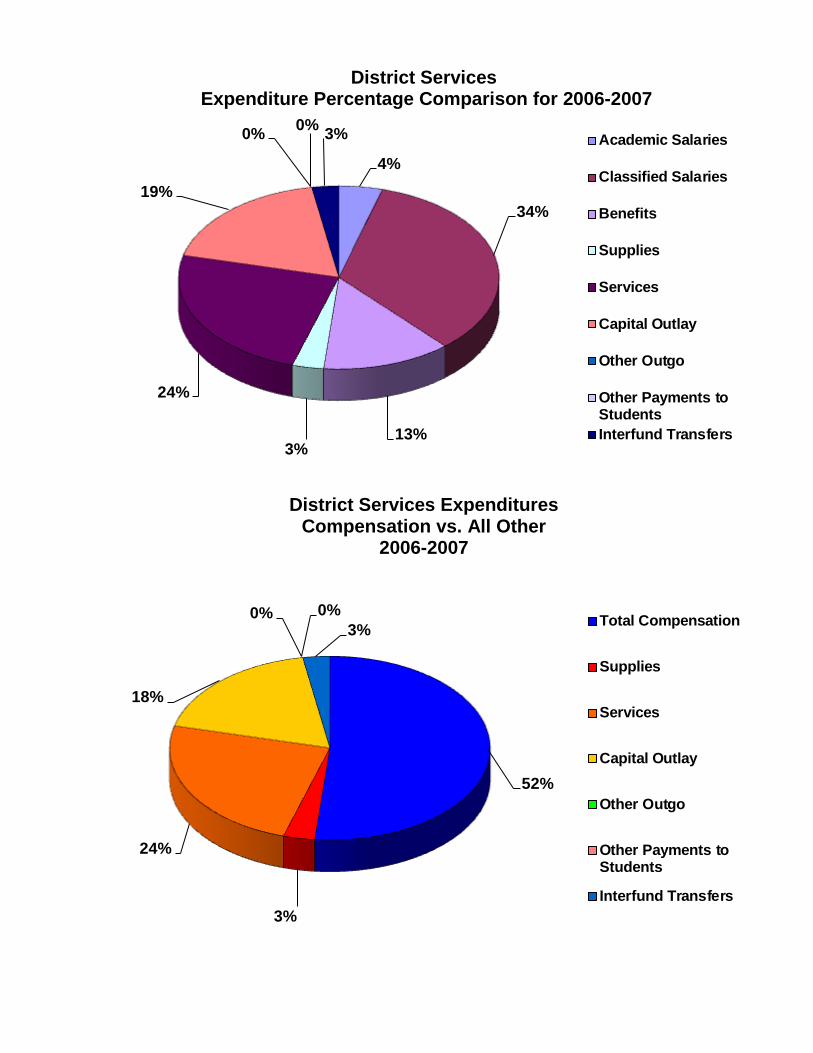
District Services Expenditure Percentage Comparison for 2006-2007
4%
34%
13%3%
24%
19%
0%0% 3% Academic Salaries
Classified Salaries
Benefits
Supplies
Services
Capital Outlay
Other Outgo
Other Payments toStudents
Interfund Transfers
District Services Expenditures Compensation vs. All Other
2006-2007
52%
3%
24%
18%
0% 0%
3%Total Compensation
Supplies
Services
Capital Outlay
Other Outgo
Other Payments toStudents
Interfund Transfers

40
General Fund 2005-06 2005-06 2006-07
Maintenance and Operations Adj Budget Unaudited Actual Budget
Estimated Revenues
State Revenues
General Apportionment 108,616$ 108,616$ -$
Other - - -
Local Revenues
Property Taxes - - -
Enrollment Fees - - -
Other 2,505 2,505 1,500
Federal Revenues - - -
Total Estimated Revenues 111,121$ 111,121$ 1,500$
Intrafund Transfers In
Admin/Athletic Ins/Sab Leave -$ -$ -$
Revenue Allocations 6,380,404 6,380,404 6,698,843
Other 107,508 107,508 794,314
Total Intrafund Transfers In 6,487,912$ 6,487,912$ 7,493,157$
Total Estimated Revenues, Transfers 6,599,033$ 6,599,033$ 7,494,657$
Expenditures
Academic Salaries -$ -$ -$
Classified Salaries 3,514,438 3,281,184 3,654,078
Benefits 1,449,286 1,359,844 1,547,758
Supplies 566,000 493,705 562,500
Services 1,749,286 2,044,144 2,577,600
Capital Outlay 81,000 69,574 82,000
Other Outgo - - -
Other Payments to Students - - -
Interfund Transfers - - -
Total Expenditures 7,360,010$ 7,248,451$ 8,423,936$
Intrafund Transfers Out
Admin/Athletic Ins/Sab Leave -$ -$ -$
Other - - -
Total Intrafund Transfers Out -$ -$ -$
Total Expenditures & Transfers 7,360,010$ 7,248,451$ 8,423,936$
Increase/(Decrease) in Fund Balance (760,977)$ (649,417)$ (929,279)$
Beginning Balance (525,336)$ (525,336)$ (1,174,754)$
Ending Balance (1,286,313)$ (1,174,753)$ (2,104,033)$
Budget as of 6/30/06
2005-2006 unaudited actual based on 8/18/06 Financial Status Report
Chabot-Las Positas Community College District
Adoption Budget
2006-07
0% 0%Academic Salaries

41

Maintenance and Operations Expenditure Percentage Comparison for 2006-2007
0%
43%
18%
7%
31%
1%
0%
0%0%
Academic Salaries
Classified Salaries
Benefits
Supplies
Services
Capital Outlay
Other Outgo
Other Payments toStudents
Interfund Transfers
Maintenance and Operations Expenditures Compensation vs. All Other
2006-2007
62%
7%
31%
1%0%
0%0%
Total Compensation
Supplies
Services
Capital Outlay
Other Outgo
Other Payments toStudents
Interfund Transfers

43
General Fund 2005-06 2005-06 2006-07
Contract Education-Economic Development Adj Budget Unaudited Actual Budget
Estimated Revenues
State Revenues
General Apportionment -$ -$ -$
Other 43,789 7,958 226,408
Local Revenues
Property Taxes - - -
Enrollment Fees - - -
Other 1,960,389 1,960,389 2,198,165
Federal Revenues - - -
Total Estimated Revenues 2,004,178$ 1,968,347$ 2,424,573$
Intrafund Transfers In
Admin/Athletic Ins/Sab Leave -$ -$ -$
Other - - - Sabbatical Leave - - -
Total Intrafund Transfers In -$ -$ -$
Total Estimated Revenues, Transfers 2,004,178$ 1,968,347$ 2,424,573$
Expenditures
Academic Salaries 5,000$ -$ -$
Classified Salaries 350,848 386,411 413,478
Benefits 103,076 102,101 114,960
Supplies 29,900 7,053 22,695
Services 1,164,474 956,363 1,281,660
Capital Outlay 3,510 368 2,750
Other Outgo - - -
Other Payments to Students - - -
Interfund Transfers - - -
Total Expenditures 1,656,808$ 1,452,296$ 1,835,543$
Intrafund Transfers Out
Admin/Athletic Ins/Sab Leave -$ -$ -$
Other - - -
Total Intrafund Transfers Out -$ -$ -$
Total Expenditures & Transfers 1,656,808$ 1,452,296$ 1,835,543$
Increase/(Decrease) in Fund Balance 347,370$ 516,051$ 589,030$
Beginning Balance (46,803)$ (46,803)$ 469,248$
Ending Balance 300,567$ 469,248$ 1,058,278$
Budget as of 6/30/06
2005-2006 unaudited actual based on 8/18/06 Financial Status Report
Chabot-Las Positas Community College District
Adoption Budget
2006-07

44
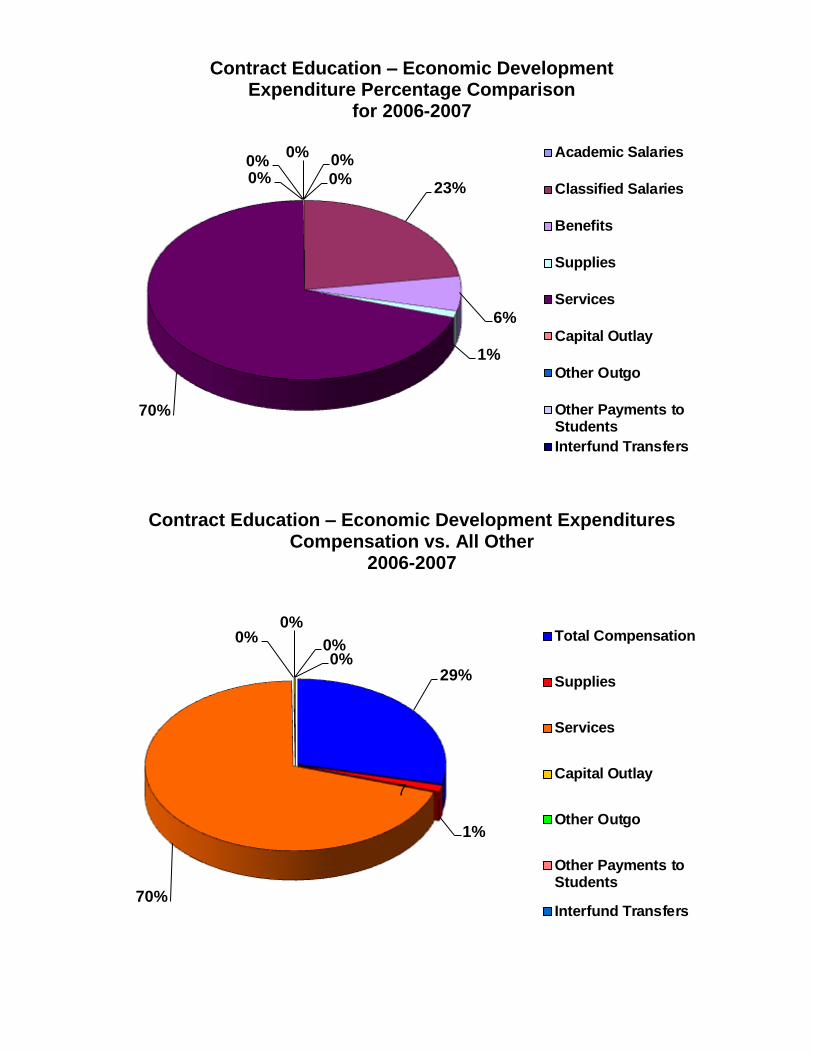
Contract Education – Economic Development Expenditure Percentage Comparison
for 2006-2007
0%
23%
6%
1%
70%
0%
0%0%
0%
Academic Salaries
Classified Salaries
Benefits
Supplies
Services
Capital Outlay
Other Outgo
Other Payments toStudents
Interfund Transfers
Contract Education – Economic Development Expenditures
Compensation vs. All Other 2006-2007
29%
1%
70%
0%0%
0%0%
Total Compensation
Supplies
Services
Capital Outlay
Other Outgo
Other Payments toStudents
Interfund Transfers
7

46
Other District Funds

47
Chabot - Las Positas Community College District Other District Funds
2006-2007 Expenditures
Cafeteria Fund ($42,348)
The purpose of the Cafeteria Fund is to record the revenues and expenses related to food service operations. At Chabot College and Las Positas College this consists of a cafeteria operated by an outside contractor and food & beverage vending machines, also operated by an outside contractor.
Child Development Fund ($2,254,448)
The purpose of the Child Development Fund is to record the revenues and expenses related to the operation of a child development center at Chabot College.
Capital Projects Fund ($4,856,132)
The purpose of the Capital Projects Fund is to record revenues and expenditures related to acquisition, construction or improvement of grounds or buildings, including scheduled maintenance projects. There are two subfunds associated with this fund: Capital Projects which accounts for all construction or improvement of grounds or buildings, including scheduled maintenance projects; and the Property Sale Fund which currently accounts for the moneys received for the sale of District owned property in Castro Valley (Nike site).
Self Insurance Fund ($2,935,434)
The purpose of the Self Insurance Fund is to account for the accumulation of funds to pay for the cost of retiree medical benefits. This fund is also referred to as the Retiree Unfunded Medical Benefit Liability (RUMBL) Fund.
The District pays for the cost of medical benefits for qualified retirees. An actuarial study completed in 2004 determined that the unfunded liability amounts to approximately $72 million. The annual increase in expenses is due to a combination of the increasing number of retirees and the increasing cost of the medical benefits. The transfer amount for 2006-07 has been increased to $3,098,189 to approximate actual annual cost.

48
Chabot - Las Positas Community College District Budget Calendar
2006 - 2007
Preliminary Budget
1/10 Report on Governor's 2006/07 budget proposal 1/12 Attend ACCCA Annual workshop on Governor's proposed budget 1/20 Develop and distribute initial Position Budget Worksheets. Budget
Worksheets, Instructions and District budget assumptions distributed to colleges and District Cost Center Managers
2/01 Develop and submit budget assumptions from colleges and District (including M & O)
2/14 Submit position corrections/adjustments to District Business Office
2/21 Final adjustments entered and all budgets loaded, site revenue projections to District Business Office; Preliminary revenue allocations to Colleges
3/01 Send preliminary Budget Worksheets and revised Position Budget
Worksheets to Colleges and District Cost Center Managers
3/06 Preliminary Budget prepared
Tentative Budget
4/14 Submit Position corrections/adjustments to District Business Office; final
budget entries loaded, adjustments to site revenue projections
4/21 Review Tentative Budget Worksheets
5/03 Prepare Draft Tentative Budget
5/12 Review Draft Tentative Budget
5/15 Correct/adjust final Position Budget Worksheets 5/19 Enter final corrections (balanced), adjust site revenue projections 5/26 Prepare Draft Tentative Budget for submission 6/06 Conduct Board of Trustees Budget Workshop 6/09 Load Budget into Operation Accounts

49
6/13 Prepare Tentative Budget for submission to the Board of Trustees
6/27 Recommend adoption of Tentative Budget to Board of Trustees; Tentative Budget adopted
Adoption Budget
7/24 Send out final Position Budget Worksheets and Budget Worksheets
8/07 Enter Adjustments and corrections for the Adoption Budget. Adjust site revenue projections to District Office
8/21 Prepare Adoption Budget for submission to the Board of Trustees 9/05 Recommend adoption to Board of Trustees: Adopt Adoption Budget 9/08 Load Budget adjustments into Operation Accounts 45 Days After Signing/Board Meeting
Present major revisions to the Adoption Budget based on State Budget Bill being signed into law

50
GLOSSARY OF FINANCE TERMS
Accounting - The process of identifying, measuring, and communicating financial information to permit informed judgments and decisions by users. Base Revenue - The districts’ total prior year revenue from state general apportionments, local property tax revenue, and student enrollment fees, adjusted when applicable for projected deficits. Allocation - Division or distribution of resources according to a predetermined plan. Apportionment - Federal or state taxes distributed to college districts or other governmental units according to certain formulas. Appropriation - An allocation of funds made by a legislative or governing body for a specified time and purpose. Assessed Value - The value of land, homes or businesses set by the county assessor for property tax purposes. Assessed value is either the appraised value of any newly built or purchased property or the value on March 1, 1975, of continuously owned property, plus an annual increase. This increase is tied to the California Consumer Price Index but may not exceed 2%. Auxiliary Operations - Supportive services and/or specialized programs for the general benefit of the college(s). Food service and dormitories are examples of auxiliary operations. Base Year - A year to which reference is made when projecting a current condition. Block Grant - A fixed sum of money not linked to enrollment/FTES measures. Board of Governors - The statewide governing board of the community colleges. The members are appointed by the Governor. The Board hires the Chancellor of the California Community Colleges and makes policy decisions that affect all districts. The Board may be directed by the Legislature to regulate certain matters and it may choose to regulate others. Board of Trustees - The local governing board of each community college district. Its members are elected from the service area. The board hires the chief administrator of the district and directs the operations of the district. It makes policy decisions that are permitted or mandated at the local level. Budget - A plan of financial operation for a given period of a specified purpose consisting of an estimate of revenue and expenditures. (Ideally, an educational plan expressed in dollars.) Budget Act - The legislative vehicle for the state’s budget appropriations. The Constitution requires that it be passed by a two-thirds vote of each house and sent to the Governor by June 15 each year. The Governor may reduce or delete, but not increase, individual items.

51
Budgeting - The process of allocation available resources among potential activities to achieve the objectives of an organization. Categorical Funds - Funds received by a district for a certain purpose, which can only be spent for that purpose. Examples: Funding for the disabled, EOPS, deferred maintenance, and matriculation. Chart of Accounts - A systematic list of accounts applicable to a specific entity. Consumer Price Index (CPI) - A measure of the cost of living compiled by the United States Bureau of Labor Statistics. These indices of inflation are calculated regularly for the United States, California, some regions with in California, and selected cities. The CPI is one of several measures of economic change. Cost of Living Adjustments (COLA) - an increase in funding for revenue limits or categorical programs. Current law ties COLAs to indices of inflation, although different amounts are appropriated in some years. Course Classification - All courses offered by a college are classified by are (Examples: Letters and Science, Vocational, Community Services, etc.), by credit given, and by transferability, and this information is submitted to the State Chancellor’s Office. Current Expense of Education (CEE) - ECS 84362 - The current General Fund operation expenditures of a community college district excluding expenditures for food services, community services, object classifications 6000 (except equipment replacement) and 7000, and other costs specified in law and regulations. Scheduled Maintenance - Major repairs of buildings and equipment. Some matching state funds are available to districts, which establish a scheduled maintenance program. Education Code - The primary body of law, which regulates education in California. Additional laws are contained in the California Code of Regulations, Title 5, the Government Code, and general statutes. Encumbrances - Obligations in the form of purchase orders, contracts, salaries, and other commitments for which part of an appropriation is reserved. Enrollment/FTES Cap - A limit on the number of students (FTES) for which the state will provide funding. Equalization - Funds allocated by the Legislature to raise districts with lower revenue limits toward the statewide average. Expenditures - Amounts disbursed for all purposes. Accounts kept on an accrual basis include all charges whether paid or not. Accounts kept on a cash bias include only actual cash disbursements.
52
Fifty Percent Law - Requires that fifty percent of district expenditures in certain categories must be spent for salaries and benefits of classroom instructors and some instructional aides. Salaries of counselors and librarians are not included in this classification. Full-time Equivalent Student - An FTES is a student workload measure that represents 525 class (contact) hours of student instruction/activity in credit and non-credit courses. Full-time equivalent student (FTES) is one of the workload measures used in the computation of state support for California community colleges. Fund - An independent fiscal and accounting entity with a self-balancing set of accounts for recording cash and other financial resources, together with all related liabilities and residual equities or balances, and changes therein. Fund Balance - The difference between assets and liabilities. General Fund - The fund used to account for the ordinary operations of the district. It is available for any legally authorized purpose not specified for payment by other funds. Inflation Factor - An increase in apportionment provided by the state to reflect the increased cost of operation due to inflation. Lottery - Approved by voters in November 1984, lottery games began in October 1985. Of the total lottery revenues generated, a minimum of 34% must be distributed to public schools and colleges for “education of pupils.” Lottery income has added about 3% - 4% to community college funding. Mandated Costs - College district expenditures, which occur as a result of federal or state law, court decisions, demonstrative regulations, or initiative measures. Marginal Funding - A procedure whereby the gain or loss in funds for growth or decline in FTES is computed at a rate, which is less than the average revenue per FTES. Noncredit FTES - FTES earned in non-credit courses, generally adult education. Object - Expenditure classification category of an item or a service purchased. Per Capita Personal Income - Income before taxes as estimated by the U.S. Department of Commerce. Program-Based Funding - A system whereby a program or activity generates revenue based on a formula or allocation without specifying where and how the funds must be spent. Proposition 13 - An initiative amendment passed in June 1978, adding Article XIII A to the California Constitution. Tax rates on secured property are restricted to no more than 1% of full cash value. Proposition 13 also defined assessed value and required a two-thirds vote to change existing or levy other new taxes.

53
Reserve - Funds set aside in a college district budget to provide for future expenditures or to offset future losses, for working capital, or for other purposes. Restricted Funds - Money, which must be spent for a specific purpose either by law or by local board action. Revenue - Income from all sources. Revenue Limit - The specific amount of student enrollment fees, state and local taxes a college district may receive per pupil for its general education program. Annual increases are determined by Proposition 98 formula or the Legislature. Shortfall - An insufficient allocation of money, requiring an additional appropriation or resulting in deficits. Split Roll - A system for taxing business and industrial property at a different rate from individual homeowners. State Apportionment - An allocation of state money to a district based on total available general revenues less property taxes and enrollment fees. Subventions - Provision of assistance or financial support, usually from higher governmental units to local governments or college districts, for example, to compensate for loss of funds due to tax exemptions. Sunset - The termination of the regulations for a categorical program or regulation. Tidelands Oil Revenues - Money from oil on state-owned lands. When available, some of the revenues are appropriated for community college capital outlay needs. TOP Code - Taxonomy of Programs code number used in budget. Unencumbered Balance - That portion of an appropriation or allotment not yet expended or obligated. Unfunded FTES - FTES which are generated in excess of the enrollment/FTES cap.