denitrification in low loaded trickling … hub documents/research reports/1825-1 … · as the...
TRANSCRIPT

DENITRIFICATION IN LOW LOADED TRICKLING FILTERS: A CASE STUDY OF THE HISTORIC TRICKLING FILTERS AT THE
DASPOORT WASTEWATER TREATMENT WORKS
Report to the WATER RESEARCH COMMISSION
by
JA Wilsenach, L Burke, BV Radebe, MR Mashego, W Stone, and M Mouton
Natural Resources and Environment, CSIR
WRC Report No. 1825/1/13 ISBN No 978-1-4312-0502-8
February 2014

Obtainable from
Water Research Commission Private Bag X03 Gezina, 0031 [email protected] or download from www.wrc.org.za
DISCLAIMER This report has been reviewed by the Water Research Commission (WRC) and approved for
publication. Approval does not signify that the contents necessarily reflect the views and policies of the WRC, nor does mention of trade names or commercial products constitute
endorsement or recommendation for use.
© Water Research Commission
ii
iii
EXECUTIVE SUMMARY Within South Africa, at least 130 municipal wastewater treatment works, and another 50 at government institutions, employ trickling filters of some sort, either as part of a process, or as the sole biological treatment process. Trickling filters are not only found at small towns or remote rural settlements, but are often part of large treatment works, such as Rooiwal Northern Works (220 Mℓ/d), Olifantsfontein (105 Mℓ/d), Daspoort (55 Mℓ/d) and Paarl (25 Mℓ/d). Amidst current concerns of under-investment in wastewater treatment infrastructure, always in competition with other services for funding, existing trickling filters deserve more attention. Firstly, there is the possibility that existing trickling filters operate far below their potential. Secondly, trickling filters could play alternative roles as part of integrated processes. Thirdly, trickling filters are resilient, which means they withstand variation well and recover quickly from shock loads. There is good reason to believe that trickling filters are in some cases superior, or at least equal, to any other treatment system and that trickling filters may sometimes be the most appropriate technology when considering upgrade or construction of new works. The aims of this project were to: • Describe the recent historic nitrogen removal performance of old biological trickling
filters at Daspoort wastewater treatment works. • Describe the differences in seasonal performance of trickling filters (between
summer and winter) and to determine the reasons for the different process performances.
• Establish on full scale whether nitrogen removal could be further improved through recycling of effluent over the trickling filter, at different rates, and by changing the distribution arm rotation speed.
• Identify the mechanisms and microbiological processes that play important roles in the nitrogen removal efficacy of the Daspoort trickling filters.
METHOD Historical data from the City of Tshwane‘s analytical services at Daspoort Wastewater Treatment Works was used to evaluate the recent performance of the process. The data, from 2004 up till 2012, were used to compare the nitrogen removal with COD removal over the trickling filters. Raw wastewater data were adjusted to represent settled wastewater, based on some historic measurements of both raw and settled wastewater. Nitrogen and COD removal were then calculated as the difference between settled wastewater and final effluent concentrations.

iv
In a first series of new experiments, one full scale unit, consisting of four trickling filters at Daspoort’s Old Works, was modified with a recycle pump to return trickling filter effluent to the siphon tank. The effect of recycling was compared to a control unit, also consisting four tickling filters, without recycling. The settled wastewater inflow to recycle ratio was successively set to 1:1, 2:1 and 1:2. The rotation speed of the distribution arms of two trickling filters (one receiving recycle flow, and one control unit) was subsequently reduced by turning one of the distribution arms around for reverse hydraulic thrust. In a second series of experiments, filter media obtained from 0.9 m deep was put into two glass reactors and sparged with air and nitrogen gas respectively to create aerobic and anaerobic conditions. Batch processes were run with an ammonium nitrite feed mixture. Sludge from the trickling filters was tested for the presence of anammox bacteria using the polymerase chain reaction to amplify taxonomic informative gene sequences of the 16S rRNA gene cluster. RESULTS AND CONCLUSIONS Historic data showed a remarkable removal of nitrogen, relative to COD removal in what was believed to be mostly an aerobic environment. Based on the normal ratio of COD to nitrogen removal for ordinary heterotrophic denitrification, it seems that half of the total COD removed, was used for anoxic denitrification. Data from one out of every four days indicated that, based on the stoichiometry, more COD was removed in the anoxic processes than in the aerobic processes. In some cases, the COD removal could not account for the nitrogen removal, even if complete anoxic conditions were assumed. During the full scale experiments, at a recycle:wastewater ratio of 1:1, the recycled nitrate-rich trickling filter effluent had a statistically significant but not drastic effect on the removal of nitrogen. At a higher recycle ratio, the effluent nitrate concentration increased slightly, while the overall nitrogen removal performance got worse. Reducing the distribution arm rotation speed had little effect on the effluent nitrogen concentration. Interestingly, the nitrogen removal over full-scale trickling filters could not be fully explained by the amount of COD available for normal heterotrophic denitrification. During aerobic laboratory batch experiments, nitrification of ammonium and nitrite was complete, as expected. During anaerobic batch experiments, nitrite and ammonium were removed, and at a much higher rate than the removal of nitrate. The removal of nitrate and COD could be explained by normal heterotrophic denitrification, if the catabolic oxidation of COD only was taken into account. There was however not nearly enough COD for removal of nitrite, even considering the catabolic reaction only. Removal of ammonium and nitrite was statistically well correlated, and the ammonium:nitrite stoichiometric removal ratio was 1:1.3, which is typical for anaerobic ammonium oxidation. Furthermore, PCR analyses of the

v
metagenomic DNA revealed the presence of a bacterium closely related to Candidatus Brocadia anammoxidans, which was the first ever anammox bacterium species discovered. As far as we know, the finding of an anammox bacterial species at Daspoort is the first of its kind in South Africa. In the laboratory batch experiments, the rate of the combined ammonium and nitrite removal under optimum anaerobic conditions was higher than the rate of ammonium or nitrite oxidation under optimum aerobic conditions. It was ultimately concluded that nitrogen removal over the Daspoort trickling filters is not only a function of conventional heterotrophic denitrification, but that an anaerobic ammonium oxidation process plays an important role. The slow growth rate of anammox bacteria is often seen as a limitation in process technology (Van Rijn et al., 2006), but these bacteria are in fact ubiquitous in nature. This natural occurrence is underlined by the finding of anammox in Daspoort’s old trickling filters, which have been functional since long before the discovery of anammox bacteria! This work opens the door for further research to unravel those conditions that lead to superior nitrogen removal in microbial biofilm consortia in ordinary trickling filters.

vi
ACKNOWLEDGEMENTS The authors would like to thank the Reference Group of the WRC Project for the assistance and the constructive discussions during the project: Dr Valerie Naidoo Water Research Commission, Chairperson Mr Chris Brouckaert University of KwaZulu-Natal Mr Walter Johannes Africon International Engineering (Pty) Ltd Mr Koos Wilken ERWAT Prof Alf Botha University of Stellenbosch Prof Evans Chirwa University of Pretoria Prof Thokozani Majozi University of the Witwatersrand Prof Jannie Maree Tshwane University of Technology The authors wish to express gratitude towards the City of Tshwane for permission to study the full scale trickling filters at Daspoort Wastewater Treatment Works, and for maintaining these old work horses over the past 100 years! Moreover, without the kind and enthusiastic assistance of the following personnel, the project would not have been possible: Mr David Entshowe, Mr Willie Els, Mr George Potgieter, Mr Kerneels Esterhuyse, and Mr Koot Snyman May these wastewater operators and professionals be empowered to continue their good work.

vii
KNOWLEDGE DISSEMINATION Post graduate students and completed degrees Radebe, V.B. (2012), M.Tech (Water Care) Tshwane University of Technology, Simultaneous nitrification and denitrification using trickling filters. Peer reviewed articles published Wilsenach, J., Burke, L., Radebe, V., Mashego, M., Stone, W., Mouton, M. and Botha, A. (2013) Anaerobic ammonium oxidation in the old trickling filters at Daspoort Wastewater Treatment Works, Water SA (In press). Conferences attended Radebe, V.B., Mashego, M., Maree, J.P. and Wilsenach, J. (2012) Simultaneous nitrification and denitrification using trickling filters, Proceedings from WISA bi-annual conference, Cape Town. Workshops Appropriate Technologies: Denitrification in Trickling Filters; 18 July 2013, at the Water Research Commission, Rietfontein, Pretoria.

viii

ix
TABLE OF CONTENTS
1 INTRODUCTION ....................................................................................................... 1
1.1. WASTEWATER TREATMENT OLD AND NEW ............................................................... 1
1.2. NITROGEN REMOVAL IN WASTEWATER TREATMENT .................................................. 1
1.3. TRICKLING FILTERS IN WASTEWATER TREATMENT ...................................................... 4
1.4. CURRENT WASTEWATER EFFLUENT QUALITY REQUIREMENTS ..................................... 4
1.5. AIMS OF THE PROJECT ............................................................................................. 5
2 LITERATURE REVIEW ................................................................................................ 7
2.1 BIOFILM AND BIO-FILTER PROCESSES ........................................................................ 7
2.2 SIMULTANEOUS NITRIFICATION AND DENITRIFICATION IN TRICKLING FILTERS .............. 9
2.3 MATHEMATICAL MODELLING APPROACHES ............................................................ 11
3 RECENT PERFORMANCE OF TRICKLING FILTERS AT THE OLD DASPOORT WASTEWATER TREATMENT WORKS ........................................................................ 13
3.1 INTRODUCTION TO TRICKLING FILTERS IN CITY OF TSHWANE .................................... 13
3.2 HISTORICAL DATA ................................................................................................. 14
3.2.1 Data set: water chemistry analysis .......................................................................... 14
3.2.2 Data set: flow rate ................................................................................................. 16
3.3 Results and discussion ........................................................................................... 16
4 EXPERIMENTAL WORK ON FULL SCALE TRICKLING FILTERS (DASPOORT EASTERN WORKS) ............................................................................................................... 20
4.1 INTRODUCTION AND AIMS ..................................................................................... 20
4.2 MATERIALS AND METHODS .................................................................................... 20
4.2.1 Settled sewage flow and recycle flow ...................................................................... 20
4.2.2 Distribution arm rotation speed .............................................................................. 21
4.2.3 Sampling and analysis ............................................................................................ 22
4.3 EFFECTS OF EFFLUENT RECYCLE OVER TRICKLING FILTERS ON NITROGEN REMOVAL .... 22
4.4 EFFECTS OF DISTRIBUTION ARM ROTATION SPEED ON NITROGEN REMOVAL .............. 25
4.5 EFFECTS OF TEMPERATURE ON NITROGEN REMOVAL ............................................... 26

x
4.6 CONCLUSIONS ON FULL SCALE TRICKLING FILTER OPERATION ................................... 28
5 THE ROLE OF ANAEROBIC AMMONIUM OXIDATION IN TRICKLING FILTERS AT THE OLD DASPOORT WASTEWATER TREATMENT WORKS ................................................ 29
5.1 INTRODUCTION AND AIMS ..................................................................................... 29
5.2 MATERIALS AND METHOD ..................................................................................... 29
5.2.1 Sludge collection for DNA extraction ....................................................................... 29
5.2.2 DNA extraction and PCR amplification of the 16S rRNA gene ..................................... 30
5.2.3 Sludge collection for batch reactors ........................................................................ 30
5.2.4 Experimental set-up .............................................................................................. 32
5.2.5 Feed solution and batch feeding ............................................................................. 32
5.2.6 Sampling and analysis ............................................................................................ 33
5.3 RESULTS ............................................................................................................... 33
5.3.1 Molecular microbiology ......................................................................................... 33
5.3.2 Aerobic batch process results ................................................................................. 35
5.3.3 Anaerobic batch process results ............................................................................. 37
5.3.4 Comparison of removal rates ................................................................................. 40
5.4 DISCUSSION .......................................................................................................... 40
5.5 CONCLUSIONS ON BATCH EXPERIMENTS ................................................................. 44
6 CONCEPT MATHEMATICAL MODEL ......................................................................... 45
6.1 MODEL STRUCTURE ............................................................................................... 45
6.2 PROCESS STOICHIOMETRY AND KINETICS ................................................................ 47
6.3 PHYSICAL PROPERTIES AND MASS TRANSFER ........................................................... 50
6.3.1 Air flow rate and oxygen uptake ............................................................................. 50
6.3.2 Hydraulic loading, shear and sloughing .................................................................... 51
6.3.3 Biofilm diffusion .................................................................................................... 51
7 THE FUTURE OF TRICKLING FILTERS: EVALUATION OF THE ROLE AND POTENTIAL OF TRICKLING FILTERS ................................................................................................ 53
7.1 TRICKLING FILTERS: SUSTAINABLE AND APPROPRIATE TECHNOLOGY ........................ 53
7.2 ENVIRONMENTAL IMPACT ..................................................................................... 55
7.2.1 Wastewater effluent quality ................................................................................... 55
7.2.2 Air quality ............................................................................................................. 56

xi
7.2.3 Sludge handling and disposal .................................................................................. 56
7.2.4 Prevention of natural resource depletion ................................................................ 56
7.3 LIFE CYCLE COST .................................................................................................... 57
7.3.1 Construction cost .................................................................................................. 57
7.3.2 Financing .............................................................................................................. 58
7.3.3 Operation and maintenance ................................................................................... 58
7.4 RISK OF PROCESS FAILURE ...................................................................................... 59
7.4.1 Consistent effluent quality (biochemical process stability, resilience) ......................... 59
7.4.2 Number of moving parts ........................................................................................ 60
7.4.3 Myth of control ..................................................................................................... 60
7.5 TRICKLING FILTER INTEGRATION WITHIN THE WASTEWATER TREATMENT SYSTEM ..... 60
7.5.1 Single pass (parallel) reactor ................................................................................... 60
7.5.2 In-series reactors .................................................................................................. 61
7.5.3 Side stream reactor combinations ........................................................................... 61
8 CONCLUSIONS ...................................................................................................... 62 9 RECOMMENDATIONS FOR FUTURE RESEARCH ......................................................... 63 10 LIST OF REFERENCES .............................................................................................. 66 APPENDIX A: LIST OF SOUTH AFRICAN WASTEWATER TREATMENT WORKS THAT EMPLOY
TRICKLING FILTERS AS PART OF THE PROCESS .......................................................... 70 APPENDIX B: DASPOORT WWTW HISTORIC DATA REVISION ................................................. 74 APPENDIX C: DASPOORT WWTW FULL SCALE EXPERIMENTAL WORK .................................... 81
xii
List of Figures
Figure 1: The Nitrogen Cycle: Pathways for biological nitrogen removal from wastewater. 2 Figure 2: Nitrification and denitrification in conventional activated sludge plants. ............. 9 Figure 3: Conceptual understanding of nitrification in biofilms (Nijhof and Klapwijk, 1995),
which is further developed in this work to include anoxic and anaerobic process. ............................................................................................................................... 12
Figure 4: A Google Earth© image of the Daspoort WWTW (Eastern Works). .................... 13 Figure 5: A graphical representation of the Daspoort WWTW, describing the sampling
point, the humus sludge withdrawal valve, in relation to the trickling filter wastewater treatment process ............................................................................. 14
Figure 6: Seasonal variations of settled sewage TKN and COD concentrations, and effluent ammonium and nitrate concentrations at Daspoort Eastern Wastewater Treatment works ................................................................................................... 17
Figure 7: Daspoort WWTW flow rate with the concentrations on the same dates. ........... 18 Figure 8: Ammonium concentrations entering with the raw wastewater vs. concentration
of nitrogen removed by the trickling filters. ......................................................... 19 Figure 9: Reducing distribution arm rotation speed via reverse hydraulic thrust .............. 21 Figure 10: Effect of different effluent recycle rates on final effluent nitrate concentrations,
for experiments in February and March 2010 ...................................................... 23 Figure 11: Effect of distribution arm rotation speed on ammonium concentrations in
trickling filters, with and without effluent recycle (January and February 2011) 25 Figure 12: Effect of distribution arm rotation speed on nitrate concentrations in trickling
filters, with and without effluent recycle (January and February 2011) .............. 25 Figure 13: Effect of temperature gradient, between water and ambient temperature
atmosphere, on ammonium and nitrate concentrations and total nitrogen removed. ............................................................................................................... 27
Figure 14: The surface layer of the trickling filter medium covered with biofilm. ................ 31 Figure 15: Digging in Daspoort trickling filters (left) to acquire stones with biofilm and
biomass at a depth of exactly 0.9 m (right, author with ruler) ............................ 31 Figure 16: Laboratory-scale aerobic (left) and anaerobic (right) batch reactors filled with
trickling filter media. ............................................................................................. 32 Figure 17: Gel electrophoresis of the 16S rDNA taxonomic gene fragments amplified from
DNA extracted from biomass sampled from the trickling filters of Daspoort WWTW. ................................................................................................................. 34
Figure 18: Phylogenetic tree based on 16S rRNA gene sequences originating from an anammox strain named DTFamx occurring in a trickling filter at the Daspoort WWTW .................................................................................................................. 34

xiii
Figure 19: Results from four aerobic batch processes. (Chemical oxygen demand = COD; ammonium/ammonia-nitrogen = NH3-N; nitrate-nitrogen = NO3-N; nitrite-nitrogen = NO2-N). ................................................................................................ 35
Figure 20: The total nitrogen concentration in the aerobic reactor during the experimental periods. ................................................................................................................. 37
Figure 21: Results from four anaerobic batch processes. (Chemical oxygen demand = COD; ammonium/ammonia-nitrogen = NH3-N; nitrate-nitrogen = NO3-N; nitrite-nitrogen = NO2-N). ................................................................................................ 38
Figure 22: The total nitrogen concentration in the anaerobic reactor during the experimental periods. ........................................................................................... 39
Figure 23: Biofilm process model for the denitrification in trickling filters, including anaerobic ammonium oxidation ........................................................................... 45
Figure 24: Simplified biofilm process stoichiometric model for the denitrification in trickling filters. .................................................................................................................... 47

xiv
List of Tables
Table 1: Loading rates of trickling filters ................................................................................... 4 Table 2: General limit and special limit standards according to the General Authorisation in
terms of section 39 of the Water Act 1998. ................................................................ 5 Table 3: Micrographs showing bacterial stratification in biofilm as a result of chemical
gradients from different studies. ................................................................................. 8 Table 4: Distribution arm rotation speed ................................................................................ 21 Table 5: Effects of 1:1 effluent recycle on final effluent nitrate concentration for 11
experiments in January and February 2011 .............................................................. 24 Table 6: Summary of nitrogen removal results (aerobic and anaerobic batch experiments) 40 Table 7: Summary of nitrogen removal results (aerobic and anaerobic batch experiments) 48 Table 8: Process rate equations .............................................................................................. 49 Table 9: Summary of nitrogen removal model parameters .................................................... 49

1
1 INTRODUCTION
1.1. Wastewater treatment old and new Wastewater treatment has been part of industrialized societies since the late 1800’s. During the past century, wastewater treatment systems evolved from rudimentary systems like trickling filters and the Dutch "pasveer" ditches, to advanced biological nutrient removal activated sludge processes, and beyond. Recent inventions include membrane bioreactors with low cross membrane pressures, as well as the more exotic aerobic granular reactors, to name but two. Internationally, the drivers for improvement of wastewater treatment processes have been the increasingly strict effluent standards, life cycle costs and, more recently, the need for sustainable systems. The following quotation from Piret et al. (1939) is therefore interesting: “During the past decade cities and industries have been forced more and more because of social and economic pressures, to treat their waste waters. Unfortunately, adequate disposal systems are being installed very slowly because the methods of treatment now employed are extremely costly and place a heavy burden on the taxpayers or concerns involved.” These sentiments still ring clear today, almost 75 years later, especially in the less developed world. In this wonderful paradox lies a hint: while new technology – fuelled by the imagination of innovators with the aid of powerful new computational techniques and molecular methods – is developed at astonishing rates, the workhorses of yesteryear may still offer much. If the drivers for improvement remain unchanged, then by revisiting old treatment processes, and the literature that described these, we may gain insights into new concepts.
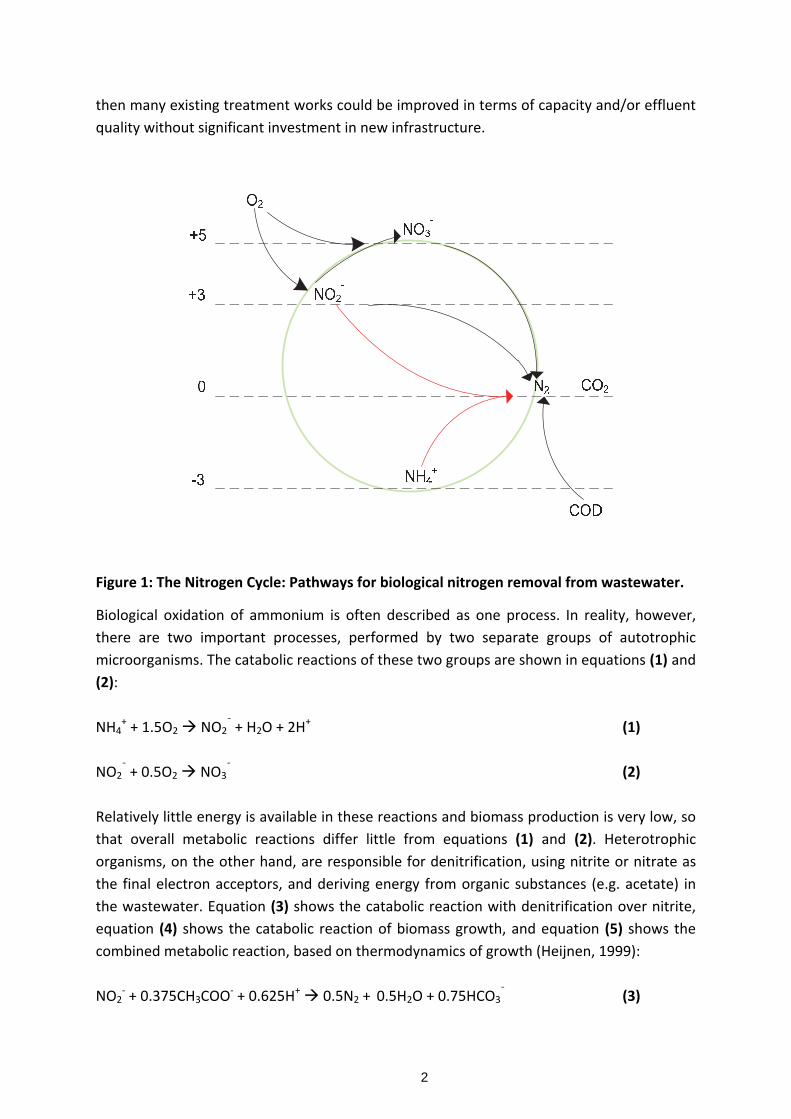
1.2. Nitrogen removal in wastewater treatment Ammonium in wastewater is toxic to fresh water organisms and depletes oxygen in surface waters. Nitrate in freshwater causes eutrophication, and can cause serious health problems, especially in children, at concentrations above 10 mg N/ℓ. For these reasons, ammonium and nitrate must be removed from wastewater, regardless of the type of technology applied. Ammonium and nitrate are commonly removed through biological processes in separate reactor zones. Figure 1 illustrates the pathways through which nitrogen is removed from wastewater. Simultaneous nitrification and denitrification in a single reactor has many advantages over the separated processes, such as reduction of reactor volume, application in existing facilities without structural modification, and ultimately improved effluent quality. Moreover, if this could be achieved in trickling filters,
2
then many existing treatment works could be improved in terms of capacity and/or effluent quality without significant investment in new infrastructure.
Figure 1: The Nitrogen Cycle: Pathways for biological nitrogen removal from wastewater.
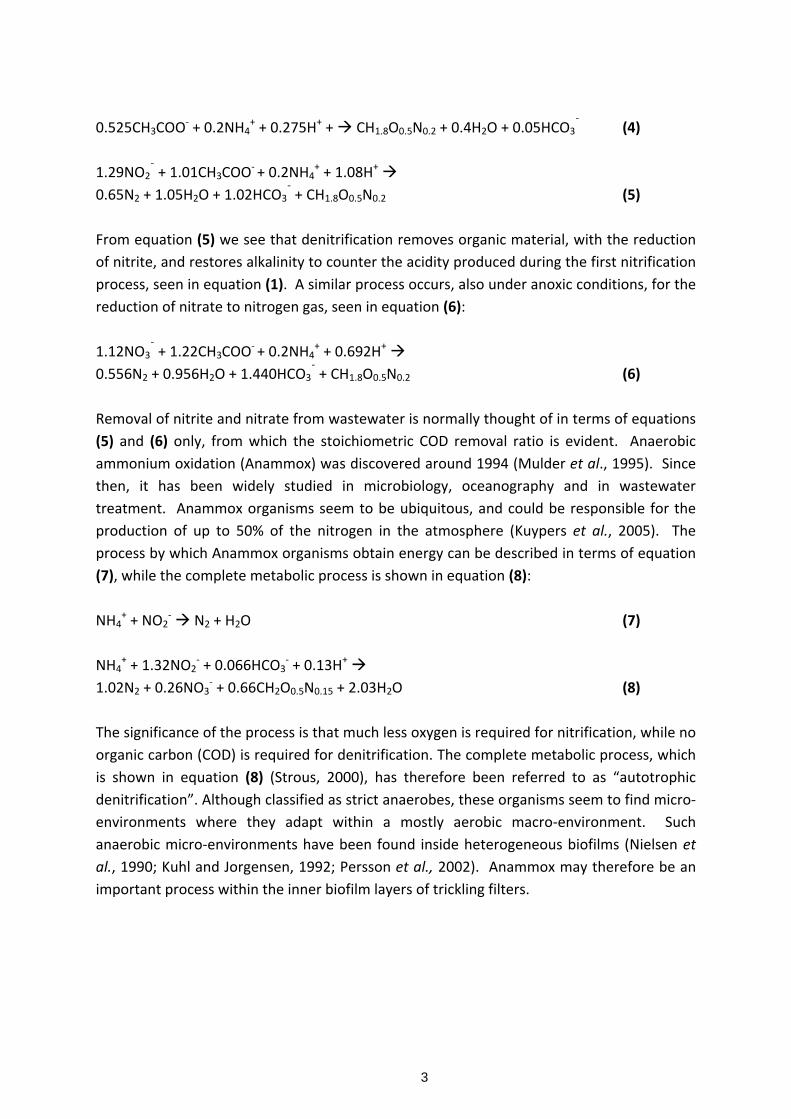
Biological oxidation of ammonium is often described as one process. In reality, however, there are two important processes, performed by two separate groups of autotrophic microorganisms. The catabolic reactions of these two groups are shown in equations (1) and (2): NH4
+ + 1.5O2 NO2ˉ + H2O + 2H+ (1)
NO2
ˉ + 0.5O2 NO3ˉ (2)
Relatively little energy is available in these reactions and biomass production is very low, so that overall metabolic reactions differ little from equations (1) and (2). Heterotrophic organisms, on the other hand, are responsible for denitrification, using nitrite or nitrate as the final electron acceptors, and deriving energy from organic substances (e.g. acetate) in the wastewater. Equation (3) shows the catabolic reaction with denitrification over nitrite, equation (4) shows the catabolic reaction of biomass growth, and equation (5) shows the combined metabolic reaction, based on thermodynamics of growth (Heijnen, 1999): NO2
- + 0.375CH3COO- + 0.625H+ 0.5N2 + 0.5H2O + 0.75HCO3ˉ (3)
3
0.525CH3COO- + 0.2NH4
+ + 0.275H+ + CH1.8O0.5N0.2 + 0.4H2O + 0.05HCO3ˉ (4)
1.29NO2
ˉ + 1.01CH3COO- + 0.2NH4+ + 1.08H+
0.65N2 + 1.05H2O + 1.02HCO3ˉ + CH1.8O0.5N0.2 (5)
From equation (5) we see that denitrification removes organic material, with the reduction of nitrite, and restores alkalinity to counter the acidity produced during the first nitrification process, seen in equation (1). A similar process occurs, also under anoxic conditions, for the reduction of nitrate to nitrogen gas, seen in equation (6): 1.12NO3
ˉ + 1.22CH3COO- + 0.2NH4+ + 0.692H+
0.556N2 + 0.956H2O + 1.440HCO3ˉ + CH1.8O0.5N0.2 (6)
Removal of nitrite and nitrate from wastewater is normally thought of in terms of equations (5) and (6) only, from which the stoichiometric COD removal ratio is evident. Anaerobic ammonium oxidation (Anammox) was discovered around 1994 (Mulder et al., 1995). Since then, it has been widely studied in microbiology, oceanography and in wastewater treatment. Anammox organisms seem to be ubiquitous, and could be responsible for the production of up to 50% of the nitrogen in the atmosphere (Kuypers et al., 2005). The process by which Anammox organisms obtain energy can be described in terms of equation (7), while the complete metabolic process is shown in equation (8): NH4
+ + NO2- N2 + H2O (7)
NH4
+ + 1.32NO2- + 0.066HCO3
- + 0.13H+ 1.02N2 + 0.26NO3
- + 0.66CH2O0.5N0.15 + 2.03H2O (8) The significance of the process is that much less oxygen is required for nitrification, while no organic carbon (COD) is required for denitrification. The complete metabolic process, which is shown in equation (8) (Strous, 2000), has therefore been referred to as “autotrophic denitrification”. Although classified as strict anaerobes, these organisms seem to find micro-environments where they adapt within a mostly aerobic macro-environment. Such anaerobic micro-environments have been found inside heterogeneous biofilms (Nielsen et al., 1990; Kuhl and Jorgensen, 1992; Persson et al., 2002). Anammox may therefore be an important process within the inner biofilm layers of trickling filters.

4
1.3. Trickling filters in wastewater treatment The first trickling filter ever was commissioned in England in 1893. Exactly 20 years later, trickling filters were commissioned at Daspoort wastewater treatment works in Pretoria. These trickling filters have been operational since 1913 and still produce at least 5 Mℓ/d of effluent with a very good quality. By comparison to table 1, the old trickling filters at Daspoort receive 0.7 m3/m2.d, this includes the off periods when siphon tanks are filling. Instantaneous hydraulic loading rates are of course much higher. Based on 0.7 m3/m2.d, the organic loading rate is 260 gBOD5/m3
filter.d (based on 5 Mℓ/d, with 250 mg COD/ℓ and COD = 2.5 x BOD5), so that these trickling filters can truly be considered as low-loaded. Table 1: Loading rates of trickling filters
A list of all the wastewater treatment works in South Africa that still employ trickling filters (also called bio-filters) in one way or another, is included in Appendix A. This list is included to show the distribution through South Africa, as well as the variation in the kind of process configuration where bio-filters play a role in wastewater treatment.
1.4. Current wastewater effluent quality requirements Municipal wastewater has to be treated in accordance to license conditions. In the situation where many wastewater treatment works have failed to renew licenses, effluent standards are not immediately known. Therefore, the special limit standards and general limit standards in accordance to the General Authorisation in terms of section in terms of section 9 of the Water Act, 1998 (Act 36 of 1998), are often quoted. This authorisation apply to wastewater treatment works with an average daily flow of less than 2 Mℓ/d, with the special limit applicable to discharge into listed sensitive rivers and catchments. In reality, license conditions are normally somewhere between the general and special limit, depending on the size of the works, and the sensitivity of the catchment. The standards for the chemical parameters, shown in Table 2, are relevant to the work in this report, as a general measure for the effluent of trickling filters.
LOW RATE MEDIUM RATE HIGH RATEHydraulic loading
(m3/m2.d) 1.2-3.5 3.5-9 9-36BOD5 loading
(gBOD5/m3 filter.d) 80-400 240-480 480-960
Removal efficiency (%) 80-90 50-70 65-85Nitrification Well nitrified Partially nitrified Little or no nitrification
5
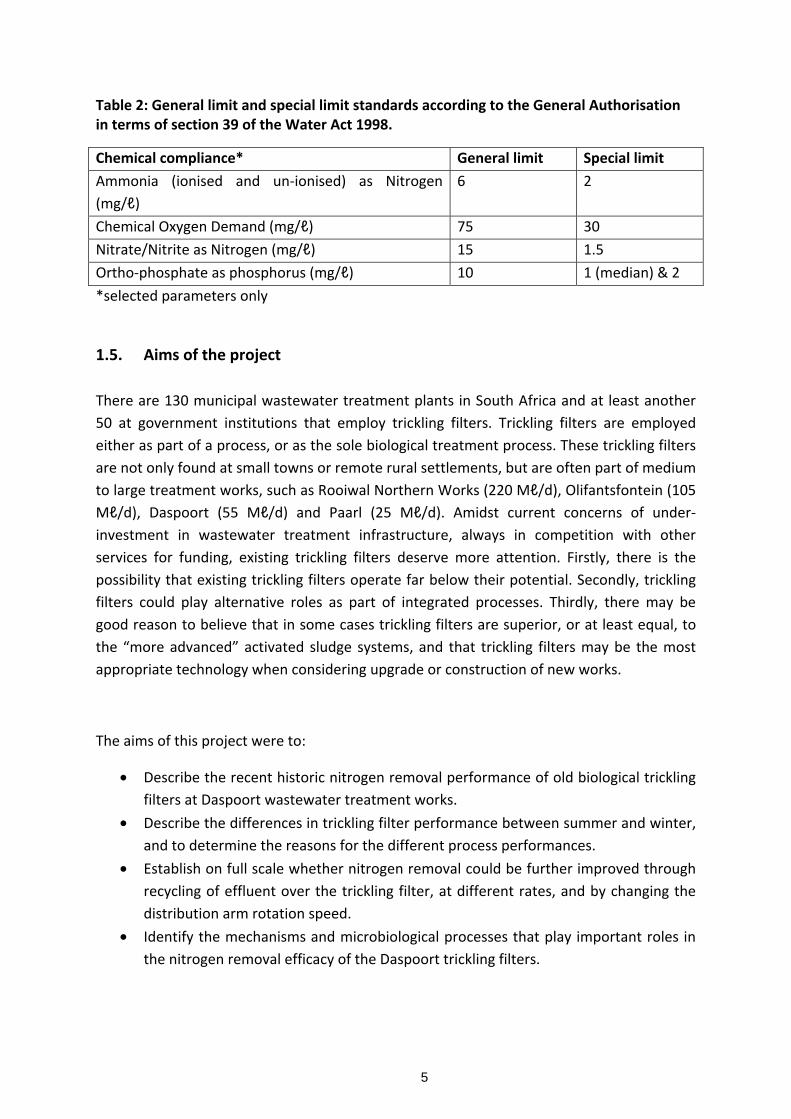
Table 2: General limit and special limit standards according to the General Authorisation in terms of section 39 of the Water Act 1998.
Chemical compliance* General limit Special limitAmmonia (ionised and un-ionised) as Nitrogen (mg/ℓ)
6 2
Chemical Oxygen Demand (mg/ℓ) 75 30 Nitrate/Nitrite as Nitrogen (mg/ℓ) 15 1.5 Ortho-phosphate as phosphorus (mg/ℓ) 10 1 (median) & 2*selected parameters only
1.5. Aims of the project There are 130 municipal wastewater treatment plants in South Africa and at least another 50 at government institutions that employ trickling filters. Trickling filters are employed either as part of a process, or as the sole biological treatment process. These trickling filters are not only found at small towns or remote rural settlements, but are often part of medium to large treatment works, such as Rooiwal Northern Works (220 Mℓ/d), Olifantsfontein (105 Mℓ/d), Daspoort (55 Mℓ/d) and Paarl (25 Mℓ/d). Amidst current concerns of under-investment in wastewater treatment infrastructure, always in competition with other services for funding, existing trickling filters deserve more attention. Firstly, there is the possibility that existing trickling filters operate far below their potential. Secondly, trickling filters could play alternative roles as part of integrated processes. Thirdly, there may be good reason to believe that in some cases trickling filters are superior, or at least equal, to the “more advanced” activated sludge systems, and that trickling filters may be the most appropriate technology when considering upgrade or construction of new works.
The aims of this project were to:
• Describe the recent historic nitrogen removal performance of old biological trickling filters at Daspoort wastewater treatment works.
• Describe the differences in trickling filter performance between summer and winter, and to determine the reasons for the different process performances.
• Establish on full scale whether nitrogen removal could be further improved through recycling of effluent over the trickling filter, at different rates, and by changing the distribution arm rotation speed.
• Identify the mechanisms and microbiological processes that play important roles in the nitrogen removal efficacy of the Daspoort trickling filters.

6
Ultimately, the objective of this project is to garner a better understanding of the nitrogen removal potential of trickling filters, which could lead to improvements in filter design and operation. If successful, existing trickling filters can be improved to further enhance effluent quality, which may prove that trickling filters are still the most appropriate technology (as stand-alone biological processes) for small and medium sized treatment works.

7
2 LITERATURE REVIEW
2.1 Biofilm and bio-filter processes In wastewater treatment processes, two distinct methods of growth and aeration are used. In suspended growth, activated sludge bacteria are homogenously mixed in a basin that is mechanically aerated. This is a compact and relatively energy intensive process. In attached growth processes, bacteria grow in a “biological film” on carrier media, such as stone in trickling filters, or plastic in rotating biological contactors. In these processes, the bacterial bio-film is in cyclic contact with atmosphere directly, through the sequential flow over trickling filters and the rotation of bio-discs or rotating contactors. Unlike activated sludge, the sludge age is not controlled in bio-film processes. Instead, the sludge age is determined by natural die-off of bacteria, and the washing off of biofilm due to the sheer force of flowing water. Due to the high age of biofilms, bacterial layers are formed in which different micro-climes harbour many different types and species, from aerobic through anoxic to anaerobic.
More than 50 years ago, Schulze (1957) started to quantify the relationships between hydraulic loading rate, organic loading rate, and removal efficiency of Biochemical Oxygen Demand in trickling filters. From Schulze’s references, it is evident that that the formal investigation of these systems had been quite productive since the 1940’s. During this period, much of the basic understanding of trickling filters had been established, namely that treatment capacity depends on the mass of active biofilm and the contact time between the liquid and this mass. Some of these early observations and conclusions include:
• Many different organisms play a role in the complex treatment processes inside biofilm and trickling filters, including bacteria, fungi, algae, protozoa, nematoda, rotatoria, chaetopoda, crustacea and insecta, most important of which is the bacteria (Holtje, 1943).
• The removal of organic matter in wastewater is a function of the total biofilm mass in the trickling filter, which Schulze (1957) reported on as “surprisingly small”, after 2.5-4.5 g of dry material per kilogram of filter stone was measured by Heukelekian (1948).
• One way to increase the treatment capacity is to increase the biofilm mass, but deeper layers of the biofilm get oxygen only by diffusion, which is a slow process. Rashevsky (1948) stated that the maximum diameter of clumps of bacteria should not exceed 1 mm to prevent anaerobic conditions at the inside. Later observations showed the depth of biofilm should not exceed 2-3 mm if anaerobic conditions are to be avoided (Schulze, 1957), which could lead to the formation of hydrogen sulphide.

8
The effect of biofilm thickness on various biochemical processes seems to be important in understanding trickling filters. While the inner layer is almost always anaerobic, this zone could also become anoxic, depending on nitrate concentration in bulk liquid, and diffusion into the biofilm. Nielsen (1990), Kuhl and Jorgensen (1992), and Perssson et al. (2002), used micro-sensors with high spatial resolution to quantify the concentration of substances at various depths in biofilms. The same overall picture emerged from their work: Oxygen was found only in the upper 0.5 mm of a biofilm, below which anoxic (nitrate reduction) and anaerobic (sulphate reduction) processes occurred, depending on the concentration of diffused nitrate or sulphate. Thus, chemical gradients may exist in microbial biofilms that lead to bacterial stratification within these structures (Table 2). Table 3: Micrographs showing bacterial stratification in biofilm as a result of chemical gradients from different studies.
An aerobic and black anaerobic layer, from a biofilm treating domestic and dairy wastes (Schulze, 1957). Biological sulphate reduction occurs in the lower zone.
Nitrosomonas species (yellow) and auto-fluorescence (red) indicate a mostly anaerobic zone (Schramm et al., 1996). Small colonies are seen in the “anaerobic zone”, as old growth or oxic micro-niches. Biofilm substratum is to the bottom right.
Anammox bacteria (blue) below a layer of Nitrosomonas species (green) taken from a reactor where bulk liquid was in constant contact with atmosphere and therefore not in a strict anaerobic environment (Wilsenach, 2006). Bulk liquid is to the top left.
Although higher flows lead to thinner biofilms (the effect of “spülkraft”, or flushing rate), it seems that biofilm thickness only have to exceed 0.5 mm for denitrification to take place. Thus, thicker biofilms may lead to an increase in decay and odour from the inner biofilm layers, without increased removal of organic matter from the wastewater. Henze et al. (2002) also states that diffusion into the biofilm is limited, so that only the outer 0.5 to 1

9
A-recycle (3:1)
AerobicSST
Anoxic
S-recycle (1:1)
Influent Effluent
mm is active, and thus “the biofilm thickness is of no importance to the results of the concentration ranges involved here”. These authors also conclude that thicker biofilms contribute greatly to the complexity of the system, since it may lead to growth of higher organisms, including snails, worms, etc., that form tunnels and graze upon bacteria.
2.2 Simultaneous nitrification and denitrification in trickling filters In our classical understanding of activated sludge systems, the nitrification and denitrification processes are physically separated, and occurs in two distinct stages or compartments (Figure 2). In a system where the aerobic zone of activated sludge is replaced with a trickling filter, for external nitrification, denitrification in an anoxic zone is possible (Muller et al., 2004). The anoxic zone could also be replaced by a primary dedicated denitrification filter designed to avoid aeration. This was however not the aim of this project.
Figure 2: Nitrification and denitrification in conventional activated sludge plants.
Our understanding of activated sludge processes have been improved recently through investigations on simultaneous aerobic autotrophic nitrification and anoxic heterotrophic denitrification. Szewsczyk and Kulig (2007) found that limitation of oxygen diffusion inside the flocks of activated sludge “created significant anoxic micro-zones”. In the outer part of the flocks the aerobic conditions support the activity of nitrifiers and aerobic heterotrophs. The nitrite and nitrate produced in aerobic zones diffuse to the anoxic zones where they are reduced to nitrogen gas. It was found that, at high influent COD and TKN concentrations, up to 90% of the nitrogen can be removed via denitrification within anoxic zones inside activated sludge flocs, even with bulk liquid oxygen concentrations up to 5 mg O2/ℓ. Experimental measurements (de Beer et al., 1994; Satoh et al., 2003) have shown that
Denitrification in a classical activated sludge process relies on the recycle of nitrate rich water to an anoxic zone; e.g. an effluent concentration of 15 mg NO3
-/ℓ , with an influent of 75 mg Ntot/ℓ requires a total recycle ratio of 4:1 (assuming effluent TKN close to zero). However, in most cases, with this recycle ratio a lower nitrate effluent concentration would be expected. This is due to simultaneous nitrification/ denitrification, which is known to occur where DO < 0.8. This process phenomenon is included in ASM2 and others.

10
anoxic zones may occur in flocs of a diameter above 2 mm. This phenomenon has been further exploited in the recent developments around aerobic granular sludge, where denitrification takes place in the inner layers of the kernels, or granules (De Kreuk et al., 2005). Evidently, no physical barrier needs to exist between the “aerobic” an “anoxic” zones for nitrification and denitrification to synergistically remove nitrogen from wastewater. This study was therefore focused on single stage trickling filters that act as the sole biological wastewater treatment process. The possibility of simultaneous nitrification/denitrification must therefore be exploited to the fullest. In terms of Gibbs energy, nitrate is a strong electron acceptor (-35 kJ/e-mol), even when compared to oxygen (-78 kJ/e-mol), and much stronger than sulphate (0 kJ/e-mol). It would seem more likely that denitrification can out-compete aerobic growth at relatively high nitrate concentrations. While 15 mg N/ℓ would be an acceptable effluent quality, the nitrate availability is higher than that of oxygen, with maximum DO = 8 mg/ℓ, but normally around 2-3 mg/ℓ in treated effluent. Dalsgaard and Revsbech (1992) studied the effect of micro-zonation on the performance of different processes – especially denitrification – in a biofilm. Denitrification was measured as a function of oxygen and nitrate concentrations, organic matter and ammonium. It was found that increased bulk liquid concentrations of nitrate increased the zone within the biofilm in which denitrification took place. Conversely, higher bulk liquid oxygen concentrations increased the aerobic zone thickness within the biofilm, and decreased the overall denitrification rate. This aerobic zone normally extended 0.2-0.3 mm into the biofilm, below which was a mostly anoxic/anaerobic zone. If the oxygen penetration depth was increased artificially, denitrification stopped, but resumed immediately when returning to anoxic conditions. This suggests that the same organisms were responsible for aerobic removal of COD, as well as for COD removal with nitrate reduction (denitrification). In another study (Daniel et al., 2009), a polyurethane packed-bed-biofilm sequential batch reactor was fed with ammonium rich synthetic substrate (125 and 250 mg N/ℓ). Interestingly, nitrite (and not nitrate) was found to be the main oxidized nitrogen compound after each of the aeration cycles. However, the nitrite concentration dropped to below the detection limit during each of the subsequent anoxic cycles in which ethanol was used as carbon source. Biesterfeld et al., (2003) investigated intact biofilm samples from a carbonaceous trickling filter in a bench scale reactor. The reactors were fed with sterilized wastewater effluent, spiked with nitrate to a final concentration of 16-18 mg NO3
--N/ℓ. Dissolved oxygen concentrations in the bulk liquid were kept at 2-4 mg O2/ℓ. Denitrification took place immediately, at rates of 3 to 5 g N/m2.day, indicating that denitrification is possible inside the biofilm of systems with dissolved oxygen in the bulk liquid.

11
From this literature review, indications are that nitrification and denitrification occur simultaneously in biofilm systems, which include trickling filters. However, conventional nitrification and denitrification may not be the only significant nitrogen removal process. Anaerobic ammonium oxidation (Anammox) is a microbially-mediated process identified in engineered systems as well as in natural environments, and has been applied to wastewater treatment systems (Schmidt et al., 2002). This process is performed by bacteria of the order Planctomycetales, and provides an alternative approach to nitrogen removal via denitrification (Van Rijn et al., 2005). Anammox bacteria enable complete ammonia removal whereby denitrification of nitrite occurs with ammonia as the electron donor (Van Loosdrecht et al., 1997) via autotrophic pathways without the need for organic carbon (Van Rijn et al., 2005). Anammox bacteria are often isolated and enriched from biofilm systems. For example, Egli et al. (2001) used sludge from a rotating biological contactor, treating ammonium rich leachate with a low organic carbon content, to enrich a biomass population which consisted of 88% anammox bacteria. Examples of anammox found within trickling filters specifically are not common in literature. Lydmark et al. (2006) studied the distribution of nitrifying organisms at different depths of a full scale nitrifying trickling filter. Apart from other bacteria, two groups of ammonium oxidising bacteria (two different Nitrosomonas oligotropha) and two groups of nitrite oxidising bacteria (two Nitrospira spp.) dominated at all depths of the trickling filters. Apart from the filter depth, the Nitrospira spp. was generally found closer to the biofilm base, with Nitrosomonas sp. on the biofilm surface. In addition to the common nitrifying bacteria, small populations of anammox bacteria were found at 6 m depth only.
2.3 Mathematical modelling approaches Bioprocess modelling is a combination of art (skill), understanding of reaction kinetics and solving simultaneous mathematical equations. Although models always give real numbers as answers, their meaning must always be checked against real data. Often, there is little correspondence. For this reason, it’s very important to start with the correct, or best possible, conceptual understanding of the interaction between the various biochemical processes. Such a starting point is Figure 3, adapted from others.

12
Figure 3: Conceptual understanding of nitrification in biofilms (Nijhof and Klapwijk, 1995), which is further developed in this work to include anoxic and anaerobic process.

13
3 RECENT PERFORMANCE OF TRICKLING FILTERS AT THE OLD DASPOORT WASTEWATER TREATMENT WORKS
3.1 Introduction to trickling filters in City of Tshwane
The City of Tshwane employs trickling filters at a number of wastewater treatment works, including Cullinan, Sunderland ridge, Klipgat, Temba, Rooiwal and Daspoort. At Rooiwal, two modules consisting trickling filters only treat 41 Mℓ/d and 55 Mℓ/d respectively. At most of the treatment works within City of Tshwane, trickling filters work in combination with activated sludge plants. The Daspoort Wastewater Treatment Works (WWTW) is located on the southern banks of the Apies River on the north-western edge of the Pretoria Central Business District. Wastewater from the central Pretoria area is collected in a main outfall sewer that runs alongside the Apies River past the Daspoort WWTW to the Rooiwal Wastewater Treatment Works.
Figure 4: A Google Earth© image of the Daspoort WWTW (Eastern Works).
The Daspoort WWTW extracts raw wastewater from this outfall sewer at two points, to be treated in its “older” Eastern Works and the “newer” Western Works respectively. The influent flows drawn from both locations are controlled automatically at Daspoort WWTW (Muller et al., 2004). The influent wastewater to both works at Daspoort WWTW undergoes mechanical screening, grit removal and primary settling in Dortmund-type vertical flow settling tanks. The Eastern Works is a trickling filter plant, comprising four trickling filter

14
modules with four trickling filters in each module (Figure 4 and Figure 5). These old trickling filter modules have a combined treatment capacity of 9 Mℓ/d. The Western Works is a biological nutrient removal activated sludge process with external nitrification over four trickling filters (Muller et al., 2004). By comparison to the trickling filters at Rooiwal, with hydraulic loading rate of 3.3 m3/d.m2 (which is considered a medium loading rate), the trickling filters at Daspoort receive a low load of 1.2 m3/d.m2 at maximum capacity. In practice the flow is limited and the actual trickling filter loading rate is closer to 0.7 m3/d.m2.
Figure 5: A graphical representation of the Daspoort WWTW, describing the sampling point, the humus sludge withdrawal valve, in relation to the trickling filter wastewater treatment process
3.2 Historical data
3.2.1 Data set: water chemistry analysis The historic data for this evaluation was obtained from the analytical laboratory at Daspoort WWTW and includes chemical analysis results from June 2004 to November 2012. The data includes the concentrations of nitrate, ammonium, Total Kjeldahl Nitrogen (TKN), Chemical Oxygen Demand (COD) and ortho-phosphate. Data for raw wastewater concentrations was from samples collected at the Eastern Works only. Data for settled sewage was available only up to April 2006. Effluent concentrations were measured at the humus tanks.

15
In order to evaluate nitrogen removal over the trickling filters, the Total Kjeldahl Nitrogen (TKN) concentration in settled sewage is required. However, firstly, settled sewage concentrations were not measured throughout the data period, and not as frequently as raw sewage, and secondly, TKN was not measured as frequently as ammonium in either of the settled sewage or raw sewage. The measured values for the ammonium and TKN concentrations in the raw wastewater were then used to deduce the values of the ammonium and TKN settled sewage concentrations. First the relationship between the ammonium concentration in the raw waste water and the measured values (from 29 July 2004 to 25 April 2006) of ammonium in the settled sewage was calculated. The measured concentrations of ammonium in the settled sewage were divided by the values of the measured ammonium concentrations in the raw waste water of the same dates to get a value that represents a relationship between these two data sets. The average of all these values were calculated as 1.09 with a standard deviation of 0.25, and a relative standard
deviation ( ) of 23%. The relationship between ammonium concentrations in the raw wastewater and the ammonium in the settled sewage was consequently observed to be 1:1 (NH4
+ ss = NH4+ raw).
The measured data of the TKN concentrations of the settled sewage was divided by the measured concentrations of the ammonium in the settled sewage. The average of all the values calculated were 1.6 with a standard deviation of 0.28, and relative standard deviation of 19%. The ratio of TKN:NH4
+ was therefore taken to be 1.6:1. The TKN settled sewage values were deduced by multiplying the measured ammonium values in the raw wastewater by 1.6 (NH4
+ ss = NH4+ raw). The TKN in settled sewage could
thus be “modelled” based on the ammonium in settled sewage, and compared to the measured TKN in settled sewage (for those cases where TKN was measured). The average of our deduced TKN concentrations (the TKN “model”) over the whole period (until November 2012) was calculated as 34.5 mg N/ℓ, with a standard deviation of 8.3. The average of the measured TKN concentrations in the settled sewage over the same period, but for much less data points, was calculated as 35 mg N/ℓ, with a standard deviation of 7.8. The deduced TKN values were compared with actual ammonium and nitrate effluent concentrations to evaluate nitrogen removal. The progression of data from raw ammonium to settled sewage TKN is shown graphically in Appendix B. The COD concentrations in the settled sewage were not measured as consistently as in the raw wastewater, and again a larger data set had to be deduced from the measured data. The measured concentrations of the COD in the settled sewage were divided by the COD concentrations in the raw wastewater of the same dates. The average CODss:CODraw was calculated as 0.6 with a standard deviation of 0.07 (a relative standard deviation of 12%).

16
The COD concentrations in the settled sewage were calculated by multiplying the values of the COD concentration in the raw wastewater by 0.6.
3.2.2 Data set: flow rate Daspoort WWTW also provided data on the inflow rate into the wastewater works. The data contains the inflow rate of each day from the beginning of 2004 until the end of 2011. The data includes the amount of water directed to the Eastern Works and the Western Works in Mℓ/d. The average amount of flow entering the Eastern and Western Works (the total flow rate entering the works) was around 40 Mℓ/d, while the average flow into the Eastern works was 5 Mℓ/d and 35 Mℓ/d into the Western works. This data was used to test whether the inflow rate had any effect on the concentrations observed for the different chemical parameters. It must however be noted that the flow rate into Daspoort WWTW is controlled and excess flow (e.g. storm water/wet weather) bypasses to Rooiwal WWTW. This excess water originating from storm water overflows, and/or wet weather, would have already diluted the concentrations of the chemical parameters within the inflow to Daspoort WWTW. Because the flow rate into Daspoort WWTW is controlled and the excess is bypassed to Rooiwal WWTW, the organic loads and hydraulic loads cannot be correlated.
3.3 Results and discussion A clear trend was noted for the ammonium and nitrate concentrations in the effluent with the concentrations increasing in the winter months and decreasing during the summer months. These trends are indicated in Figure 5. The same trend was noted for the ammonium concentration in the raw wastewater. The higher concentrations in the effluent in winter are therefore caused by the higher concentrations in the influent. To determine whether the amount of wastewater entering the wastewater works have an influence on these concentrations, the flow rate data obtained from Daspoort WWTW was plotted on a graph together with the concentration data (Figure 6).

17
Figure 6: Seasonal variations of settled sewage TKN and COD concentrations, and effluent ammonium and nitrate concentrations at Daspoort Eastern Wastewater Treatment works

18
The flow rate into the wastewater treatment works (East and West) did not correspond to the concentrations of the chemical parameters (Figure 6). This phenomenon can be ascribed to control of the inflow into the works and the bypass of excess wastewater from other sources (e.g. rain water/water infiltrating the old pipes) to the Rooiwal WWTW. The results thus confirmed that the inflow into Daspoort does not change much from season to season. However, strong indications were obtained that seasonal changes occurred in the concentrations of the chemical parameters of the inflow into Daspoort WWTW. These seasonal changes can be ascribed to the diluting of wastewater, with excess water originating from storm water overflows, and/or wet weather, before it enters Daspoort WWTW.
Figure 7: Daspoort WWTW flow rate with the concentrations on the same dates.
Interestingly, as illustrated in Figure 7, corresponding seasonal changes were observed for the amount of nitrogen removed from the wastewater and the concentration of ammonium entering Daspoort WWTW. From the data that was measured at Daspoort WWTW and the deduced values, we calculated that on average 15 mg N/ℓ was removed (as nitrogen) from the average TKN influent of 35 mg N/ℓ. Based on complete heterotrophic denitrification metabolism, the stoichiometric ratio of COD to nitrogen removal determines that 15 mg N/ℓ via denitrification requires typically 86 mg COD/ℓ under normal anoxic conditions.

19
Figure 8: Ammonium concentrations entering with the raw wastewater vs. concentration of nitrogen removed by the trickling filters.
With the environment mostly aerobic, it is expected that most of the COD will be removed with oxygen, and not nitrate or nitrite, as electron acceptor. The average COD effluent concentration for the Eastern Works was 51 mg COD/ℓ. The COD concentration of settled sewage, which flow into the trickling filters, were found to be between 200-300 mg COD/ℓ, with an average at 245 mg COD/ℓ. If for example 15 mg N/ℓ was removed together with 86 mg COD/ℓ via nitrate reduction and 51 mg COD/ℓ remained in the final effluent, an average of just over a 100 mg COD/ℓ was then removed by oxygen. The average of the fraction of COD required for denitrification over total COD removed is almost 50%. This seems unlikely for a system designed and operated to be highly aerobic. Aside from average removal rates, and looking into the nitrogen removal on single days (Table B1, Appendix B), some results seem to indicate that there might not be enough COD in the wastewater to complete the denitrification. From the historic data, one out of every four instances recorded a CODrequired:CODremoved ratio of more than 0.5, which means that more COD was removed in an anoxic denitrification process than in a normal aerobic process (out of 83 data points shown in Table B1). In three cases, the CODrequired:CODremoved > 1, which means not enough COD was available for denitrification, even if no COD was removed in an aerobic process. It was therefore hypothesized that another mechanism, which was not linked to ordinary heterotrophic denitrification, could be responsible for some of the nitrogen removed. This mechanism could possibly be linked to Anammox, and would be found in the inner layers of the biofilm, where an anaerobic environment exists.

20
4 EXPERIMENTAL WORK ON FULL SCALE TRICKLING FILTERS (DASPOORT EASTERN WORKS)
4.1 Introduction and aims
Nitrogen removal on full scale was demonstrated in chapter 3, based on historic data of the trickling filters at Daspoort Eastern Works. An explanation of the most likely nitrogen removal mechanisms must still be offered. In this chapter, we detail the investigation of six full scale trickling filters, which remained part of an operational treatment works.
The aim of this study was to evaluate the full scale effects of operational parameters on nitrogen removal. The most important operational parameters, other than loading rate, are:
• Effluent recycle, which re-introduces nitrate to the top of the trickling filter. At the top of trickling filters, where settled wastewater with the full organic (COD) and ammonium load is first contacted with the bio-mass, one expects dissolved oxygen in the bulk liquid. Nitrate is a strong electron acceptor, and may be available to bacteria to oxidise organic matter under oxygen limited conditions. This should then result in nitrate reduction and denitrification.
• Distribution arm rotation speed, was reduced on two trickling filters to establish whether a more concentrated instantaneous flow, in contrast to a trickling flow, would lead to greater differences between anoxic and aerobic microclimates, and as such improve denitrification.
• Water temperature, which governs the growth rate of organisms, as well as the solubility of substrates and mass transfer rates, and the water/ambient temperature gradient, which determines the air flow rate and direction of air flow through trickling filters. For most of winter, when water temperature exceeds ambient temperature, air flow will be upward through trickling filters, and vice versa in summer.
Combinations of these influencing parameters, and possible interactions, were investigated to gather evidence that would lead to a proposal for ideal operating conditions.
4.2 Materials and methods
4.2.1 Settled sewage flow and recycle flow Daspoort Eastern Works Unit 3 (comprising trickling filters 9-12) was temporarily reconfigured to recycle effluent. A submersible pump was installed in a sump that collects effluent from units 3 and 4, before flowing to the humus tanks. Effluent was pumped into

21
the unit 3 siphon tank, via a temporary 80mm HDPE line. The pump system discharged a constant flow rate of 53m3/h, or 1.26 Mℓ/d, which was measured by filling the square siphon tank. This pump rate resulted in a nominal 1:1 effluent recycle ratio. Unit 4 (comprising trickling filters 13-16) was kept intact to serve as reference system received on average the same load as unit 3. Settled sewage flow rate into the siphon tank was measured (Daspoort Eastern Works flow measurement) to establish actual recycle ratios. However, the flow rate over the trickling filters is always constant, determined only by the siphon tank elevation above the trickling filters and constant head loss through the pipe systems. With higher incoming flow rates, the siphon tank stays open for longer periods.
4.2.2 Distribution arm rotation speed Trickling filter distribution arm rotation speeds were measured by stopwatch, and found to be almost equal (Table 4). Table 4: Distribution arm rotation speed
Trickling filter number: 9 11 12 14 15 16Revolutions per minute: 1.0 0.9 0.7 1.1 1.0 0.9
To investigate the effect of the distribution arm rotation speed on the trickling filter performance, the rotation speed was decreased by reverse hydraulic thrust. Each distribution mechanism consists of a central distribution well with four distribution arms, and each arm is made up of two sections, with horizontally facing holes for water exit.
Figure 9: Reducing distribution arm rotation speed via reverse hydraulic thrust

22
Two outer sections of trickling filter 11 and trickling filter 14 were rotated through 180o for 25% of overall thrust in the opposite direction (Figure 9). This reverse thrust resulted in decreased rotation speeds of 0.15 rpm for trickling filter 11, and 0.33 rpm for trickling filter 14. It was later noted that the distribution arm of trickling filter 11 did not always overcome the inertia to start rotating after siphon tank opening, and often remained static.
4.2.3 Sampling and analysis Ammonium analysis was performed on the filtered sample (25 ml) by adding 3 drops of mineral stabilizer, 3 drops of polyvinyl alcohol and 1 ml of Nessler Reagent. The concentration was read using the Hach DR /2010 Portable Data logging Spectrophotometer at 425 nm (Hach, 1997). Nitrate analysis was performed by mixing the filtered sample (25 mℓ) with a sachet of NitraVer-5 Nitrate Reagent (powder pillows; Hach Permachem Reagents). The nitrate concentration was read using a Hach DR /2010 Portable Data logging Spectrophotometer at 500 nm, (Hach, 1997). Nitrite analysis was performed by mixing the filtered sample (10 mℓ) with a sachet of NitraVer-2 Nitrite Reagent (Powder pillows; Hach Permachem Reagents). The nitrate concentration was read using a Hach DR /2010 Portable Data logging Spectrophotometer at 585 nm, (Hach, 1997).
The COD was determined by adding filtered/unfiltered sample (2 mℓ) to the contents in a COD test tube. The test tube was placed in the heating block for 2 hours, after which it was allowed to cool to room temperature and the COD concentration calculated from the reading at 436 nm using the NANOCOLOR Universal photometer 500 D at 15-160 mg/ℓ range.
The Hach DR/2010 spectrophotometer and the reagents were supplied by Hach Company, Loveland, CO 80539, USA. The NANOCOLOR Universal Photometer 500 D and the reagents were supplied by Separations Laboratory Supply Specialists, 227 Main Ave, Ferndale Randburg, 2194
4.3 Effects of effluent recycle over trickling filters on nitrogen removal
Sampling included three trickling filters receiving recycle flow (trickling filters 9, 11, and 12) and the composite effluent of unit 4 as reference. Samples were taken on four days (2010/02/09 and 11, 2010/03/08 and 10) and samples were collected on each of these days at three time intervals (8h00, 12h00 and 16h00). The recycle:feed ratio in February was 2:1, and the recycle:feed ratio in March was 1:1. Figure 10 is therefor based on 18 data points for February (2:1 recycle), 18 data points for March (1:1 recycle) and 12 data points for the control unit, spanning from February to March.

23
Figure 10: Effect of different effluent recycle rates on final effluent nitrate concentrations, for experiments in February and March 2010
Ammonium was also measured at the same points, but effluent concentrations ranged between 0 and 2.5 mg N/ℓ for trickling filters with recycle flow as well as the control unit. Not much can be inferred from such low concentrations, and results are therefore not shown. There was some correspondence between all trickling filters in terms of the results against time of measurement: samples collected at 16h00, irrespective of recycle flow or not, had increased ammonium concentrations (1.7-2.9 mg N/ℓ) while samples collected at either 8h00 or 12h00 had zero ammonium.
The box-and-whisker plots of Figure 10 show the mean, the 95% confidence, as well as maximum and minimum of the data. It would appear that effluent recycle over these two periods had a statistically significant effect. By comparisson to the reference system, a 1:1 eflfuent recycle resulted in a lower average nitrate concentration. Furthermore, with 1:1 effluent recycle the variation of effluent nitrate concentration is much less. The system could therefore be said to operate more consistently. However, at a higher recycle ratio (2:1), which with a constant reycle pump flow rate in reality meant a lower influent loading rate, the nitrate effluent concentration was significantly higher. The variation in results also increased notably. The nitrate effluent concentration with a 2:1 recycle ratio, and a lower inflow rate, resulted varied between 14 mg N/ℓ and 19 mg N/ℓ. With 1:1 recycle, this variation in effluent nitrate concentration was within 1 mg N/ℓ. Why then, would nitrate effluent concentrations increase with an increased recycle ratio? The average ammonium loading rates were 14 kg N/day for the 2:1 recycle ratio period, and 29 kg N/d for the 1:1 recycle ratio period. In accordance with the higher nitrate effluent concentrations, together with lower ammonium loading, the nitrogen removal efficiency was only 33% for 2:1 recycle (49% for the reference unit during this period), while it was around 67% during 1:1 effluent

24
recycle (59% for the reference unit during this period). Moreover, the average COD loading rates were 203 kg COD/day (2:1) and 135 kg COD/day (1:1) respectively. The latter is due to an unexpected lower COD influent concentration, as measured for the settled sewage as well as in the siphon tank over the test period. Based on the actual COD and NH4
+ removal, the comparative aeration requirements were similar at 408 kg O2/day (2:1) and 435 kg O2/day (1:1). It is counterintuitive that the nitrogen removal processes would perform better at a much lower COD:NH4
+ ratio, when similar aerobic conditions prevailed at both instances. Conventional wisdom could not explain this observation.
Table 5: Effects of 1:1 effluent recycle on final effluent nitrate concentration for 11 experiments in January and February 2011
Effluent recycle
(Unit 3, filters 9 and 12) Reference system
(Unit 4, filters 15 and 16)
N removal COD
requiredCOD
removed N removal COD required COD
removed
Date (mg N/ℓ) (%) (mg COD/ℓ) (mg COD/ℓ)
(mg N/ℓ) (%) (mg COD/ℓ) (mg COD/ℓ)
2011/01/24 43.2 70% 247 84 44.0 75% 252 912011/01/25 14.1 55% 81 99 17.9 62% 102 1362011/01/26 10.5 49% 60 62 2.0 10% 11 762011/01/27 15.7 60% 90 15 18.1 62% 104 872011/01/28 14.7 54% 84 113 12.1 47% 69 1242011/02/02 28.1 68% 161 112 25.6 66% 147 1182011/02/03 26.6 68% 152 138 28.9 69% 165 762011/02/04 41.7 70% 239 108 41.1 75% 235 1342011/02/07 25.7 66% 147 75 25.4 67% 145 712011/02/08 24.8 62% 142 13 27.6 64% 158 97
The data in Table 5 summarise the nitrogen removal performance one year after testing the effect of different effluent recycle ratios. By this time, an effluent recycle ratio of 1:1 had been maintained for more than a year since the start of the experiments. Three observations are clear from Table 5. Firstly, nitrogen removal is generally very good over the entire period. Secondly, there is not much difference between the recycle system (62% N removal average) and the reference system (60% N removal average). Thirdly, the actual COD removed is often less than the COD required by ordinary heterotrophic denitrification to correspond with the measured nitrogen removal. If COD removal is based on inflow and outflow concentrations, one may overlook COD available from decaying biomass and/or COD from settled sewage enmeshed in the biofilm from a previous day’s loading, which becomes available later. However, with a steady inflow and observations over two weeks (24 January to 8 February), the assumption of COD removal based on inflow and outflow is reasonable, and therefore, the “shortage” of COD to account for denitrification has to be explained.

25
4.4 Effects of distribution arm rotation speed on nitrogen removal
The effect of distribution arm rotation speed on ammonium effluent concentrations and nitrate effluent concentrations are shown in figures 10 and 11 respectively. The box-and-whisker plots show the 95% confidence intervals around the mean, as well as the maximum and minimum values.
Figure 11: Effect of distribution arm rotation speed on ammonium concentrations in trickling filters, with and without effluent recycle (January and February 2011)
Figure 12: Effect of distribution arm rotation speed on nitrate concentrations in trickling filters, with and without effluent recycle (January and February 2011)
26
Ammonium effluent concentrations varied considerably. On the reference side, there was better nitrification in filter 14 (reduced speed) and filter 15 (normal speed) than filter 16 (normal speed). Over the filters with effluent recycle, filter 11 (reduced speed) performed much worse than filters 9 and 12 (normal speed).
Variations in nitrate effluent concentrations were insignificant. If anything, the effluent nitrate concentrations from filter 9 and 12, with effluent recycle, were lower than reference filters 14, 15, and 16. Nevertheless, there was no evidence to suggest that reducing trickling filter arm distribution speed to less than 1 rpm was effective. On the contrary, too slow rotation speeds often resulted in static distributions arms that could not overcome the inertia at the onset of flow, with poor results as seen from the high ammonium concentration in filter 11. This high concentration is due to a localised overloading, because of the static distribution arms.
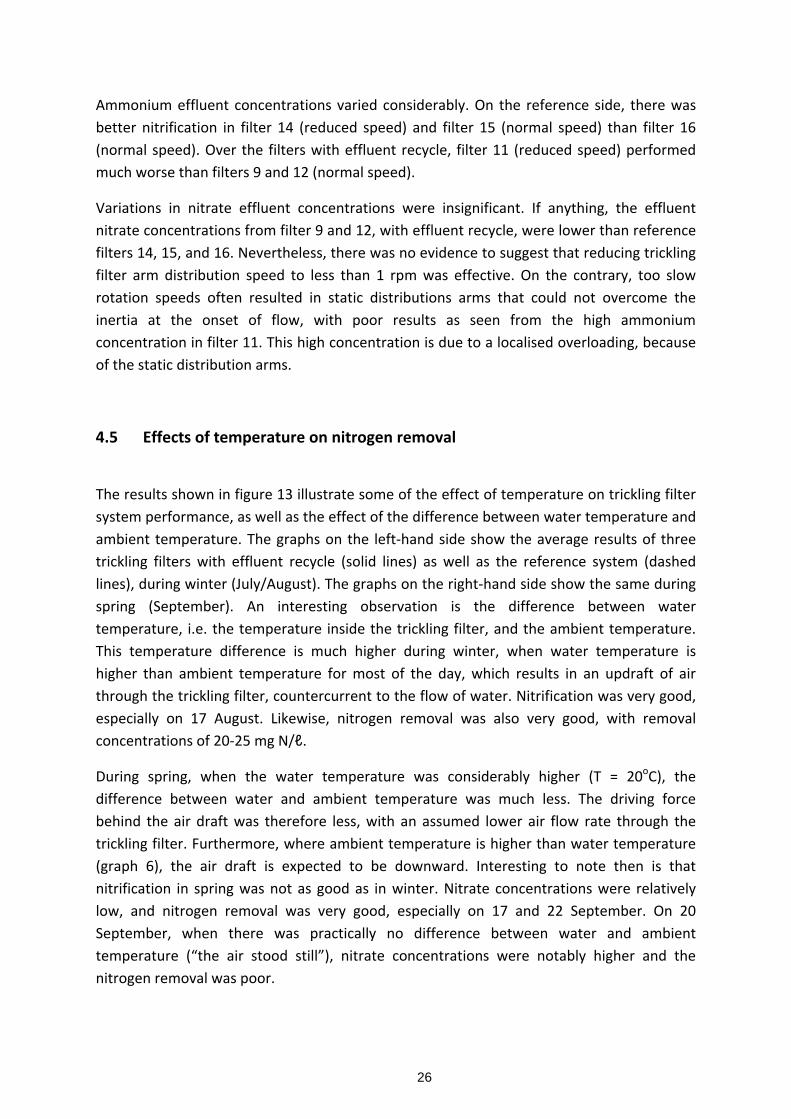
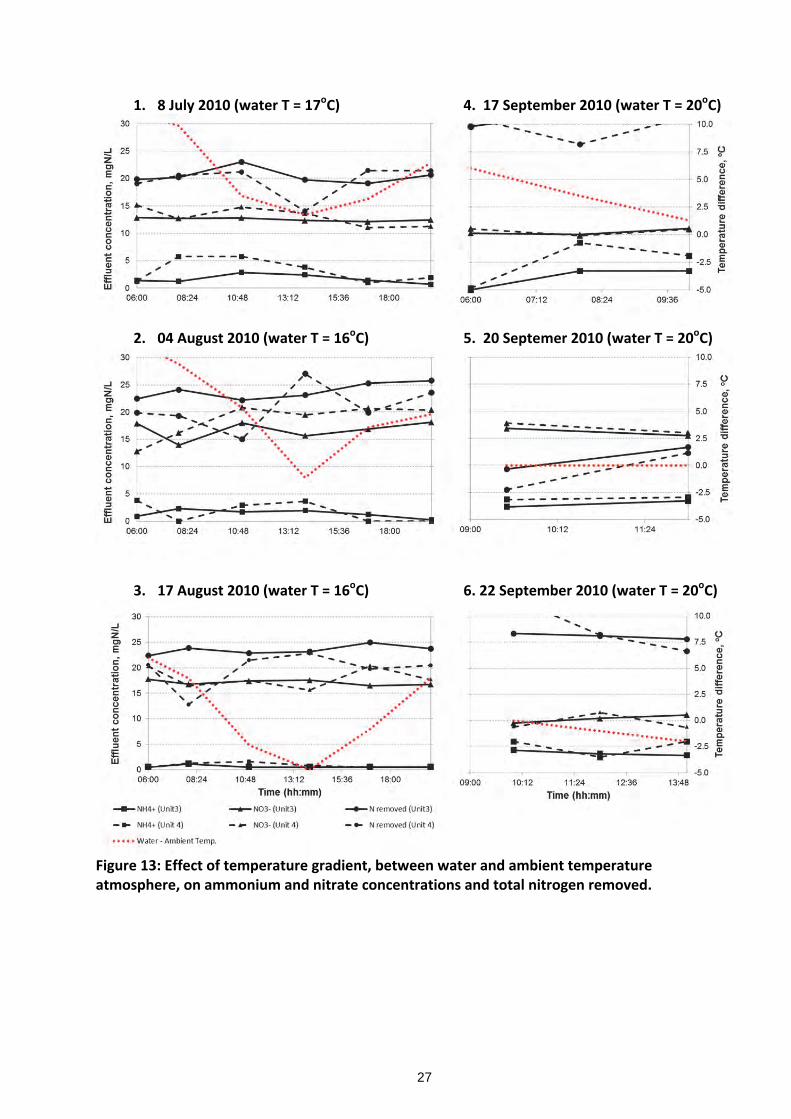
4.5 Effects of temperature on nitrogen removal
The results shown in figure 13 illustrate some of the effect of temperature on trickling filter system performance, as well as the effect of the difference between water temperature and ambient temperature. The graphs on the left-hand side show the average results of three trickling filters with effluent recycle (solid lines) as well as the reference system (dashed lines), during winter (July/August). The graphs on the right-hand side show the same during spring (September). An interesting observation is the difference between water temperature, i.e. the temperature inside the trickling filter, and the ambient temperature. This temperature difference is much higher during winter, when water temperature is higher than ambient temperature for most of the day, which results in an updraft of air through the trickling filter, countercurrent to the flow of water. Nitrification was very good, especially on 17 August. Likewise, nitrogen removal was also very good, with removal concentrations of 20-25 mg N/ℓ.
During spring, when the water temperature was considerably higher (T = 20oC), the difference between water and ambient temperature was much less. The driving force behind the air draft was therefore less, with an assumed lower air flow rate through the trickling filter. Furthermore, where ambient temperature is higher than water temperature (graph 6), the air draft is expected to be downward. Interesting to note then is that nitrification in spring was not as good as in winter. Nitrate concentrations were relatively low, and nitrogen removal was very good, especially on 17 and 22 September. On 20 September, when there was practically no difference between water and ambient temperature (“the air stood still”), nitrate concentrations were notably higher and the nitrogen removal was poor.
27
1. 8 July 2010 (water T = 17oC) 4. 17 September 2010 (water T = 20oC)
2. 04 August 2010 (water T = 16oC) 5. 20 Septemer 2010 (water T = 20oC)
3. 17 August 2010 (water T = 16oC) 6. 22 September 2010 (water T = 20oC)
Figure 13: Effect of temperature gradient, between water and ambient temperature atmosphere, on ammonium and nitrate concentrations and total nitrogen removed.

28
4.6 Conclusions on full scale trickling filter operation
The full scale trickling filter experiments confirmed the historic data for the Daspoort Eastern Works in two respects:
1. Nitrogen removal over the trickling filters is very good, with removal efficiencies up to 70%.
2. There is often not enough COD removed to account for the good nitrogen removal in terms of ordinary heterotrophic denitrification.
Aside from the observations of good nitrogen removal, it was not really possible to identify operational parameters that led to this performance. None of the experiments on effluent recycle, or distribution arm rotation speeds, improved effluent concentrations significantly, or consistently. It must therefore be concluded that the old trickling filters at Daspoort operated at their optimum already, regardless of this work.

29
5 THE ROLE OF ANAEROBIC AMMONIUM OXIDATION IN TRICKLING FILTERS AT THE OLD DASPOORT WASTEWATER TREATMENT WORKS
5.1 Introduction and aims The results of chapter 3 and 4 suggest nitrogen removal pathways beyond conventional nitrification and denitrification. The aim of this study was to identify the microbiological processes responsible for the nitrogen removal in Daspoort trickling filters and to establish specifically whether anaerobic ammonium oxidation (anammox) takes place. A further aim was to gain an understanding of the relative importance of the identified processes by comparing nitrogen removal rates from different batch experiments. The Daspoort trickling filters are single pass filters, which achieves remarkable nitrogen removal. From an average total Kjeldahl influent concentration of 35 mg N/ℓ, an effluent nitrate concentration of 16 mg N/ℓ was produced, with complete nitrification. Humus sludge from the trickling filters was collected and analysed for the presence of anaerobic ammonium oxidisers at Stellenbosch University. Batch reactors were inoculated with biomass on the stone media obtained from one of the Daspoort trickling filters, in order to understand the stoichiometric relationship of bioprocesses responsible for wastewater treatment and nitrogen removal.
5.2 Materials and method
5.2.1 Sludge collection for DNA extraction Humus sludge was collected from the sludge withdrawal valve of the humus tanks at Daspoort WWTW (Figure 4 and Figure 5). Humus sludge contains the biofilm, with all its associated microbes, that grows on and is washed off the trickling filter media. It is therefore the most representative biomass sample obtainable for any trickling filter system. The humus sludge sample was analysed by the Stellenbosch University. The total genomic DNA was extracted from the sample and screened, implementing the PCR detection techniques honed during WRC Project K5/1823 Fishing for Indigenous Anammox Bacteria.

30
5.2.2 DNA extraction and PCR amplification of the 16S rRNA gene GeneJET Genomic DNA Purification Kit (Fermentas Life Sciences, Inqaba Biotec, South Africa), which was found to be more effective than the Zymo merchandise, was used for DNA extraction. The polymerase chain reaction (PCR) was used to amplify the 16S rRNA gene, which is a taxonomically relevant gene employed in identification and classification of bacteria at species level. Twelve primer combinations, obtained from literature, were selected to detect every possible known Anammox species (Inqaba Biotec, South Africa). However, anammox organisms display significant genus level rRNA diversity (Schmid et al., 2003) and it is therefore accepted that many species remain undiscovered due to the limitations of the probes and primers, which are all designed to amplify taxonomic genes. The 50 μℓ PCR reaction contained 200 μM of each deoxynucleotide triphosphate, 0.25 μM of each primer, 2 mM Mg Cl2, 2.5 U Taq DNA polymerase (Fermentas Life Sciences, EU) and approximately 100 ng of template DNA (adapted from Amano et al., 2007). The PCR was initiated with a 4 min denaturation at 94°C and concluded with a final 7 min elongation at 72°C. The reaction comprised thirty cycles, each with a 30 s denaturation at 94°C, a 30 s annealing at 56°C and a 60 s elongation at 70°C. The reactions were performed in a 2527 Thermal Cycler (Applied Biosystems, Singapore). PCR products were visualized under UV light in a 0.8% agarose gel. Bovine Serum Albumin was added (2.5 μℓ at 2 mg/mℓ) in order to overcome inhibition by wastewater contaminants. Negative controls were included in all instances. Where multiple PCR products were obtained from one primer set, or streaking of the PCR product occurred, PCR amplicons were extracted directly from the gel using the DNA Extraction kit (Fermentas Life Sciences, EU), according to manufacturer’s instructions. An ABI PRISM (model 3100) genetic sequencer was used for all sequencing and the online Basic Local Alignment Search Tool (BLAST) was used to detect homology with known anammox species on the NCBI (National Centre for Biotechnology Information) website database (http://www.ncbi.nlm.nih.gov/BLAST/). Sequences that aligned 100% with their respective target species were imported into PAUP (Version 4.0b10), and a heuristic search strategy was used for Maximum Parsimony analysis. The quality of the branching patterns was assessed by bootstrap resampling of the data sets with 1,000 replications.
5.2.3 Sludge collection for batch reactors The area of each trickling filter is 452 m2, consisting of gravel and stone filter media, and the bulk volume of the filters is 814 m3 each. The top layer of the trickling filters (above 1.2 m high) is filled with gravel sized 38 to 63 mm, while the bottom part is filled with gravel sized 101 to 127 mm in order to promote ventilation through the trickling filter (Els, 2010).

31
The gravel serve as the filter medium on which bacteria and other microorganisms form biofilms, which is a complex aggregation of microorganisms growing on a solid substrate as illustrated in Figure 14.
Figure 14: The surface layer of the trickling filter medium covered with biofilm.
Filter stones for batch experiments were obtained at a depth of 0.9 m into the Daspoort trickling filters (Figure 15), with a total filter media depth of 1.8 m. A dumpy level was set up on the banks south of the trickling filter units to determine levels accurately.
Figure 15: Digging in Daspoort trickling filters (left) to acquire stones with biofilm and biomass at a depth of exactly 0.9 m (right, author with ruler)

32
5.2.4 Experimental set-up Two glass vessels with a volume of 7ℓ each were used as aerobic and anaerobic reactors. The aerobic reactor was sparged with compressed air (resulting in DO concentration of ± 4.5 mg/ℓ). The anaerobic reactor was sparged with 99% nitrogen gas (resulting in DO concentration of ± 0.17 mg/ℓ). The gas pipes that supplied compressed air and nitrogen gas respectively extended through the bottom of the reactor, and were attached to diffusers. A mesh sieve was placed above the diffusers for optimal distribution of the gas bubbles. Equal masses of trickling filter stones (7.8 kg) with existing biomass attached as biofilm, and loose sludge were packed in the batch reactors.
Figure 16: Laboratory-scale aerobic (left) and anaerobic (right) batch reactors filled with trickling filter media.
Packed reactors were filled with Daspoort effluent and an active volume of 3.5 ℓ was measured. Reactor liquid was circulated externally from bottom to top at a rate of 450 mℓ/min. The anaerobic reactor was connected to the recycle pump with marprene tubing (Watson-Marlow) to ensure a low permeability to oxygen. Samples were collected from the recycle pipe. Reactor temperatures were between 24°C and 28°C. The aerobic reactor was fitted with a pH correction mechanism, dosing NaHCO3 when pH dropped below 7.5.
5.2.5 Feed solution and batch feeding Effluent from Daspoort was spiked with NH4Cl to ± 30 mg/ℓ N and with NaNO2 to ± 25 mg/ℓ N. The reactors were sampled at 0, 4, 8, 24, 28, 32, 48, 52 and 56 hours and analysed for pH,

33
chemical oxygen demand (COD), ammonia-nitrogen (NH4+-N), nitrate-nitrogen
(NO3ˉ-N), nitrite-nitrogen (NO2
ˉ-N) and total nitrogen content. Effluent was not exchanged between batches (to prevent loss of biomass, and for fear of introducing air to the anaerobic reactor). The reactor liquid was spiked with ± 30 mg/ℓ NH4Cl-N and ± 25 mg/ℓ NaNO2
ˉ-N before each experiment and between batch experiments to prevent sulphate reduction from biomass die-off and to keep accumulation of soluble COD low. An initial series of experiments (i-v) was not completed due to some challenges, but still gave some interesting results. Experiment i was not run long enough to obtain meaningful results. N2 gas flow failed during experiment ii. The recycle line failed during experiment iii (at t = 28h). The recycle line detached shortly after the start of experiment iv (at t = 4h). The N2 gas cylinder emptied during experiment v due to leak in the sparge pipe. There was a delay of 12 days between experiment v and experiment 1, because of a strike by truck drivers and non-delivery of N2 gas. The second series of experiments was named 1-4, which all functioned mechanically correct and were continued long enough (56h) to allow the processes to complete.
5.2.6 Sampling and analysis With the exception of pH, all analyses were carried out on filtered samples (Whatman #1). COD analysis was carried out using low range COD vials (15-160 mg/ℓ) (Macherey-Nagel) and measured with a 500D Nanocolour Universal Photometer. Total nitrogen analysis was also carried out using Nanocolour vials (Macherey-Nagel) and measured using the 500D Nanocolour Universal Photometer. Ammonia, nitrite and nitrate analysis was performed using a Hach spectrophotometer DR/2010.
5.3 Results
5.3.1 Molecular microbiology The PCR detection techniques confirmed the presence of anammox bacteria (Figure 17). The primer combinations used for the PCR to produce the bands in each lane were: Lane 1, Amx368f-Amx820r; Lane 2, Amx368f-Bs820r; Lane 3, Amx368f-Amx1480r; Lane 4, Amx368f-1037r; Lane 5, Amx60f-Amx820r; Lane 6, Amx60f-Bs820r; Lane 7, Amx60f-1480r (Negative controls a separate gel, data not included). The sequenced DNA showed significant homology to the 16S rDNA taxonomic informative gene fragments of “Candidatus” Brocadia fulgida and Candidatus Brocadia anammoxidans. (Figure 18).

34
Figure 17: Gel electrophoresis of the 16S rDNA taxonomic gene fragments amplified from DNA extracted from biomass sampled from the trickling filters of Daspoort WWTW.
Figure 18: Phylogenetic tree based on 16S rRNA gene sequences originating from an anammox strain named DTFamx occurring in a trickling filter at the Daspoort WWTW

35
The sequence representing DTFamx was obtained using the primer combination Amx60f-Amx820r in the PCR reaction (Figure 17). The tree was constructed with PAUP (Version 4.0b10) using a heuristic search strategy for Maximum Parsimony analysis. Numbers above branches indicate bootstrap values (> 50%) from 1000 replicates, while the number in brackets depicts the Genebank accession number for each sequence.
5.3.2 Aerobic batch process results In the aerobic reactor, the pH decreased during all batch experiments and an adjustment with NaHCO3 was necessary to increase the pH when the pH dropped below 7.5. Because of this adjustment, the pH data was not a true indication of acidity formation (Figure 19). The optimal pH range for nitrifying bacteria is between 7.5 and 8.5. During nitrification alkalinity is consumed, while during denitrification alkalinity is produced. The pH during experiments 3 and 4 dropped below 7, for around 20 hours at the start of the batch, which may explain the decrease in the nitrite oxidation rate.
Figure 19: Results from four aerobic batch processes. (Chemical oxygen demand = COD; ammonium/ammonia-nitrogen = NH3-N; nitrate-nitrogen = NO3-N; nitrite-nitrogen = NO2-N).
The COD concentration in the aerobic reactor declined gradually during all experimental periods with a total COD removal of 12, 29, 24 and 20 mg/ℓ in experiments 1 to 4 respectively (Figure 19). Bacteria that oxidise ammonia to nitrate are autotrophic and do not require an organic carbon source. Therefore the decline in COD concentration in the aerobic reactor is most likely due to utilisation by other aerobic heterotrophs present in the biofilm

36
consortia. Heterotrophic nitrifiers have been found to occur in some ecological systems, but their nitrification rates are much lower than that of autotrophic nitrifiers (Robertson and Kuenen, 1990). The NH4
+-N concentration in the aerobic reactor decreased and most of NH4+-N was
removed within 24 hours (Figure 19, graph 1, 2, and 3). NH4+-N removal was much slower in
experiment 4 (Figure 19, graph 4). The aerobic conditions in this reactor would have promoted the activity of nitrifying bacteria present in the biofilm and NH4
+-N was oxidised to NO2-N, by ammonia oxidising bacteria, which is converted to NO3
--N by the nitrite oxidising bacteria (Vayenas et al., 1997). The NO2
--N concentration gradually decreased in the aerobic reactor in all experimental periods (Figure 19), but at a different rate than ammonium oxidation. It can be seen that once ammonium is oxidised completely (concentrations near zero), the rate of nitrite oxidation seems to increase. This may not actually be an increased rate, since during ammonium oxidation more nitrite is produced while residual nitrite is being oxidised. Once ammonium oxidation stops, no more nitrite is produced, as is seen in experiments 1 to 3. Nitrate accumulated in the aerobic reactor from experimental period 1 to 4 at average concentrations of 53.9 mg/ℓ NO3
ˉ-N (Figure 19, graph 1), 63.3 mg/ℓ NO3ˉ-N (Figure 19,
graph 2), 70.3 mg/ℓ NO3ˉ-N (Figure 19, graph 3), and 94.8 mg/ℓ NO3
ˉ-N (Figure 19, graph 4) respectively. Interestingly, in the case of experiment 2, it could clearly be observed that the nitrate concentration increased with an apparent increased rate of nitrite oxidation (at the point where ammonium is zero) (Figure 19, graph 2). However, nitrate production was found not to be correlated with ammonium and nitrite oxidation, as one would expect. COD removal, like that of nitrate production, seemed somewhat erratic (Figure 19). However, in all four experiments, there was evidence of some removal. In the last three cases, the final COD concentration remains at around 40-45 mg/ℓ. For experiment 1, the final COD is 30 mg/ℓ, but the initial concentration was also less than that of experiments 2 to 4. This final COD would appear to be the residual inert soluble COD of wastewater, which on average is 25 mg/ℓ for domestic wastewater (Henze et al., 2008). In that case, whatever COD was removed, was very slowly degradable, since there was not really a concrete and well defined difference between the theoretical concepts of “soluble inert COD” and “slowly biodegradable COD”. No COD was added to the system, and by the time that experiments 1 to 4 were run, the only COD present must have been that available from decaying biomass. Total nitrogen, which was analytically measured as such, differs from the sum of analytical measurements for ammonium, nitrite and nitrate, because the difference between Total Kjeldahl Nitrogen and ammonium (i.e. all the reduced forms of nitrogen that is not ammonium), is part of the measurement. Total nitrogen analyses provide a good reference,

37
and as is seen in Figure 20, there was little change in the total nitrogen concentrations during any of the experiments 1, 2 and 4. This would be expected under completely aerobic conditions. The drop in total nitrogen concentration during experiment 3 (t = 8h until t = 24h) was unexpected. As with each batch, ammonium-nitrite is dosed (spiked), one expects the total nitrogen concentration to increase with 55-60 mg Ntot/ℓ after every consecutive batch experiment.
Figure 20: The total nitrogen concentration in the aerobic reactor during the experimental periods.
5.3.3 Anaerobic batch process results The pH of the anaerobic reactor showed a slight increase during the experimental periods, but remained fairly stable within the range of pH 8-8.5 (Figure 21) and no adjustment was necessary. The optimum pH for denitrification lies between 7 and 8, with different optimal levels, depending on the bacterial species involved (Yoo et al., 1999). The COD concentration in the anaerobic reactor also decreased gradually with a total COD removal of 23, 38, 41 and 22 mg/ℓ during periods 1 to 4 respectively (Figure 21). Bacteria responsible for denitrification can be autotrophic or heterotrophic, therefore the COD decrease may be due to ordinary heterotrophic denitrification. All experiments had an equal final COD concentration of 40 mg/ℓ. As discussed in the case of the aerobic reactor, the COD would be very slowly degradable, and would be introduced only through the slow decay of trickling filter humus sludge. This is seen by the fact that the COD at the onset of each consecutive experiment is higher (respectively 62, 68, 75 and 68 mg/ℓ) than the final COD of the previous experiment, without any external COD dosing. In the anaerobic reactor, NH4
+-N removal was clearly observed (Figure 21), although at a lower rate than in the aerobic reactor. As the reactor was maintained under anaerobic conditions, this environment would not be conducive to the proliferation of normal

38
nitrifying bacteria, which indicated that an alternative pathway for ammonia removal must have been present.
Figure 21: Results from four anaerobic batch processes. (Chemical oxygen demand = COD; ammonium/ammonia-nitrogen = NH3-N; nitrate-nitrogen = NO3-N; nitrite-nitrogen = NO2-N).
The removal of ammonia was also much slower in the anaerobic reactor in experiment 4 (Figure 21, graph 4), which shows that conditions in this reactor were no longer suitable to sustain the ammonium removal. Important to note is that the final ammonium concentration from experiments 1 to 3 (respectively 13, 15, 12 mg N/ℓ) is more or less returned as ammonium in experiments 2 to 4 (respectively 33, 46, 41 mg N/ℓ) with a known dose of 25-26 mg N/ℓ. In the anaerobic reactor, where no nitrification was expected to take place due to lack of oxygen, NO2
ˉ-N was also removed, with most of the NO2ˉ-N removed within 32 hours (Figure
21, graph 1, 2 and 3), with the exception of experimental period 4 where the nitrite removal was much slower (Figure 21, graph 4). Experiments 1 and 3 showed that nitrite could be reduced to zero. Interestingly, ammonium removal stopped at the point where nitrite was reduced to zero (clearly seen in Figure 21, graph 1). Moreover, as the rates of nitrite removal decreased over time (in line with Monod kinetics), the rates of ammonium removal seems to have decreased proportionally (experiments 1 to 3). Nitrate was reduced with each batch. However there was an increase in nitrate, from the end of one batch to the beginning of the next, from roughly 5-10 mg N/ℓ to 20 mg N/ℓ. No

39
external nitrate was added in between batches. The concentrations of NO3ˉ-N in the aerobic
reactor were higher than that of the anaerobic reactor at the start of the experimental periods as nitrate accumulated (through nitrification) during the initial adaptation phase of the reactors ± 30 days (experiments i to v) prior to the commencement of experiments 1 to 4.
Figure 22: The total nitrogen concentration in the anaerobic reactor during the experimental periods.
The total nitrogen concentration was analysed for the anaerobic reactor and is compared with the sum of ammonium, nitrite and nitrate (“the sum of species”) in Figure 22. Again, as with the aerobic reactor, a difference in the total nitrogen concentration and the sum of species would be expected. This difference should be equal to the difference between Total Kjeldahl Nitrogen and ammonium. Since the effluent was never changed during batches, one could expect that after a total of 9 experiments, lasting 68 days, there would be reduced species of nitrogen, other than ammonium, from organic decay. Still, Figure 22 shows that total nitrogen and the sum of species follow the same trends. Total nitrogen analyses provide a useful reference to gauge analytical correctness of other analyses, and to moderate outliers. Interestingly, the results obtained during experiments 1, 2 and 4 show fair correspondence between total nitrogen and the sum of species (Figure 22). The results obtained during experiment 3, however, show a discrepancy at around t=24 h. Although it was not possible to identify a faulty analysis, the sharp decrease in ammonium observed at t=28h during experiment 3 (Figure 22) may have been as a result of an experimental error. Importantly, both total nitrogen and the sum of species show a progressive decrease in the overall nitrogen removal rate from experiments 1 to 4.

40
5.3.4 Comparison of removal rates Figures 19 and 21 show that the best straight line fit for ammonium and nitrite removal is between t=4 h and t=24 h. At t=0 h, the effect of imperfect mixing would result in the bulk liquid having a higher concentration than the complete reactor space, shortly after spiking with substrate. On the other hand, after 24 h, the rate of removal decreased due to affinity for substrate (assuming Monod kinetics). The removal rates shown in Table 6 therefore apply mostly to this period. However, for nitrite removal in the aerobic reactor, we also show the removal rate between t=24 h and t=32 h, which is the period of nitrite oxidation without nitrite production from ammonium oxidation. Table 6: Summary of nitrogen removal results (aerobic and anaerobic batch experiments)
EXP’ii to EXP’v = experiment ii to v (see explanation under the heading “5.2.5 Feed solution and batch feeding”) ; EXP’1 to EXP’2 = experiment 1 to 4. The COD required for the catabolic reaction only, for ordinary heterotrophic denitrification over nitrite and nitrate, was calculated based on 2.86 g COD/g NO3
--N, and 1.71 g COD/g NO2
--N. This calculated COD requirement can be compared to the measured COD removal over the same period. The ratio of nitrite to ammonium removal was calculated based on the period t=4 h to t=24 h, as well as for the complete experiment. The average ratio of NO2-N: NH4
+-N removal, based on the values in Table 6 (excluding experiment 4), equals 1.31.
5.4 Discussion Kartal et al. (2008) studied the ability of anaerobic ammonium oxidisers (anammox bacteria) to oxidise acetate and grow amongst heterotrophic bacteria. In batch experiments,
EXP' ii EXP' iii EXP' v EXP' 1 EXP' 2 EXP'3 EXP'4
Parameter Period
NH4+ 04h - 24h 10.4 13.0 21.8 22.4 19.8 15.8 10.50
NO2- 04h - 24h 16.7 20.7 12.5 10.0 7.6 10.3 6.39
NO2- 24h - 32h 4.1 3.9 9.4 9.1 6.4 13.4 3.96
NH4+ 04h - 24h 7.6 4.1 10.3 12.4 10.3 7.6 -0.56
NO2- 04h - 24h 10.3 8.5 9.13 17.3 16.7 14.6 8.83
NO3- 04h - 24h -1.1 8.5 4.80 7.9 3.1 4.5 9.60
COD 04h - 24h 11 11 0 20 7 12 8
COD_denit,min calculated 18 39 29 52 38 38 43
NO 2- /NH 4
+ ratio 1 (04h- 24h) 1.36 2.06 0.89 1.39 1.62 1.93 -
NO 2- /NH 4
+ ratio 2 (00h - 56h) 1.08 1.05 0.97 1.16 1.35 0.86 3.67
Aero
bic
ANae
robi
c
Removal (mg/l) (negative values depict production)
41
Candidatus ‘Brocadia fulgida’ showed the highest oxidation rate for acetate, which was not incorporated directly into the organism’s biomass. It is interesting that the PCR results from Daspoort humus sludge showed the presence of an anammox bacterial species closely related to ‘Brocadia fulgida’. This is an autofluorescent species, which would render FISH analyses of microbial organisation within biofilms, in terms of bacterial diversity, unlikely to be successful.
While the actual portion of nitrogen released through diverse bacterial consortia and higher organisms present in the trickling filter biofilms remain difficult to assess, the total nitrogen concentrations in the reactors could be examined. In all experimental periods, the total nitrogen concentration was much higher in the aerobic reactor (Figure 20) than in the anaerobic reactor (Figure 22). This can be ascribed to the activity of denitrifying bacteria (possibly heterotrophic as well as autotrophic) in the anaerobic reactor, which may have resulted in decreased NO3
ˉ-N and therefore total nitrogen, compared to the inhibition of denitrification in the aerobic reactor. Interestingly, the total nitrogen in the anaerobic reactor increased with each successive experiment (Figure 22), which correlates with the slower rate of NH4
+-N and NO2--N removal (Figure 21) that occurred as the experiments
progressed.
Denitrification is known to occur in distinct zones within trickling filter biofilms, at a depth of 0.2-0.3 mm below the biofilm surface, as was demonstrated by Dalsgaard and Revsbech (1992) using micro-sensors. However, in the aerobic batch reactor inoculated with trickling filter biomass, very little if any removal of the total nitrogen, known to occur via denitrification, was observed. This is interesting, since the full scale reactors at Daspoort remove 50% or more of the influent nitrogen. Most likely, the process of simultaneous denitrification alongside nitrification was suppressed at high airflow rates, as the anaerobic or anoxic micro-zones were minimized (Holman and Wareham, 2005) in the aerobic reactor. Nevertheless, it was previously reported that, during batch experiments, denitrification can also occur in the presence of oxygen (Schmidt et al., 2002), however most denitrifiers are facultative anaerobes and reduce nitrate in the absence of oxygen (Van Rijn et al., 2005). The absence of COD in the batch reactor feed (see 5.2.5 “Feed solution and batch feeding”) could also have influenced the thickness of the aerobic zone of the biofilm of the aerobic reactor. With less COD, the aerobic zone depth would increase and the potential for denitrification (autotropic or heterotropic) would have decreased. On the other hand, it is also known that ammonium lowers nitrate assimilation rates and increases nitrate availability for denitrification. Thus, it was stated that the interaction of aerobic nitrifying bacteria, ordinary anoxic heterotrophic denitrifying bacteria, and anaerobic ammonium oxidizing bacteria under oxygen limitation, has the potential to almost completely convert ammonium and organic carbon to nitrogen gas and carbon dioxide (Chen et al., 2009).

42
The results obtained with the aerobic reactor during the present study showed that microorganisms occurring in the trickling filter biofilm were capable of complete nitrification under aerobic conditions. The findings obtained with the anaerobic reactor showed that microorganisms were present that were capable of denitrification, which may be heterotrophic or autotrophic. Heterotrophic activity was indicated by the reduction of COD and nitrate, whiles autotrophic activity and the possibility of anammox bacteria taking part in the process, was indicated by the reduction of nitrite and ammonia. It must be noted that anammox bacteria are characterised by the consumption of NO2
- and NH4+ in a ratio of 1:3.1
(Schmidt et al., 2002) and that this ratio was also the average ratio of NO2--N: NH4
+-N removal in the anaerobic reactor for experiments 1, 2 and 3 (Table 6).
The rate of ammonia and nitrite removal in the anaerobic reactor showed a decline from experimental periods 1 to 4 (Figure 21). The conditions in the reactor were therefore not ideal to sustain anaerobic ammonium oxidation, and the reaction rate slowed down notably over the successive experimental periods. Since effluent was never changed, this decreased reaction rate could have been due to build-up of an inhibitory by-product in the system.
The biological composition of the trickling filter biofilms depends on their location and other ambient factors (Mack et al., 1975). Over 200 species of bacteria, protozoa, algae, worms and insects have been found on or in trickling filters and these organisms exist as a functional unit within an ecosystem (Cooke, 1959). Conditions in the laboratory batch reactors may not have been ideal for all these species to survive, as they would in the actual trickling filter system. The symbiotic role of these organisms in the nutrient removal process should therefore not be underestimated.
A number of observations point to the existence of anammox bacteria in the full scale trickling filters at Daspoort, and that these bacteria play an important role in the overall removal of nitrogen from settled wastewater. These observations are summarised below:
a. The measured availability, as well as the removal, of COD from the bulk liquid was clearly insufficient for the removal of nitrite and nitrate via ordinary heterotrophic denitrification, even considering only the catabolic reactions for nitrite/nitrate reduction. This finding echoes an earlier observation on the good effluent results from the full scale trickling filter (section 3 of this report).
b. Nitrite was reduced to near zero (below detection limit) in anaerobic batch experiments. Nitrate was not reduced to zero in any of the anaerobic experiments (it

43
is believed that the nitrate value of experiment 1, t = 56h, is an analytical error in light of the nitrate trend, as well as the total nitrogen concentration shown in Figure 22).
c. Under normal heterotrophic denitrification, it is to be expected that nitrate will be removed completely before nitrite is removed however; it did not happen during any of the experiments with the anaerobic batch reactor.
d. Anammox bacteria are known to have a high affinity for nitrite, resulting in complete nitrite removal with sufficient ammonium.
e. When nitrite concentrations in the anaerobic experiments reached zero, the removal of ammonium stopped altogether, and the concentration remained near constant (especially during experiments 1 and 2). Anaerobic removal of ammonium was clearly correlated with the removal of nitrite.
f. Compared to experiments 1 and 2, experiments 3 and 4 were characterised by lower nitrite removal rates and overall lower total nitrogen removal rates, as well as lower removal rates for ammonium.
g. The average ratio of nitrite to ammonium removal, as shown in Table 5 (excluding experiment 4), was 1.31, which is the commonly accepted ratio for the anammox process.
h. The reaction rate for anaerobic ammonium removal was relatively high (around 50% of the rate of aerobic ammonium oxidation, for experiments 1 to 3), and the reaction rate of anaerobic nitrite removal was comparable to the rate of aerobic nitrite oxidation.
i. PCR amplification of taxonomically informative 16S rRNA gene sequences, followed by sequence analysis confirmed the presence of an anammox bacterium closely related to Candidatus Brocadia anammoxidans” and Candidatus “Brocadia fulgida” in the Daspoort humus sludge.
A major limitation of the anammox process is the slow growth rate of anammox bacteria (Van Rijn et al., 2005). The Daspoort trickling filters are over 100 years old and this may have allowed the formation of a superior microbial biofilm consortium through selection and evolution. The application of the anammox process applied to recirculating systems to control nitrogen compared to conventional denitrification approaches remains to be determined.

44
5.5 Conclusions on batch experiments Bacteria closely related to anammox bacteria were detected through direct molecular screening of samples from the trickling filters of the Daspoort WWTW. Batch reactors filled with humus sludge demonstrated anaerobic ammonium removal with concomitant nitrite reduction, at a stoichiometric relationship close to that which characterizes known anammox bacteria. However, batch reaction rates decreased progressively over the successive experimental periods, indicating decay of the anammox-like process without growth during batch experiments. This phenomenon could perhaps indicate a disturbance, during the experiments, of a symbiotic relationship between the anammox bacteria and other organisms that maintain a favourable environment. With the above as background, it is evident that nitrogen removal over Daspoort trickling filters is not only a function of conventional heterotrophic denitrification, but an anaerobic ammonium oxidation process also plays an important role.
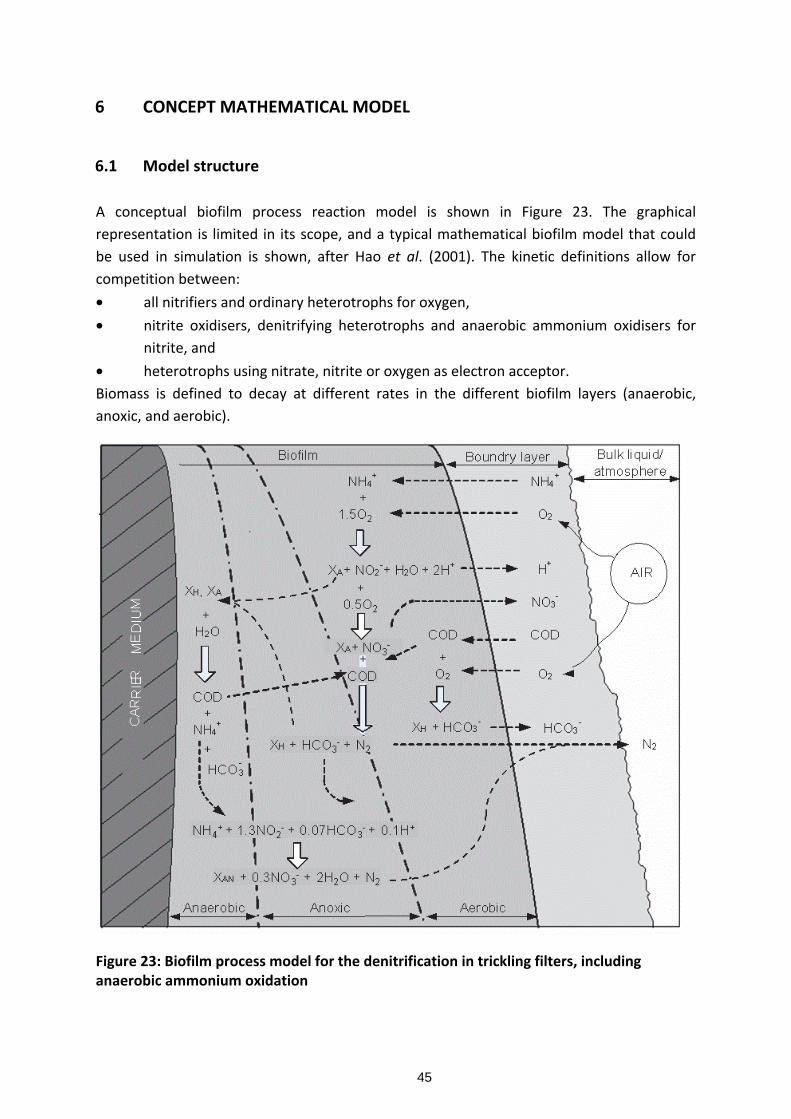
45
6 CONCEPT MATHEMATICAL MODEL
6.1 Model structure A conceptual biofilm process reaction model is shown in Figure 23. The graphical representation is limited in its scope, and a typical mathematical biofilm model that could be used in simulation is shown, after Hao et al. (2001). The kinetic definitions allow for competition between: • all nitrifiers and ordinary heterotrophs for oxygen, • nitrite oxidisers, denitrifying heterotrophs and anaerobic ammonium oxidisers for
nitrite, and • heterotrophs using nitrate, nitrite or oxygen as electron acceptor. Biomass is defined to decay at different rates in the different biofilm layers (anaerobic, anoxic, and aerobic).
Figure 23: Biofilm process model for the denitrification in trickling filters, including anaerobic ammonium oxidation

46
The mathematical model of Hao et al. (2001) was integrated into the biofilm compartment of the AQUASIM software (Reichert, 1998). The bulk volume of the biofilm reactor (trickling filter) could be divided into sub-reactors to allow for differentiation of substance concentration in the bulk liquid, as well as for different biofilm thicknesses. An unconfined reactor could be used for the biofilm compartment, which is further specified by no diffusive mass transport of solids and by no change in porosity. The specified compartment then calculates concentrations and growth according to grid points in the biofilm (10-15). A model this defined would be a good biofilm model. However, such a strict definition of the entire system as biofilm model is not consistent with the reality and complexity of the process. Digging into the trickling filter to obtain rocks for anammox batch experiments (as described in chapter 5) has revealed an abundance of higher organisms, including: • insects • snails • worms (including earthworms) • crustaceans (including barnacles) These organisms seem to thrive in the low loaded intermittently fed ecosystem of the Daspoort trickling filters. Their food would include bacteria and no doubt yeasts, and possibly some of the other higher organisms, which would to a large extent be converted to CO2. The relative mass of these organisms hasn’t been quantified, as distinction from the rest of the biomass complex/matrix is a challenge. It follows that the role of higher organisms in COD removal cannot be quantified without further research. A simplified 2-dimensional biofilm model is presented in Figure 23, Table 8 and Table 9. Further work is required to quantify the role of higher organisms in the COD and N mass balance, in order to present a less simplistic model.
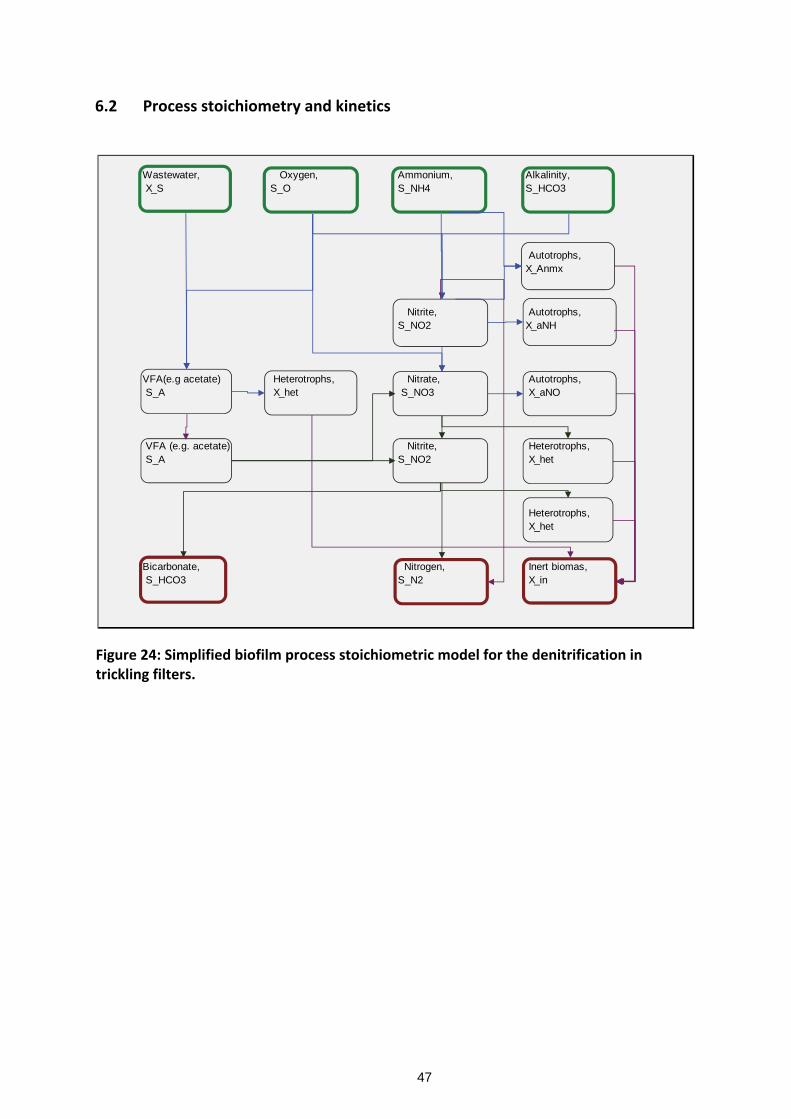
47
6.2 Process stoichiometry and kinetics
Figure 24: Simplified biofilm process stoichiometric model for the denitrification in trickling filters.
Wastewater, Oxygen, Ammonium, Alkalinity, X_S S_O S_NH4 S_HCO3
Autotrophs, X_Anmx
Nitrite, Autotrophs, S_NO2 X_aNH
VFA(e.g acetate) Heterotrophs, Nitrate, Autotrophs, S_A X_het S_NO3 X_aNO
VFA (e.g. acetate) Nitrite, Heterotrophs, S_A S_NO2 X_het
Heterotrophs, X_het
Bicarbonate, Nitrogen, Inert biomas, S_HCO3 S_N2 X_in

48
Tabl
e 7:
Sum
mar
y of
nitr
ogen
rem
oval
resu
lts (a
erob
ic a
nd a
naer
obic
bat
ch e
xper
imen
ts)
Yiel
dsSu
bsta
nce
conv
ersi
on m
ass
bala
nces
(mol
)Ra
tes
Proc
esse
sY
,obs
S_N
O3
S_N
O2
S_N
2S
_NH
4S
_O2
S_A
S_H
CO
3S
_H+
X_S
X_he
tX_
aNH
X_aN
OX_
inH
2O
Hyd
roly
sis
of p
artic
ulat
es0.
20.
337
0.67
7.33
-13.
33-8
.67
a
Mic
ro-o
rgan
ism
dec
ay,
X_he
t-
0.2
0.48
-0.0
40.
24-1
0.01
-0.3
6b1
Mic
ro-o
rgan
ism
dec
ay,
X_aN
H0.
20.
48-0
.04
0.24
-10.
01-0
.36
b2
Mic
ro-o
rgan
ism
dec
ay,
X_aN
H0.
20.
48-0
.04
0.24
-10.
01-0
.36
b3
Ano
xic
grow
th,
S_A
; N
O3
to N
O2
0.5
-2.1
2.1
-0.2
-1.0
51.
10.
251
0.40
c
Ano
xic
grow
th,
S_A
; N
O2
to N
20.
5-1
.40.
7-0
.2-1
.05
1.1
-1.1
51
1.10
d
Aer
obic
gro
wth
on
S_A
0.5
-0.2
-1.0
5-1
.05
1.1
0.25
10.
40e
Nitr
ifica
tion;
NH
4 >
NO
20.
1614
.8-1
5-2
1.15
-128
.81
15.2
0f
Nitr
ifica
tion;
NO
2 >
NO
30.
0548
.53
-48
-0.7
25-2
4.00
-10.
251
0.93
g
Ana
mm
ox;
NH
4 +
NO
2 >
N2
+ H
2O0.
032.
70-1
0.60
10.7
025
-10.
703
-1-1
.21
21.6
1h
Observed biomass yield on substrate
Nitrate
Nitrite
Nitrogen gas
Ammonium
Dissolved oxygen
Soluble, readily degradable substrate
Bicarbonate
Acidity
Particulate slowly degradable substrate
Heterotrophs, facultative
Autotrophs, NH4 oxidisers
Autotrophs, nitrite oxidisers
Particulate inert matter
Water
Process rate equations

49
Table 8: Process rate equations
Table 9: Summary of nitrogen removal model parameters
Process rate equations
a K_H*X_S/(X_S+K_X)*X_hb1 b_het*X_hetb2 b_aNH*X_aNHb3 b_aNO*X_aNOc μmax_het*S_A/(S_A+K_A)*S_NO3/(S_NO3+K_NO3)*K_ONO3/(S_O+K_ONO3)*S_NH4/(K_NH+S_NH4)*S_HCO3/(S_HCO3+K_HCO3)*X_hd μmax_het*S_A/(S_A+K_A)*S_NO2/(S_NO2+K_NO2)*K_ONO2/(S_O+K_ONO2)*S_NH4/(K_NH+S_NH4)*S_HCO3/(S_HCO3+K_HCO3)*X_he μmax_het*S_A/(S_A+K_A)*S_O/(S_O+K_Oh)*S_NH4/(K_NH+S_NH4)*S_HCO3/(S_HCO3+K_HCO3het)*X_hetf μmax_aNH*S_NH4/(S_NH4+K_NH4nh)*S_NH4/(S_NH4+K_NH4)*S_O/(S_O+K_Onh)*S_HCO3/(S_HCO3+K_HCO3aut)*X_aNHg μmax_aNO*S_NO2/(S_NO2+K_NO2)*S_NH4/(S_NH4+K_NH4)*S_O/(S_O+K_Ono)*S_HCO3/(S_HCO3+K_HCO3aut)*X_aNOh μmax_Anmx*S_NH4/(S_NH4+K_NH4anmx)*S_NO2/(S_NO2+K_NO2anmx)*(1/(S_O+1))*S_HCO3/(S_HCO3+K_HCO3aut)*X_Anmx
Kinetic parameters min average maxμmax_het max growth rate of facultative heterotrophs 1/d 2μmax_aNH max growth rate of ammonium oxidisers 1/d 0.35μmax_aNO max growth rate of nitrite oxidisers 1/d 0.6
n correction factor for anoxic growth rate 1/d 0.7b_het decay rate of heterotrophs 1/d 0.35
b_aNH decay rate of ammonium oxidisers 1/d 0.05b_aNO decay rate of nitrite oxidisers 1/d 0.09
Saturation constants min average maxK_A growth on S_A gCOD/m3 10
K_Oh Oxygen, heterotrophs gO2/m3 0.1
K_Onh Oxygen, ammonium ox gO2/m3 0.2 0.6
K_Ono Oxygen, nitrite ox gO2/m3 0.1 2.2
K_CO3aut Bicarbonate, alkalinity, autotrophs eqv/m3 0.1
K_CO3het Bicarbonate, alkalinity, heterotrophs eqv/m3 0.3
K_NH4nh Electron donor for ammonium oxidisers gNH4+/m3 0.7
K_NH4 Nitrogen source in biomass synthesis gNH4+/m3 0.05
K_NO2 Nitrite as electron acceptor gNO2-/m3 0.5
K_NO3 Nitrate as electron acceptor gNO3-/m3 0.5
K_ONO2 Oxygen inhibiting nitrite as e-aceptor gO2/m3 0.7
K_ONO3 Oxygen inhibiting nitrate as e-acceptor gO2/m3 0.7
K_X Particulate slowly degradable substrate gCOD/m3 12
Diffusion coefficients (Henze et al. 2002) min average maxd_O Oxygen m2/d 1 2.1
d_A Substrate, soluble degradable m2/d 0.1 0.7
d_NH4 Ammonium m2/d 0.8 1
d_NO2 Nitrite m2/d 0.8 1
d_NO3 Nitrate m2/d 0.8 1
d_HCO3 Bicarbonate m2/d 0.4 0.8
Biofilm characcteristics min average maxbft Biofilm thickness mm 0.7 3
rho Density gCOD/m3 50000
theta Porosity m3 liquid/m3 biofilm 0.75

50
6.3 Physical properties and mass transfer
6.3.1 Air flow rate and oxygen uptake Paraphrasing Piret et al. (1939), the following aspects of air flow rate through a trickling filter is of fundamental importance in developing a trickling filter model:
• In winter, or at night, when the water is warmer than the outside air, the air inside the filter is heated, becoming less dense, which creates an upward draft. In summer, or during mid-day, when the outside air temperature is higher than the wastewater temperature, air inside the trickling filter is cooled, becoming denser, and creates a downward draft. The flow of air at equilibrium and with continuous water distribution is a straight-line function of the difference between the temperature of the outside air and the temperature of the wastewater.
• The hydraulic loading has very little effect on the air flow rate, and air is not “pulled-in” by the trickle of flow.
• Filter media temperature, at steady state, approaches the water temperature, and not that of the outside air temperature
• The maximum air flow occurs when the difference between temperature of air inside the trickling filter and the outside air temperature is a maximum. Intermittent flow (e.g. via siphon tank, as at Daspoort WWTW, or pump) keeps inside air and filter media temperature closer to the outside air temperature. Maximum air flow thus occurs during continuous hydraulic loading.
• The temperature of air leaving the trickling filter is close to the average of the water temperature and outside air temperature.
• The rate of air flow is highly dependent on the passage available for air to flow. Since the driving force for the air draft can be low, for small temperature differences even slight obstructions can limit the air flow rate. The growth and accumulation of biomass, which depends on oxygen from the air flow, therefore also becomes a restriction on the air flow rate.
For a deterministic approach to understanding and quantifying trickling filters, a dynamic model is required that can iteratively: • Calculate the air flow rate for clean water through a clean filter, with filter media of
variable nominal diameter, but without growth, for any data series of temperature differences (as variable input data), which is the first calibration.
• Calculate the transfer of oxygen from air into the bulk liquid, based on the air flow rate, the hydraulic load, for varying bulk liquid oxygen concentrations.

51
• Calculate the transfer of oxygen from the bulk liquid into the biofilm. • Calculate biomass growth, based on this introduction of oxygen, according to
process stoichiometry and kinetics. • In turn, use the calculated biomass to calculate the air flow rate for the series of
input temperature differences.
6.3.2 Hydraulic loading, shear and sloughing Biofilm and other forms of biomass inside a trickling filter are subjected to shear stress caused by the trickling water (which is a process similar to soil erosion). Higher hydraulic loadings cause greater shear stress and reduce biofilm thickness and prevent clogging. Decaying or dead biomass loses the ability to attach to filter media, and is sloughed. In a model, the following interactions are important:
• Hydraulic loading rate has to be translated into a flow rate per area of trickling filter media (m3.m-2.h-1)
• The per area flow rate has to be translated into a shear stress that acts on biomass, which in turn either reacts by attachment force, or is sloughed by excessive shear stress.
• The sloughed biomass is carried by the momentum of flow and under force of gravity, and is either washed out or deposited at lower layers depending on balance of forces.
• The effect of sloughing is translated to an increased air passage, which increases air flow rate and affects oxygen transfer.
• The flow regime is important too: for any given average daily flow rate, a trickling filter with intermittent flow rate will have a higher hydraulic load and increased shear stress, and therefore thinner biofilm, as compared to the same trickling filter with continuous flow.
• Similarly, the rotation speed of the distribution arm results in specific localised hydraulic loads. A very high rotating speed approximates a continuous flow distribution, while a very low rotating speed concentrates the hydraulic load onto small sections of the trickling filter.
6.3.3 Biofilm diffusion The diffusion of substances into deeper layers of the biofilm not only determines the rate of overall processes, but also the establishment of different micro-climates (e.g. aerobic, anoxic, and anaerobic) in which different bacteria interact. Biofilm diffusion kinetics have been studied in depth (Morgenroth, 2008) and applied in 1-D models. In developing an

52
integrated trickling filter model, most likely the same diffusion kinetics will apply, and other than careful selection of values from literature, not much further basic research is required here.

53
7 THE FUTURE OF TRICKLING FILTERS: EVALUATION OF THE ROLE AND POTENTIAL OF TRICKLING FILTERS
7.1 Trickling filters: sustainable and appropriate technology The wastewater industry in South Africa can at times be fraught with opinions that are formed of catch phrases and clichés. Opinion pieces (such as this chapter) are therefore properly introduced through a deliberation on the meaning of some terminology: System: a system is best described in terms of a multi-dimensional technology space, with
co-ordinates being • System hierarchy (materials-components-equipment-unit processes-user interface-
socio-political level) • System life cycle (from conceptualisation-design-development-implementation-
operation-maintenance-utilisation until decommissioning and dismantling) • System discipline (philosophy-mathematics-natural science-engineering-economics,
etc.). Technology: technology comes into existence and functions in human society only in a system where the product of the following three factors is large enough to move the technology beyond a certain “critical mass”. The three factors are: • Sufficient fundamental knowledge of the natural science (physics, chemistry and, in
this case, microbiology) of the system, the mathematical and numerical skill required for a dimensional description of a system, and the technical skill to apply the knowledge and numbers in practice.
• Money, in the form of capital investment and continued running costs, and in competition with other systems that require money.
• Social and political will and appetite for the goods and services produced by a system.
Sustainable: to keep going continuously while conserving an ecological balance and
avoiding depletion of natural resources.1
1 ‘Sustainability’ and ‘Sustainable development’ have become buzzwords in the 21st Century, especially in
the urban infrastructure design and management sector. Brundtland et al. (1987) define sustainable development as “development that meets the needs of the present without compromising the ability of future generations to meet their own needs”. According to Hjorth & Bagheri (2006), it is often misconceived as an ‘end state’ or rigid project target to be achieved in an allotted time-frame. Sustainable development, however, is an on-going process which inter-relates aspects of economy, environment, society and other technicalities. (WRC project K5/1826: Sustainable Urban Drainage (in press 2013).

54
Appropriate: suitable for the purpose within the specific context of a system. Most sustainable technology: a relative concept, used for comparison of different
technologies, measured as the optimum natural resource consumption in producing goods and services, considering technology drivers such as environmental impact, cost, and human/technology interface.
Most appropriate technology: a relative concept, used for comparison of alternative
technologies, and measured as the extent to which the cornerstones of the technology are equally well founded and in harmony (great technical skill without money is a failed technology, just as is the case where all the money and will is available, but without skill, and considering that the “most sustainable technology” in one context may not be “appropriate” in another)
Some of the criteria used in measuring “sustainable” as well as “appropriate” technology are here listed and briefly discussed, by way of introduction to the rest of the chapter: Effluent quality • Chemical and microbial pollutants from the perspective of the treatment process
(what is technologically possible) • Chemical and microbial pollutants from the perspective of the receiving water body
(what is environmentally required) • Resilience of a biochemical process, or, the ability and quick response to return to
steady state operation in event of an adverse incident. Lifecycle Cost • Capital cost is the deciding factor for selection and construction of most wastewater
treatment works (available from funds such as Municipal Infrastructure Grant). • Running cost: It happens (too often) that once capital is spent, the municipal budget
makes no (or not sufficient) provision for running cost, even in the first year of operation. It seems prudent therefore to invest more in a system requiring lower O&M cost.
Operational cost can amount to up to 80% of life cycle cost. However, the duration of “life
cycle” is ill defined: most works designed for 20 years, but give longer service (with higher maintenance costs in later years) and thus the operational cost (as percentage of life cycle cost) could be even higher than normally calculated.
Human resources (skills) are a requirement for heads and hands. Many hands with no head
mean nothing. Likewise, the best head without hands won’t get the job done either.

55
The time frame of a system is normally not well defined. We lack sufficient imagination to see far into the future. The durability of a system is important both for its “sustainability” as well as its “appropriateness”. A time horizon of 100 years plus is normally unheard of in wastewater treatment systems, but the case study of the well-maintained trickling filters at Daspoort, shows the huge potential that a long life holds.
The rest of this chapter compares the Daspoort trickling filters, according to these and various other criteria, in terms of its sustainability and suitability for wastewater treatment, in the context of large municipal wastewater treatment works where a portion of the total inflow is treated, like Daspoort’s old trickling filters, or where trickling filters are used as part of another process, like the external nitrification at Daspoort’s newer trickling filters; or in the context of small and rural wastewater treatment works, where trickling filters are the only biological wastewater treatment unit process. Because trickling filters are more similar in function and operation to activated sludge processes than to pond systems, the comparison in this chapter is between trickling filters and activated sludge. Activated sludge has become the default process of choice in recent years, and this conception needs to be challenged.
7.2 Environmental impact
7.2.1 Wastewater effluent quality • COD effluent from low loaded trickling filters, with filtered COD effluent
concentrations at an average of 33 mg/ℓ, are comparable with most activated sludge processes.
• Ammonium from low loaded trickling filters (at Daspoort) is normally between 2 mg/ℓ and 5 mg/ℓ, which is well within the general limit standard of 6 mg N/ℓ.
• Nitrate can vary within nitrifying trickling filters, but are normally in excess of the general limit standard of 15 mg N/ℓ. However, the experience of Daspoort has shown consistent nitrate removal to less than 15 mg N/ℓ, with lows of between 8 and 10 mg N/ℓ, which compares very well with most activated sludge processes.
• Phosphate is not removed by the trickling filter process. All the phosphate taken up by the biomass inside the filter is eventually released through death and decay. Because of the long sludge age of the system, very little net P-removal takes place. Phosphate removal at trickling filter processes is standard via chemical precipitation with ferric chloride.
• Suspended solids from trickling filters are humus that sloughs off the filter media. With the dosing of ferric chloride, most solids are coagulated, and as a by-product of

56
phosphate precipitation, suspended solids removal from trickling filters is normally just as effective in humus tanks, as is activated sludge separation form final effluent in clarifiers.
• Pathogens are physically removed in the filter system (and killed off most likely through predation). Still, final disinfection is required just as with the activated sludge processes.
7.2.2 Air quality Aerosol formation in activated sludge plants (especially with surface mounted aerators) is normally not taken into consideration by environmental impact studies. Volatile suspended solids, nitrogenous compounds and even solids, including harmful bacteria and viruses, are in fact dispersed into the atmosphere as an unwanted side effect of aeration. With trickling filters, however, there is very little chance of this happening. At Daspoort WWTW almost no odour is discernible at the old trickling filters except for a faint hint of humus (East), while the activated sludge process (West) often smells.
7.2.3 Sludge handling and disposal Low loaded trickling filters require primary settling, to remove up to 60% of solids and 30% of COD. The resulting raw sludge has to be treated, and this is most often done in anaerobic digestion. If managed properly anaerobic digesters can produce biogas, which is available for production of heat. Waste sludge from anaerobic digesters are stable and can be disposed in landfill, used in composting, or in some cases applied directly to agricultural land. Sludge handling from activated sludge processes is no less complicated. The fact that more inert material is concentrated in the suspended activated sludge normally complicates sludge treatment: not enough readily available organic matter is present to make anaerobic digestion worthwhile, but the sludge is still too active for direct disposal.
7.2.4 Prevention of natural resource depletion Activated sludge processes require electrical power for aeration and mixing. The economic cost of electricity is discussed under “7.3 Life cycle cost”, but there is also an environmental cost related to the production of electricity, including nitrogenous and sulphurous gasses as well as CO2. A more serious concern is the depletion of coal as a natural resource. Modern activated sludge processes have been described as potential resource recovery processes,

57
e.g. bio-polymers and poly-phosphate, but this was in relation to “old” activated sludge processes and not trickling filters. Almost no resources are consumed in the trickling filter process. Phosphate is removed as FePO4, which is not easily recoverable.
7.3 Life cycle cost
7.3.1 Construction cost • Land is a cost in wastewater treatment works that is not often taken into
consideration in South Africa. Most cities, even the metropolitan areas, are not as densely populated as cities in most other countries, and land is always available. However, where land is not freely available and where the cost of land is important, trickling filters are not a viable option. For instance, in Rotterdam, The Netherlands, one of the activated sludge plants is built below ground to create open public space on top of the process. Activated sludge bioreactors require around 800 m2 (at 5.5 m deep, and a hydraulic residence time of 20 hours, for 200 ℓ/d, for 25 000 people, or 5 Mℓ/d). By contrast, one of the trickling filters at Daspoort, which is 24 m in diameter, occupies almost 800 m2 when the areas around the filters are taken into account. Since 16 trickling filters are employed at Daspoort, activated sludge processes use land 16 times more effectively. It can be assumed that inlet works, primary settling and clarification require the same area, regardless of the choice of biological treatment.
• Civil construction of activated sludge bioreactors consists of earth works (excavation), concrete reactor walls with some minor internal structures, and bulk pipe work. For the case study of a 5 Mℓ/d reactor, with a volume of 4 200 m3 at a depth of 5 m, the concrete volume required for construction amounts to roughly 450 m3. Excavation would be equal to the reactor volume. For the same functionality, a trickling filter is needed with a concrete floor and walls with a height of 1.8 m. The concrete volume required for this trickling filter construction would be 2 400 m3 (or roughly five times more than for the activated sludge reactor). With trickling filters, normally no earth excavation is required, but the total pipe length is more. With activated sludge, shorter lengths of pipe of bigger diameter are used, which is more economical.
• Material in the form of filter media (mostly rock) is a big cost factor in the construction of trickling filters, as the transport thereof is very expensive. Where rock crushers are close to a planned wastewater treatment works, this cost is much less than if rock has to be transported over some distance.

58
• Mechanical equipment at trickling filters is limited to the distribution arms. Once these operate correctly, they require little attention other than periodic maintenance of the centre bearing. By contrast, activated sludge systems require aerators, mixers and recycle pumps.
• The electrical infrastructure is much more complex for activated sludge processes (including mini-substations, transformers, power cables, motor control centres) as for trickling filters.
7.3.2 Financing Down payment on capital investment bears a cost that could be significant over the life-cycle of a system, depending on the down-payment period, and the interest rate.
7.3.3 Operation and maintenance • Staff salaries
- Management and administration is normally not the most significant expenditure. Where organisations are well run, a strong management core can oversee the operation of a number of treatment works as well as the associated infrastructure. This portion of the total staff is not much affected by the type of process employed.
- The type and number of scientific/technical services also do not depend much on the type of process employed. Effluent sampling and analysis are no different at a trickling plant than at an activated sludge plant. At an activated sludge plant the higher level process controllers need to be better skilled, especially in understanding process behaviour and sudden changes, which is much less important at trickling filters.
- Process controllers (up to class III) required at an activated sludge plant are much more important than at a trickling filter plant. Regulation 2834, for the classification of works, gives a higher score for an activated sludge process, which would eventually stipulate the number of operators required. Process controllers up to class III are in short supply and are often difficult to retain.
- Although it should not be, maintenance seems to be the Achilles heel of activated sludge works. Too often equipment is abused. They are kept in operation until they cease of break down, without any preventative routine maintenance whatsoever. Shockingly, this is also the case in the larger metropolitan and at some of the larger public companies responsible for wastewater treatment. Good fitters, electricians, and millwrights are in short supply and command good salaries. For all the wonderful benefits and

59
promises of activated sludge, the system fails for lack of proper maintenance. For example, a burnt-out stream breaker or isolator worth a mere R1 000 will prevent the operation of a multimillion Rand system. Trickling filters quite simply have less moving parts, and therefore less that can go wrong.
• Electricity The energy requirement for mixing, internal recirculation pumping and aeration of
modern biological nutrient removal activated sludge processes is 3.7 kJ/ℓ (Wilsenach and Van Loosdrecht, 2006). If the Daspoort WWTW had been designed as an activated sludge plant 100 years ago, the total cost of electricity in today’s terms (at R1/kWh) over its lifetime, with 5 Mℓ/d, would have been R189 million. This would have increased the treatment cost by an additional R1/kℓ. However, the Daspoort trickling filters are built against a slope and operate under force of gravity alone, without any electricity.
This is not generally true for all trickling filters, as some still require pumping. However, the fact that neither electrical powered aeration nor mixing is required means that the energy demand of trickling filters would always be much less than that of activated sludge processes.
• Chemical dosing Ferric chloride is used to remove phosphate at the old Daspoort trickling filters. At 4
mg P/ℓ removed on average, and a current cost of ferric chloride of R1,658/ton, assuming 50% efficiency in phosphate precipitation (due to co-precipitation of other compounds) the cost of this chemical dosing over the lifetime of the trickling filters could have been up to R30 million. Chemical precipitation as a phosphate removal mechanism is normally said to be very expensive, but by comparison to the saving in electricity at Daspoort, this is a very affordable cost!
7.4 Risk of process failure
7.4.1 Consistent effluent quality (biochemical process stability, resilience) Activated sludge can in theory produce excellent effluent quality, with low dissolved nutrient concentrations and low suspended solids in the effluent. However, this is only true if the plant is operated and maintained 100% according to prescription. Deviation from the process norm can easily result in persistently poor effluent quality. Trickling filters such as those at Daspoort are very resilient. None of the full scale experiments performed during the work described elsewhere in this report, seemed to have had any lasting effect on the

60
performance and ability of the process. The long sludge age (approaching infinity) together with the complex eco-system observed, seems to result in a remarkably stable system that is mostly self- regulating. However, no system exists that can operate indefinitely without proper operation and maintenance. If the primary settling tanks upstream from the trickling filters are not operated and de-sludged correctly, solids would eventually carry over and destroy the trickling filter.
7.4.2 Number of moving parts The number of moving parts at an activated sludge system and the consequent potential for failure make the system less resilient. A simple malfunction of a single part often has a knock-on effect that may lead to process and/or mechanical failures in other parts of the system.
7.4.3 Myth of control • Activated sludge processes can be controlled by a few parameters, including SRT, S-
recycle ratio, A-recycle, and configuration (e.g. either UCT or three-stage Bardenpho).
• A number of issues are beyond the plant personnel’s control, such as high peak loads (hydraulic and waste load, as well as certain wastes released from industrial batch processes). These problems must be addressed by management, often in collaboration with industry, over a period of time. Other issues, such as bulking sludge, erratic bio-P removal if the detail design or construction was not precisely in keeping with the principles of bio-P removal, is also not easily rectified by process controllers. In other words, much of the operation of the activated sludge process is beyond the control of normal process controllers, and the “myth of control” is quickly exposed in practice.
7.5 Trickling filter integration within the wastewater treatment system
7.5.1 Single pass (parallel) reactor The arguments presented in this chapter allow for further consideration of trickling filters as the most appropriate systems for wastewater treatment. Low-load trickling filters perform nearly as well as activated sludge, and go further on less. Small and medium towns, rural settlements, and remote government institutions could all consider trickling filters as main biological wastewater treatment process.

61
7.5.2 In-series reactors Muller et al. (2004) described the advantage of trickling filters in series, where the sequence of leading and lagging can be switched. While a high substrate concentration is required for growth, this does not necessarily result in low effluent concentrations. A polishing filter with low substrate concentrations can yield very good effluent concentrations, but with little biomass, which eventually become non-viable. Swopping the lead and lagging filters periodically ensures that high load removal and biomass growth is always balanced with a viable biomass for “mopping up” the final effluent to very low concentrations.
7.5.3 Side stream reactor combinations The potential for side stream trickling filter application is all but exhausted. The following ideas are presented for further consideration: • External nitrification biological nutrient removal, as in Daspoort’s Western works,
and described by Muller et al. (2004). • Waste streams with a high nitrogen concentration, such as anaerobic digester
supernatant or filtrate, normally add to the nitrogen concentration in the raw wastewater and further increase the TKN:COD ratio. As shown in this work, if some COD is added to the system to create viable biomass and the necessary anaerobic micro-climates, then autotrophic nitrogen removal occurs within the trickling filter. This would remove some nitrogen for which insufficient COD may be present to remove via normal heterotrophic denitrification. Furthermore, assuming that only a portion of the nitrogen is removed via autotrophic pathways and the ammonium from this stream is fully oxidised, the nitrate rich stream can be introduced directly into the anoxic zone of an activated sludge system.
• Roughing filters are often used as upstream process to reduce COD into an overloaded activated sludge system. However, the most readily available COD is removed in the trickling filter, and the potential for biological nutrient removal activated sludge is much reduced. Rather than running trickling filters and the activated sludge works in series, a portion of the raw wastewater (say 20%) can be routed over the trickling filter for complete COD removal and nitrification. The effluent nitrate and humus is then returned to the anoxic zone of the activated sludge system.

62
8 CONCLUSIONS Denitrification in trickling filters is an important treatment process which can be regulated by the manipulation of the process parameters. The following are important process considerations: • Low loaded trickling filters have many different micro-environments that allow a
wide array of wastewater treatment bacteria to co-exist simultaneously. One such bacterial group was believed to include anaerobic ammonium oxidisers.
• Higher organisms such as snails, worms, and crustaceans, may play an important role in wastewater and in situ sludge treatment processes.
• Recirculation of effluent increases the oxygen transfer to wastewater and organisms and creates a more universal aerobic environment beyond a certain recycle ratio. This finding was contrary to earlier findings with clean water tests that showed that the air flow rate, and therefore oxygen transfer, is mostly a function of the difference in temperature between the outside air and the wastewater.
• Recirculation of effluent re-introduces nitrate at the top of the filter and improves nitrate reduction (denitrification) below a certain recycle ratio.
• There may be a seasonal cycle related to treatment process efficiency, but the present study was not able to confirm this conclusively. To the contrary, it seemed more likely that seasonal variation in effluent quality from trickling filters is a result of changes in the influent concentration, i.e. dilution of raw wastewater, during wet weather. The removal of nitrogen via the trickling filter was rather constant during summer or winter.
• Anaerobic ammonium oxidation is an important nitrogen removal process at the Daspoort trickling filters. Without the anaerobic ammonium oxidation process, nitrogen removal could be only half as effective as was observed during this study.
• Modelling of a full scale trickling filter cannot only be based on normal (or; well-known) wastewater treatment processes. There is a definite role for organisms like anammox bacteria, and their role should be included in a process model. At the same time, a process model based on literature and first principles could shed light on the potential role of anammox bacteria, and the quantification of this process relative to the more well-known processes.
• The system cannot be described comprehensively by only modelling the biofilm. The role and function of higher organisms that also seem to perform a sludge management function need to be quantified as well.
Because of their performance and proven potential, low loaded trickling filters could be considered as the most sustainable and most appropriate technology in the right context.
63
9 RECOMMENDATIONS FOR FUTURE RESEARCH The evidence from these experiments shows that trickling filters have an important role to play in the future of the South African wastewater sector. This role is multifaceted, and can impact on different areas of application. All existing trickling filters can (and should) be evaluated to optimise operation and improve system performance. Apart from existing trickling filters, new trickling filters should be evaluated as the most appropriate technology in small and certain medium sized treatment works. Topics for further research include: 1. Deterministic calculation of air flow rate and oxygen transfer under conditions of air
flow restriction Aim of Research: • To quantify the air flow rate through a trickling filter, based on the temperature
difference between wastewater and outside air, under different air flow conditions. Ideal air flow occurs when clean water is trickled through a trickling filter, devoid of biomass. However, increasing biomass, as a result of different filter heights, organic loading and different filter media characteristics, with decreasing void space (air passages), restricts the air flow rate.
• To establish the oxygen transfer rate from air to bulk liquid, based on the air flow rate, for the difference in oxygen concentration in air, which varies with the height trickling filters, as well as the oxygen concentration of water, which can also vary over the height of trickling filters.
• To establish whether an upward draft of air, where high oxygen concentrations in the air is first contacted with low COD and ammonium concentrations at the bottom of the filter (treated wastewater), differs in overall oxygen transfer from a downward draft of air, where high oxygen concentrations in the air is first contacted with high COD and ammonium concentrations at the top of the filter (untreated wastewater).
• To determine how the operational regime changes air flow: i.e. is there a difference between air flow when an average dry weather flow is dosed periodically (siphon tank or pump), and when the same flow is dosed at a constant steady rate?
Method brief: • Set up a series of laboratory trickling filters at different heights (equal to real trickling
filters, e.g. at 1.8 m, 2.3 m, 2.8 m) and large filter diameter to media size ratio to prevent side wall channelling.
• Control water and air temperatures in heat exchangers to simulate seasonal and diurnal variations typical of a real wastewater treatment works.
• Introduce settled sewage to trickling filters and established biomass.

64
• Measure air flow rate and oxygen concentrations at the air outlet under different operating conditions.
• Compare laboratory findings with real trickling filters, for example: the Simons Town municipal wastewater trickling filters are built on the False Bay coast, which may be expected to have a moderating effect on the outside air temperature, and which could therefore result in a lower air flow rate compared to inland trickling filters exposed to more extreme temperatures, such as those at Paarl and Wellington.
2. Role of higher organisms Aim of Research: Trickling filters are commonly described as attached growth or biofilm processes. Within the biofilm, bacteria are responsible for the removal of substrate from wastewater. However, this view is too simplistic, considering the complex ecological system established in trickling filters that includes higher organisms such as molluscs, worms, insects and crustaceans. The role of these higher organisms needs to be examined in order to understand the trickling filter process beyond empirical (“black box”) approaches. As yet un-quantified functions of higher organisms include: • Their grazing on the biofilm, thereby introducing an in-situ “waste sludge handling
mechanism” and by maintaining flow paths, a porous biomass structure, and preventing clogging.
• Their direct removal of suspended solids and colloidal material introduced by settled wastewater.
Method brief: • Obtain filter media with in situ biomass, including a variety of higher organisms. • Pack the filter media in a laboratory trickling filter (as described for air flow rate
experiments). • Compare treatment performance with an equal laboratory trickling filter, where only
a biofilm culture was established in the laboratory using settled sewage. 3. Mathematical modelling of trickling filter processes Aim of Research: To integrate existing knowledge from different disciplines into a deterministic mathematical model. Three main disciplines that interact in trickling filters are: • Physical process performance, which include firstly the effect of stress from the
hydraulic load of sloughing organisms, secondly air flow rate, based on temperature difference between wastewater and outside air as well as the restriction to air flow as a function of filter media void space and accumulated biomass, thirdly the

65
concomitant oxygen transfer rate to the bulk liquid, and fourthly diffusion of substrate (electron donors and electron acceptors) through the biofilm and associated biomass.
• Microbiological processes that are regulated by the competition between various organisms for available substrate, the establishment of aerobic, anoxic and anaerobic micro-climates that promote growth of heterotrophs and autotrophs, and the interaction between these organisms.
• Higher organisms like molluscs, worms, insects and crustaceans and their eco-system function in biofilm grazing (in-situ waste sludge management) and tunnelling (in-situ maintenance of air and water flow paths) and possibly symbiotic relations between bacteria, archaea, fungi, and higher organisms.
Method brief: Assess and compile international literature on trickling filter operation and performance over the past 75 years, and develop a three-dimensional mathematical model. A three-dimensional model is required to accurately account for the influence of filter media, the physical mass transport (air, substrate) and the complex ecological interactions (Morgenroth, 2008). Once a model is developed, it should be calibrated on existing full scale trickling filters, such as Daspoort, with very good overall performance, as well as trickling filters where, for no obvious reasons, overall performance is not as good.

66
10 LIST OF REFERENCES Amano, T., Yoshinaga, I., Okada, K., Yamagishi, T., Ueda, S., Obuchi, A., Sako, Y., Suwa, Y. (2007) Detection of Anammox Activity and Diversity of Anammox Bacteria-Related 16S rRNA Genes in Coastal Marine Sediment in Japan. Microbes and Environments 22: 232-242.
Biesterfeld, S., Farmer, G., Figueroa, L., Parker, D., Russell, P. (2003) Quantification of denitrification potential in carbonaceous trickling filters, Water Research 37: 4011-4017.
Chen, H., Liu, S., Yang, F., Xue, Y., Wang, T. (2009) The development of simultaneous partial nitrification, ANAMMOX and denitrification (SNAD) process in a single reactor for nitrogen removal. Bioresource Technology 100: 1548-1554.
Cooke, B. (1959) Trickling filter ecology. Ecology 40: 273-291.
Dalsgaard, T., Revsbech, N.P. (1992) Regulating factors of denitrification in trickling filter biofilms as measured with the oxygen/nitrous oxide microsensor. FEMS Microbiology Ecology 101: 151-164.
Daniel, L.M., Pozzi, E., Foresti, E., Chinalia, F.A. (2009) Removal of ammonium via simultaneous nitrification-denitrification nitrite-shortcut in a single packed-bed batch reactor. Bioresource Technology 100: 1100-1107.
De Beer, D., Stoodley, P., Roe, F., Lewandowski, Z. (1994). Effects of biofilm structure on oxygen distribution and mass transport. Biotechnology. Bioengineering 43:1131-1138.
De Kreuk M.K., McSwain B.S., Bathe S., Tay S.T.L., Schwarzenbeck, N., Wilderer P.A. (2005) Discussion outcomes. In: Aerobic Granular Sludge. Water and Environmental Management Series. IWA Publishing, Munich. Pp.165-169
Egli, K., Fanger, U., Alvarez, P.J.J., Siegrist, H., van der Meer, J.R., Zehnder, A.J.B. (2001) Enrichment and characterization of an anammox bacterium from a rotating biological contactor treating ammonium-rich leachate. Archives of Microbiology 175 (3): 198-207
Els, W. (2010) Personal communication
Hach (1997) Water analysis handbook. Hach, Loveland, CO.
Hao, X., van Loosdrecht, M.C.M., Meijer, S.C.F., Qian, Y. (2001) Model-based evaluation of two BNR processes – UCT and A2N. Water Research, 25: 2851-2860.
Heijnen, J.J. (1999) In: Encyclopaedia of Bioprocess Technology: Fermentation, Biocatalysis and Bioseperation. John Wiley and Sons, Inc.
Henze, M., Harremoes, P., La Cour Jansen, J., Arvin, E. (2002) Wastewater treatment: Biological and chemical processes. 3rd Edition, Springer-Verlag, Berlin, Germany.

67
Henze, M., van Loosdrecht, M.C.M., Ekama, G.A., Brdjanovic, D. (2008) Biological wastewater treatment – principles, modelling and design. IWA Publishing.
Heukelekian, H. (1948) Similarities and differences between a biofilter and a standard filter. Sewage Works Journal 20:1032-40.
Holman, J.B., Wareham, D.G. (2005) COD, ammonia and dissolved oxygen time profiles in the simultaneous nitrification/denitrification process. Biochemical Engineering Journal 22: 125-133.
Holtje, R. H. (1943) The biology of sprinkling filters. Sewage Works Journal 15: 14.
Isaacs, S. H., Henze, M. (1995) Controlled carbon source addition to an alternating nitrification-denitrification wastewater treatment process including biological P removal. Water Research 29: 77-89.
Kartal, B., van Niftrik, L., Rattray J., van de Vossenberg, J.L.C.M., Schmid, M.C., Damsté, J.S., Jetten, M.S.M., Trous, M. (2008) Candidatus ‘Brocadia fulgida’: an autofluorescent anaerobic ammonium oxidizing bacterium. FEMS Microbiology Ecology 63: 46-55.
Kuhl, M., Jorgenson, B.B. (1992) Microsensor measurements of sulphate reduction and sulphide oxidation in compact microbial communities of aerobic biofilms. Applied and Environmental Microbiology 58: 1164-1174.
Kuypers, M.M.M., Lavik, G., Woebken, D., Schmid, M., Fuchs, B.M., Amann, R., Jørgensen, B.B., Jetten, M.S.M. (2005) Massive nitrogen loss from the Benguela upwelling system through anaerobic ammonium oxidation. PNAS 102: 6478-6483.
Lydmark, P., Lind, M., Sörensson, F., Hermansson, M. (2006) Vertical distribution of nitrifying populations in bacterial biofilms from a full-scale nitrifying trickling filter. Environmental Microbiology 8: 2036-2049.
Mack, W.N., Mack, J.P., Ackerson, A.O. (1975) Microbial film development in a trickling filter. Microbial Ecology 2: 215-226.
Mehlhart, G.F. (1994) Upgrading of Existing Trickling Filter Plants for Denitrification. Water Science Technology 30: 173-179.
Morgenroth, E. (2008) Modelling Biofilms. In: Biological Wastewater Treatment: Principles, Modelling and Design, edited by Henze, M., Van Loosdrecht, M.C.M., Ekama, G.A. Brdjanovic, D. IWA Publishing, London, UK.
Mulder, A., van de Graaf, A.A., Robertson, L.A. and Kuenen J.G. (1995) Anaerobic ammonium oxidation discovered in a denitrifying fluidized bed reactor. FEMS Microbiology Ecology 16(3): 177-184.

68
Muller, A.W., Wentzel, M.C., Saayman, G.B., van der Merwe, S.A., Esterhuyse, C.M., Snyman, J.S., Ekama, G.A. (2004) Full scale implementation of external nitrification biological nutrient removal at the Daspoort Waste Water Treatment Works, Water SA 30:37-43.
Nielsen, L.P., Christensen, P.B., Revsbech, N.P., Sorensen, J. (1990) Denitrification and oxygen respiration in biofilms studied with a microsensor for nitrous oxide and oxygen. Microbial Ecology 19: 63-72.
Nijhof, M., Klapwijk, A. (1995) Diffusion transport mechanisms and biofilm nitrification characteristics influencing nitrite levels in nitrifying trickling filter effluents. Water Research 29: 2287-2292.
Persson, N.J., Gustafsson, Ö., Bucheli, T.D., Ishaq, R., Næs,‖K., Broman, D. (2002) Soot-Carbon Influenced Distribution of PCDD/Fs in the Marine Environment of the Grenlandsfjords, Norway. Environmental Science & Technology 36: 4968-4974.
Piret, E.L., Mann, C.A., Halvorson, H.O. (1939) Aerodynamics of trickling filters. Industrial and Engineering Chemistry 31: 706-712.
Rashevsky, N. 1948. A note on biological periodicities. The Bulletin of Mathematical Biophysics, 10: 201-204.
Reichert, P. (1998) AQUASIM 2.0 – User Manual, Computer Program for the Identification and Simulation of Aquatic Systems. Swiss Federal Institute for Environmental Science and Technology (EAWAG), ISBN: 3-906484-16-5. CH – 8600 Dübendorf, Switzerland.
Robertson, L.A., Kuenen, J.S. (1990) Combined heterotrophic nitrification and aerobic denitrification in Thiosphaera pantotropha and other bacteria. Antonie van Leeuwenhoek 57: 139-152.
Rudert, G. (2004) A new understanding of the old trickling filtration technology. In: Biennial Conference of the Water Institute of Southern Africa (WISA). Pp. 1447-1458.
Satoh, H., Nakamura, Y., Ono, H., Okabe, S. (2003) Effect of oxygen concentration on nitrification and denitrification in single activated sludge flocs. Biotechnology and Bioengineering, 83: 604-607.
Schmidt, I., Sliekers, O., Schmid, M., Cirpus, I., Strous, M., Bock, E., Kuenen, J.G., Jetten, M.S.M. (2002) Aerobic and anaerobic ammonia oxidizing bacteria – competitors or natural partners? FEMS Microbiology Ecology, 39:175-181.
Schramm, A., Larsen, L.H., Revsbech, N.P. (1996) Structure and function of a nitrifying biofilm as determined by in situ hybridization and the use of microelectrodes. Applied and Environmental Microbiology: 62: 4641-4647.
Schulze, K.L. (1957) Experimental vertical screen trickling filter. Sewage and Industrial Wastes: 29: 458-467.

69
Schulze, K.L. (1960) Load and efficiency of trickling filters. Journal WPCF 32: 245-261.
Strous, M. (2000) Microbiology of anaerobic ammonium oxidation. PhD thesis, TU Delft.
Szewczyk, K.W., Kuro´n-Kulig, A. (2007). Simultaneous nitrification and denitrification in a new airlift reactor. Journal of Biotechnology, 131S, S133-S187.
Van Loosdrecht, M.C.M, Jetten, M.S.M. (1997) Method for treating ammonia-comprising wastewater. Patent no. PCT/NL97/00482.
Van Rijn, J., Tal, Y., Schreier, J. (2006) Denitrification in recirculating systems: theory and applications. Aquacultural Engineering 34: 346-376.
Vayenas, D.V., Pavlou, S., Lyberatos, G. (1997) Development of a dynamic model describing nitrification and nitratification in trickling filters. Water Research 31:1135-1147.
Wilsenach, J.A. (2006) Treatment of source separated urine and its effects on wastewater systems. PhD thesis, TU Delft.
Wilsenach, J.A., van Loosdrecht, M.C.M. (2006) Integration of Processes to Treat Wastewater and Source-Separated Urine. Journal of Environmental Engineering, 132: 331-341.
WISA (2002) Water SA Special Edition: WISA Proceedings 2002, ISBN 1-86845-946-2. Available on website http://www.wrc.org.za.
Yoo, H., Ahn, K-H., Lee, H-J., Lee, K-H., Kwak, Y-J., Song, K-G. (1999) Nitrogen removal from synthetic wastewater by simultaneous nitrification and denitrification (SND) via nitrite in an intermittently-aerated reactor. Water Research 33: 145-154.
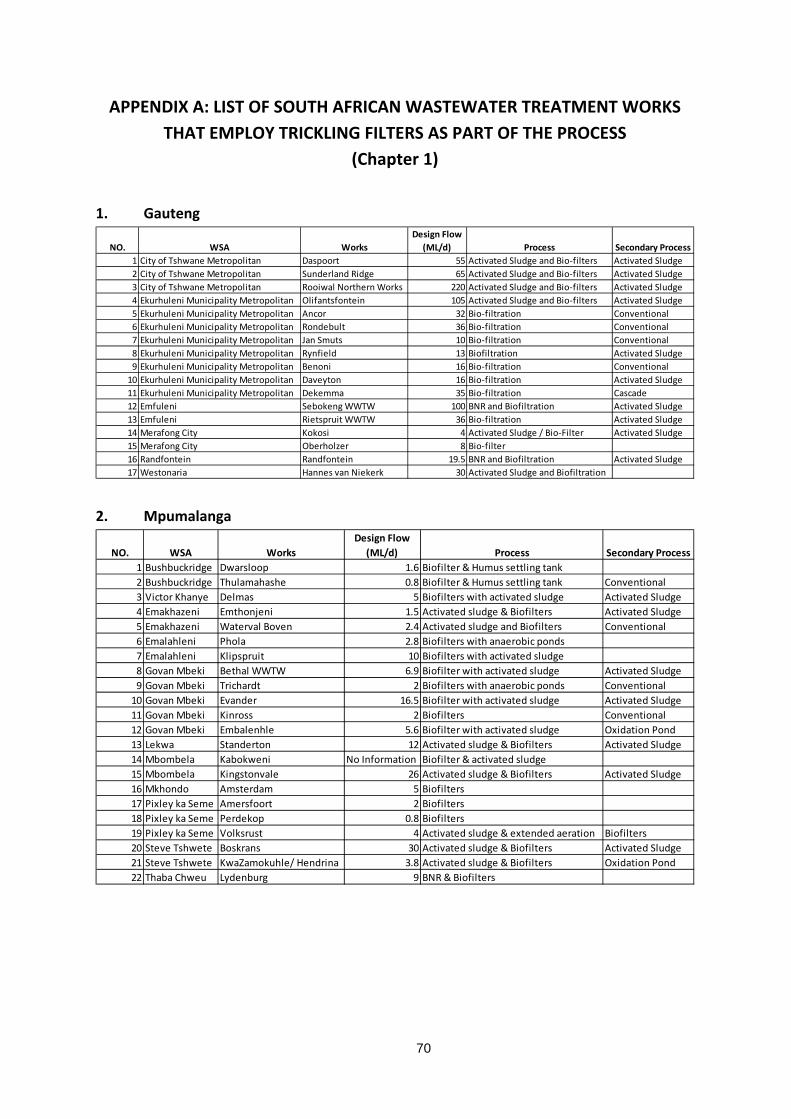
70
APPENDIX A: LIST OF SOUTH AFRICAN WASTEWATER TREATMENT WORKS THAT EMPLOY TRICKLING FILTERS AS PART OF THE PROCESS
(Chapter 1)
1. Gauteng
2. Mpumalanga
NO. WSA WorksDesign Flow
(ML/d) Process Secondary Process1 City of Tshwane Metropolitan Daspoort 55 Activated Sludge and Bio-filters Activated Sludge2 City of Tshwane Metropolitan Sunderland Ridge 65 Activated Sludge and Bio-filters Activated Sludge3 City of Tshwane Metropolitan Rooiwal Northern Works 220 Activated Sludge and Bio-filters Activated Sludge4 Ekurhuleni Municipality Metropolitan Olifantsfontein 105 Activated Sludge and Bio-filters Activated Sludge5 Ekurhuleni Municipality Metropolitan Ancor 32 Bio-filtration Conventional6 Ekurhuleni Municipality Metropolitan Rondebult 36 Bio-filtration Conventional7 Ekurhuleni Municipality Metropolitan Jan Smuts 10 Bio-filtration Conventional8 Ekurhuleni Municipality Metropolitan Rynfield 13 Biofiltration Activated Sludge9 Ekurhuleni Municipality Metropolitan Benoni 16 Bio-filtration Conventional
10 Ekurhuleni Municipality Metropolitan Daveyton 16 Bio-filtration Activated Sludge11 Ekurhuleni Municipality Metropolitan Dekemma 35 Bio-filtration Cascade12 Emfuleni Sebokeng WWTW 100 BNR and Biofiltration Activated Sludge13 Emfuleni Rietspruit WWTW 36 Bio-filtration Activated Sludge14 Merafong City Kokosi 4 Activated Sludge / Bio-Filter Activated Sludge15 Merafong City Oberholzer 8 Bio-filter16 Randfontein Randfontein 19.5 BNR and Biofiltration Activated Sludge17 Westonaria Hannes van Niekerk 30 Activated Sludge and Biofiltration
NO. WSA WorksDesign Flow
(ML/d) Process Secondary Process1 Bushbuckridge Dwarsloop 1.6 Biofilter & Humus settling tank2 Bushbuckridge Thulamahashe 0.8 Biofilter & Humus settling tank Conventional3 Victor Khanye Delmas 5 Biofilters with activated sludge Activated Sludge4 Emakhazeni Emthonjeni 1.5 Activated sludge & Biofilters Activated Sludge5 Emakhazeni Waterval Boven 2.4 Activated sludge and Biofilters Conventional6 Emalahleni Phola 2.8 Biofilters with anaerobic ponds7 Emalahleni Klipspruit 10 Biofilters with activated sludge8 Govan Mbeki Bethal WWTW 6.9 Biofilter with activated sludge Activated Sludge9 Govan Mbeki Trichardt 2 Biofilters with anaerobic ponds Conventional
10 Govan Mbeki Evander 16.5 Biofilter with activated sludge Activated Sludge11 Govan Mbeki Kinross 2 Biofilters Conventional12 Govan Mbeki Embalenhle 5.6 Biofilter with activated sludge Oxidation Pond13 Lekwa Standerton 12 Activated sludge & Biofilters Activated Sludge14 Mbombela Kabokweni No Information Biofilter & activated sludge15 Mbombela Kingstonvale 26 Activated sludge & Biofilters Activated Sludge16 Mkhondo Amsterdam 5 Biofilters17 Pixley ka Seme Amersfoort 2 Biofilters18 Pixley ka Seme Perdekop 0.8 Biofilters19 Pixley ka Seme Volksrust 4 Activated sludge & extended aeration Biofilters20 Steve Tshwete Boskrans 30 Activated sludge & Biofilters Activated Sludge21 Steve Tshwete KwaZamokuhle/ Hendrina 3.8 Activated sludge & Biofilters Oxidation Pond22 Thaba Chweu Lydenburg 9 BNR & Biofilters

71
3. North West
4. Limpopo
5. Free State
NO. WSA WorksDesign Flow
(ML/d) Process Secondary Process1 Dr Ruth S Mompati District Municipality Bloemhof 5.6 Bio-filtration2 Tlokwe City Council Potchefstroom 45 Activated sludge & Biofilters Activated Sludge3 Ventersdorp Ventersdorp 2 Activated Sludge / Oxidation Ponds Biofilter
NO. WSA WorksDesign Flow
(ML/d) Process Secondary Process1 Bela-Bela Warmbath WWTW 3.2 Bio Filter Conventional2 Greater Sekhukhune District Municipality Roosenekal WWTW 0.4 Bio Filter3 Mopani District municipality Giyani WWTW 2.1 Bio Filter Conventional4 Mopani District municipality Nkowankowa WWTW 4.5 Bio Filter Conventional5 Mopani District municipality Tzaneen WWTW 24 Bio Filter & Activated sludge Conventional6 Mopani District municipality Namakgale WWTW 6.3 Bio Filters Conventional7 Mopani District municipality Ga-Kgapane WWTW 5.7 Bio Filter Conventional8 Polokwane Mankweng WWTW 8 Bio Filter, Oxidation Ponds Conventional9 Polokwane Seshego WWTW 11.7 Bio Filter Conventional
10 Polokwane Polokwane WWTW 25 Bio Filter Activated Sludge11 Thabazimbi Northam oxidation ponds No Information Bio Filters Oxidation Pond12 Thabazimbi Thabazimbi WWTW 2.55 Bio Filters Activated Sludge13 Vhembe District municipality Louis Trichardt WWTW 5 Bio Filter, Oxidation Ponds14 Vhembe District municipality Thohoyandou WWTP 6 Bio Filter & Activated sludge
NO. WSA WorksDesign Flow
(ML/d) Process Secondary Process1 Dihlabeng Clarens 1.3 Bio-filter & Oxidation ponds Activated Sludge2 Dihlabeng Rosendal/Mautse 0.24 Bio-filter & Oxidation ponds Activated Sludge3 Kopanong Gariep Dam 2.8 Bio-filter & Oxidation ponds4 Letsemeng Oppermans No Information Bio-filter5 Mafube Namahadi 1.4 Bio-filter & Oxidation ponds6 Mafube Villiers 2.4 Bio-filter & Oxidation ponds7 Maluti a Phofung Kestell WWTW 0.8 Bio-filter Oxidation Pond8 Maluti a Phofung Phuthaditjhaba WWTW 9.5 Bio-filter9 Mangaung Metropolitan Botshabelo 10.5 Bio-filter & Oxidation ponds Activated Sludge
10 Mangaung Metropolitan Thaba Nchu 4.5 Bio-filter & Oxidation ponds11 Mangaung Metropolitan Bainsvlei 4 Bio-filter & Oxidation ponds Activated Sludge12 Masilonyana Winburg No Information Bio-filtration13 Matjhabeng Allanridge 6 Bio-filter & Oxidation ponds Activated Sludge14 Matjhabeng Virginia 26 Bio-filter & Oxidation ponds Activated Sludge15 Metsimaholo Deneysville 2.1 Bio-filter Conventional16 Metsimaholo Sasol InfraChem 37 Bio-filter Conventional17 Nketoana Petrus Steyn No Information Bio-filter & Oxidation ponds18 Setsoto Senekal 8 Bio-filter & Oxidation ponds
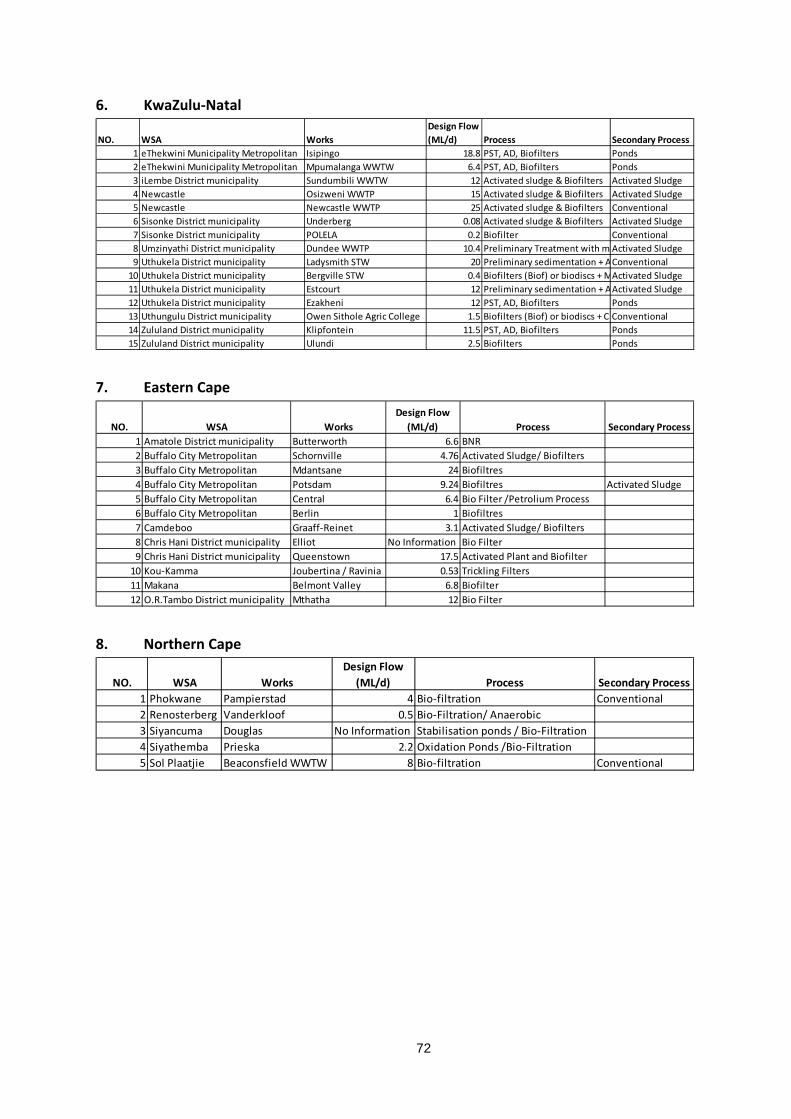
72
6. KwaZulu-Natal
7. Eastern Cape
8. Northern Cape
NO. WSA WorksDesign Flow (ML/d) Process Secondary Process
1 eThekwini Municipality Metropolitan Isipingo 18.8 PST, AD, Biofilters Ponds2 eThekwini Municipality Metropolitan Mpumalanga WWTW 6.4 PST, AD, Biofilters Ponds3 iLembe District municipality Sundumbili WWTW 12 Activated sludge & Biofilters Activated Sludge4 Newcastle Osizweni WWTP 15 Activated sludge & Biofilters Activated Sludge5 Newcastle Newcastle WWTP 25 Activated sludge & Biofilters Conventional6 Sisonke District municipality Underberg 0.08 Activated sludge & Biofilters Activated Sludge7 Sisonke District municipality POLELA 0.2 Biofilter Conventional8 Umzinyathi District municipality Dundee WWTP 10.4 Preliminary Treatment with m Activated Sludge9 Uthukela District municipality Ladysmith STW 20 Preliminary sedimentation + AConventional
10 Uthukela District municipality Bergville STW 0.4 Biofilters (Biof) or biodiscs + MActivated Sludge11 Uthukela District municipality Estcourt 12 Preliminary sedimentation + AActivated Sludge12 Uthukela District municipality Ezakheni 12 PST, AD, Biofilters Ponds13 Uthungulu District municipality Owen Sithole Agric College 1.5 Biofilters (Biof) or biodiscs + C Conventional14 Zululand District municipality Klipfontein 11.5 PST, AD, Biofilters Ponds15 Zululand District municipality Ulundi 2.5 Biofilters Ponds
NO. WSA WorksDesign Flow
(ML/d) Process Secondary Process1 Amatole District municipality Butterworth 6.6 BNR2 Buffalo City Metropolitan Schornville 4.76 Activated Sludge/ Biofilters3 Buffalo City Metropolitan Mdantsane 24 Biofiltres4 Buffalo City Metropolitan Potsdam 9.24 Biofiltres Activated Sludge5 Buffalo City Metropolitan Central 6.4 Bio Filter /Petrolium Process6 Buffalo City Metropolitan Berlin 1 Biofiltres7 Camdeboo Graaff-Reinet 3.1 Activated Sludge/ Biofilters8 Chris Hani District municipality Elliot No Information Bio Filter9 Chris Hani District municipality Queenstown 17.5 Activated Plant and Biofilter
10 Kou-Kamma Joubertina / Ravinia 0.53 Trickling Filters11 Makana Belmont Valley 6.8 Biofilter12 O.R.Tambo District municipality Mthatha 12 Bio Filter
NO. WSA WorksDesign Flow
(ML/d) Process Secondary Process1 Phokwane Pampierstad 4 Bio-filtration Conventional2 Renosterberg Vanderkloof 0.5 Bio-Filtration/ Anaerobic3 Siyancuma Douglas No Information Stabilisation ponds / Bio-Filtration4 Siyathemba Prieska 2.2 Oxidation Ponds /Bio-Filtration5 Sol Plaatjie Beaconsfield WWTW 8 Bio-filtration Conventional

73
9. Western Cape
NO. WSA WorksDesign Flow
(ML/d) Process Secondary Process1 Beaufort West Beaufort West 4.6 Preliminary sedementation / Bio filters / Activated sludge / SActivated Sludge2 Bergrivier Velddrif 0.971 Biofilters, Maturation ponds Oxidation Pond3 Breede Valley Worcester 28 Activated sludge & Bio-filter ( Mechanical Inlet works + Grit r_4 Cederberg Citrusdal 0.96 Biofilters, Maturation ponds, Disinfection5 City of Cape Town Metropolitan Kraaifontein 17.5 Activated Sludge & Bio-filter, maturation ponds, chlorinationActivated Sludge6 City of Cape Town Metropolitan Llandudno 0.28 2 stage Bio-filter & gas chlorination Conventional7 City of Cape Town Metropolitan Simon's Town 4 2 stage Bio-filter & gas chlorination Conventional8 Drakenstein Paarl 25 Biofilters, Activated sludge, Maturation ponds, Disinfection Activated Sludge9 Drakenstein Wellington 7 Biofilters, Activated sludge, Maturation ponds, Disfection Activated Sludge
10 George Outeniqua 15 2 stage Bio-filter & gas chlorination Conventional11 George Gwaing 11 Biofilters, Maturation ponds, Disinfection Activated Sludge12 Hessequa Riversdale 2 Biofilters, Activated sludge, Maturation ponds, Disinfection13 Kannaland Ladismith 1.2 Biofilters, Maturation ponds, Disinfection Conventional14 Knysna Belvidere (Uitzigt) 0.6 Biofilters, Maturation ponds, Disinfection Package Plant15 Knysna Rheenendal 0.7 Biofilters, Maturation ponds, Disinfection Activated Sludge16 Knysna Karatara 0.0621 Biofilters, Disinfection Conventional17 Langeberg Ashton 4 Activated sludge & Bio-filter Activated Sludge18 Langeberg Robertson 4.2 Bio-filter & Oxidation ponds Activated Sludge19 Stellenbosch Stellenbosch 20 Biofilters, Activated sludge, Maturation ponds,Centrifuge, SluActivated Sludge20 Swartland Malmesbury 5.5 Activated sludge' Biofilters, Anaerobic digesters Activated Sludge21 Swartland Moorreesburg 1.5 Biofilters , Activated sludge , Anearobic digesters Activated Sludge22 Swellendam Koornland 0.5 Activated sludge & Bio-filter Activated Sludge23 Swellendam Klipperivier 0.5 Activated sludge & Bio-filter Activated Sludge24 Witzenberg Wolseley 1.8 Bio-filter & Oxidation ponds

74
APPENDIX B: DASPOORT WWTW HISTORIC DATA REVISION (Chapter 3)
*Table B.1: Table for the COD required for denitrification. Sample
Date TKN
ss NO3+
Eff NH4+ Eff
∑(NO3- +
NH4+)eff
Nitrogen Removed
COD ss
COD eff
COD Removed
COD Required for
Denitrification
CODrequired/CODremoved
2004/06/29 29 19.2 3.0 22.2 6.5 179 32 147 37 0.252004/07/02 38 14 1.5 15.5 22.3 201 60 141 128 0.912004/07/21 29 12.6 3.0 15.6 13.3 138 28 110 76 0.692004/09/03 44 18.5 4.7 23.2 20.9 356 47 309 119 0.392004/09/14 36 12.9 2.5 15.4 20.7 191 52 139 118 0.852004/10/07 38 11.3 2.2 13.5 24.8 229 45 184 142 0.772004/10/22 38 12.3 2.8 15.1 22.7 276 46 230 130 0.572004/11/02 38 12.5 5.0 17.5 20.2 211 46 165 116 0.702004/11/19 30 13.3 1.9 15.2 15.1 255 36 219 86 0.392004/12/02 34 11.3 2.2 13.5 20.5 235 30 205 117 0.572005/01/06 26 9.31 1.0 10.3 16.2 141 40 101 92 0.922005/01/18 28 8.5 3.6 12.1 15.4 215 53 162 88 0.552005/03/01 29 17.3 4.3 21.6 6.9 113 30 83 40 0.472005/03/14 39 12.4 2.3 14.7 24.5 242 37 205 140 0.682005/04/05 27 15.8 1.7 17.5 9.3 181 16 165 53 0.322005/04/22 40 16.8 2.4 19.2 20.9 265 32 233 120 0.512005/05/04 39 16 3.7 19.7 19.2 236 43 193 110 0.572005/05/20 40 17.7 4.5 22.2 17.6 346 37 309 101 0.332005/06/22 38 14.9 3.0 17.9 20.2 296 68 228 116 0.512005/07/05 35 12.9 2.6 15.5 19.6 315 44 271 112 0.412005/07/22 42 11.1 4.3 15.4 26.6 304 49 255 152 0.602005/08/04 42 12.8 8.6 21.4 20.6 293 59 234 118 0.502005/08/17 39 19.9 2.9 22.8 16.2 267 41 226 93 0.412005/09/28 45 19 3.2 22.2 22.5 292 53 239 128 0.542005/10/11 33 16.7 2.2 18.9 14.6 250 38 212 83 0.392005/10/27 42 19.81 2.4 22.2 19.4 248 47 201 111 0.552005/11/08 37 17.13 2.6 19.7 17.6 253 44 209 100 0.482006/01/31 14 19.78 1.0 20.8 -6.7 117 56 61 -38 -0.632006/02/20 30 17.14 1.3 18.4 11.2 285 65 220 64 0.292006/03/13 33 14.51 1.5 16.0 17.4 220 155 65 100 1.542006/05/23 37 19.55 3.8 23.3 13.9 232 16 216 80 0.372006/06/08 42 19.46 4.2 23.7 18.8 276 45 231 107 0.462006/06/22 41 21.01 5.3 26.3 14.7 306 64 242 84 0.352006/07/04 43 19.43 4.0 23.4 19.8 250 29 221 113 0.512006/08/22 43 16.02 3.8 19.8 23.2 256 39 217 133 0.612006/09/04 35 17.43 3.7 21.2 14.0 224 63 161 80 0.502006/09/21 38 17.02 3.2 20.2 18.1 356 52 304 104 0.34

75
Sample Date
TKN ss
NO3+ Eff
NH4+ Eff
∑(NO3- +
NH4+)eff
Nitrogen Removed
COD ss
COD eff
COD Removed
COD Required for
Denitrification
CODrequired/
CODremoved 2006/10/10 32 25.49 3.0 28.5 3.2 211 43 168 18 0.112006/10/31 40 18 2.0 20.0 20.3 241 53 188 116 0.622006/11/12 35 18.7 1.6 20.3 15.2 284 58 226 87 0.382006/12/07 31 15.35 2.9 18.2 12.6 291 50 241 72 0.302007/01/08 27 15.3 2.1 17.4 9.4 241 17 224 54 0.242007/01/24 32 12.2 2.8 15.0 16.6 230 23 207 95 0.462007/02/07 39 14.8 2.5 17.3 21.6 206 18 188 124 0.662007/02/22 35 13 3.7 16.7 18.8 244 23 221 107 0.492007/03/13 27 11.82 4.0 15.8 11.6 223 60 163 66 0.412007/03/28 40 11.8 6.7 18.5 21.2 246 52 194 121 0.632007/04/09 31 9.71 3.0 12.7 18.2 189 38 151 104 0.692007/04/22 34 19.07 2.2 21.2 12.8 221 55 166 73 0.442007/05/10 39 18.3 4.0 22.3 16.7 295 18 277 96 0.342007/05/22 43 19.13 3.7 22.8 19.8 232 35 197 113 0.572007/06/03 36 17.94 4.1 22.0 14.1 211 32 179 81 0.452007/06/28 41 21.1 5.1 26.2 14.4 232 42 190 82 0.432007/07/08 36 19.64 5.3 25.0 10.7 179 44 135 61 0.452007/07/25 45 22.2 4.8 27.0 17.7 196 52 144 101 0.712007/08/30 37 21 4.0 25.0 12.4 152 86 66 71 1.072007/09/04 41 20 3.1 23.1 18.1 232 46 186 104 0.562007/09/16 34 20.18 2.1 22.3 11.3 222 68 154 64 0.422007/10/03 43 19.87 3.6 23.5 20.0 278 60 218 114 0.522007/10/15 31 15.8 1.8 17.6 13.2 236 50 186 75 0.412007/11/08 38 18.54 2.1 20.7 17.6 282 34 248 100 0.412007/11/20 28 17.66 2.2 19.9 8.6 232 124 108 49 0.452007/12/09 18 15.15 0.7 15.8 2.2 193 68 125 13 0.102008/01/28 23 11.8 2.1 13.9 9.1 186 17 169 52 0.312008/04/10 32 13.12 2.8 15.9 16.4 254 77 177 94 0.532008/04/20 36 14.9 2.8 17.7 18.6 234 47 187 106 0.572008/05/05 36 14.2 3.1 17.3 19.1 267 29 238 109 0.462008/06/08 35 16.2 7.0 23.2 11.4 223 34 189 65 0.342008/06/19 40 17.3 4.0 21.3 18.2 278 88 190 104 0.552008/07/16 39 20 5.3 25.3 14.0 250 56 194 80 0.412008/07/29 45 21.3 6.1 27.4 17.9 257 52 205 102 0.502008/08/14 39 20.1 4.6 24.7 14.5 257 34 223 83 0.372008/08/24 39 18.8 2.6 21.4 17.8 245 23 222 102 0.462008/09/15 40 20.45 2.8 23.3 17.1 209 30 179 98 0.552008/10/08 37 18.4 3.9 22.3 14.8 206 82 124 84 0.682008/10/23 47 16 4.0 20.0 27.1 177 27 150 155 1.032008/11/03 34 16.3 3.4 19.7 14.1 192 98 94 80 0.852008/11/18 21 11.2 3.9 15.1 6.3 175 15 160 36 0.22

76
Sample Date
TKN ss
NO3+ Eff
NH4+ Eff
∑(NO3- +
NH4+)eff
Nitrogen Removed
COD ss
COD eff
COD Removed
COD Required for
Denitrification
CODrequired/
CODremoved 2008/12/01 33 14.4 4.2 18.6 14.0 283 207 76 80 1.052009/01/18 19 10.6 1.4 12.0 7.1 178 39.4 139 40 0.292009/01/29 26 10.6 2.3 12.9 12.9 111 71.6 40 74 1.862009/02/09 27 12.6 3.0 15.6 11.2 117 10 107 64 0.602009/02/25 29 15.1 2.8 17.9 10.7 192 35 157 61 0.392009/03/10 28 12.7 3.0 15.7 12.6 134 54 80 72 0.902009/03/30 29 14.3 2.7 17.0 11.8 222 19 203 68 0.332009/04/29 29 15.1 3.3 18.4 10.9 110 39 71 63 0.882009/05/10 33 17 3.1 20.1 12.6 155 16 139 72 0.522009/05/26 42 17.3 5.0 22.3 19.7 227 56 171 113 0.662009/06/04 39 18.7 4.1 22.8 15.8 309 38 271 90 0.332009/06/17 36 16.4 4.6 21.0 14.7 378 42 336 84 0.252009/07/01 33 18.4 5.2 23.6 9.1 329 61 268 52 0.192009/07/14 33 22.2 4.0 26.2 6.6 300 30 270 38 0.142009/08/04 39 12.8 8.5 21.3 18.1 283 61 222 103 0.472009/08/16 33 17.9 3.4 21.3 11.5 280 13 267 66 0.252009/09/13 35 19.74 4.3 24.0 11.0 279 23 256 63 0.242009/09/28 18 27.6 2.0 29.6 -11.1 147 30 117 -64 -0.542009/10/13 33 13.7 4.1 17.8 15.7 236 25 211 90 0.422009/10/27 32 16.3 3.3 19.6 12.3 242 28 214 71 0.332009/11/12 37 13.7 3.1 16.8 20.6 239 46 193 118 0.612009/11/25 32 17.6 3.4 21.0 11.4 238 27 211 65 0.312009/12/07 30 14 1.4 15.4 14.4 241 53 188 82 0.442010/01/19 32 16.3 4.6 20.9 11.5 272 64 208 66 0.322010/02/04 36 14.6 3.2 17.8 18.2 248 224 24 104 4.272010/02/15 32 14.8 3.5 18.3 13.4 236 24 212 77 0.362010/03/02 6 2.48 3.7 6.2 -0.6 355 28 327 -3 -0.012010/03/17 25 6.42 3.4 9.9 14.7 205 39 166 84 0.502010/04/07 16 9.96 2.2 12.2 3.9 232 35 197 23 0.112010/06/01 39 17.9 2.9 20.8 18.4 281 29 252 105 0.422010/06/14 34 16.1 5.7 21.8 12.0 284 35 249 68 0.272010/07/07 35 17.4 5.1 22.5 12.9 215 22 193 74 0.382010/07/22 42 19.1 5.9 25.0 17.3 290 44 246 99 0.402010/08/02 42 18.6 5.6 24.2 17.5 377 29 348 100 0.292010/08/15 35 18.3 5.4 23.7 11.6 313 33.51 280 66 0.242010/09/08 37 11.1 10.6 21.7 15.6 300 77 223 89 0.402010/09/19 35 18 2.0 20.0 15.0 234 28 206 86 0.422010/10/18 30 11.3 11.4 22.7 7.1 227 200 27 40 1.502010/11/02 35 14.6 3.4 18.0 17.0 284 38 246 97 0.402010/11/22 26 12.8 2.4 15.2 10.7 235 81 154 61 0.402010/12/08 19 13.3 1.8 15.1 4.3 273 447 -174 25 -0.14
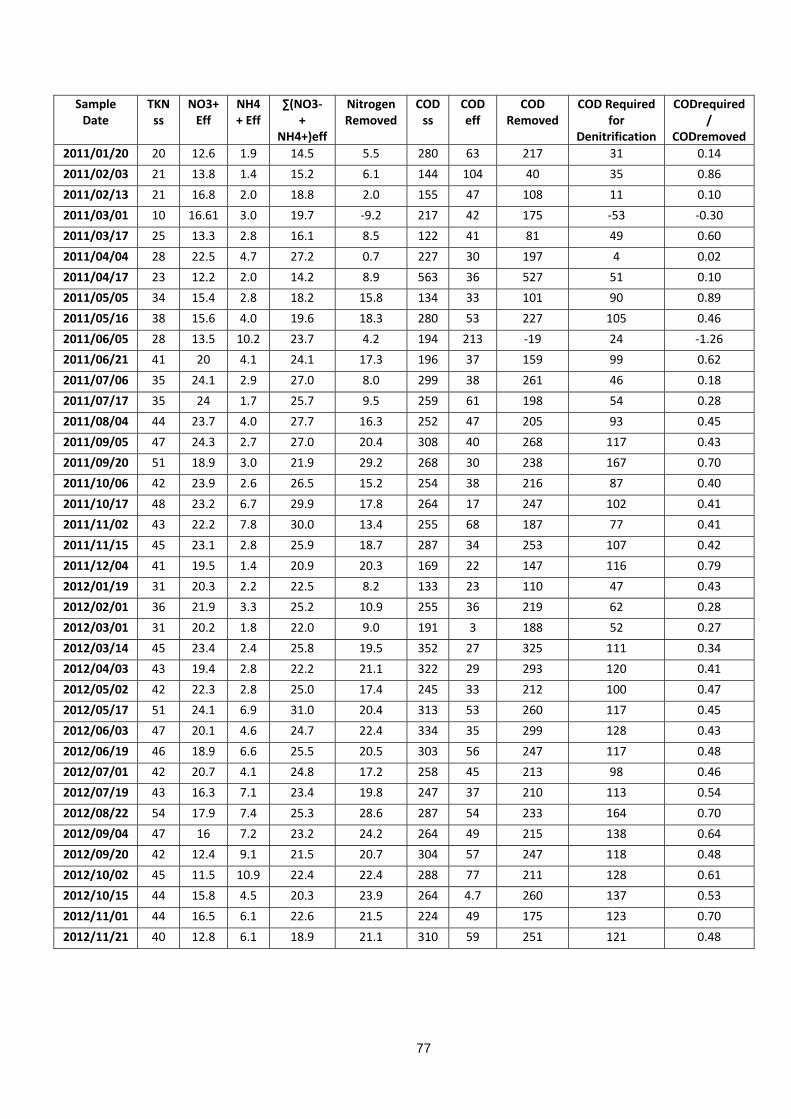
77
Sample Date
TKN ss
NO3+ Eff
NH4+ Eff
∑(NO3- +
NH4+)eff
Nitrogen Removed
COD ss
COD eff
COD Removed
COD Required for
Denitrification
CODrequired/
CODremoved 2011/01/20 20 12.6 1.9 14.5 5.5 280 63 217 31 0.142011/02/03 21 13.8 1.4 15.2 6.1 144 104 40 35 0.862011/02/13 21 16.8 2.0 18.8 2.0 155 47 108 11 0.102011/03/01 10 16.61 3.0 19.7 -9.2 217 42 175 -53 -0.302011/03/17 25 13.3 2.8 16.1 8.5 122 41 81 49 0.602011/04/04 28 22.5 4.7 27.2 0.7 227 30 197 4 0.022011/04/17 23 12.2 2.0 14.2 8.9 563 36 527 51 0.102011/05/05 34 15.4 2.8 18.2 15.8 134 33 101 90 0.892011/05/16 38 15.6 4.0 19.6 18.3 280 53 227 105 0.462011/06/05 28 13.5 10.2 23.7 4.2 194 213 -19 24 -1.262011/06/21 41 20 4.1 24.1 17.3 196 37 159 99 0.622011/07/06 35 24.1 2.9 27.0 8.0 299 38 261 46 0.182011/07/17 35 24 1.7 25.7 9.5 259 61 198 54 0.282011/08/04 44 23.7 4.0 27.7 16.3 252 47 205 93 0.452011/09/05 47 24.3 2.7 27.0 20.4 308 40 268 117 0.432011/09/20 51 18.9 3.0 21.9 29.2 268 30 238 167 0.702011/10/06 42 23.9 2.6 26.5 15.2 254 38 216 87 0.402011/10/17 48 23.2 6.7 29.9 17.8 264 17 247 102 0.412011/11/02 43 22.2 7.8 30.0 13.4 255 68 187 77 0.412011/11/15 45 23.1 2.8 25.9 18.7 287 34 253 107 0.422011/12/04 41 19.5 1.4 20.9 20.3 169 22 147 116 0.792012/01/19 31 20.3 2.2 22.5 8.2 133 23 110 47 0.432012/02/01 36 21.9 3.3 25.2 10.9 255 36 219 62 0.282012/03/01 31 20.2 1.8 22.0 9.0 191 3 188 52 0.272012/03/14 45 23.4 2.4 25.8 19.5 352 27 325 111 0.342012/04/03 43 19.4 2.8 22.2 21.1 322 29 293 120 0.412012/05/02 42 22.3 2.8 25.0 17.4 245 33 212 100 0.472012/05/17 51 24.1 6.9 31.0 20.4 313 53 260 117 0.452012/06/03 47 20.1 4.6 24.7 22.4 334 35 299 128 0.432012/06/19 46 18.9 6.6 25.5 20.5 303 56 247 117 0.482012/07/01 42 20.7 4.1 24.8 17.2 258 45 213 98 0.462012/07/19 43 16.3 7.1 23.4 19.8 247 37 210 113 0.542012/08/22 54 17.9 7.4 25.3 28.6 287 54 233 164 0.702012/09/04 47 16 7.2 23.2 24.2 264 49 215 138 0.642012/09/20 42 12.4 9.1 21.5 20.7 304 57 247 118 0.482012/10/02 45 11.5 10.9 22.4 22.4 288 77 211 128 0.612012/10/15 44 15.8 4.5 20.3 23.9 264 4.7 260 137 0.532012/11/01 44 16.5 6.1 22.6 21.5 224 49 175 123 0.702012/11/21 40 12.8 6.1 18.9 21.1 310 59 251 121 0.48

78
*Table B.1: Footnote. The table shows the deduced concentrations of the TKN and COD in the settled sewage and the other data received from Daspoort WWTW including the TKN concentration in the settled sewage, the nitrate and ammonium concentrations in the effluent, and the sum of the nitrate and ammonium concentrations. The “nitrogen removed” column contains the value of the sum of the effluent deducted from the TKN settled sewage concentration. The next columns contain the COD concentrations in the settled sewage and in the effluent. The COD removed column contains the difference between the COD in the settled sewage and the COD in the effluent. The COD required for denitrification column contains the value of the COD used in the denitrification process. The last column contains the fraction of the COD required for denitrification over the total COD actually removed, as measured and calculated.
Figure B.1: The concentration of ammonium in the raw wastewater and in the settled sewage. From the Figure B.1 it can be seen that the measured data are in close relation with each other. Next, the TKN settled sewage values were deduced from the relationship between the data above. The measured concentrations of the TKN and the ammonium in the settled sewage are shown in Figure B.2 below.

79
Figure B.2: The measured concentrations of the TKN and ammonium in the settled sewage. The measured TKN concentrations and the TKN values deduced from ammonium (from mid-2004 to April 2006) are plotted on Figure B.3:
Figure B.3: Concentration of the measured TKN values and the deduced values for the TKN. In Figure B.4 it can be seen that there is relationship between the measured COD concentration in the settled sewage and the COD concentration in the raw wastewater.

80
Figure B.4: Concentrations of COD in the settled sewage and raw wastewater. The measured COD concentrations in the settled sewage and the deduced values are shown in Figure B.5.
Figure B.5: The measured and deduced values of the COD concentration in the settled sewage. From Figure B.5 it can be seen that the deduced values are close to the measured values and the values will be used in the calculations.
81
APPENDIX C: DASPOORT WWTW FULL SCALE EXPERIMENTAL WORK (Chapter 4)
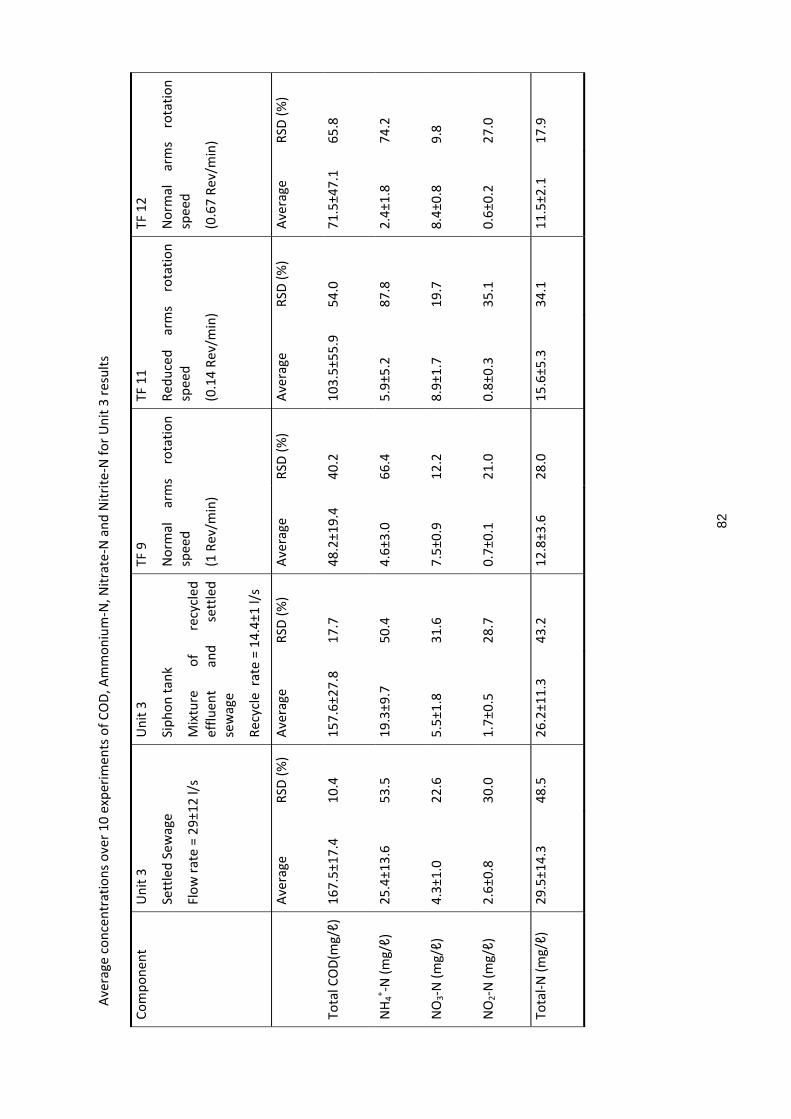
82
Aver
age
conc
entr
atio
ns o
ver 1
0 ex
perim
ents
of C
OD,
Am
mon
ium
-N, N
itrat
e-N
and
Nitr
ite-N
for U
nit 3
resu
lts
Com
pone
nt
Uni
t 3
Sett
led
Sew
age
Flow
rate
= 2
9±12
l/s
Uni
t 3
Siph
on ta
nk
Mix
ture
of
re
cycl
ed
efflu
ent
and
sett
led
sew
age
Recy
cle
rate
= 1
4.4±
1 l/s
TF 9
Nor
mal
ar
ms
rota
tion
spee
d
(1 R
ev/m
in)
TF 1
1
Redu
ced
arm
s ro
tatio
n sp
eed
(0.1
4 Re
v/m
in)
TF 1
2
Nor
mal
ar
ms
rota
tion
spee
d
(0.6
7 Re
v/m
in)
Av
erag
e RS
D (%
) Av
erag
e RS
D (%
) Av
erag
e RS
D (%
) Av
erag
e RS
D (%
) Av
erag
e RS
D (%
)
Tota
l CO
D(m
g/ℓ)
167.
5±17
.4
10.4
15
7.6±
27.8
17
.7
48.2
±19.
4 40
.2
103.
5±55
.9
54.0
71
.5±4
7.1
65.8
NH 4
+ -N (m
g/ℓ)
25.4
±13.
6 53
.5
19.3
±9.7
50
.4
4.6±
3.0
66.4
5.
9±5.
2 87
.8
2.4±
1.8
74.2
NO
3-N (m
g/ℓ)
4.3±
1.0
22.6
5.
5±1.
8 31
.6
7.5±
0.9
12.2
8.
9±1.
7 19
.7
8.4±
0.8
9.8
NO
2-N (m
g/ℓ)
2.6±
0.8
30.0
1.
7±0.
5 28
.7
0.7±
0.1
21.0
0.
8±0.
3 35
.1
0.6±
0.2
27.0
Tota
l-N (m
g/ℓ)
29.5
±14.
3 48
.5
26.2
±11.
3 43
.2
12.8
±3.6
28
.0
15.6
±5.3
34
.1
11.5
±2.1
17
.9

83
Ave
rage
con
cent
ratio
ns o
ver 1
0 ex
perim
ents
of C
OD,
Am
mon
ium
-N, N
itrat
e-N
and
Nitr
ite-N
for U
nit 4
resu
lts
Com
pone
nt
Uni
t 4
(Ref
eren
ce)
Sett
led
Sew
age
Flow
rat
e =
18.6
±10
l/s
Uni
t 4
(Ref
eren
ce)
Siph
on ta
nk
No
recy
cled
effl
uent
TF 1
4
Redu
ced
arm
s ro
tatio
n sp
eed
(0.3
3 Re
v/m
in)
TF 1
5
Nor
mal
ar
ms
rota
tion
spee
d
(1 R
ev/m
in)
TF 1
6
Nor
mal
ar
ms
rota
tion
spee
d
(0.8
8 Re
v/m
in)
Av
erag
e RS
D (%
) Av
erag
e RS
D (%
) Av
erag
e RS
D (%
) Av
erag
e RS
D (%
) Av
erag
e RS
D (%
)
Tota
l CO
D (m
g/ℓ)
168.
1±20
.7
12.3
16
7.2±
19.7
11
.8
74.6
±34.
2 45
.9
67.2
±36.
9 54
.9
66.0
±28.
4 43
.0
NH 4
+ -N (m
g/ℓ)
24.4
±12.
7 52
.0
24.2
±11.
6 48
.0
1.7±
1.1
67.9
2.
5±0.
9 36
.2
3.8±
2.7
71.6
NO
3-N (m
g/ℓ)
4.7±
0.9
18.2
4.
5±0.
9 19
.3
9.0±
0.9
9.7
8.7±
1.0
11.7
8.
9±0.
9 9.
8
NO
2-N (m
g/ℓ)
2.6±
0.7
28.7
2.
6±0.
8 29
.8
0.4±
0.2
41.3
0.
5±0.
3 52
.7
0.5±
0.2
35.1
Tota
l-N (m
g/ℓ)
28.9
±13.
7 47
.6
29.0
±11.
8 40
.8
11.1
±1.4
12
.6
11.6
±1.5
13
.2
13.2
±2.9
21
.6
Key:
RSD
(%) =
Rel
ativ
e st
anda
rd d
evia
tion