denis c. shields, * paul m. sharp, * desmond g. higgins
TRANSCRIPT

“Silent” Sites in Drosophila Genes Are Not Neutral: Evidence of Selection among Synonymous Codons’
Denis C. Shields, * Paul M. Sharp, * Desmond G. Higgins, * and Frank Wright? *Department of Genetics, Trinity College, Dublin; and ?Department of Genetics, University of Edinburgh
The patterns of synonymous codon usage in 91 Drosophila melanogaster genes have been examined. Codon usage varies strikingly among genes. This variation is associated with differences in G+C content at silent sites, but (unlike the situation in mammalian genes) these differences are not correlated with variation in intron base composition and so are not easily explicable in terms of mutational biases. Instead, those genes with high G+C content at silent sites, resulting from a strong “preference” for a particular subset of the codons that are mostly C-ending, appear to be the more highly expressed genes. This suggests that G+C content is reduced in sequences where selective constraints are weaker, as indeed seen in a pseudogene. These and other data discussed are consistent with the effects of translational se- lection among synonymous codons, as seen in unicellular organisms. The existence of selective constraints on silent substitutions, which may vary in strength among genes, has implications for the use of silent molecular clocks.
Introduction
Any fitness differences among synonymous codons, perhaps associated with translational accuracy and/or efficiency, are expected to be very small and thus only effective in determining codon frequencies in organisms with large effective population sizes (Bulmer 1987; Li 1987). This indeed appears to be the case in the few organisms in which codon usage has been examined in any detail. On the one hand, in Escherichia coli and Saccharomyces cerevisiae (organisms expected to have very large effective population sizes) selection for efficient translation seems to determine codon fre- quencies, particularly in genes expressed at high levels (Gouy and Gautier 1982; Ike- mura 1985; Sharp and Li 1986). On the other hand, in mammals, which have much smaller effective population sizes, there is as yet no evidence of selection among syn- onymous codons. Rather, base composition varies considerably around the mammalian genome (Bernardi et al. 1985)) and codon usage in any gene is correlated with the local chromosomal G+C content (Aota and Ikemura 1986)) perhaps reflecting dif- ferences in patterns of mutational bias around the genome (Filipski 1987).
Codon usage in Drosophila melanogaster has not been investigated in any detail, and it is not clear how (or even if) different genes should vary. The long-term effective population sizes of fruit flies are probably intermediate between those of mammals and those of lower organisms such as E. co/i and yeast, and so it is not known whether selection between synonymous codons could be effective. Also, invertebrates do not
1. Key words: Synonymous codon usage, base composition, Drosophila melanoguster, molecular clock. Address for correspondence and reprints: Dr. Paul M. Sharp, Department of Genetics, Trinity College,
Dublin 2, Ireland.
Mol. Biol, Evol. 5(6):704-716. 1988. 0 1988 by The University of Chicago. All rights reserved. 0737-4038/88/0506-0007$02.00
704

Selection on Codon Usage in Drosophila Genes 705
exhibit the within-genome G+C variation seen in mammals and birds (Bernardi et al. 1985).
Here we examine codon usage in a large number of D. melanogaster genes. We find considerable variation among genes. This variation cannot be easily explained by base-composition differences, but it appears to be consistent with the expected effects of selection among synonymous codons.
Material and Methods
The DNA sequences of 91 Drosophila melanogaster genes were obtained from the GenBank (release 54) and EMBL (release 12) libraries or directly from the literature (see table 1). Codon usage data were calculated and converted to relative synonymous codon usage (RSCU) values. The RSCU value for any codon for a particular amino acid is the observed usage of that codon divided by that expected if all codons for that amino acid were used equally (Sharp et al. 1986). This treatment facilitates comparison among genes (or groups of genes) of different length and amino acid composition. G+C content was calculated for three categories of sites within genes: silent sites (i.e., synonymously variable positions within codons) , replacement sites (where nucleotide substitution must result in an amino acid replacement ), and introns. Intron sequences are available for only 37 of the 91 genes. For each gene, bias in silent codon usage was measured by a “scaled” x2 (a x2 calculated for the deviation from equal usage of codons within synonymous groups, divided by the total number of codons in the gene less Trp and Met codons, which are excluded). This provides a simple measure of general synonymous codon usage bias, a measure that is essentially independent of gene length for genes of more than 100 codons (F. Wright, unpublished data).
The codon usage data for the different genes were subjected to correspondence analysis. This is the multivariate data-reduction method most often used to analyze codon usage data (see Grantham et al. 198 1; Shields and Sharp 1987), since such data are in the form of counts or frequencies (Greenacre 1984). Cluster analysis (also called “automatic classification”) has also been used in the past (e.g., see Grantham et al. 198 1; Sharp et al. 1986), but it is not appropriate when the within-species variation is continuous rather than discrete. In the present paper we have used correspondence analysis mainly as an ordination method to rank the genes studied. Correspondence analysis identifies trends through the multivariate data, which are then represented as orthogonal axes. The first axis represents the single most important trend (i.e., that accounting for the largest fraction of the variation) through the data; genes at the two ends of this axis differ the most in codon usage. The correspondence analysis was carried out on RSCU values, in an attempt to avoid effects due to differential amino acid usage. However, the conversion to RSCU values is only partially successful in this respect. Among the D. melanogaster data are some (generally short) genes with very biased amino acid usage-in these genes several amino acids are so lowly rep resented that RSCU values for their codons are susceptible to large stochastic variation. These genes may contribute artifactual variation to the correspondence analysis and obscure more interesting trends through the data. To identify those genes encoding proteins with a very biased amino acid composition, for each gene the proportion of sequence involved in encoding the most abundant amino acids was calculated. Seven genes (see table 1 b) in which >50% of the codons were for just three amino acids were excluded from the correspondence analysis.

Table 1 The 91 Drosophila melanogaster Gene Sequences Used in the Present Study
G+C CONTENT
(S) No. OF INTRON
Locus? GENE PRODUCT COJBONS x2 b (G+C)s (G+C), (G+Ck LENGTH
A
Cytochrome C(D4) ........... FI: initiation factor ........... aTub84B: cu-tubulin 1 ......... Hsp82: heat shock 82 ......... Lcpl: larval cuticle ........... Rpal: ribosomal protein ....... Gapdh-1: dehydrogenase ....... Adh: dehydrogenase .......... Gapdh-2: dehydrogenase ....... Ypl: yolk protein ............ actin79B: Actin .............. actin88F: Actin .............. Tm: tropomyosin 127 ......... ~28: Chorion protein .......... ~19: Chorion protein .......... Myosin light chain ........... aTub84D: cx-tubulin 3 ........ Yp3: yolk protein ............ Ubiquitin (sl) ............... ~15: Chorion protein .......... Lcpl: larval cuticle ........... eh8: Serendipity .............. Lcp2: larval cuticle ........... Sod: dismutase .............. Hsp23: heat shock 23 ......... eve: Even skipped ............ aTub85E: wtubulin2 ......... Rbp49: ribosomal protein ...... ninaE: opsin ................ Hsp26: heat shock 26 ......... sryd: Serendipity ............. ftz: Fushi-tarazu ............. L44D: (HDL) ............... Hsp7087A7: heat shock 70 ..... Yp2: yolk protein ............ Hsp27: heat shock 27 ......... Lcp3: larval cuticle ........... sryb: Serendipity ............. Dmras64B: protooncogene ..... en: Engrailed ................ Hsp7087cl: heat shock 70 ..... c-m: Protooncogene .......... Calmodulin ................. Ace: acetyl cholinesterase ...... Nicotinic a.c.h.r. ............. prd: Paired .................. hb: Hunchback .............. per: Period .................. a Tub6 7C: wtubulin 4 ........ RpII215: RNA polymerase ..... H44D: (HDL) ............... Hsp22: heat shock 22 .........
109 0.92 83 47 464 0.82 76 48 451 0.83 80 49 718 0.84 82 40 113 0.63 76 50 114 0.56 82 53 333 0.84 84 47 257 0.88 82 44 333 0.64 75 47 440 0.80 80 48 377 0.86 83 48 377 0.91 82 47 285 1.05 86 42 173 0.54 71 60 174 0.72 77 56 156 0.51 76 43 451 0.77 81 49 421 0.83 81 48
76 0.44 69 41 116 0.43 67 58 131 0.58 72 58 94 0.46 85 43
127 0.37 69 58 154 0.44 75 51 185 0.53 74 48 377 0.57 79 59 450 0.54 75 48 134 0.70 78 46 374 0.66 80 45 209 0.51 76 50 431 0.72 88 43 414 0.54 78 48 506 0.40 73 47 644 0.50 76 48
96 0.32 74 45 214 0.43 74 52 113 0.61 79 49 352 0.61 88 43 188 0.41 78 40 553 0.48 76 55 642 0.42 74 48 553 0.43 76 46 149 0.44 69 44 650 0.39 75 50 521 0.41 73 42 220 0.27 70 50 759 0.33 72 50
1219 0.46 80 54 463 0.48 72 46 470 0.32 69 48 522 0.34 71 44 175 0.38 78 51
706
39 35 40
491 1131
57
38 135 37 430 25 76 33 360 48 60
47 64
44 62
32 470 48 59 33 377
30 151 45 62
37 67
45 56
42 283 51 233 30 488 34 598 31 352

Table 1 (Continued)
G+C CONTENT (a)
No. OF INTRON Locus? GENE PRODUCI- CODONS x2 b (G+C)s (G+C)A (G+C)t LENGTH
A
Eip28: ecdysone-induced ...... gooseberry: bsh9 ............. 2: Zeste .................... Dmras85D: protooncogene ..... opsin R7 ................... srya: Serendipity ............. sgs7: Glue protein ............ 0440: (HDL) ............... Ddc: Dopa decarboxylase ...... DER,EGFR homologue ....... sgs8: Glue protein ............ Nonhistone chromosomal protein srcl: Protooncogene .......... ras3: Protooncogene .......... ry: Xanthine dehydrogenase .... r: Rudimentary .............. Protein kinase C ............. Opsin R8 ................... Gart: transformylase .......... Pupal cuticle protein .......... Cha: acetyltransferase ......... c-myb: Protooncogene ......... Insulin receptor homologue .... gooseberry: bsh4 ............. w: White ................... DJX Deformed .............. Sgs-5: glue protein ........... Est-6: esterase ............... dnc: Dunce ................. Kr: Kruppel ................. Cytochrome C (D3) .......... y: Yellow ...................
256 0.36 66 48 220 0.30 65 52 556 0.24 70 52 190 0.38 73 44 384 0.49 75 45 531 0.36 71 44 75 0.18 62 49
509 0.19 65 46 512 0.29 70 49 843 0.28 70 45 76 0.25 68 54
162 0.24 67 50 133 0.29 67 41 183 0.36 73 44
1139 0.24 64 49 2237 0.21 67 51
640 0.22 63 42 382 0.24 67 44
1354 0.24 65 52 185 0.45 72 49 729 0.24 69 52 429 0.16 62 45 300 0.20 59 47 217 0.21 66 51 707 0.31 71 47 591 0.17 66 51 164 0.14 54 43 549 0.15 52 46 363 0.23 60 48 467 0.05 56 52 106 0.21 65 45 542 0.16 47 49
36 1166
38 183
36 66
37 1709 34 137 41 69
29 346
28 516 33 377 35 413 51 71
32 396
33 2718
B
sgs3: Glue protein . . ...... sgsl: Glue protein . . ...... Tm: tropomyosin 33 ...... Tm: tropomyosin 34 . . . . . .
Mtn: metallothionein . . . . . .
Cg25C: collagen . . . . . . . . .
Hisl: histone Hl . . . . . . . . .
307 0.48 68 53 44 73 148 0.47 43 60 240 0.20 48 76 261 0.21 56 76
41 0.49 77 56 33 265 469 0.36 47 72 257 0.17 48 47
NOTE.-section A lists 84 genes in order of their appearance on axis 1 of a correspondence analysis of codon usage (see Material and Methods); section B lists seven genes encoding proteins with highly biased amino acid content, which were excluded from the correspondence analysis. Gene sequences were taken from the GenBank and EMBL libraries, except for Rpal (Qian et al. 1987), Yp.3 (Yan et al. 1987), ubiquitin (Arribas et al. 1986), Sod (Seto et al. 1987), eve (Frasch et al. 1987), calmodulin (Kamanaka et al. 1987), Ace (Hall and Spierer 1986), hb (Tautz et al. 1987), per (Citri et al. 1987), z (Pirotta et al. 1987), r (Freund and Jarry 1987), Kr (Rosenberg et al. 1986), and y (Geyer et al. 1986).
’ Where possible, loci are named according to the usage of Treat-Clemons and Deane ( 1984). b For deviation from random synonymous codon usage, scaled by gene length (see Material and Methods). ‘Percentage G+C content is given for silent sites (G+C)s, amino acid replacement sites (G+C),,, and in-
trons (G+C)I.
707

708 Shields et al.
D. melanogaster
G+C sitent sites
20
G+C silent sites
201
lo-
G+C introns G+C introns
PIG. 1 .-Percentage G+C content at silent sites and in introns of 84 Drosophila melanogaster and 115 human genes (intron sequences are only available for 35 of the 84 and 39 of the 115 genes, respectively). Human data were obtained as follows: from the 135 genes for which Maruyama et al. ( 1986) present codon usage data, 24 genes were excluded on the grounds of being closely related to others among the 115; intron sequences were obtained from GenBank.
Results
Base composition at silent sites, (G+C)s, and hence the pattern of synonymous codon usage, varies considerably among Drosophila melanogaster genes (fig. 1). The variance of (G+C)s among the 84 genes is 0.0064, which is, for example, more than three times the value (0.0020) expected for a binomial variable with mean 0.72 and sample size 100. The average number of silent sites in these genes is 439-only four genes have fewer than 100 silent sites, and these do not comprise the extremes of the distribution in figure 1. Thus there appears to be some source of systematic variation among genes in (G+C)s. However, the diversity is not as great as that seen among

Selection on Codon Usage in Drosophila Genes 709
D.melanogaster human
I1001
80
0 20 40 60 80 100
introns
100
80
3 60 .?5 u) E Q, 40 = u)
20
0
.
r = - 0.11 (p=O.16)
d 2b 4b 6b 8b Id0
replacement sites
80
60
. . .
! = ; ‘: . . . % ‘L
. l .
. .
r = 0.63 (p=O.OO) o-. ','I' 1.1.
0 20 40 60 80 100
introns
I””
80-
60-
r = 0.53 (p=O.OO)
O' 0 40 60
replacement sites
I )O
FlG. 2.-Relationship between G+C content at silent sites, (G+C)s, and G+C content in introns, (G+C),, and at replacement sites, (G+C),, for Drosophila melanogaster and human genes (see fig. 1 for details of genes). Correlation coefficients are indicated, with probabilities.
human genes (fig. 1). It is interesting that while the base composition of silent sites, ( G+C)s, and of introns, (G+C) I, from the same genes are highly correlated in human genes (fig. 2)) there is no such correlation in D. melanogaster (fig. 2). Also, another correlation seen in human genes-between base composition at amino acid replace- ment sites, (G+C) A, and (G+C)s- is absent in D. melanogaster (fig. 2 ) . These data suggest that while there is heterogeneity in codon usage among D. melanogaster genes, this variation is not simply associated with local genomic base composition.
The first axis of a correspondence analysis identifies the single largest source of variation among a set of multivariate data points- in this case, the single largest trend in codon usage among genes. In table 1 each gene has been ranked according to its value on this first axis. Also shown in table 1 for each gene are the G+C content (at

7 10 Shields et al.
Table 2 Codon Usage in Drosophila melanogaster Genes
15 High 15 Mid 15 Low 15 High 15 Mid 15 Low
Phe . . . . TTT TTC
Leu . . . . TTA TTG
Leu . . . . CTT CTC CTA CTG
Ile , . . . . ATT ATC ATA
Met . . . . ATG
Val . . . . GTT GTC GTA GTG
13 0.2 51 0.4 105 0.8 Ser 145 1.8 205 1.6 146 1.2
3 0.1 7 0.1 41 0.4 39 0.7 88 1.0 121 1.1
14 0.2 28 0.3 67 0.6 Pro 43 0.8 88 1.0 99 0.9
7 0.1 28 0.3 66 0.6 236 4.1 276 3.2 270 2.4
61 0.7 84 0.8 135 1.2 Thr 213 2.3 212 1.9 140 1.2
0 0.0 36 0.3 73 0.6 114 1.0 208 1.0 166 1.0
56 0.6 43 0.4 85 0.8 Ala 131 1.5 132 1.3 106 1.0
9 0.1 29 0.3 41 0.4 163 1.8 205 2.0 206 1.9
TCT 30 0.6 27 0.3 53 0.6 TCC 127 2.7 191 1.9 120 1.3 TCA 5 0.1 23 0.2 58 0.6 TCG 57 1.2 135 1.3 120 1.3
CCT 21 0.4 41 0.4 46 0.4 ccc 138 2.7 178 1.7 120 1.1 CCA 31 0.6 73 0.7 98 0.9 CCG 14 0.3 132 1.2 163 1.5
ACT 34 0.5 43 0.4 62 0.7 ACC 216 3.2 181 1.8 137 1.5 ACA 5 0.1 70 0.7 65 0.7 ACG 12 0.2 116 1.1 113 1.2
GCT 95 0.9 75 0.6 119 0.9 GCC 299 2.8 278 2.1 240 1.8 GCA 18 0.2 65 0.5 101 0.7 GCG 19 0.2 113 0.9 85 0.6
Tyr . , , . TAT 32 0.4 48 0.5 104 0.9 Cys . . . . TGT 3 0.1 25 0.4 43 0.6 TAC
Ter . . . . TAA TAG
140 1.6 159 1.5 126 1.1 14 2.8 8 2.0 5 1.3 Ter
1 0.2 3 0.8 4 1.0 Trp
13 0.3 60 0.6 96 0.9 Arg 72 1.7 131 1.4 121 1.1 12 0.1 59 0.3 104 0.7
156 1.9 283 1.7 212 1.3
17 0.2 121 0.8 159 1.0 Ser 185 1.8 185 1.2 148 1.0
13 0.1 66 0.3 116 0.7 Arg 346 1.9 327 1.7 230 1.3
TGC TGA TGG
54 1.9 107 1.6 93 1.4 0 0.0 1 0.3 3 0.8
39 1.0 63 1.0 94 1.0
His . . . . CAT CAC
Gln . . . . CAA CAG
Asn . . . . AAT AAC
Lys . . . . AAA AAG
Asp . . . . GAT GAC
Glu . . . . GAA GAG
126 0.9 169 0.9 199 1.1 Gly 160 1.1 202 1.1 151 0.9 31 0.2 71 0.3 126 0.7
313 1.8 391 1.7 245 1.3
CGT 75 2.4 56 0.9 59 1.0 CGC 97 3.1 163 2.7 105 1.7 CGA 4 0.1 36 0.6 63 1.0 CGG 0 0.0 51 0.8 73 1.2
AGT 1 0.0 64 0.6 89 1.0 AGC 63 1.3 167 1.7 119 1.3 AGA 1 0.0 20 0.3 31 0.5 AGG 9 0.3 41 0.7 41 0.7
130 1.4 91 0.7 135 1.0 160 1.7 263 2.0 205 1.5 83 0.9 137 1.0 169 1.2
0 0.0 37 0.3 50 0.4
NOTE-Numbers of codons and relative synonymous codon usage values are presented for the three groups of 15 genes with the highest (high), lowest (low), and intermediate (mid) values on correspondence analysis axis 1 (table 1A).
silent sites, at replacement sites, and in introns) and the scaled x2, representing an index of the degree of general codon usage bias. The value for each gene on the first axis of the correspondence analysis is highly correlated with both the scaled x2 (cor- relation coefficient, r = 0.87) and ( G+C)s (r = 0.75).
The trend in codon usage pattern along the first axis of the correspondence analysis is illustrated in table 2, where codon usage data have been pooled for three groups of genes- one from each end of this axis and one from the middle. Again it can be seen that the trend along the first axis is from highly biased codon usage in the genes at one end to nearly even usage of synonymous codons (as evidenced by a majority of RSCU values near 1 .O) at the other end. The codons favored in the highly biased group are largely, but not exclusively, G- or C-ending. The obvious exceptions are CGT, GAT, and GGT, which are used quite frequently to encode Arg, Asp, and Gly, respectively. These data, taken with the data from table 1, clearly indicate sub-
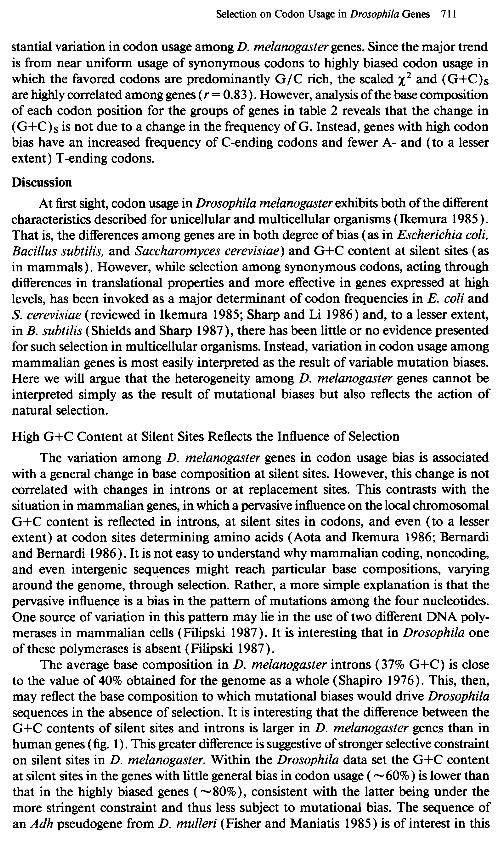
Selection on Codon Usage in Drosophila Genes 7 11
stantial variation in codon usage among D. melanogaster genes. Since the major trend is from near uniform usage of synonymous codons to highly biased codon usage in which the favored codons are predominantly G/C rich, the scaled x2 and (G+C)s are highly correlated among genes ( r = 0.83 ). However, analysis of the base composition of each codon position for the groups of genes in table 2 reveals that the change in (G+C)s is not due to a change in the frequency of G. Instead, genes with high codon bias have an increased frequency of C-ending codons and fewer A- and (to a lesser extent) T-ending codons.
Discussion
At first sight, codon usage in Drosophila melanogaster exhibits both of the different characteristics described for unicellular and multicellular organisms ( Ikemura 1985 ) . That is, the differences among genes are in both degree of bias (as in Escherichia coli, Bacillus subtilis, and Saccharomyces cerevisiae) and G+C content at silent sites (as in mammals). However, while selection among synonymous codons, acting through differences in translational properties and more effective in genes expressed at high levels, has been invoked as a major determinant of codon frequencies in E. coli and S. cerevisiae (reviewed in Ikemura 1985; Sharp and Li 1986) and, to a lesser extent, in B. subtilis (Shields and Sharp 1987), there has been little or no evidence presented for such selection in multicellular organisms. Instead, variation in codon usage among mammalian genes is most easily interpreted as the result of variable mutation biases. Here we will argue that the heterogeneity among D. melanogaster genes cannot be interpreted simply as the result of mutational biases but also reflects the action of natural selection.
High G+C Content at Silent Sites Reflects the Influence of Selection
The variation among D. melanogaster genes in codon usage bias is associated with a general change in base composition at silent sites. However, this change is not correlated with changes in introns or at replacement sites. This contrasts with the situation in mammalian genes, in which a pervasive influence on the local chromosomal G+C content is reflected in introns, at silent sites in codons, and even (to a lesser extent) at codon sites determining amino acids ( Aota and Ikemura 1986; Bemardi and Bemardi 1986). It is not easy to understand why mammalian coding, noncoding, and even intergenic sequences might reach particular base compositions, varying around the genome, through selection. Rather, a more simple explanation is that the pervasive influence is a bias in the pattern of mutations among the four nucleotides. One source of variation in this pattern may lie in the use of two different DNA poly- merases in mammalian cells (Filipski 1987). It is interesting that in Drosophila one of these polymerases is absent (Filipski 1987 ) .
The average base composition in D. melanogaster introns (37% G+C) is close to the value of 40% obtained for the genome as a whole (Shapiro 1976). This, then, may reflect the base composition to which mutational biases would drive Drosophila sequences in the absence of selection. It is interesting that the difference between the G+C contents of silent sites and introns is larger in D. melanogaster genes than in human genes (fig. 1). This greater difference is suggestive of stronger selective constraint on silent sites in D. melanogaster. Within the Drosophila data set the G+C content at silent sites in the genes with little general bias in codon usage ( -60%) is lower than that in the highly biased genes ( -80%)) consistent with the latter being under the more stringent constraint and thus less subject to mutational bias. The sequence of an Adh pseudogene from D. muZZeri (Fisher and Maniatis 1985) is of interest in this

7 12 Shields et al.
context: G+C content at silent sites in the two functional Adh genes of D. mulleri is 73% and 75%, respectively, while at homologous sites in the pseudogene it is reduced to 67%. Again, this suggests that, when selection among synonymous codons is relaxed, mutation tends to reduce the G+C content.
Codon Bias in Drosophila melanogaster Is Related to Expression Level
In E. coli, B. subtilis, and S. cerevisiae there is a well-established relationship between the degree of bias among synonymous codons and the level of gene expression (e.g., see Gouy and Gautier 1982; Shields and Sharp 1987; Bennetzen and Hall 1982, respectively). For several reasons it is less easy to establish whether such a relationship exists in D. melanogaster. For example, multicellular organisms have far more complex life cycles and gene expression varies dramatically depending on the developmental stage as well as the tissue. Also, less data on expression levels are available for D. melanogaster than for E. co/i, for example.
Nevertheless, when one considers the available information, there does seem to be a relationship between the level of gene expression and the strength of codon usage bias (reflected approximately by the order of genes in table 1) in D. melanogaster genes. For example, among the genes with high codon bias are those encoding alcohol dehydrogenase, initiation factor, actin, ribosomal proteins, and glyceraldehyde-3- phosphate dehydrogenase. Loci in yeast or E. coli homologous to these Drosophila genes all have high codon bias and are very highly expressed (Sharp et al. 1986), and certainly alcohol dehydrogenase is known as one of the most abundant proteins in Drosophila. Perhaps better evidence comes from specific comparisons of genes known to be expressed at different levels. Limbach and Wu ( 1985) state that, of the two cytochrome c genes, “in general, DC4 is expressed at much higher levels than DC3”; DC4 has very high codon bias, while DC3 has very weak bias (table 1). Among the four alpha-tubulin genes, two (genes 1 and 3) appear to be constitutively expressed while genes 2 and 4 appear to be expressed only in testes and ovaries, respectively (Therkauf et al. 1986). The gene 1 transcript “is much more abundant” than the gene
,2 transcript (Kalfayan and Wensink 1982), and gene 1 has much higher codon bias than gene 2 (table 1). The gene 4 transcript is detected only in ovarian nurse cells and in O-3-h embryos (Theurkauf et al. 1986) and has the lowest codon bias among these four genes. Additionally, since our analysis, Hovemann et al. ( 1988) have reported that, of two D. melanogaster elongation-factor genes, expression of one is “generally markedly stronger” than that of the other and that the codon usage of the former is more restricted (i.e., more biased) than that of the latter.
Are the preferred codons in the highly biased genes those which would be expected? The relative abundances of all iso-accepting tRNAs in D. melanogaster have been estimated (White et al. 1973), but only a few of the anticodon sequences are known (Sprinzl et al. 1987). From those data, it is possible to begin to correlate the observed synonymous codon frequencies with potential selective differences. For example, the Lys codon AAG, which is most strongly preferred over AAA in the highly biased group of genes (table 2), is translated by the most abundant Lys tRNA. The DNA sequence of the major Arg tRNA gene predicts the anticodon ACG, and the relative usage of CGT to encode Arg increases in the highly biased genes. As in E. coli and yeast, the major Phe tRNA has the anticodon GAA, and in all three species that codon which can be translated without wobble, i.e., UUC, is preferred.
As pointed out by Ikemura ( 1985 ) , differential modulation of tRNA populations among tissues could result in a diversity of codon usage patterns within the genome
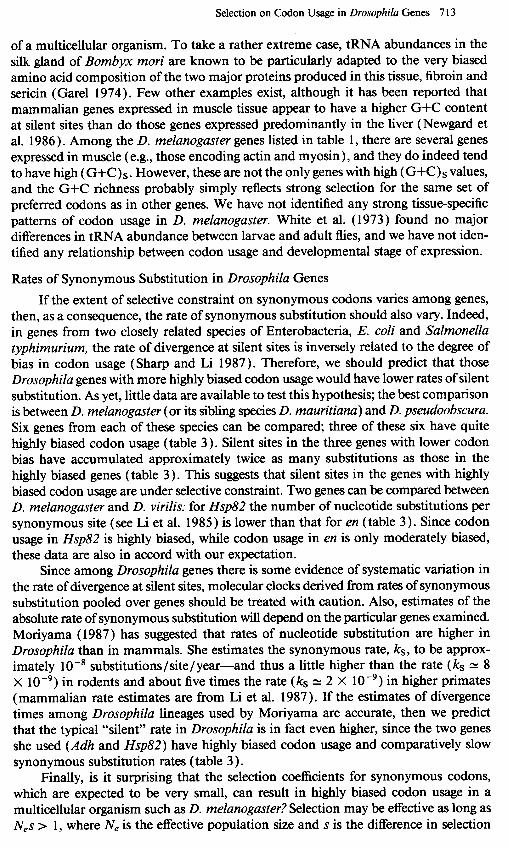
Selection on Codon Usage in Drosophila Genes 7 13
of a multicellular organism. To take a rather extreme case, tRNA abundances in the silk gland of Bombyx mori are known to be particularly adapted to the very biased amino acid composition of the two major proteins produced in this tissue, fibroin and sericin (Garel 1974). Few other examples exist, although it has been reported that mammalian genes expressed in muscle tissue appear to have a higher G+C content at silent sites than do those genes expressed predominantly in the liver (Newgard et al. 1986). Among the D. melanogaster genes listed in table 1, there are several genes expressed in muscle (e.g., those encoding actin and myosin), and they do indeed tend to have high (G+C) s . However, these are not the only genes with high (G+C) s values, and the G+C richness probably simply reflects strong selection for the same set of preferred codons as in other genes. We have not identified any strong tissue-specific patterns of codon usage in D. melanogaster. White et al. (1973) found no major differences in tRNA abundance between larvae and adult flies, and we have not iden- tified any relationship between codon usage and developmental stage of expression.
Rates of Synonymous Substitution in Drosophila Genes
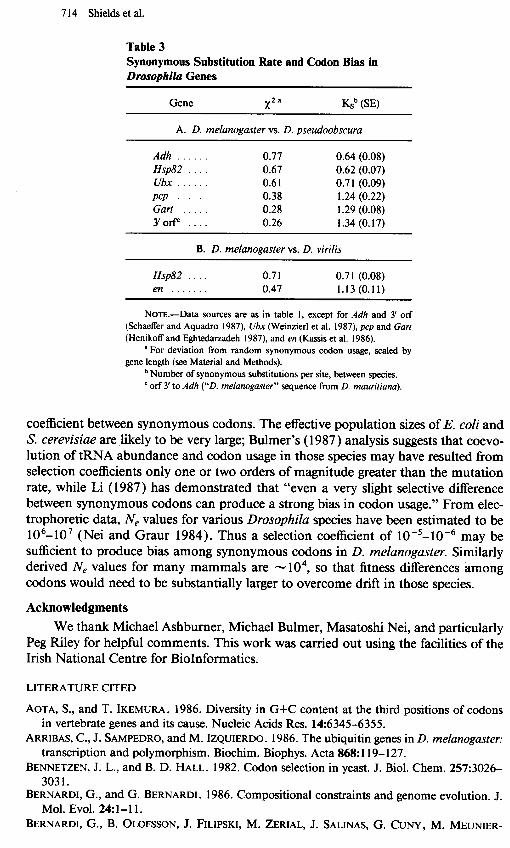
If the extent of selective constraint on synonymous codons varies among genes, then, as a consequence, the rate of synonymous substitution should also vary. Indeed, in genes from two closely related species of Enterobacteria, E. coli and Salmonella typhimurium, the rate of divergence at silent sites is inversely related to the degree of bias in codon usage (Sharp and Li 1987). Therefore, we should predict that those Drosophila genes with more highly biased codon usage would have lower rates of silent substitution. As yet, little data are available to test this hypothesis; the best comparison is between D. melanogaster (or its sibling species D. mauritiana) and D. pseudoobscura. Six genes from each of these species can be compared; three of these six have quite highly biased codon usage (table 3). Silent sites in the three genes with lower codon bias have accumulated approximately twice as many substitutions as those in the highly biased genes (table 3). This suggests that silent sites in the genes with highly biased codon usage are under selective constraint. Two genes can be compared between D. melanogaster and D. virilis: for Hsp82 the number of nucleotide substitutions per synonymous site (see Li et al. 1985) is lower than that for en (table 3). Since codon usage in Hsp82 is highly biased, while codon usage in en is only moderately biased, these data are also in accord with our expectation.
Since among Drosophila genes there is some evidence of systematic variation in the rate of divergence at silent sites, molecular clocks derived from rates of synonymous substitution pooled over genes should be treated with caution. Also, estimates of the absolute rate of synonymous substitution will depend on the particular genes examined. Moriyama ( 1987) has suggested that rates of nucleotide substitution are higher in Drosophila than in mammals. She estimates the synonymous rate, ks, to be approx- imately 10 -8 substitutions/ site /year-and thus a little higher than the rate ( ks 1: 8 X 10 -‘) in rodents and about five times the rate ( ks N 2 X 10F9) in higher primates (mammalian rate estimates are from Li et al. 1987). If the estimates of divergence times among Drosophila lineages used by Moriyama are accurate, then we predict that the typical “silent” rate in Drosophila is in fact even higher, since the two genes she used (Adh and Hsp82) have highly biased codon usage and comparatively slow synonymous substitution rates ( table 3 ) .
Finally, is it surprising that the selection coefficients for synonymous codons, which are expected to be very small, can result in highly biased codon usage in a multicellular organism such as D. melanogaster? Selection may be effective as long as N,s > 1, where N, is the effective population size and s is the difference in selection
7 14 Shields et al.
Table 3 Synonymous Substitution Rate and Codon Bias in Drosophila Genes
Gene x 2a
Ksb (SE)
A. D. melanogaster vs. D. pseudoobscura
Adh . . . . . Hsp82 . . . Ubx . . . . . pep . Gart . . . . 3’off . . .
0.77 0.64 (0.08) 0.67 0.62 (0.07) 0.61 0.7 1 (0.09) 0.38 1.24 (0.22) 0.28 1.29 (0.08) 0.26 1.34 (0.17)
B. D. melanogaster vs. D. virilis
Hsp82 . . . . en . . . . . . .
0.71 0.7 1 (0.08) 0.47 1.13 (0.11)
NOTE.-Data sources are as in table 1, except for Adh and 3’ orf (Schaeffer and Aquadro 1987), Ubx (Weinzierl et al. 1987), pep and Cart (Henikoff and Eghtedarzadeh 1987), and en (Kassis et al. 1986).
‘For deviation from random synonymous codon usage, scaled by gene length (see Material and Methods).
b Number of synonymous substitutions per site, between species. ’ orf 3’ to Adh (“D. melanogaster” sequence from D. mauritiana).
coefficient between synonymous codons. The effective population sizes of E. coli and S. cerevisiae are likely to be very large; Bulmer’s ( 1987) analysis suggests that coevo- lution of tRNA abundance and codon usage in those species may have resulted from selection coefficients only one or two orders of magnitude greater than the mutation rate, while Li ( 1987) has demonstrated that “even a very slight selective difference between synonymous codons can produce a strong bias in codon usage.” From elec- trophoretic data, N, values for various Drosophila species have been estimated to be 106- 10’ (Nei and Graur 1984). Thus a selection coefficient of IO-‘- 10m6 may be sufficient to produce bias among synonymous codons in D. melanogaster. Similarly derived Ne values for many mammals are - 104, so that fitness differences among codons would need to be substantially larger to overcome drift in those species.
Acknowledgments We thank Michael Ashburner, Michael Bulmer, Masatoshi Nei, and particularly
Peg Riley for helpful comments. This work was carried out using the facilities of the Irish National Centre for BioInformatics.
LITERATURE CITED
AOTA, S., and T. IKEMURA . 1986. Diversity in G+C content at the third positions of codons in vertebrate genes and its cause. Nucleic Acids Res. 14:6345-6355.
ARRIBAS, C., J. SAMPEDRO, and M. IZQUIERDO. 1986. The ubiquitin genes in D. melanogaster: transcription and polymorphism. Biochim. Biophys. Acta 868: 119- 127.
BENNETZEN, J. L., and B. D. HALL. 1982. Codon selection in yeast. J. Biol. Chem. 257:3026- 3031.
BERNARDI, G., and G. BERNARDI. 1986. Compositional constraints and genome evolution. J. Mol. Evol. 24: l- 11.
BERNARDI, G., B. OLOFSSON, J. FILIPSKI, M. ZERIAL, J. SALINAS, G. CUNY, M. MEUNIER-
Selection on Codon Usage in Drosophila Genes 7 15
ROTIVAL, and F. RODIER. 1985. The mosaic genome of warm-blooded vertebrates. Science 228:953-958.
BULMER, M. 1987. Coevolution of codon usage and tRNA abundance. Nature 325:728-730. CITRI, Y., H. V. COLOT, A. C. JACQUIER, Q. Yu, J. C. HALL, D. BALTIMORE, and M. ROSBACH.
1987. A family of unusually spliced biologically active transcripts encoded by a Drosophila clock gene. Nature 326:42-47.
FILIPSKI, J. 1987. Correlation between molecular clock ticking, codon usage, fidelity of DNA repair, chromosome banding and chromatin compactness in germline cells. FEBS Lett. 217: 184-186.
FISHER, J. A., and T. MANIATIS. 1985. Structure and transcription of the DrosophiZa mulleri alcohol dehydrogenase genes. Nucleic Acids Res. 13:6899-69 17.
FRASCH, M., T. HOEY, C. RUSHLOW, H. DOYLE, and M. LEVINE. 1987. Characterisation and localisation of the even-skipped protein of Drosophila EMBO J. 6:749-759.
FREUND, J. N., and B. P. JARRY. 1987. The rudimentary gene of Drosophila melanogaster encodes four enzymatic functions. J. Mol Biol. 193:1-l 3.
GAREL, J.-P. 1974. Functional adaptation of tRNA population. J. Theor. Biol. 43:21 l-225. GEYER, P. K., C. SPANA, and V. G. CORCES. 1986. On the molecular mechanism of gypsy-
induced mutations at the ye/low locus of Drosophila melanoguster. EMBO J. 5:2657-2662. GOUY, M., and C. GAUTIER. 1982. Codon usage in bacteria: correlation with gene expressivity.
Nucleic Acids Res. 10:7055-7074. GRANTHAM, R., C. GAUTIER, M. GOUY, M. JACOBZONE, and R. MERCIER. 198 1. Codon catalog
usage is a genome strategy modulated for gene expressivity. Nucleic Acids Res. 9:r43-r74. GREENACRE, M. J. 1984. Theory and applications of correspondence analysis. Academic Press,
London. HALL, L. M. C., and P. SPIERER. 1986. The Ace locus of Drosophila melanoguster: structural
gene for acetylcholinesterase with an unusual 5’ leader. EMBO J. 5:2949-2954. HENIKOFF, S., and M. K. EGHTEDARZADEH. 1987. Conserved arrangement of nested genes at
the Drosophila Gart locus. Genetics 117:7 1 l-725. HOVEMANN, B., S. RICHTER, U. WALLDORF, and C. CZIELPLUCH. 1988. Two genes encode
related cytoplasmic elongation factors 1 a( EF- 1 a) in Drosophila melanoguster with continuous and stage specific expression. Nucleic Acids Res. 16:3 175-3 194.
IKEMURA, T. 1985. Codon usage and tRNA content in unicellular and multicellular organisms (review). Mol. Biol. Evol. 2: 13-34.
KALFAYAN, L., and P. C. WENSINK. 1982. Developmental regulation of Drosophila a-tubulin genes. Cell 29:9 l-98.
KAMANAKA, M. K., J. A. SAUGSTAD, 0. HANSON-PAINTON, B. J. MCCARTHY, and S. L. TOBIN. 1987. Structure and expression of the Drosophila calmodulin gene. Nucleic Acids Res. 15: 3335-3348.
KASSIS, J. A., S. J. POOLE, D. K. WRIGHT, and P. H. O’FARRELL. 1986. Sequence conservation in the protein coding and intron regions of the engrailed transcription unit. EMBO J. 5: 3583-3589.
LI, W.-H. 1987. Models of nearly neutral mutations with particular implications for nonrandom usage of synonymous codons. J. Mol. Evol. 24:337-345.
LI, W.-H., M. TANIMURA, and P. M. SHARP. 1987. An evaluation of the molecular clock hypothesis using mammalian DNA sequences. J. Mol. Evol. 25:330-342.
LI, W.-H., C.-I. WV, and C.-C. LUO. 1985. A new method for estimating synonymous and nonsynonymous rates of nucleotide substitution considering the relative likelihood of nu- cleotide and codon changes. Mol. Biol. Evol. 2: 150- 174.
LIMBACH, K. J., and R. WV. 1985. Characterisation of two Drosophila melunoguster cytochrome c genes and their transcripts. Nucleic Acids Res. 13:63 l-644.
MARUYAMA, T., T. GOJOBORI, S. AOTA, and T. IKEMURA. 1986. Codon usage tabulated from the GenBank genetic sequence data. Nucleic Acids Res. 14:rl5 1 -r 197.
MORIYAMA, E. N. 1987. Higher rates of nucleotide substitution in Drosophila than in mammals. Jpn. J. Genet. 62:139-147.

7 16 Shields et al.
NEI, M., and D. GRAUR. 1984. Extent of protein polymorphism and the neutral mutation theory. Evol. Biol. 17:73- 118.
NEWGARD, C. B., K. NAKANO, P. K. HWANG, and R. J. FLETTERICK. 1986. Sequence analysis of the cDNA encoding human liver glycogen phosphorylase reveals tissue-specific codon usage. Proc. Natl. Acad. Sci. USA 83:8 132-8 136.
PIROTTA, V., E. MANET, E. HARDON, S. E. BICKEL, and M. BENSON. 1987. Structure and sequence of the Drosophila zeste gene. EMBO J. 6:79 l-799.
QIAN, S., J.-Y. ZHANG, M. A. KAY, and M. JACOBS-LORENA. 1987. Structural analysis of the Drosophila rpA1 gene, a member of the eucaryotic ‘A’ type ribosomal protein family. Nucleic Acids Res. 15:987-1003.
ROSENBERG, U. B., C. SCHRODER, A. PREISS, A. KIENLIN, S. COTE, I. RIEDE, and I. JACKLE. 1986. Structural homology of the product of the Drosophila Kruppel gene with Xenopus transcription factor IIIA. Nature 319:336-339.
SCHAEFFER, S. W., and C. F. AQUADRO. 1987. Nucleotide sequence of the Adh gene region of Drosophila pseudoobscura: evolutionary change and evidence for an ancient gene duplication. Genetics 117:61-73.
SETO, N. 0. L., S. HAYASHI, and G. M. TENER. 1987. Drosophila Cu-Zn superoxide dismutase cDNA sequence. Nucleic Acids Res. 15:5483.
SHAPIRO, H. S. 1976. Distribution of purine and pyrimidines in deoxyribonucleic acids. Pp. 24 l-28 1 in G. D. FASMAN, ed. CRC handbook of biochemistry and molecular biology. 3d ed. vol. 3: Nucleic acids. CRC, Cleveland.
SHARP, P. M., and W.-H. LI. 1986. Codon usage in regulatory genes in Escherichia coli does not reflect selection for ‘rare’ codons. Nucleic Acids Res. 14:7737-7749.
. 1987. The rate of synonymous substitution in enterobacterial genes is inversely related to codon usage bias. Mol. Biol. Evol. 4:222-230.
SHARP, P. M., T. M. F. TUOHY, and K. R. MOSURSKI. 1986. Codon usage in yeast: cluster analysis clearly differentiates highly and lowly expressed genes. Nucleic Acids Res. 14:5 125- 5 143.
SHIELDS, D. C., and P. M. SHARP. 1987. Synonymous codon usage in Bacillus subtilis reflects both translational selection and mutational biases. Nucleic Acids Res. 15:8023-8040.
SPRINZL, M., T. HARTMANN, F. MEISSNER, J. MOLL, and T. VORDERW~LBECKE. 1987. Com- pilation of tRNA sequences and sequences of tRNA genes. Nucleic Acids Res. 15:r53-rl88.
TAUTZ, D., R. LEHMANN, H. SCHNURCH, R. SCHUH, E. SEIFERT, A. KIENLIN, K. JONES, and H. JACKLE . 1987. Finger protein of novel structure encoded by hunchback, a second member of the gap class of Drosophila segmentation genes. Nature 327:383-389.
THEURKAUF, W. E., H. BAUM, J. Bo, and P. C. WENSINK. 1986. Tissue-specific and constitutive alpha-tubulin genes of Drosophila melanogaster code for structurally distinct proteins. Proc. Natl. Acad. Sci. USA 83:8477-848 1.
TREAT-CLEMONS, L. G., and W. W. DOANE. 1984. Biochemical loci of the ‘fruit fly’ (Drosophila melunoguster). Pp. 300-323 in S. J. O’BRIEN, ed. Genetic maps 1984. Vol. 3. Cold Spring Harbor Laboratory, Cold Spring Harbor, N.Y.
WEINZIERL, R., J. M. AXTON, A. GHYSEN, and M. AKAM. 1987. Ultrubithorax mutations in constant and variable regions of the protein coding sequence. Genes Dev. 1:386-397.
WHITE, B. N., G. M. TENER, J. HOLDEN, and D. T. SUZUKI. 1973. Analysis of tRNAs during the development of Drosophila. Dev. Biol. 33:185-195.
YAN, Y. L., C. J. KUNERT, and J. H. POSTLETHWAIT. 1987. Sequence homologies among the three yolk polypeptide (Yp) genes in Drosophila melanogaster. Nucleic Acids Res. 15: 67-85.
MASATOSHI NEI, reviewing editor
Received December 18, 1987; revision received April 16, 1988