denis a. federiakin, eugenia a. aleksandrova - wp.hse.ru · pdf filedenis a. federiakin,...
TRANSCRIPT

Denis A. Federiakin, Eugenia A. Aleksandrova
INVESTIGATING THE
DIMENSIONALITY OF TORR: A
REPLICATION STUDY
BASIC RESEARCH PROGRAM
WORKING PAPERS
SERIES: PSYCHOLOGY
WP BRP 87/PSY/2017
This Working Paper is an output of a research project implemented within NRU HSE’s Annual
Thematic Plan for Basic and Applied Research. Any opinions or claims contained in this
Working Paper do not necessarily reflect the views of HSE

Denis A. Federiakin1,1 Eugenia A. Aleksandrova
22
3 INVESTIGATING THE DIMENSIONALITY OF TORR: A
REPLICATION STUDY3
Although Relational Reasoning (RR) is regarded as an extraordinarily important research field,
relatively little is known about its measurement. The Test of Relational Reasoning (TORR) is a
non-verbal instrument claimed to measure four forms of RR: analogy, anomaly, antinomy, and
antithesis. At the time of writing, there is only one study systematically investigating the
dimensionality and psychometric properties of TORR within the IRT methodology of the original
authors, which does not give unambiguous result. The goal of this paper is to replicate the original
study on an independent Russian sample of participants in the paradigm of Rasch measurement.
Despite several limitations, the independent investigation of TORR dimensionality supports the
results of the original study.
JEL Classification: Z.
Keywords: Relational Reasoning, Test of Relational Reasoning, IRT-Calibration, Rasch modeling,
Unidimensional Model, Multidimensional Model, Model Residuals, Test Dimensionality, Fit
Statistics
11
National Research University Higher School of Economics, PhD Student. «Center for monitoring
the quality of education», Institute of Education. E-mail: [email protected] 22
National Research University Higher School of Economics, Analyst. «Center for monitoring the
quality of education», Institute of Education. E-mail: [email protected] 3 This Working Paper is an output of a research project implemented within NRU HSE’s Annual Thematic Plan for Basic and
Applied Research. Any opinions or claims contained in this Working Paper do not necessarily reflect the views of HSE.

3
Introduction
Relational Reasoning (RR) has been conceptualized as the fundamental cognitive ability to
identify meaningful patterns within any stream of information, be it linguistic, graphic, or numeric
(Alexander & DRLRL, 2012; Dumas et al., 2013). This broad definition was produced on the basis
of an extensive systematic review of the theoretical and empirical literature within divergent
research areas, including neuroscience, cognitive psychology, child development, and educational
psychology (Dumas et al., 2013). While conceptually RR is viewed as a broad construct
incorporating any instances of pattern discernment between and among pieces of information to be
examined (Alexander & DRLRL, 2012), operationally it was specified and measured in four forms:
analogy, anomaly, antinomy, and antithesis (Alexander et al., 2016; Dumas & Alexander, 2016).
Each manifestation corresponds to a particular pattern within a set of information (similarity,
discrepancy, incompatibility, and polarity).
Of the four measurable forms RR can manifest itself in, analogical reasoning has been the
most explored and measured in educational and psychological studies (Alexander et al., 2016). On
account of this, the extended conceptualization of RR, including anomaly, antimony, and antithesis,
has been recognized as particularly novel and powerful (Schunn, 2017). Importantly, however,
these types of higher-order relations cannot be considered exhaustive. Although there are other
forms of RR that might be likewise examined, the four forms have been regarded as basic for
forging associations between and among pieces of information, and worthy of investigation due to
their broad applicability in an educational context in which complex cognitive processes are
required (Alexander & DRLRL, 2012; Dumas et al., 2013, 2014).
Since the ability to reason relationally is fundamental, it is applicable in all academic fields
but what makes studying this ability particularly valuable and meaningful for STEM areas? The
author of the construct gives several arguments (Alexander, 2017). First, many empirical studies of
RR have utilized problems, tasks, methods and procedures from mathematics, science, engineering,
and technology which makes the outcomes obtained by researchers of particular interest for STEM
domains. Secondly, teaching and learning STEM involves a lot of different media (for example,
drawings, texts and graphs) which requires students to comprehend the meaning of all these various
schemes. In view of this, it is important to ascertain the ways students extract the meaning from
these materials when learning. In addition, within STEM domains, introducing sophisticated
scientific concepts or procedures goes hand-in-hand with contrasting them with students’ previous
misconceptions or misunderstandings. Considering this, it seems necessary to find out how
instructional materials and activities can be organized in order to correct the discrepancy between

4
students’ misinterpretations and scientific explanations. Furthermore, STEM students have to deal
with critical concepts which are not only abstract in nature and difficult to understand, but also exist
in next to incomprehensible dimensions (e.g., nanometers, eons, quintillions, and infinity).
Therefore, it is important to find effective and easily interpretable ways to compare and contrast
these phenomena in order to make them more accessible and understandable for students, especially
for those who struggle on their path to professional development in these areas.
Extant evidence derived from the scientific literature on RR in STEM professions confirms
that this cognitive ability is important for scientists, including medical doctors, and engineers; can
be observed and measured in diverse ways; can be developed and taught; supports and is supported
by collaboration as all its forms operating in concert with one another (Dumas, 2016).
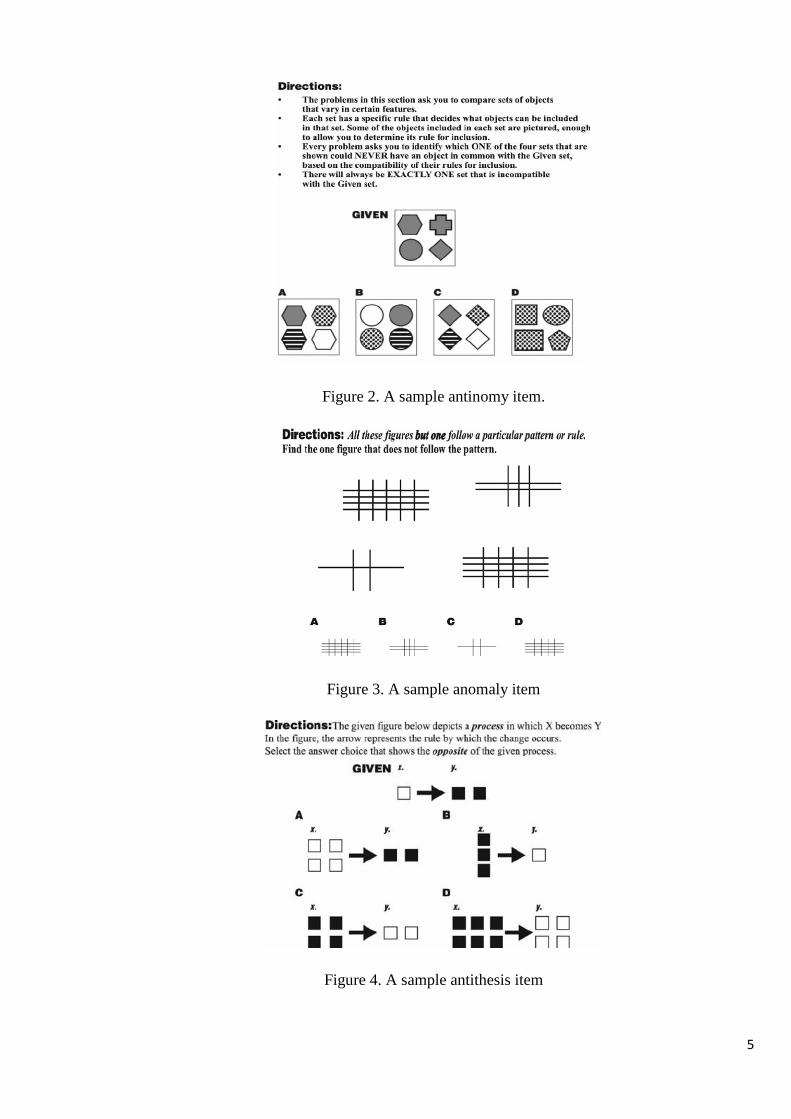
In order to capture all four types of higher-order patterns, the graphical Test of Relational
Reasoning (TORR) was devised and developed (Dumas & Alexander, 2016). The measure has 32
visuospatial items, organized in four scales of 8 items representing the four forms of relational
reasoning. Additionally, each scale of TORR includes two sample items; designed to familiarize
participants with the format of the tasks, and which are relatively easy. Examples of RR items from
the TORR are presented in Figures 1-4.
Figure 1. A sample analogy item.
5
Figure 2. A sample antinomy item.
Figure 3. A sample anomaly item
Figure 4. A sample antithesis item

6
TORR has been utilized as a predictive measure in a variety of studies. It has predicted scores
on SAT, both for the verbal section (F(1, 28)=16.13, p<0.001; β=0.36, t=4.02, p<0.001; R2=0.37) and
for the mathematics section (F(1, 28)=4.34, p<0.05; β=0.2, t=2.08, p<0.05; R2=0.13) (Alexander et al.,
2015). TORR demonstrated high levels of predictive validity in the domain of engineering design
(Dumas & Schmidt, 2015; Dumas, Schmidt & Alexander, 2016) where it was a significant predictor
of students’ ability to produce innovations in solving an engineering problem (β=0.84, p=0.01).
The internal structure of TORR and the item parameters were ascertained and calibrated
within both the Classical Test Theory (CTT) and Multidimensional Item Response Theory (MIRT)
(Alexander et al., 2016(1); Dumas & Alexander, 2016) in a large, representative undergraduate
sample (N=1,379). In terms of CTT, TORR was a reliable and highly internally consistent
instrument (Cronbach’s alpha=0.84). An investigation of TORR dimensionality identified a 3PL bi-
factor model as the best-fitting MIRT model with which the test was calibrated. The bi-factor model
estimates five parameters: guessing, general discrimination, specific discrimination, general
difficulty, and specific difficulty; it allows the assessment of students’ general RR ability, while
also supplying information on their analogical, anomalous, antinomous, and antithetical reasoning
abilities. A systematic investigation of differential-item-functioning (DIF) across demographic
groups on TORR items evidenced the cultural fairness of the measure across multiple gender,
ethnic, and language groups (Dumas, 2016).
The goal of this paper is to replicate the original study (Dumas & Alexander, 2016) on an
independent Russian sample in the paradigm of Rasch measurement. At the time of writing, there is
only one study systematically investigating the dimensionality and psychometric properties of
TORR. Although RR is a fresh and important area of psychological and educational research,
relatively little is known about the variation of TORR features and the internal structure of various
national samples.
Method
Participants
Participants were 736 the fourth year undergraduate Electrical Engineering and Computer
Science students. The data gathering was conducted in November 2016 as a part of the larger Study
for Undergraduate PERformace (SUPER) project investigating the quality of higher engineering
education in BRIC countries. For the SUPER project, 34 Russian universities (6 elite and 28 non-

7
elite by state status) were randomly chosen and asked to participate. The sample for this study is a
randomly chosen half of the representative sample (a randomized clustered sample) of Russian
Engineering students graduating in 2017.
Procedure
The studied sample was randomly chosen for administrating non-academic tests. During the
data gathering session two tests (ETS test for Critical Thinking, which is a part of HEIghten®
Outcomes Assessment Suite and TORR itself) were followed by a questionnaire collecting
information about a range of individual and institutional level factors influencing educational
outcomes.
Students were asked to participate by their university coordinators determined by the
university administrators. Students were motivated by (a) instructions containing information about
the importance of the study for improving the quality of higher engineering education around the
world and (b) receiving individual feedback about their performance on the tests relative to the
whole sample.
The test was administrated in computer-based form with a linear design. To provide maximal
equivalence with a paper-and-pencil format, respondents could move forward and backward
between test items and skip some of them. However, total test time was limited to 50 minutes and
students were able to see the time left.
Results
Classical Test Theory Prospective
For CTT analysis we used package “psych” (version 1.7.8) for R program language (version
3.4.2). In this part we examined classical test reliability with raw Cronbach’s alpha (0.75) and
Greatest Lower Bound from factor analysis, as recommended in Revelle (2017) under the given
sample size (glb=0.82). Such values tend to be at least satisfactory and have high coherence with
results of previously published studies. The total test scores were approximately normally
distributed (Figure 5). The full matrix of correlations between the subscales and the total test score
and basic descriptive statistics are presented in Table 1.

8
Figure 5. Distribution of Raw Scores
Table 1. Correlations and descriptive statistics for test scores
Total test
score
Analogy
Scale
Anomaly
Scale
Antinomy
Scale
Antithesis
Scale
Correlations Total test
score
1.00
Analogy
Scale
0.71* 1.00
Anomaly
Scale
0.70* 0.40* 1.00
Antinomy
Scale
0.49* 0.14* 0.11* 1.00
Antithesis
Scale
0.74* 0.36* 0.34* 0.14* 1.00
Descriptives Mean 16.33 4.30 3.86 3.58 4.06
Standard
Deviation
5.17 1.77 1.86 1.72 2.19
Notes: * p < 0.005

9
Classical item statistics are presented in Table 2. Table 2 suggests that 7 items exhibited low
discrimination parameters toward the total test score (5 of them belong to the antinomy scale, which
can explain the relatively low correlation of this scale with the total test score). Despite the
unsatisfactory discrimination performance of several items, we decided to retain all of them in the
test to follow the analysis procedure and to provide equivalence to the original paper.
Table 2. Classical Item Statistics
Scale Item number Item difficulty Item total
corrected
correlation
Item scale
corrected
correlation
Analogy 1 0.52 0.32 0.32
2 0.50 0.45 0.51
3 0.75 0.34 0.42
4 0.52 0.45 0.50
5 0.84 0.38 0.39
6 0.45 0.35 0.38
7 0.77 0.30 0.43
8 0.48 0.24 0.30
Anomaly 9 0.79 0.27 0.21
10 0.53 0.20 0.28
11 0.35 0.22 0.34
12 0.48 0.38 0.50
13 0.48 0.30 0.35
14 0.46 0.48 0.58
15 0.42 0.28 0.32
16 0.35 0.18 0.13

10
Antinomy 17 0.62 0.24 0.48
18 0.67 0.11 0.05
19 0.34 0.27 0.40
20 0.47 0.26 0.49
21 0.45 0.17 0.25
22 0.29 0.13 0.26
23 0.37 0.02 0.06
24 0.38 0.04 0.33
Antithesis 25 0.42 0.33 0.34
26 0.49 0.30 0.28
27 0.60 0.40 0.57
28 0.54 0.46 0.52
29 0.32 0.18 0.21
30 0.62 0.52 0.61
31 0.53 0.45 0.56
32 0.56 0.40 0.54
Item Response Theory Modeling
The original study compared three models from the framework of 3PL IRT modeling
(unidimensional, multidimensional and bi-factor). However, we conduct analysis within the Rasch
(1PL) framework due to the opportunities this approach provides for item and dimensionality
analysis and compare only two of three models – unidimensional and multidimensional.
Before using estimates of the model parameters, the dimensionality of the test must be
investigated to ensure the absence of bias in the parameter estimates due to Local Items
Dependence (LID) (Sireci, Thissen & Wainer, 1991). Under Rasch methodology we analyzed the

11
dimensionality of the test with Principal Components Analysis (PCA) of unidimensional model
residuals (Linacre, 2012). If a unidimensional model is sufficient, then (a) PCA does not extract any
significant factors (that is, with an eigenvalue more than 2.0) and (b) the extracted factors are
uninterpretable (this consequence comes from the usual PCA), i.e. model residuals do not contain
any information not described by the model. However, if a unidimensional model is not sufficient,
neither requirements are met and, by sense, residuals still contain some unextracted information.
Such a situation may lead to the confounding of item parameters and a unidimensional solution
cannot be trusted. Following such logic, we conducted PCA of model residuals (a summary is
presented in Table 3). The investigation of test dimensionality was conducted using Winsteps
software for Rasch modeling.
Table 3. Summary of PCA of Model Residuals
Variance Rubrics Eigenvalue Empirical Modeled
Total raw variance in observations 39.9 100.0% 100.0%
Raw variance explained by measures 7.3 18.5% 18.3%
Raw variance explained by persons 2.5 6.3% 6.2%
Raw Variance explained by items 4.8 12.2% 12.0%
Raw unexplained variance (total) 32.0 81.5% 100.0% 81.7%
Unexplned variance in 1st contrast 2.2 5.5% 6.8%
Unexplned variance in 2nd contrast 2.0 5.1% 6.3%
Unexplned variance in 3rd contrast 1.5 3.9% 4.8%
Table 3 demonstrates that it is possible to discover 2 factors (called “contrasts” for model
residuals analysis in Rasch modeling) based on their eigenvalue. To examine the interpretability of
this factor solution, we studied which items load the first contrast the most. These results are
presented in Table 4.

12
Table 4. Items loading on contrast 1
Contrast 1 Loading Item number Loading Item number
0.46 Antinomy Item 4 -0.43 Antithesis Item 6
0.45 Antinomy Item 1 -0.42 Antithesis Item 3
0.44 Antinomy Item 8 -0.40 Antithesis Item 8
0.42 Antinomy Item 3 -0.38 Antithesis Item 4
0.36 Antinomy Item 5 -0.37 Antithesis Item 7
0.33 Antinomy Item 6 -0.21 Antithesis Item 1
0.21 Antinomy Item 7
0.17 Antinomy Item 2
Although the interpretation of contrasts is not as straightforward as factors from a traditional
PCA, we can clearly see a strong trend of item grouping based on the principal of belonging to the
subscale. We may not, therefore, try to interpret following contrasts since we have already
discovered the full bundle of LID evidence. This implies a requirement for multidimensional
modeling.
Multidimensional modeling included four dimensions defined following the theoretical
instrument structure. This means that we modeled 4 correlated scales (analogy, anomaly, antinomy,
and antithesis) with 8 items each. For this calibration we used ConQuest software for Rasch
modeling. ConQuest software was also used for additional unidimensional modeling to compare
omnibus model fit indices. We cannot directly compare the fit statistics of the unidimensional
model from Winsteps and the multidimensional model from ConQuest due to differences in the
algorithms of the parameter estimations which are implemented in the programs (Linacre, 1999).
The Akaike information criterion (AIC; Akaike, 1974) and Bayesian information criterion
(BIC; Schwarz, 1978) were examined to determine which model fits the data best. It is known that
when a sample size is large, AIC tends to favor complex models, whereas BIC may favor more
parsimonious models because of the incorporation of a penalty for additional components (Kang,

13
Cohen, & Sung, 2009). Lower AIC and BIC values indicate better fit. These model fit statistics are
presented in Table 5.
Table 5. Model fit statistics
Model -2 Log
Likelihood
Number of
Estimated
Parameters
Sample
Size
AIC BIC
Unidimensional 29708.74 33 736 29774.74 29926.58
Multidimensional 29213.27 42 736 29297.27 29490.52
Table 5 clearly demonstrates that the multidimensional model fits the data better than the
unidimensional one. As a result, we used AIC and BIC indexes for additional supportive evidence
for test multidimensionality. This finding is highly coherent with the original research.
Discussion, Limitations and Conclusion
The construct of RR is regarded as a valuable and fruitful field for further scientific
investigation. Although its connections with academic achievements and psychological constructs
and the internal structure of the construct are investigated and proved, a few gaps still exist. For
example, relatively little is known about other forms of RR which are not covered by TORR, or the
international equivalence of the measure. However, this paper is focused on the partial replication
of the original study using another sample and analytical approach.
We calibrated two of the three models used by TORR developers to inspect its internal
structure: unidimensional and multidimensional models. Unlike the authors of the original study,
who worked in 3PL IRT-paradigm, we worked in the paradigm of Rasch measurement. The choice
of the Rasch approach was made due to the advanced opportunities it provides for analyzing test
quality comparing it to the family of 3PL models.
This paper has with several important restrictions. First, calibrating a bi-factor model is not an
immediate concern of this paper. The Rasch approach provides three popular, slightly different,
models which can be classified as bi-factor models: the Rasch Testlet Model (Wang & Wilson,
2005), the Extended Rasch Testlet Model (Paek et al, 2009) and the Rasch model with
subdimensions (Brandt, 2008). Calibrating and comparing these additional models is a natural step

14
for the extension and improvement of this study. Second, we do not inspect measurement fairness
toward various national and gender groups as was done in the original study. An investigation of
Differential Distractor Functioning, Differential Item Functioning, Differential Bundle Functioning
and Differential Test Functioning will provide more information regarding the entire test quality.
Third, we are not focused on the evaluation of subscale reliability (i.e., Haberman, 2007). We used
only the overall evaluations of the test reliability, although multidimensional test structure requires
other reliability estimates.
However, considering the limitations of this paper, the analyses yielded very similar results. A
unidimensional model is not sufficient for TORR no matter whether the Rasch approach or 3PL is
used. Such a conclusion supports authors’ expectations of the construct structure.
Acknowledgments
Support from the Basic Research Program of the National Research University Higher School
of Economics is gratefully acknowledged.

15
References
Akaike, H. (1974). A new look at the statistical model identification. IEEE Transactions on
Automatic Control, 19(6), 716–723.
Alexander, P. A. (2016). Relational thinking and relational reasoning: harnessing the power of
patterning. npj Science of Learning, 1, 16004.
Alexander, P. A. (2017). Relational reasoning in stem domains: a foundation for academic
development. Educational Psychology Review, 29(1), 1-10.
Alexander, P. A., & The Disciplined Reading and Learning Research Laboratory. (2012). Reading
into the future: Competence for the 21st century. Educational Psychologist, 47(4), 259-280.
Alexander, P. A., Dumas, D., Grossnickle, E. M., List, A., & Firetto, C. M. (2016). Measuring
relational reasoning. The Journal of Experimental Education, 84(1), 119–151.
Brandt, S. (2008). Estimation of a Rasch model including subdimensions. IERI monograph series:
Issues and methodologies in large-scale assessments, 1, 51-69.
Dumas, D. (2016). Seeking cultural fairness in a measure of relational reasoning (Doctoral
dissertation, University of Maryland, College Park).
Dumas, D. (2017). Relational reasoning in science, medicine, and engineering. Educational
Psychology Review, 29(1), 73-95.
Dumas, D., & Alexander, P. A. (2016). Calibration of the test of relational reasoning. Psychological
assessment, 28(10), 1303–1318.
Dumas, D., & Schmidt, L. (2015). Relational reasoning as predictor for engineering ideation
success using TRIZ. Journal of Engineering Design, 26, 74–88.
Dumas, D., Alexander, P. A., & Grossnickle, E. M. (2013). Relational reasoning and its
manifestations in the educational context: A systematic review of the literature. Educational
Psychology Review, 25(3), 391-427.
Dumas, D., Schmidt, L. C., & Alexander, P. A. (2016). Predicting creative problem solving in
engineering design. Thinking Skills and Creativity, 21, 50-66.
Fountain, L. (2016). Relations among Topic Knowledge, Individual Interest, and Relational
Reasoning, and Critical Thinking in Maternity Nursing (Doctoral dissertation).

16
Haberman, S. J. (2008). When Can Subscores Have Value? Journal of Educational and Behavioral
Statistics, 33(2), 204 – 229.
Kang, T., Cohen, A. S., & Sung, H. (2009). Model selection indices for polytomous items. Applied
Psychological Measurement, 33, 499–518.
Linacre, J. M. (1999). Understanding Rasch measurement: estimation methods for Rasch Measures.
Journal of Outcome Measurement, 3, 381-405.
Linacre, J. M. (2012). Winsteps®(Version 3.75.0)[Computer Software]. Beaverton, Oregon:
Winsteps.com. Retrieved January 1, 2012.
Paek, I., Yon, H., Wilson, M., Kang, T. (2009). Random parameter structure and the testlet model:
extension of the Rasch testlet model. Journal of Applied Measurement, 10(4),394-407.
Revelle, M. W. (2017). Package ‘psych’.
Schunn, C. D. (2017). Building from In Vivo Research to the Future of Research on Relational
Thinking and Learning. Educational Psychology Review, 29(1), 97-104.
Schwarz, G. E. (1978). Estimating the dimension of a model. Annals of Statistics, 6, 461–464.
Sireci, S., Thissen, D., & Wainer, H. (1991). On the Reliability of Testlet-Based Tests. Journal of
Educational Measurement, 28(3), 237-247.
Wang, W.-C., Wilson, M. (2005). The Rasch Testlet Model. Applied Psychological Measurement,
29(2), 126-149.

17
Denis A. Federiakin
National Research University Higher School of Economics. «Center for monitoring the quality of
education», Institute of Education. E-mail: [email protected]
Eugenia A. Aleksandrova
National Research University Higher School of Economics. «Center for monitoring the quality of
education», Institute of Education. E-mail: [email protected]
Any opinions or claims contained in this Working Paper do not necessarily
reflect the views of HSE.
© Federiakin, Aleksandrova, 2017