demographic and health survey 2016 neonatal mortality in
TRANSCRIPT

Page 1/24
Spatial Distribution and Associated Factors ofNeonatal Mortality in Ethiopia: using EthiopianDemographic and Health Survey 2016Gedamnesh Bitew Deres
University of Gondar College of Medicine and Health SciencesDestaw Fetene Teshome
University of Gondar College of Medicine and Health SciencesAyenew Molla Lakew ( [email protected] )
Institute of Public Health, College of Medicine and Health sciences, University of Gondar, Ethiopiahttps://orcid.org/0000-0003-3648-9891
Research article
Keywords: EDHS, Neonatal mortality, spatial distribution, associated factors, Ethiopia
Posted Date: March 2nd, 2020
DOI: https://doi.org/10.21203/rs.3.rs-15617/v1
License: This work is licensed under a Creative Commons Attribution 4.0 International License. Read Full License

Page 2/24
AbstractBackground: Neonatal mortality is continuing on top of the agenda of public health and internationaldevelopment agencies. In Ethiopia, it is still high accounts 60% infant mortality and 43% of under-�vemortality. However, the distribution of the problem across the regions of Ethiopia is not well addressed.Therefore, this analysis aimed to assess spatial distribution of neonatal mortality and identify associatedfactors in Ethiopia using the 2016 Ethiopian Demographic Health Survey (EDHS). Exploring spatialdistribution and identifying associated factors is important to select priority areas and design effectiveintervention program to reduce neonatal mortality.
Methods: The analysis included 7,193 live births, selected by strati�ed two-stage cluster samplingtechniques. Spatial analysis was done to explore spatial distribution of neonatal death using Geographicinformation system and Sat scan. Multilevel logistic regression was �tted to identify individual andcommunity level factors associate with neonatal mortality.
Results: The hot-spot areas for neonatal mortality were Amhara, West Tigray, northeast, southwest andcentral part of Oromia. Mother’s with age >35 years (AOR=2.25, 95CI%: 1.47, 3.45), family size of 3-5(AOR=0.14, 95CI%: 0.06, 0.36) and 6 and above (AOR=0.08, 95%CI: 0.02, 0.20), male neonates (AOR=3.45,95%CI: 2.27, 5.22), smaller birth size (AOR=1.61, 95%CI: 1.02, 2.54), birth interval less than 2 years(AOR=3.58, 95%CI: 1.66, 7.70) and 2 years and more (AOR=2.54, 95%CI: 1.26-5.11), early initiation ofbreast feeding (AOR=0.20, 95%CI: 0.09-0.42), had no ANC visit (AOR=1.68, 95%CI: 1.08, 2.60), did notreceive PNC services (AOR=3.58, 95%CI: 1.13 -11.33) and C/S delivery (AOR=19.55, 95%CI: 8.07, 47.34)were statistically signi�cant variables for neonatal mortality.
Conclusions: High risk areas for neonatal mortality were identi�ed in northern, central and southwest partof the Ethiopia. Individual level variables were important factors associated with neonatal mortality.Focusing on maternal health care services, increase birth interval and initiation of breast feeding early willbe needed to reduce neonatal mortality.
BackgroundNeonatal mortality is the death of new born up to �rst 28 days after birth (1). Globally, 2.5 million deathsoccurred in the �rst month of life at rate of 18 deaths per 1,000 live births which accounts 47% of under-�ve mortality in 2017. The majority, 80% of neonatal deaths, occurred in Sub-Saharan Africa (27 per 1000live births) and South Asia countries (2). In spite of many efforts taken by Ethiopian government andother stakeholders, neonatal death is still high, 29 per 1000 live births, which accounts 60% of infantmortality and 43% of under-�ve mortality. The reduction progress was by 41% from 49 to 29 per 1000live births for the last 16 years from 2000 to 2016 (3).
Neonatal mortality is continuing on top of the agenda of public health and international developmentagencies because sustainable development goals (SDGs) for child survival cannot be met withoutsubstantial reductions in neonatal mortality. Reduction of neonatal death would be important to achieve

Page 3/24
both the neonatal and under-�ve mortality targets of the sustainable development goals. The SDGs havetwo speci�c targets to reduce the neonatal mortality rate and under-�ve mortality rate to 12 and 25 per1000 live-births within 2030 (4).
The majority of neonatal deaths are caused by preventable or treatable diseases worldwide like neonatalsepsis or pneumonia, tetanus, birth asphyxia, low birth weight, preterm birth complications, congenitalabnormalities and other causes (2, 5). Previous studies showed that leading causes of new born deathare prematurity, low birth weight, asphyxia, infections, congenital abnormalities and other causes (6, 7).Many literatures also indicated that neonatal mortality was in�uenced by mother’s age, educationalstatus of mother and father, income condition, residence, regional differences, neonatal related factors,maternal health care services and obstetric related factors (8-10).
Although there are studies conducted on neonatal mortality and associated factors in Ethiopia, they didnot show the spatial distribution of the problem in the country. Neonatal mortality varies in the country inspace and time by changing its magnitude. The individual and community level factors were also notaddressed previously.
The present study therefore, aimed to examine the spatial patterns and identify determinants of neonatalmortality in Ethiopia using the 2016 EDHS data. First, the study examined whether there was a signi�cantglobal spatial autocorrelation for the neonatal mortality. If the presence of global spatial dependency wascon�rmed, local spatial autocorrelation was explored, and map the spatial distribution of neonatalmortality by region.
The spatial exploration of neonatal mortality would have an important implications to select priorityareas design targeting policy for effective intervention program to reduce neonatal mortality
MethodsStudy setting and period
The data for this study were collected in all nine regions and two city administrations of Ethiopia fromJanuary 18 to June 27, 2016. Each region is subdivided into zones, and zones into administrative unitscalled district. Each district is further subdivided into the lowest administrative unit, called kebeles. Thereare a total of 68 zones, 817 districts and 16,253 kebeles in the country (3).
Population and Sample
All neonates in Ethiopia born within the �ve years preceding the survey were the source population,whereas all neonates in Ethiopia who were in the selected clusters were considered as the studypopulation. Neonates with incomplete data, and longitude and latitude zero degree for spatial dataexploration were excluded from the analysis.

Page 4/24
A total of 7,193 live births taken from 645 (202 in urban and 443 in rural areas) Enumeration Areas (EA)were included in the analysis. Strati�ed two-stage cluster sampling was used to select the estimatedsample. Each region was strati�ed into urban and rural areas, yielding 21 sampling strata. Samples ofEAs were selected independently in each stratum in two stages. In the �rst stage 645 clusters of EAs wereselected, 18,008 households were enumerated in the second stage (3). The 7,193 household hadneonates during the data collection and all neonates were included in the analysis.
Data collection Procedures
The source of this study was the 2016 EDHS. Permission letter for the use of this data were obtained, anddata sets were downloaded from the Measure Demographic web site: www.measuredhs.com.
Data for the original work were collected by using compressive standard questionnaires.The householdQuestionnaire, the woman’s questionnaire and the man’s questionnaire were used to collect socio-economic and demographic information, women’s birth history and other important information. After allquestionnaires were �nalized in English, they were translated into Amharic, Tigrigna, and Oromiffa. Thecollected data was back translated into English to keep consistence.
Study variables
Neonatal mortality was the dependent variable of the study. The independent variables were communitylevel variables (region and residence) and Individual level variables. Individual level variables:demographic and socio-economic variable (mother’s age, mother’s education level, father’s educationlevel, wealth index, father’s employment status, mother’s employment status, marital status, family size,improved water source, improved toilets), Neonatal related variables( sex, birth interval, birth size andinitiation of breast feeding) and maternal health service (ANC visit, PNC visit, Place of delivery, mode ofdelivery, multiple births, number of tetanus toxoid vaccine ).
Data quality control
The quality of this data was maintained by checking its completeness, cleaning the missing values byrunning frequency tables. In addition to this, the quality of original data were maintained by pretest thequestionnaires in all three local languages (Amarigna, Oromiffa and Tigrigna), giving training forinterviewers and interviewers used tablet computers to record response.
Statistical Analysis
Data were weighted to account different sampling probabilities and response rates. Descriptive measureswere used to summarize the characteristics of the study participants using weighted frequencies andpercentages for community level and individual level variables. Neonatal mortality rate across the regionswas also estimated and displayed with the graph.

Page 5/24
Spatial autocorrelation was examined through global Moran’s which is an indicator for spatialautocorrelation and measures whether spatial pattern of neonatal mortality was clustered, dispersed orrandom. The Moran’s I value ranges from −1 to +1. If the test statistics is signi�cance (P < 0.05) andMoran’s I value approaches -1 indicates dispersion and +1 indicates clustered, while if the test statistics isnot signi�cance, the observed pattern of neonatal mortality displays is random.
A Local Moran’s I cluster map was used to determine local clustering of the neonatal mortality. It alsomeasures whether there were positively correlated (high-high and low-low) clusters or negativelycorrelated clusters (high-low and low-high). Moreover, clusters high values (High-High) and clusters of lowvalues (low -low) were identi�ed. The level of clustering of the neonatal mortality within the area wereidenti�ed using Z-score. High and low level of clustering of neonatal mortality was indicated a positiveand negative Z-scores respectively.
High prevalence/low prevalence areas of neonatal mortality were determined using the Getis-Ord Gi. Hot-spot and cold-spot areas identi�ed and indicated by Gi*. The high-risk and low-risk regions for neonatalmortality was predicted by using Spatial kriging interpolation analysis.
Spatial sat scan analysis was conducted using SatScan software version 9.6 to investigate signi�cantprimary and secondary clusters of high neonatal mortality. The numbers of cases in each location haveBernoulli distribution and the model requires data cases and control. The default maximum spatialcluster size of <50% of the population was used, as an upper limit, which allowed both small and largeclusters to be detected and ignored clusters that contained more than the maximum limit. For eachpotential cluster, a likelihood ratio test statistic was used to determine if the number of observed mortalitywithin the potential cluster is signi�cantly higher than expected or not. The primary and secondaryclusters are identi�ed and reported with log likelihood ratio, relative risk and P-value.
Model Building
Multilevel logistic regression model was �tted to account for the clustering structure of the EDHS data. Itwas �tted to examine both individual and community level factors that associate with neonatal mortality.Variables having P-value up to 0.2 in the bi-variable analysis were selected to �t the multi-variablemultilevel model. Finally, multilevel logistic regression analysis was performed to estimate the adjustedodds ratios and those variables with P-value of <=0.05 was considered as statistically signi�cant.
Four multilevel analysis models were �tted using STATA 14. Model I (null model) was �tted withoutexplanatory variables to test random variability in the intercept and intra-class correlation coe�cient (ICC)was determined. Model II was �tted to explore the effect of community level variables, Model III was �ttedto examine the effect of individual level variables and Model IV was �tted to indicate the effects of bothindividual and community level characteristics simultaneously.
The effects of individual-level and community-level factors on neonatal mortality were reported in term ofodds ratios with 95% con�dence interval. Random effects were expressed in terms of Intra-Cluster

Page 6/24
Correlation (ICC) and proportional change Variance (PCV).
The log likelihood and Akaikie Information Criterion (AIC) of the models were estimated to assess the�tness of the model relative to the other models. Variance In�ation Factor were used to identify thepresence of multi-collinearity in the model.
ResultsCommunity level characteristics
A total weighted 7,590 live births within �ve years preceding the EDHS 2016 were included in the analysis.About 6,621 (87.23%) of the study participants were from rural and 3,130 (41.23%) of the neonates werefrom Oromia (Table 1).
Individual level characteristics
Socioeconomic and Demographic characteristics
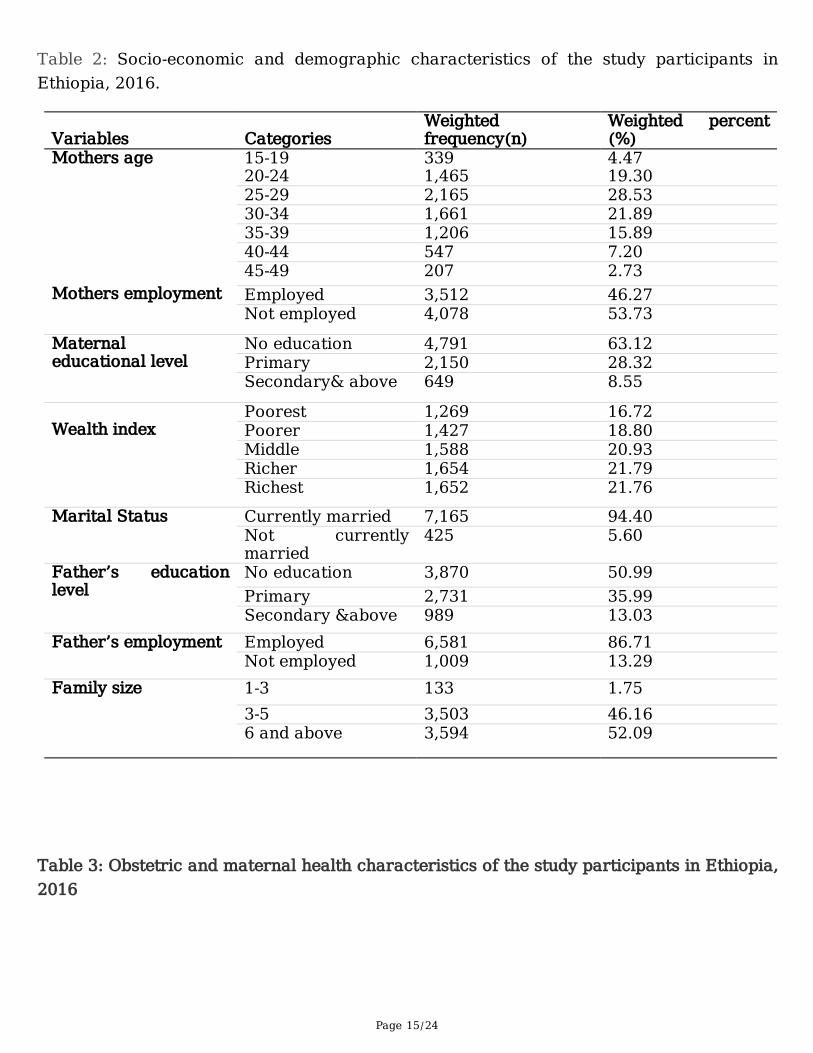
About 2,165 (28.53%) neonates were born from mothers aged 25-29 years. The mean age of the motherswas 29.25 (±6.8 SD) years. Of the mothers, 4,791(63.12%) of them have no formal education and 7,165(94.4%) were married (Table 2).
Neonatal related characteristics
Of the neonates, 3,941(51.92%) were males and 3,081(40.59%) had average birth size according to theirmother’s perception. About 6,378(84.09) neonates were initiated breast milk within one hour of birth.
Maternal health care services and obstetric characteristics
Among mothers 4,757(62.67%) had antenatal care visits during their last pregnancy, and 2,524 (33.25%)of the mothers were delivered at health facilities. Only 636 (8.36%) of the neonates had postnatal carecheckup (Table 3).
Regional neonatal mortality rate
The NMR varies across the regions of the country. The highest and the lowest NMR were observed inOromia (25 per 1000 life birth) and Adis Abeba (7.5 per 1000 life birth) respectively (Figure 1).
Spatial Analysis of Geographic Information System
The spatial autocorrelation analysis indicated that the spatial distribution of neonatal mortality was non-random. The Global Moran’s Index was 0.19 (P-value <0.001) indicates that there was signi�cantclustering of neonatal mortality (Figure 2).

Page 7/24
Hot spot (high risk) regions for neonatal mortality were observed in Amhara, west Tigray, northeast,southwest and central part of Oromia. However, Afar, Benshangul-Gumz, Gambela, DireDawa, Harari and,northeast part of Southern Nations, Nationalities and Peoples (SNNP) were identi�ed as cold spot (lowrisk) regions for neonatal mortality in Ethiopia (Figure 3).
The analysis of cluster and outliers indicated that high outlier clusters and low outlier clusters had nearlyequal occurrence. These high outliers were observed on Oromia, border of SNNP and Oromia, border ofBenshagul-Gumiz and Oromia, border of Benshagul-Gumiz and Amhara regions. However, low outlierswere found in Tigray, Amhara, Oromia, South Afar and SNNP (Figure 4).
The spatial kriging interpolation analysis was used to predicted high risk regions for neonatal mortality.Predication of high risk areas were indicated by red predictions. Southeast and northwest part of Amhara,central and northeast Oromia, Adis Abeba, Tigray and north SNNP were predicted as more risky areascompared to other regions. Whereas, Afar, Benshagul-Gumiz, west Oromia, Somali, SNNP and Gambelawere predicated as having less risk for neonatal mortality (Figure 5).
Spatial sat scan analysis
Nine most likely (primary) clusters were identi�ed and all of them were signi�cant. The primary clustersspatial window was located in central Oromia. It was centered at 7.634301 N, 39.484474 E with 80.38 kmradius, with RR of 4.61 and LLR of 21.05, at P-value < 0.001. The RR of 4.61 for clusters of spatialwindow means neonates within the spatial window had 4.61 times higher risk for death than neonatesoutside the window. In addition to this, 52 signi�cant secondary clusters were located in Benshagul-Gumiz, west Amhara and western Oromia. It was centered at 11.340042 N, 35.12673 E with 212.45 kmradius, with RR of 3.69 and LLR of 11.65, at P-value = 0.003. The RR of 3.69 for clusters spatial windowmeans neonates within the spatial window had 3.69 times higher risk for death than neonates outside thewindow (Figure 6).
Multilevel logistic regression analysis
The value ICC for Null model was 0.38 which indicates 38% of the total variance in neonatal mortality inEthiopia can be attributed to the communities in which the mothers were residing Four multi-level models(null model, model �tted with community level variables, model �tted with individual level variables andmodel �tted with community and individual level variables) were �tted in this study. Then, models werecompared by their log likelihood and AIC. Model �tted with community and individual level variables hadhighest log likeli hood and lowest AIC. This model was selected for analysis.
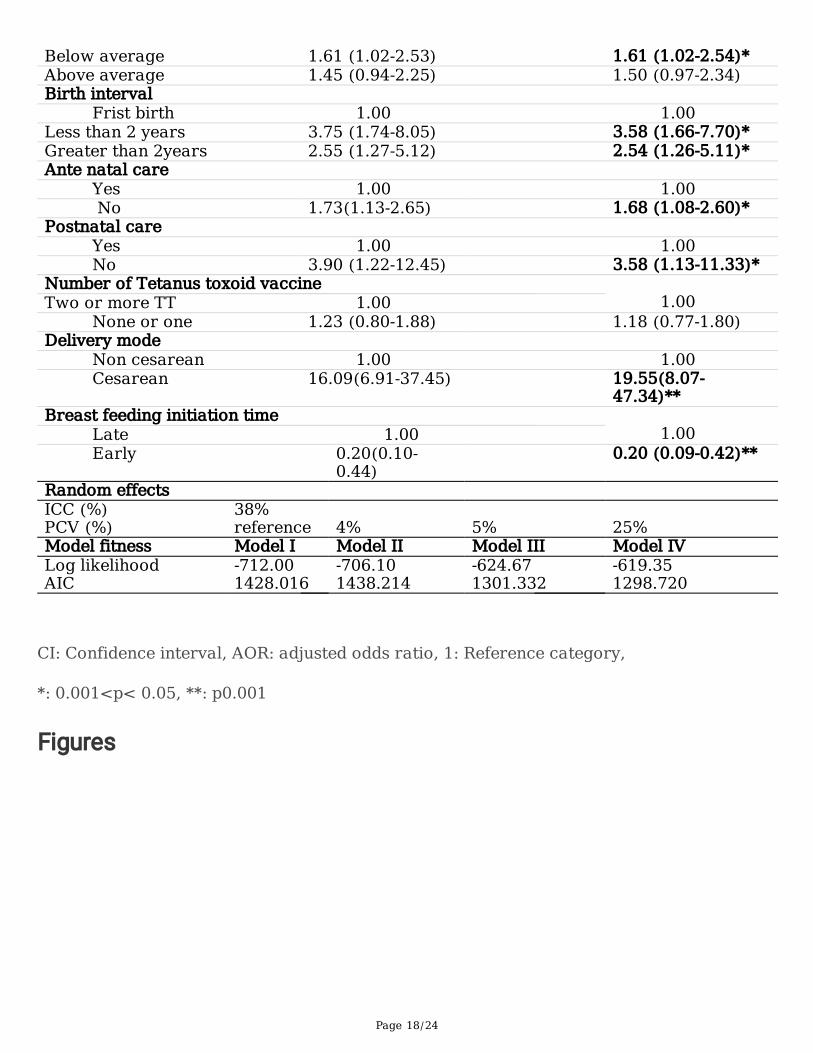
The �xed effects (measure of association) and the random intercepts for the use of neonatal mortalityare presented in Table 4. In the multi-variable multilevel logistic regression mother’s age, family size,smaller than average birth size, birth interval, sex of the neonate, breastfeeding initiation time, ANC visit,PNC visit and mode of delivery were statically signi�cant variables for neonatal mortality.

Page 8/24
DiscussionThe aim of this study was to assess spatial distribution and associated factors of neonatal mortality inEthiopia using 2016 EDHS data. The spatial analysis indicated that high risk regions for neonatalmortality were observed in northern (Amhara, west Tigray), southwest and central (northeast, southwestand central part of Oromia). In contrast, Afar, Benshangul-Gumz, Gambela, Dire Dawa, Harari andnortheast part of SNNP were identi�ed as low risk regions for neonatal mortality. The Sat scan statisticalanalysis showed that primary clusters were located in central Oromia and secondary clusters wereexisted in Benshagul-Gumiz, west Amhara and western Oromia. The probable explanation for geographicvariation in the risk of neonatal mortality is the distribution of causes of neonatal mortality in the country.A common cause of neonatal mortality in Ethiopia is low birth weight, preterm birth, neonatal sepsis,congenital and other causes. A systematic review and meta-analysis done in Ethiopia on prevalence oflow birth weight and associated factor indicated that high prevalence of low birth weight existed in theTigray, Amhara and Oromia region(11). In addition to this, these regions had high prevalence of pretermbirth (12, 13) and neonatal sepsis (14).
The odds of neonatal death among neonates born from mothers’ age 35–49 was 2.25 times more thanthat of neonates born from mothers’ age 20–34 years. This �nding is consistent with studies done inEthiopia (15, 16) and Sudan (17). The possible explanation could be due to older mothers have increasedrisk of over birth weight, gestational diabetes mellitus, gestational hypertension, postpartum hemorrhagewhich are risk factors for bad birth outcome (18–20).
This study revealed that neonates born from mothers with 3–5, and 6 and above family members were86% and 92% less likely to have neonatal mortality as compared with neonates born from mothers with1–2 family size respectively. The result supported by the study done in West Gojam (10). The possiblereasons might be due most mothers having large family members assumed to be multi-parity. Thesemulti-parity mothers had low risk of low birth weight, pregnancy and delivery complications thatdecreases neonatal death (21).
The sex of the new born signi�cantly in�uenced the occurrence of neonatal mortality.
This study indicated that male neonates were 3.45 times more likely to die within neonatal period thanfemale neonates. This �nding is similar studies done in Butajira (22), Zambia (23), Pakistan (24) andIndia (25). The possible justi�cation might be due to male neonates have increased risk for congenitalmalformation (26, 27) and more susceptible to infections disease due to immune de�ciencies (28).
Neonates born with preceding birth interval of less than 2 years and 2 years and more were 3.58 timesand 2.33 times more likely to die within neonatal period as compared with neonates born in �rst orderrespectively. This �nding is in line with previous studies done in West Gojam (10), Ethiopia (29),Nigeria(30) and Bangladesh (31). The possible reason might be due to mother who have short birth intervalincreased the risk of maternal nutritional depletion, folic acid depletion, transmission of infection andsibling competition for breastfeeding and parental resources leads to adverse neonatal outcome (32).

Page 9/24
The birth size of the neonates had associations with neonatal mortality. This study showed that the oddsof neonatal death among neonates with birth size perceived by their mothers as smaller than averagewas 1.61 times more than neonates with birth size perceived by their mother as average. This �nding issimilar with studies done Ethiopia (33) and Afghanistan (34). The possible justi�cation might be due tosmaller than average birth size neonates indicate low birth weight babies and may result from prematurebirths that increased the risk immune immaturity that predispose for infections, mental retardation,hypothermia and other complication (35).
Neonates initiated breast feeding early were lower the odds of neonatal death by 80% as compared toneonates initiated breast feeding lately. This �nding is consistent with studies done in Felege Hiwothospital (36) and India (37). The possible justi�cation might be due to the �rst liquid come out from thebreast that is called Colostrum is very important for the new-born babies to protect them from infectionsas it is rich in antibodies that leads to decrease neonatal mortality (38).
The odds of neonatal death among neonates born from mothers had no antenatal care visit wasincreased by 68% as compared to neonates born from mothers had antenatal care visit. The result is inline with studies conducted in Jimma (7), Gazi- strep (39) and India (37). This is because of attendingANC provide opportunity for screening danger signs of pregnancy complication and health workers givegood information about safe delivery, delivery complication, breast feeding and neonatal care (21, 40).
Utilization of postnatal services was related with neonatal mortality. This study revealed neonates whodid not received postnatal care were 3.58 times more likely to die within neonatal period than neonateswho received postnatal care. This �nding is supported by previous studies done in Ghana (9) and India(37). The possible justi�cation might be due to receiving postnatal care services used to identify earlydanger signs, treat neonatal disease and prevent complication that improves neonatal health (41, 42).
The odds of neonatal death among neonates born by cesarean section were 19.55 times more thanneonates born by normal. The result is consistent with studies conducted in Sudan (17) and Pakistan(43). This might be due most C/S deliveries done by emergency after labor complication and fetaldistress that increased the risk of neonatal morbidity and mortality (44).
ConclusionsHigh risk areas for neonatal mortality were found in northern, central and southwest part of the country. Incontrast, low risk areas were identi�ed in western, northwest, eastern and northeast part of the country.
Community level variables were found to be less important factors to design strategies for reducingneonatal mortality. Individual level variables like being male, having smaller than average birth size, bornfrom mothers did not attend ANC visit, had no postnatal care check-up, delivered by caesarean sectionand born from mothers age 35–49 years were factors that increase the risk of death in neonatal period.Whereas, having large birth interval, born from mothers with large family size and initiating breast feedingearly were factors that decrease the risk of neonatal death.

Page 10/24
Federal ministry of health needs give priority for northern, central and southwest part of the country thathas high risk for neonatal mortality and Improve maternal health care services coverage. Healthprofessionals give emphasis to increase ANC for pregnant mothers and giving PNC for new born, advicemothers to increase birth interval and advice mothers to initiate breasts feeding within early. Researcherscan use study as baseline to conduct a study for the reasons why northern, central and southwest part ofthe country have high neonatal mortality
List Of AbbreviationsAIC: Akaikie Information Criteria, ANC: Antenatal Care, C/S: Cesarean Section, DHS: DemographicHealth Surveys, EA: Enumeration Area, EDHS: Ethiopian Demographic and Health Survey, GIS: GeographicInformation System, ICC: Intra Class Correlation, LLR: Loglikelihood Ratio, NMR: NeonatalMortality Rate, PNC: Postnatal Care, proportional change Variance (PCV), RR: Relative Risk, SDG:Sustainable Development Goals, SNNP: Southern Nations, Nationalities and Peoples, TT: Tetanus Toxoid.
DeclarationEthics approval
Ethical clearance was obtained from the Ethical Review Board of Institute of Public Health, College ofMedicine and Health Sciences, University of Gondar. Permission letter was gotten from Measure DHSInternational Program which authorized the data-sets. All the data used in this study are publiclyavailable, aggregated secondary data with not having any personal identifying information that can belinked to particular individuals, communities, or study participants. Con�dentiality of data wasmaintained anonymously in this study.
Consent to publish
Not applicable
Competing interests
The authors declare that they have no competing interests.
Availability of data and materials
All relevant information is within the manuscript. The data upon which the results based could beaccessed on a reasonable request.
Funding
Funding was not secured for this study.
Authors’ contributions

Page 11/24
GBD conceived the study, performed data extraction and management carried out the statisticalanalysis and interpretation and wrote the draft manuscript. DFT and AML participated in the design ofthe study, revising design and analysis of the research, performed statistical analysis. All authorsapproved the �nal version of the manuscript.t
Acknowledgments
We would like to thank University of Gondar, College of Medicine and Health Sciences, Institute of PublicHealth, Department of Epidemiology and biostatistics to give this opportunity. And also, we would like tothank Measure Demographic Health Surveys authority.
Authors’ information
GBDeres (MPH). D.F. (MPH, assistant professor) is a lecturer in the Department of Epidemiology andBiostatics, Institute of Public Health, College of Medicine and Health Sciences, University of Gondar,Ethiopia. A.M (MPH) is a lecturer in the Department of Epidemiology and Biostatics, Institute of PublicHealth, College of Medicine and Health Sciences.
References1. Organization WH. Neonatal and perinatal mortality: country, regional and global estimates. 2006.
2. United Nations Inter agency Group for Child Mortality Estimation (UNIGME) .Levels & Trends in ChildMortality.Estemates developed by United Nations Inter-agency Group for Child Mortality Estimation’,United Nations Children’s Fund, New York. 2018.
3. Central satastical Agency.Ethiopia Demograghic health survey 2016. Addis Ababa, Ethiopia ,andRockville, Maryland, USA :CSA and ICF. 2016.
4. United Nations, Sustainable Development Goals.http://www.un.org/sustainabledevelopment/health/. Accessed feburary10. 2019.
5. Lawn JE, Cousens S, Zupan J, Team LNSS. 4 million neonatal deaths: when? Where? Why? Thelancet. 2005;365(9462):891-900.
�. Mengesha HG, Sahle BW. Cause of neonatal deaths in Northern Ethiopia: a prospective cohort study.BMC public health. 2017;17(1):62.
7. Debelew GT, Afework MF, Yalew AW. Determinants and causes of neonatal mortality in Jimma zone,southwest Ethiopia: a multilevel analysis of prospective follow up study. PLoS One.2014;9(9):e107184.
�. Hibstu DT, Ayele TA, Mengesha ZB. Determinants of Neonatal Mortality in Ethiopia: A Case ControlStudy, 2013. Open Access Library Journal. 2014;1(06):1.
9. Kayode GA, Ansah E, Agyepong IA, Amoakoh-Coleman M, Grobbee DE, Klipstein-Grobusch K.Individual and community determinants of neonatal mortality in Ghana: a multilevel analysis. BMCpregnancy and childbirth. 2014;14(1):165.

Page 12/24
10. Yirgu R, Molla M, Sibley L. Determinants of neonatal mortality in rural Northern Ethiopia: Apopulation based nested case control study. PloS one. 2017;12(4):e0172875.
11. Endalamaw A, Engeda EH, Ekubagewargies DT, Belay GM, Tefera MA. Low birth weight and itsassociated factors in Ethiopia: a systematic review and meta-analysis. Italian journal of pediatrics.2018;44(1):141.
12. Bekele I, Demeke T, Dugna K. Prevalence of preterm birth and its associated factors among mothersdelivered in Jimma university specialized teaching and referral hospital, Jimma Zone, OromiaRegional State, South West Ethiopia. J Women’s Health Care. 2017;6:356.
13. Teklay G, Teshale T, Tasew H, Mariye T, Berihu H, Zeru T. Risk factors of preterm birth among motherswho gave birth in public hospitals of central zone, Tigray, Ethiopia: unmatched case–control study2017/2018. BMC research notes. 2018;11(1):571.
14. Mersha A, Worku T, Shibiru S, Bante A, Molla A, Seifu G, et al. Neonatal sepsis and associated factorsamong newborns in hospitals of Wolaita Sodo Town, Southern Ethiopia. Research and Reports inNeonatology. 2019;9:1.
15. Wakgari N, Wencheko E. Risk factors of neonatal mortality in Ethiopia. Ethiopian Journal of HealthDevelopment. 2013;27(3):192-9.
1�. Yaya Y, Eide KT, Norheim OF, Lindtjørn B. Maternal and neonatal mortality in south-west Ethiopia:estimates and socio-economic inequality. PloS one. 2014;9(4):e96294.
17. Bashir AO, Ibrahim GH, Bashier IA, Adam I. Neonatal mortality in Sudan: analysis of the Sudanhousehold survey, 2010. BMC Public Health. 2013;13(1):287.
1�. Yogev Y, Melamed N, Bardin R, Tenenbaum-Gavish K, Ben-Shitrit G, Ben-Haroush A. Pregnancyoutcome at extremely advanced maternal age. American journal of obstetrics and gynecology.2010;203(6):558. e1-. e7.
19. Laopaiboon M, Lumbiganon P, Intarut N, Mori R, Ganchimeg T, Vogel J, et al. Advanced maternal ageand pregnancy outcomes: a multicountry assessment. BJOG: An International Journal of Obstetrics& Gynaecology. 2014;121:49-56.
20. Carolan M, Frankowska D. Advanced maternal age and adverse perinatal outcome: a review of theevidence. Midwifery. 2011;27(6):793-801.
21. Majoko F, Nyström L, Munjanja S, Mason E, Lindmark G. Relation of parity to pregnancy outcome ina rural community in Zimbabwe. 2004.
22. Gizaw M, Molla M, Mekonnen W. Trends and risk factors for neonatal mortality in Butajira District,South Central Ethiopia,(1987-2008): a prospective cohort study. BMC pregnancy and childbirth.2014;14(1):64.
23. Chatupa M, Mwakazanga D, Mulenga D, Siziya S. Factors associated with neonatal deaths at ArthurDavidson Children’s Hospital Ndola Zambia.
24. Nisar YB, Dibley MJ. Determinants of neonatal mortality in Pakistan: secondary analysis of PakistanDemographic and Health Survey 2006–07. BMC Public Health. 2014;14(1):663.

Page 13/24
25. Singh A, Kumar A, Kumar A. Determinants of neonatal mortality in rural India, 2007–2008. PeerJ.2013;1:e75.
2�. Sokal R, Tata LJ, Fleming KM. Sex prevalence of major congenital anomalies in the United Kingdom:A national population‐based study and international comparison meta‐analysis. Birth DefectsResearch Part A: Clinical and Molecular Teratology. 2014;100(2):79-91.
27. Tennant PW, Samarasekera SD, Pless‐Mulloli T, Rankin J. Sex differences in the prevalence ofcongenital anomalies: A population‐based study. Birth Defects Research Part A: Clinical andMolecular Teratology. 2011;91(10):894-901.
2�. Green MS. The male predominance in the incidence of infectious diseases in children: a postulatedexplanation for disparities in the literature. International Journal of Epidemiology. 1992;21(2):381-6.
29. Mekonnen Y, Tensou B, Telake DS, Dege�e T, Bekele A. Neonatal mortality in Ethiopia: trends anddeterminants. BMC public health. 2013;13(1):483.
30. Akinyemi JO, Bamgboye EA, Ayeni O. Trends in neonatal mortality in Nigeria and effects of bio-demographic and maternal characteristics. BMC pediatrics. 2015;15(1):36.
31. Kamal SM, Ashrafuzzaman M, Nasreen S. Risk factors of neonatal mortality in Bangladesh. Journalof Nepal Paediatric Society. 2012;32(1):37-46.
32. Conde‐Agudelo A, Rosas‐Bermudez A, Castaño F, Norton MH. Effects of birth spacing on maternal,perinatal, infant, and child health: a systematic review of causal mechanisms. Studies in familyplanning. 2012;43(2):93-114.
33. Kebede B, Gebeyehu A, Sharma HR, Yifru S. Prevalence and associated factors of neonatal mortalityin North Gondar Zone, Northwest Ethiopia. Ethiopian Journal of Health Development. 2012;26(2):66-71.
34. Al Kibria GM, Burrowes V, Choudhury A, Sharmeen A, Ghosh S, Mahmud A, et al. Determinants ofearly neonatal mortality in Afghanistan: an analysis of the Demographic and Health Survey 2015.Globalization and health. 2018;14(1):47.
35. Bernstein IM, Horbar JD, Badger GJ, Ohlsson A, Golan A, Network VO. Morbidity and mortality amongvery-low-birth-weight neonates with intrauterine growth restriction. American journal of obstetrics andgynecology. 2000;182(1):198-206.
3�. Tewabe T, Mehariw Y, Negatie E, Yibeltal B. Neonatal mortality in the case of Felege Hiwot referralhospital, Bahir Dar, Amhara Regional State, North West Ethiopia 2016: a one year retrospective chartreview. Italian journal of pediatrics. 2018;44(1):57.
37. Sari IP. The Determinants of Infant Mortality in Neonatal Period. Jurnal Kesehatan Masyarakat.2016;12(1).
3�. Edmond KM, Kirkwood BR, Amenga-Etego S, Owusu-Agyei S, Hurt LS. Effect of early infant feedingpractices on infection-speci�c neonatal mortality: an investigation of the causal links withobservational data from rural Ghana. The American journal of clinical nutrition. 2007;86(4):1126-31.
39. El Awour I, Abed Y, Ashour M. Determinants and risk factors of neonatal mortality in the Gaza Strip,occupied Palestinian territory: a case-control study. The Lancet. 2012;380:S25-S6.

Page 14/24
40. Vogel JP, Habib NA, Souza JP, Gülmezoglu AM, Dowswell T, Carroli G, et al. Antenatal care packageswith reduced visits and perinatal mortality: a secondary analysis of the WHO Antenatal Care Trial.Reproductive health. 2013;10(1):19.
41. Gogia S, Sachdev HS. Home visits by community health workers to prevent neonatal deaths indeveloping countries: a systematic review. Bulletin of the World Health Organization. 2010;88:658-66.
42. Baqui AH, Ahmed S, El Arifeen S, Darmstadt GL, Rosecrans AM, Mannan I, et al. Effect of timing of�rst postnatal care home visit on neonatal mortality in Bangladesh: a observational cohort study.Bmj. 2009;339:b2826.
43. Jehan I, Harris H, Salat S, Zeb A, Mobeen N, Pasha O, et al. Neonatal mortality, risk factors andcauses: a prospective population-based cohort study in urban Pakistan. Bulletin of the world HealthOrganization. 2009;87:130-8.
44. Sobhy S, Arroyo-Manzano D, Murugesu N, Karthikeyan G, Kumar V, Kaur I, et al. Maternal andperinatal mortality and complications associated with caesarean section in low-income and middle-income countries: a systematic review and meta-analysis. Lancet (London, England).2019;393(10184):1973-82.
TablesTable 1: Community level characteristics of study participants in Ethiopia, 2016
Variables Categories Weighted frequency(n) Weighed percent (%)Residence Urban 969 12.77
Rural 6,621 87.23Region Tigray 537 8.01
Afar 71 0.94Amhara 1,632 21.50Oromia 3,130 41.23Somali 269 3.57Benshangul-Gumz 81 1.06SNNP 1,601 21.09Gambela 21 0.27Harari 17 0.23Addis Ababa 198 2.61Dire Dawa 33 0.44
Page 15/24
Table 2: Socio-economic and demographic characteristics of the study participants inEthiopia, 2016.
Variables
Categories
Weightedfrequency(n)
Weighted percent(%)
Mothers age 15-19 339 4.4720-24 1,465 19.3025-29 2,165 28.5330-34 1,661 21.8935-39 1,206 15.8940-44 547 7.2045-49 207 2.73
Mothers employment Employed 3,512 46.27Not employed 4,078 53.73
Maternaleducational level
No education 4,791 63.12Primary 2,150 28.32Secondary& above 649 8.55
Wealth index
Poorest 1,269 16.72Poorer 1,427 18.80Middle 1,588 20.93Richer 1,654 21.79Richest 1,652 21.76
Marital Status Currently married 7,165 94.40Not currentlymarried
425 5.60
Father’s educationlevel
No education 3,870 50.99Primary 2,731 35.99Secondary &above 989 13.03
Father’s employment Employed 6,581 86.71Not employed 1,009 13.29
Family size 1-3 133 1.753-5 3,503 46.166 and above 3,594 52.09
Table 3: Obstetric and maternal health characteristics of the study participants in Ethiopia,2016

Page 16/24
Variables
Categories
Weightedfrequency(n)
Weighted percent(%)
ANC visit No 2,833 37.33Yes 4,757 62.67
Place of delivery Healthfacility
2,524 33.25
Home 5,066 66.75
Number of Tetanus Toxoidvaccine
None orone
3,310 43.6
Two ormore
4,280 56.4
Postnatal care visit Yes 636 8.38No 6,954 91.62
Mode of delivery
Non C/S 7,407 97.59C/S 183 2.41
Multiple births No 7,470 98.42
Yes 120 1.58
Table 4: Multi-variable multilevel logistic regression analysis of individual and communitylevel factors associated with neonatal mortality in Ethiopia, 2016

Page 17/24
Characteristics
ModelI
Model II
Model III
Model IV
Fixed effects AOR (95% CI) AOR (95%) AOR (95% CI)Residence
Urban 1.00 1.00Rural 1.78 (0.67-
3.48)2.12 (0.73-6.17)
Region Afar 1.00 1.00Tigray 1.40 (0.57-
3.48)1.68 (0.16-17.29)
Amhara 1.28 (0.52-3.14)
1.23 (0.13-11.74)
Oromia 1.30 (0.55-3.04)
1.16 (0.12-10.87)
Somali 3.06 (1.40-6.69)
2.64 (0.28-27.05)
Benshagul-Gumiz 0.84 (0.32-2.25)
0.94 (0.05-19.53)
SNNP 0.61 (0.24-1.58)
0.56 (0.06-5.61)
Gambela 1.21 (0.44-3.36)
1.52 (0.02-109.26)
Harari 1.78 (0.69-4.59)
1.25 (0.22-72.71)
Adis Abeba 0.77 (0.15-3.80)
0.77 (0.39-15.24)
Dire Dewa 1.40 (0.43-4.60)
1.62 (0.04-60.61)
Mothers age 20-34 1.00 1.0015-20 1.69 (0.63-4.51) 1.59 (0.60-4.27)35-49 2.20 (1.44-3.35) 2.25 (1.47-3.45)**
Family size 1-2 1.00 1.003-5 0.14 (0.06-0.36) 0.14 (0.06-0.36)**6 &above 0.08 (0.03-0.20) 0.08 (0.02-0.20)**
Father’s educational level No education 1.00 1.00Primary 1.20 (0.78-1.84) 1.34 (0.86-2.09)
Secondary &above 0.30 (0.11-0.82) 0.40 (0.14-1.11)Marital status Currently married 1.00 1.00Not currentlymarried
1.53 (0.78-3.02) 1.61 (0.81-3.20)
Sex Female 1.00 1.00Male 3.44 (2.27-5.20) 3.45 (2.27-5.22)**
Size of child at birth Average 1.00 1.00
Page 18/24
Below average 1.61 (1.02-2.53) 1.61 (1.02-2.54)*Above average 1.45 (0.94-2.25) 1.50 (0.97-2.34)Birth interval
Frist birth 1.00 1.00Less than 2 years 3.75 (1.74-8.05) 3.58 (1.66-7.70)*Greater than 2years 2.55 (1.27-5.12) 2.54 (1.26-5.11)*Ante natal care
Yes 1.00 1.00 No 1.73(1.13-2.65) 1.68 (1.08-2.60)*
Postnatal care Yes 1.00 1.00No 3.90 (1.22-12.45) 3.58 (1.13-11.33)*
Number of Tetanus toxoid vaccine Two or more TT 1.00 1.00
None or one 1.23 (0.80-1.88) 1.18 (0.77-1.80)Delivery mode
Non cesarean 1.00 1.00Cesarean 16.09(6.91-37.45) 19.55(8.07-
47.34)**Breast feeding initiation time
Late 1.00 1.00Early 0.20(0.10-
0.44) 0.20 (0.09-0.42)**
Random effects ICC (%) 38% PCV (%) reference 4% 5% 25%Model fitness Model I Model II Model III Model IVLog likelihood -712.00 -706.10 -624.67 -619.35AIC 1428.016 1438.214 1301.332 1298.720
CI: Confidence interval, AOR: adjusted odds ratio, 1: Reference category,
*: 0.001<p< 0.05, **: p0.001
Figures

Page 19/24
Figure 1
Regional neonatal mortality rate in Ethiopia, 2016

Page 20/24
Figure 2
Spatial autocorrelation for distribution of neonatal mortality in Ethiopia, 2016

Page 21/24
Figure 3
Hot spot and cold spot areas of neonatal mortality in Ethiopia, 2016

Page 22/24
Figure 4
clusters and outlier identi�cation of neonatal mortality in Ethiopia, 2016

Page 23/24
Figure 5
Spatial interpolation of neonatal mortality across regions in Ethiopia, 2016

Page 24/24
Figure 6
The primary and secondary clusters of neonatal mortality in Ethiopia, 2016