demand-side management for municipal...
TRANSCRIPT

DEMAND-SIDE MANAGEMENT FOR
MUNICIPAL UTILITIES: A PRACTICAL GUIDE
AND REFERENCE MANUAL
DEMAND-SIDE MANAGEMENT
FOR MUNICIPAL UTILITIES:
A PRACTICAL GUIDE AND REFERENCE MANUAL
Prepared by:
Martha Hewett, Ken Campbell Center for Energy and Environment
Minneapolis, MN
Christopher Reed Moorhead Public Service Department
Moorhead, MN
Prepared for:
Minnesota Department of Public Service St. Paul, MN
June, 1995

DEDICATION
This Manual is dedicated to Vivian Matson, Moorhead Public Service’s customer service representative. Vivian has served Moorhead Public Service customers for more than 25 years and probably has more information about our customers stored in her head than any computer hard drive could handle. She provided detailed information about our commercial and industrial customers, making this project more manageable. Vivian and other customer service representatives like her have the difficult job of receiving calls from irate customers. In most instances, after a few minutes with Vivian, the customer’s problem is solved and the two are pleasantly exchanging zucchini bread recipes. Now that’s customer service.

ACKNOWLEDGMENTS This project was made possible in part by a grant of $45,000 from the Minnesota Department of Public Service. Many people contributed to the development of this manual and the accompanying case study. We sincerely thank them for their contributions: Minnesota Department of Public Service • Cheryl Asplund, Manager Program Design and Delivery • Lois Mack, Senior Planner • Christopher Davis, Analyst Missouri Basin Municipal Power Agency • Jeff Peters Results Center • Ted Flanigan NEOS Corporation • Denise Rue Moorhead Public Service • Public Service Commissioners
• Bill Flickinger • Helen Frampton • Dave Kerssen (Secretary) • Darvin Landa (PSC Liaison to Conservation Programs Task Force) • Ken Norman (President)
• Conservation Program Task Force Members
• Otis Anderson • Greg Ballentine • Mary Davies • Steve Evert • John Fernholz • Ansel Hakanson • Shirley Lontz • Jerry VanAmburg (Chairman) • Dave Walden

• Moorhead Public Service Staff • Claudia Evert, Cashier • Cheryl Ishaug, Secretary • Barb Lodin, Administrative Assistant • Nancy Lund, Controller • Vivian Matson, Customer Services Representative • Carol Renner, Communication Director • Bill Schwandt, General Manager • Energy Interns Kevin Bengtson, Matt Bye, Nick Ethen, Janeen Maar • and the entire staff of Moorhead Public Service
Center for Energy and Environment • Jayne Bisson, Technical Secretary • Sheryl Carter, Research Analyst • Timothy Dunsworth, Statistical Analyst • Bonnie Esposito, Director of Marketing • Judy Goepfrich, Graphics Coordinator • Robert Henderson, Finance Director • Mary Sue Lobenstein, Engineering Analyst • Sheldon Strom, Executive Director • Karen Wood, Technical Secretary

TABLE OF CONTENTS Introduction OBJECTIVE I: Determine How Your Customers Use Electricity OBJECTIVE II: Determine the Value of Demand-Side Resources to the Utility OBJECTIVE III: Identify Most Promising Programs OBJECTIVE IV: Select, Design and Implement Programs APPENDIX A

Demand-Side Management for Municipal Utilities
Introduction Page 1 Center for Energy and Environment
INTRODUCTION Goal The goal of this manual is to provide a practical, step by step guide to assist municipal utilities in planning and carrying out demand-side management activities. What is demand-side management? “Demand-side management is the planning and implementation of those utility activities designed to influence customer use of electricity in ways that will produce desired changes in the utility’s load shape.”1 Demand-side management seeks cost-effective ways to balance electric supply and demand through activities aimed at the demand side, or customer side, of the meter. Demand-side management (DSM) includes not only strategic conservation, but also load management, and even strategic load growth and electrification. Chances are very good that your utility has done some DSM already! Why DSM? In 1995, as electric utilities face the prospect of deregulation, wholesale competition, and possibly even retail competition, there is a tendency to dismiss DSM as a costly frill, implemented at the behest of regulators, that competitive utilities can no longer afford. Utilities and trade organizations are dissociating themselves from the term “demand-side management” and focusing instead on “energy services” and “marketing.” Regardless of the name that it goes by, activity directed toward the customer side of the meter will continue to be an important part of utilities’ business. Many load management programs can decrease generation, transmission and distribution requirements and thereby reduce rates and provide a competitive advantage. Some utilities, including Moorhead Public Service, have power purchase contracts structured in such a way that strategic conservation programs can also reduce rates. Programs that are beneficial to customers can be strategically important to the utility even if a first analysis indicates that they will cause a small increase in rates. Why? Because customer loyalty, customer retention, and retention of market share (e.g., electric vs gas water heating) will have a positive impact on utility revenues and rates in the longer term. Finally, programs may be beneficial to the community as a whole even if they do cause an increase in rates. Municipal utilities are in a unique position which empowers and even requires them to consider the full societal impact of DSM activities, and not just the more narrow rate impact. Figure 1 identifies twenty-four benefits of energy efficiency. It is obvious from the list of benefits that DSM involves many public policy issues. It is important to involve upper management, community leaders and customers in setting policy directions for your utility’s DSM activities.
1 EPRI 1984. Demand Side Management Volume 1: Overview of Key Issues. EPRI EA/EM-3597. Palo Alto, CA: Electric Power Research Institute.
Demand-Side Management for Municipal Utilities
Page 2 Introduction Moorhead Public Service Department
Figure 1. The Wider Benefits of Energy Efficiency* Direct Economic Benefits 1. Reduces customers’ bills 2. Reduces the need for power plant construction 3. Reduces the need for transmission construction 4. Reduces the need for distribution upgrades 5. Reduces the threat of future fuel price volatility 6. Opens up opportunities to sulfur rights as a tradable commodity Indirect Economic Benefits 7. Stimulates economic development by engaging multipliers 8. Creates durable jobs which benefit the local economy 9. Increases competitiveness of local businesses and industries 10. Energy-efficient technologies reduce maintenance & equipment replacement costs 11. Many retrofits result in the “HVAC” bonus Environmental Benefits 12. Mitigates the threat of global climate change 13. Reduces emissions that cause acid rain 14. Reduces the rate of stratospheric ozone depletion 15. Reduces the threat of nuclear accidents and proliferation 16. Minimizes pollution at mines and power plants 17. Minimizes the threat of electromagnetic fields from power lines & home wiring Societal Benefits 18. Enhances national security by easing dependence on foreign energy resources 19. Increases the value of real estate in soft markets 20. Increases the comfort & quality of work spaces, which can increase productivity 21. Many electric and gas efficiency measures also save water 22. DSM programs address the regressive nature of low income people’s energy use 23. Energy-efficiency programs can make housing more affordable 24. Utility programs create market transformations with long-term results *from Flanagin, T., The 24 Benefits of Energy Efficiency, Basalt, CO: The Results Center. Reprinted by permission. Organization of this manual This manual divides the demand-side planning and implementation process into four straightforward objectives: I. Determine how your customers use electricity.
Before you can influence customer demand, you must first understand it. Objective I will help you determine how electricity is used in your service territory, both on an annual basis and during system peak periods. Specifically, what market segments do you have? What electric appliances and equipment do they have? Which segments and end uses contribute significantly to energy use and peak demand? What conservation actions have customers already taken?
II. Determine the value of demand-side resources to the utility.
How do you know whether a potential DSM activity is worthwhile? Objective II will help you understand the economic tests commonly used to determine whether DSM

Demand-Side Management for Municipal Utilities
Introduction Page 3 Center for Energy and Environment
activities are cost-effective. It will walk you through the process of determining “avoided costs” for your utility, that is, the marginal costs that can be avoided if demand or energy use is reduced. It will show you a simple process you can use to analyze the likely cost-effectiveness of different load-shaping activities for your specific situation. In addition, it will highlight qualitative factors that also need to be considered in evaluating DSM programs.
III. Identify the most promising programs. Once you understand how your customers use electricity and you know the value of DSM resources to your utility, you will have a sound, objective basis for identifying promising programs. Objective III will help you assemble a “long list” of DSM programs to consider and screen the list based on meaningful, practical criteria. It will also help you to develop more detailed information on a shorter list of promising programs.
IV. Select, design and implement programs.
The bottom line is results. Objective IV will help you to identify and think through all of the issues that need to be considered in developing and implementing a successful program.
DSM is a broad and active field of endeavor, which would be impossible to summarize in one manual. Each objective ends with a list of resources that can provide further information and guidance. How to use the manual If you want to do a rigorous analysis of DSM opportunities from A to Z, go for it! This manual provides a step-by-step road map to successful DSM. If you already have a good feeling for what you need to do, simply reading through the manual will help you make sure that all the bases are covered, and enable you to move ahead without wondering if you’ve missed something. If you need input on a certain step of the process, the manual and related references can show you where to start. Sometimes it helps to see what someone else has done. The companion case study shows how Moorhead Public Service (MPS) worked through these objectives to develop a planning framework for its future DSM activities, and to launch its first, highly successful, commercial conservation program. A word of encouragement Many aspects of successful demand-side management are really a matter of common sense. You can do it! In recent years, the literature on DSM has become increasingly complex and arcane, seeming to require teams of specialists ranging from engineers to statisticians to economists. This level of complexity may be appropriate for large utilities, where utility employees cannot be intimately familiar with their service territories and where the company must address

Demand-Side Management for Municipal Utilities
Page 4 Introduction Moorhead Public Service Department
stockholders’, intervenors’ and regulators’ sometimes conflicting demands for cost-effectiveness, aggressiveness, prudence, and proven impacts. Municipal utilities may have significant advantages in developing and implementing DSM plans. Many municipal utilities already know their customers fairly well, and understand something about how they use energy and what is important to them, so they do not require exhaustive market analyses to identify their customers’ needs. Many municipal utilities are an integral part of a small community. They do not need expensive marketing campaigns because word-of-mouth, one-on-one marketing, and community spirit are sufficient to generate participation in DSM programs. Because the utility is owned by the citizens/ratepayers and operated by the municipal government there is less need for exhaustive and complex documentation to prove that contemplated DSM activities are or are not worthwhile or that completed DSM programs achieved a specific result. Notwithstanding these advantages, municipal utilities can use better information and more thoughtful analysis to do a better job for their customers and their community. This manual will give you the tools to design a DSM plan and DSM programs that are both practical and effective.

Demand-Side Management for Municipal Utilities
Objective I Page 1 Center for Energy and Environment
OBJECTIVE I. DETERMINE HOW YOUR CUSTOMERS USE ELECTRICITY Purpose The purpose of this objective is to develop a good understanding of how electricity is used in your service territory, both on an annual basis and during the system peak, and to determine what DSM actions your customers have already taken. This will enable you to target your DSM activities toward the most important customer segments and end uses, and to identify the best DSM opportunities. Process The first step in better understanding your sales is to identify customer segments and gather information on appliance and equipment saturations within these customer segments. Some information on DSM actions can usually be gathered at the same time. In step 2, the appliance saturation data can be combined with estimates of energy use and load shapes for individual appliances to estimate the system-wide energy use and contribution to peak for each type of appliance or equipment. Step 1 Identify Customer Segments, Gather Information on Appliance Saturations and
Previous Conservation Actions Step 1.1 Identify information needs. You must first determine what information is both important and feasible to collect, either from existing sources or using methods that fit within the utility’s budget and analysis capabilities. These choices can be made based on review of previous studies by other utilities and on existing knowledge of the utility's customer characteristics. As a starting point, the information you are likely to need includes: • gross customer segments • residential customer sub-segments • commercial and industrial customer subsegments • appliance saturations • previous DSM actions/market penetrations • energy and peak demand information by appliance or end use The following discussion provides more details on what information is needed and why; methods for collecting and analyzing the data are described beginning with Step 1.2. Gross customer segments. Obviously, it is important to be able to separate the utility's customers and energy use into residential, commercial industrial and agricultural classes, since there are significant differences in the average energy use, end use distribution, and load shapes among these classes. In addition, it is important to have information on customer subclasses

Demand-Side Management for Municipal Utilities
Page 2 Objective I Moorhead Public Service Department
such as dual fuel and non-dual fuel. These data will almost always be available from the customer billing system. Residential customer sub-segments. Residential customer sub-segments typically include single-family dwellings, plexes (dwellings in 2 to 4 unit buildings), apartments (dwellings in 5+ unit buildings) and mobile homes. These sub-segments tend to have different mixes of appliances and different energy use patterns. They also differ in proportion of home ownership. Another way of segmenting residential customers is in terms of income (low income vs non-low income). It is useful to be able to segment your residential customers for several reasons. First, it will facilitate more accurate determination of appliance saturations and end uses. Second, it will enable you to develop DSM programs more appropriate to specific sub-segments and to market them more effectively. Commercial and industrial (C&I) customer sub-segments. The make-up of the commercial and industrial customer base can differ quite a bit from one utility to another. It is useful to be able to segment your commercial and industrial customers based on the type of business activity occurring at each account. This information can be used for a number of purposes, including: 1. Demand-side planning and program development. Different types of business
activities are typically associated with different energy-using equipment and energy use patterns, which in turn are amenable to different types of demand-side interventions. In addition, different types of businesses may have different economic criteria for investments. A good understanding of your C&I market will enable you to target your efforts toward those DSM services that have the greatest potential impact, improving the cost-effectiveness of your programs. In addition, much useful published data is given by sub-sector, so having your own customers classified on this basis will make it possible for you to use available data to better understand your own market. For example, the federal Commercial Building Energy Consumption Survey (CBECS, formerly NBECS), conducted every 3 years by the Energy Information Administration, provides information on energy-using equipment, building use characteristics, and energy use for buildings of different types.
2. Marketing. Once you have developed DSM programs, you can use information on the economic activity of each C&I customer to target mailings, direct marketing calls, and other marketing efforts to customers in the market segments most likely to be interested, reducing your marketing costs.
3. Supply-side planning and forecasting. Information on C&I customers by subsegments can be combined with historical billing data to more accurately project trends in demand. Forecasting for energy demand can be further refined by combining these data with broader economic forecasts by economic sub-sector that may be available from government agencies or other sources. These supply-side uses of the data are not discussed further.
You will probably want to make a choice between two rather divergent approaches to segmentation of the commercial and industrial market that are in common use. One approach is based on the Standard Industrial Classification (SIC) codes established by the Federal Office of

Demand-Side Management for Municipal Utilities
Objective I Page 3 Center for Energy and Environment
Management and Budget, while the other is based on functional codes or building type codes established by the utility. The SIC codes were developed for use in classifying establishments based on the type of economic activity in which they are engaged. Procedures for assigning codes consistent with the federal classifications are described in an OMB circular (1987). SIC codes have the advantage of being a standardized method, and they are used by many utilities, which may facilitate comparisons with other utilities or borrowing of data. They may be especially useful in generating sales forecasts based on anticipated economic trends, using economic data compiled by government agencies, industry organizations or others. However, SIC codes are not optimal for demand-side management, since the basis for assigning them is primarily economic, and they therefore do not always describe well the energy-related activities at a particular site. For example, the corporate offices and warehouses for a large retail chain would be coded as retail, even though the offices clearly would have energy uses like other office buildings, and the warehouses would have energy uses like those for other warehouses. The account for an office building owned by a developer would be coded 6510, "real-estate operators and lessors." Functional codes are more useful for demand-side management because they can be assigned based on the type of energy-using activity that occurs on the account. Like SIC codes, functional codes are used by other organizations that can be good sources of borrowed data, including the U. S. Energy Information Administration (in their Commercial Buildings Energy Survey, see EIA 1991), and the Electric Power Research Institute (EPRI) (in their COMMEND modeling program). A good review of various commercial building classification schemes is given by EPRI (1986). A comparison of SIC codes and function codes for one utility is given in appendix B of Dunsworth and Hewett (1989). Moorhead Public Service (MPS) decided to assign both SICs and functional codes to their C&I customers, since each is useful for certain purposes. The function coding scheme developed for Moorhead Public Service is described in the report, Assignment of SIC and Function Codes to Commercial and Industrial Customers for Moorhead Public Service, in Tab 1 of the case study. It is detailed enough that it can be regrouped to match either the EPRI COMMEND classifications or the EIA CBECS groupings, with a few minor exceptions. It also adds some industrial and agricultural categories, since neither CBECS nor COMMEND address these, as well as some “residential” categories, since MPS, like many utilities, considers multifamily buildings to be commercial customers. For DSM purposes, we recommend that you start with the Moorhead function code system and add or remove categories based on your need for specific segments which are important in your service territory. For example, you could add further industrial sub-categories if you have significant industrial loads in one or two key sectors, or adding further agricultural sub-categories if your service territory includes a lot of farm customers. Appliance saturations: Most DSM opportunities apply to specific types of energy-using equipment, so you will need an understanding of which types of appliances and equipment contribute the most to your system-wide energy use and peak demand, and offer the best potential

Demand-Side Management for Municipal Utilities
Page 4 Objective I Moorhead Public Service Department
for demand-side management. Deciding which appliances you need saturation data for requires preliminary estimates of the following: • which appliances use the most energy and/or contribute the most to peak demand on a per
customer basis, • which of these are likely to have a significant market penetration in your area, and in turn • which of these are likely to have a market penetration different enough from that in other
areas that you cannot simply borrow saturation estimates from other studies. To help you evaluate these factors, data on appliance saturations, energy use and peak demand from various utilities are compiled in the manual. In addition, data for Moorhead Public Service are given in the case study. These data should be reviewed in the light of common-sense understanding of your own service territory. Space heating, space cooling and water heating are three end uses which deserve particular scrutiny for two reasons. First, they consume large amounts of energy and/or contribute significantly to system peaks. Second, the saturations of electric appliances as opposed to appliances using other fuels and the saturations of various types of electric appliances for these end uses can differ significantly by such factors as climate, availability and relative price of other fuels, and income levels in the service territory. A survey may well be justified to gather good saturation data on these appliances alone. Saturations of other appliances, such as second refrigerators or freezers, may have smaller but important differences from one service territory to another. The saturation of various types of industrial equipment can vary significantly depending on the nature of the industrial base, so any analysis should include careful identification of major industrial loads. It is important to realize that while information gathered by site visits is highly accurate, information supplied by respondents to mail or telephone surveys may not be. Not all respondents know, for example, whether their water heater, space heating equipment, or even air conditioning is electric or uses some other fuel (see, for example, Hewett et al. 1987). Respondents may confuse humidifiers and dehumidifiers. Enough commercial customers will be unable to provide accurate information on the type of heating or cooling system they have (e.g., boiler, rooftop heat/cool package, unit heaters) that data gathered through a mail or phone survey must be viewed with some skepticism. One way to check the accuracy of responses is to site visit a subset of those interviewed by mail or phone. Another, less accurate, alternative is to check billing data to see if use for these customers is in the expected range. The lowest cost alternative is to rely on your knowledge of your service territory to check the plausibility of survey results. Shortcuts: In the residential and commercial sectors, it may be adequate to rely on estimates based on information from other utilities for saturations of most appliances, and concentrate on heating, cooling and water heating. The industrial sectors, if important in your service territory, may still require detailed saturation data.

Demand-Side Management for Municipal Utilities
Objective I Page 5 Center for Energy and Environment
Previous customer activities to improve efficiency: In planning DSM programs it is helpful to have as much information as possible about the current market penetrations of various energy-efficient technologies. It would be a waste of staff resources to develop a residential insulation program, for example, and then discover that the vast majority of houses in your service territory had already been insulated. The DSM measures important to find out about are those that: 1. have significant potential to reduce energy use or peak demand: The measure must
significantly affect a large end use that has a high saturation. AND 2. have an intermediate market penetration. It isn't necessary to ask customers if they have
implemented technologies so new that very few will have used them, or so standard that all but a few can be expected to have them, as long as you're sure your assumptions about this are correct.
Step 1.2 Select data collection methods and plan your approach to maximize response
rates. Step 1 will allow you to identify what information you already have, what information you need to obtain for your own service territory, and what information you are willing to infer based on information from other sources. Once you have identified your information needs, you can decide on the method of data collection and plan strategies that will give you a high response rate to assure reliable results. Choosing a data collection method: Cost, response rates, and data quality are three key factors to consider in selecting the method of data collection. The primary methods available are site visits combined with in-person interviews, telephone interviews, and mail surveys. The "best" method depends on numerous factors. Berdie et al. (1986) give an excellent review of the considerations. For the types of information needed here, site visits by qualified personnel will almost always give the highest quality information and highest response rates. Site visits also allow for the most detailed data collection, being limited only by the technical abilities of the survey staff. But site visits also are the most expensive approach, and for most small municipal utilities, the cost of visiting a representative sample of customers is prohibitive. If there are a few large customers who account for a large proportion of your total sales, the high cost of site visits may well be justified for those accounts, not only to assure that they are included and that their data is accurate, but also to build customer relations. The Moorhead project, for example, conducted site visits for the ten largest commercial customers, who account for 64 percent of C&I energy sold and 38 percent of total energy sold. More commonly, information will be gathered through mail or telephone interviews and will rely on what customers know about their equipment and appliances. The conventional wisdom is that mail surveys are cheaper than telephone interviews, but achieve poorer response rates. Since non-response bias can completely undermine the validity of a survey (as discussed under “Maximizing response rates” below), this is a significant drawback. However, it is entirely possible to achieve high response rates with mail surveys, if extensive follow-up is done, though

Demand-Side Management for Municipal Utilities
Page 6 Objective I Moorhead Public Service Department
this can increase the cost so that it is more comparable to that of telephone interviews (Birdie et al. 1986). Municipal utilities have an advantage here. Since they are often small enough and local enough to avoid being viewed by respondents as impersonal institutions, they may be able to achieve good response rates with limited follow-up. MPS achieved an 80 percent response rate on their residential mail survey using incentives (chance to win one of six $50 credit on electric bill) and two follow-up letters and a 76 percent response rate on their commercial and industrial mail survey using limited follow-up and no incentives. Telephone interviews may achieve better data quality if they help you make sure that the most informed person completes the survey (e.g., in the case of commercial customers where any of a number of people might complete a mail survey), while mail surveys may achieve better data quality if they give people more time to find information they don't have readily at hand (e.g., in the case of a homeowner who needs to check with another household member as to whether the walls have been insulated). You may want to talk with a survey firm or consult books such as Berdie et al. before making a final decision. Some information will definitely be less accurate if collected by mail or phone than if collected through a site visit. For example, a “high efficiency air conditioner,” is likely to mean widely different things to different people and the actual EER is likely to be known by very few respondents, so that the saturation of high efficiency air conditioners will be impossible to determine accurately by phone or mail. Other information, such as presence of a second refrigerator, can be answered accurately by all respondents. Some information, such as presence of attic or wall insulation, is in a gray area such that it is of value if collected, but its reliability must be viewed with caution. As with appliance saturations, the responses can be checked through site visits or subjective "feel" for the service territory. Compilations of information from previous energy audits may serve as a useful check on survey results, but it is important to remember that audit recipients are self-selected and can be quite different from the general population. A final option to consider is that some information may be available from staff. For example, Moorhead Public Service had a long-standing employee who was extremely familiar with the service territory and customers. A decision was made to have this employee assign SIC and function codes to all commercial customers, separate from the mail survey of a sample of customers. MPS planned to make telephone calls to assign codes to questionable cases, but this proved unnecessary. One very important advantage of this approach was that it shortened and simplified the C&I questionnaire considerably. If MPS had sent an explanation of the difference between the SIC and function codes and a list of 86 two-digit SIC codes and 28 function codes for respondents to choose from, along with examples for each code to help people decide how to categorize their business, it likely would have discouraged many in the sample from responding, and results would have been subject to error due to misunderstanding of the coding schemes. Another key advantage was that MPS was able to assign SIC and function codes to all customers in a systematic way at the same time, and not just to the survey sample. This will give MPS a valuable tool for future planning, marketing, and forecasting activities. If someone is available who really knows most of the C&I customers well, and is able to understand the nuances of the coding, this approach has a lot to recommend it.

Demand-Side Management for Municipal Utilities
Objective I Page 7 Center for Energy and Environment
Maximizing response rates: Sampling bias and non-response bias are terms that you may not be familiar with, but they are important concepts to grasp because they will determine whether your survey results are representative, or are not worth the paper they're printed on. Sampling bias, which is discussed in Step 3, is normally given a lot more attention because it is easier to avoid. Non-response bias, which is discussed below, is typically downplayed by many survey research consultants because avoiding it requires commitment and effort and increases costs. As described by Berdie et al., "in most studies, the sample chosen for the study has been selected randomly, and is, therefore, [if large enough -- see Step 3] representative of the entire population. Hence, if responses are obtained from all people in the sample, the resulting data will accurately reflect ... the population. However, if only a small percentage of those in the sample respond, there is no certainty that the results represent the population." If you do not undertake the follow-up necessary to achieve a high response rate, the likelihood of non-response bias is great. Consider the impact, for example, if the residential non-respondents are those whose bills are smaller, and who therefore are less interested in energy, or if the commercial non-respondents are the small, one-person operations who are spread too thin to complete the questionnaire. The conclusions you reach by extrapolating to the population from those who do respond will not be correct. There are no hard and fast rules about what response rate is "high enough". However, we would recommend that a 70 percent response rate is the minimum you should consider acceptable, with a goal of at least 80 percent more desirable. Response rates exceeding 90 percent can definitely be achieved if you put the effort into it (Berdie et al. 1986). The response rate should be calculated as:
response rate = number of respondents/(original sample minus those who turn out not to be in the population of interest)
Those not in the population of interest would include, for example, buildings that have been demolished. Those who are simply hard to reach or not willing to respond are still in the population of interest. A number of strategies can be used to increase response rates. The suggestions given in the appendix to Objective I are based on CEE’s experience and on Berdie et al. Van Liere et al. also provide information on methods used to increase response rates in a survey of commercial customers done for Northern States Power Company-Wisconsin. Step 1.3 Determine sampling frame, required sample size, and sampling strategy, and
select sample. The "sampling frame:" Who are you talking to? In choosing a sample, the first step is to define the population. While this sounds simple, it isn't necessarily so. Definition of the population deserves careful consideration at the outset, so that later analyses are as useful as possible. To get the most out of your data, you will need to be able to link customer

Demand-Side Management for Municipal Utilities
Page 8 Objective I Moorhead Public Service Department
characteristics and appliance saturations with energy use data and make projections to your entire customer base. For a residential survey, what is a "customer"? At first it would seem that a customer and an account are the same thing. But what if some customers have two or more accounts, for example, a primary account and a second meter for electric heat? If the population is defined in terms of accounts, it will be impossible for the customer to associate such factors as household size or conservation measures with a particular one of his two accounts, and it may be difficult for him or her to associate specific appliances with specific accounts. In addition, it will be difficult for you to use these responses to extrapolate from account level data to your customer base as a whole without double-counting. For commercial customers, defining the population can be even more difficult. In addition to separate utility meters for primary uses and peak-interruptible uses, commercial customers may have multiple meters at a site due to the sheer size of the load, or because they have grown and occupy what were originally two or more separate business areas within a building. Often these customers have no idea what physical area or end-use loads within their business are actually served by each account. They will also be unable to meaningfully associate such items as "number of employees" with a specific meter or account. If you extrapolate from these responses to all accounts, you are likely to have problems of double-counting that will make your results meaningless. In addition, some customers have more than one location in the service territory. Does a business with four locations constitute one member of the population or four? Questions of this sort must be answered before drawing the sample. We recommend that you define the population in terms of location. For a residential customer, this will simply be their house. For a commercial customer, this will be all the accounts belonging to the business at a given location, whether they are within one building or in multiple buildings at the same general location. Each location of a business having more than one location would be counted as a separate member of the population. (See Van Liere et al. 1987, Public Service Company of Colorado, 1987, for examples of use of this method). Moorhead Public Service defined its residential population by dwelling unit, which also correlated with accounts, since even for houses with dual heat, both meters are included on a single account. Small commercial customers were defined by business location. However, the 10 largest commercial customers were defined by commercial enterprise. For example, the Moorhead Public Schools were treated as a single customer, even though they are scattered over several locations. Because Moorhead Public Service relates to these customers as single entities, and because they are such an important load to MPS, they wanted to treat them as single entities for analysis purposes. This different definition of customer groups shouldn't create a problem as long as it is remembered throughout the course of the analysis. Once you have defined the population, it is important that you communicate clearly to survey recipients how you have defined it, so that they will understand what accounts and what addresses to include in responding. You also will need to remember the definition you chose

Demand-Side Management for Municipal Utilities
Objective I Page 9 Center for Energy and Environment
when you calculate the required sample size, pull the sample, determine total energy use per respondent, and make extrapolations to your entire customer base. Sample Size: How many responses do you need? The number of responses required depends on the statistical reliability you need for your results. Obviously, if you could afford to survey the entire customer base (and could get a perfect 100% response rate), your results would be perfectly representative of your service territory. To consider an extreme alternative, if you decided to interview only one customer, the results would not be very representative and would depend a lot on which customer you happened to choose. Deciding on the right number of responses between one and everybody is computed using statistical methods. Normally, a utility conducting a study will want to have a 90 to 95 percent confidence of being within + 5 or 10 percent of the true population values. As a first approximation, Table I.1 can be used to determine the raw sample size required to give the desired confidence and precision (confidence interval, or CI) for categorical (yes/no or multiple choice) questions.
Table I.1. Raw sample sizes required for various population sizes, degrees of confidence, and levels of precision.
Population 90% Conf 95% Conf 90% Conf 95% Conf
N 10% CI 10%CI 5% CI 5% CI 300 55 73 142 168 400 58 77 161 196 500 60 81 176 217
1,000 63 88 213 278 10,000 67 95 263 370
It is important to realize that the specified precision and confidence will only be obtained for the overall sample, so you must typically either accept reduced precision in subsets of the sample (e.g. for information about insulation levels in electrically heated homes, as opposed to all homes, or appliance saturations in single family homes, as opposed to all homes) or else go to a larger and/or differently designed sample to achieve the subset precision you want (see the discussion of sampling strategies below). Since the study will very likely involve a mixture of questions with categorical responses and questions with numerical responses, it may also be important to assure a certain level of precision in measuring the items having numerical responses, either in absolute terms or as a percentage of the mean observed value. Quantitative items likely to be included are annual energy consumption, gross building area, number of employees, etc. Details on calculation of sample sizes for numerical variables, and for categorical variables for other population sizes, are given in the Appendix A. Once you calculate the raw sample size, i.e., the number of responses you need, you will have to determine how large a sample to actually draw, to take into account the estimated non-responses.

Demand-Side Management for Municipal Utilities
Page 10 Objective I Moorhead Public Service Department
The formula is: adjusted sample size = number of responses required/anticipated response rate = raw sample size/anticipated response rate Sampling Strategy: Before you can actually select a sample, you need the records for your entire customer base to be grouped in a manner consistent with the way you have defined the population. You may have to do this manually. For example, MPS had to do quite a bit of manual work to group its commercial accounts into "locations," which enabled them both to get a count of locations and to select a sample of locations. Data on company name, account number, billing address and service address were printed out for each account on a single line, and the list was studied to identify accounts having the same service address. Initially, any accounts having the same service address were grouped into one "location", regardless of whether the company name matched, unless the project manager knew for certain that the two (or more ) businesses were not the same entity. This initial list was reviewed with another experienced staff member, and a number of accounts originally grouped as one "location" were split. In addition, a number of accounts not having the same service addresses were combined. These were cases with multiple accounts at the same location, but with a different street number or street name, such as those for businesses occupying a corner lot, with meters on both streets. The total number of locations in the population was then counted, the required sample size computed, and a sample of every nth location drawn from the list using a random starting point. As another example, though each residential customer on Moorhead Public Service's system has only one account, those with dual heat or radio-controlled central air conditioners have two meters. When MPS tried to use a computerized method to draw a sample of customers, they ended up with a sample of meters instead. The problem was diagnosed because choosing every twenty-second case, which was supposed to produce a sample of about 490, produced a sample of over 600. It ended up that a sample of accounts could only be drawn by printing out all of the accounts and choosing every 22nd from a random start by hand. Another item to consider is whether you will use an "equal probability" sample or a "stratified" sample. This is another seemingly arcane technical decision that has a lot of practical significance. An equal probability sample uses random or quasi-random sampling techniques that give every member of the population (e.g., every "location") an equal chance of being included. A stratified sample is used when you want to make sure that certain subgroups are adequately represented. For example, you may want to stratify C&I customers by size. Many utilities have a relatively small number of large C&I customers that account for a disproportionate share of sales. In an equal probability random sample, only one or two of these large customers might be included. This is adequate to statistically represent the population in terms of business locations, but it isn't really adequate to statistically represent your C&I customers on a sales-weighted basis. Therefore, you may wish to sample more heavily from larger customers, or even include all of the very large customers. You could also divide your C&I customers into more than two strata (e.g., large, medium and small customers). If you draw a stratified sample, you will need to reweight the strata during analysis to correctly represent the

Demand-Side Management for Municipal Utilities
Objective I Page 11 Center for Energy and Environment
population as a whole. Another example of a situation in which stratification might be useful is if you have a small but significant subpopulation of residential electric heat customers. Suppose, for example, that these customers are only about 15 percent of your total residential customers, but you are thinking of targeting an insulation program to them. There might not be enough of them in an equal probability sample to allow you to analyze their present insulation levels accurately. In this case, you might decide to sample more heavily from electric space heat customers. Again, you would need to do some reweighting for analyses of the entire residential population. There are a variety of ways to draw a random sample. Often, the easiest is to use a table of random numbers or a random number generator to choose the starting point, and then select every nth member of the population from a complete list, where the value of n is the ratio of the total population to the required adjusted sample size. This method is generally satisfactory unless there is some non-random feature in the list you are working from. If there is some problematical non-random feature in the population list, then the entire sample can be drawn using a random number generator or random number table. Step 1.4 Develop survey instrument(s). The first step in developing the survey instrument is to make a list of what you want to know. Consult the information needs you identified in Step 1.1. Keeping in mind the data collection method (mail, phone, face to face) that you have chose in Step 1.2, consider how many questions you can realistically ask without "wearing out your welcome" with survey recipients. Carefully consider what questions respondents can actually answer with a reliable degree of accuracy. You may want to double-check your thoughts on this. It may be that fewer people than you realize know the square footage of their home or the age of their refrigerator, know whether their office air-conditioning comes from roof-top units or chillers, or know if their walls have been insulated. Also consider how much data you can realistically analyze, since analysis of survey data is time-consuming and can be expensive. Resist the temptation to view the survey as a one-time opportunity to ask everything you ever wanted to know from customers. Especially be wary of attempts to piggyback questions about satisfaction with service onto a study of this type. Respondents will be reluctant to answer such questions truthfully when they know they can be identified through your code number, and you can end up with both meaningless data and a lower-than-anticipated response rate. A unique issue in the C&I survey design is that different sub-sectors have different types of energy-using equipment. A questionnaire designed to cover all sub-sectors may be very detailed, and may be unnecessarily confusing or overwhelming to respondents with less equipment. One way around this is to develop a modular survey. Both Northern States Power (NSP)-Minnesota and NSP-Wisconsin have used this approach. They used a pre-screening phone call to determine which type of survey instrument each customer received. Customers with commercial cooking or refrigeration equipment received one version, those with industrial equipment received another, and the third group received the most simple survey (Van Liere et al. 1987). This approach allows for the collection of detailed information from those customers to which particular questions apply without annoying or overwhelming those for whom these questions are

Demand-Side Management for Municipal Utilities
Page 12 Objective I Moorhead Public Service Department
irrelevant. MPS used the same survey for all commercial customers, but kept the length more moderate. The actual wording of survey questions is critical in obtaining reliable, accurate information. The wording will depend in part on whether the survey will be administered by mail or phone or in person. The format of the questionnaire can also affect the response rate, response quality, and ease of data entry. Developing good questionnaires is not as easy as it seems, and as a general rule, it is worthwhile to hire an experienced consultant to help you design survey instruments. Some items to consider in designing survey questions are: 1. Provide instructions (e.g., "circle one number"). 2. Make the questions completely unambiguous, so that they will be interpreted the same
way by all respondents. 3. Use vocabulary that is appropriate to the audience. 4. Avoid biased questions that seem to call for a particular response. 5. Consider how the survey will be administered. Some questions are easy to understand in
writing, but difficult to understand when read over the phone, while for other questions, the reverse is true.
6. Whenever possible, ask multiple choice or yes/no questions, rather than allowing the respondent to fill in the blank. Open-ended questions frequently elicit responses that are off the subject you intended to address and/or are difficult to code for statistical analysis.
7. Provide for every possible answer, including "other", with a space for a written response, where necessary. Provide a "don't know" option any time the respondent really may not know the answer. Provide an option for “none” where appropriate, so you can distinguish true zeros from non-responses.
8. When providing multiple choice options, think carefully about how they are constructed. For example, when setting up a question about income, you may want the breaks between categories to correspond to poverty levels for various household sizes, if part of your goal is to determine how many low income customers you have and how their needs differ from the general population.
9. Plan your analysis in detail ahead of time. This is an excellent way to identify ambiguities and data gaps.
10. Pre-test the survey instrument with a small number of respondents to identify any questions that consistently cause problems.
For further information about questionnaire design, including important format issues, see Berdie et al. Survey instruments used by Moorhead Public Service are shown in Tab 1 of the case study.
Demand-Side Management for Municipal Utilities
Objective I Page 13 Center for Energy and Environment
Step 1.5 Implement survey(s), track responses, conduct follow-up. For mail surveys, you will need to track the number of responses received each day and send follow-up letters when the response rate starts to drop off significantly. Typically, the questionnaires are assigned a code number keyed to a list of recipients, so that follow-up mailings are sent only to non-respondents. For surveys of this type, the code number also allows you to match site characteristics with electrical use data. It is wise to explain the code number in your cover letter, so that recipients do not get the impression that you are trying to “put one over on them.” Step 1.6 Clean, code, enter and analyze data. Survey responses must be cleaned and coded before they can be entered. Examples include • checking the "other" responses to see if they can be recoded as one of the standard choices, • checking for reasonableness and recoding impossible responses (e.g., a business that reports
it is open 740 hours per week) as “missing” (i.e., no useable response) or calling the respondent back to get a correct answer, and
• coding as “missing” multiple responses to "circle one number" questions, such as the approximate size of the heated living area.
A standard procedures used by many survey firms to guard against errors in data entry is to enter all data twice, with any discrepancies between the two rounds of data entry checked by referring back to the hard copy of the questionnaire. We very strongly recommend this strategy or an equivalent. It is highly advisable to run and review basic frequencies and statistics of all variables before conducting any more sophisticated analyses. The review will identify problematic responses missed in coding (e.g., a business with a reported floor area of 24 square feet), that may need to be corrected by checking back to the original survey or even recontacting the respondent. Leaving such outliers in your data set will lead to meaningless average values as well as incorrect results from more detailed analyses such as regressions. Survey responses may need to be merged with data from other sources, such as monthly, seasonal or annual energy use data from the billing system, or SIC and function codes assigned by staff. A detailed description of statistical analysis methods is beyond the scope of this manual. Use of a qualified consultant is recommended. In addition, use of a statistical package designed for analysis of this type, such as SPSS (Statistical Package for the Social Sciences ) or SAS is strongly recommended. Doing analysis of this type using something like a spreadsheet tool can rapidly become exceedingly time-consuming, as the data may need to be sorted and subsets analyzed in a large number of ways. The possibilities for error are great. Additional points to consider when analyzing the survey data are: • If a stratified sample was drawn, the sample must be reweighted before analysis of the
overall population can be done.

Demand-Side Management for Municipal Utilities
Page 14 Objective I Moorhead Public Service Department
• It will probably be necessary to do two-way and three-way analyses of the data to get meaningful results. For example, you may want to examine insulation levels separately for electrically heated and non-electrically heated customers. You may want to determine appliance saturations separately for single family homes and apartments. Major appliances tend to have different annual energy use levels in different types of dwellings, and information by dwelling type can be used in estimating system-wide energy use by end use in objective 2.
• You may want to do area-weighted analyses of responses to the C&I survey such as appliance saturations. For example, it may be as useful to know that the area-weighted proportion of buildings cooled by chillers is 50 percent as it is to know that the unweighted proportion of buildings cooled by chillers is 10 percent.
The analyses done for the MPS residential and C&I surveys are listed in Tab 1 of the case study in the sections on Residential Survey Materials and Commercial Survey Materials, and provide an example of the level of analysis that is possible to make full use of a short survey of the type MPS conducted. Step 2 Determine Breakdown of Sales by Customer Subsegments and End Use. Breaking down sales by end use requires a somewhat different process for residential customers than for commercial and industrial customers. The total contribution of a particular end use to residential sales is typically determined from the product of the number of customers, the saturation or prevalence of the end use/appliance among those customers, and the estimated average use of the appliance per customer, when it is present. The contribution to peak demand is estimated by combining the energy use for each end use with estimates of the load factor (annual average demand/peak-coincident demand) for that end use. It is customary to analyze single family dwellings (and similar dwellings such as plexes, town homes and mobile homes) separately from apartments in buildings of five or more units, since the average energy use of most appliances is lower in apartments than it is in single family homes. Commercial and industrial sales are usually first divided by functional code groups. This information is very valuable in itself, as it shows you which types of buildings or business activities are the most important contributors to system sales. The distribution of sales by function code can be very different from the distribution of customers by function code. End use estimates for the C&I sector are then calculated within functional code groups. For each group, the contribution of a particular end use to C&I sales is determined from the product of the floor stock (total floor area) in the function code group, the area-weighted floor-space share (or saturation) of the end use, and the end use intensity (EUI) in kWh per unit area. The contribution to peak demand is then estimated by combining the energy use for each end use with estimates of the load factor (annual average demand/peak-coincident demand) for that end use. To be of any value, this analysis requires estimates of floor stock, floor-space shares for a dozen or more function code groups, as well as end use intensities for eight or ten end uses for each function

Demand-Side Management for Municipal Utilities
Objective I Page 15 Center for Energy and Environment
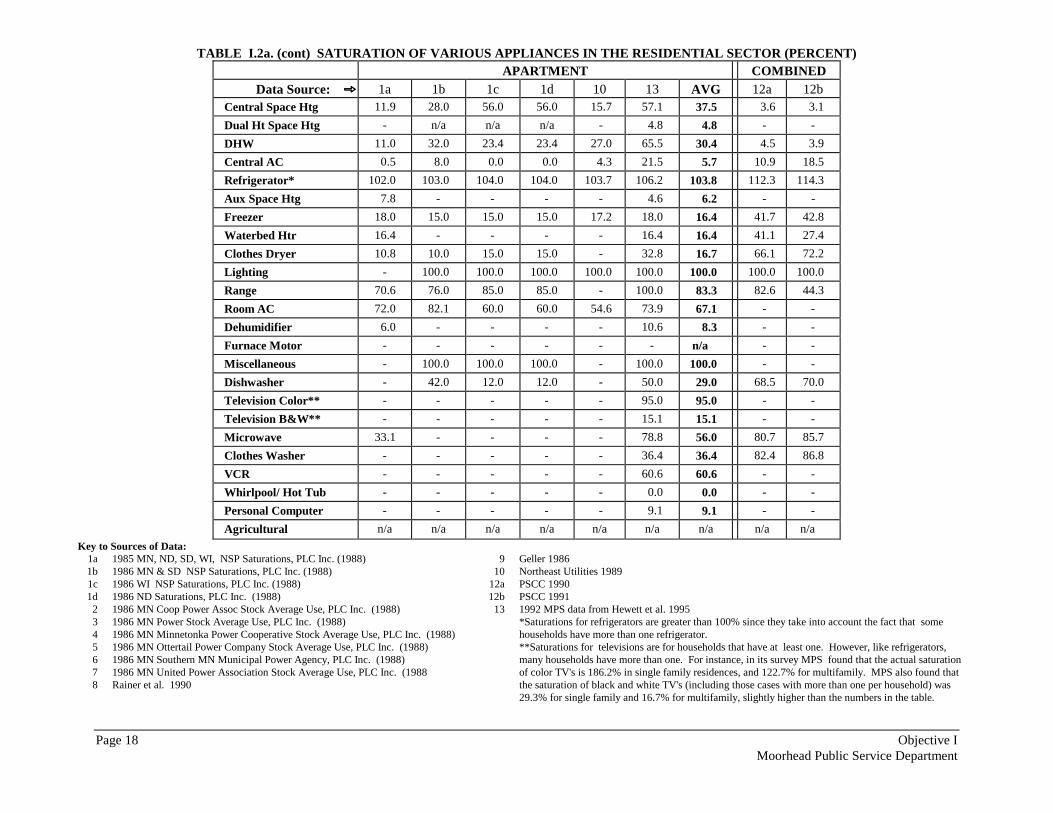
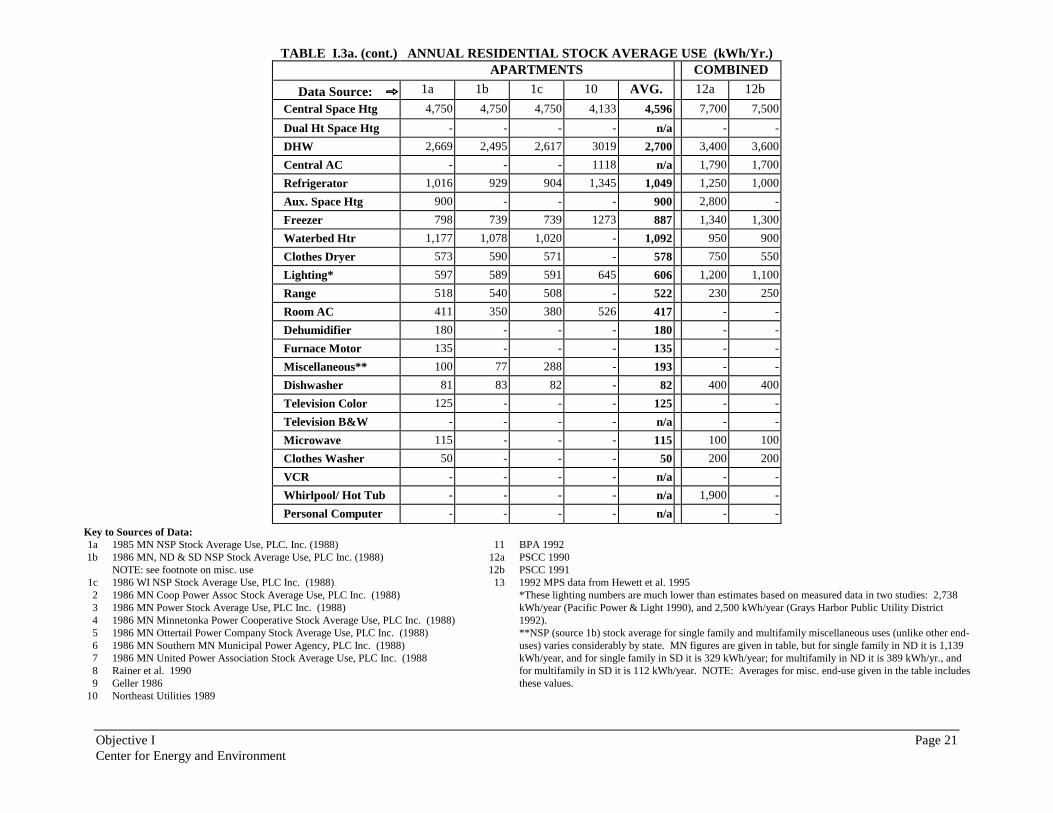
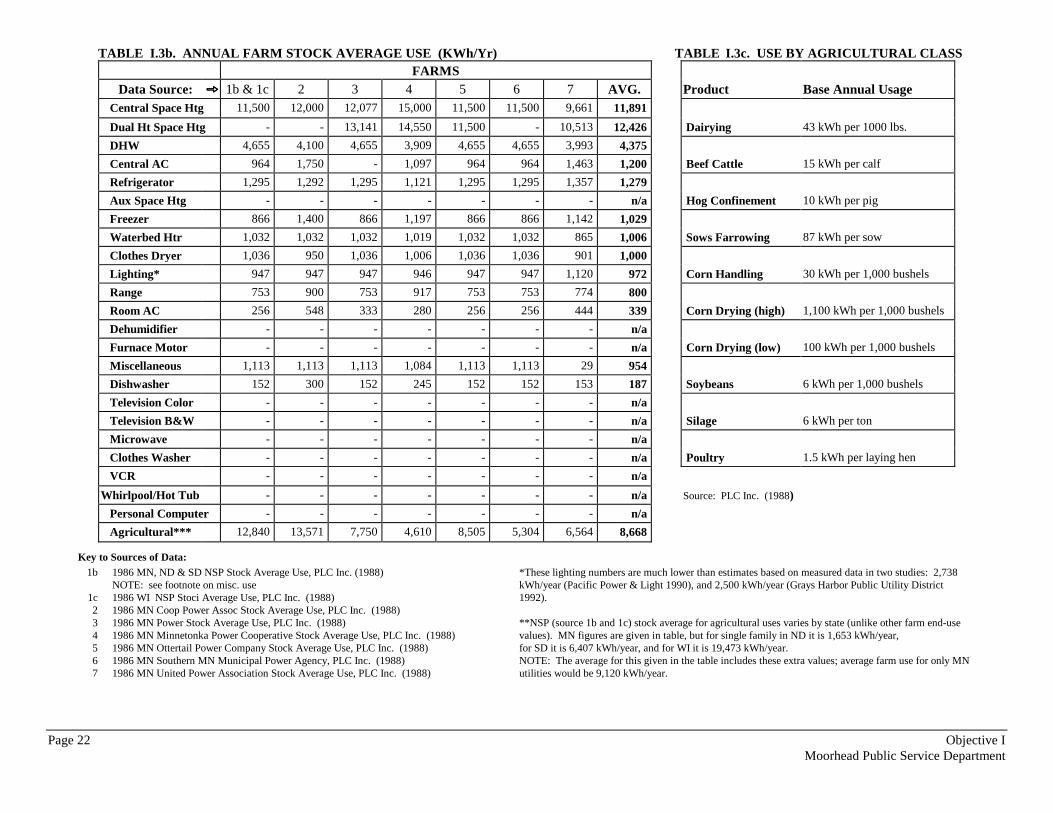
code group. However, this level of effort is usually impractical for small municipal utilities, and the discussion below assumes that you will borrow commercial and industrial end use estimates from other sources. The estimates of residential and C&I end use energy consumption and peak demand generated using the methods described above must be totaled and reconciled against sales. Generally, this is done by making judgmental corrections until reasonable agreement is achieved. Because the residential and commercial methodologies are somewhat different, Step 2 is broken into two separate sections, to allow you to read through the complete process for these two major sectors separately. Step 2.1 Determine the number of single family and multifamily customers. You should already have a count of the total number of residential customers from Step 1.3. It is critical that a “customer” be defined for energy use analysis in the same way as it was defined for sampling and for collecting survey data. The proportion of customers living in single family and multifamily dwellings could be determined from survey results. However, apartment dwellers often have a lower response rate than occupants of single family homes (see Moorhead case study), so unless your overall response rate was very high, your survey results may be biased if you use this approach. An alternative is to use Census data to determine the proportion of single family and multifamily dwellings, if your service territory is essentially congruent with a geographic area for which separate Census results are available. The Census data must be adjusted by eliminating the number of dwellings in master-metered apartment buildings, if you define these buildings as commercial customers. Step 2.2 Determine the saturations of key end uses or appliances. Saturations of key appliances can be estimated by completing your own survey or by using data available from similar utilities, as described under Step 1. Saturation data from other utilities are shown in Tables I.2.a and I.2.b for the residential and farm sectors. Step 2.3 Determine the stock average use for key end uses. Large utilities expend considerable resources in determining stock average use. They may meter loads in a large number of homes, or they may do calculations based on extensive data from manufacturers on the average energy use of products manufactured in each of the last 10 to 20 years ("vintage use"), product sales, average product lifetimes, estimated retirement rates, and so on. This level of effort is often beyond the financial capabilities of small utilities. Fortunately, the stock average use of most appliances does not vary much from one utility to another, so that for most appliances, values can be borrowed from published sources. Tables I.3.a, I.3.b and I.3.c present stock average use estimates for the residential and farm sectors for a number of utilities.

Demand-Side Management for Municipal Utilities
Page 16 Objective I Moorhead Public Service Department
It may be worthwhile to estimate energy use for electric heating and central cooling for your own utility, since these end uses are the most sensitive to variations in climate, construction quality, and levels of weatherization. A method of doing this for heating use is described in the appendix to this objective. An analogous method could be used for cooling, although in northern climates it is more difficult to accurately adjust cooling energy use estimates from a particular year to come up with estimates for a normal weather year, since cooling use is much more susceptible to behavioral variation. Step 2.4 Calculate initial estimates of residential sales and peak demand by end use for
the test year. Sales are the product of the number of customers, the saturation, and the average use. For the actual data year, the calculations should use estimates of heating and cooling use for the weather conditions in the data year (either from direct analysis of billing data, as described in Step 2.3, or from approximate weather-adjustment of published stock average use estimates). Large utilities estimate contributions to peak demand either through metered load research or through the use of simulation models such as EPRI’s RELOAD model. Again, this level of effort is beyond the financial capabilities of small utilities. Approximate contributions to peak demand can be calculated based on the calculated energy use and on estimates of load factor. Unfortunately, far fewer estimates of load factors are available than of stock average use. Available data are shown in Table I.4.

Objective I Page 17 Center for Energy and Environment
TABLE I.2a. SATURATION OF VARIOUS APPLIANCES IN THE RESIDENTIAL SECTOR (PERCENT) SINGLE FAMILY (including 1-4 unit buildings)
Data Source: ���� 1a 1b 1c 1d 2 3 4 5 6 7 8 9 10 13 AVG Central Space Htg 4.6 4.0 8.5 8.5 10.4 4.6 12.5 22.3 10.2 6.4 - - 11.0 16.3 9.9 Dual Ht Space Htg - n/a n/a n/a n/a 3.0 22.1 5.9 n/a 4.3 - - - 10.2 9.1 DHW 27.6 28.0 58.9 58.9 53.8 52.5 69.8 69.8 29.0 56.4 - 9.0 46.0 72.3 48.6 Central AC 31.9 32.0 20.3 20.3 27.4 0.0 32.2 32.2 25.8 19.1 - 27.0 6.9 48.0 24.9 Refrigerator* 125.0 138.0 136.0 136.0 134.3 130.2 115.0 115.0 129.0 114.8 - - 110.7 137.1 126.8 Aux Space Htg 18.0 - - - - - - - - - - - - 27.7 22.9 Freezer - 54.0 63.0 63.0 97.0 54.4 84.0 84.0 44.0 87.4 - - 31.6 65.4 66.2 Waterbed Htr - 19.0 - - - - - - - - 16.0 - - 24.2 19.7 Clothes Dryer 52.1 54.0 53.4 53.4 66.6 46.5 81.2 81.2 42.7 61.7 48.0 - 92.9 61.1 Lighting 100.0 100.0 100.0 100.0 100.0 100.0 100.0 100.0 100.0 100.0 - 100.0 100.0 100.0 100.0 Range 61.0 65.0 79.0 79.0 68.5 80.1 77.5 77.5 67.8 63.7 - 58.0 - 94.5 72.6 Room AC 33.1 34.8 36.0 36.0 32.1 18.4 39.0 39.0 46.9 18.4 - 9.0 65.9 34.1 34.1 Dehumidifier 41.0 - - - - - - - - - 12.0 - - 38.6 30.5 Furnace Motor - - - - - - - - - - 53.0 - - 78.2 65.6 Miscellaneous 100.0 100.0 100.0 100.0 100.0 100.0 100.0 100.0 100.0 100.0 - 100.0 - 100.0 100.0 Dishwasher - 70.0 35.0 35.0 52.9 30.9 34.0 62.8 62.8 46.5 42.0 - - 58.8 48.2 Television Color** - - - - - - - - - - 98.0 - - 97.8 97.9 Television B&W** - - - - - - - - - - 55.0 - - 25.4 40.2 Microwave 61.7 - - - - - - - - - 80.0 - - 92.3 78.0 Clothes Washer - - - - - - - - - - - - - 92.0 92.0 VCR - - - - - - - - - - 65.0 - - 77.5 71.3 Whirlpool/ Hot Tub - - - - - - - - - - 2.0 - - 3.5 2.8 Personal Computer - - - - - - - - - - 15.0 - - 25.7 20.4 Agricultural n/a n/a n/a n/a n/a n/a n/a n/a n/a n/a n/a n/a n/a n/a
Key to Sources of Data: 1a b
1c 1d
2 3 4 5 6 7 8
1985 MN, ND, SD, WI, NSP Saturations, PLC Inc. (1988) 1986 MN & SD NSP Saturations, PLC Inc. (1988) 1986 WI NSP Saturations, PLC Inc. (1988) 1986 ND Saturations, PLC Inc. (1988) 1986 MN Coop Power Assoc Stock Average Use, PLC Inc. (1988) 1986 MN Power Stock Average Use, PLC Inc. (1988) 1986 MN Minnetonka Power Cooperative Stock Average Use, PLC Inc. (1988) 1986 MN Ottertail Power Company Stock Average Use, PLC Inc. (1988) 1986 MN Southern MN Municipal Power Agency, PLC Inc. (1988) 1986 MN United Power Association Stock Average Use, PLC Inc. (1988 Rainer et al. 1990
9 10
12a 12b
13
Geller 1986 Northeast Utilities 1989 PSCC 1990 PSCC 1991 1992 MPS data from Hewett et al. 1995 *Saturations for refrigerators are greater than 100% since they take into account the fact that some households have more than one refrigerator. **Saturations for televisions are for households that have at least one. However, like refrigerators, many households have more than one. For instance, in its survey MPS found that the actual saturation of color TV's is 186.2% in single family residences, and 122.7% for multifamily. MPS also found that the saturation of black and white TV's (including those cases with more than one per household) was 29.3% for single family and 16.7% for multifamily, slightly higher than the numbers in the table.
Page 18 Objective I Moorhead Public Service Department
TABLE I.2a. (cont) SATURATION OF VARIOUS APPLIANCES IN THE RESIDENTIAL SECTOR (PERCENT) APARTMENT COMBINED
Data Source: ���� 1a 1b 1c 1d 10 13 AVG 12a 12b Central Space Htg 11.9 28.0 56.0 56.0 15.7 57.1 37.5 3.6 3.1 Dual Ht Space Htg - n/a n/a n/a - 4.8 4.8 - - DHW 11.0 32.0 23.4 23.4 27.0 65.5 30.4 4.5 3.9 Central AC 0.5 8.0 0.0 0.0 4.3 21.5 5.7 10.9 18.5 Refrigerator* 102.0 103.0 104.0 104.0 103.7 106.2 103.8 112.3 114.3 Aux Space Htg 7.8 - - - - 4.6 6.2 - - Freezer 18.0 15.0 15.0 15.0 17.2 18.0 16.4 41.7 42.8 Waterbed Htr 16.4 - - - - 16.4 16.4 41.1 27.4 Clothes Dryer 10.8 10.0 15.0 15.0 - 32.8 16.7 66.1 72.2 Lighting - 100.0 100.0 100.0 100.0 100.0 100.0 100.0 100.0 Range 70.6 76.0 85.0 85.0 - 100.0 83.3 82.6 44.3 Room AC 72.0 82.1 60.0 60.0 54.6 73.9 67.1 - - Dehumidifier 6.0 - - - - 10.6 8.3 - - Furnace Motor - - - - - - n/a - - Miscellaneous - 100.0 100.0 100.0 - 100.0 100.0 - - Dishwasher - 42.0 12.0 12.0 - 50.0 29.0 68.5 70.0 Television Color** - - - - - 95.0 95.0 - - Television B&W** - - - - - 15.1 15.1 - - Microwave 33.1 - - - - 78.8 56.0 80.7 85.7 Clothes Washer - - - - - 36.4 36.4 82.4 86.8 VCR - - - - - 60.6 60.6 - - Whirlpool/ Hot Tub - - - - - 0.0 0.0 - - Personal Computer - - - - - 9.1 9.1 - - Agricultural n/a n/a n/a n/a n/a n/a n/a n/a n/a
Key to Sources of Data: 1a 1b 1c 1d
2 3 4 5 6 7 8
1985 MN, ND, SD, WI, NSP Saturations, PLC Inc. (1988) 1986 MN & SD NSP Saturations, PLC Inc. (1988) 1986 WI NSP Saturations, PLC Inc. (1988) 1986 ND Saturations, PLC Inc. (1988) 1986 MN Coop Power Assoc Stock Average Use, PLC Inc. (1988) 1986 MN Power Stock Average Use, PLC Inc. (1988) 1986 MN Minnetonka Power Cooperative Stock Average Use, PLC Inc. (1988) 1986 MN Ottertail Power Company Stock Average Use, PLC Inc. (1988) 1986 MN Southern MN Municipal Power Agency, PLC Inc. (1988) 1986 MN United Power Association Stock Average Use, PLC Inc. (1988 Rainer et al. 1990
9 10
12a 12b
13
Geller 1986 Northeast Utilities 1989 PSCC 1990 PSCC 1991 1992 MPS data from Hewett et al. 1995 *Saturations for refrigerators are greater than 100% since they take into account the fact that some households have more than one refrigerator. **Saturations for televisions are for households that have at least one. However, like refrigerators, many households have more than one. For instance, in its survey MPS found that the actual saturation of color TV's is 186.2% in single family residences, and 122.7% for multifamily. MPS also found that the saturation of black and white TV's (including those cases with more than one per household) was 29.3% for single family and 16.7% for multifamily, slightly higher than the numbers in the table.

Objective I Page 19 Center for Energy and Environment
TABLE I.2b. SATURATION OF VARIOUS APPLIANCES IN THE FARM SECTOR (PERCENT) Data Source: ���� 1b,c,d 2 3 4 5 6 7 AVG
Central Space Htg 2.2 11.7 4.6 12.5 22.3 2.2 6.4 8.8 Dual Ht Space Htg n/a n/a 3.0 22.1 5.9 n/a 4.3 8.8 DHW 78.0 59.0 78.0 69.8 69.8 78.0 56.4 69.9 Central AC 7.5 26.5 0.0 32.2 32.2 7.5 19.1 17.9 Refrigerator 140.0 133.6 140.0 115.0 115.0 140.0 114.8 128.3 Aux Space Htg - - - - - - - n/a Freezer 81.0 105.6 81.0 84.0 84.0 81.0 87.4 86.3 Waterbed Htr - - - - - - - n/a Clothes Dryer 78.2 69.1 78.2 81.2 81.2 78.2 61.7 75.4 Lighting 100.0 100.0 100.0 100.0 100.0 100.0 100.0 100.0 Range 67.6 69.2 67.6 77.5 77.5 67.6 63.7 70.1 Room AC 23.0 31.6 18.4 39.0 39.0 23.0 18.4 27.5 Dehumidifier - - - - - - - n/a Furnace Motor - - - - - - - n/a Miscellaneous 100.0 100.0 100.0 100.0 100.0 100.0 100.0 100.0 Dishwasher 34.0 49.5 34.0 34.0 34.0 34.0 46.5 38.0 Television Color - - - - - - - n/a Television B&W - - - - - - - n/a Microwave - - - - - - - n/a Clothes Washer - - - - - - - n/a VCR - - - - - - - n/a Whirlpool/ Hot Tub - - - - - - - n/a Personal Computer - - - - - - - n/a Agricultural 100.0 100.0 100.0 100.0 100.0 100.0 100.0 100.0
Key to Sources of Data: 1b 1986 MN & SD NSP Saturations, PLC Inc. (1988) 1c 1986 WI NSP Saturations, PLC Inc. (1988) 1d 1986 ND NSP Saturations, PLC Inc. (1988) 2 1986 MN Coop Power Assoc Saturations, PLC Inc. (1988) 3 1986 MN Power Saturations, PLC Inc. (1988) 4 1986 MN Minnetonka Power Cooperative Saturations, PLC Inc. (1988) 5 1986 MN Ottertail Power Company Saturations, PLC Inc. (1988) 6 1986 MN Southern MN Municipal Power Agency Saturations, PLC Inc. (1988) 7 1986 MN United Power Association Saturations, PLC Inc. (1988)

Page 20 Objective I Moorhead Public Service Department
TABLE I.3a. ANNUAL RESIDENTIAL STOCK AVERAGE USE (kWh/Yr.) SINGLE FAMILY (including 1-4 unit buildings)
Data Source: ���� 1a 1b 1c 2 3 4 5 6 7 8 9 10 11 AVG. Central Space Htg 11,500 11,500 11,200 10,800 12,077 15,000 9,293 6,728 9,661 - - 7037 - 10,480 Dual Ht Space Htg - - - - 13,141 14,550 9,293 - 10,513 - - - - 11,874 DHW 4,643 4,679 3,909 3,690 3,805 3,909 3,244 4,062 3,933 - 3,300 3,432 4,707 3,943 Central AC 1,626 1,574 969 1,575 - 1,097 804 1,449 1,463 - 2,700 1,624 - 1,488 Refrigerator 1,387 1,410 1,249 1,182 1,199 1,121 1,036 1,312 1,357 - 1,288 1,558 1,504 1,300 Aux. Space Htg 1,200 - - - - - - - - - - - - 1,200 Freezer 1,158 1,061 896 1,061 888 1,197 743 1,033 1,142 - 933 1,273 1,540 1,077 Waterbed Htr 1,182 1,078 1,019 1,078 1,019 1,019 846 1,078 865 900 - - - 1,008 Clothes Dryer 1,041 1,102 930 855 909 1,006 772 1,071 901 - 932 - 1,060 962 Lighting* 955 963 946 963 882 946 785 867 1,120 - 1027 1,000 - 950 Range 767 785 677 810 645 917 562 715 774 - 730 - 472 714 Room AC 406 393 247 493 333 280 205 374 444 - - 526 - 370 Dehumidifier 360 - - - - - - - - 400 - - - 380 Furnace Motor 271 - - - - - - - - 500 - - - 386 Miscellaneous** 200 224 841 494 618 1,084 698 143 29 - 513 - - 526 Dishwasher 151 155 153 270 148 245 127 143 153 200 - - 121 170 Television Color 125 - - - - - - - - 250 - - - 188 Television B&W - - - - - - - - - 40 - - - 40 Microwave 112 - - - - - - - - 120 - - - 116 Clothes Washer 90 - - - - - - - - - - - 107 99 VCR - - - - - - - - - 40 - - - 40 Whirlpool/ Hot Tub - - - - - - - - - 2,300 - - - 2,300 Personal Computer - - - - - - - - - 130 - - - 130Key to Sources of Data:
1a 1b
1c 2 3 4 5 6 7 8 9
10
1985 MN NSP Stock Average Use, PLC Inc. (1988) 1986 MN, ND & SD NSP Stock Average Use, PLC Inc. (1988) NOTE: see footnote on misc. use 1986 WI NSP Stoci Average Use, PLC Inc. (1988) 1986 MN Coop Power Assoc Stock Average Use, PLC Inc. (1988) 1986 MN Power Stock Average Use, PLC Inc. (1988) 1986 MN Minnetonka Power Cooperative Stock Average Use, PLC Inc. (1988) 1986 MN Ottertail Power Company Stock Average Use, PLC Inc. (1988) 1986 MN Southern MN Municipal Power Agency, PLC Inc. (1988) 1986 MN United Power Association Stock Average Use, PLC Inc. (1988 Rainer et al. 1990 Geller 1986 Northeast Utilities 1989
11 12a 12b
13
BPA 1992 PSCC 1990 PSCC 1991 1992 MPS data from Hewett et al. 1995 *These lighting numbers are much lower than estimates based on measured data in two studies: 2,738 kWh/year (Pacific Power & Light 1990), and 2,500 kWh/year (Grays Harbor Public Utility District 1992). **NSP (source 1b) stock average for single family and multifamily miscellaneous uses (unlike other end-uses) varies considerably by state. MN figures are given in table, but for single family in ND it is 1,139 kWh/year, and for single family in SD it is 329 kWh/year; for multifamily in ND it is 389 kWh/yr., and for multifamily in SD it is 112 kWh/year. NOTE: Averages for misc. end-use given in the table includes these values.
Objective I Page 21 Center for Energy and Environment
TABLE I.3a. (cont.) ANNUAL RESIDENTIAL STOCK AVERAGE USE (kWh/Yr.) APARTMENTS COMBINED
Data Source: ���� 1a 1b 1c 10 AVG. 12a 12b Central Space Htg 4,750 4,750 4,750 4,133 4,596 7,700 7,500 Dual Ht Space Htg - - - - n/a - - DHW 2,669 2,495 2,617 3019 2,700 3,400 3,600 Central AC - - - 1118 n/a 1,790 1,700 Refrigerator 1,016 929 904 1,345 1,049 1,250 1,000 Aux. Space Htg 900 - - - 900 2,800 - Freezer 798 739 739 1273 887 1,340 1,300 Waterbed Htr 1,177 1,078 1,020 - 1,092 950 900 Clothes Dryer 573 590 571 - 578 750 550 Lighting* 597 589 591 645 606 1,200 1,100 Range 518 540 508 - 522 230 250 Room AC 411 350 380 526 417 - - Dehumidifier 180 - - - 180 - - Furnace Motor 135 - - - 135 - - Miscellaneous** 100 77 288 - 193 - - Dishwasher 81 83 82 - 82 400 400 Television Color 125 - - - 125 - - Television B&W - - - - n/a - - Microwave 115 - - - 115 100 100 Clothes Washer 50 - - - 50 200 200 VCR - - - - n/a - - Whirlpool/ Hot Tub - - - - n/a 1,900 - Personal Computer - - - - n/a - -
Key to Sources of Data: 1a 1b
1c 2 3 4 5 6 7 8 9
10
1985 MN NSP Stock Average Use, PLC. Inc. (1988) 1986 MN, ND & SD NSP Stock Average Use, PLC Inc. (1988) NOTE: see footnote on misc. use 1986 WI NSP Stock Average Use, PLC Inc. (1988) 1986 MN Coop Power Assoc Stock Average Use, PLC Inc. (1988) 1986 MN Power Stock Average Use, PLC Inc. (1988) 1986 MN Minnetonka Power Cooperative Stock Average Use, PLC Inc. (1988) 1986 MN Ottertail Power Company Stock Average Use, PLC Inc. (1988) 1986 MN Southern MN Municipal Power Agency, PLC Inc. (1988) 1986 MN United Power Association Stock Average Use, PLC Inc. (1988 Rainer et al. 1990 Geller 1986 Northeast Utilities 1989
11 12a 12b
13
BPA 1992 PSCC 1990 PSCC 1991 1992 MPS data from Hewett et al. 1995 *These lighting numbers are much lower than estimates based on measured data in two studies: 2,738 kWh/year (Pacific Power & Light 1990), and 2,500 kWh/year (Grays Harbor Public Utility District 1992). **NSP (source 1b) stock average for single family and multifamily miscellaneous uses (unlike other end-uses) varies considerably by state. MN figures are given in table, but for single family in ND it is 1,139 kWh/year, and for single family in SD it is 329 kWh/year; for multifamily in ND it is 389 kWh/yr., and for multifamily in SD it is 112 kWh/year. NOTE: Averages for misc. end-use given in the table includes these values.
Page 22 Objective I Moorhead Public Service Department
TABLE I.3b. ANNUAL FARM STOCK AVERAGE USE (KWh/Yr) TABLE I.3c. USE BY AGRICULTURAL CLASS FARMS
Data Source: ���� 1b & 1c 2 3 4 5 6 7 AVG. Product Base Annual Usage Central Space Htg 11,500 12,000 12,077 15,000 11,500 11,500 9,661 11,891 Dual Ht Space Htg - - 13,141 14,550 11,500 - 10,513 12,426 Dairying 43 kWh per 1000 lbs. DHW 4,655 4,100 4,655 3,909 4,655 4,655 3,993 4,375 Central AC 964 1,750 - 1,097 964 964 1,463 1,200 Beef Cattle 15 kWh per calf Refrigerator 1,295 1,292 1,295 1,121 1,295 1,295 1,357 1,279 Aux Space Htg - - - - - - - n/a Hog Confinement 10 kWh per pig Freezer 866 1,400 866 1,197 866 866 1,142 1,029 Waterbed Htr 1,032 1,032 1,032 1,019 1,032 1,032 865 1,006 Sows Farrowing 87 kWh per sow Clothes Dryer 1,036 950 1,036 1,006 1,036 1,036 901 1,000 Lighting* 947 947 947 946 947 947 1,120 972 Corn Handling 30 kWh per 1,000 bushels Range 753 900 753 917 753 753 774 800 Room AC 256 548 333 280 256 256 444 339 Corn Drying (high) 1,100 kWh per 1,000 bushels Dehumidifier - - - - - - - n/a Furnace Motor - - - - - - - n/a Corn Drying (low) 100 kWh per 1,000 bushels Miscellaneous 1,113 1,113 1,113 1,084 1,113 1,113 29 954 Dishwasher 152 300 152 245 152 152 153 187 Soybeans 6 kWh per 1,000 bushels Television Color - - - - - - - n/a Television B&W - - - - - - - n/a Silage 6 kWh per ton Microwave - - - - - - - n/a Clothes Washer - - - - - - - n/a Poultry 1.5 kWh per laying hen VCR - - - - - - - n/a Whirlpool/Hot Tub - - - - - - - n/a Source: PLC Inc. (1988) Personal Computer - - - - - - - n/a Agricultural*** 12,840 13,571 7,750 4,610 8,505 5,304 6,564 8,668
Key to Sources of Data: 1b
1c 2 3 4 5 6 7
1986 MN, ND & SD NSP Stock Average Use, PLC Inc. (1988) NOTE: see footnote on misc. use 1986 WI NSP Stoci Average Use, PLC Inc. (1988) 1986 MN Coop Power Assoc Stock Average Use, PLC Inc. (1988) 1986 MN Power Stock Average Use, PLC Inc. (1988) 1986 MN Minnetonka Power Cooperative Stock Average Use, PLC Inc. (1988) 1986 MN Ottertail Power Company Stock Average Use, PLC Inc. (1988) 1986 MN Southern MN Municipal Power Agency, PLC Inc. (1988) 1986 MN United Power Association Stock Average Use, PLC Inc. (1988)
*These lighting numbers are much lower than estimates based on measured data in two studies: 2,738 kWh/year (Pacific Power & Light 1990), and 2,500 kWh/year (Grays Harbor Public Utility District 1992). **NSP (source 1b and 1c) stock average for agricultural uses varies by state (unlike other farm end-use values). MN figures are given in table, but for single family in ND it is 1,653 kWh/year, for SD it is 6,407 kWh/year, and for WI it is 19,473 kWh/year. NOTE: The average for this given in the table includes these extra values; average farm use for only MN utilities would be 9,120 kWh/year.
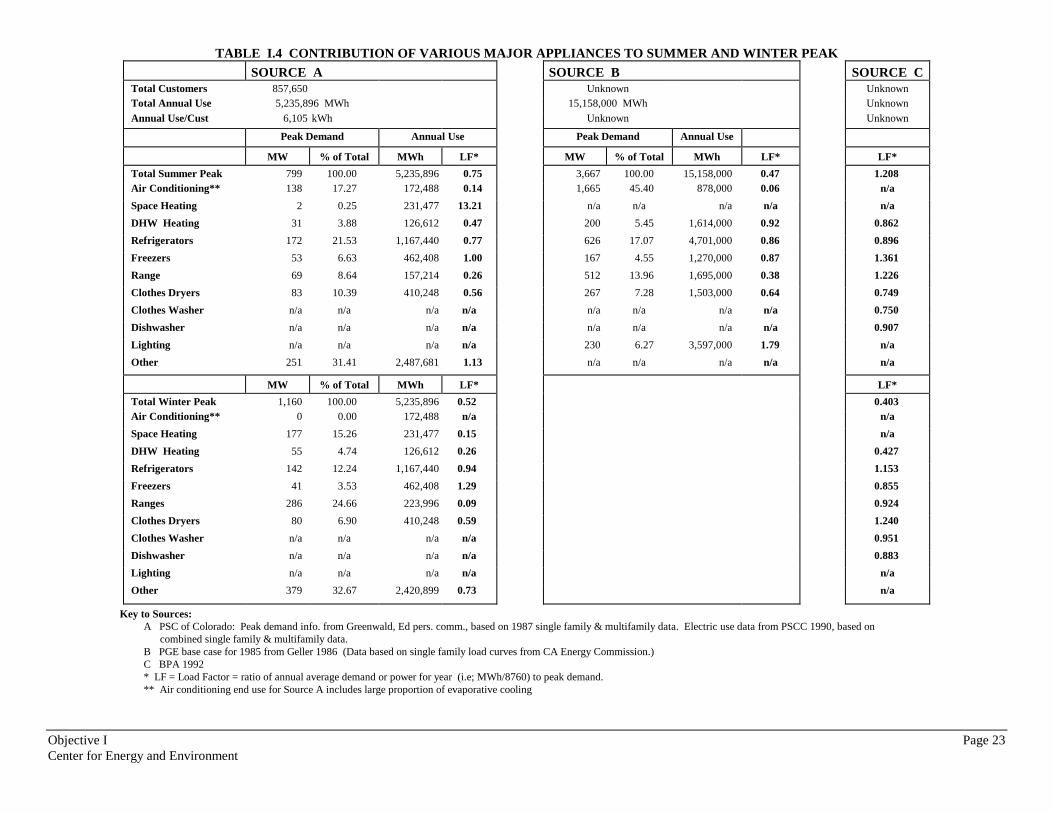
Objective I Page 23 Center for Energy and Environment
TABLE I.4 CONTRIBUTION OF VARIOUS MAJOR APPLIANCES TO SUMMER AND WINTER PEAK SOURCE A SOURCE B SOURCE C
Total Customers 857,650 Unknown Unknown Total Annual Use 5,235,896 MWh 15,158,000 MWh Unknown Annual Use/Cust 6,105 kWh Unknown Unknown
Peak Demand Annual Use Peak Demand Annual Use
MW % of Total MWh LF* MW % of Total MWh LF* LF* Total Summer Peak 799 100.00 5,235,896 0.75 3,667 100.00 15,158,000 0.47 1.208 Air Conditioning** 138 17.27 172,488 0.14 1,665 45.40 878,000 0.06 n/a Space Heating 2 0.25 231,477 13.21 n/a n/a n/a n/a n/a DHW Heating 31 3.88 126,612 0.47 200 5.45 1,614,000 0.92 0.862 Refrigerators 172 21.53 1,167,440 0.77 626 17.07 4,701,000 0.86 0.896 Freezers 53 6.63 462,408 1.00 167 4.55 1,270,000 0.87 1.361 Range 69 8.64 157,214 0.26 512 13.96 1,695,000 0.38 1.226 Clothes Dryers 83 10.39 410,248 0.56 267 7.28 1,503,000 0.64 0.749 Clothes Washer n/a n/a n/a n/a n/a n/a n/a n/a 0.750 Dishwasher n/a n/a n/a n/a n/a n/a n/a n/a 0.907 Lighting n/a n/a n/a n/a 230 6.27 3,597,000 1.79 n/a Other 251 31.41 2,487,681 1.13 n/a n/a n/a n/a n/a
MW % of Total MWh LF* LF* Total Winter Peak 1,160 100.00 5,235,896 0.52 0.403 Air Conditioning** 0 0.00 172,488 n/a n/a Space Heating 177 15.26 231,477 0.15 n/a DHW Heating 55 4.74 126,612 0.26 0.427 Refrigerators 142 12.24 1,167,440 0.94 1.153 Freezers 41 3.53 462,408 1.29 0.855 Ranges 286 24.66 223,996 0.09 0.924 Clothes Dryers 80 6.90 410,248 0.59 1.240 Clothes Washer n/a n/a n/a n/a 0.951 Dishwasher n/a n/a n/a n/a 0.883 Lighting n/a n/a n/a n/a n/a Other 379 32.67 2,420,899 0.73 n/a
Key to Sources: A PSC of Colorado: Peak demand info. from Greenwald, Ed pers. comm., based on 1987 single family & multifamily data. Electric use data from PSCC 1990, based on combined single family & multifamily data. B PGE base case for 1985 from Geller 1986 (Data based on single family load curves from CA Energy Commission.) C BPA 1992 * LF = Load Factor = ratio of annual average demand or power for year (i.e; MWh/8760) to peak demand. ** Air conditioning end use for Source A includes large proportion of evaporative cooling

Demand-Side Management for Municipal Utilities
Page 24 Objective I Moorhead Public Service Department
Step 2.5 Check estimates against total residential sales and peak demand, and reconcile differences.
The total residential sales estimated by summing the sales by end use from Step 2.4 should be checked against the actual system sales for the data year. If the discrepancy is reasonably small, the end use estimates can be accepted as usable. If the discrepancy is large, all assumptions should be re-checked and any errors corrected. Budget limitations will probably limit any adjustments beyond correction of errors to the analysts' intuitive feel for the service territory, in terms of saturations, stock average use, and dwelling type breakdown. Few, if any, utilities routinely use demand meters on their residential customers, or even on all of their C&I customers. Therefore, you very likely will not have an estimate of total residential peak demand from billing data against which to reconcile the estimates you built up from energy use and load factors. It will then be necessary to wait until the commercial analysis is complete, combine the residential and commercial estimates, and reconcile the combined estimates against actual system peak demand. Step 2.6 Calculate final estimates of residential sales and peak demand by end use for a
normal weather year. Once adjustments have been made to reconcile the total of the end use estimates and peak demands for the test year to sales, final estimates for a normal weather year can be made by simply substituting normal year heating and cooling energy use estimates in place of those for the data year. Step 2.7 Determine the number of commercial and industrial customers. You should already have a count of the total number of commercial and industrial customers from Step 1.3. It is critical that a “customer” be defined for energy use analysis in the same way as it was defined for sampling and for collecting survey data. Step 2.8 Determine the distribution of sales by function code group. The most accurate approach is to assign function codes to every C&I account, and then to total energy use within groups to determine the sales by function code group. If this is not possible, an estimate can be derived based on the energy use of respondents to the C&I survey. The estimated total energy use for each function code group is simply the product of: • the total number of C&I customers, • the percent of C&I customers that are in this function code group (from analysis of entire
C&I customer database, if possible, otherwise from survey results) and • the average electric use of customers in this function code group (again, from analysis of the
entire C&I database, if possible, and otherwise from analysis of billing data for the survey group).

Demand-Side Management for Municipal Utilities
Objective I Page 25 Center for Energy and Environment
Estimates based on survey results have a much greater possibility for error than estimates derived from the total C&I database for two reasons. First, for any reasonably-sized sample, the individual subsamples by function code will be too small to provide accurate estimates of average electric use for the group. Second, non-response bias can lead to significant errors in the estimation of the percentage of customers by function code group from survey results. The sales for all function code groups are added together, and then reconciled against total C&I sales either through a simple proportional adjustment or through judgmental adjustments. Step 2.9 Estimate C&I sales and peak demand by end use. The least labor-intensive approach to end use estimates for the commercial and industrial sectors is simply to borrow data on the percentage breakdown of sales and peak demand from other sources and apply them to your system’s commercial and industrial sales and peak demand. Available data from other sources are shown in Tables I.5, I.6 and I.7.
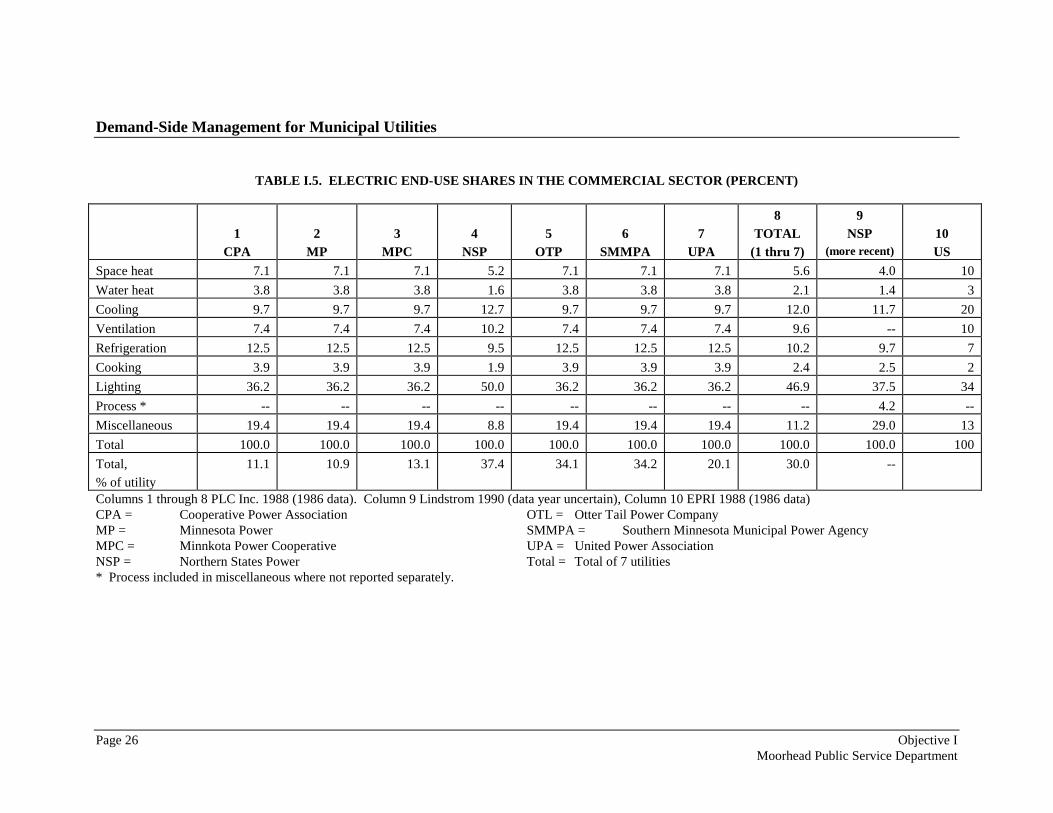
Demand-Side Management for Municipal Utilities
Page 26 Objective I Moorhead Public Service Department
TABLE I.5. ELECTRIC END-USE SHARES IN THE COMMERCIAL SECTOR (PERCENT)
1 CPA
2
MP
3
MPC
4
NSP
5
OTP
6
SMMPA
7
UPA
8 TOTAL
(1 thru 7)
9 NSP
(more recent)
10 US
Space heat 7.1 7.1 7.1 5.2 7.1 7.1 7.1 5.6 4.0 10 Water heat 3.8 3.8 3.8 1.6 3.8 3.8 3.8 2.1 1.4 3 Cooling 9.7 9.7 9.7 12.7 9.7 9.7 9.7 12.0 11.7 20 Ventilation 7.4 7.4 7.4 10.2 7.4 7.4 7.4 9.6 -- 10 Refrigeration 12.5 12.5 12.5 9.5 12.5 12.5 12.5 10.2 9.7 7 Cooking 3.9 3.9 3.9 1.9 3.9 3.9 3.9 2.4 2.5 2 Lighting 36.2 36.2 36.2 50.0 36.2 36.2 36.2 46.9 37.5 34 Process * -- -- -- -- -- -- -- -- 4.2 -- Miscellaneous 19.4 19.4 19.4 8.8 19.4 19.4 19.4 11.2 29.0 13 Total 100.0 100.0 100.0 100.0 100.0 100.0 100.0 100.0 100.0 100 Total, % of utility
11.1 10.9 13.1 37.4 34.1 34.2 20.1 30.0 --
Columns 1 through 8 PLC Inc. 1988 (1986 data). Column 9 Lindstrom 1990 (data year uncertain), Column 10 EPRI 1988 (1986 data) CPA = Cooperative Power Association OTL = Otter Tail Power Company MP = Minnesota Power SMMPA = Southern Minnesota Municipal Power Agency MPC = Minnkota Power Cooperative UPA = United Power Association NSP = Northern States Power Total = Total of 7 utilities * Process included in miscellaneous where not reported separately.

Demand-Side Management for Municipal Utilities
Objective I Page 27 Center for Energy and Environment
TABLE I.6. ELECTRIC END-USE SHARES IN THE INDUSTRIAL SECTOR (PERCENT)
1
CPA 2
MP 3
MPC 4
NSP 5
OTP 6
SMMPA 7
UPA 8
TOTAL (1 thru 7)
9 NSP
(more recent) Space heat 1.0 1.5 1.0 1.8 0.5 1.8 1.0 1.6 0.6 Water heat 0.4 0.1 0.4 0.3 0.2 0.3 0.4 0.2 0.2 Cooling 3.4 0.5 3.4 5.3 1.7 5.3 3.4 3.4 3.3 Ventilation 4.2 0.7 4.2 5.0 2.1 5.0 4.2 3.3 -- Refrigeration 14.9 0.1 14.9 5.4 7.2 5.4 14.9 4.0 1.7 Cooking -- -- -- -- -- -- -- -- 0.1 Process 5.4 3.0 5.4 12.1 2.6 12.1 5.4 8.2 64.6 Motors * 58.4 88.7 58.4 61.8 78.8 61.8 58.4 72.0 -- Lighting 9.8 5.1 9.8 8.1 5.8 8.1 9.8 7.0 13.5 Miscellaneous 2.6 0.6 2.6 2.2 1.3 2.2 2.6 1.6 16.0 Total 100.0 100.0 100.0 100.0 100.0 100.0 100.0 100.0 100.0 Total, % of utility
10.2 69.1 6.7 22.6 24.8 34.2 6.5 27.5 --
Columns 1 through 8 PLC Inc. 1988 (1986 data), column 9 Lindstrom 1990 (data year uncertain). CPA = Cooperative Power Association OTL = Otter Tail Power Company MP = Minnesota Power SMMPA = Southern Minnesota Municipal Power Agency MPC = Minnkota Power Cooperative UPA = United Power Association NSP = Northern States Power Total = Total of 7 utilities * Motors included in process for more recent NSP data.

Demand-Side Management for Municipal Utilities
Page 28 Objective I Moorhead Public Service Department
TABLE I.7. ELECTRIC PEAK SHARES IN THE COMMERCIAL AND INDUSTRIAL SECTORS
Summer Winter End Use PSCC,
C&I NSP, C&I
NSP, Ind
PSCC, Ind
NSP, Comm
PSCC, Comm
PSCC, C&I
PSCC, Ind
PSCC, Comm
Space heat 0.0 0.0 0.0 0.0 0.0 0.0 25.0 12.3 26.8 Cooling 35.3 29.3 14.5 20.8 36.5 37.2 0.1 0.5 0.1 Ventilation -- 5.5 3.4 -- 6.5 -- -- -- -- Lighting 30.6 26.3 14.7 15.9 31.9 32.5 35.2 17.7 37.6 Water heat 1.8 0.7 0.2 0.9 0.9 1.9 4.4 1.1 4.8 Refrigeration 6.0 4.3 1.4 4.0 5.7 6.3 4.6 3.2 4.8 Cooking 3.0 0.8 0.0 0.4 1.2 3.3 4.2 0.0 4.8 Process & Misc
-- 33.1 65.8 -- 17.3 -- -- -- --
Other 23.3 -- -- 58.0 -- 18.8 26.5 65.2 37.6 Total 100.0 100.0 100.0 100.0 100.0 100.0 100.0 100.0 116.5 Note: Overall PSCC electric heat 16% of C&I floorstock, cooling 63% of C&I floorstock. PSCC data PSCC 1987. Industrial estimates taken from "manufacturing" sector data, commercial derived from total C&I minus
manufacturing. NSP data Lindstrom 1990. Outcome When you have completed the steps outlined above, you will have much of the information about your customers necessary to design effective DSM programs, including: • appliance and equipment saturations among residential and C&I customers • the presence and importance of various C&I market segments • the breakdown of energy sales and system peak demand by market segment and end use
preliminary information on the current market penetration of some demand-side management measures.
In objective 3, these data can be combined with information on conservation potential by end use to identify key DSM targets.

Demand-Side Management for Municipal Utilities
Objective I Page 29 Center for Energy and Environment
Resources Babbie, Earl, 1979. The Practice of Social Research (Second Edition). Belmont, CA: Wadsworth Publishing Company. Berdie, Doug, John Anderson, and Marsha Niebuhr, 1986. Questionnaires: Design and Use. Metuchen, NJ and London: The Scarecrow Press, Inc. BPA 1992. Description of Electric Energy Use in Single Family Residences in the Pacific Northwest. Portland, OR: Bonneville Power Administration. Cahill, James, Keith Ritland, and Wendy Lin-Kelly, 1992. Description of Electric Energy Use in Single Family Residences in the Pacific Northwest: 1986 - 1992. Portland, Oregon: Bonneville Power Administration. EIA, 1991. Commercial Buildings Characteristics 1989. DOE/EIA--0246(89). Washington, D.C.: U.S. Department of Energy/Energy Information Administration. EIA, 1992. Commercial Buildings Energy Consumption and Expenditures 1989. DOE/EIA--0318(89). Washington, D.C.: U.S. Department of Energy/Energy Information Administration. EPRI, 1988. Commercial End-Use Data Development Handbook: COMMEND Market Profiles and Parameters. V.2: COMMEND Data and Parameter Development Techniques. EM-4703 V.2. Palo Alto, CA: Electric Power Research Institute. EPRI, 1986. The COMMEND Planning System: National and Regional Data and Analysis. EM-4486. Palo Alto, CA: Electric Power Research Institute. Geller, Howard, 1986. Residential Conservation Power Plant Study, Phase I, Technical Potential. Prepared for Pacific Gas and Electric Company, San Francisco, CA. Washington, DC: American Council for an Energy Efficient Economy. Hewett, Martha, Timothy Dunsworth, and Maureen Quaid, 1987. Electric Use of Energy Assistance Program Recipients in Minneapolis, Minnesota. MEO/TR87-1-SF. Minneapolis, MN: Center for Energy and Environment. Lindstrom, L. 1990. Personal communication. M.S. Lobenstein, M. Hewett, K. Campbell, C. Reed, 1995. Residential End Use Analysis and Program Screening for Moorhead Public Service. Minneapolis: Center for Energy and Environment. Office of Management and Budget, 1987. Standard Industrial Classification Manual. PB87-100012. Washington, D.C. Office of Management and Budget.
Demand-Side Management for Municipal Utilities
Page 30 Objective I Moorhead Public Service Department
Minnesota Department of Public Service, 1992. 1992 Energy Policy and Conservation Report: Transition Into the 21st Century, Dec 1992. St. Paul, MN: Minnesota Department of Public Service. Northeast Utilities 1989. WMECO 1989 Technical Potential Assessment Final Report. Prepared for Northeast Utilities by Synergic Resources Corporation. PLC, Incorporated, 1988. Conservation Potential in the State of Minnesota: Final Report, Volume II: Tables and Appendices. PLC, Incorporated. PSCC, 1991. Residential Energy Use Survey. Denver, CO: Public Service Company of Colorado. PSCC, 1990. 1989 Residential Energy Use Survey Total Company Report. Denver, CO: Public Service Company of Colorado. PSCC, 1987. Commercial Energy Use Survey and Load Shape Analysis Total Company Report. Denver, CO: Public Service Company of Colorado. Rainer, Leo, Steve Greenberg, and Alan Meier (Lawrence Berkeley Laboratory), 1990. "The Miscellaneous Electric Energy Use in Homes," Proceedings of ACEEE 1990 Summer Study on Energy Efficiency in Buildings, Vol. 9, pp. 9.263-9.272. Washington, D.C.: American Council for an Energy-Efficient Economy. Taylor, Z. Todd, 1992. Description of Electric Energy Use in Commercial Buildings in the Pacific Northwest: 1992 Supplement. Richland, WA: Pacific Northwest Laboratory. Van Liere, Kent, Pamela Rathbun, Laureen Ross McCalib, Debra Sundin, and Dana Larson, 1987. "Improving Survey Methods for Gathering Conservation and End-Use Data From Commercial/Industrial Customers," In Proceedings of the 1987 Energy Conservation Program Evaluation Conference. Chicago, IL: Argonne National Laboratory and others.

Demand-Side Management for Municipal Utilities
Objective II Page 1 Center for Energy and Environment
OBJECTIVE II. DETERMINE THE VALUE OF DEMAND-SIDE RESOURCES TO THE UTILITY
Purpose The purpose of this objective is to establish the criteria you will use to evaluate the benefits of demand-side programs. This will enable you both to determine whether particular DSM programs meet your criteria or not and to prioritize those programs that do. Process The first step in determining the value of DSM to the utility is to identify potential criteria to be used in evaluating demand-side resources. A number of qualitative factors have a critical influence on decisions regarding which DSM activities to pursue. A municipally owned utility must, of course, consider the needs of the community. These range from economic development and the needs of the business community to the needs of low income citizens. In addition, several economic tests are commonly used to quantify the benefits and costs of various potential DSM activities from the perspectives of various stakeholders. These tests are essential tools which enable you to make sound financial decisions about DSM activities, both as a utility, with concern for your program participants, utility revenue requirements and rates, and as a city agency, with concern for the needs of society. The next step is to select the software that you will use to do cost-effectiveness calculations and customize it with the utility-specific inputs needed. Before you can conduct any benefit/cost analyses, you will need to do some background work to quantify your “avoided costs,” that is, how much the utility saves in capital, fuel costs, purchased power costs or other costs when customers reduce their energy use. These avoided costs, developed in step 3, are one of the benefits included in benefit/cost tests. A fourth step which can be quite helpful is to run benefit/cost tests for some prototypical conservation load shapes. This will tell you what types of load shapes (i.e., what distribution of energy and demand savings throughout the year) are likely to produce benefits which exceed their costs. This will help you to anticipate the types of DSM technologies most likely to be cost-effective for your utility. In addition, the net benefit numbers from this analysis will give you an idea of the maximum amount you could afford to spend (on incentives, marketing, administrative costs, and so on) to achieve a unit of savings for measures with various load shapes. Once these steps have been taken, you will need to finalize your criteria for evaluating demand-side resources. Many of these criteria, such as equity across customer classes or among income groups, or the particular economic tests used to screen and prioritize programs, are public policy questions. While staff can identify the issues, it is essential to seek input from opinion leaders and the broader community and to involve upper management and elected officials in setting the ultimate direction for DSM activities.

Demand-Side Management for Municipal Utilities
Page 2 Objective II Moorhead Public Service Department
Step 1. Identify Potential Criteria to be Used in Evaluating Demand-Side Resources. Energy and demand savings achieved at customers’ homes or businesses are a utility resource that can serve as an alternative to construction of generating facilities or power purchases. In order to determine what types of DSM resources the utility should buy, you will need to analyze their cost-effectiveness. In addition, you will need to consider other qualitative factors, such as equity across customer groups, impacts on economic development, and feasibility with available staff and other resources. Step 1.1 Identify qualitative factors to be considered in evaluating DSM programs. A number of qualitative factors influence decisions regarding which DSM activities to pursue. These factors can be identified by staff, but the weight assigned to them in decision-making must be determined by upper management with input from the community, as described in Task 5. These factors can then be used by staff as screening criteria in evaluating potential program activities. Some factors to consider are listed below. DSM potential: Other things being equal, it is logical to start with those DSM activities that have the greatest potential impact on peak demand or energy use. As discussed in objective III, these are activities focused on significant electric end uses for which more efficient technologies are available, but currently have low market penetration. Economic development: DSM programs can promote economic development if they offer something attractive to businesses considering locating in the area or if they offer something to existing businesses which can increase their profitability. They can also inhibit economic development if they significantly increase rates or if otherwise establish inequities with other areas. Equity across customer classes: If the total resource cost test or the societal test is used as a screening criterion for DSM programs and if some of the resulting programs do not pass the rate impact measure test, then only customers who can take advantage of the programs will actually experience a decrease in costs. This argues for offering an array of programs that gives all major customer classes an opportunity to participate. Even if all programs pass the RIM test, participants will still benefit more than non-participants, which again argues for a “something for everybody” approach to development of the portfolio of DSM programs. Various strategies could include allocating DSM spending based on energy (kWh) sales to each class, the amount of revenues generated from each rate class, the number of customers in the class, the potential for savings in that class, need, or other criteria. At the time of the Moorhead project, the State of Minnesota had no formal rules regarding equity across customer classes but did use DSM spending proportional to revenues and kWh as a loose criterion for evaluating regulated utilities’ overall DSM program. Equity across income levels: Low income customers spend a much greater proportion of their income on energy than do other customer groups. In addition, they often face more barriers in participating in DSM programs. They are unlikely to have the cash necessary to participate in an

Demand-Side Management for Municipal Utilities
Objective II Page 3 Center for Energy and Environment
insulation program, refrigerator rebate program or similar program that requires a significant investment of their own funds. Many utilities offer special programs targeted at low income customers in response to regulatory requirements or as a way to reduce the amount of customer arrears. At one time, the State of Minnesota required regulated utilities to spend 50 percent of residential DSM dollars on low income customers, but the utilities were not able to come anywhere close to meeting this goal. More recently, the state has required utilities to state in their filings how much of each program is expected to go to low income and rental customers and has simply tried to assure that most residential programs in some way address low income and rental customers (with a primary emphasis on the low income group). In the case of one utility with 35 percent low income customers, the State tried to get the proportion of residential DSM funds spent on low income customers close to 35 percent. Delivery feasibility: DSM program require varying levels of staff time and expertise. The limitation of staff resources must be considered when deciding which DSM programs to implement. Unique opportunities for municipal utilities: As agencies of local government, municipal utilities have some unique opportunities that investor-owned utilities do not. Examples include the ability to easily establish coordinated DSM programs to improve the efficiency of municipal buildings through cost-effective investment of other municipal funds, and the ability to work with code officials to improve enforcement of energy codes in new commercial buildings. Lost opportunities: Some DSM resources are much easier to obtain at a particular point in time than at any other point. For example, it is much easier to provide good air-sealing at the time when a new home is built than at a later time. It is much less expensive to make a new office building efficient when it is first built than later, or to upgrade an industrial facility to high efficiency motors at the time of a major plant expansion than after the expansion is completed. Some of these differences are captured by the cost-effectiveness tests. However, the tests always rely on estimates about the future costs of generation, transmission, distribution and capacity that are subject to some uncertainty. Unanticipated events may cause a sudden increase in these costs. When deciding whether to capture DSM resources that would otherwise become lost opportunities, it may be prudent to allow for the possibility that avoided costs may be higher at some later date. Other qualitative factors to be considered include: • interaction with existing utility programs, • impacts on customer relations, • customer acceptance of the proposed program, and • the opinions of trade allies such as equipment vendors and contractors. Step 1.2 Become familiar with standard economic tests of DSM cost-effectiveness. The various parties affected by DSM activities include the program participants, the utility itself, non-participant ratepayers, and society as a whole. These parties incur different costs and realize

Demand-Side Management for Municipal Utilities
Page 4 Objective II Moorhead Public Service Department
different benefits as a result of DSM activities. In order to make sound decisions, the utility will need to evaluate the cost-effectiveness of each DSM strategy from most if not all of these perspectives. Ultimately, the choice of specific tests to be used screen and prioritize programs is again a policy decision, which will require input from the community and upper management as described in step 5. The various economic tests used for this purpose can seem bewildering at first, but it is very important to develop a thorough understanding of them to guide you in making sound decisions about DSM investments. The key perspectives are: • Participants. Program participants typically receive some kind of incentive, such as a
rebate, as well as saving money on their electric bills, but to participate in most DSM programs they also have to make some kind of investment themselves. If the ratio of the benefits to the costs does not exceed participants’ criteria for cost-effectiveness, they will not participate, and the program will be a failure. Participant cost-effectiveness is evaluated using the “Participant Test.”
• The utility. While DSM programs cost something to deliver, they also allow the utility to
avoid certain generation and fuel costs or purchased power costs. If the avoided costs exceed the program costs (including incentives given to participants), the utility’s total costs will decrease. This is measured using the “Utility Cost Test,” also known as the “Revenue Requirements Test.”
• Non-participant ratepayers. DSM programs often decrease the utility’s revenues from
sales. Even if a program passes the Utility Cost Test so that the utility’s net costs decrease, it may be necessary to raise rates if the program’s gross costs plus the lost revenues exceed the avoided costs. While the percentage increase in rates, if any, is often extremely small, the impact on large customers can be significant. The magnitude of this impact is evaluated using the “Rate Impact Measure Test,” also known as the “no-losers test” or “nonparticipant test.”
• All ratepayers on average. Another way of looking at DSM strategies is to look at overall
economic efficiency in terms of the total economic resources expended by all parties to meet an energy need. Some portion of customers’ needs for lighting, heating, mechanical power and other amenities can be met either by generating an increment of electricity or by improving customers’ end use efficiency. If the utility’s costs to deliver the program plus the participants’ cost to participate are less than the cost to generate the electricity (the avoided costs), then meeting the energy need through the DSM program is more economically efficient than generating the required electricity. Operating the DSM program will therefore cause the net costs to all ratepayers on average (participants plus non-participants) to decrease. This perspective is evaluated through the all ratepayers test, more commonly known as the “Total Resource Cost Test.”
• Society as a whole. The total cost to society to meet the energy needs of its members is also
of interest to utilities. It is of interest to municipal utilities because, as divisions of

Demand-Side Management for Municipal Utilities
Objective II Page 5 Center for Energy and Environment
government, they have an interest in the common welfare as well as in their own operations. It is of interest to regulated utilities when regulators require consideration of the common welfare. Cost-effectiveness to society as a whole is measured using the “Societal Test.” The Societal Test is similar to the Total Resource Cost Test, with a few exceptions. First, it may include factors normally left out of narrowly defined calculations of economic efficiency, such as impacts on the environment. These factors that are external to standard economic calculations are commonly referred to as externalities.1 Second, the Societal Test may make different assumptions about the value of costs incurred or savings realized at distant points in time, since the common welfare includes consideration of future welfare. Although it is uncommon, the Societal Test may sometimes use avoided costs that reflect the marginal cost to society of acquiring new generating capacity, rather than the costs to the specific utility.
Figures II.1 through II.5 graphically illustrate these different benefit/cost analyses and will allow you to compare the items counted as costs or benefits from each perspective. The items in bold commonly arise as part of DSM programs, while the items not in bold are included for completeness but would typically arise in scenarios different from those considered here, such as fuel switching programs conducted by combination electric and gas utilities or programs intended to increase customer energy use (load-building programs). The following observations may be helpful as a starting point in evaluating which tests to use. It obviously does not make sense to offer DSM programs that do not pass the Participant Test or the Revenue Requirements Test. We recommend that the Revenue Requirements Test be used to help prioritize programs that pass the test based on the cost to the utility to acquire DSM resources. Programs that pass the Rate Impact Measure test offer at least some benefit to all customers and should be non-controversial. Many investor-owned utilities prefer to offer only those DSM programs that pass the RIM test. In an era of increasing competition for economic development and with the specter of open competition for customers in a deregulated electric industry, rate impacts are a serious concern. On the other hand, for many utilities only load management programs will pass the RIM test, in which case, use of this test as minimum criterion will eliminate any conservation programs. In actuality the magnitude of the rate impact for many conservation programs is vanishingly small. As agencies of government, municipal utilities need to consider the societal implications of DSM activities, and may find the Total Resource Cost Test or the Societal Test more appropriate in reflecting the overall welfare of society. As a point of reference, at the time of the Moorhead project the State of Minnesota was primarily relying on the societal test, including environmental externalities, in evaluating the proposed DSM programs of regulated utilities. One additional decision which has to be made in calculating each test is the choice of “discount rate.” DSM programs generally produce benefits for a number of years. For example, if a hospital buying a new chiller selects a more efficient unit because of a rebate offered by the utility, the hospital will see lower electric bills over the entire life of the chiller. Likewise, the utility will see lower peak demand that it would if a standard efficiency chiller had been installed. The benefits from all these future years cannot simply be added together, though, because people 1Further information on externalities is given in Appendix E of the Final Report of the Conservation Programs Task Force, in Tab 3 of the Moorhead case study.

Demand-Side Management for Municipal Utilities
Page 6 Objective II Moorhead Public Service Department
don’t value future savings as much as they value money in their pockets today. It is necessary to discount the stream of future savings, to take into account the fact that future savings are not as valuable. The discount rate used is different for different parties. The same thing applies to streams of costs, such as increased maintenance costs of a more efficient technology, or payments made on a loan used to install the efficiency measure. The following discussion gives more details on each test, including its strengths and weaknesses.2
2Some of the information is drawn from Herman and Chamberlin 1989 and CPUC/CEC 1987, both useful resources in understanding cost-effectiveness tests.

Demand-Side Management for Municipal Utilities
Objective II Page 7 Center for Energy and Environment
Participant Test Perspective: Customers participating in the DSM program. Use: Tests likelihood of successfully marketing the program. Benefits: Reduction in electric bill, incentives received from the utility, [tax credits, if any]. (A few
versions of this test include the participant share of the utility’s avoided costs) Costs: Participant’s gross costs (equipment, operation and maintenance, etc). (A few versions of this
test include the participant share of the utility program costs). Discount rate: Participant’s. Usually taken as the interest rate the participant could earn by putting the same
money into another investment. Sometimes a high rate is used to capture participants’ aversion to the risk that the DSM measure may not give the claimed savings.
Form: Commonly expressed as net present value or as benefit to cost ratio, even though participants themselves normally look at DSM programs in terms of payback or return on investment.
Strengths: Gives a first indication of potential participation. Can help in program design, if it is used to evaluate the incentive level needed to get the NPV, return on investment, or payback to the threshold level at which the desired fraction of customers will participate.
Weaknesses: Does not capture the complexities of customer decision-making processes. Many customers don’t base decisions entirely on quantifiable variables. Doesn’t contribute much to the assessment of DSM as an alternative to supply-side projects such as building new generating capacity.
Figure II.1 Participant Test • Perspective: Program participants.
• Use: Tests likelihood of successfullymarketing program.
• Discount rate: Customer’s.
Electric BillReduction
Incentives
Tax Credits
ParticipantCosts
Benefits
Costs

Demand-Side Management for Municipal Utilities
Page 8 Objective II Moorhead Public Service Department
• Perspective: Utility• Use: Compare costs to utility of various
options for acquiring DSM resources.• Discount rate: Utility’s cost of capital
Avoided Costs -Gen/Trans/Distrib
Capacity
Increased Costs -Gen/Trans/Distrib
Capacity
Utility ProgramCosts
Incentives
Benefits
Costs
Revenue Requirements (RR) Test Perspective: Utility Use: Tests whether achieving conservation or load reduction through the proposed DSM program is
cheaper for the utility than providing the equivalent amount of power, and therefore should be passed by any proposed DSM program. Can be used to rank those DSM program options that pass the test.
Benefits: Avoided costs of generation, transmission and distribution of energy, avoided capital costs of increasing system capacity.
Costs: Utility program costs (marketing, administration, delivery, evaluation, etc), incentives given to participants, [increased costs of generation, transmission, distribution, system capacity, if any]
Discount rate: Utility’s. Generally taken as the utility’s rate of return or cost of capital (as established by regulators for regulated utilities, or through bond issues for municipal utilities).
Form: Commonly expressed as net present value or as benefit to cost ratio. Strengths: Costs include only the utility’s costs, not participant costs, so in this way costs are defined
analogously to supply-side projects. Takes into account who pays costs (utility or customer), which the total resource cost test does not.
Weaknesses: Does not capture rate impacts, because it looks at the average customer and does not distinguish the impacts on participants from those on non-participants. Cannot be used to evaluate load-building projects because the benefit is zero.
Comments: Measures efficiency in terms of total costs to the utility (i.e., the lowest cost way for the utility to acquire a given amount of resources). If a program passes this test, the energy bill of the average customer will drop. But unless rates decrease, only customers who can take advantage of the program will actually experience the drop in their bills. It is not generally difficult to pass this test.
Figure II.2 Revenue
Requirements (RR) Test
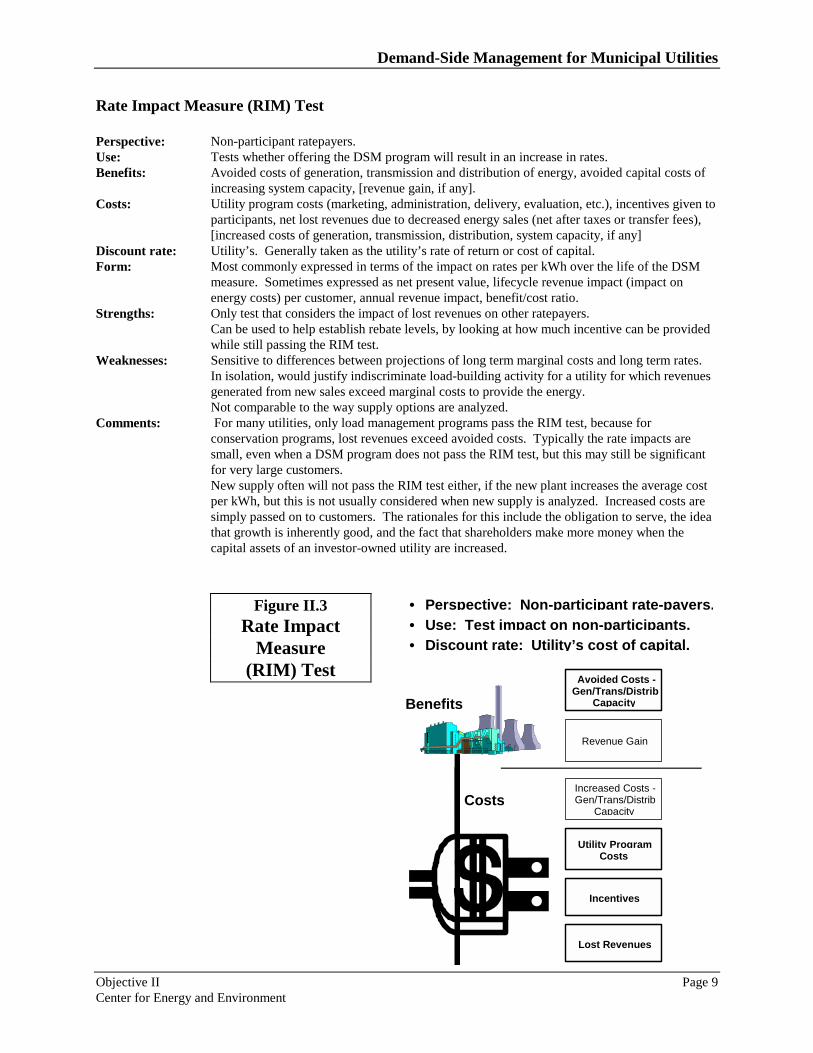
Demand-Side Management for Municipal Utilities
Objective II Page 9 Center for Energy and Environment
Benefits
• Perspective: Non-participant rate-payers.• Use: Test impact on non-participants.• Discount rate: Utility’s cost of capital.
Avoided Costs -Gen/Trans/Distrib
Capacity
Revenue Gain
Increased Costs -Gen/Trans/Distrib
Capacity
Utility ProgramCosts
Incentives
Lost Revenues
Costs
Rate Impact Measure (RIM) Test Perspective: Non-participant ratepayers. Use: Tests whether offering the DSM program will result in an increase in rates. Benefits: Avoided costs of generation, transmission and distribution of energy, avoided capital costs of
increasing system capacity, [revenue gain, if any]. Costs: Utility program costs (marketing, administration, delivery, evaluation, etc.), incentives given to
participants, net lost revenues due to decreased energy sales (net after taxes or transfer fees), [increased costs of generation, transmission, distribution, system capacity, if any]
Discount rate: Utility’s. Generally taken as the utility’s rate of return or cost of capital. Form: Most commonly expressed in terms of the impact on rates per kWh over the life of the DSM
measure. Sometimes expressed as net present value, lifecycle revenue impact (impact on energy costs) per customer, annual revenue impact, benefit/cost ratio.
Strengths: Only test that considers the impact of lost revenues on other ratepayers. Can be used to help establish rebate levels, by looking at how much incentive can be provided while still passing the RIM test.
Weaknesses: Sensitive to differences between projections of long term marginal costs and long term rates. In isolation, would justify indiscriminate load-building activity for a utility for which revenues generated from new sales exceed marginal costs to provide the energy. Not comparable to the way supply options are analyzed.
Comments: For many utilities, only load management programs pass the RIM test, because for conservation programs, lost revenues exceed avoided costs. Typically the rate impacts are small, even when a DSM program does not pass the RIM test, but this may still be significant for very large customers. New supply often will not pass the RIM test either, if the new plant increases the average cost per kWh, but this is not usually considered when new supply is analyzed. Increased costs are simply passed on to customers. The rationales for this include the obligation to serve, the idea that growth is inherently good, and the fact that shareholders make more money when the capital assets of an investor-owned utility are increased.
Figure II.3 Rate Impact
Measure (RIM) Test
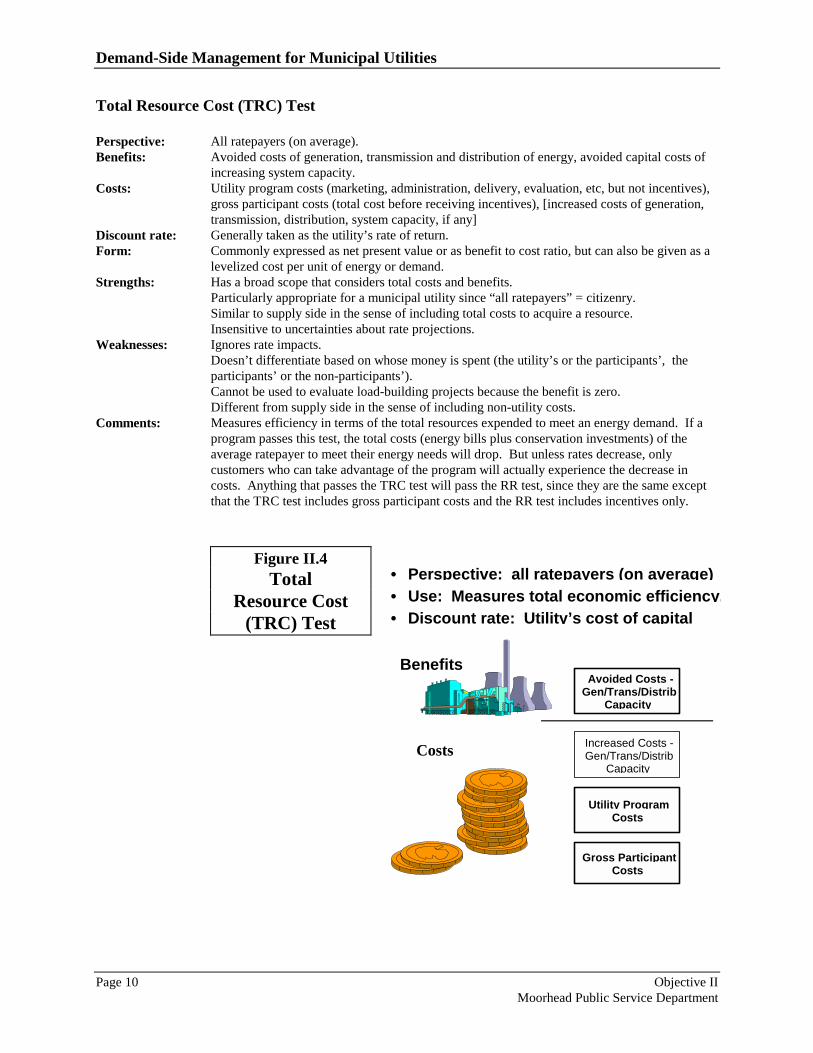
Demand-Side Management for Municipal Utilities
Page 10 Objective II Moorhead Public Service Department
• Perspective: all ratepayers (on average)• Use: Measures total economic efficiency.• Discount rate: Utility’s cost of capital
Avoided Costs -Gen/Trans/Distrib
Capacity
Increased Costs -Gen/Trans/Distrib
Capacity
Utility ProgramCosts
Gross ParticipantCosts
Benefits
Costs
Total Resource Cost (TRC) Test Perspective: All ratepayers (on average). Benefits: Avoided costs of generation, transmission and distribution of energy, avoided capital costs of
increasing system capacity. Costs: Utility program costs (marketing, administration, delivery, evaluation, etc, but not incentives),
gross participant costs (total cost before receiving incentives), [increased costs of generation, transmission, distribution, system capacity, if any]
Discount rate: Generally taken as the utility’s rate of return. Form: Commonly expressed as net present value or as benefit to cost ratio, but can also be given as a
levelized cost per unit of energy or demand. Strengths: Has a broad scope that considers total costs and benefits.
Particularly appropriate for a municipal utility since “all ratepayers” = citizenry. Similar to supply side in the sense of including total costs to acquire a resource. Insensitive to uncertainties about rate projections.
Weaknesses: Ignores rate impacts. Doesn’t differentiate based on whose money is spent (the utility’s or the participants’, the participants’ or the non-participants’). Cannot be used to evaluate load-building projects because the benefit is zero. Different from supply side in the sense of including non-utility costs.
Comments: Measures efficiency in terms of the total resources expended to meet an energy demand. If a program passes this test, the total costs (energy bills plus conservation investments) of the average ratepayer to meet their energy needs will drop. But unless rates decrease, only customers who can take advantage of the program will actually experience the decrease in costs. Anything that passes the TRC test will pass the RR test, since they are the same except that the TRC test includes gross participant costs and the RR test includes incentives only.
Figure II.4 Total
Resource Cost (TRC) Test
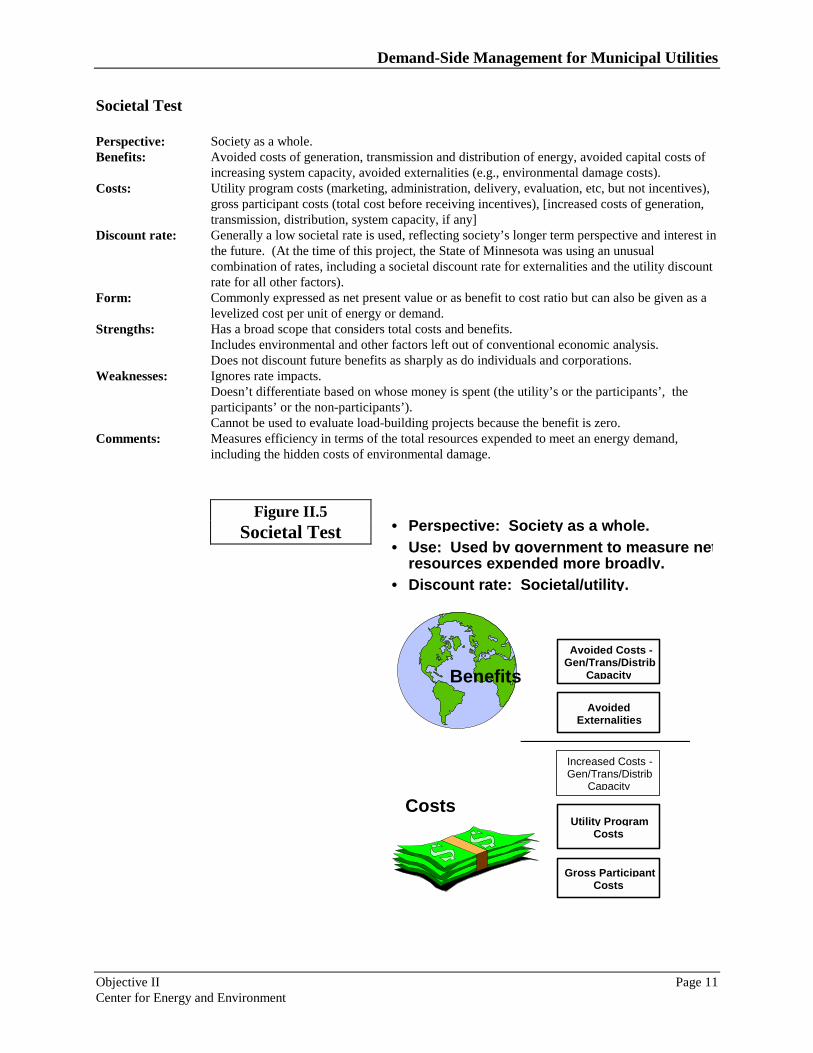
Demand-Side Management for Municipal Utilities
Objective II Page 11 Center for Energy and Environment
• Perspective: Society as a whole.• Use: Used by government to measure net
resources expended more broadly.• Discount rate: Societal/utility.
Avoided Costs -Gen/Trans/Distrib
Capacity
Increased Costs -Gen/Trans/Distrib
Capacity
Utility ProgramCosts
Gross ParticipantCosts
Benefits
Costs
AvoidedExternalities
Societal Test Perspective: Society as a whole. Benefits: Avoided costs of generation, transmission and distribution of energy, avoided capital costs of
increasing system capacity, avoided externalities (e.g., environmental damage costs). Costs: Utility program costs (marketing, administration, delivery, evaluation, etc, but not incentives),
gross participant costs (total cost before receiving incentives), [increased costs of generation, transmission, distribution, system capacity, if any]
Discount rate: Generally a low societal rate is used, reflecting society’s longer term perspective and interest in the future. (At the time of this project, the State of Minnesota was using an unusual combination of rates, including a societal discount rate for externalities and the utility discount rate for all other factors).
Form: Commonly expressed as net present value or as benefit to cost ratio but can also be given as a levelized cost per unit of energy or demand.
Strengths: Has a broad scope that considers total costs and benefits. Includes environmental and other factors left out of conventional economic analysis. Does not discount future benefits as sharply as do individuals and corporations.
Weaknesses: Ignores rate impacts. Doesn’t differentiate based on whose money is spent (the utility’s or the participants’, the participants’ or the non-participants’). Cannot be used to evaluate load-building projects because the benefit is zero.
Comments: Measures efficiency in terms of the total resources expended to meet an energy demand, including the hidden costs of environmental damage.
Figure II.5 Societal Test

Demand-Side Management for Municipal Utilities
Page 12 Objective II Moorhead Public Service Department
Step 2 Select and Customize Software for Benefit/Cost Analysis of Demand-Side Resources.
You could develop your own spreadsheets or other computer programs to carry out benefit/cost analysis on various DSM strategies, but this would be fairly time consuming. It may be easier to use programs that are already available. For the Moorhead project, two options were considered, the DSManager software available from the Electric Power Research Institute (EPRI), and the ELECBEN model available from the Minnesota Department of Public Service. Other options may be available as well. Step 2.1 Select software. Some evaluation criteria to be considered are described below. Information about DSManager and ELECBEN is presented to illustrate tradeoffs and considerations. A Users’ Guide for ELECBEN is presented in Tab 2 of the Moorhead case study. Cost: Cost is certainly a factor in any decision. At the time of the Moorhead project, DSManager was available free to EPRI members, and at a cost of $3000 to municipal utilities with peak demand under 500 MW, and $5000 to all others. ELECBEN was available at no cost, but needed some revisions to correct errors and make it more user-friendly. Data requirements: Utilities’ actual avoided costs are different every day of the year, depending on what mix of supply resources is being used. Benefit/cost tests can be run at varying levels of complexity, requiring various levels of data input. DSManager, for example, needs a minimum of 24 hourly values of impact (DSM program savings) over one typical day, and can accept any level of detail up to 8760 hourly values. Investor-owned utilities most commonly use 48 day types, an average, high and low weekday and an average weekend day for each month of the year. Each day type requires 24 hourly values. Hourly DSM program savings, known as conservation load shapes, are available from EPRI (RELOAD, $15,000) and from other sources such as the Wisconsin Center for Demand-Side Research ($3000 to out of state non-profit corporations, $5000 to for-profit corporations). ELECBEN is a much more simplistic model, requiring only the annual energy impact, the peak month load savings and annual total load savings for the customer, and the peak coincidence and group diversity of the customer demand relative to the utility’s system peak. The hourly load shape approach unquestionably has the potential to be more accurate, but is also more expensive in terms of staff time and acquisition of the necessary load libraries. In addition, it has the potential to become a “black box,” offering less insight into the calculations and potential for error due to inaccurate load shapes. Complexity: The complexity of the software must be compared to the time availability and the capabilities of the staff required to run it. Investor-owned utilities frequently assign a staff person whose full-time job is to operate DSManager and who runs the program for all utility DSM activities. ELECBEN can be operated by anyone with basic spreadsheet skills and high school math skills and an elementary understanding of economic concepts such as net present value.

Demand-Side Management for Municipal Utilities
Objective II Page 13 Center for Energy and Environment
Computer requirements: Most municipal utilities will have the computer hardware necessary to run any DSM benefit/cost model. Even DSManager requires only a 386 microprocessor, 4 Mbytes of RAM and 20 Mbytes of hard disk space for the program and the load shape data. Other users: It may be helpful to use software that is used by other utilities or by regulators. This will facilitate comparison and communication of benefit/cost results. DSManager is used by most investor-owned electric utilities. The Minnesota Department of Public Service is also considering using it in the future. ELECBEN is used primarily by the Minnesota DPS and non-profit energy service providers in Minnesota. However, DPS agrees that it is probably a more realistic tool than DSManager for use by most Minnesota municipal utilities at this time. Capabilities: Available software may differ in terms of its ability to handle various types of DSM programs (conservation, load management, load building) or provide various types of outputs. DSManager, for example, can handle any type of DSM program and can provide any type of output, including benefit/cost ratios, net present value, cost of conserved energy, and other values, for all of the standard tests. At this time, ELECBEN cannot handle certain types of load management programs, such as those that give reduced rates, without considerable finagling and cannot handle load-building programs at all. It provides benefit/cost ratios and net present values for all tests and impact per kWh for the RIM test. Step 2.2 Assemble the utility-specific information needed to customize the software. A number of utility-specific inputs are required to run benefit/cost tests. Some of the inputs required are described below. Beware: It is critical that you study the software and its manual carefully and understand how the calculations work, so that you assign inputs appropriately. Failure to understand the model and to use the right inputs can lead to erroneous conclusions in an area that will have an impact on significant financial decisions. Marginal energy and capacity costs: These avoided costs are among the most important inputs to the analysis. They are described in more detail under Step 3. Depending on how the software is set up, it may be necessary to input variable operations and maintenance savings separately (i.e., O&M costs that are avoided if the system provides less energy or has to meet less demand). Percent line loss: Because of line losses, a kW or kWh saved at a customer’s site actually translates to greater savings at the generating facility, and this is taken into account through a line loss factor. If you purchase all of your power, the line loss factor should be set to take into account the difference between gross purchased power and total system energy consumed. Losses include transmission losses from supplier substations to your substations, as well as line, meter and transformer losses from your substations to retail meters. Total energy sales, customers, and peak demand: These are used in various versions of the rate impact test.

Demand-Side Management for Municipal Utilities
Page 14 Objective II Moorhead Public Service Department
Combined tax rate: This is used in the rate impact measure. When energy sales are decreased through DSM, only the net revenue loss after taxes will have an impact on rates. Municipal utilities do not pay taxes but often pay some kind of “transfer fee” to the municipal government. One option is to treat the transfer fee as a tax, which is justified if you think of the utility as a separate entity from the city and recognize that the fee may far exceed the cost to the city to administer the utility department (thus providing dollars to the city for traditional municipal services that are no different from property tax revenues). Another option is to consider the "utility" to be the city as a whole. Then the lost revenues are 100 percent of the retail dollars not collected due to reduced sales. Since the ratepayers are also the taxpayers, if the city fee dollars were reduced due to a reduction in sales, this would have to be made up through increased taxes or decreased services. In Moorhead, because the RIM test was used as a ranking criterion, it was deemed appropriate to treat the transfer fee as though it were a tax. Retail energy rates and demand charges: These are used in the participant test and in the rate impact test. You must use the rate that applies to the customer class and end use you are analyzing. Utility discount rate: It is recommended that you use the utility’s cost of capital based on recent bond issuances. Be sure to check the software documentation carefully to determine whether you should use a nominal rate that includes both inflation and real growth or a real rate that includes only real growth. An alternative to use of the cost of capital is to use the rate of return on mid to long term investments held by the city (or an average of the cost of capital and the rate of return on investments). Societal discount rate: The Congressional Budget Office uses a real societal discount rate that is pegged to the real interest rate that the US government must pay on government securities, which is about 2 percent (Not coincidentally, this is approximately the same as the projected real rate of economic growth). You may also want to check to see whether your state has set a policy on discount rates for DSM program evaluation or other purposes. Ultimately, you may want input from upper management and/or a citizen advisory group on what value to use. Participant discount rate: This should probably be the rate obtainable from alternative investments. Alternatively, you may wish to use a rate based on current interest rates for customer borrowing, which would yield a higher participant discount rate, and probably better reflects customers’ true willingness to participate at various payback levels. Avoided environmental damage costs: These costs are used in the societal test. Unless there is a regulatory requirement that you use a particular value, you will need to decide what value to use. You may want to get input from your state or other states and then get input from senior management and/or a citizen committee (Further information on externalities or environmental damage costs is given in Appendix E of the Final Report of the Conservation Programs Task Force, in Tab 3 of the case study). For some software it may also be necessary to estimate an escalation rate for the annual increase in real or nominal costs of environmental damages.

Demand-Side Management for Municipal Utilities
Objective II Page 15 Center for Energy and Environment
Step 3 Determine the avoided costs for the energy and demand saved through demand-side management.
Avoided costs are the costs that a utility would be expected to incur were it not for the reduced demand for electricity attributable to a DSM program. Avoided costs include the marginal costs of the generation, transmission and distribution of electricity and the avoided capital costs of additional generation and transmission capacity required to provide the energy. To calculate the cost-effectiveness of DSM programs with reasonable confidence, you will need to accurately estimate the utility’s avoided costs. It is assumed that this manual will be used by municipal utilities that do not produce their own power, but purchase their power from others. If a municipal utility produces its own power, it must estimate its avoided capacity and marginal energy costs using methodologies such as those described in the references. Step 3.1 Review avoided cost information requirements of cost-effectiveness model or
spreadsheet. Different models and spreadsheets for analyzing the cost-effectiveness of conservation programs require input of avoided cost information in different forms and cost units ($/kW, $/MW, $/kWh, etc.). The model or spreadsheet that will be used by the municipal utility should be reviewed so that the avoided cost forecasts that are developed are in an appropriate form and the correct cost units. For example, ELECBEN was designed to use the avoided costs for an annual peak month in benefit cost calculations. Utilities like MPS, which purchase power based on a seasonal or monthly peak, have to adjust the avoided cost data appropriately to give accurate results. Also of critical importance is whether avoided cost values are to be in real terms (ignoring inflation) or nominal terms (including inflation). Step 3.2 Review rate structure in existing power supply contracts. Depending on the rate structure in power supply contracts, a municipal utility's avoided costs resulting from a DSM program may be more than, less than, or equal to its average cost per kW and kWh. The rate structure in existing contracts should be reviewed to determine if demand and energy charges vary depending on the total amount of power purchased or on the overall load factor. If there are price thresholds that may be crossed with implementation of a DSM program, these must be taken into account to accurately estimate avoided costs. Step 3.3 Estimate potential total demand impact of conservation program. If a municipal utility's supply arrangements are such that it faces different demand and energy costs at different levels of total power requirements, the avoided cost per kW and kWh will change as price thresholds are crossed. Therefore, it is necessary to estimate the potential impact of a DSM program before the avoided costs can be estimated. This need not be a precise estimate. If, after assessing conservation program options, it is determined that this preliminary

Demand-Side Management for Municipal Utilities
Page 16 Objective II Moorhead Public Service Department
estimate is substantially erroneous, the avoided cost analysis can be adjusted to better reflect power costs at the appropriate margin. Step 3.4 Obtain avoided cost and price projections from power suppliers. If a municipal utility has a long-term contract with a supplier which contains a fixed schedule of demand and energy charges by year, then this schedule should be used for the municipal utility's avoided cost estimate. It is more likely, however, that long-term contracts provide for unspecified rate adjustments, which requires the municipal utility to rely on less certain estimates of future power costs. The suppliers of power to municipal utilities may produce analyses of avoided capacity and energy costs which can be used as the basis for a municipal utility's avoided cost projection. Note that a supplier's avoided cost estimates, which are based on actual production costs, are not the same as their customers' (i.e., municipal utilities’) avoided costs, which are based on the prices charged by the supplier. Power suppliers may also produce long-range price projections, which can be used by a municipal utility to generate avoided cost forecasts. Price projections are a better measure of a municipal utility's avoided cost than the supplier's avoided cost projections, and the annual rate of increase is generally more constant because the cost peaks associated with new capacity requirements are flattened in the price projections. A municipal utility's avoided costs can be estimated using power suppliers' long range price projections. In addition, if a power supplier's total revenue requirements are known, it may be useful to estimate avoided costs assuming different future scenarios for rate structures that will meet the supplier's revenue requirements. Step 3.5 Assess costs of alternative supply options. If a municipal utility has alternative supply options to satisfy all or a part of its power requirements, then avoided cost and price projections from the alternative supplier should be assessed in the same manner as the current suppliers' projections. If the alternative supply option is for the municipal utility to produce its own power, then the municipal utility must perform a more sophisticated analysis of capacity and marginal energy costs that is beyond the scope of this discussion. Step 3.6 Obtain avoided cost projections from other utilities. For comparison purposes, it may be useful to obtain avoided cost projections from other utilities operating in the region. While the avoided costs of another utility are not directly related to either a supplier's or a municipal utility's avoided cost, they provide a useful benchmark and may incorporate cost factors which a municipal utility may wish to use in its avoided cost projections.

Demand-Side Management for Municipal Utilities
Objective II Page 17 Center for Energy and Environment
Step 3.7 Determine appropriate escalation rates. To project avoided costs over an entire DSM planning time frame (15 to 25 years), it is necessary to escalate demand and energy costs to account for real and nominal price increases. A number of sources can be consulted to obtain real and nominal price projections, including government agencies (the Congressional Budget Office and the Minnesota Department of Public Services) and private research companies, such as Data Resource, Incorporated. Other utilities' avoided cost projections can also be used as a source for real and nominal escalators. Independent estimates of escalation rates serve two useful purposes. First, long-term avoided costs can be projected by applying the escalators to current year avoided costs. Second, the rate of increase projected in power suppliers' long-term avoided cost estimates can be compared to the independent estimates of real and nominal cost increases to establish confidence in the power suppliers' estimates. Step 3.8 Produce avoided cost projections. Most DSM cost-effectiveness spreadsheets require separate input of avoided capacity costs (per kW or MW) and marginal energy costs (per kWh or MWh). To simplify comparison of avoided cost estimates, however, the marginal energy cost per kWh can be converted to cost per kW by multiplying the cost per kWh by the number of hours in the year and the utility's load factor. The product of this calculation can then be added to the annual demand cost per kW to generate a single avoided cost value. Innumerable projections of avoided costs can be produced with different combinations of avoided demand cost, marginal energy cost and escalation assumptions. It is advised that utility staff limit the number of projections to a manageable number, perhaps four or five, in the first set. These should be chosen such that they establish the minimum and maximum range and that they include obvious options (such as the avoided cost projections recommended by power suppliers). The first set of projections can then be assessed based on quantitative comparison and the logical appeal of the assumptions underlying each projection. Additional combinations of assumptions can then be projected, if necessary, to determine if a single projection or a narrow range of projections becomes defensible. Step 3.9 Determine which avoided cost projection(s) to use in cost-effectiveness tests. A municipal utility may agree on a single projection of avoided costs to use in its cost-effectiveness tests, although a second projection may be used to test the sensitivity of the cost-effectiveness result to the choice of avoided cost assumptions. Projecting avoided costs is not an exercise that can be performed with total confidence, and utility staff are cautioned against spending too much time estimating and validating avoided costs. In the end, decision makers and other stakeholders may differ over the correct set of

Demand-Side Management for Municipal Utilities
Page 18 Objective II Moorhead Public Service Department
avoided cost assumptions. In many cases, other assumptions pertaining to program costs, participation, consumption impact, persistence of savings, discount rates and environmental externality costs will be more significant determinants of the cost effectiveness of conservation programs. Upon completion of the steps outlined above, the municipal utility will have determined the projected avoided costs it will assign to conservation programs in cost-effectiveness tests. Avoided costs for capacity (or demand) and energy will be estimated for each year of the DSM planning period. The municipal utility may choose to use a single forecast of avoided demand costs and avoided energy costs. Alternatively, it may select more than one forecast using different sets of assumptions to test the sensitivity of the cost-effectiveness outcome to different assumptions. Step 4 Analyze the cost-effectiveness of demand-side measures with various common
load shapes. When you begin to gather information on potential programs, it will be extremely helpful to have some idea what types of programs are likely to be cost-effective. For example, should you look primarily for programs that reduce peak demand, or for programs that save energy 24 hours a day year round? What about programs with load shapes in between these two extremes? How much could you afford to spend on programs of these various types? A very helpful way to gain insight into these issues is to use the customized benefit/cost tool you have developed in Steps 2 and 3 to analyze the cost-effectiveness of DSM measures with various prototypical load shapes. Step 4.1 Select and analyze prototypical load shapes. DSM measures tend to fall into load shape categories. The following load shapes cover a broad spectrum and should give you a good basis for screening potential programs. • peak shaving: reduces peak demand but does not save energy • twenty-four hour constant load: reduces energy by a nearly constant amount year round • business hour constant load: reduces energy by a nearly constant amount during normal
business hours • off-peak: saves energy but does not reduce demand at the time of the utility’s peak • proportional to utility load: saves most at the same time that system demand is highest, has
the same overall load factor as the utility system If you are using a program like DSManager that can take more sophisticated load variations into account, you may also want to look at programs that save energy only in the winter or only in the summer. With a program like ELECBEN, these load shapes can be taken into account simply by reducing the kWh saved and assigning coincident demand savings based on whether the utility is a summer- or winter-peaking utility. These load shapes can be loaded into the software you are using. Assign a value of zero to program costs and participant costs. You will also need to input an assumed measure life, i.e.,
Demand-Side Management for Municipal Utilities
Objective II Page 19 Center for Energy and Environment
the length of time that the DSM measure will remain in place and effective. If you have time, you can run the analyses for several different measure lives. Another type of sensitivity analysis that may be beneficial to do is to run the societal test with various values of for externalities. This will give you an indication of how sensitive cost-effectiveness is to the externality value you select, and may help you in selecting a value in Step 5. Step 4.2 Interpret the results. Table II.1 shows the results of an analysis of prototypical load shapes for Moorhead Public Service. The assumptions are shown at the bottom of the table, including measure life, avoided costs, externalities, and the demand and energy savings for each load shape. There is a block of results for each class of customers that pays a different retail rate. Net present values are given in $/kW of utility peak-coincident demand savings and of $/kWh saved over the life of the measure. Taking a business-hour constant load program for the small commercial and industrial class as an example, you can see that a program with this load shape has a net present value using the RIM test of $697/kW.3 This means that the utility can afford to spend up to $697 to achieve one kW of demand reduction through a DSM measure with this load shape without negatively impacting rates. The load shape has a net present value to the customer of $1393, which means that the customer can afford to spend up to $1393 on equipment and O&M for a measure with this load shape and still have a positive life-cycle cost. (It should be noted, however, that customers don’t usually make decisions on a life-cycle cost basis, so it may be more appropriate to use more detailed outputs to look at customer payback.) The load shape has a net present value using the societal test of $1861. This means that the utility and the customer together can afford to spend up to $1861 and still pass the societal test. By comparison, a program with a 24 hour constant load shape has a negative net present value of -$256/kW. A program of this type cannot pass the RIM test given MPS’s avoided costs. However, it has NPV’s under the revenue requirements test and the societal test even higher than the business hours program. Whether such programs should be offered is clearly a policy decision. Note that the peak shaving program has a NPV to the participant of zero, so some type of incentive, such as reduced rates, is required for participation. The maximum amount the utility could spend for such a program and still pass RIM test would be $919/kW. This amount would need to cover program administration, marketing, delivery and other costs as well as the cost of the reduced rates over the life of the customers’ participation.
3 ELECBEN shows both a “Minnesota” RIM test and a “California” RIM test. The California test conforms to standard practice in the industry, while the Minnesota test is unique to Minnesota.

Demand-Side Management for Municipal Utilities
Page 20 Objective II Moorhead Public Service Department
TableII.1. Cost-Effectiveness Analysis of Prototypical Load Shapes for Moorhead Public Service
RESIDENTIAL Standard B/C Test Perspectives Scenarios Criterion Revenue RIM Societal Participant 1. Peak Shaving NPV/kW $919 $919 $944 $0 NPV/kWh N/A N/A N/A N/A 2. 24-hr Const Load NPV/kW $2,862 $76 $2,939 $3,483 NPV/kWh $.0327 $.0009 $.0336 $.0398 3. Bus. hr Const Load NPV/kW $1,811 $816 $1,861 $1,244 NPV/kWh $.0579 $.0261 $.0595 $.0397 4. No Peak Demand Savings NPV/kW N/A N/A N/A N/A NPV/kWh $.0187 -$.0131 $.0191 $.0397 5. Prop. to Util. Load NPV/kW $2,183 $554 $2,242 $2,036 NPV/kWh $.0426 $.0108 $.0438 $.0398 SMALL C&I Standard B/C Test Perspectives Scenarios Criterion Revenue RIM Societal Participant 1. Peak Shaving NPV/kW $919 $919 $944 $0 NPV/kWh N/A N/A N/A N/A 2. 24-hr Const Load NPV/kW $2,862 -$256 $2,939 $3,897 NPV/kWh $.0327 -$.0029 $.0336 $.0445 3. Bus. hr Const Load NPV/kW $1,811 $697 $1,861 $1,393 NPV/kWh $.0579 $.0223 $.0595 $.0445 4. No Peak Demand Savings NPV/kW N/A N/A N/A N/A NPV/kWh $.0187 -$.0169 $.0191 $.0445 5. Prop. to Util. Load NPV/kW $2,183 $360 $2,242 $2,278 NPV/kWh $.0426 $.0070 $.0438 $.0445 LARGE C&I Standard B/C Test Perspectives Scenarios Criterion Revenue RIM Societal Participant 1. Peak Shaving NPV/kW $919 $709 $944 $262 NPV/kWh N/A N/A N/A N/A 2. 24-hr Const Load NPV/kW $2,862 $961 $2,939 $2,376 NPV/kWh $.0327 $.0110 $.0336 $.0271 3. Bus. hr Const Load NPV/kW $1,811 $593 $1,861 $1,523 NPV/kWh $.0579 $.0190 $.0595 $.0487 4. No Peak Demand Savings NPV/kW N/A N/A N/A N/A NPV/kWh $.0187 $.0021 $.0191 $.0207 5. Prop. to Util. Load NPV/kW $2,183 $1,073 $2,242 $1,387 NPV/kWh $.0427 $.0210 $.0438 $.0271 Scenarios (all with 10 yr measure lives)
Customer kW/Mo
Util Peak Coincidence
Customer kW/Yr
Customer kWh/Yr
(item 32a) (item 30a) (item 32b) (item 29) 1. Peak Shaving 1.00 1.00 3.00 0 2. 24-hr Const Load 1.00 1.00 12.00 8760 3. Bus. Hour Const Load 1.00 1.00 12.00 3130 4. No Peak Demand Savings 1.00 0.00 2.00 3130 5. Prop. to Utility Load 1.00 1.00 7.00 5120 NPV/kW = net present value divided by the utility peak-coincident demand savings NPV/kWh = net present value divided by total kWh saved over life of measure Avoided costs = MPS power contracts, phasing from Tier 2 to Tier 1 Adjustment for transfer fee in RIM test = 20% (so lost revenues = 80% of lost retail sales) Externalities in societal test = $0 Zero program costs and participant costs

Demand-Side Management for Municipal Utilities
Objective II Page 21 Center for Energy and Environment
Analyses of this type will give you a good indication of the load shapes that will tend to be cost-effective. You can use this understanding in qualitative screening of a long list of DSM measures to estimate which ones are most likely to be cost-effective in your situation. Table II.2 explores the sensitivity of the Societal Test to the value assigned to externalities for programs with a 10 year measure life and various load shapes. Using the residential results as an example, you can see that the peak shaving program is not at all sensitive to externality assumptions, because the program saves no energy and therefore avoids no energy-related environmental costs. For a program with savings proportional to utility load, going from zero externalities to the maximum value considered ($0.032/kWh) increases the amount that could cost-effectively be spent by 70 percent. You can use this type of information as input to your decision about what value of externalities to use. Step 5 Obtain community input and finalize criteria for evaluating demand-side
resources. Ultimately, decisions about which DSM activities to pursue are a matter of public policy and political will. While staff can identify issues, direction from upper management, the City Council and the community is absolutely essential to establish the direction for DSM. Specific questions which absolutely require policy input are: • which cost-effectiveness tests to use and how to use them, • what values of environmental externalities and discount rates to use, • how to address equity across customer classes, equity across income groups, and other
qualitative factors. One way to obtain input is to convene an advisory committee or task force. This group should represent a cross-section of interests, including very large customers, small businesses, and residents. The individuals chosen to serve on the task force should be opinion leaders in the community. Objectives of the process are to: • develop a better understanding of the impacts of DSM on customers, and of their needs and
concerns • identify and address problems/opposition • assure that the opinion leaders will actively support the utility’s DSM plan. Depending on your understanding of your community, you could augment or replace this with public meetings or other processes. The process used by Moorhead Public Service to obtain community input is described in the Final Report of the Conservation Programs Task Force, in Tab 3 of the case study.

Demand-Side Management for Municipal Utilities
Page 22 Objective II Moorhead Public Service Department
Table II.2. Societal Cost-Effectiveness of Prototypical Load Shapes for Moorhead Public Service with Various Externality Values
RESIDENTIAL Societal Test Perspective, Various Externality Values Scenarios Criterion Societal, zero Societal, min Societal, max 1. Peak Shaving NPV/kW $944 $944 $944 NPV/kWh N/A N/A N/A 2. 24-hr Const Load NPV/kW $2,939 $3,631 $5,710 NPV/kWh $.0336 $.0415 $.0652 3. Bus. hr Const Load NPV/kW $1,861 $2,108 $2,851 NPV/kWh $.0595 $.0674 $.0911 4. No Peak Demand Savings NPV/kW N/A N/A N/A NPV/kWh $.0191 $.0271 $.0508 5. Prop. to Util. Load NPV/kW $2,242 $2,647 $3,862 NPV/kWh $.0438 $.0517 $.0754 SMALL C&I Societal Test Perspective, Various Externality Values Scenarios Criterion Societal, zero Societal, min Societal, max 1. Peak Shaving NPV/kW $944 $944 $944 NPV/kWh N/A N/A N/A 2. 24-hr Const Load NPV/kW $2,939 $3,631 $5,710 NPV/kWh $.0336 $.0415 $.0652 3. Bus. hr Const Load NPV/kW $1,861 $2,108 $2,851 NPV/kWh $.0595 $.0674 $.0911 4. No Peak Demand Savings NPV/kW N/A N/A N/A NPV/kWh $.0191 $.0271 $.0508 5. Prop. to Util. Load NPV/kW $2,242 $2,647 $3,862 NPV/kWh $.0438 $.0517 $.0754 LARGE C&I Societal Test Perspective, Various Externality Values Scenarios Criterion Societal, zero Societal, min Societal, max 1. Peak Shaving NPV/kW $944 $944 $944 NPV/kWh N/A N/A N/A 2. 24-hr Const Load NPV/kW $2,939 $3,631 $5,710 NPV/kWh $.0336 $.0415 $.0652 3. Bus. hr Const Load NPV/kW $1,861 $2,108 $2,851 NPV/kWh $.0595 $.0674 $.0911 4. No Peak Demand Savings NPV/kW N/A N/A N/A NPV/kWh $.0191 $.0270 $.0508 5. Prop. to Util. Load NPV/kW $2,242 $2,647 $3,862 NPV/kWh $.0438 $.0517 $.0754 Scenarios (all with 10 yr measure lives)
Customer kW/Mo
Util Peak Coincidence
Customer kW/Yr
Customer kWh/Yr
(item 32a) (item 30a) (item 32b) (item 29) 1. Peak Shaving 1.00 1.00 3.00 0 2. 24-hr Const Load 1.00 1.00 12.00 8760 3. Bus. Hour Const Load 1.00 1.00 12.00 3130 4. No Peak Demand Savings 1.00 0.00 2.00 3130 5. Prop. to Utility Load 1.00 1.00 7.00 5120 NPV/kW = net present value divided by the utility peak-coincident demand savings NPV/kWh = net present value divided by total kWh saved over life of measure Avoided costs = MPS power contracts, phasing from Tier 2 to Tier 1 Retail rate differences between classes do not enter into the societal test perspective Externalities in societal test = $0.0000, $0.0080 minimum, and $0.0320 maximum per kWh (coal-fired) Utility and Participant program costs = $0 (so NPV = amount “society,” i.e., utility plus participant can afford to spend per kW or per kWh)

Demand-Side Management for Municipal Utilities
Objective II Page 23 Center for Energy and Environment
Outcome When you have completed the steps outlined above, you will have developed all of the criteria and input data needed to evaluate the cost-effectiveness and other benefits of potential DSM programs. In objective III, you will develop a “long list” of program options and screen them based on technical and market potential, cost-effectiveness, and other factors to identify a “short list” of the most promising programs. Resources Berman, John, and Douglas Logan, 1990. “A Comprehensive Cost-Effectiveness Methodology for Integrated Least-Cost Planning. Proceedings of the ACEEE Summer Study on Energy Efficiency in Buildings. V.5 p. 5.5-5.16. Washington, DC: American Council for an Energy Efficient Economy. California Public Utilities Commission and California Energy Commission, 1987. Standard Practice Manual: Economic Analysis of Demand-Side Management Programs. Duke Power Company, 1989. Least Cost Integrated Resource Planning 1989. Charlotte, NC. Dunsworth, T. and M. Hewett., 1993. Users Guide for ELECBEN: A Spreadsheet Tool for Cost-Effectiveness Screening of Electric Utility Conservation Programs. Minneapolis, MN: Center for Energy and Environment. EPRI, 1986. The COMMEND Planning System: National and Regional Data and Analysis. Atlanta, GA: Electric Power Research Institute. EPRI, 1987. Cost-Benefit Analysis of Demand-Side Planning Alternatives. EM-5068. Palo Alto, CA: Electric Power Research Institute. Energy Information Administration, 1990a. Assumptions for the Annual Energy Outlook, 1990. Washington, D.C. DOE/EIA-0527(90). February 13. Energy Information Administration, 1990b. Annual Outlook for U.S. Electric Power: Projections Through 2010. Washington, D.C. DOE/EIA-0474(90). June 14. Energy Information Administration, 1991. Annual Energy Outlook: With Projections to 2010. Washington, D.C. DOE/EIA-0383(91). March 18.
Gettings, M., E. Hirst, and E. Yourstone, 1991. Diamond: A Model of Incremental Decision Making for Resource Acquisition by Electric Utilities. Oak Ridge, TN: Oak Ridge National Laboratory. ORNL/CON-315.

Demand-Side Management for Municipal Utilities
Page 24 Objective II Moorhead Public Service Department
Herman, Patricia, and John H. Chamberlin, 1989. “Cost-Effectiveness Enlightenment: Which is the Right Test?” Proceedings of the 1989 Conference on Energy Program Evaluation. Chicago: Argonne National Laboratory. Hill, L.J., E. Hirst, and M. Schweitzer, 1991. Integrating Demand-Side Management Programs into the Resource Plans of U.S. Electric Utilities. Oak Ridge, TN: Oak Ridge National Laboratory. ORNL/CON-311. Hirst, E. and M. Schweitzer, 1988. Uncertainty in Long-Term Resource Planning for Electric Utilities. Oak Ridge, TN: Oak Ridge National Laboratory. ORNL/CON-272. Hirst, E., 1991b. The Effects of Utility DSM Programs on Electricity Costs and Prices. Oak Ridge, TN: Oak Ridge National Laboratory. ORNL/CON-340. Koomey, J., R. Rosenfeld, and A. Gadgil., 1990. "Conservation Screening Curves to Compare Efficiency Investments to Power Plants: Applications to Commercial Sector Conservation Programs," Proceedings, ACEEE Summer Study on Energy Efficiency in Buildings. Integrated Resource Planning. Minnesota Department of Public Service, 1992. Transition Into the 21st Century. St. Paul, MN: Minnesota Department of Public Service. National Association of Regulatory Utility Commissioners, 1988. Least-Cost Utility Planning Handbook for Public Utility Commissioners. Vol 2., The Demand Side: Conceptual and Methodological Issues. Washington D.C. Northern States Power Company, 1992. Cogeneration and Small Power Production. Submitted to Minnesota Public Utilities Commission. State of Minnesota, 1985. Minnesota Rules, Chapter 7835. UCS, 1992. America's Energy Choices: Investing in a Strong Economy and a Clean Environment: Technical Appendixes. Cambridge, MA: Union of Concerned Scientists. Note: Reference materials that specifically address avoided cost assumptions that apply to a municipal utility may be obtained from the municipal utility’s electricity suppliers.

Demand-Side Management for Municipal Utilities
Objective III Page 1 Center for Energy and Environment
OBJECTIVE III: IDENTIFY MOST PROMISING PROGRAMS
Purpose The purpose of this objective is to identify those programs that best meet your DSM objectives. The “best” programs are defined in terms of technical and market potential, cost-effectiveness, and other qualitative factors. Process The first step in identifying promising programs is to review the information generated in Objective I to determine which sectors and end uses account for the greatest share of peak demand and energy use for your utility. This will enable you to focus your search for effective technologies and programs on those customer classes and end uses where significant energy or demand is used. The second step is to develop a “long list” of programs to consider. This comprehensive list will help to assure that no significant opportunities are overlooked. At the same time, it will give you an understanding of a broad range of DSM technologies and program strategies. The next step is to screen the long list. The short list of program strategies that come through the screening process must then be examined in more detail. Preliminary estimates of measure costs, program costs, participation, and energy and demand savings should be made. Cost-effectiveness and other qualitative criteria should be evaluated in sufficient detail to allow sound decisions to be made. Step 1 Identify the Most Significant End Uses and Equipment Types Based on Results
of Objective I, Step 2 In Objective I, energy sales and system peak demand were broken into components by market segment and end use. Reviewing the results of this analysis will show you which sectors and end uses consume the most energy and contribute the most to peak demand. These should be the primary focus of your search for effective technologies and programs. For example, MPS determined that their commercial and industrial sectors, while comprising only 13 percent of customers, accounted for 60 percent of energy sales. Manufacturing facilities account for 28 percent of MPS’s C&I electric sales, followed by schools (16%) and then by office, retail, groceries, restaurants and health facilities, at about 6 to 9 percent each. They determined that lighting was the largest end use for commercial customers (47%), though heating and cooling made significant contributions to winter and summer peak demand. Motors were by far the largest end use for industrial customers (72%), as well as the largest contributors to summer and winter peak demand. For residential customers, electric heat and hot water each accounted for 21 percent of sales, with lighting and refrigerators following at about 13 or 14 percent. Cooling accounts for little energy use, but is the largest contributor to residential

Demand-Side Management for Municipal Utilities
Page 2 Objective III Moorhead Public Service Department
summer peak demand. This information allowed MPS to focus their search for promising programs on commercial lighting, heating and cooling, industrial motors, and residential heating, water heating, lighting, refrigerators and cooling. Step 2 Gather information on DSM programs and develop a “long list” of programs to
consider. Step 2.1 Assemble sources of information on technologies and program strategies. Numerous sources are available for use in compiling a list of potential program strategies. These generally fall into several categories, each of which is described below. DSM Technology or Program Information Services These are private services which compile technical and program information for use by
subscribers. The information is detailed, comprehensive and up-to-date. While it is expensive, it can pay for itself in time saved assembling similar information from more diverse sources. The two services we are currently familiar with are:
E SOURCE (formerly Competitek), a subsidiary of Rocky Mountain Institute 1050 Walnut St., Boulder, CO 80302-5140 (303) 440-8500 E SOURCE is a clearinghouse for information on electric end-use efficiency. E
SOURCE offers comprehensive, periodically updated "State of the Art Technology Atlases" on various end uses. For example, atlases are available on drivepower, lighting, water heating, appliances, and space cooling. In addition, E SOURCE offers a newsletter, conferences, direct consultation, and other services. In 1993, the annual membership for electric utilities with annual sales less than 1 billion kWh was $5,000. Members receive a complete set of atlases upon joining, and new or revised editions of at least two volumes each year.
Results Center P.O. Box 2239 Basalt, CO 81621 (970) 927-3155 The Results Center began in 1992. As of early 1995, they had completed 120 case studies
of successful energy efficiency programs for all sectors, located throughout the U.S. and in other countries as well. Each profile is about 20 pages in length and provides considerable detail on the program design, costs, savings, lessons learned, etc. The Results Center also provides comparative papers, client support, and other services. In 1995, membership costs ranged from $500 to $10,000 for various levels of service. The lowest membership fee offering access to program profiles was $3,000.

Demand-Side Management for Municipal Utilities
Objective III Page 3 Center for Energy and Environment
Technical Potential Studies A number of states and utilities have conducted technical potential studies, including
Northeast Utilities, the Northwest Power Planning Council, Pacific Gas and Electric Company, the State of Minnesota and the State of Rhode Island. These can vary considerably in quality. A list of technical potential studies is given under “Resources” at the end of this chapter.
Technology Assessments Technology assessments have been conducted by a number organizations, including the
Electric Power Research Institute, the Association of Demand-Side Management Professionals, Lawrence Berkeley Laboratory, and the Center for Energy and Environment. A list of some of these assessments is given in the section on “Resources” at the end of this chapter. A number of them are old compared with information available from subscription services.
In addition, Lawrence Berkeley Laboratory maintains a database of studies which actually
measure the performance of efficiency measures, called the Buildings Energy-Use Compilation and Analysis database. It is segmented by sector, and within sector by new construction and retrofit. Further information may be obtained from LBL, One Cyclotron Road, Berkeley, CA 94720.
Surveys of Utility Programs Surveys of utility programs can also provide input on the types of technologies being
promoted and the types of program services being offered. Periodic surveys are conducted by the Electric Power Research Institute for all sectors. In addition, the American Council for an Energy Efficient Economy, Association of Demand-Side Management Professionals, and Center for Energy and Environment have conducted surveys of utility programs. A list is given in under “Resources.”
Conservation Improvement Program Filings The large regulated utilities in Minnesota, including Northern States Power Company,
Minnesota Power, Otter Tail Power and Interstate Power, are required to file Conservation Improvement Program plans every two years (odd years, in August/September). In addition, they file miscellaneous filings between these dates. Their CIP plans provide another source of information on technology and program options. All filings are available for review at the Minnesota Department of Public Service, Suite 200, 121 7th Place East, Saint Paul, 55101. To obtain copies of future filings, you can be added to the CIP service lists by contacting the specific utilities you are interested in. You can contact the Minnesota Department of Public Service to obtain a current list of utility company contacts for maintenance of CIP service lists. At the time of this writing, the appropriate DPS staff person was Roxanne Colby at (612) 296-9314.

Demand-Side Management for Municipal Utilities
Page 4 Objective III Moorhead Public Service Department
Published Research Research on individual technologies is published in many places. Three of the best
sources are: Proceedings of the American Council for an Energy Efficient Economy Summer Study on
Energy Efficiency in Buildings. Biennial, even years. Generally published in about 10 volumes, and available only as a complete set. Cost less than $200 per set. ACEEE, 1001 Connecticut Ave., NW, Suite 801, Washington, DC 20036. (202) 429-8873.
Proceedings of the Energy Program Evaluation Conference. Biennial, odd years.
Argonne National Laboratory, Argonne, IL. Cost is about $50. ASHRAE Transactions. Published twice yearly. Available in most university libraries.
Cost is about $230 annually for members, $340 for non-members. American Society of Heating, Refrigerating and Air-Conditioning Engineers, 1791 Tullie Circle, Atlanta, GA 30329. (404) 636-8400.
Some specific research reports used in conducting the Moorhead case study are listed
under “Resources.” Review the list of suggested resources and obtain those that you feel will be most helpful to you in identifying promising programs. Work through these resources, as well as other materials you may have available, to identify promising options. Step 2.2 Compile comprehensive list, sorted by sector and end use. It is also helpful to compile a central list to keep the vast number of options organized, and to provide a convenient format for recording information about each option prior to screening. In screening technology and program options, a major factor will be the significance of the sector (customer class) and end use to your utility. Therefore, it is helpful to organize the list of potential measures by sector and end use. The long list of technologies and program strategies identified for the MPS case study are given in the reports, Commercial and Industrial End-Use Analysis and Program Screening for Moorhead Public Service (Table 34), and Residential End-Use Analysis and Program Screening for Moorhead Public Service (Table 26) in Tab 1 of the case study. You may want to use these lists as a starting point, and refer to the above sources only to check that nothing of interest in your service territory has been overlooked. Keep in mind, however, that the important end uses in your service territory could be different from those for MPS. In addition, the field of energy-efficiency is advancing rapidly, so new measures may be available, and old measures may have become standard practice. Finally, the specter of deregulation and competition is driving utilities to make their DSM programs less costly. This is likely to engender a trend away from customer rebates toward strategies with lower rate impacts, such as rebates to manufacturers and increased

Demand-Side Management for Municipal Utilities
Objective III Page 5 Center for Energy and Environment
use of attractively structured financing packages. To identify the best opportunities, you will have to get up to the minute information on trends in the industry and on new and innovative program designs. Step 3 Screen Long List Based on Technologic and Market Potential, Probable Cost-
Effectiveness to the Utility and Other Factors. This step provides a systematic, objective procedure for screening the long list of conservation programs, based on the factors identified in Objective II, Step 1, so that the most promising programs are reliably identified without requiring detailed analysis of all possible programs. A primarily qualitative approach is used, allowing many options to be reviewed without requiring excessive time to gather background information, develop detailed assumptions, and conduct analyses. Step 3.1 Identify the key characteristics of each potential program on the long list, in
terms of the screening criteria. Among the key screening criteria are the technical and market potential for energy and demand savings. Given limited budgets and staff resources, it only makes sense to focus attention on those areas where the largest potential exists. As discussed in step 1, those customer classes and end uses accounting for significant energy use and demand are the most likely to have high potential. Within these end use areas, high potential will exist where technologies are commercially available that can significantly reduce energy use and/or demand, where these technologies have fairly low current market penetration, and where, with reasonable incentives and other market support, the technologies can be made sufficiently attractive to customers to produce increased market penetration. At this stage, technical and market potential are estimated qualitatively based on familiarity with efficient technologies, in terms of their energy use or demand relative to baseline technologies, their current market penetration, and perceptions of the technologies among trade allies and customers. For example, MPS knew from its end use analysis and customer survey that lighting is a large end use and that their average C&I customer lights 74 percent of his floor area with fluorescent lighting. From their familiarity with lighting technologies, they knew that lighting measures such as replacement of standard T12 lamps and electromechanical ballasts with T8 lamps and electronic ballasts could produce large energy and demand savings. Their survey showed that only 8 to 21 percent of customers had implemented various lighting measures, and they knew from energy audits and discussions with customers that these technologies had not made significant inroads into their service territory. They also knew that prices were coming down. These factors, taken together, indicated that the technical and market potential for energy and demand savings from a commercial lighting program would be high. Likely cost-effectiveness is another key screening criterion. In Objective II, you established your cost-effectiveness criteria. In addition, you analyzed various prototypical conservation load shapes to determine their cost-effectiveness in terms of these criteria. For example, MPS decided to use the societal test as the minimum criterion to be passed by its DSM programs, and to use

Demand-Side Management for Municipal Utilities
Page 6 Objective III Moorhead Public Service Department
the rate impact measure (RIM) test to help rank these potential programs. Therefore, MPS’s screening of the “long list” for cost-effectiveness focused on the societal and RIM tests. Through analysis of the prototypical load shapes, MPS determined which types of programs were likely to pass these tests. For example, commercial lighting generally has a “business day constant load” shape. Analysis of the prototypical load shapes showed that for customers on large C&I rates, measures of this type have a net present value of $1,861/kW on the societal test and $593/kW on the RIM test. This means that the utility and customer together could afford to spend $1,861 to achieve 1 kW of peak-coincident lighting demand reduction and still pass the societal test. MPS could afford to spend $593/kW on rebates, program marketing and administration, and other costs, and still pass the RIM test. For customers on small C&I rates results were the same for the societal test, but MPS could afford to spend $697/kW and still pass the RIM test. Compared with MPS’s intuitive feel for costs, it appeared that this type of program could be highly cost-effective in terms of the societal test, and could pass the RIM test. By comparison, a twenty-four hour, fairly constant load savings, such as might be obtained with a residential refrigerator program, has a higher NPV on the societal test, but a much lower NPV of $76/kW on the RIM test, and so would likely not pass the RIM test, assuming incentives plus program costs exceeded $76/kW. Finally, other qualitative criteria must be considered, as identified in Objective II, Step 1.2, including equity across customer classes, equity across income levels, economic development impacts, lost opportunities, delivery feasibility and unique opportunities for municipal utilities. For example, a lighting rebate program is relatively easy to deliver and requires limited staff. A direct installation lighting program is likely to do better at reaching small customers and to reduce the proportion of free riders, but requires more staff. In comparing these two program options, these differences were critical for MPS, a small utility with only one full time staff person assigned to DSM, along with other responsibilities. MPS’s characterization of the long list of programs, in terms of savings potential, load shape impact, probable cost effectiveness, and qualitative factors, is given in the Tab 1 of the case study, in the reports titled Commercial and Industrial End-Use Analysis and Program Screening for Moorhead Public Service (Table 34), and Residential End-Use Analysis and Program Screening for Moorhead Public Service (Table 26). Step 3.2 Rank and weight the screening criteria according to importance to the utility. At this point, you need to evaluate the relative importance of the various screening criteria to your utility. The key criteria, again, are technical and market potential, cost-effectiveness, and such qualitative factors as equity across customer classes, equity across income levels, economic development impacts, customer retention, customer satisfaction, lost opportunities, delivery feasibility (ease of implementation), and unique opportunities for municipal utilities. Like most utilities, Moorhead wanted to focus on areas with significant technical and market potential, and with a high probability of cost-effectiveness. However, ease of implementation was also a highly ranked criterion, since any project had to be completed by one full-time staff person with other, non-DSM responsibilities and one or two part time interns. In addition, staff

Demand-Side Management for Municipal Utilities
Objective III Page 7 Center for Energy and Environment
wanted to come through the screening process with something for each key customer sector - industrial, commercial and residential, as well as something specifically for the few very large customers, so equity across customer classes was a highly ranked criterion. In the new, competitive utility environment, customer retention will be a highly ranked criterion, as well. Step 3.3 Score each program on the long list on how each program will achieve the key
criteria. Scoring can be as simple as a “high, medium, low, fail” system or a series of numbers from 1 to 10. Step 3.4 Using the weighing and scoring Step 3.3, rank each program on the long list. Step 3.5 Determine a break point for further analysis during this iteration of the
conservation planning process, and assemble the short list of programs for further analysis
Determine how many potential programs you can realistically analyze in depth. Keep in mind that the analysis to be undertaken in Steps 4 and 5 must be accurate enough to provide a sound basis for decisions on significant utility expenditures. We suggest that at least five and no more than twenty programs make it to the short list. We suggest that the assumptions used to screen each program be included on the short list of programs in order to facilitate verification of these assumptions through further analysis. Step 4 Estimate Costs, Participation Levels, Savings and Other Factors for Screened
List of Programs. This step will require you to dig into end use technologies and program alternatives in detail. First, assemble data on energy and demand savings, measure life, measure costs, program costs from other utilities’ programs, current market penetration (local, regional, or national, as available), and qualitative factors for the short list of conservation programs. The resources identified under Step 2 will be a good starting point in generating the needed information. Assign a value or a range of values for measure costs, incentive levels, other anticipated program costs (marketing, administration, evaluation, etc), participation levels, energy and demand savings, group diversity, peak coincidence and proportion of free riders for the short list of programs. Step 5 Test cost-effectiveness of screened list and review qualitative factors. Input the middle values or a range of values from Step 4 into the software to be used to test cost-effectiveness and run the analysis. Review the results of the benefit cost tests. Repeat the analyses as necessary to determine the sensitivity of each program to the assumptions, until you are confident of the results.

Demand-Side Management for Municipal Utilities
Page 8 Objective III Moorhead Public Service Department
Compare the results of the cost-effectiveness analysis with the cost-effectiveness assumptions used to rank the models. Adjust the ranking of the programs on the screened list and eliminate any programs that no longer meet the utility criteria. Review the qualitative evaluations that you made for these programs in Step 3.1 in light of any new insights you gained in reviewing relevant resources for Step 4, and adjust your qualitative assessments as appropriate. Outcome When you have completed the steps outlined above, you will have developed a short list of programs that meet all of your criteria and therefore would be suitable for implementation. In Objective IV, you will complete the in-depth design of one or more of these programs and implement them. Resources General ADSMP, 1992. Demand-Side Management Planning and Implementation Reference Guide. Berkeley, CA: Association of Demand-Side Management Professionals. EPRI, 1991. End Use Technical Assessment Guide. EPRI-CU-7222. Palo Alto, CA: Electric Power Research Institute. EPRI, 1984. Demand-Side Management, Volume 2: Evaluation of Alternatives. EA/EM-3597. Palo Alto, CA: Electric Power Research Institute. Gellings, Clark W., and John H. Chamberlin, 1993. Demand-Side Management: Concepts and Methods. Second Edition. Lilburn, GA: The Fairmont Press, Inc. Gellings, Clark W., and John H. Chamberlin, 1993. Demand-Side Management Planning.. Lilburn, GA: The Fairmont Press, Inc. Krause, Florentin and Joseph Eto (Lawrence Berkeley Laboratory), 1988. Least-Cost Utility Planning Handbook for Public Utility Commissioners, Vol 2. LBL-25472. Washington, D.C.: National Association of Regulatory Utility Commissioners. Results Center, 1995?. Financing Customer Energy Efficiency. Basalt, CO: The Results Center. Technology Assessments EPRI, 1987. DSM Technology Alternatives. EM-5457. Palo Alto, CA: Electric Power Research Institute.

Demand-Side Management for Municipal Utilities
Objective III Page 9 Center for Energy and Environment
EPRI, 1984. Demand-Side Management Volume 3: Technology Alternatives and Market Implementation Methods. EA/EM-3597. Palo Alto, CA: Electric Power Research Institute. EPRI, 1987. Demand-Side Management Volume 4: Commercial Markets and Programs. EA/EM-3597. Palo, Alto, CA: Electric Power Research Institute. EPRI, 1988. Demand-Side Management Volume 5: Industrial Markets and Programs. EA/EM-3597. Palo, Alto, CA: Electric Power Research Institute. Usibelli, A., S. Greenberg, M. Meal, A. Mitchell, R. Johnson, G. Sweitzer, F. Rubenstein, and D. Arasteh, 1985. Commercial-Sector Conservation Technologies. LBL-18543. Berkeley, CA: University of California. WAPA, 1991. DSM Pocket Guidebook. Volume 1: Residential Technologies. Golden, CO: Western Area Power Administration, Energy Services. (Prepared by Solar Energy Research Institute, Golden, CO. SERI/TP-254-4098A). WAPA, 1991. DSM Pocket Guidebook. Volume 2: Commercial Technologies. Golden, CO: Western Area Power Administration, Energy Services. (Prepared by Solar Energy Research Institute, Golden, CO. SERI/TP-254-4098B). WAPA, 1991. DSM Pocket Guidebook. Volume 3: Agricultural Technologies. Golden, CO: Western Area Power Administration, Energy Services. (Prepared by Solar Energy Research Institute, Golden, CO. SERI/TP-254-4098C). WAPA, no date. DSM Pocket Guidebook, Volume 4. Industrial Technologies. Golden, CO: Western Area Power Administration, Energy Services. (Prepared by National Renewable Energy Laboratory). WAPA, no date. DSM Pocket Guidebook, Volume 5: Renewable and Related Technologies for Utilities and Buildings. Golden, CO: Western Area Power Administration, Energy Services. (Prepared by National Renewable Energy Laboratory). Surveys and Analyses of Utility Programs ACEEE, 1990. LESSONS LEARNED: A Review of Utility Experience with Conservation and Load Management Programs for Commercial and Industrial Customers. 1064-EEED-AEP-88 (Energy Authority Report 90-8). Washington, D.C.: American Council for an Energy-Efficient Economy. ADSMP, 1992. TIELINES A Compendium of Utility DSM Programs, 2nd Edition. Berkeley, CA: Association of Demand-Side Management Professionals, P.O. Box 4658, Berkeley, CA 94707.

Demand-Side Management for Municipal Utilities
Page 10 Objective III Moorhead Public Service Department
ADSMP, 1991. A Compendium of Utility DSM Evaluation Projects. Berkeley, CA: Association of Demand-Side Management Professionals, P.O. Box 4658, Berkeley, CA 94707. EPRI, 1994. 50 Successful DSM Programs: A Comparative Review of Program Attributes and Data: The Results Center Profile Series, Profiles 1-50. EPRI TR-103463. Palo Alto, CA: Electric Power Research Institute. EPRI, 1993. 1992 Survey of Utility Demand-Side Management Programs, TR-102193s Vol 1 and 2. Palo Alto, CA: Electric Power Research Institute. EPRI, 1992. 1991 Survey of Commercial-Sector Demand-Side Management Programs. TR-100329. Palo Alto, CA: Electric Power Research Institute. EPRI, 1991. 1990 Survey of Industrial-Sector Demand-Side Management Programs. CE-7089. Palo Alto, CA: Electric Power Research Institute. EPRI, 1989. 1988 Survey of Residential-Sector Demand-Side Management Programs. EPRI CU-6546. Palo Alto, CA: Electric Power Research Institute. Flanagin, T., and S. Hadley, 1994. Analysis of Successful Demand-Side Management at Publicly Owned Utilities. ORNL/CON-397. Oak Ridge, TN: Oak Ridge National Laboratory. Hewett, Martha, Dave Vavricka, and Russ Landry, 1993. Survey of Commercial & Industrial Refrigeration DSM Programs. CEUE/TR93-2. Minneapolis, MN: Center for Energy and Environment. UDI, 1991. The Official Guide to Demand Side Management Programs and Research. Utility Data Institute, 1700 K St NW, Suite 400, Washington DC 20006. (202) 466-3660. Technical Potential and Related Studies Balakrishnan, S., Jules Alcantara, and Craig McDonald, 1990. WMECO 1989 Technical Potential Assessment Final Report. SRC Report No. 7537-R6. Bala Cynwyd, PA: Synergic Resources Corporation. Geller, Howard, Anibal de Almeida, Barbara Barkovich, Carl Blumstein, David Goldstein, Alan Meier, Peter Miller, Olivier de la Moriniere, Art Rosenfeld, and Linda Schuck, 1986. Residential Conservation Power Plant Study Phase I -- Technical Potential. Washington, D.C.: American Council for an Energy-Efficient Economy. Northwest Power Planning Council, 1991. 1991 Northwest Conservation and Electric Power Plan Volume I. 91-04. Portland, OR: Northwest Power Planning Council. Northwest Power Planning Council, 1991. 1991 Northwest Conservation and Electric Power Plan Volume II--Part I. 91-05. Portland, OR: Northwest Power Planning Council.

Demand-Side Management for Municipal Utilities
Objective III Page 11 Center for Energy and Environment
Northwest Power Planning Council, 1991. 1991 Northwest Conservation and Electric Power Plan Volume II--Part II. 91-05. Portland, OR: Northwest Power Planning Council. PLC, Incorporated, 1988. Conservation Potential in the State of Minnesota: Final Report, Volume I. PLC, Incorporated. Xenergy Inc., 1988. A Statewide, Least-Cost Plan for Rhode Island, Final Report on the Initial Work of the Rhode Island Least-Cost Planning Committee. Burlington, MA: Xenergy Inc. Other Resources - Residential ACEEE, 1987. The Most Energy-Efficient Appliances. Washington, D.C.: American Council for an Energy-Efficient Economy. AHAM, June 1993 (Edition No. 2). 1993 Directory of Certified Refrigerators and Freezers. Chicago, Illinois: Association of Home Appliance Manufacturers. BPA, June 1993 (Second Printing). Super Good Cents Builder's Field Guide. DOE/BP-1998. Portland, Oregon: Bonneville Power Administration. BPA, March 1987. The Top 15% Energy-Efficient Refrigerators and Freezers. DOE/BP-17529-17. Portland, Oregon: Bonneville Power Administration: Brown, Marilyn, Linda Berry, Richard Balzer and Ellen Faby, May 1993. National Impacts of the Weatherization Assistance Program in Single-Family and Small Multifamily Dwellings. ORNL/CON-326. Oak Ridge, Tennessee: Oak Ridge National Laboratory. Cohen, Samuel, Charles Goldman, and Jeffrey Harris (Lawrence Berkeley Laboratory), 1990. "Measured Energy Savings for Individual Retrofit Measures in Single-Family Buildings," Proceedings of the 1990 ACEEE Summer Study on Energy Efficiency in Buildings, pp. 9.45-9.58. Washington, D.C.: American Council for an Energy-Efficient Economy. Coltrane, S., D. Archer, and E. Aronson, 1986. Smart programs: the social-psychological foundations of successful energy conservation delivery systems. Proceedings of the 1986 ACEEE Summer Study on Energy Efficiency in Buildings, V. 7, P. 20-33. Washington, D.C.: American Council for an Energy-Efficient Economy. DELTA-T, Inc., 1990. Residential Lighting Acceptance Pilot for Pacific Power and Light Company - Final Report. Eugene, OR: DELTA-T, Inc. Henson, Joann, 1992. "Conversions + Conversations = Conservation," Home Energy, pp. 13-16. Lucas, Robert (Pacific Northwest Laboratory), 1992. "Analysis of Historical Residential Air-Conditioning Equipment Sizing Using Monitored Data," ACEEE 1992 Summer Study on Energy

Demand-Side Management for Municipal Utilities
Page 12 Objective III Moorhead Public Service Department
Efficiency in Buildings, pp. 2.157-2.165. Berkeley, CA: American Council for an Energy-Efficient Economy. National Appliance Energy Conservation Act of 1987. Public Law 100-12. Nelson, B, D. Robinson, G. Nelson, and M. Hutchinson, September 1986. Energy Efficient House Research Project. ORNL/Sub/83-47980/1. Oak Ridge, Tennessee: Oak Ridge National Laboratory. Quaid, M., and R. Faber, 1988. An Evaluation of Coordinated Energy Services: A Comprehensive Low Income Conservation Program. MEO/TR88-7. Minneapolis, MN: Center for Energy and Environment. Quaid, M., and M. Anderson, 1988. Measured Energy Savings from Foundation Insulation in Minneapolis Single Family Homes. MEO/TR88-3. Minneapolis, MN: Center for Energy and Environment. Quaid, M., T. Dunsworth, and M. Hewett, 1987. An Evaluation of the Community Energy Workshop: An Energy Conservation Pilot Program for Low Income Households. MEO/TR87-4. Minneapolis, MN: Center for Energy and Environment. Robinson, D., G. Nelson, M. Hewett, M. Noble, L. Shen and L. Goldberg, March 1991. Monitoring and Evaluation of Foundation Insulation Retrofits in Single Family Detached Houses in St. Paul and Minneapolis, Minnesota. ORNL/Sub/86-SA711/V. Oak Ridge, Tennessee: Oak Ridge National Laboratory. Sumi, David , William Miller, and John Proctor, 1992. "Impact Measurements for a Low-Flow Showerhead Program," ACEEE 1992 Summer Study on Energy Efficiency in Buildings, pp. 7.231-7.242. Berkeley, CA: American Council for an Energy-Efficient Economy. Warwick W, and S. Bailey, June 1993. Results from an Energy-Efficient Showerhead Field Study. PNL-8715 UC-350. Richland, Washington: Pacific Northwest Laboratory. Other Resources - Commercial and Industrial ADSMP, 1991. TECHNOLINES Volume II: DSM Technology Reference Guide for HVAC Systems in Commercial and Industrial Applications. Berkeley, CA: Association of Demand-Side Management Professionals. Carlisle, N., E. Hancock, B. Westby, 1987. Shop Retrofit Packaging Methodology Final Report. October 1987. Golden, Colorado: Solar Energy Research Institute. DOE 1991. National Energy Strategy. Washington, D.C.: U.S. Department of Energy, 1991.

Demand-Side Management for Municipal Utilities
Objective III Page 13 Center for Energy and Environment
EPRI, 1988. Energy Use and Conservation in the Commercial Sector, Volumes 1 and 2. EPRI EM-5578. Palo Alto: Electric Power Research Institute. Gentilini, L., D. Bohac, T. Dunsworth, M. Hewett, 1994. A Study of Compliance with the Lighting Provisions of the Minnesota State Building Code for Small Commercial Buildings. CEE/TR94-5. Minneapolis, MN: Center for Energy and Environment. Gettings, M. and J. MacDonald, 1989. Expansion of Utility Services to Small Businesses. Oak Ridge, TN: Oak Ridge National Laboratory. Draft report provided courtesy of the authors. Hewett, Martha and Mike Sachi, 1993. Improving Cooling Equipment Efficiency for the Small Commercial Buildings Market. CEUE/TR93-7B. Minneapolis, MN: Center for Energy and Environment. Hewett, M. and T. Dunsworth 1989. Small Commercial Needs Assessment - Part 2: Analysis of Data from Small Commercial Audits and Surveys. MEO/TR89-1B. Minneapolis, MN: Center for Energy and Environment. Hurley, J, K. Shukla, M. Grimanis, May 1986. Commercial Appliance Energy Use Update. #5081-241-0544, Gas Research Institute, 8600 W Bryn Mawr Avenue, Chicago, IL 60631. Krause, F., E. Vine, and S. Gandhi, 1989. Program Experience and Its Regulatory Implications: A Case Study of Utility Lighting Efficiency Programs. LBL-28268. Berkeley, CA: Lawrence Berkeley Laboratory. Morgan Systems, 1990. Electric Utility Guide to Marketing Efficient Lighting. Berkeley, CA: Morgan Systems Corporation. OTA, May 1992. Building Energy Efficiency. OTA-E-518. Washington, D.C.: Office of Technology Assessment (U.S. Government Printing Office). OTA, March 1982. Energy Efficiency of Buildings in Cities. OTA-E-168. Washington, D.C.: Office of Technology Assessment. (U.S. Government Printing Office). Sachi, Mike, Martha Hewett, and Dave Vavricka, 1993. Lighting Efficiency in New Small Commercial Construction in Minnesota. CEUE/TR93-7. Minneapolis, MN: Center for Energy and Environment. SLDL 1995. Lamp and Ballast Combinations. Seattle, WA: Seattle Lighting Design Laboratory. Skumatz, L., K. Lorberau, R. Moe, R. Bordner, R. Chandler, 1991. Bonneville Measure Life Study: Effect of Commercial Building Changes on Energy Using Equipment. SRC Report No. 7619-R2, Synergic Resources Corporation. Available through Bonneville Power Administration, Portland, OR.

Demand-Side Management for Municipal Utilities
Page 14 Objective III Moorhead Public Service Department
WSEO 1992. Motor Master Electric Motor Selection Software Users’ Reference Guide. Olympia, WA: Washington State Energy Office.

Demand-Side Management for Municipal Utilities
Objective IV Page 1 Center for Energy and Environment
OBJECTIVE IV: SELECT, DESIGN AND IMPLEMENT PROGRAMS
Purpose The purpose of this objective is to design and implement one or more successful DSM programs. Process Step 1 Select Program Choose a program to implement based on the final cost-effectiveness results and qualitative factors identified in Objective III, Step 5. In Moorhead’s case, the first program they chose to implement was a C&I lighting rebate program. Step 2 Design Program Design of the program is described as a linear sequence of steps, but in reality the steps may proceed in parallel or be iterated several times. Initially, you are likely to have some constraints on the project budget and schedule, and you may have some idea of the total number of customers you want to serve or the energy or demand impact you want to achieve. As you further design the technical aspects of the program, marketing plan, and administrative processes, you will likely need to refine your estimates of budget, program size or both. Municipal utilities often have limited staff time available for program design. Fortunately, many of the programs likely to make sense in the early stages of an overall DSM program have been done before. We recommend that you borrow from the resources identified in Objective III, and spend your time fine-tuning the program to your situation rather than reinventing the wheel. Examples of initial program designs for several program options are given in Tab 6, Selection and Design of MPS’s New DSM Programs, in the Moorhead case study, . Step 2.1 Determine project budget, schedule and goals You will probably have some overall figure in mind when you start to develop the program budget. Budget components to consider include: • marketing - costs of developing and implementing promotions and advertising for customers
and trade allies, • project delivery - costs for project management, clerical and administrative functions, site
visits or other technical services, etc., • incentives - costs of rebates, special rates, or other incentives, • evaluation - costs to evaluate program processes and outcomes and refine program design, • overhead - costs for non-project costs (e.g., proportion of costs for space, phones, utility or
department managers, etc. that must be assigned to the project, if any), and

Demand-Side Management for Municipal Utilities
Page 2 Objective IV Moorhead Public Service Department
• possibly other, program specific, costs, such as costs of providing ballast disposal services. As the design of the program evolves, following the process outlined in Steps 2.2 through 2.7, you will be able to make more accurate estimates of the individual line items. Project goals should be assigned in terms of number of customers to be served, energy savings and demand reduction. This will require some thinking about the likely energy use and savings for the average participant. A project schedule should also be developed. Management may impose some initial constraints on the schedule. You will also need to consider the time required for all phases of the project (design, start up, program operation, program evaluation). There may be external constraints (such as major ordering months for key distributors or major sales months for equipment with seasonal sales patterns) that will affect the time line. Step 2.2 Define the technical aspects of the program Many program characteristics must be defined before the program can be implemented. Key features are described below. Eligibility Who is eligible to participate? This must be clearly defined, in terms of rate class, customer size, and other characteristics (e.g., new or existing construction) to allow you to target your marketing and to avoid misleading customers that are not eligible. The eligible group may need to be larger than the primary target market (see Step 2.3), as it is sometimes problematical to define eligibility criteria that may be perceived as giving some customers an unfair advantage. Technologies included The specific measures to be included in the program must be identified. Qualifying criteria and program rules General program rules help to assure the desired impacts and reduce undesirable results. These rules might address such issues as: • Documentation: Bids, manufacturers’ product specifications and invoices can be required
along with the application form to verify actual installation of appropriate equipment, and to assure that the incentive does not exceed the incremental costs.
• Inspections: Requiring that the site be inspected before the measure is installed will allow you to determine whether the existing system is eligible for replacement. Requiring inspections after installation will assure that qualifying measures were installed. The rules can state that inspections will be made of projects over some size or of selected projects if inspecting every job is unnecessary or overly expensive.

Demand-Side Management for Municipal Utilities
Objective IV Page 3 Center for Energy and Environment
• Liability: Program rules can also address liability concerns, such as use of licensed contractors, compliance with building codes, and proper disposal of hazardous materials such as asbestos, ballasts containing PCBs and fluorescent tubes containing mercury.
• Approved contractors: If appropriate, you can require that the work be done only by an approved list of contractors who have undergone certain training or agreed to abide by certain program rules.
• Expiration dates: Setting a maximum length of time from implementation to application for the rebate will avoid customers applying for rebates on work they did before the program started.
The specific equipment characteristics or system design features to be met must be defined through qualifying criteria for individual measures. This will further serve to assure that the equipment or designs rebated will produce the intended energy and demand impacts, and will avoid undesirable effects (e.g., harmonic distortion due to poorly designed electronic ballasts, moisture problems due to poorly designed insulation systems, use of certain CFCs). It will also reduce the possibility for confusion or dissatisfaction on the part of customers or trade allies. Reviewing the rules used by other utilities may give you a good starting point. Discussions with key trade allies (e.g., manufacturers or manufacturers’ representatives for equipment, engineers for system design) can also help to define appropriate criteria. Sometimes, the equipment characteristics are fairly technical. They may be difficult for customers and even some trade allies to understand, and/or it may be difficult for them to get the necessary supporting documentation. In such cases, it will increase participation and customer satisfaction if you work with the manufacturers, manufacturers’ representatives, or distributors to develop an approved product list. The customer or contractor can then simply check his model number against the pre-approved list. Manufacturers and manufacturers’ representatives will generally be very willing to provide the information necessary to assure that their products will be on such lists. Another issue that may need to be defined is that some measures are mutually exclusive, so that the customer cannot receive rebates for both measures when applied to the same building or system. Perhaps each measure has savings potential, but the combined savings is little more than the individual savings for one or the other. For example, variable speed drive and unloaders are two different ways of achieving capacity modulation in commercial refrigeration systems, so Northern States Power Company-Minnesota does not allow a customer to receive rebates for both on the same compressor. In addition, you can use the qualifying criteria to define certain baseline conditions. As an example, if you are giving a rebate for adjustable speed drives in new industrial facilities, you could define the minimum efficiency of the motor that the drive is connected to. This might be appropriate if, for example, you know that two thirds of the motors being installed in your service territory already achieve some efficiency higher than federal equipment standards. You might not want to rebate this efficiency level because of high free ridership, but you might want to assure that the customer buys a motor at least this efficient if they are to receive a rebate for an adjustable speed drive.

Demand-Side Management for Municipal Utilities
Page 4 Objective IV Moorhead Public Service Department
A final issue to consider is compatibility with programs of neighboring utilities. Both trade allies and those customers who operate in more than one utility’s service territory will appreciate efforts toward consistency because it reduces the time and energy they have to invest to understand the programs. In one unusual and creative example, a number of gas utilities in Minnesota operate a joint rebate program for commercial gas cooking equipment through the Blue Flame Association. All procedures are standardized and all paper work is handled centrally through the Association. Incentive form, amounts, and recipients Many utility DSM programs use financial incentives to encourage customers to take certain actions. One decision to be made about incentives is which form to use. Options include cash rebates, special rates, low interest loans, equipment leasing, and shared savings, among others. For example, rebates tend to entail a larger net transfer of funds to the customer than loans, but loans involve larger internal costs for processing and bad debt, and are not generally as popular with customers. However, loans paid back on the customer’s utility bill can be very attractive, especially for small customers. The amount of the incentive is generally established by weighing the objective of moving the market against the objective of minimizing program costs. Commercial and industrial customers are likely to make economic decisions based on specific financial criteria such as payback or return on investment. Typical business payback criteria are discussed in numerous reports on commercial sector DSM. Examining the costs and savings without incentives, as captured in your analyses of the participant benefit/cost test, will provide a good understanding of the size of incentive needed to reach the customer’s payback criterion. Another potential source of input on customers’ financial criteria or on likely responses to various incentive amounts is customer surveys, focus groups or informal discussions with customers or trade allies. For example, Moorhead staff obtained information on payback criteria by recontacting customers who had expressed an interest in lighting rebates before the program existed. It appears that one of the reasons business customers require short payback is that they are skeptical about the actual savings they will realize. By selecting technologies carefully or by using carefully evaluated demonstration projects, you may be able to reduce the amount of the rebate required to induce participation. The amount of incentive does not affect the societal test, since the societal test does not distinguish between funds spent by the utility and funds spent by the customer. However, it does affect the utility test and, more importantly, the rate impact measure test. Customer payback must be weighed against rate impacts in establishing the final rebate levels. While the State of Minnesota, for example, places great emphasis on the societal test, the utility’s primary concern is the impact achieved for the utility funds expended, which is better measured by the revenue requirements test or the rate impact measure test.

Demand-Side Management for Municipal Utilities
Objective IV Page 5 Center for Energy and Environment
Due to the emerging movement to deregulate electric utilities and resulting concerns about competitiveness, utilities are currently rethinking their assumptions about the amount and form of incentives to use to encourage customers to take certain actions. There will likely be a trend away from large customer rebates toward other types of incentives, which might include rebates given to vendors or manufacturers, low interest or market rate loans, leases or even simply education programs. Such alternative incentives can be highly effective if properly designed. For instance, an efficient equipment leasing program which gives the customer a positive cash flow and allows him to make payments on his utility bill could be very attractive at a cost well below that of a direct incentive. On the other hand, experience has shown that education alone is rarely effective. You will also need to specify how rebates will be calculated. For example, will the rebate be based on a certain amount per lamp, a certain amount per kW saved, or an amount that will reduce the customer’s payback to a certain level? If the amount is per item or per kW, you may also want to establish a maximum, expressed as a percentage of total costs, as a minimum payback to be provided, or even as a maximum total dollar amount. Moorhead chose to calculate their lighting rebates in dollars per kW rather than dollars per fixture, because they felt it would give them greater flexibility to adjust to changes in the technologies on the market and determine rebates for new products. They also set an upper limit of 50 percent of total project costs, including the costs of disposal. How will the incentive be transferred? Will the rebate be a separate check or a credit on the electric bill? Will repayment of the loan be through separate payments or through additional charges on the electric bill? Finally, you may want to consider who should receive the incentive. Especially for some commercial products, the choice of equipment may be made more by a trade ally than by the customer. Northern States Power Company, for example, greatly increased participation in their rooftop air conditioner program when they divided the rebate between the customer and the contractor. Other program services It is sometimes assumed that customers are simply rational economic decision-makers, and that if their cost-effectiveness criteria are achieved, they will automatically be induced to implement efficiency measures. In fact, there are numerous other barriers to customer participation. Some are perceptual, and must be addressed through marketing. Others are practical, and can be addressed through appropriate program services. Among these are: • low energy costs as a percent of revenues, which minimizes the time and attention that can be
devoted to assessing energy cost reduction opportunities, • lack of objective, credible information about efficient technologies, and a resulting
skepticism and high perception of risk, • lack of expertise to assess efficiency opportunities, • split responsibilities between building owners and tenants, and

Demand-Side Management for Municipal Utilities
Page 6 Objective IV Moorhead Public Service Department
• short lease terms. A program which does not address these considerations may have very limited participation even though the incentives are high enough to satisfy customers’ criteria. For example, a busy small business owner who has to learn about lighting, decide what work he wants done, find several contractors, get and review bids (which will probably offer different recommendations) and monitor the progress of the work is probably a business owner who will not install efficient lighting. Program services such as energy audits from the utility which identify a short, specific list of high priority actions, provision of bid specifications, screened pools of contractors, bid review, and quality control make it easy for the same customer to get the work done. Some of these services can be delivered directly by utility marketing staff. Particularly technical services may require contracts with qualified engineering or design firms. Direct installation programs, especially those serving a large number of customers, may best be delivered by experienced independent contractors. You can get good information on your customers’s needs through informal discussions with trade allies and customers. Moorhead staff talked with one customer in particular who provided good insights on his needs in terms of ease of the process, help with filling out the rebate forms, disposal of used lamps and ballasts and timing with respect to his fiscal year. He also provided trade magazines that further elaborated on the needs of customers in his business when working with utility DSM programs. Moorhead staff also met with trade allies on several occasions to discuss program design and services, as described under Step 2.4. Step 2.3 Develop a marketing plan Before you develop a marketing plan you should know who your target group is, understand the current market conditions, and understand the current market barriers to increased sales of the product. Who do you want to participate? Who is most likely to participate? What is the current market penetration or market share of this technology? What are the market barriers? Is it simply a matter of price, or is the product not well known, hard to get, inconvenient to use, or unpopular with trade allies? Marketing decisions include marketing targets, marketing channels, marketing messages, and timing of marketing efforts. One marketing target is obviously the customer, but you will also need to make key trade allies (distributors, contractors, engineering firms) aware of the program. There are innumerable marketing channels, including direct mail, word of mouth, and various media. Various low cost marketing options are available to municipal utilities, such as press releases, speaking to community organizations and public access television. Small utilities have an advantage because they are seen as part of the community and have a more personal relationship with their customers. MPS initially marketed their commercial lighting program through letters to eligible customers and potential vendors, along with a press release coordinated with Public Power Week. They also gave a presentation at the local Rotary meeting. Now, the vendors play a major role in generating customers. In addition, the program gets many participants through word of mouth. For example, MPS staff or Task Force members discuss it

Demand-Side Management for Municipal Utilities
Objective IV Page 7 Center for Energy and Environment
with people they know. All of the business owners in one mall signed up after the first business in the mall participated. People who see the new lighting in key local businesses ask about it and discuss it with their friends. These approaches have generated all the business MPS can handle at current budget levels. Marketing messages are a key factor in program success, but are beyond the scope of this manual. Marketing staff within your organization should be able to provide you will a basic understanding of the issues. The marketing plan must also consider timing issues. Certain products, such as heating equipment, cooling equipment, or equipment involved in new home construction, have seasonal sales patterns. The program should be timed to capitalize on these sales peaks. Distributors must be aware of the program far enough in advance to order the appropriate stock. Your staff must have all procedures in place and have enough experience to handle a significant volume of applications when these peak sales periods come around. The marketing plan should also consider the project duration: Setting a program end date in the program literature will put customers on notice that the program cannot be expected to go on indefinitely. This will both stimulate participation and mitigate customer and trade ally dissatisfaction if and when the program is terminated. Customers and trade allies will seldom be upset if the program is extended beyond the date set in the initial program literature. Step 2.4 Assess infrastructure needs Trade allies play a key role in the sale of energy-using equipment. Their importance in the success of DSM programs cannot be overemphasized. To successfully market any DSM program, you will need to evaluate the current market infrastructure and identify and solve key problems. Issues to consider include: general issues
• How does the product get to market (does it go through retail outlets, through distributors and contractors, factory direct to the end user?)
• What are the typical inventory practices for this type of product? • What are the typical decision-making processes involved in sale of the product?
distributors and retail outlets
• Are distributors and retail outlets aware of the product? • Are they interested in selling it? (What is the turnover? Is it profitable to them?) • Do they currently offer it? Do they actually stock it? • Are they able to get it reliably from manufacturers? When do they place major orders? • Are they receptive to utility involvement? What type of involvement do they believe
would be most beneficial? engineers and contractors
• Are engineers and contractors aware of the product?

Demand-Side Management for Municipal Utilities
Page 8 Objective IV Moorhead Public Service Department
• Are they interested in selling it? (Does it have higher callbacks? Do they understand and believe in the technology concept? Do they think it offers the customer good reliability and performance? Is it profitable to them?)
• Are they capable of selling it? (Do they understand how to segment their market, who is likely to buy, what features or attributes sell this product?)
• Are they capable of designing or installing it? • Are they receptive to utility involvement? What type of involvement do they believe
would be most beneficial? Surveys, focus groups or informal discussions with trade allies can provide this information. In addition to identifying and solving infrastructure deficiencies, you need to assure that the program is workable from the trade allies’ perspective, and that they will support it. Trade allies are a free sales force. They are already meeting with your customers every day, and selling them on equipment servicing and replacement. If your program works for them, they will contribute significantly to sales; if it does not, they can form a barrier that is almost impossible to overcome. Moorhead staff talked with a group of five key electrical contractors on three separate occasions before finalizing the MPS lighting program, once before a detailed plan had been committed to paper, and twice to get input on written drafts of the program plan. These discussions helped MPS address vendor concerns, let the contractors know that their views were important, and assured that these key trade allies were well informed and on board when the program began. Step 2.5 Identify necessary program processes, resources and staff requirements You will need to give adequate consideration to the specific activities that must be accomplished in operating the program, and how you will staff these activities. This will be critical in estimating the budget and staffing requirements, and in assuring that all materials and procedures are available and functioning at the start of the program. It’s important to be realistic, so that the program can be successful. For example, failure to process applications and pay rebates in a timely manner is a frequent source of customer dissatisfaction, that can only be avoided through well designed processes and adequate staffing. In some cases it may be most economical to obtain the assistance of consultants who have extensive experience in program design and delivery. Activities to consider in determining staffing requirements include: marketing
• develop marketing materials for customers and trade allies • develop program rules and qualifying criteria • develop and maintain approved product lists • develop and maintain contact with trade allies • deliver marketing messages to customers (direct mailings, one on one contact, other)
application processing • develop application form, including calculation procedures • handle customer and trade ally questions and problems

Demand-Side Management for Municipal Utilities
Objective IV Page 9 Center for Energy and Environment
• process applications: --conduct pre-inspections --review and approve applications received --conduct post inspections --pay incentives
technical services • develop approved designer/contractor/vendor lists • conduct energy audits, design analyses, etc. • prepare bid specifications • review bids • provide quality control • deal with unsatisfactory service providers
tracking and evaluation • develop tracking system and analysis procedures • enter data • conduct analysis of program processes • conduct engineering analysis of a sample of cases • conduct billing analysis of a sample of cases • conduct periodic analysis and reporting to management
You may want to review the proposed program processes with trade allies or selected customers to gather input from their perspective. Step 2.6 Develop tracking and evaluation plan and identify data requirements Certain information will need to be tracked simply for project management purposes. Obviously you will need to track the budget. In particular, you will need to track applications approved so that you know when your incentive budget is exhausted. You will need to track progress against goals, in terms of participants, calculated energy and demand savings, and cost per unit of energy and demand savings. You will need to track internal processes, so that you know how long it takes for a customer to move through various parts of the process, and whether the turnaround time meets goals established in the program design. Further, we recommend that you plan to formally evaluate both the pilot project and the full scale program. Good evaluations not only measure savings, but also often lead to program modifications which significantly increase savings or reduce costs. Evaluation is described in somewhat more detail under Step 4. At this point, you need to develop your evaluation plan far enough to determine what data you should track now for use in completing the evaluation. As a starting point for planning, the tracking system may need to contain information on:
• business name and contact person (business) or customer name (residence) • installation address • mailing address, if different from installation address • phone number

Demand-Side Management for Municipal Utilities
Page 10 Objective IV Moorhead Public Service Department
• account number • date of rebate application • date of approval • date of installation • date and check number of rebate • type(s) and amount of equipment removed (existing buildings only) • type(s) and amount of equipment assumed as benchmark for comparison (new
construction, or replacement of failed equipment in existing buildings) • type(s) and amount of equipment installed (existing buildings only) • estimated summer coincident peak demand savings (or estimated pre and post demand) • estimated winter coincident peak demand savings • estimated annual operating hours • estimated annual energy savings (or estimated pre and post energy use) • cost of equipment • cost for labor • other costs, if any • incentive amount • designer • installer
Step 2.7 Iterate and refine as necessary Developing a DSM program is a learning experience. As mentioned earlier, the activities identified in Steps 2.1 through 2.6 may proceed in parallel, but also tend to feed into each other. It is important to revisit earlier decisions as you move through the process, iteratively refining the program design. As mentioned earlier, it is critical that you seek input from all players during the program design, including trade allies at all levels in the distribution chain, customers, and any other relevant parties, such as code officials. Step 3 Implement Pilot Program The purpose of a pilot project is to test the waters, figure out if your assumptions are correct, and fine tune the program processes. Conducting a pilot program can also help to reduce customer dissatisfaction due to initial wrinkles in the program or due to suspension of the program for lack of funds or any other reason. Moorhead decided not to pilot their commercial lighting rebate program because there is such a plethora of utility experience with lighting programs. They felt comfortable that by drawing on this experience they could develop an initial program design that would be close to optimal. But in the case of their custom rebate program, where they felt they had access to much less in the way of relevant experience, they did operate a pilot program.

Demand-Side Management for Municipal Utilities
Objective IV Page 11 Center for Energy and Environment
The first step in implementing a pilot program is to develop the actual marketing materials, application forms, tracking spreadsheets and written procedures based on the design established in Step 2. The staff that will be directly involved in the project will need training in all aspects of the program process. In a small company, all utility personnel should receive some information about the program, so that they are aware of it and know how to refer interested customers. These personnel may have insights about the program design that you have overlooked. In addition, they can help to market it by word of mouth. Once you have all materials and staff in place, you can introduce the program to the market. For a pilot, it may not be necessary or desirable to have a major kick-off event that might generate a lot of participation. A mailing to selected customers, a press release, and notification of key trade allies may be sufficient. Step 4 Evaluate Pilot and Fine-Tune Program Since the whole purpose of a pilot project is to test the program, check your assumptions, and fine tune the program design, it is important that your tracking system be in place and that you carefully monitor and evaluate the pilot. Evaluation of the program processes will help you to identify ways to improve the program design and implementation. Evaluation of the program impacts will determine whether the program goals are actually being met. Among other things, a “process evaluation” can determine the effectiveness of the marketing strategy, determine the adequacy of the program staffing and resources, identify the causes of any problems such as delays in processing applications, and evaluate customer satisfaction, barriers to participation, etc. An “impact evaluation” can determine the magnitude of the energy and demand savings attributable to the program, as well as utility and customer costs and program cost-effectiveness. This is not as simple as it may at first sound, since it may involve complex issues such as:
• correcting pre and post energy use and demand for differences in weather; • differentiating between gross savings achieved by participants and net savings when
compared with non-participants; • accounting for free-riders who participate in the program but would have done the work
anyway, and free drivers who do the work because of the program, but don’t participate, • assessing actual transformation of the market due to the program; • measuring the tendency to take some part of the savings in increased comfort or amenity
rather than measurable energy savings (snapback); and • assessing the persistence of savings.

Demand-Side Management for Municipal Utilities
Page 12 Objective IV Moorhead Public Service Department
Impact evaluations can be based on engineering calculations, but it is generally much more accurate to base them on analysis of billing data or on direct metering. They may also involve customer surveys addressing such issues as free ridership and persistence. The information gathered from these sources can be used to perform a revised benefit-cost analysis of the program. You will probably want to avoid a long hiatus between the pilot program and full scale implementation, so evaluation of the pilot will need to be conducted expeditiously. At a minimum, we recommend that the impact evaluation of the pilot compare your engineering estimates to short term weather-normalized billing data. A full discussion of evaluation objectives and methods is beyond the scope of this manual. A number of evaluation references are listed under “Resources.” Based on the evaluation of the pilot, you should be able to revise the marketing plan, administrative processes and tracking procedures, as well as the qualifying criteria and rules, incentive amounts, and technical services. In addition, you should be able to develop a firm annual budget for the full scale program by budget category, make a more reliable estimate of demand and energy impacts, and revise the cost-effectiveness analysis. Step 5 Implement Full Scale Program Implementation of the full scale program is similar to implementation of the pilot. The primary differences are that a larger marketing effort may be appropriate for the full scale program, and the processes and staffing need to be designed and sized to handle a larger volume. Step 6 Evaluate and Revise Program Evaluation of the full scale program has the same general objectives as evaluation of the pilot, but where the evaluation of the pilot is indicative, the evaluation of the full scale program can and should be more definitive. You will be able to conduct longer term billing analysis and a more comprehensive investigation of other issues, giving you more accurate and reliable results.
Demand-Side Management for Municipal Utilities
Objective IV Page 13 Center for Energy and Environment
Outcome When you have completed the steps outlined above, you will have implemented one or more successful DSM programs. You will have achieved energy and/or demand savings that are cost-effective to your customers, your utility, society as a whole, and possibly other ratepayers as well. You will have gained valuable experience that will allow you to implement additional programs even more effectively. Resources See Resources for Objective III for descriptions of various utility programs. Program Evaluation The Association of Energy Service Professionals and the Electric Power Research Institute, among others, offer trainings on DSM program evaluation. A guide to DSM evaluation issues and options has been developed by the Minnesota DSM Evaluation Consortium, an group including individuals from regulated utilities, state agencies, and others. It is available through Mark Thornsjo at Northern States Power Company, (612) 330-6016. An Energy Efficiency Blueprint for California. Appendix A, Measurement Protocols for DSM Programs Eligible for Shareholder Incentives. 1990. Report of the Statewide Collaborative Process. Sacramento, CA: California Public Utilities Commission (?) “Beyond the Meter.” Measurement & Evaluation News, V. 3 No. 1. San Dimas, CA: Southern California Edison. EPRI, 1991. Impact Evaluation of Demand-Side Management Programs, Vol. 1 and 2. CU-7179. Palo Alto, CA: Electric Power Research Institute. (prepared by RCG Hagler Bailly) EPRI. Approaches for Synthesizing DSM Program Evaluations: The Wisconsin DSM Program Evaluation Database and a Review of Meta-Analysis. Palo Alto, CA: Electric Power Research Institute. (prepared by RCG Hagler Bailly). EPRI. DSM Evaluation: Six Steps for Assessing Programs. Palo Alto, CA: Electric Power Research Institute. EPRI. DSM Program Evaluation: A Guidebook to Current Practice Palo Alto, CA: Electric Power Research Institute. EPRI. Engineering Approaches to Impact Estimation, Vol. 1. Palo Alto, CA: Electric Power Research Institute.

Demand-Side Management for Municipal Utilities
Page 14 Objective IV Moorhead Public Service Department
EPRI 1991. Impact Evaluation of DSM Programs: Volume 1: A Guide to Current Practice, Volume 2: Case Studies and Applications. Palo Alto, CA: Electric Power Research Institute. EPRI. Quality Assurance of Evaluation Data. Palo Alto, CA: Electric Power Research Institute. (Prepared by Xenergy). Fels, M. F. 1986. PRISM: An Introduction. Energy and Buildings V. 9, p. 5-18. Hirst, E., and J. Reed, eds., 1991. Handbook of Evaluation of Utility DSM Programs. Oak Ridge, TN: Oak Ridge National Laboratory. Kushler, M., K. Keating, J. Schlegel, E. Vine, 1992. “The Purpose, Practice and Profession of DSM Evaluation: Current Trends, Future Challenges.” Proceedings of the American Council for an Energy Efficient Economy Summer Study on Energy Efficiency in Buildings, V.7. ACEEE, 1001 Connecticut Ave., NW, Suite 801, Washington, DC 20036. (202) 429-8873. Proceedings of the American Council for an Energy Efficient Economy Summer Study on Energy Efficiency in Buildings. Biennial, even years. Generally published in about 10 volumes, and available only as a complete set. One volume deals with program evaluation. ACEEE, 1001 Connecticut Ave., NW, Suite 801, Washington, DC 20036. (202) 429-8873. Proceedings of the Energy Program Evaluation Conference. Biennial, odd years. Argonne National Laboratory, Argonne, IL. SRC, 1992. Effective Measure Life and Other Persistence Issues in DSM Programs: Literature Review. Oakland, CA: Synergic Resources Corp. Rate Design EPRI, 1988. Customer Response to Interruptible and Curtailable Rates. Vol 1-3. EM-5630-CCML. Palo Alto, CA: Electric Power Research Institute. EPRI, 1987. Residential Response to Time-of-Use Rates. EM-3560. Palo Alto, CA: Electric Power Research Institute. EPRI, 1990. Rate Design: Traditional and Innovative Approaches. EPRI CU-6886. Palo Alto, CA: Electric Power Research Institute. EPRI, 1986. Innovative Rate Design Survey. EM-5705. Palo Alto, CA: Electric Power Research Institute. EPRI, 1991. Customer Response to Rate Options. EPRI-CU-7131. Palo Alto, CA: Electric Power Research Institute.

Demand-Side Management for Municipal Utilities
Objective IV Page 15 Center for Energy and Environment
Other EPRI, 1987. Customer Preference and Behavior: Residential Modeling Framework. EPRI EM-5217. Palo Alto, CA: Electric Power Research Institute. EPRI, 1988. Implicit Discount Rates in Residential Customer Choices, Vol. 1 and 2. EPRI EM-5587. Palo Alto, CA: Electric Power Research Institute. Kotler, Philip. 1984. Marketing Management: Analysis, Planning and Control. 5th ed. Englewood Cliffs, NJ: Prentice Hall, Inc. Results Center 1995. Financing Customer Energy Efficiency (Special Report). Basalt, CO: The Results Center.

Demand-Side Management for Municipal Utilities
Appendix A Page 1 Center for Energy and Environment
APPENDIX A Methods to Maximize Response Rates Consider preletters: A letter sent out in advance of a telephone interview or mail survey may increase response rates. Write a good cover letter or introductory script: The cover letter for a mail survey or the introduction to a telephone interview should briefly explain the purpose of the study and how the information will be used. It should also explain why the interviewee should participate, with special emphasis on any potential benefits to them from the study (e.g., improved customer programs, lower rates). It should make clear who is sponsoring the study, and, if in letter form, should use utility letterhead. If completion of the mail survey or interview is expected to take 15 minutes or less, stating this up front will increase the response rate, but if it will take longer, it is probably better not to mention it. In addition, a cover letter should give respondents a contact to call if they have questions about either the purpose of the study or how to answer specific questions. It should be signed personally by someone whose name and position will convey the importance of the project, such as the General Manager. It should also set a deadline for response. A stamped return envelope will stimulate higher response than business reply postage (Berdie et al.). Protect your respondents' confidentiality: You will probably want to link survey responses with energy use data for further analysis, for example, to see how total annual use differs for customers who do and do not have electric heat. In addition, you will need to keep track of who has responded so that you can send follow-up letter to those who have not. If a mail survey is used, both of these considerations require that you put a code number on each questionnaire. Survey recipients are quick to notice these numbers, so it is important to mention them in the cover letter, explain exactly what they will be used for, and assure confidentiality. For examples, see the Moorhead case study and Berdie et al. If a telephone survey is used, the interviewer should assure confidentiality to maximize the overall response as well as increase the number and accuracy of responses to sensitive questions. Think about personalization: Personalizing your cover letter can increase response rates by making the recipients feel that their specific response is valued, that they are not just a random "customer." However, it can also increase recipients' concerns about confidentiality. You'll need to weigh these factors based on your feel for your customers' relationship to your utility. Both response rate and response quality depend on who answers your questionnaire. For C&I surveys it is particularly important to make sure the right person is contacted. This may require a pre-screening call to identify the appropriate respondent (see Van Liere et al. 1987). Make the survey professional, interesting, concise, and understandable: Mail questionnaires should have attractive type and layout and professional reproduction. Any type of interview should be as short as possible consistent with the needs of the study. According to experts, the quality of responses to telephone interviews begins to deteriorate after about 15 minutes, unless the subject is of particular interest to the interviewees. The questions should be clear, so that

Demand-Side Management for Municipal Utilities
Page 2 Appendix A Moorhead Public Service Department
respondents do not give up in frustration (and also so that you get the information you actually intended to elicit). Telephone interviews should be done by professionals. It is a mistake to think that gathering information by phone is so simple that anyone can do it. It takes training and experience to establish initial rapport, to maximize completions and to ask questions in a consistent, non-leading manner. Consider incentives: Incentives ranging from token gifts through the chance to win a raffle to actual cash payments usually increase response rates. The Moorhead project achieved good response rates by offering a chance to win one of six $50 credits on utility bills. It appeared that this was a major factor in response since the vast majority of respondents returned their surveys by the deadline for entry in the drawing. On the other hand, the commercial survey achieved a good response without incentives. One issue to consider is whether your customers will view a drawing as unfair, or view payments as fiscally irresponsible. Provide extra assistance for large customers: Large customers’ responses are particularly important, yet their facilities can be large enough to make compilation of data a burden. Providing these customers with assistance in conducting inventories of equipment and filling out the surveys will not only assure a high response rate and accurate data, but will also provide an opportunity for customer contact and preliminary marketing of the DSM effort. Follow up, follow-up, follow-up: Follow-up is critical; high response rates can seldom be achieved without it. For mail surveys, track the pattern of responses and send out reminders (to non-respondents only) when the number of responses received per day has dropped off substantially. Send a cover letter reiterating the importance of their response and providing a number to call with questions. Send a second copy of the questionnaire in case they have thrown away or misplaced the first copy. For telephone interviews, make repeated attempts on different days of the week and at different times of day (within the times that the respondents can reasonably be expected to be there). When you do reach the respondent, schedule a specific time to call back if they cannot complete the interview right then. Berdie et al. have obtained very high response rates using six or seven attempts, where three attempts is a more common number for survey research firms. Calculating the Required Sample Size You will want to consider the required sample sizes for several levels of precision and confidences to see how your survey budget will depend on this decision, unless there are strong constraints (from management or a regulatory agency, for example) that determine the exact precision desired. There is a little algebra involved in coming up with estimated sample sizes, but it isn’t particularly complicated and should be something you can do in-house. For categorical data (yes/no or multiple choice types of questions), the raw sample size required to give a particular degree of statistical reliability depends on the size of the population being studied and also on the expected population value of the proportion that is being measured. For example, if you are interested in knowing the percentage of residential customers having central air conditioning, and anticipate that it is around 40 percent, your "expected value" of the proportion is 0.40. If there are a variety of questions with different expected results or if the

Demand-Side Management for Municipal Utilities
Appendix A Page 3 Center for Energy and Environment
expected value simply can't be estimated in advance with any precision at all, the conventional approach is to assume an expected value of 0.50 because this gives the largest sample size and thus the best chance of achieving at least the desired precision and confidence regardless of what the measured proportion turns out to be. Normally, a utility conducting a study will want to have a 90 to 95 percent confidence of being within + 5 or 10 percent of the true population values. Required raw sample sizes for various population sizes and various precisions (confidence intervals or CI) and degrees of confidence are given in Table A-1.
Table A-1. Raw sample sizes required for various population sizes, degrees of confidence, and levels of precision, assuming p = 0.50.
Population 90% Conf 95% Conf 90% Conf 95% Conf
N 10% CI 10%CI 5% CI 5% CI 10 9 9 10 10 25 18 20 23 23 50 29 33 42 44 75 36 42 59 63
100 40 49 73 79 150 47 59 97 108 200 51 65 115 132 300 55 73 142 168 400 58 77 161 196 500 60 81 176 217
1,000 63 88 213 278 10,000 67 95 263 370
If your specific population size is not listed in the above table, you can either interpolate between values in the table or calculate a value. The equation for required raw sample size, n, from a population of size N with a true proportion (expected value) p is as follows: n = p (1-p)N (CI/t)2 N + p (1-p) where: CI is the desired confidence interval or precision, (expressed as a decimal fraction, as in
p), and t is the critical student's t value for the desired degree of confidence, taken from any
statistics textbook (e.g. 1.96 for 95%). If the study has a mixture of questions with categorical responses and questions with numerical responses, it may also be important to assure a certain level of precision in measuring the items having numerical responses, either in absolute terms or, more commonly, as a percentage of the

Demand-Side Management for Municipal Utilities
Page 4 Appendix A Moorhead Public Service Department
mean observed value. Quantitative data likely to be of interest could include annual energy consumption and gross building area, for example. This sample size computation is conceptually similar to the case of qualitative items above, except that it will often be more critical to have reasonable advance estimates of the true mean population value (xm) and its variability, expressed in terms of its standard deviation (sd). Obviously these are not known precisely ahead of time or the survey would not be needed, but acceptable ballpark estimates can often be obtained from literature reports, colleagues at other utilities, or educated guesses by staff members familiar with your customers and with the item being measured. For a confidence interval expressed as a decimal fraction of the relevant relationships are: CI = t * sd/(xm * √n) or n = (t * sd/(CI * xm))2 The first equation of could be used to see if the sample size calculated for categorical items will give acceptable precision on a particular numerical item as well, and the second equation could be used to make independent estimates of the required raw sample size so that the tradeoffs of emphasizing one type of survey result or the other can be assessed directly. Note that in the above equations, N is the population size as you have defined the population. If you have defined the population in terms of locations, but you only have a count of your customers in terms of accounts, you will either have to: 1. make a very good estimate of the number of locations (for example, by looking at how
many residential dual fuel meters you have, and subtracting this from the total number of residential accounts, to estimate residential sites), or
2. actually aggregate the accounts to the site level and count the resulting number of sites. Once you calculate the raw sample size (i.e., the number of responses you need), you will have to determine how large a sample to actually draw, to take into account the estimated non-responses. The formula is: adjusted sample size = number of responses required/anticipated response rate = raw sample size/anticipated response rate where the raw sample size comes from the earlier equations. Estimating Stock Average Use for Electric Heating It is probably worthwhile to estimate energy use for electric heating and central cooling for your own utility, rather than relying on published estimates for other utilities, since these end uses are the most sensitive to variations in climate, construction quality, and levels of weatherization. This section outlines a simple method to estimate stock average use for electric heating. An example following this method is given in Appendix A of the report on Residential End Use

Demand-Side Management for Municipal Utilities
Appendix A Page 5 Center for Energy and Environment
Analysis and Program Screening (in Tab 1 of the case study), and it may be easier to understand the discussion below if you refer to the specific example there. To estimate stock average use for heating, the electric use for each customer is first separated into winter months, shoulder months, and summer months. The heating and cooling months can be identified based on examination of long term average weather data from the National Weather Service.1 These can then be translated into billing months based on an understanding of the relationship of nominal billing months to the actual periods of consumption for customers with various average meter reading dates. A raw estimate of space heating energy use can be made by first calculating the average use for a shoulder month (sum of use for all shoulder months divided by number of shoulder months), multiplying this amount by the number of winter months, and subtracting the result from the total winter months’ use. This would be an overestimate, however, because non-heating loads also have a somewhat seasonal pattern of use (Fels et al. 1986), as can be seen by the fact that electric use goes up in the winter even for non-heating customers. To correct for this, the average seasonality of non-heating uses (average winter month/average shoulder month) can be determined for non-electric heat customers, and then multiplied by the average shoulder month use for space heating customers to determine an adjusted base use value. The estimate of space heating use for the year being analyzed, adjusted for the seasonality of base use, is then the total winter use minus the product of the adjusted base use per month and the number of winter months. The estimated space heating use in a normal weather year equals the heating use for the year being analyzed multiplied by the ratio of normal heating degree days to heating degree days for the year being analyzed. The normal and current year heating degree day data are from the National Weather Service.
1Local Climatological Data, National Climatic Data Center, Federal Building, Asheville, NC 28801. Data may also be available from the Minnesota State Climatologist's Office at the University of Minnesota.