demand planning: forecasting and demand management chapter twelve mcgraw-hill/irwin copyright ©...
TRANSCRIPT
Demand Planning: Forecasting and Demand Management
CHAPTER TWELVE
McGraw-Hill/Irwin Copyright © 2011 by the McGraw-Hill Companies, Inc. All rights reserved.
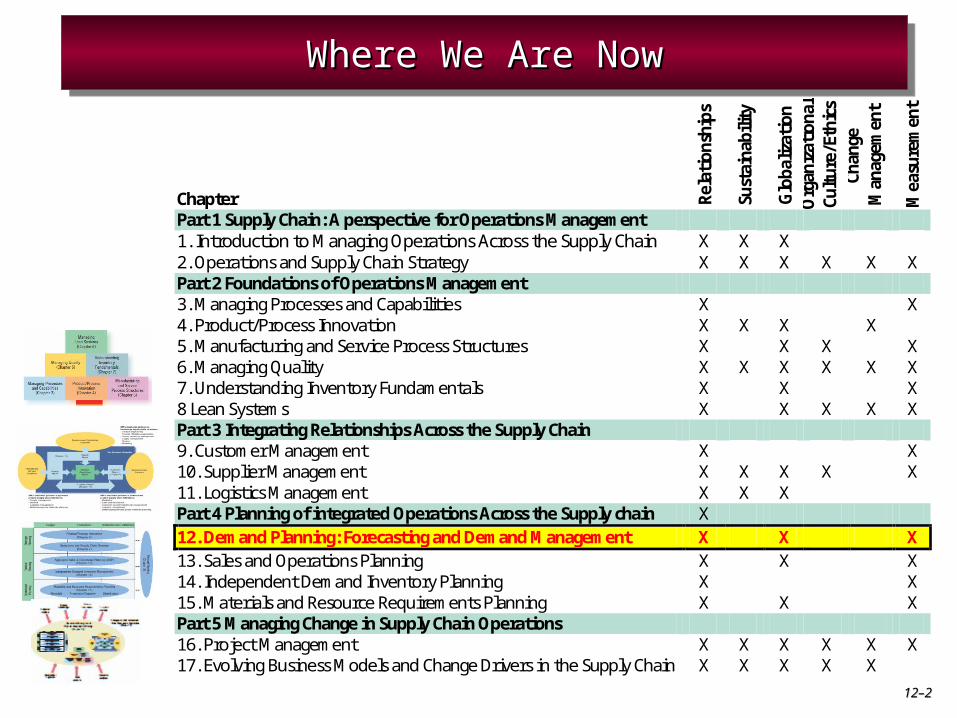
Where We Are NowWhere We Are NowWhere We Are NowWhere We Are Now
Chapter Rela
tion
ship
s
Sust
aina
bilit
y
Glo
baliz
ation
O
rgan
izati
onal
Cult
ure/
Ethi
cs
Chan
ge
Man
agem
ent
Mea
sure
men
t
Part 1 Supply Chain: A perspective for Operations Management 1. Introduction to Managing Operations Across the Supply Chain X X X 2. Operations and Supply Chain Strategy X X X X X X Part 2 Foundations of Operations Management 3. Managing Processes and Capabilities X X 4. Product/Process Innovation X X X X 5. Manufacturing and Service Process Structures X X X X 6. Managing Quality X X X X X X 7. Understanding Inventory Fundamentals X X X 8 Lean Systems X X X X X Part 3 Integrating Relationships Across the Supply Chain 9. Customer Management X X 10. Supplier Management X X X X X 11. Logistics Management X X X Part 4 Planning of integrated Operations Across the Supply chain X 12. Demand Planning: Forecasting and Demand Management X X X 13. Sales and Operations Planning X X X 14. Independent Demand Inventory Planning X X 15. Materials and Resource Requirements Planning X X X Part 5 Managing Change in Supply Chain Operations 16. Project Management X X X X X X 17. Evolving Business Models and Change Drivers in the Supply Chain X X X X X
12–12–22

1. Explain role of demand management
2. Differentiate between demand management and forecasting
3. Describe various forecasting procedures
4. Develop forecast various models
5. Describe forecast measures
6. Explain how improvements make demand planning easier
12–12–33
Learning ObjectivesLearning Objectives
Demand PlanningDemand Planning
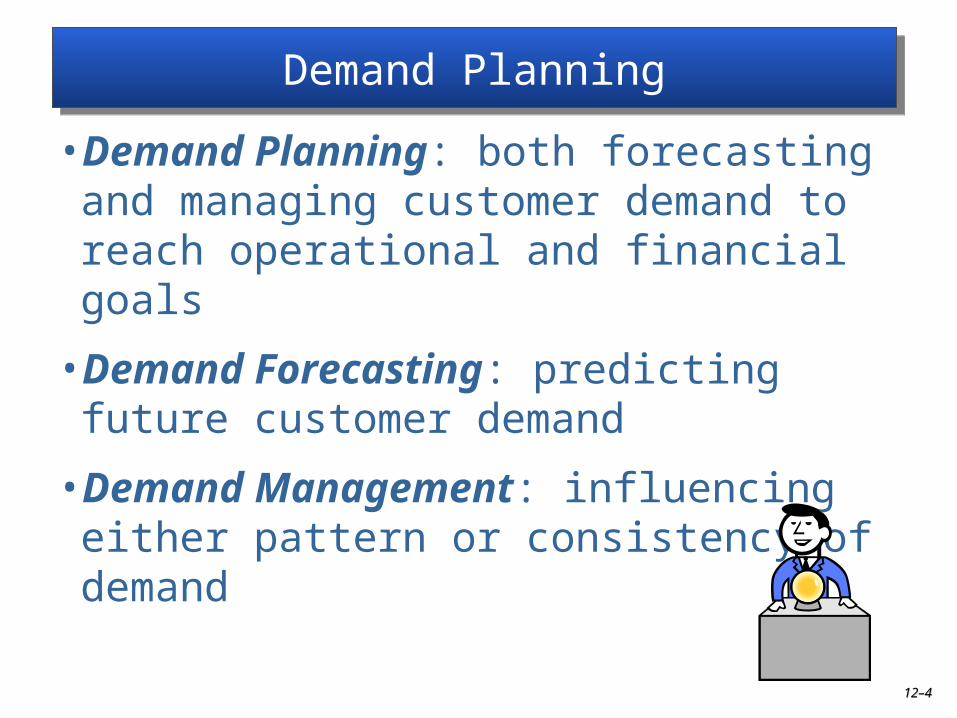
• Demand Planning: both forecasting and managing customer demand to reach operational and financial goals
• Demand Forecasting: predicting future customer demand
• Demand Management: influencing either pattern or consistency of demand
12–12–44

Demand Planning and OM Demand Planning and OM
Figure 12-1 12–12–55
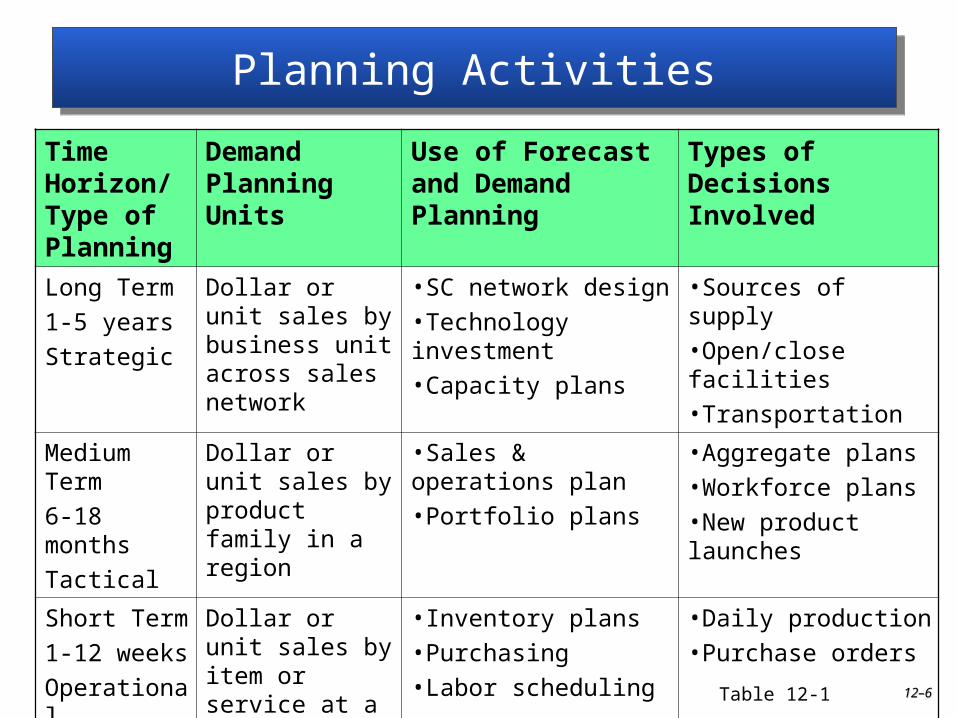
Planning ActivitiesPlanning Activities
Time Horizon/ Type of Planning
Demand Planning Units
Use of Forecast and Demand Planning
Types of Decisions Involved
Long Term
1-5 years
Strategic
Dollar or unit sales by business unit across sales network
•SC network design
•Technology investment
•Capacity plans
•Sources of supply
•Open/close facilities
•Transportation
Medium Term
6-18 months
Tactical
Dollar or unit sales by product family in a region
•Sales & operations plan
•Portfolio plans
•Aggregate plans
•Workforce plans
•New product launches
Short Term
1-12 weeks
Operational
Dollar or unit sales by item or service at a given location
•Inventory plans
•Purchasing
•Labor scheduling
•Daily production
•Purchase orders
Table 12-1 12–12–66

Demand ForecastingDemand Forecasting
• Components of Demand: patterns of demand over time
• Autocorrelation: relationship of past and current demand
• Forecast error: “unexplained” component of demand
Stable Seasonal Trend Step Change
Figure 12-2 12–12–77
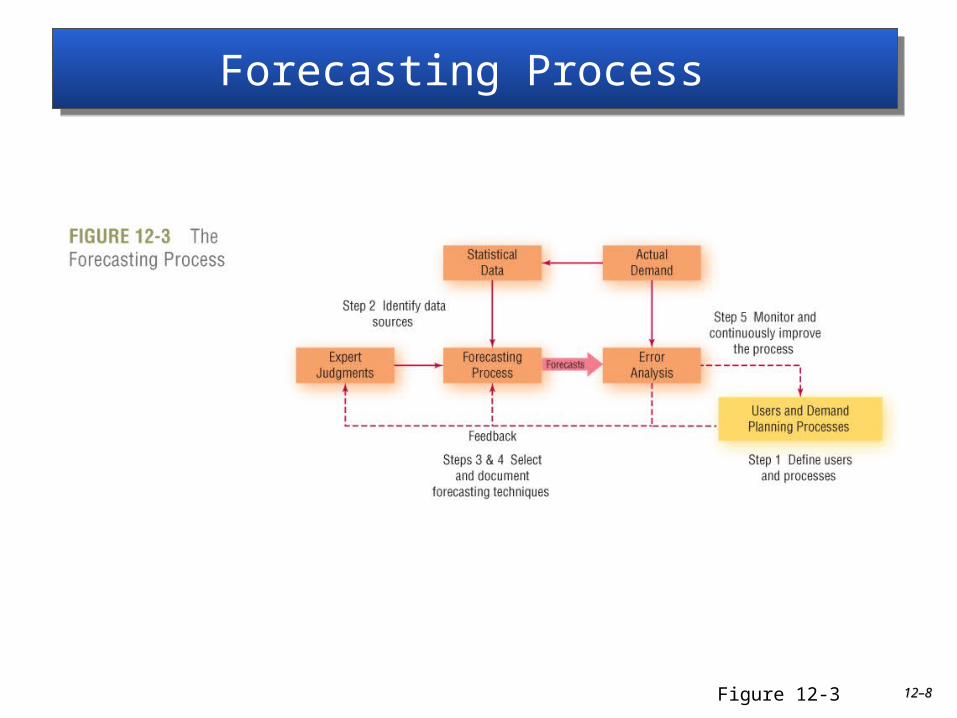
Forecasting Process Forecasting Process
Figure 12-3 12–12–88
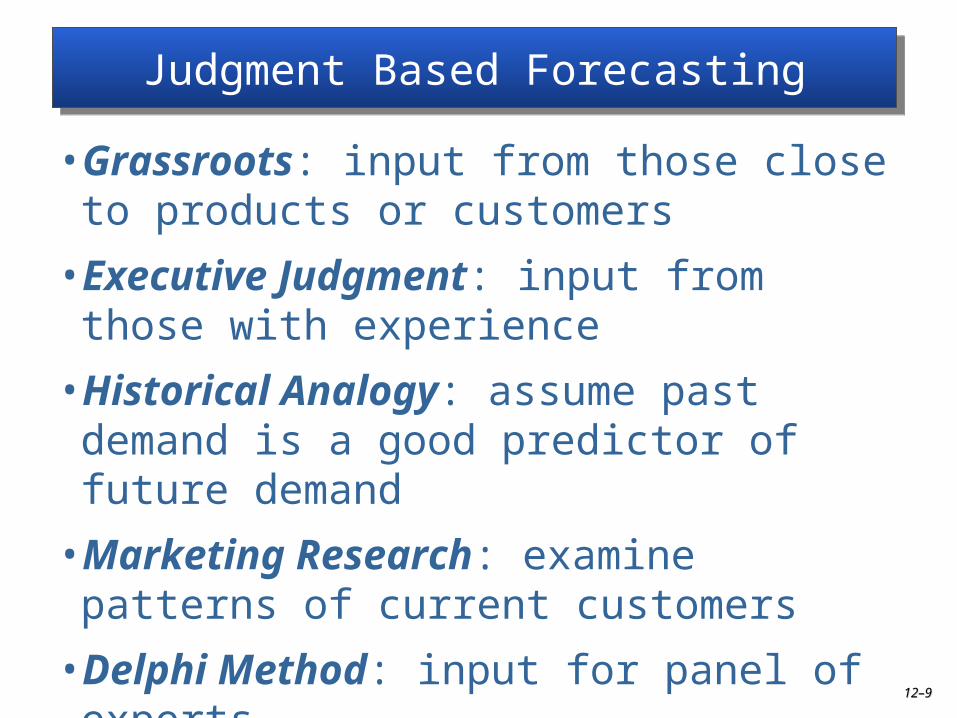
Judgment Based ForecastingJudgment Based Forecasting
• Grassroots: input from those close to products or customers
• Executive Judgment: input from those with experience
• Historical Analogy: assume past demand is a good predictor of future demand
• Marketing Research: examine patterns of current customers
• Delphi Method: input for panel of experts
12–12–99

Statistical Based ForecastingStatistical Based Forecasting
• Time Series Analysis: uses historical data arranged in order of occurrence
• Naïve Model: tomorrow's demand will be same as today’s demand
12–12–1010
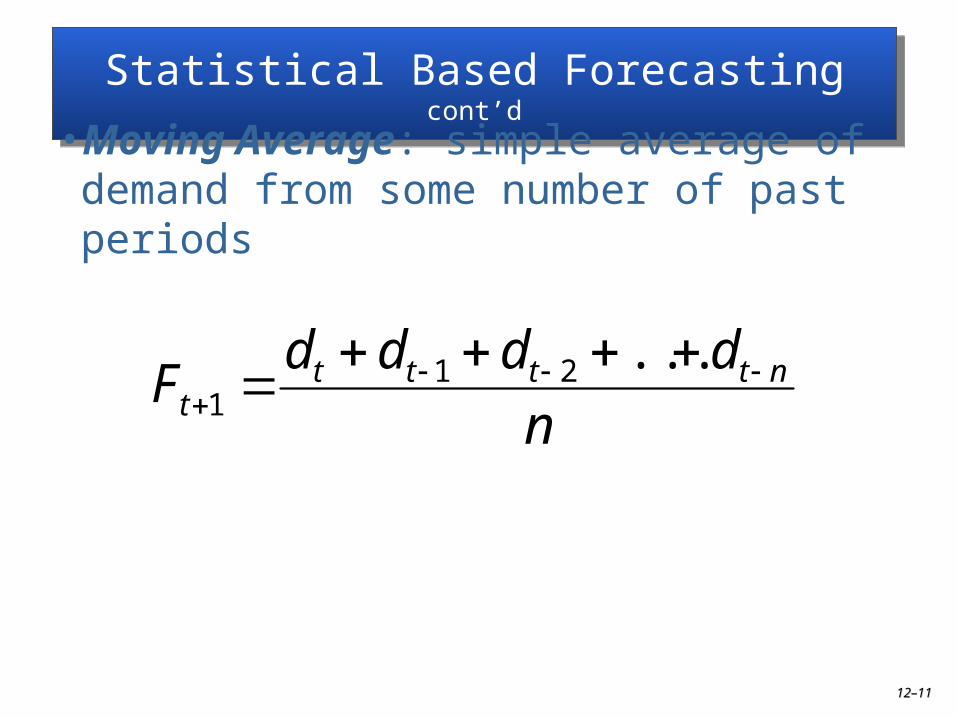
Statistical Based Forecasting cont’dStatistical Based Forecasting cont’d
• Moving Average: simple average of demand from some number of past periods
n
ddddF nttttt
...211
12–12–1111
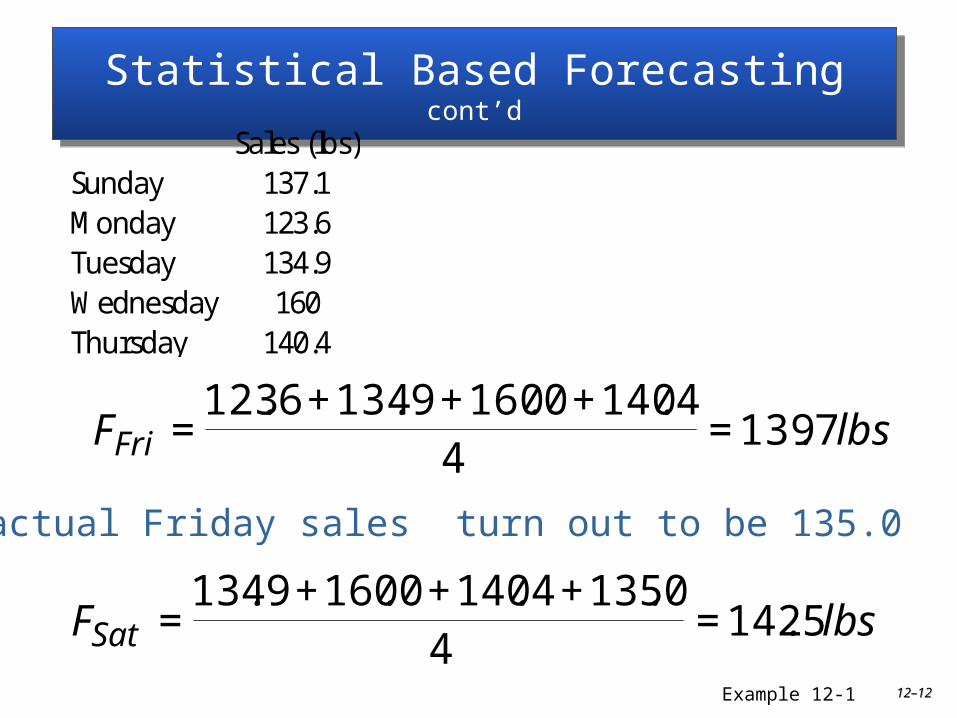
Statistical Based Forecasting cont’dStatistical Based Forecasting cont’d
Sales (lbs)Sunday 137.1Monday 123.6Tuesday 134.9Wednesday 160Thursday 140.4
lbs.....
FFri 71394
4140016091346123=
+++=
lbs.....
FSat 51424
0135414001609134=
+++=
If actual Friday sales turn out to be 135.0
Example 12-1 12–12–1212
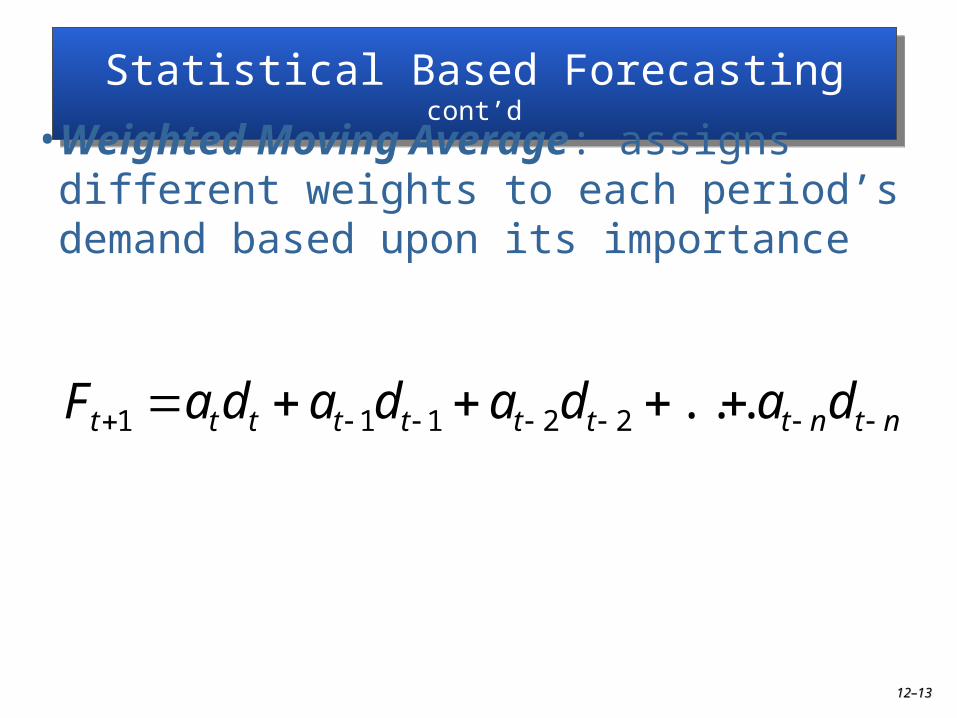
Statistical Based Forecasting cont’dStatistical Based Forecasting cont’d
• Weighted Moving Average: assigns different weights to each period’s demand based upon its importance
ntntttttttt dadadadaF ...22111
12–12–1313

Weighted Moving AverageWeighted Moving Average
Sales (lbs) Day WeightSunday 137.1Monday 123.6 4 days ago 0.1Tuesday 134.9 3 days ago 0.2Wednesday 160 2 days ago 0.2Thursday 140.4 yesterday 0.5
total = 1.0
lbs..)(..)(..)(..)(.F
lbs..)(..)(..)(..)(.F
Sat
Fri
114101355414020160291341
514141405016029134261231
=+++=
=+++=
Example 12-2 12–12–1414
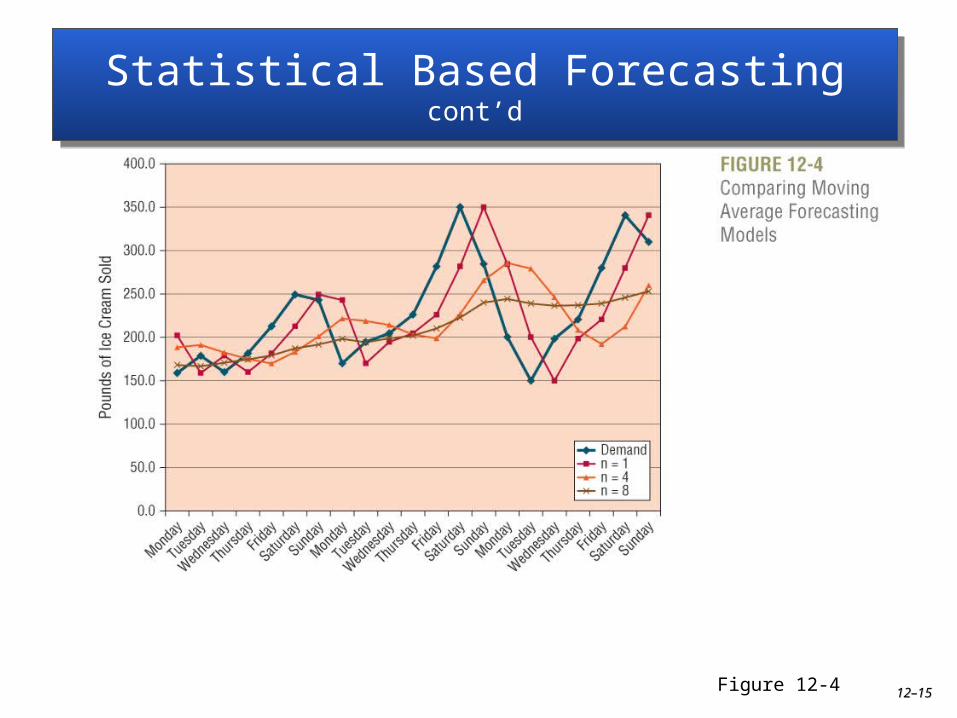
Statistical Based Forecasting cont’dStatistical Based Forecasting cont’d
Figure 12-412–12–1515

Statistical Based Forecasting cont’dStatistical Based Forecasting cont’d
• Exponential Smoothing: a moving average approach that put less weight on further back in time data
• Smoothing Coefficient: weight given to most recent demand
)(
)1(
1
1
tttt
ttt
FdFF
or
FdF
12–12–1616

Statistical Based Forecasting cont’dStatistical Based Forecasting cont’d
The forecast of a product was 110 lbs and actual demand was 115 lbs. What is the next period forecast with a smoothing constant of 0.10?
Ft+1 = 110 + (0.1)(115-110) = 110.5 lbs
Example 12-312–12–1717

Statistical Based Forecasting cont’dStatistical Based Forecasting cont’d
• Regression Analysis: fits an equation to a set of data
)()()()( SbFbAbDbBforecastSales sfad
B = Base sales (computed y intercept)D = Disposable personal incomeA = Advertising expendituresF = Fuel pricesS = Sales from prior year
12–12–1818

Statistical Based Forecasting cont’dStatistical Based Forecasting cont’d
• Simulation Models: sophisticated techniques that allow for the evaluation of multiple business scenarios
• Focused Forecasting: combination of computer simulation and input from knowledgeable individuals
12–12–1919

Forecast Process PerformanceForecast Process Performance
• Forecast Accuracy: measure of how closely forecast aligns with demand
• Bias: tendency to over or under predict future demand (forecast error)
n
Fd
MFEErrorForecastMeanBias
tt
n
t
)(
)(
1
12–12–2020
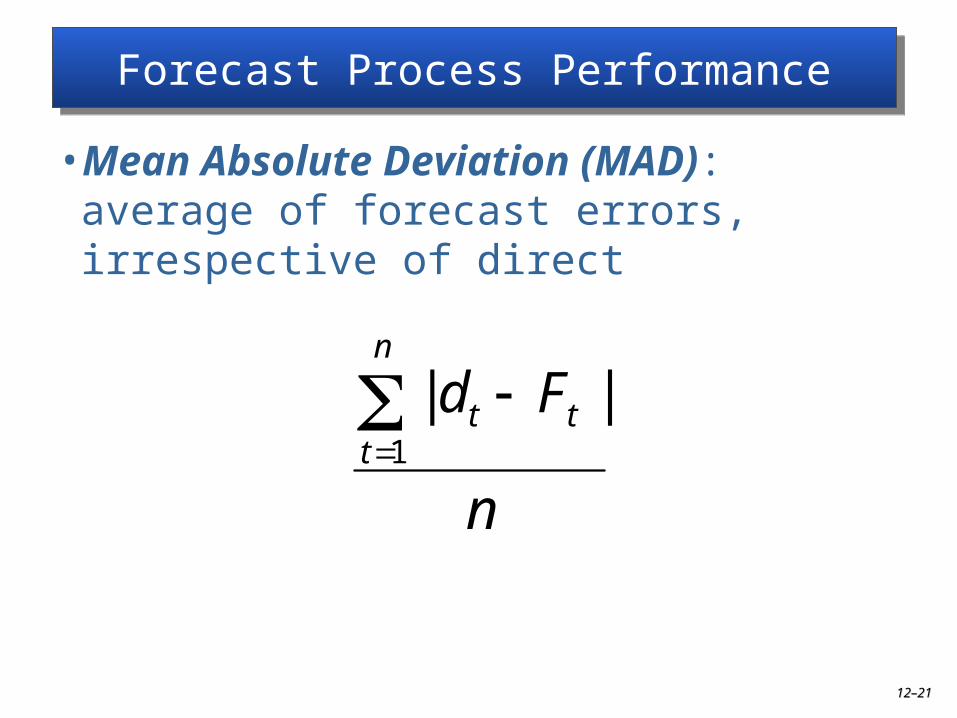
Forecast Process PerformanceForecast Process Performance
• Mean Absolute Deviation (MAD): average of forecast errors, irrespective of direct
n
Fd tt
n
t
||1
12–12–2121

Forecast Process PerformanceForecast Process Performance
1. Short term forecasts are more accurate than long term forecasts
2. Aggregate forecasts are more accurate than detailed forecasts
3. Information from more sources yields a more accurate forecast
12–12–2222
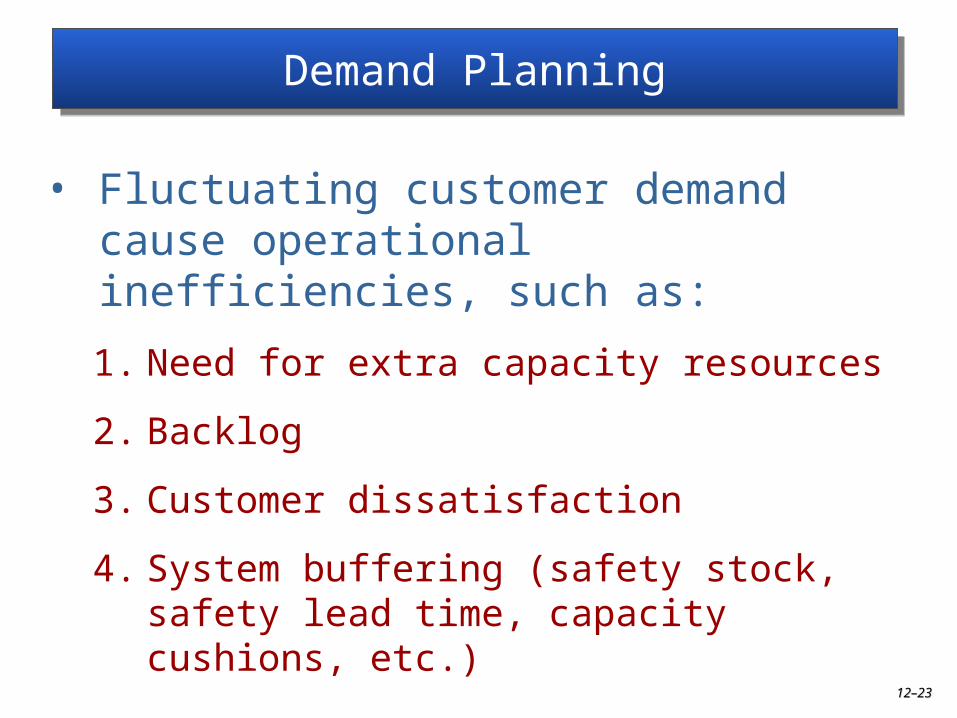
Demand PlanningDemand Planning
• Fluctuating customer demand cause operational inefficiencies, such as:
1. Need for extra capacity resources
2. Backlog
3. Customer dissatisfaction
4. System buffering (safety stock, safety lead time, capacity cushions, etc.)
12–12–2323

Demand PlanningDemand Planning
Try to manage demand by:
1. Use pricing, promotions or incentives to influence timing or quantity of demand
2. Manage timing of order fulfillment
3. Encourage shifting to alternate products
12–12–2424

Improving Planning ManagementImproving Planning Management
• Improving information accuracy and timeliness
• Reducing lead time
• Redesigning the product
• Collaborating and sharing information
12–12–2525
Improving Demand PlanningImproving Demand Planning
• Collaborative, planning, forecasting and replenishment (CPFR): supply chain partners share forecast, and demand and resource plans to reduce risk
- Market Planning: changes to products, locations, pricing and promotions
- Demand and resource planning: forecasting
- Execution: order fulfillment
- Analysis: data on key performance metrics
12–12–2626

Improving Demand PlanningImproving Demand Planning
Figure 12-612–12–2727

Demand Planning SummaryDemand Planning SummaryDemand Planning SummaryDemand Planning Summary
1. Forecasting process choice is influenced by a variety of factors
2. Forecasts are judgment or statistical model based
3. Both accuracy and bias should be considered
4. Demand management involves influencing customer demand
5. Supply chains can be made more responsive to changes in customer demand
12–12–2828