demag ppt vorlage - demagcranes.co.in file3 highlights all financial targets achieved further...
TRANSCRIPT

Analysts’ Conference
Demag Cranes AG Financial Year 2005/2006

2
Agenda
■ Highlights and Group Overview: Harald J. Joos, CEO
■ Financials: Dirk Kiessling, CFO
■ Outlook: Harald J. Joos, CEO
■ Q&A Session

3
Highlights
■ All financial targets achieved
■ Further reduction of net financial debt by 25.2 % to EUR 133.3 million; gearing reduced to roughly 71 %
■ Proposal to pay a dividend of EUR 1.00; dividend yield 4.5 % (calculation based on IPO offer price)
■ Continuing sound business environment
■ Outlook 2006/2007: further growth in all segments

4
FY 2005/2006: Record Results
Sales, adjusted EBITDA, adjusted EBIT in EUR million, EBIT margin in percent
844.0
810.1
881.6
986.9
52.234.1
64.084.5
76.2
55.9
84.9
105.6
6.2%
4.2%
7.3%
8.6%
FY 02/03 FY 03/04 FY 04/05 FY 05/06
Sales
Adjusted EBIT
Adjusted EBITDA
EBIT margin

5
Dynamic Growth in Emerging Markets
706.0
280.9
FY 05/06
635.2
246.4
FY 04/05
Mature Markets
Emerging Markets
11.1%
14.0%
Germany189.0
19%
Europe w/o Germany377.1
39%
218.8
22%
Asia/Pacific
121.8
12%
Others80.1
8%
North- andSouth America
Sales per market in EUR million Sales per region in EUR million

6
Industrial CranesSignificant Improvement of Profitability
Sales, adjusted EBITDA, adjusted EBIT in EUR million, EBIT margin in percent
Sales
Adjusted EBIT
Adjusted EBITDA
EBIT margin
409.9
449.0
1.3
10.8
14.5
23.7
0.3%
2.4%
FY 04/05 FY 05/06
449.0 46%
269.6
27%
268.3
27%
Port Technology
ServicesIndustrial Cranes
Sales in FY 05/06
9.5%
63.4%
730.8%

7
Sales, adjusted EBITDA, adjusted EBIT in EUR million, EBIT margin in percentSales in FY 05/06
Port TechnologyHighly Successful Product Strategy
237.1
269.6
20.4 24.5
24.9
29.8
8.6%
9.1%
FY 04/05 FY 05/06
Sales
Adjusted EBIT
Adjusted EBITDA
EBIT margin
449.0
46%
269.6 27%
268.3
27%
Port Technology
ServicesIndustrial Cranes
13.7%
19.7%
20.1%

8
Sales in FY 05/06
ServicesStrong Expansion of Service Activities
234.6
268.3
42.3
49.345.652.1
18.0%
18.4%
FY 04/05 FY 05/06
Sales
Adjusted EBIT
Adjusted EBITDA
EBIT margin
449.0
46%
269.6
27%
268.3 27%
Port Technology
ServicesIndustrial Cranes
Sales, adjusted EBITDA, adjusted EBIT in EUR million, EBIT margin in percent
14.4%
14.3%
16.5%

FinancialsFinancial Year
2005/2006
10
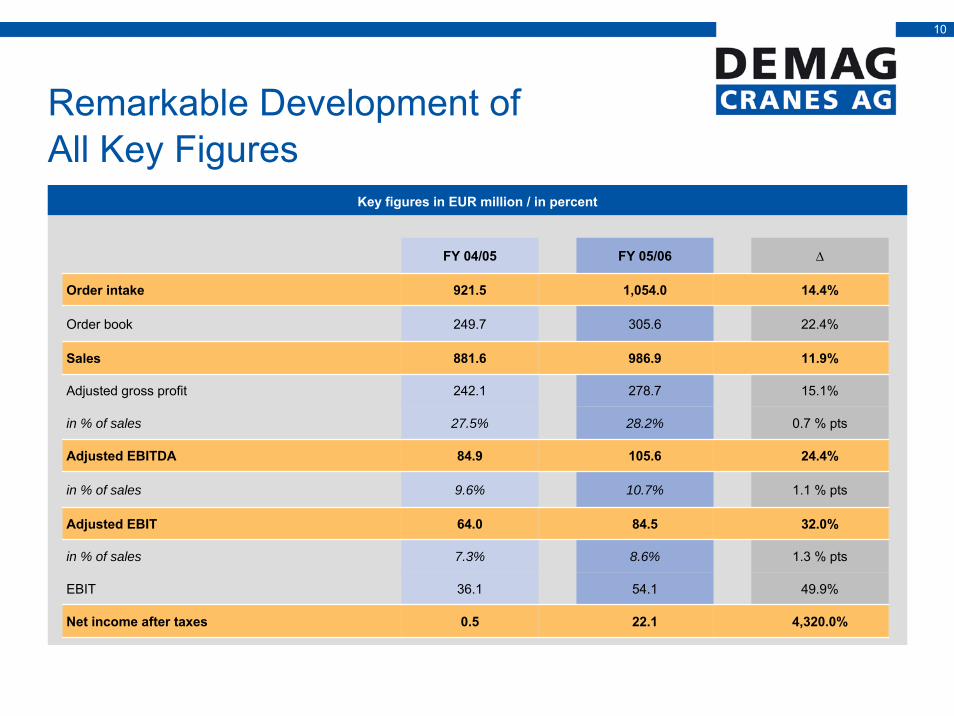
Key figures in EUR million / in percent
Remarkable Development of All Key Figures
FY 04/05 FY 05/06 ∆
Order intake 921.5 1,054.0 14.4%
Order book 249.7 305.6 22.4%
Sales 881.6 986.9 11.9%
Adjusted gross profit 242.1 278.7 15.1%
in % of sales 27.5% 28.2% 0.7 % pts
Adjusted EBITDA 84.9 105.6 24.4%
in % of sales 9.6% 10.7% 1.1 % pts
Adjusted EBIT 64.0 84.5 32.0%
in % of sales 7.3% 8.6% 1.3 % pts
EBIT 36.1 54.1 49.9%
Net income after taxes 0.5 22.1 4,320.0%

11
Strong Order Intake and Order Book
Order intake in EUR million / in percent
FY 04/05 FY 05/06
921.5
242.9
439.7
239.0
1,054.0
275.3
300.5
478.2
Industrial Cranes
Port Technology
Services
+14.4%
30 September 2005
249.7
75.6
142.2
31.9
30 September 2006
164.0
37.5
104.0
305.6+22.4%
Industrial Cranes
Port Technology
Services
Order book in EUR million / in percent
8.8%
23.7%
15.2%
15.3%
37.6%
17.6%

12
Continued High Level of R&D and Focus on SG&A Optimisation
Functional costs in EUR million / in percent of sales
986.9
267.2
54.1
Adjusted: 11.5
Adjusted:17.7
Adjusted: 0.8 Adjusted: 0.3
(708.2)
(55.5)
(127.5)(16.3)
5.1
11.5
30.4
Sales
COGS
Gross profit
G&A
(7.4% of sales)
Marketing & Selling
(13.0 % of sales)
R&D
(1.7 % of sales)
Others
EBITPrevious Year: 67.9
(7.7 % of sales)
Previous Year: 122.7
(13.9 % of sales)
Previous Year: 17.1
(1.9 % of sales)

13
2005/2006 Results Influenced by One-Off Effects
Adjustments in EUR million
FY 04/05 FY 05/06
EBIT 36.1 54.1
Effects from purchase accounting depreciation/amortisation 11.8 11.4
IPO costs 0 12.4
Restructuring/consulting 13.8 1.2
Severance & redundancy costs 12.3 4.2
Profit from divestments (2.7) 0.8
Other (8.8) (0.8)
Total adjustments for one-off effects 14.6 17.8
Adjustments for holding charges 1.5 1.2
Adjusted EBIT 64.0 84.6

14
High Level of CAPEX for Future Organic Growth
CAPEX in EUR million / in percent of sales
2.8%2.6%2.7%3.0%in % of sales28.122.622.225.3Total CAPEX6.24.61.00.0Capitalised R&D expenses21.918.021.225.3CAPEX
FY 05/06FY 04/05FY 03/04FY 02/03
25.3 21.218.0
21.9
1.04.6
6.2
3.0% 2.7%2.6%
2.8%
25.3 22.2 22.6
28.1
CAPEX
in % of sales
Capitalised R&D expenses

15
Significant Reduction of Working Capital
Net working capital in EUR million / in percent of sales
20.7%22.9%24.2%26.6%in % of sales203.9202.3196.1224.4Net working capital59.356.246.472.6(Net advances)99.465.274.162.7(Accounts payable)177.2154.4149.3165.5Accounts receivable185.5169.3167.4194.2Inventory
30 Sep 0630 Sep 0530 Sep 0430 Sep 03
224.4196.1 202.3 203.9
26.6%24.2%
22.9%20.7%
Net working capital
in % of sales

16
Ongoing Strong Cash Generation
Cash flow statement in EUR million
44.19.8Free cash flow before financing16.713.6Disposal proceeds
(28.1)(22.6)CAPEX (incl. capitalised R&D)
(2.1)(1.1)Acquisitions/disinvestments57.619.8Cash flow from operations
(10.0)(6.8)Income tax payments
(14.7)(23.3)Net interest payments82.449.9Cash flow before interest and tax(0.3)(3.2)Other operating cash flow
(2.5)(12.0)Δ Other assets/liabilities(1.5)(3.8)Δ Net working capital38.3(11.6)Δ Accounts payable
4.58.8Δ Net advances
(25.7)(2.5)Δ Accounts receivable
(18.5)1.5Δ Inventories86.668.9EBITDA
FY 05/06FY 04/05

17
Extraordinary Reduction of Net Debt due to Active Cash Management
Net financial debt in EUR million / Gearing in percent
70.6%111.0%440.7%18,973.7%Gearing133.3178.3286.9360.5Net financial debt
2.457.918.46.8(Short-term financial receivables)
51.143.235.545.5(Cash and cash equivalents)
182.6264.2323.7396.1Long-term interest-bearing loans and borrowings
4.115.217.116.7Short-term interest-bearing loans and borrowings
30 Sep 0630 Sep 0530 Sep 0430 Sep 03
360.5
286.9
178.3133.3
440.7%
111.0%70.6%
Net financial debt
Gearing

18
Increase in Sales per Employee
Headcount* / sales per employee
4,7143,698 3,332 3,303
599
627684 765
1,368
1,4581,504 1,612
6,681
5,7835,520 5,680
0.1260.140
0.1600.174
30 Sep 03 30 Sep 04 30 Sep 05 30 Sep 06
Industrial Cranes
Port Technology
Services
Sales per employee
* Permanent employees as at the end of period (excluding temporary employees, apprentices and trainees)

19
Key figures in EUR million / in percent
Strong Q4 Reflects Effectiveness of Measures
Q4 2004/2005 Q4 2005/2006 ∆
Order intake 229.8 269.0 17.1%
Order book 249.7 305.6 22.4%
Sales 253.5 273.0 7.7%
Adjusted gross profit 69.8 78.3 12.2%
in % of sales 27.5% 28.7% 1.2 % pts
Adjusted EBITDA 30.6 35.8 17.0%
in % of sales 12.1% 13.1% 1.0 % pts
Adjusted EBIT 24.9 29.7 19.3%
in % of sales 9.8% 10.9% 1.1 % pts
EBIT 17.6 26.4 50%
Net income after taxes 6.6 13.6 106.1%

OutlookFinancial Year
2006/2007

21
Growing Sales and Further Improvement of Earnings
Financial outlook for FY 2006/2007
Sales in a range of 7.0 % to 10.0 % above previous year
Adjusted EBIT 24.0 % to 29.0 % higher compared to FY 2005/2006
Increase of adjusted EBITDA of 20.0 % to 25.0 % over previous year

22
Segment Outlook 2006/2007
Industrial
Cranes
Outlook
■ Further effects of implemented measures
■ Stronger market penetration with new products
Port
Technology
■ Completion of new product families and market launches
■ Further reduction of throughput times
Services
■ Ongoing trend among customers to outsource maintenance operations
■ Strengthening of service infrastructures in target regions
Outlook
Outlook

23
Financial Calendar 2007
■ 27 February 2007 Interim report Q1, financial year 2006/2007
■ 20 March 2007 General Shareholders’ Meeting, financial year 2005/2006
■ 15 May 2007 Interim report Q2, financial year 2006/2007
■ 9 August 2007 Interim report Q3, financial year 2006/2007
■ 12 December 2007 Financial statements, financial year 2006/2007

24
Disclaimer
■ This report includes forward looking statements on Demag Cranes AG, its subsidiaries and associates, and on the economic and political conditions that may influence the business performance of the Demag Cranes AG. All these statements are based on assumptions made by the Executive Board using information available to it at the time.
■ Should these assumptions prove to be wholly or partly incorrect, or should further risks arise, actual business performance may differ from that expected.
■ The Executive Board therefore cannot assume any liability for the statements made.

Back UpFinancial Year
2005/2006

26
Quarterly Development per Segment
*As at end of period**The adjustments reflect the effect of the purchase accounting method, one-off effects as well as Holding charges up to the IPO.*** Permanent employees as at the end of period (excluding temporary employees, apprentices and trainees)
Industrial Cranes Q1 2005 ∆ Q2 2005 ∆ Q3 2005 ∆ Q4 2005 ∆ Q1 2006 ∆ Q2 2006 ∆ Q3 2006 ∆ Q4 2006Order Intake 122.9 -18.3% 100.4 12.5% 112.9 -8.3% 103.5 16.8% 120.9 4.1% 125.9 -10.4% 112.8 5.1% 118.6Order Book* 123.7 7.8% 133.4 14.4% 152.6 -6.8% 142.2 7.7% 153.2 5.4% 161.4 2.4% 165.3 -0.8% 164.0Sales 105.1 -12.7% 91.8 6.4% 97.7 18.0% 115.3 -4.0% 110.7 4.5% 115.7 -8.0% 106.4 9.2% 116.2Adjusted Gross Profit 25.3 -3.6% 24.4 7.4% 26.2 5.0% 27.5 -3.6% 26.5 19.6% 31.7 -5.7% 29.9 3.0% 30.8Adjusted EBIT -1.8 38.9% -2.5 -168.0% 1.7 129.4% 3.9 -112.8% -0.5 -680.0% 2.9 31.0% 3.8 21.1% 4.6in % of sales -1.7% -2.7% 1.7% 3.4% -0.5% 2.5% 3.6% 4.0%Employees*** 3,501 -1.5% 3,448 0.4% 3,463 -3.8% 3,332 -0.7% 3,310 -0.2% 3,303 1.2% 3,342 -1.2% 3,303
Port TechnologyOrder Intake 44.4 51.6% 67.3 0.9% 67.9 -6.8% 63.3 54.5% 97.8 -38.8% 59.9 7.8% 64.6 21.1% 78.2Order Book* 85.9 13.0% 97.1 -11.4% 86.0 -12.1% 75.6 66.3% 125.7 -6.0% 118.2 -10.8% 105.4 -1.3% 104.0Sales 28.5 96.8% 56.1 40.5% 78.8 -6.5% 73.7 -35.3% 47.7 32.1% 63.0 22.9% 77.4 5.3% 81.5Adjusted Gross Profit 5.6 108.9% 11.7 41.0% 16.5 10.3% 18.2 -45.6% 9.9 40.4% 13.9 19.4% 16.6 22.9% 20.4Adjusted EBIT -0.9 -600.0% 4.5 71.1% 7.7 18.2% 9.1 -81.3% 1.7 211.8% 5.3 47.2% 7.8 24.4% 9.7in % of sales -3.2% 8.0% 9.8% 12.3% 3.6% 8.4% 10.1% 11.9%Employees*** 641 3.1% 661 1.7% 672 1.8% 684 2.0% 698 5.4% 736 2.7% 756 1.2% 765
ServicesOrder Intake 57.1 4.6% 59.7 -0.8% 59.2 6.4% 63.0 -0.2% 62.9 11.9% 70.4 -0.7% 69.9 3.1% 72.1Order Book* 29.9 11.7% 33.4 0.0% 33.4 -4.5% 31.9 11.9% 35.7 6.4% 38.0 8.7% 41.3 -9.2% 37.5Sales 53.5 6.5% 57.0 4.4% 59.5 8.6% 64.6 -6.7% 60.3 12.3% 67.7 -4.0% 65.0 15.8% 75.3Adjusted Gross Profit 20.2 3.5% 20.9 2.9% 21.5 12.1% 24.1 -7.1% 22.4 11.6% 25.0 -2.0% 24.5 10.6% 27.1Adjusted EBIT 9.3 10.8% 10.3 4.9% 10.8 10.2% 11.9 -16.8% 9.9 17.2% 11.6 6.0% 12.3 26.0% 15.5in % of sales 17.4% 18.1% 18.2% 18.4% 16.4% 17.1% 18.9% 20.6%Employees*** 1,518 -1.1% 1,501 -1.1% 1,484 1.3% 1,504 1.5% 1,526 1.5% 1,549 2.2% 1,583 1.8% 1,612
in EUR million