dell children’s medical center of central texas: charting the path to platinum
TRANSCRIPT

DELL CHILDREN’S MEDICAL CENTER OF CENTRAL TEXAS:
CHARTING THE PATH TO PLATINUM
A CONSULTANT’S PERSPECTIVE
Nolan Rome
Senior Vice President, WSP+ccrd

Our Path
To Healthcare
Sustainability

The Path for Today
• Why sustainability?
• Driver?
• Statement for the Provider
• Statement for the Community
• Statement of Responsibility
• Dell Children’s Hospital
• Dell Children’s 3BT

• Sustainable designs lead to a healthy building
philosophy
• Our business is providing an
environment for helping people
get well
• It should start with a healthy building
• The healthy building concept is now:
• The RIGHT thing to do
• And it ‘sells’ in many ways
Sustainability: Our Perspective

1981 1992 1996 2008 2010 2015
ccrdcreated
ccrd assisted in the
creation of Dallas
AIA sustainability
committee
ccrd present
Sustainability in
Healthcare to
International
Healthcare
Conference
ccrd completes over
25,000,000 SF of
healthcare project
designs
Dell Children’s
Hospital becomes
first LEED platinum
certified hospital
WSP + ccrd join
forces – now have
completed 25 LEED
healthcare projects
Dell Children’s
Hospital becomes
first LEED Healthcare
platinum certified
hospital

Dell Children’s Medical Center of Central Texas
• Awarded LEED Platinum• First LEED Platinum Healthcare Facility
• 473,000 BGSF, 169 beds
• 32.2 acres on 709 acre Brownfield site
• Combined Heat Power Plant (CHP)
• Achieved 54 LEED v2.1 points• 23 points MEP related• Represents 43% of total points achieved


Combined Cooling Heating and Power Plant
• 4.5MW natural gas-fired turbine supplies 100% of the hospital’s electricity
• 75% more efficient than coal-fired power plants
• Lower emissions of nitrogen oxides and carbon dioxide as a result of efficient combustion chamber technology
• Steam, a by-product of the conversion process, is utilized by the hospital and is used in absorption chillers to produce all of the hospital’s chilled water needs

Dell Children’s Hospital - Specifics
• Individual control capabilities• 96% of occupants have lighting control• Underfloor air distribution in administrative areas
• Occupancy sensors and daylight harvesting utilized
• CO2 monitoring in high occupancy areas • Reduce outside air under low occupancy
• Approximately 1.3 million gallons water saved annually• Dual low flush fixtures, low flow showers, automatic sensors
• Energy savings estimated at $1.5 million
• Energy measurement and verification system• Maintain and optimize energy usage

Dell Children’s Hospital Courtyards

Dell Children’s Hospital Courtyards

Dell Children’s Medical Center – 3BT Expansion
• FIRST LEED
Platinum under
2009 LEED for
Healthcare
• 75,000 BGSF, 72
beds
• 57 LEED Design
Phase Credits
Awarded
• 86 LEED Credits
Awarded Total
Heat
Recovery
Lighting
Controls
Solar PV &
Heating
Water
Project Overview – 3BT Expansion
©2013 THOMAS MCCONNELL
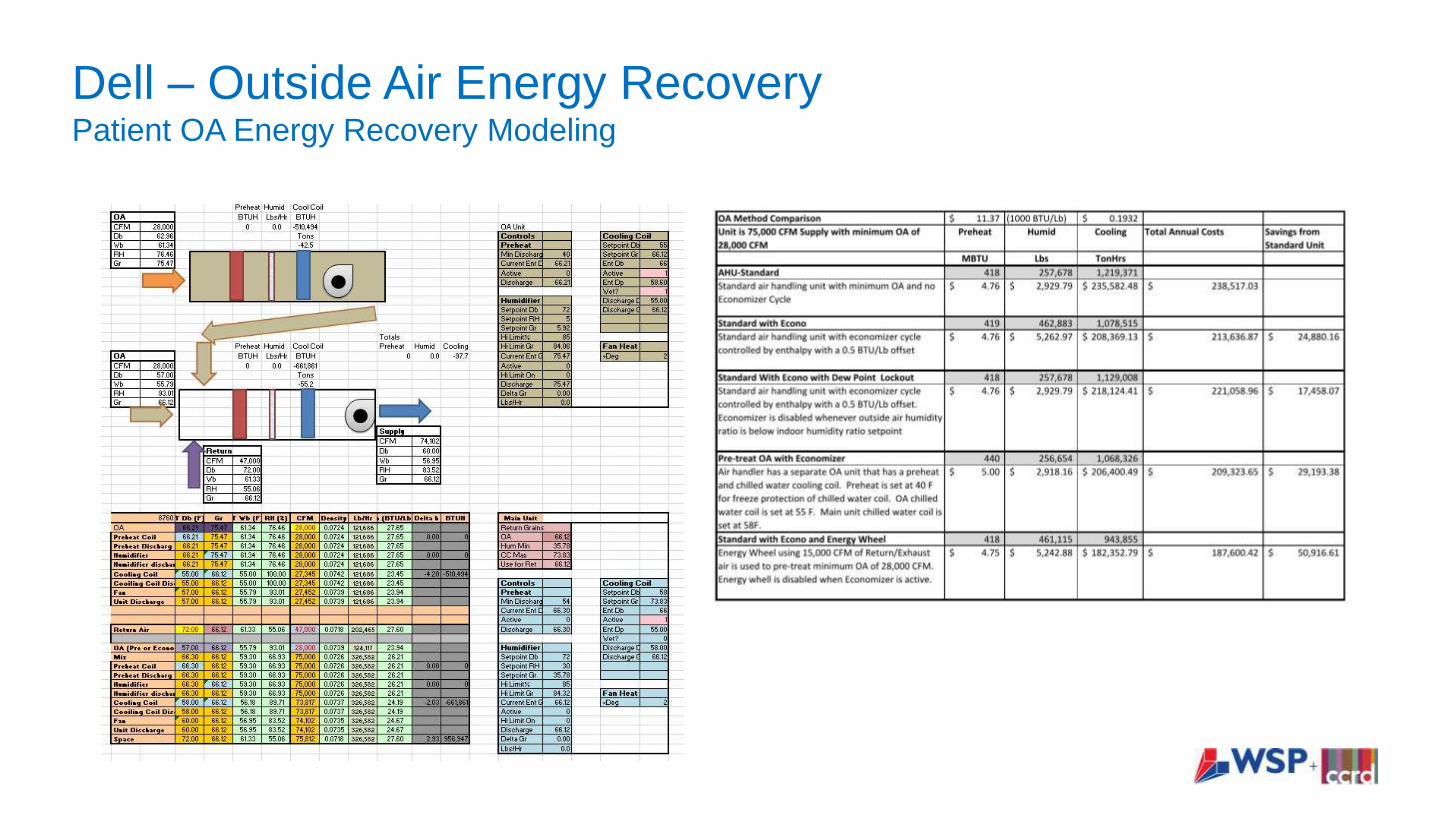
Dell – Outside Air Energy RecoveryPatient OA Energy Recovery Modeling

• Owner Desire for Setbacks Based on Bed Tracking
• Patient Information Protection Concerns/ Constraints
• Collaboration with BMS/Lighting Controls/Finance Software
In-patient
Registered –
Billing Tracking
Dell – Lighting Controls IntegrationPatient Tracking & BMS

On Site Renewable

• 88,654,000 w-Hr collected annually
• 1.3% of On-Site Renewable
Dell – On Site Renewable EnergySolar Heating Water System

• 22% better than ASHRAE
90.1 Baseline by COST
• 75 W-hr/m2 more efficient
than Baseline by USE
• ONLY energy numbers used
in the combined heat &
power calculation
Computational Modeling Results

For Projects Served by District Thermal Energy and
CHP USGBC has Supplemental Guide.
Austin Energy provides chilled water, steam and power
4 Years of Energy
Numbers Provided
District Thermal Performance Calculations
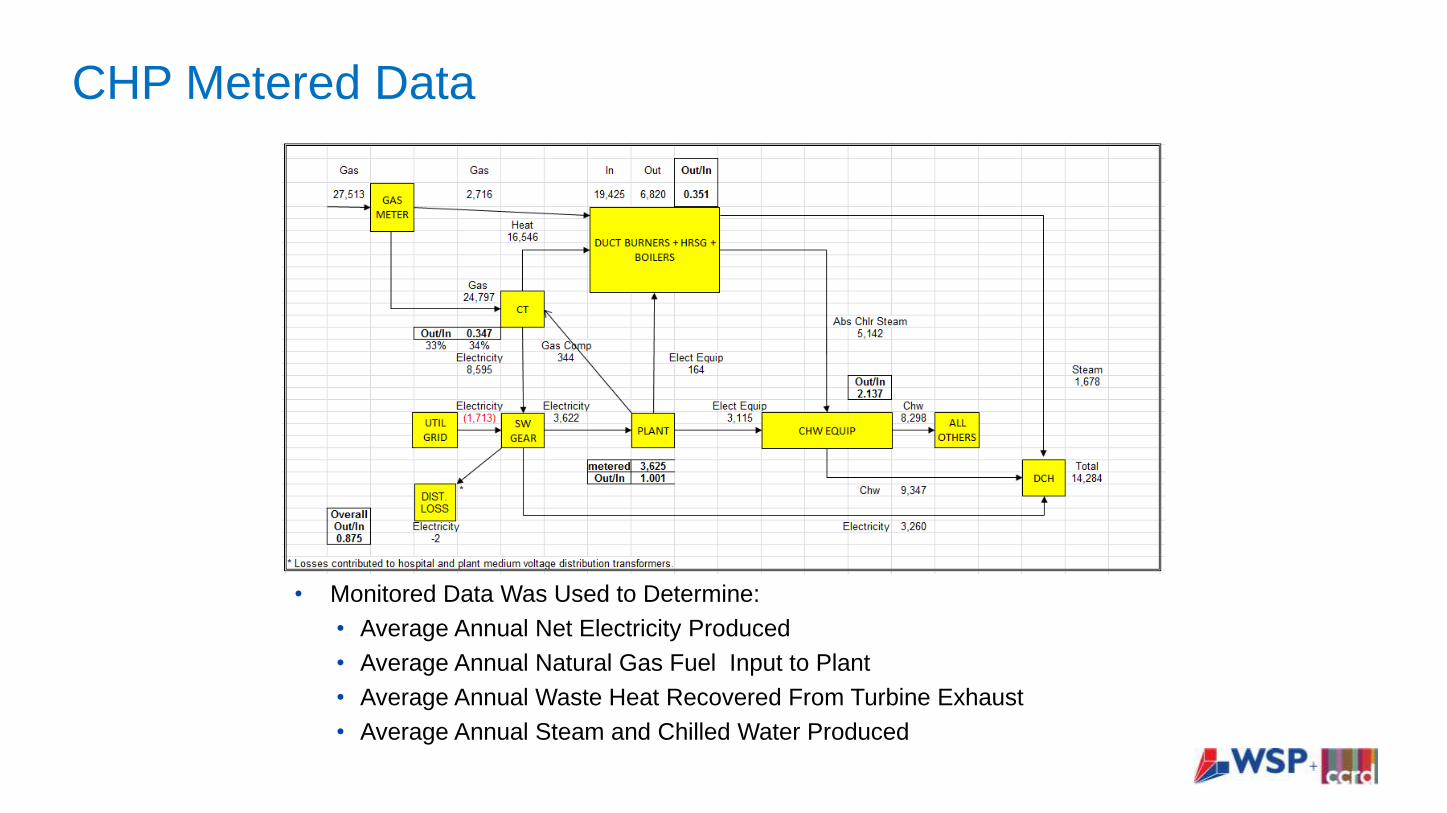
• Monitored Data Was Used to Determine:
• Average Annual Net Electricity Produced
• Average Annual Natural Gas Fuel Input to Plant
• Average Annual Waste Heat Recovered From Turbine Exhaust
• Average Annual Steam and Chilled Water Produced
CHP Metered Data

• The energy cost savings for the Proposed case was
determined to be 46% over the Baseline case, which would
qualify the project for 23 Points under the requirements of
EA Credit 1.
Results of Computational Model & CHP Calculations

Actual Loads vs. Design Projections

0.04
0.03 0.03 0.03 0.03 0.03
0.05
0.090.09
0.11
0.09 0.09
SEPTEMBER AUGUST JULY JUNE MAY APRIL MARCH FEBRUARY JANUARY DECEMBER NOVEMBER OCTOBER
DCMCCT - Natural Gas Use - GJ/sm/month
Dell Natural Gas Usage

0.08 0.08
0.09 0.09
0.080.07 0.07
0.07 0.070.07 0.07 0.07
SEPTEMBER AUGUST JULY JUNE MAY APRIL MARCH FEBRUARY JANUARY DECEMBER NOVEMBER OCTOBER
DCMCCT - Electric Use - GJ/sm/month
Dell Electric Usage

0.04
0.03 0.030.03 0.03
0.03
0.05
0.09
0.09
0.11
0.090.09
0.08 0.08
0.09 0.09
0.080.07 0.07
0.07 0.070.07 0.07 0.07
SEPTEMBER AUGUST JULY JUNE MAY APRIL MARCH FEBRUARY JANUARY DECEMBER NOVEMBER OCTOBER
DCMCCT - Energy Use - GJ/sm/month
Nat Gas Elec
Dell Total Energy Usage

Dell Children’s Medical
Center of Central Texas
DRIVER: Community
& Wellness