delineation of tectonic lineaments using aeromagnetic data...
TRANSCRIPT

GEOFIZIKA VOL. 29 2012
Preliminary communication UDC 550.389
Delineation of tectonic lineaments using aeromagnetic data for the south-east Cameroon area
Alain Narcisse S. Feumoe
1, Theophile Ndougsa-Mbarga
2,Eliezer Manguelle-Dicoum
1 and James Derek Fairhead
3
1University of Yaoundé I, faculty of Science, Department of Physics, Yaoundé, Cameroon2University of Yaoundé 1, Advanced Teacher’s Training College, Department of Physics,
Yaoundé, Cameroon3University of leeds, faculty of Environment, School of Earth and Environment, leeds, UK
Received 28 November 2011, in final form 21 September 2012
The subsurface structures in a part of the Congo Craton in south-eastern Cameroon, between the latitudes 2° to 3° N and longitudes 13° to 15° E, has been estimated by the interpretation of aeromagnetic data. Magnetic survey is used to delineate magnetic lineaments, analyze its relationship to the tectonic fabric and to estimate the depth of perturbing body source, probably granitic intrusion along one profile selected on the total magnetic intensity reduced to the equator (TMI–RTE) map by means of forward modelling and inversion con-strained by surface geology and results from Euler deconvolution analysis method. Determination of the magnitude maxima of the first vertical derivative (FVD) of the residual field reduce to the equator allowed a map to be produced showing various aeromagnetic lineaments interpreted as the fault system of the studied area. Particularly, looking at the center of the structural map, we find that these structures are associated to long-wavelength anomalies, suggesting that its should be connected with large-scale structural deformation. The pseu-do-gravity map shows the extension of the tillitic formations on the geological map. Our results confirms the morphological difference and the tectonical sub-division into two tectonic sectors corresponding to the Congo Craton in the south, Pan-African in the north and also helped identify the tectonic boundary separat-ing them at depth.
Keywords: magnetic anomaly, reduction-to-the equator, first vertical derivative, pseudo-gravity and Euler deconvolution.
1. Introduction
The area involved in this study is located in the south-eastern part of Cam-eroon (Central Africa). The south-eastern Cameroon region rises many geological challenges due in part to the wide spacing between primary surface observations

176 A. N. S. fEUMOE ET AL.: DElINEATION Of TECTONIC lINEAMENTS USING AEROMAGNETIC...
and a short supply of subsurface observations. Indeed, the dense vegetal coverage makes difficult direct geological studies and field geophysical surveys however, potential field data are a primary source of information on subsurface geology and tectonic features. Aeromagnetic method being a faster economical and ver-satile geophysical tool may help reveal both large and small scale features, in-cluding differences in basement type, magmatic intrusions, volcanic rocks, base-ment surface and fault structures (Vasanthi et al., 2006).
This area was affected by a series of tectonic events due to the collision be-tween the Pan-African belt and the Congo Craton that formed the structural features of the southern Cameroon (Nzenti et al., 1984, 1988; Castaing et al., 1994; Abdelsalam et al., 2002; Toteu et al., 2006). The collision yielded to an over thrusting of the Pan-African units onto the Craton of about 50 to 150 km (Nédelec et al., 1986; Manguelle-Dicoum et al., 1992; Tadjou et al., 2009; Shandini et al., 2010).
The most relevant geophysical studies were carried out in northern edge of the Congo Craton in south Cameroon to determine by audio-magnetotelluric in-vestigations the subsurface structure of the schist-granite contact and the Congo Craton boundary (Manguelle-Dicoum et al., 1992; Mbom-Abane, 1997) and to define the crustal density across the tectonic and also to identify the important signature of structures in the gravity anomaly field (Tadjou et al., 2004, 2009; Shandini et al., 2011). A mayor problem in this regard is that the underlying re-gional geology structure in south-eastern Cameroon is currently not understood.
The purpose of this study based on the interpretation of available aeromagne-tic data, is to improve our knowledge about the structural context of the south-east ern Cameroon by proposing a comprehensive structural sketch map of the area and by correlating these linear structures with the regional geology in order to have a better understanding of the structural framework of the area. The 2D sus cep tibility model of the crust along one profile directed NW–SE was carried out bas ed on complete total magnetic anomaly data by means of modelling and inversion.
2. Geologic and tectonic settingThe study area encompasses a 24 642 km2 area that includes the Yaoundé
domain and the Ntem complex with its Proterozoic cover (fig. 1).The following sections summarizes the geological and structural framework of the area as background to interpretation and discussion of geophysical lineament mapping.
The Yaoundé domain is a huge allochtonous nappe unit thrusted southward onto the Congo Craton. This domain belongs to the northern Pan-African belt and includes the Mbalmayo-Bengbis and Yokadouma series. It comprises low-to-high-grade garnet-bearing schists, gneisses, and orthogneisses metamorphosed under a medium-to-high-pressure metamorphism reaching the granulite facies.
The Ntem complex constitutes the north-western part of the Congo Craton and is very well exposed in southern Cameroon (Maurizot et al., 1986). The

GEOfIzIKA, VOl. 29, NO. 2, 2012, 175–192 177
complex is made up dominantly of Archean rocks with some reworked material that formed in Early Proterozoic times (Tchameni, 2000; Tchameni et al., 2001). It includes Ntem unit and Mbalam series. The Pan-African units rest directly on the Ntem complex basement and constitute the second cover of the Congo Craton. The first Craton cover (Proterozoic) is constituted by the Dja series and the tillitic complexes. It is discordant with the Mbalam belt and covered par-tially in the north by the Yaoundé nappe (Mvondo et al., 2003; Caron et al., 2010).
The major tectonic feature of the region is constituted by the extension of the Congo Craton under the Pan-African units. This event marks the subduction of the Congo Craton under the Pan-African belt. According to the hypothesis of subduction of the southern plate Craton, it must have provoked deep fractures in covers. However, the geology knowledge about the buried faults in the area is limited and the geologic and tectonic data available actually are focused in the Mintom area, where a limestone deposit has been found by the mining inventory (Vanhoutte and Salley, 1986; Vanhoutte, 1989; Caron et al., 2010). The present study deals with the application of aeromagnetic data interpretation to establish the struc-tural setting of the area under investigation.
3. Aeromagnetic data and analysis
3.1. The origin of dataThe key component of this study involved image enhancement of existing
aeromagnetic data sets acquired by the company SURVAIR (contractor) for the CIDA (client) in 1970. Aeromagnetic surveys were flown with a flight height of
Figure 1. Geological sketch map of the study area (modified after Feybesse et al., 1987). 1 = Mou-loundou tillite; 2 = Ntem unit; 3 = Lower Dja series; 4 = Mbalam series; 5 = Upper Dja series; 6 = Yokadouma series; 7 = Mbalmayo-Bengbis series.
178 A. N. S. fEUMOE ET AL.: DElINEATION Of TECTONIC lINEAMENTS USING AEROMAGNETIC...
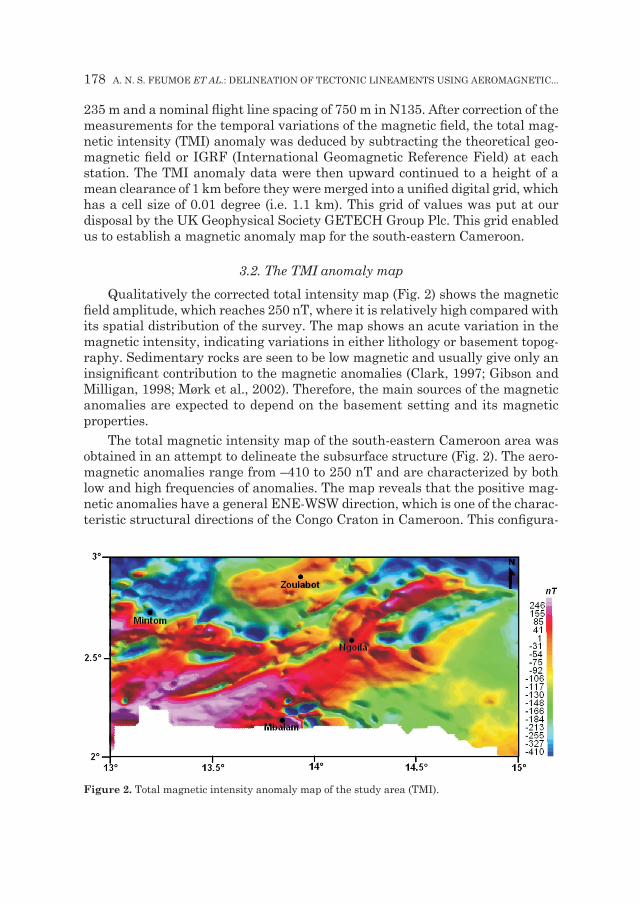
235 m and a nominal flight line spacing of 750 m in N135. After correction of the measurements for the temporal variations of the magnetic field, the total mag-netic intensity (TMI) anomaly was deduced by subtracting the theoretical geo-magnetic field or IGRF (International Geomagnetic Reference Field) at each station. The TMI anomaly data were then upward continued to a height of a mean clearance of 1 km before they were merged into a unified digital grid, which has a cell size of 0.01 degree (i.e. 1.1 km). This grid of values was put at our disposal by the UK Geophysical Society GETECH Group Plc. This grid enabled us to establish a magnetic anomaly map for the south-eastern Cameroon.
3.2. The TMI anomaly mapQualitatively the corrected total intensity map (fig. 2) shows the magnetic
field amplitude, which reaches 250 nT, where it is relatively high compared with its spatial distribution of the survey. The map shows an acute variation in the magnetic intensity, indicating variations in either lithology or basement topog-raphy. Sedimentary rocks are seen to be low magnetic and usually give only an insignificant contribution to the magnetic anomalies (Clark, 1997; Gibson and Milligan, 1998; Mørk et al., 2002). Therefore, the main sources of the magnetic anomalies are expected to depend on the basement setting and its magnetic properties.
The total magnetic intensity map of the south-eastern Cameroon area was obtained in an attempt to delineate the subsurface structure (fig. 2). The aero-magnetic anomalies range from –410 to 250 nT and are characterized by both low and high frequencies of anomalies. The map reveals that the positive mag-netic anomalies have a general ENE-WSW direction, which is one of the charac-teristic structural directions of the Congo Craton in Cameroon. This configura-
Figure 2. Total magnetic intensity anomaly map of the study area (TMI).

GEOfIzIKA, VOl. 29, NO. 2, 2012, 175–192 179
tion of positive anomalies may be attributed to relatively deep-seated low relief basement structures. This suggests that the TMI anomalies are strongly influ-enced by the regional tectonic.
At low magnetic latitudes as is the case here, it is not very easy to correlate the observed anomaly maxima and the positions of magnetic sources because in the TMI anomaly map, the maxima are not found vertically above magnetic sources, thus making it difficult to link the observed anomalies with the sources. In order to partially come to this, it is usually necessary to perform a standard phase shift operation known as reduction-to-pole on the observed magnetic field, the operator affects as well the phase as the amplitude.
3.3. Reduction-to-the-poleThe reduction to the pole (RTP) operation transforms the observed mag-
netic anomaly in to the anomaly that would have been measured if the magne-tization and ambient field were both vertical. This puts the limits of the mag-netic anomalies directly over their sources, like gravity anomalies, thus making magnetic interpretation easier and more reliable. In practice, the standard RTP transform is difficult to apply at very low latitudes and produces variable-qual-ity maps, sometimes dominated by declination-parallel artefacts (Rajagopalan, 2003). The RTP methods either modify the amplitude in the north-south direc-tion using frequency domain techniques (Hassen and Pawlowski, 1989; Mendoça and Silva, 1993) or calculate an equivalent source in the space domain (Silva, 1986). The RTP map (Fig. 3) remains strongly influenced by the low latitudes as compare to these on the TMI (fig. 2) anomaly map. However, this affects the location as well as the wavelength of the anomalies. On this map, the north-south
Figure 3. Total magnetic intensity map reduced to the pole (TMI-RTP).

180 A. N. S. fEUMOE ET AL.: DElINEATION Of TECTONIC lINEAMENTS USING AEROMAGNETIC...
direction is accentuated and RTP is generally unstable and cannot be very use-ful. To facilitate the interpretation of the anomalies at very low latitudes, we transform the analytic maps in the space domain: this is the case of the reduc-tion-to-the-equator.
3.4. Reduction-to-the-equatorThe TMI data have reduced to the equator by assuming an inclination of
I = –19.89° and a declination of D = –5.88° according to IGRF (International Geomagnetic Reference field) at the date of January 1970 in the center of the region (2.5° N, 14.0° E). The Geosoft package software V.6.3 was used to reduce the field to the equator (transformation done in the Fourier domain). In the space domain, these analytic transformations correspond to convolutions of the initial signal with a specific operator. Calculations are generally done in the Fourier domain where the convolution is replaced by the simple multiplication. It can be seen that the RTE map (fig. 4) shows two different zones based on the magnetic intensity variations, which are possibly related to the zones of structural variations based on the geologic investigations. The highest magnetic intensity values are located at the south-western part of the study area. Meanwhile, the positives anomalies moved vertically northbound on the RTE map. A strong correlation is observed between the anomalies and the regional geology which shows a promi-nence of magnetism due to intrusive igneous rocks over the basement formations.
The magnetic anomaly map reduced to the equator shows a clear contrast between crust of Ntem complex and crust of Pan-African. The Pan-African crust is characterized by low amplitude of anomalies which correlate with known tectonic structures such as metamorphic rocks, even though to a large extent covered by sedimentary rocks. In contrast, the Ntem complex exhibits numerous
Figure 4. Total magnetic intensity map reduce to the equator (TMI-RTE) showing profile.

GEOfIzIKA, VOl. 29, NO. 2, 2012, 175–192 181
high amplitude anomalies of which several correlate with intrusive complexes (Archean rocks) in accordance with the Precambrian age of the crystalline base-ment in this area (Congo Craton).
4. MethodTo delineate the subsurface structures of the area, we have taken four ap-
proaches. These approaches are the fVD method to delineate linear structures, the pseudo-gravity to outline crustal magnetic sources and the Euler deconvolu-tion to constrain depth of perturbing body source. Results of the last method with available geological information are used to build a 2D structural model to help in understanding the subsurface structure of the study area.
4.1. The first vertical derivative (FVD)Derivatives tend to sharpen the edges of anomalies and enhance shallow
features. The vertical derivative map is much more responsive to local influ-ences than to broad or regional effects and therefore tends to give sharper picture than the map of the total field intensity. Thus the smaller anomalies are more readily apparent in area of strong regional disturbances. In fact, the fVD is used to delineate high frequency features more clearly where they are shadowed by large amplitude, low frequency anomalies.
To emphasize the effects of the geological contacts, critical for the structural framework of the area, the data processing involved accurate enhancement of the short-wavelength and linear features. In that regard, the aeromagnetic data were first re-gridded with a grid-cell spacing of 250 m and were subjected to regional/residual separation to isolate short-wavelength signal which is more suitable for high-resolution mapping of shallow magnetic boundaries. The re-
Figure 5. Shaded-relief residual map of the TMI-RTE for the study area.

182 A. N. S. fEUMOE ET AL.: DElINEATION Of TECTONIC lINEAMENTS USING AEROMAGNETIC...
gional/residual separation was made by subtraction of the upward-continued grid to 200 m from the total magnetic intensity aeromagnetic grid. Upward continuation transformation attenuates high-frequency signal components and tends to emphasize deep, regional-scale magnetic anomalies. Subtraction of the low-frequency upward-continued data from the original grid produces a residu-al map that is enhanced in short-wavelength signal. The enhancement of mag-netic anomalies associated with faults and other structural discontinuities were achieved by the application of fVD to the residual map in fig. 5 (Dobrin and Savit, 1988; Telford et al., 1990). The reprocessed aeromagnetic data set is sig-nificantly enhanced in high frequencies and is much better suited to detailed regional shallow mapping and analysis of basement magnetic boundaries.
4.2. Pseudo-gravityIn order to locate and outline crustal magnetic sources, transformation tech-
niques must be applied to the data as magnetic anomalies very rarely are centred above their source. The pseudo-gravity transform (Baronov, 1957) is applied to the magnetic data. By using the pseudo gravity transform, the apex of the mag-netic anomalies is shifted over the source body and the distortion due to the earth’s magnetic field can easily be removed. A pseudo-gravity transformation is useful in interpreting magnetic anomalies, not because a mass distribution actually corresponds to the magnetic distribution beneath the magnetic survey, but because gravity anomalies are in some ways more instructive and easier to interpret and quantify than magnetic anomalies (Blakely, 1995).
The pseudo-gravity transform was applied to the total magnetic intensity grid using the FFT (Fast Fourier Transform) filter package available in Oasis Montaj by taking into account the density contrast of 1 g/cm3 and a magnetiza-tion of 0.5 Gauss. The pseudo-gravity transformation follows from Poisson’s rela-tion between the magnetic potential and the gravitational field. Consider a body with uniform magnetization and density occupying a volume v. Then magnetic scalar potential is: (1)
where p is the observation point, d the distance from p. The gravitational poten-tial is: (2)
Where G is the gravitational constant and r the density. Combining the two,
(3)
gM the component of gravity in the direction of magnetization: it is Poisson’s relation. In fact, it is not necessary for gravity and magnetization to be constant.

GEOfIzIKA, VOl. 29, NO. 2, 2012, 175–192 183
We can consider a body to be composed of arbitrarily small volumes in which density and magnetization can be regarded as constant. Since potential add, (3) applies to a body which density and magnetization vary in proportion. However, pseudo-gravity is defined as the gravity anomaly that would be observed if the magnetization distribution were replaced by an identical density distribution, i.e. r / M is a constant.
4.3. Euler deconvolution
The objective of the 1D Euler deconvolution process is to determine the shape and corresponding depth estimations of geologic sources of magnetic and gravi-metric anomalies along a profile. Euler deconvolution is based on solving Euler’s homogeneity equation (4) (Reid et al., 1990):
(4)
where B is the regional value of the total magnetic field and (x0, y0, z0) is the position of the magnetic source, which produces the total magnetic field M mea-sured at (x, y, z). N is so called structural index. for each position of the moving window, a over-estimated system of linear equations is solved for the position and depth of the sources (Thompson, 1982; Reid et al., 1990). Euler deconvolution can applied to profiles and assumes that the field is symmetric transverse to the profile, so ∂M / ∂y = 0. The total field can be considered to be the sum of a re-gional field and the anomaly due to the point source, then from equation (4):
(5)
Then by moving the operated window from one location to the next over the anomaly, multiple solutions for the same source are obtained.
4.4. 2D modelling
We used the 2.5D modelling program of Gordon Cooper „Geomodel” which is an interactive, graphically oriented and modelling program designed for the interpretation of magnetic and gravity data (Potential field data) to carry out modelling of the subsurface by taking into account the value of depth derived by Euler deconvolution. In each method three possible ways to parameterise the model (shape, susceptibility and depth to the top) are available. The way to re-duce the instability and decrease the non-uniqueness of the solution is to inte-grate geological and geophysical constraints into the forward modelling. The geological constraints (susceptibility) used for the study area were qualitatively determined by varying its values in the program. Geophysical constraining fo-cused on direct interpretation of the magnetic field by Euler deconvolution.

184 A. N. S. fEUMOE ET AL.: DElINEATION Of TECTONIC lINEAMENTS USING AEROMAGNETIC...
The mean terrain clearance was set at a height of 1 km, the flight height was 750 m and the transversal extent of the body fixed at 50 km corresponding to the lateral extension of the observed anomaly along profile. When the best fitting between the observed and calculated magnetic was made as good as possible, inversion was carried.
5. Results and discussion
5.1. Aeromagnetic lineaments via FVDfig. 4 shows besides the obvious long-wavelength anomalies linear, short
wave-length anomalies whose visibility is essentially enhanced by shaded relief image. A further enhancement of the short wave-length trends in the data set is achieved in the first vertical derivative of the reduce-to-the-equator, total mag-netic intensity grid as shown in fig. 6. A system of ENE–WSW trending negative anomalies of short wave-length which are rimmed by positive anomalies is clear-ly visible, extending from the Ntem unit border towards the ENE between Yo-kadouma series and lower Dja series. This correlate well with the existence of zone of faults. In the western part of the survey area, a number of mostly round-ish, negative anomalies (dark-blue) is shown. These anomalies result from the low susceptibility of the limestone structures.
The lineaments map (fig. 7) shows the long regional trends which control the subsurface structure beneath the studied area. In this study, ENE–WSW, WNW–ESE and E–W are the dominant trends affecting the study area. The relationships among these trends suggest that the area was subjected to more than a single tectonic event. The results of the previous geologic studies carried out in the south-eastern Cameroon revealed the morphological difference. The
Figure 6. first vertical derivative (fVD) of residual map for the study area.

GEOfIzIKA, VOl. 29, NO. 2, 2012, 175–192 185
analysis of the aeromagnetic lineaments confirms the morphological difference and the tectonical subdivision in two tectonic sectors: the northern part which is composed by the metamorphic rocks such as schists belongs to the Pan-African fold belt formations. The southern part which is composed by intrusion igneous rocks such as Archean rocks (granitic and granulitic) belongs to the Congo Craton.
The main fractures in the center of the map which extend from north-west-ern of Mbalam to north-eastern of Ngoïla region lie in the margin of the gra-nitic intrusion into both Ntem Complex basement formations and Pan-African formations on the geological sketch map and inferred to normal fault. Recently, using a multi-scale analysis on gravity anomaly data sets, Shandini et al. (2011) have put in evidence to the south-western Cameroon an ENE–WSW regional trend of structure. According to Shandini et al. (2011), these faults were hidden by plutonic formations and have a ENE–WSW trending. These structures took place during an active continental collision between Pan-African and Craton and potentially are assigned to Eburnean orogeny and correspond to the probable tectonic boundary between Pan-African and Precambrian. It appears that, the reseau of major lineaments identified in the area under study which extend from the south-west to north-east with a major trend WSW–ENE can also be con-nected to those identified by Shandini.
The minor lineaments put in evidence in the northern part of the structural map (Mbalmayo-Benbis series) which roughly ENE–WSW trending were already found using magneto-telluric method as schists-granites contacts in the base-ment (Manguelle et al., 1992). These structures took place during the Pan-Afri-can event.
Figure 7. Aeromagnetic lineaments map obtained for the study area.

186 A. N. S. fEUMOE ET AL.: DElINEATION Of TECTONIC lINEAMENTS USING AEROMAGNETIC...
By taking into account the geological setting of Congo Craton in the southern part of the study area characterized by the presence of Precambrian faults, the general abundance of lineaments observed in this part of the area could be re-lated to faulting associated with the put in place of deep-seated basement struc-tures related to the subduction of the plate Craton onto the Pan-African fold belt. The tectonic grain of the Precambrian rocks in southern part of the study area is characterized by the WNW–ESE and E–W roughly trending direction of the structures and correlate with the trends of aeromagnetic lineaments identified on the synthetic lineaments map. These faults were probably hidden by basic formations and covered by the Proterozoic Craton cover (lower Dja serie).
5.2. Pseudo-gravityThe pseudo-gravity anomaly, which is the vertical derivative of the pole-
reduced magnetic potential, was calculated. With this analysis (fig. 8) shows three different magnetic high character of the crust in the area. The north-western part is characterized by high prominent amplitude pseudo-gravity anomaly. This anomaly coincides in this region with the Mbalmayo-Benbis series formations. The south-western part of the map is also associated with strong anomalies. In this area, these correspond to the locations of known and inter-preted intrusive complexes (Ntem unit) and are in agreement with the nature of the crystalline basement in this area (So’o granites and banded plutonic rocks). An elongated regional pseudo-gravity high is outlined to the east of the area. This pseudo-gravity high coincides in south-eastern with the tillitic formations. The positive anomaly trend in this region extends far to the north from the ex-tension of the tillitic formations on the geological map and may indicate the extension of these in the region. The pseudo-gravity map does not show a clear
Figure 8. Pseudo-gravity map of total-field magnetic for the study area.

GEOfIzIKA, VOl. 29, NO. 2, 2012, 175–192 187
difference between the crustal properties of Pan-African and Craton because the Craton basement continues northward beneath the cover. The contribution of the pseudo-gravity analysis permits us to better constrain the geodynamic of the study area. The Mbalmayo-Benbis and Yokadouma series are associated to nu-merous highs and lows respectively. These were subjected regionally to two different phases of deformation associated to the Pan-African process. Within this pseudo-gravimetric configuration, the main regional trends of structures are observed striking ENE–WSW; WNW–ESE and NW–SE.
5.3. Euler deconvolutionThe Euler method (Thompson, 1982; Reid et al., 1990) has been applied to a
profile selected on the TMI-RTE map (Fig. 4) after subtracting the regional trend (fig. 9). We put the main focus of the Euler analysis on the constraining of the depth of perturbing body responsible of the north-eastern positive regional anom-alies. Indeed, the source of these causing masses is not yet clear. The most critical parameter in the Euler deconvolution is the structural index N see (Tab. 1) it is introduced as a parameter and solutions give the depth and the horizon-tal position of the source along the profile. In the case of this work, we have no information coming from other geophysical studies. Both Thompson (1982) and Reid et al. (1990) suggested that a correct structural index N gives the tightest clustering of Euler solutions around the geologic structure of interest. We as-signed several structural indices values.
For this profile, a window size equal to 17 was used and the Euler solutions were determined. A value of 1 gives the extension of fifteen nonlinear of Euler solutions corresponding to depth which range from 200 to 4 000 m (fig. 10). A value of 1.5 gives five linear clustering of Euler solutions corresponding to a
Figure 9. Magnetic profile over the RTE map (Fig. 4).

188 A. N. S. fEUMOE ET AL.: DElINEATION Of TECTONIC lINEAMENTS USING AEROMAGNETIC...
depth of 5 122 m, this depth can be interpreted as mean depth of body respon-sible for the observed positive regional magnetic anomalies in the north-eastern part of the area. As we can see no solution exists for structural indices 2 and 3. for a vertical intrusive body, the value of N should therefore be strictly included between 1 and 2. Thus structural index of 1.5 would better explain the anomaly generated by the regional structure along profile selected on the RTE map.
Table 1. Structural indices for magnetic sources (Thompson, 1982; Reid et al., 1990).
Sources Structural index
Contact 0
Vertical dyke and sill 1
Vertical cylinder and pipe 2
Sphere 3
Figure 10. Euler deconvolution of residual magnetic field along a profile after removal of the re-gional trend. Symbols „+” are solutions corresponding to the structural index N = 1 and symbols „×” are solutions corresponding to the structural index N = 1.5.

GEOfIzIKA, VOl. 29, NO. 2, 2012, 175–192 189
5.4. 2D modellingDue to non-uniqueness of potential field interpretation such as in the mag-
netic method used in this work, constraints have been introduced in a simplified geometry, limits to size or depth, range limits on susceptibility, location and extent of outcrops and other parameters seemed in the context of what is known or can be reasonably inferred about the geological environment. We put the main focus of the modelling on the deep structures. The 2D modelling and inversion results are particularly informative for the structure of the study area. The model obtained is shown in one vertical section (fig. 11).
The calculated model for profile (Fig. 11) shows a mushroom-like body prob-ably granitic rocks with roof located at a depth of 4 660 m with a high-enough contrast of magnetic susceptibility, 0.0105 (CGS unit).
This body is correlated to granitic intrusion in the upper crust which reach 5 km. Such bodies in the area may represent granitic magma intrusion along faults in the upper, brittle, part of the crust during the subduction of the plate Craton. The magma would have cooled down without reaching the surface. The
Figure 11. Magnetic modelling of the intrusion within the Pan-African formations.

190 A. N. S. fEUMOE ET AL.: DElINEATION Of TECTONIC lINEAMENTS USING AEROMAGNETIC...
distribution of positive anomalies correlates well with the zones of faults and the 2D modelling confirm the hypothesis that, the major faults observed in the cen-ter of the studied area were hidden by plutonic formations.
6. ConclusionThe main results obtained in this study bring new elements allowing im-
provement of our knowledge on the geological structures of the study area. Spa-tial analysis, helped detect morphological differences in the lineament patterns. The southern sector of the map shows a density of lineaments toward WNW–ESE trend. The northern and central sectors of the map shows a density of lineaments toward ENE–WSW. Accordingly, the terrain can be divided into two tectonic sectors. The comparison of the results with the geoscientific data (structural, lithological) confirms the morphological difference and the tectonical subdivision into two tectonic sectors corresponding to the Congo Craton in the south and Pan-African in the north and also helped identify the tectonic boundary separat-ing them at depth assigned to the major normal faults in the center. This geo-physical study suggests that the structures of crust modelled are situated on the flank of the major faults in the basement: it is a product of an active continental collision. This collision has provoked considerable overthrusting of the Pan-Af-rican formations onto the Congo Craton formations.
Acknowledgements – The first two authors are grateful to GETECH Group plc (Leeds, UK) for providing aeromagnetic data used in this study and one anonymous reviewer for the kind help in making the manuscript clearer, more correct and mature for publication.
ReferencesAbdelsalam, M. G., liégeois, J. P. and Stern, R. J. (2002): The Saharan Metacraton, J. Afr. Earth Sci.,
34, 119–136, DOI: 10.1016/S0899-5362(02)00013-1.Baranov, V. (1957): A new method for interpretation of aeromagnetic maps: Pseudo-gravimetric
anomalies, Geophysics, 22, 359–383.Blakely, R. J. (1995): Potential theory in gravity and magnetic applications. Cambridge University
Press, london, 511 pp.Castaing, C., feybesse, J. l., Thieblemont, D., Triboulet, C. and Chèvremont, P. (1994): Paleogeo-
graphical reconstructions of the Pan-African/Brasiliano orogen: Closure of an oceanic domain or intracontinental convergence between major blocks?, Precambrian Res., 67, 327–344, DOI: 10.1016/0301-9268(94)90095-7.
Clark, D. A. (1997): Magnetic petrophysics and magnetic petrology: aids to geological interpretation of magnetic surveys, AGSO J. Aust. Geol. Geophys., 17(2), 83–103.
Caron, V., Ekomane, E., Mahieux, G., Moussango, P. and Ndjeng, E. (2010): The Mintom formation (new): Sedimentology and geochemistry of neoproterozoic, paralic succession in south-east Cam-eroon, J. Afr. Earth Sci., 57, 367–385.
Dobrin, M. B. and Savit, C. H. (1988): Introduction to geophysical prospecting. McGraw-Hill, New York, 867 pp.
feybesse, J. l., Johan, V.,.Maurizot, P. and Abessolo, A. (1987): Evolution tectonométamorphique libérienne et eburnéenne de la partie NW du craton zairois (SW Cameroun), in Current Research in African earth sciences, edited by Matheis G. and Schandelmeier H., Balkema, Rotterdam, 9–13.
GEOfIzIKA, VOl. 29, NO. 2, 2012, 175–192 191
Gibson, R. I. and Millegan, P. S. (1998): Geology applications of gravity and magnetic: Case histories. Society of Exploration Geophysicist, 170. 162 pp, DOI: 10.1190/1.9781560801832.
Hassen R. O. and Pawlowski R. S. (1989): Reduction to pole at low latitudes by Weiner filtering. Geophysics, 54, 1607–1613.
Manguelle Dicoum, E., Bokosah, A. S. and Kwende Mbanwi, T. E. (1992): Geophysical evidence for a major Precambrian schist-granite boundary in southern Cameroon, Tectonophysics, 205, 437– 446.
Maurizot, P., Abessolo, A., feybesse, J., Johan, l. and lecomte, P. (1986): Etude et prospection minière du Sud-Ouest du Cameroun. Synthèse des travaux de 1978 à 1985, Rapport BRGM, Orleans, 85, CMR 066, 274 pp.
Mbom-Abane, S. (1997): Investigations géophysiques en bordure du craton du Congo (régiond’Abong Mbang / Akonolinga, Cameroun) et implications structurales, Ph. D. Thesis, Université de Yaoun-dé I, Cameroun, 180 pp.
Mendonça, C. A. and Silva, B. C. (1993): A stable truncated series approximation of the reduction-to- pole operator, Geophysics, 58, 1084–1090.
Mørk, M. B. E., Mc Enroe, S. A. and Olesen, O. (2002): Magnetic susceptibility of Mesozoic and Ceno-zoic sediments off Mid Norway and the role of siderite: Implications for interpretation of high-resolution aeromagnetic anomalies, Mar. Petrol. Geol., 19, 1115–1126.
Mvondo, H., Den-Brok, S. W. J. and Mvondo-Ondoa, J. (2003): Evidence for symmetric extension and ex humation of the Yaoundé nappe (Pan-African fold Belt, Cameroon), J. Afr. Earth Sci., 35, 215–231.
Nédélec, A., Macaudière, J., Nzenti, J. and Barbey, P. (1986): Évolution structurale et métamorphique des scihtes de Mbalmayo (Cameroun). Implications pour la structure de la zone mo-bile panafric-aine d’Afrique centrale au contact du craton du Congo, C. R. Acad. Sci. Paris, 303, 75–80.
Nzenti, J. P., Barbey, P., Jegouzo, P. and Moreau, C. (1984): Un nouvel exemple de ceinture granuli-tique dans une chaîne protérozoïque de collision: les migmatites de Yaoundé au Cameroun, Comptes Rendu de l’Académie des Sciences de Paris, 299, 1197–1199.
Nzenti, J. P., Barbey, P., Macaudière, J. and Soba, D. (1988): Origin and evolution of the late Precam-brian high, grade Yaoundé gneisses Cameroon, Precambrian Res., 38, 91–109.
Rajagopalan, S. (2003): Analytic signal vs. reduction to pole: Solutions for low magnetic latitudes, Exploration Geophysics, 34, 257–262, DOI: 10.1071/EG0325.
Reid, A. B., Allsop, J. M., Granser, H., Millett, A. J. and Somerton, I. W. (1990): Magnetic interpreta-tion in three dimensions using Euler deconvolution, Geophysics, 55, 80–90.
Shandini, N. Y., Tadjou, J. M., Tabod, C. T. and fairhead, J. D. (2010): Gravity data interpretation in the northern edge of the Congo Craton, South-Cameroon, Anuário do Instituto de Geociências, 33(1), 73–82.
Shandini, N. Y., Tadjou, J. M. and Basseka, C. A. (2011): Delineating deep basement faults in South Cameroon area, World Appl. Sci. J., 14, 611–615.
Silva, J. B. C. (1986): Reduction to the pole as an inverse problem and its application to low-latitude anomalies, Geophysics, 51, 369–382, DOI: 10.1190/1.1442096.
Tadjou, J. M., Manguelle-Dicoum, E., Tabod, C. T., Nouayou, R., Kamguia, J., Njandjock, N. P. and Ndougsa, M. T. (2004): Gravity modelling along the northern margin of the Congo Craton, south-Cameroon, J. Cameroon Acad. Sci., 4, 51–60.
Tadjou, J. M., Nouayou, R., Kamguia, J., Kande, H. l. and Manguelle-Dicoum, E. (2009): Gravity analysis of the boundary between the Congo craton and the Pan-African belt of Cameroon, Aust. J. Earth Sci., 102, 71–79.
Tchameni, R., Mezger, K., Nsifa, E. and Pouclet, A. (2000): Neoarchaean evolution in the Congo Cra-ton: Evidence from K-rich granitoids of the Ntem Complex, Southern Cameroon, J. Afr. Earth Sci., 30, 133–147.
Tchameni, R. (2001): Crustal origin of Early Proterozoic syenites in the Congo Craton (Ntem Complex), South Cameroon, Lithos, 57, 23-42.
Telford, W. M., Geldart, l. P., Sherriff, R. E. and Keys, D. A. (1990): Applied geophysics. Cambridge Univ. Press, Cambridge, 860 pp.

192 A. N. S. fEUMOE ET AL.: DElINEATION Of TECTONIC lINEAMENTS USING AEROMAGNETIC...
Thompson, D. T. (1982): EUlDPH: A new technique for making computer-assisted depth estimates from Magnetic data, Geophysics, 47, 31–37.
Toteu, S. f., fouateu, R. Y., Penaye, J., Tchakounte, J., Mouangue, A. C. S., Van Schmuss, W. R., Deloule, E. and Stendal, H. (2006): U, Pb dating of plutonic rocks involved in the nappe tectonics in southern Cameroon: Consequence for the Pan-African orogenic evolution of the central African fold belt, J. Afr. Earth Sci., 44, 479–493.
Vanhoutte, M. (1989): Bilans de l’étude géologique et l’évaluation des calcaires de Mintom. Projet de mise en valeur d’indices miniers sélectionnés. United Nations Development Program, Unpublished Report, 92, 64 pp.
Vanhoutte, M. and Salley, P. (1986): Reconnaissance des calcaires de Mintom. Projet de recherches 1045 minières, sud-est Cameroun. United Nations Development Program, Unpublished Report, 91, 59 pp.
Vasanthi, A., Sharma K. K. and K. Mallick K. (2006): On new standards for reducing gravity data: The North American gravity database, Geophysics, 71, 31–32.
SAŽETAK
Identifikacija tektonskih lineamenata korištenjem aeromagnetskih podataka za područje jugoistočnog Kameruna
Alain Narcisse S. Feumoe, Theophile Ndougsa-Mbarga, Eliezer Manguelle-Dicoum i James Derek Fairhead
Pomoću interpretacije aeromagnetskih podataka procijenjene su strukture ispod površine tla u dijelu Kongoanskog kratona u jugoistočnom Kamerunu, između zemljopis-nih širina 2° i 3° N i dužina 13° i 15° E. Magnetski premjer korišten je za prepoznavanje magnetskih lineamenata duž izabranog profila na karti ukupne jakosti magnetskog pol-ja reduciranog na ekvator (TMI-RTE), za analizu njihova odnosa prema tektonskoj građi i za procjenu dubine izvora perturbacija, vjerojatno granitnih intruzija. Korišteno je iz-ravno modeliranje te inverzija ograničena površinskom geologijom i rezultatima dobive-nim metodom Eulerove dekonvolucije. Određivanje iznosa maksimuma prve vertikalne derivacije (FVD) rezidualnog polja reduciranog na ekvator omogućilo je izradu karte koja pokazuje različite aeromagnetske oblike interpretirane kao sustav rasjeda u razmatranom području. Pobliže, gledajući strukturne karte nalazimo da su ove strukture povezane s dugoperiodičnim anomalijama, sugerirajući da one moraju biti povezane sa strukturnim deformacijama na velikoj skali. Naši rezultati potvrđuju morfološke razlike i tektonsku potpodjelu u dva tektonska sektora koji se podudaraju s Kongoanskim kratonom na jugu i Pan-afričkim strukturama na sjeveru, te pomažu u identificiranju tektonskih granica koji ih razdvajaju u dubini.
Ključne riječi: magnetska anomalija, redukcija na ekvator, prva vertikalna derivacija, pseudo-gravimetrija, Eulerova dekonvolucija
Corresponding authors’ addresses: Alain Narcisse S. feumoe, University of Yaoundé I, faculty of Science, Depart-ment of Physics, PO Box 6052 Yaoundé, Cameroon, e-mail: [email protected] Ndougsa-Mbarga, University of Yaoundé 1, Advanced Teacher’s Training College, Department of Physics, P.O. Box 47, Yaoundé, Cameroon, e-mail: [email protected]