delft university of technology the use of rfid technology
TRANSCRIPT

Delft University of Technology
The use of RFID technology to measure the compositions of diethyl ether-oil-brinemixtures in enhanced imbibition experiments
Hassan, Anas; Bruining, Hans; Musa, Tagwa; Chahardowli, Mohammad
DOI10.1016/j.petrol.2017.06.051Publication date2017Document VersionAccepted author manuscriptPublished inJournal of Petroleum Science and Engineering
Citation (APA)Hassan, A., Bruining, H., Musa, T., & Chahardowli, M. (2017). The use of RFID technology to measure thecompositions of diethyl ether-oil-brine mixtures in enhanced imbibition experiments. Journal of PetroleumScience and Engineering, 156, 769-779. https://doi.org/10.1016/j.petrol.2017.06.051
Important noteTo cite this publication, please use the final published version (if applicable).Please check the document version above.
CopyrightOther than for strictly personal use, it is not permitted to download, forward or distribute the text or part of it, without the consentof the author(s) and/or copyright holder(s), unless the work is under an open content license such as Creative Commons.
Takedown policyPlease contact us and provide details if you believe this document breaches copyrights.We will remove access to the work immediately and investigate your claim.
This work is downloaded from Delft University of Technology.For technical reasons the number of authors shown on this cover page is limited to a maximum of 10.

The use of RFID technology to measure the
compositions of diethyl ether-oil-brine mixtures in
enhanced imbibition experiments
Anas Hassan ∗, Hans Bruining †, Tagwa Musa ‡, Mohammad Chahardowli §
June 10, 2017
1 Abstract
Recent developments in Radio Frequency (800MHz-1000MHz) Identification(RFID) devices suggest that it is possible to use them for wireless laboratorymeasurements of the dielectric coefficients (or compositions) of fluid mixtureswith possible spin-off for their use in the petroleum engineering practice. Theadvantage of RFID devices is their small size (0.095× 0.008× 0.001m3), the de-velopments to make them increasingly smaller and that they do not require theuse of leak prone connecting cables. RFID measures the response of a samplevolume of interest irradiated by a radio frequency electromagnetic (EM) wave.The response can be expressed in terms of various response functions, e.g. twoscattering functions (S11 and S21) or the minimum irradiated power (Pmin).The response functions can be measured using a state-of-the-art RFID device(CISC RFID Xplorer-200), which operates in the range between 800-1000 MHz.The effect of the dielectric coefficient on the RFID response was tested by plac-ing the RFID tag in different media with various dielectric coefficients ε rangingfrom 1 to 80. The overall purpose is to develop a work-flow to relate the responsefunctions obtained with RFID technology to the dielectric coefficient and thusthe composition of fluid mixtures in which an RFID tag can be immersed. Anapplication is to measure fluid compositions during a spontaneous imbibitionexperiment in an Amott-cell. As an intermediate step we measure the composi-tion dependence of the partial molar volume of diethyl ether (DEE) in brine andthe partial molar volume of DEE in oil by using an Anton Paar density meter.The relation between the dielectric coefficients and the volume fraction can beobtained with the Bottcher mixing rule. The DEE volume fraction range ofinterest is 0-8 % volume fraction in the aqueous solution whereas DEE volume
∗TU Delft, Civil Engineering and Geosciences, and Sudan University of Scienceand Technology SUST, College of Petroleum Engineering and Technology. E-mail:[email protected]†TU Delft, Civil Engineering and Geosciences, Stevinweg 1, 2628 CE Delft, The Nether-
lands. E-mail: [email protected]‡SUST, Sudan University of Science and Technology, College of Petroleum Engineering
and Technology, Khartoum, Sudan. E-mail: [email protected]§Sahand University of Technology, Petroleum Engineering, Sahand new town, Tabriz, Iran.
E-mail: [email protected]
1
© 2017 Manuscript version made available under CC-BY-NC-ND 4.0 license https://creativecommons.org/licenses/by-nc-nd/4.0/ Postprint of Journal of Petroleum Science and EngineeringVolume 156, July 2017, Pages 769-779Link to formal publication (Elsevier): https://doi.org/10.1016/j.petrol.2017.06.051
fraction range of interest is 0-100 % volume fraction in oleic solutions. For betterunderstanding of the measurement results, we used COMSOLTM simulations,which show that the response functions depend on the dielectric coefficient in avessel of appropriate dimensions filled with a fluid of choice. The measurementsshow that the minimum power at the tag position Pmin is the preferred responsefunction and that the sensitivity of Pmin was highest at 915 and 868 MHz foraqueous (8.547×10⁻⁶) and oleic (1.905×10⁻⁴) solutions respectively. The mea-surement error is of the same order of magnitude as the errors mentioned above(Hon, 1989) ensuing from evaporation of DEE during the preparation of thecalibration fluids or the approximate nature of the Bottcher mixing rule. Weconclude that it is possible to use RFID technology for contact-less measure-ments of the compositions of fluids in imbibition experiments.
Keywords: Amott-cell; Dielectric coefficient; Laboratory measurement;In-situ fluid composition; Radio Frequency Identification (RFID); Solvent en-hanced oil recovery.
2

2 Introduction
Figure 1: Amott-cell Experi-ment: the Amott-cell containsan oil saturated core, whichrepresents the matrix (porousmedium) outside the fractures,and the fluid surrounding thecore which represents the frac-ture.
Naturally fractured reservoirs contain around20% of the world oil reserves ((Salimi, Bru-ining, et al., 2010a),(Salimi, Bruining, et al.,2010b),(Firoozabadi et al., 2000),(Saidi et al.,1983)). Oil recovery from fractured reser-voirs is generally low due to preferential flowin the fractures thus bypassing the oil inthe matrix layers ((Hirasaki, Zhang, et al.,2004),(Kleppe, Morse, et al., 1974),(Warren,Root, et al., 1963),(Mattax, Kyte, et al.,1962),(Holm, Csaszar, et al., 1962)), un-less water imbibes in the matrix thus ex-pelling oil to the fracture ((Salimi et al.,2010a),(Salimi et al., 2010b)). This mecha-nism only occurs when the matrix is water wetor made water wet ((Al-Hadhrami, Blunt, etal., 2000),(Motealleh, de Zwart, & Bruining,2005)). These transfer mechanisms can beconveniently studied in the laboratory by us-ing an Amott-cell. Generally, an Amott-cell isa powerful tool to study processes in fracturedreservoirs in the laboratory. The Amott-cellconsists of a glass jar with a graded cylin-der on the top; the jar contains an oil satu-rated core, representing the porous medium(matrix) outside the fractures, whereas thefluid surrounding the core represents the frac-ture (see Figure 1). Experiments in Amott-cells can be used to elucidate mechanisms that can enhance or deteriorate thefeasibility of using solvents for improved oil recovery in fractured reservoirs((Chahardowli et al., 2016),(Chahardowli, Zholdybayeva, Farajzadeh, Bruining,et al., 2013),(Kahrobaei, Farajzadeh, Suicmez, & Bruining, 2012),(Mattax etal., 1962),(Holm et al., 1962)). The most important experimental data com-prise in-situ determination of the composition of the fluid mixtures.
There is recent interest to improve the oil recovery in fractured reservoirsusing solvents that are mutually soluble in demineralized water or brine solu-tions and oil ((Parsons et al., 2016),(Chahardowli, 2016),(Chahardowli et al.,2016),(Chernetsky et al., 2015)). Solvent-based oil recovery, which we abbrevi-ate as SEOR, is a process whereby a solvent is injected into an oil reservoir inorder to increase the macroscopic and microscopic displacement efficiency, dueto a number of mechanisms such as oil swelling, oil density reduction, oil viscos-ity reduction and wettability alteration ((Chernetsky et al., 2015),(Chahardowliet al., 2013)(Zhou, Morrow, Ma, et al., 2000),(Standal, Haavik, Blokhus, &Skauge, 1999),(Morrow et al., 1990)). However, due to the high costs of sol-vents, SEOR only becomes economically viable when the oil price is high andthe amount of solvent to be used can be kept low or retrieved. Using minimalamounts of solvent is not only economically attractive but also enhances theeffectiveness of the production process ( (Govind, Das, Srinivasan, Wheeler, et
3

al., 2008),(Gupta, Gittins, et al., 2007)). Moreover, minimizing the quantityof injected solvent would reduce the environmental impact of SEOR. It wouldtherefore be useful to accurately monitor solvent concentrations in real-timefrom within the reservoir. This is where R(adio) F(requency) ID(entification)or RFID technology could potentially play an interesting role ((Hassan, 2016),(Laheurte, Ripoll, Paret, & Loussert, 2014),(Liu, Bolic, Nayak, & Stojmenovic,2008),(Zhang & Wang, 2006)).
The RFID system comprises of a reader that contains both a transmittingantenna, a receiving antenna and a passive tag, which can modulate the sig-nal before transmitting it back to the reader receiver (Want, 2006) (Dobkin,2012). We use a state of the art RFID set-up (RFID CISC Xplorer200), tomeasure the response functions as a function of frequency (800 MHz- 1 GHz)and dielectric coefficient, in which the tag is immersed. RFID has attractedconsiderable interest and is widely used in a number of applications, includingsupply chain management, public transportation, asset tracking, access control,health care, food industry etc. ((Laheurte et al., 2014),(Dobkin, 2012),(Want,2006),(Dobkin & Wandinger, 2005),(Cho, Song, Kim, Kim, & Yoo, 2005)).In recent years, the combination of RFID technology with sensory systemshas extended its applications to measure a wide range of environmental pa-rameters including temperature ((Law, Bermak, & Luong, 2010),(Vaz et al.,2010),(Shenghua & Nanjian, 2007)), pressure ((DeHennis & Wise, 2002),(Mori,Suemasu, Noguchi, & Sato, 2004),(Beriain, Rebollo, Fernandez, Sevillano, &Berenguer, 2012),(Opasjumruskit et al., 2006)), humidity ((Amin, Bhuiyan,Karmakar, & Winther-Jensen, 2014),(Virtanen, Ukkonen, Bjorninen, Elsher-beni, & Sydanheimo, 2011),(Virtanen, Ukkonen, Bjorninen, & Sydanheimo,2010),(Jia, Heiß, Fu, & Gay, 2008)) and chemical composition ((Fiddes & Yan,2013),(Potyrailo et al., 2012)).
RFID tags have benefited from innovative research. Novak in his thesis(Novak, 2009) describes the use of the RFID tag as a chemical sensor for tracesubstances in the liquid phase. Ong et al. (Ong, Grimes, Robbins, & Singh,2001) show that RFID is capable of monitoring the complex permittivity, i.e. thereal and imaginary part of the dielectric coefficient of the medium surroundingthe tag. Grimes at al. (Grimes et al., 2002) give an overview of sensors based onremote resonance frequency detection that allow the measurement of a variety ofphysical parameters. Only very recently the possibility of using RFID for deter-mining dielectric coefficients, has been worked out by Humberto Lobato-Moraleset al. ((Lobato-Morales, Corona-Chavez, & Olvera-Cervantes, 2013),(Lobato-Morales et al., 2011)), who use a Substrate-Integrated-Waveguide (SIW) reso-nant cavity and a tunnel sensor, which allows the determination of the complexpermittivity. The dielectric coefficient also depends on the frequency; measure-ments at various frequencies therefore expand the capability using RFID’s formeasuring quantities that depend on more than two parameters ((Warnagiris,2000)). Karappuswami et al. (Karuppuswami, Kaur, Ghazali, & Chahal, 2016)is recently published and describe different sensor designs for measurement ofdielectric properties via the response functions under far field conditions. Evenif the focus of their paper is largely on optimal sensor design but they alsoreport possible applications to fluid compositions, i.e. isopropyl alcohol-waterand methanol-water mixtures. Karappuswami’s research, which has been car-ried out in parallel with our research shows overlap with the results describedin this paper. However, in addition to (Karuppuswami et al., 2016), we explore
4
the possibility of using RFID technology and its optimization in a laboratoryset-up (Amott-cell) (see Figure 2). As a consequence we developed a work-flowincluding the procedure to relate the composition in terms of volume fractionto the RFID response function with an emphasis on the minimum power at thetag position (Pmin), which is defined as the minimum power that the passivetag requires in order to be activated.
The work-flow can serve as a template for implementing RFID technologyin laboratory experiments, and therefore, e.g. be used to enhance the interpre-tation capabilities in Amott-cells. This can be accomplished by using the RFIDtag to measure the dielectric coefficients of the medium surrounding the tag.This requires the calibration curves of the response functions versus the volumefraction both in the aqueous brine phase and oleic phase; the DEE volume fac-tion can be conveniently expressed in terms of the partial molar volumes andthe mole fractions of the constituents; the use of partial molar volumes resultsin more linear relationships. Conversely the volume fractions can be used toestimate the dielectric coefficients of the mixtures as a function of the compo-sition using the Bottcher mixing rule. Thus the relation between the responsefunctions and the dielectric coefficients can be determined. However, due to thelow boiling point of Diethyl Ether (DEE), a special experimental procedure isnecessary, which is therefore described in a separate section devoted to experi-mental aspects to obtain the calibration curves. For the optimal development ofthe workflow it is helpful to use COMSOL to simulate the behavior of the RFIDsystem in terms of the RFID response functions to facilitate the interpretationof the measurements. Yeoman and Neill (Yeoman et al., 2009) have developedand implemented a prototype numerical model in COMSOL to obtain the elec-tric field of an RFID system that contains a meandering dipole tag antenna. Wemodified the Yeoman-Neill model to implement the tag geometry used by us,and used two reader antennae, instead of one. The computed electric field al-lows to obtain quantities that can be measured by the reader, e.g. the scatteringfunction as a function of frequency. The COMSOL model of Yeoman and Neilldoes not include modulation of the tag back-scattered signal, so that only thetotal electric field can be obtained. The model shows that the response mainlydepends on the embedding extending several centimeters around the tag (up to0.03 m). Beyond 0.03 m the response function becomes independent of the sizeof the embedding.
The organization of the paper is as follows: In section 4 we determine themaximum full solubility of DEE in demineralized water (or brine with zerosalt concentration), in brine (0.05M NaCl and 0.5M NaCl) and hexadecane.We establish the calibration curve by using the Anton Paar density meter, us-ing hexadecane-DEE mixtures, brine-DEE mixtures and water-DEE mixtures.From this the partition coefficient as function of the composition is determined.The density meter measurements can be used to determine the partial molarvolumes of the constituents as a function of the DEE mole fraction. We use theIDAX-300 Insulation diagnostic system and the Wayne Kerr Precision-6640Ato determine the dielectric coefficient of pure hexadecane and DEE and the di-electric coefficient of demineralized water and the brine respectively. Moreover,we apply the Bottcher mixing rule to determine the dielectric coefficient of thebrine-DEE and hexadecane-DEE mixtures, using the dielectric coefficients ofthe pure components and the partial molar volumes. Section 5 has two subsec-tions. In subsection 5.1 we describe the COMSOL simulation. We define the
5

RFID response functions and give the model equation description. Subsection5.2 shows the result of the numerical calculations. Section 6 gives an overview ofthe RFID experiments. Subsection 6.1 describes the RFID set-up. Subsection6.2 and 6.3 discuss the experimental measurements and results respectively. Weend with some conclusions in section 7.
3 Motivation
In order to illustrate why measurements with RFID technology are useful forsolvent enhanced imbibition experiments, we consider the following mechanism.When a core is immersed in an Amott cell filled with brine saturated with DEE,imbibition of the aqueous phase into the core occurs while displacing oil to theaqueous phase (see right part of Figure 2). It can be expected that the equi-librium concentration of DEE in the oleic phase is much larger than the DEEconcentration in the aqueous phase. As a result, it is inferred that the aqueouslayer around the core is quickly scavenged from DEE by oil droplets, which arecollected in the graded cylinder of the Amott-cell. With an RFID tag we wouldbe able to validate this mechanism by monitoring the DEE concentration in theaqueous phase surrounding the core and the DEE concentration in the gradedcylinder of the Amott cell. If the proposed mechanism would be correct we ex-pect that the DEE concentration in the fluid (oleic phase) collected in the lowerpart of the graded cylinder quickly reduces to zero. Consequently it is assertedthat an RFID tag can be used in an Amott-cell to study the effect of partition-ing of DEE concentration in the aqueous and the oleic phase on the efficiencyof solvent enhanced imbibition experiments ((Hassan, 2016),(Chahardowli etal., 2016),(Chahardowli et al., 2013)). RFID tags become increasingly smaller,which gives additional possibilities (see left part of Figure.2)
Figure 2: Right part of figure (6) shows counter-current imbibition: the spacesurrounding the oil saturated core, which is filled with DEE saturated brine(colored red) represents the fracture . The DEE saturated brine penetrates intothe core by capillary imbibition from the sides and from the bottom by gravitydisplacement of the oil (green). In counter-current imbibition flow, the oil andDEE saturated brine flow in opposite directions. Left part of figure (6) showshow RFID tags become increasingly smaller, which makes RFID technologymore useful for laboratory and field fluid composition measurements
6
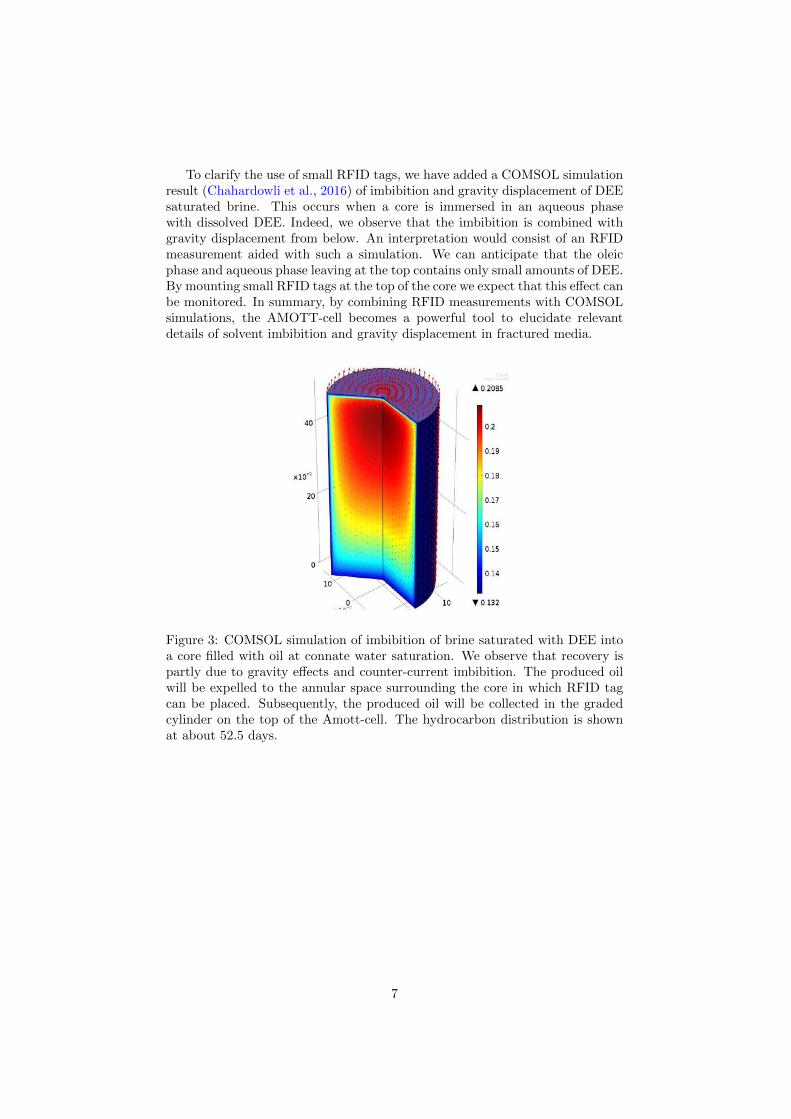
To clarify the use of small RFID tags, we have added a COMSOL simulationresult (Chahardowli et al., 2016) of imbibition and gravity displacement of DEEsaturated brine. This occurs when a core is immersed in an aqueous phasewith dissolved DEE. Indeed, we observe that the imbibition is combined withgravity displacement from below. An interpretation would consist of an RFIDmeasurement aided with such a simulation. We can anticipate that the oleicphase and aqueous phase leaving at the top contains only small amounts of DEE.By mounting small RFID tags at the top of the core we expect that this effect canbe monitored. In summary, by combining RFID measurements with COMSOLsimulations, the AMOTT-cell becomes a powerful tool to elucidate relevantdetails of solvent imbibition and gravity displacement in fractured media.
Figure 3: COMSOL simulation of imbibition of brine saturated with DEE intoa core filled with oil at connate water saturation. We observe that recovery ispartly due to gravity effects and counter-current imbibition. The produced oilwill be expelled to the annular space surrounding the core in which RFID tagcan be placed. Subsequently, the produced oil will be collected in the gradedcylinder on the top of the Amott-cell. The hydrocarbon distribution is shownat about 52.5 days.
7
4 Phase Behavior
This section describes the behavior of phases in a system of diethyl ether-brine-oil in terms of the partition coefficient of diethyl ether (DEE) between the oleicand the aqueous phase. Moreover, we determine the dielectric coefficients of themixtures in terms of the pure dielectric coefficients of the pure substances andthe volume fraction of DEE ((Hassan, 2016),(Chahardowli, 2016)).
4.1 Measurements of partial molar volume
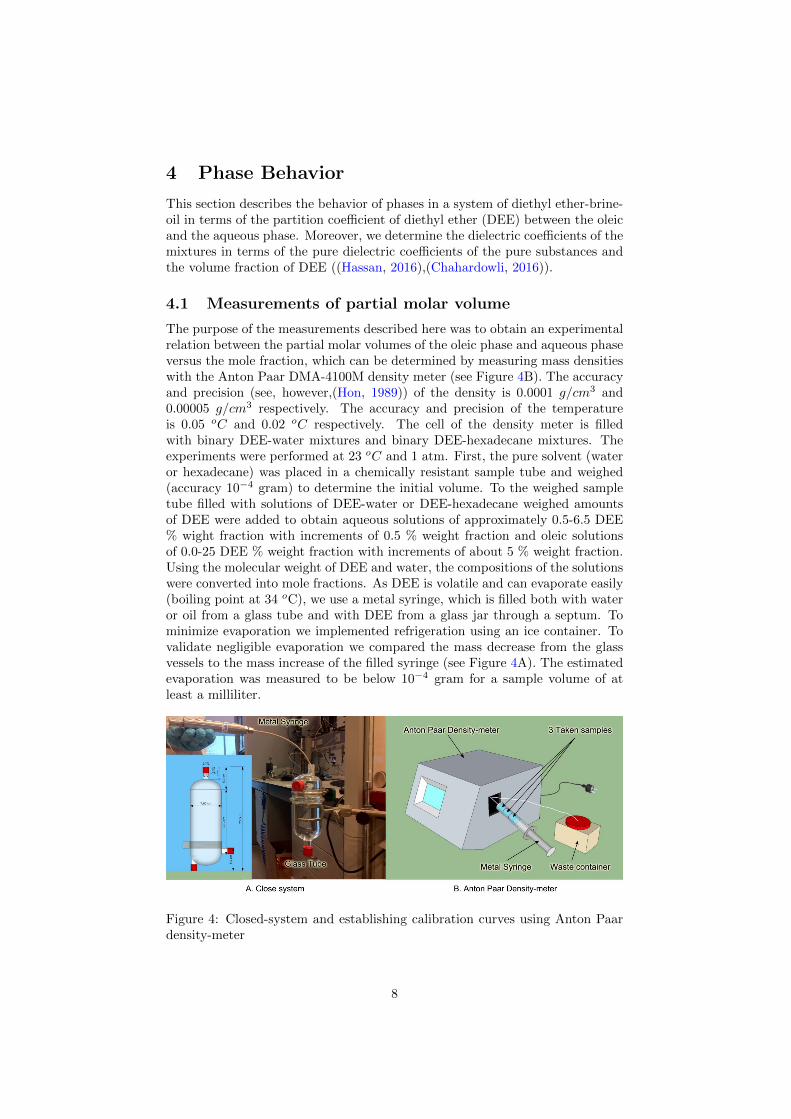
The purpose of the measurements described here was to obtain an experimentalrelation between the partial molar volumes of the oleic phase and aqueous phaseversus the mole fraction, which can be determined by measuring mass densitieswith the Anton Paar DMA-4100M density meter (see Figure 4B). The accuracyand precision (see, however,(Hon, 1989)) of the density is 0.0001 g/cm3 and0.00005 g/cm3 respectively. The accuracy and precision of the temperatureis 0.05 oC and 0.02 oC respectively. The cell of the density meter is filledwith binary DEE-water mixtures and binary DEE-hexadecane mixtures. Theexperiments were performed at 23 oC and 1 atm. First, the pure solvent (wateror hexadecane) was placed in a chemically resistant sample tube and weighed(accuracy 10−4 gram) to determine the initial volume. To the weighed sampletube filled with solutions of DEE-water or DEE-hexadecane weighed amountsof DEE were added to obtain aqueous solutions of approximately 0.5-6.5 DEE% wight fraction with increments of 0.5 % weight fraction and oleic solutionsof 0.0-25 DEE % weight fraction with increments of about 5 % weight fraction.Using the molecular weight of DEE and water, the compositions of the solutionswere converted into mole fractions. As DEE is volatile and can evaporate easily(boiling point at 34 oC), we use a metal syringe, which is filled both with wateror oil from a glass tube and with DEE from a glass jar through a septum. Tominimize evaporation we implemented refrigeration using an ice container. Tovalidate negligible evaporation we compared the mass decrease from the glassvessels to the mass increase of the filled syringe (see Figure 4A). The estimatedevaporation was measured to be below 10−4 gram for a sample volume of atleast a milliliter.
Figure 4: Closed-system and establishing calibration curves using Anton Paardensity-meter
8
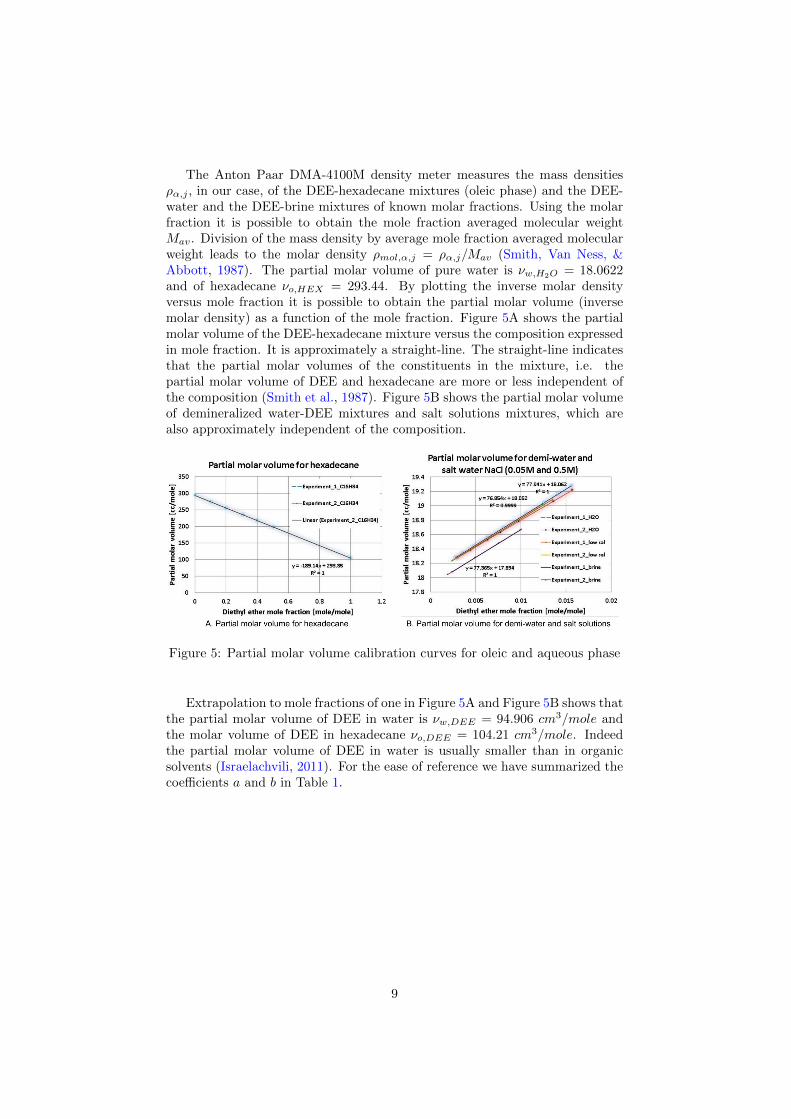
The Anton Paar DMA-4100M density meter measures the mass densitiesρα,j , in our case, of the DEE-hexadecane mixtures (oleic phase) and the DEE-water and the DEE-brine mixtures of known molar fractions. Using the molarfraction it is possible to obtain the mole fraction averaged molecular weightMav. Division of the mass density by average mole fraction averaged molecularweight leads to the molar density ρmol,α,j = ρα,j/Mav (Smith, Van Ness, &Abbott, 1987). The partial molar volume of pure water is νw,H2O = 18.0622and of hexadecane νo,HEX = 293.44. By plotting the inverse molar densityversus mole fraction it is possible to obtain the partial molar volume (inversemolar density) as a function of the mole fraction. Figure 5A shows the partialmolar volume of the DEE-hexadecane mixture versus the composition expressedin mole fraction. It is approximately a straight-line. The straight-line indicatesthat the partial molar volumes of the constituents in the mixture, i.e. thepartial molar volume of DEE and hexadecane are more or less independent ofthe composition (Smith et al., 1987). Figure 5B shows the partial molar volumeof demineralized water-DEE mixtures and salt solutions mixtures, which arealso approximately independent of the composition.
Figure 5: Partial molar volume calibration curves for oleic and aqueous phase
Extrapolation to mole fractions of one in Figure 5A and Figure 5B shows thatthe partial molar volume of DEE in water is νw,DEE = 94.906 cm3/mole andthe molar volume of DEE in hexadecane νo,DEE = 104.21 cm3/mole. Indeedthe partial molar volume of DEE in water is usually smaller than in organicsolvents (Israelachvili, 2011). For the ease of reference we have summarized thecoefficients a and b in Table 1.
9

Table 1: The coefficients of the linear regression between the partial molarvolume and the mole fraction of DEE (v = ax+ b)
Component Coefficient (a) Coefficient (b)
C16H34-exp1 -189.08 293.29C16H34-exp2 -189.14 293.35H2O-exp1 77.914 18.062H2O-exp2 72.064 18.057NaCl (0.05M)-exp1 77.687 18.052NaCl (0.05M)-exp2 76.854 18.052NaCl (0.5M)-exp1 76.988 17.899NaCl (0.5M)-exp2 77.365 17.594
After obtaining the experimental relation between the partial molar volumesof the oleic phase and aqueous phase versus the mole fraction, we determine thepartition coefficient of DEE between the oleic and aqueous phase by calculatingthe solvent concentration in the oleic and aqueous phase from previously estab-lished calibration curves (Hassan, 2016). The partition coefficient is the ratio ofthe DEE concentration (or DEE volume fraction) in the oleic phase divided bythe DEE concentration (or DEE volume fraction) in the aqueous phase. Figure6 shows the partitions coefficients of DEE between the Oleic and aqueous (dem-ineralized water-DEE mixtures and salt solutions mixtures) phase as functionof the composition.
Figure 6: Partition coefficients as function ofthe composition.
Furthermore, we use thevolume fraction vα,i of thecomponents i in phase α andthe pure component dielec-tric coefficients εi to calcu-late the dielectric coefficientof mixtures εm by applyingthe Bottcher mixing rule
ε1 − εmε1 + 2εm
vα,1+ε2 − εmε2 + 2εm
vα,2 = 0,
(1)where the volume fraction ofcomponent j in phase α, i.e.vα,j is given by
vα,j =xjνα,j
xjνα,j + (1− xj)να,k 6=j,
(2)and where xj is the mole fraction of component j. As pure components weselected demineralized water (brine with zero salt concentration) (εw = 79.08),hexadecane (εh = 2.05) and DEE (εD = 4.24) at 23 ± 0.02 oC. We measurethe dielectric coefficients of the pure substances using the IDAX-300 Insulationdiagnostic system and the Wayne Kerr Precision-6640A. The thus obtainedexperimental values can be compared with tabulated values in the literature.For water (εw = 79.19) , for hexadecane (εh = 2.049), and for DEE (εD = 4.43).(Wille, Buggert, Mokrushina, Arlt, & Smirnova, 2010)(Predel, 2006)(Wohlfarth,
10

2008)(Wyman Jr, 1933) Figure 7 plots the dielectric coefficient on logarithmicscale versus the molar volume fraction. We use the logarithmic scale to clearlyshow the behavior of both the DEE-Water mixture and DEE-Oil mixture in asingle plot. The dielectric coefficient of the DEE-water mixture is approximatelylinear in the molar volume fraction range of interest (0-8 % volume fraction).The Dielectric coefficient of the DEE-Oil mixture is approximately linear overthe entire range (0-100 % volume fraction).
5 COMSOL Simulation
Figure 7: Dielectric coefficient versus Diethylether (DEE) volume fraction in oleic and aque-ous phase.
The work described here fol-lows the paper of Yeoman andNeill (Yeoman et al., 2009)and their implementation inCOMSOLTM. In the COM-SOL program we adapt theconfiguration of the antennaeand the detailed configura-tion of the tag (RFID device)to correspond to the outlayused by us. The geometricaloutlay of the setup used byus consists of two reader an-tennae (emitting and receiv-ing) and a passive tag. Thereader antennae are at a dis-tance of 10.0 cm from eachother (edge to edge), wherethe emitting antenna (Tx) co-incides with the xz-plane andthe receiving antenna (Rx) isrotated (45o) around the z-axis counter clock wise. Thetag (port-2) is located at a distance of 0.5 m from the emitting antenna (port-1),and the Tx and the Rx reader antennae are at a distance of 10 cm from eachother (see Figure 8). The tag that we used in the experiment is shown in Figure12 and 13.
11
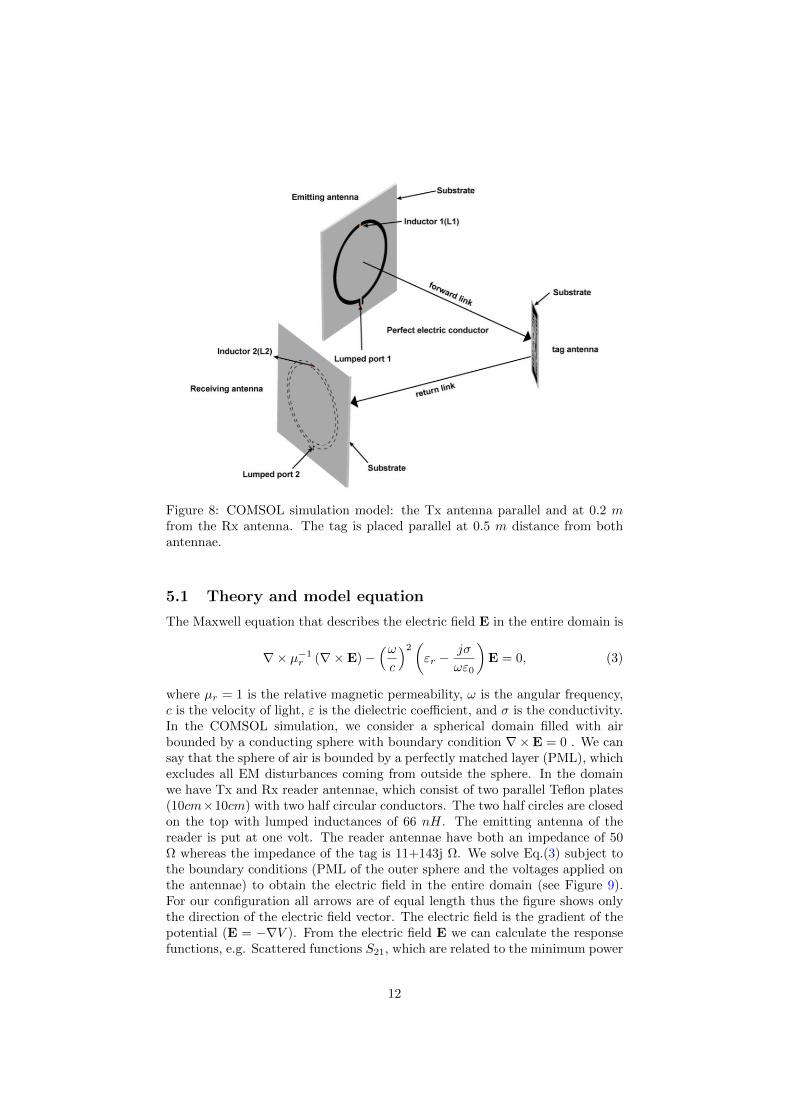
Figure 8: COMSOL simulation model: the Tx antenna parallel and at 0.2 mfrom the Rx antenna. The tag is placed parallel at 0.5 m distance from bothantennae.
5.1 Theory and model equation
The Maxwell equation that describes the electric field E in the entire domain is
∇× µ−1r (∇×E)−(ωc
)2(εr −
jσ
ωε0
)E = 0, (3)
where µr = 1 is the relative magnetic permeability, ω is the angular frequency,c is the velocity of light, ε is the dielectric coefficient, and σ is the conductivity.In the COMSOL simulation, we consider a spherical domain filled with airbounded by a conducting sphere with boundary condition ∇×E = 0 . We cansay that the sphere of air is bounded by a perfectly matched layer (PML), whichexcludes all EM disturbances coming from outside the sphere. In the domainwe have Tx and Rx reader antennae, which consist of two parallel Teflon plates(10cm×10cm) with two half circular conductors. The two half circles are closedon the top with lumped inductances of 66 nH. The emitting antenna of thereader is put at one volt. The reader antennae have both an impedance of 50Ω whereas the impedance of the tag is 11+143j Ω. We solve Eq.(3) subject tothe boundary conditions (PML of the outer sphere and the voltages applied onthe antennae) to obtain the electric field in the entire domain (see Figure 9).For our configuration all arrows are of equal length thus the figure shows onlythe direction of the electric field vector. The electric field is the gradient of thepotential (E = −∇V ). From the electric field E we can calculate the responsefunctions, e.g. Scattered functions S21, which are related to the minimum power
12

at the tag position (Pmin), to be obtained experimentally in section 6. The S12
function is defined as the logarithm (see Eq.(4) and Eq.(5)) of the voltage ratiobetween the input V2 at port-2 and the output V1 also at port-1 (Dobkin, 2012),i.e.
S21 =10 logV2V1
[dB]. (4)
The S11 parameter is defined by the voltage ratio between the input V1 at port-1and the output V1 also at port-1 (Dobkin, 2012)
S11 =10 logV1V1
[dB]. (5)
We use the computed response functions S11 and S21 as function of the frequencyas output of the numerical code. Note that the model of Yeoman and Neill, showthe response functions S11 and S21 in vacuo, whereas our simulations show theresponse functions S11 and S21 for a tag embedded in a medium with dielectriccoefficient ε > 1. The purpose of the COMSOL simulation is to show that theeffect of the dielectric coefficient of the medium on the response functions issignificant. The numerical simulations indicate that the output of the RFIDsystem can be used to determine the dielectric coefficient of the medium inwhich the tag is immersed.
5.2 COMSOL Results
Figure 9: electric field vector shows the normal-ized electric field in dB (20log10E2/Eref ) in acolor graph in the z = 0 plane. Moreover itshows with arrows the direction of the electricfield. The highest values of the normlized elec-tric field occur near the emitting antenna
The main results of the COM-SOL simulation are the scat-tering functions S11 and S21
in the frequency range of(800-1000 MHz). Figure 10Ashows the response functionS11 as function of frequencybetween 800 MHz-2.5 GHzfor the base case and for var-ious dielectric coefficients be-tween 1-80 as indicated in theinsert. We observe that theresponse function S11 is in-sensitive to the dielectric co-efficient. Figure 10B showsthe response function S21 asfunction of frequency between800 MHz-2.5 GHz for the basecase and for various dielectric coefficients between 1-80 as indicated in the in-sert. We observe that the response function S21 significantly depends on thevalue of the dielectric coefficient. The wave like structure of S21 shifts to theleft for increasing dielectric coefficient except for water where it shifts to theright. Figure 11A shows the response function S11 as function of the frequencybetween 800 MHz-2.5 GHz for the base case, and for various dielectric coeffi-cients between 1-80 as indicated in the insert. We observe that the responsefunction S11 is insensitive to the volume of the box in which the tag is encased.
13
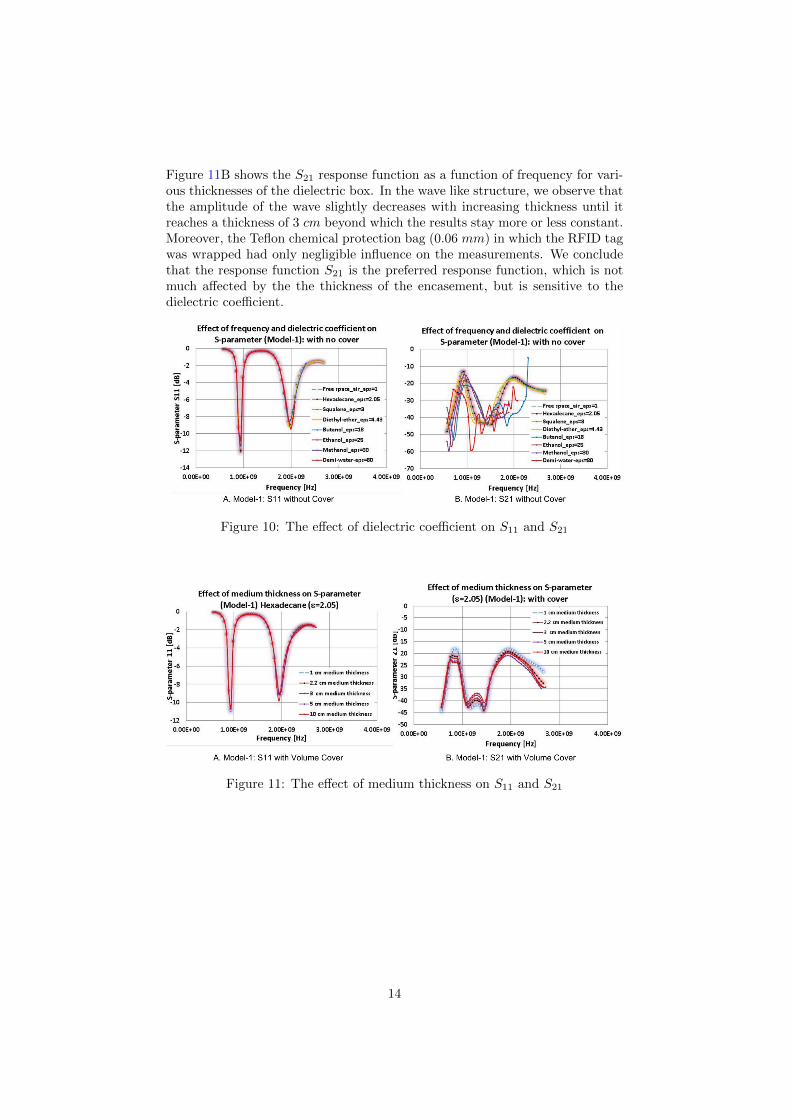
Figure 11B shows the S21 response function as a function of frequency for vari-ous thicknesses of the dielectric box. In the wave like structure, we observe thatthe amplitude of the wave slightly decreases with increasing thickness until itreaches a thickness of 3 cm beyond which the results stay more or less constant.Moreover, the Teflon chemical protection bag (0.06 mm) in which the RFID tagwas wrapped had only negligible influence on the measurements. We concludethat the response function S21 is the preferred response function, which is notmuch affected by the the thickness of the encasement, but is sensitive to thedielectric coefficient.
Figure 10: The effect of dielectric coefficient on S11 and S21
Figure 11: The effect of medium thickness on S11 and S21
14

6 RFID Experiment
6.1 RFID set-up
The RFID set-up consists of a transmitting (Tx) antenna, a receiving (Rx) an-tenna and the passive tag. The tag is the same as described for the COMSOLsimulation and configured as described below (see Figure 12). The transmit-ting and the receiving antennae are separate entities. Separate transmittingand receiving antennae allow to optimally separate the incident and backscat-tered power measurements. In this setup, the Tx antenna emits Left-Hand Cir-cularly Polarized (LHCP) radiation and the Rx antenna receives Right-HandCircularly Polarized (RHCP) radiation (see Figure 12). As shown in Figure13, the Tx and Rx antennae are mounted on a square plastic cover of size20 × 20×0.2 cm3 with a constant dielectric coefficient (ε = 2.1). The cov-ers are placed perpendicular to the z = 0 plane. The antennae consist of acopper circular ring with a radius of 10 cm and a thickness of 1 mm in thesame way as described for the COMSOL simulation above. The z-coordinateof the midpoint of the tag coincides with the z-coordinate of the midpoint ofthe covers. The line connecting the midpoints of the tag and the cover of theemitting antenna is perpendicular to the cover-plane. The other cover is ro-tated 45o around the z-axis (see Figure 13). Both antennae are connected withthe reader by a coaxial cable. The distance between the midpoints of the twoantennae is 0.2 m and the distance between the emitting antenna and the tagis 0.5 m, which causes that the set-up operates in the far-field domain (Dobkin,2012). The RFID setup is located far away from the laboratory walls, floorand ceiling such that it is minimally affected by the surrounding environment.
Figure 12: RFID communication system: thisexperiment use passive tag, which contains nobattery, the tag-reader communication processis always initiated by the reader emitting an-tenna (RHCP), the tag can modulate the signalbefore transmitting it back to the receiver an-tenna (LHCP).
The RFID setup can measurethe frequency dependence oftwo selected response func-tions in terms of the scatter-ing function S21) and in termsof minimum power at the tagposition (Pmin) as a functionof the dielectric coefficient.The S21 and Pmin functionsare interrelated. We per-formed a calibration of thefrequency dependent RFIDresponse functions as a func-tion of the dielectric coeffi-cient. This is accomplishedby immersing the RFID tagin a cylindrical tube, witha diameter of 0.05 m and aheight 0.35 m, filled with flu-ids (till 0.2 m height and avolume of 0.00039 m3) of var-ious known dielectric coeffi-cients (ε = [1, 80]). By plot-ting the RFID response functions at various frequencies as a function of the
15

dielectric coefficient an optimal frequency can be found for which the dielectricdependence is most sensitive.
6.2 Experimental measurements
Figure 13: RFID Xplorer setup: the tag isplaced in a cylindrical plastic tube filled withdifferent liquids, with varying dielectric coeffi-cient (ε between 1-80).
The aim of using the RFIDset-up is to measure the tagresponse functions for vari-ous media (with dielectric co-efficients between 1 and 80).Of the possible response func-tions, we specifically mea-sured the minimum powerat the tag position (Pmin)and the scattering function,S21. The minimum power atthe tag position can be re-lated to the scattered signalat the midpoint of the tagwith respect to the input sig-nal at the emitting antenna.The measurements are per-formed at 23oC in the fre-quency range between 800-1000 MHz (with frequency steps of 5 MHz). We started our calibration processby measuring in air (ε = 1). As the system is designed to operate in air thisis considered as our base case. We did not measure other response functionsbecause it turned out that Pmin gave optimal results. Measurements for otherdielectric coefficients were done by placing the tag in a cylindrical (polypropy-lene, ε = 2.2) tube (with an outside diameter of 0.05 m, an inside diameterof 0.046 m and a height of 0.35 m, and filled up to 0.2 m, corresponding to avolume 0.00039 m3. The cylindrical polypropylene tube, which is chemicallyresistant against the used fluids, is filled with different liquids such as water, oiland alcohol (propanol, butanol, ethanol and methanol) with various dielectriccoefficients (between 1-80). The tube (volume of 0.00039m3) is filled up to aheight of 0.2m; the top 0.15 m is filled with air. The tag is fully immersed inthe liquid.
6.3 Experimental Results and Discussions
This experiment seeks to measure the effect of the dielectric coefficient ε onthe RFID response functions obtained with the CISC (Xplorer-200) setup. Inthis study, we determine the response functions S21 and Pmin. The responsefunction S21 is equal to 10logV2/V1 dBm, where V2 is the voltage measured atport-2 and V1 is the applied voltage at port-1. The response function Pmin(10 log10(V ) dBm) is the minimum voltage required to activate the RFID tag.Figure 14A shows the S21 versus frequency for air ε ≈ 1, hexadecane ε = 2.05,diethyl ether ε = 4.1 , a variety of alcohols (ethanol with ε = 25, methanolε = 33, propanol ε = 18, butanol ε = 17) mixtures of alcohol and(ε ∈ 17− 33)and water ε = 80. We observe an oscillatory structure for a frequency ranging
16
between 800-1000 MHz, with mainly four distinct peaks. The position of thepeaks shifts monotonously to the left for increasing dielectric coefficients, exceptfor water where the peaks shift to the right. This is possibly due to a conduc-tivity effect of distilled water brought about by dissolution of carbon dioxide.Figure 14B plots the scattering function S21 versus the dielectric coefficient forgiven frequencies, e.g. 868 MHz, 915 MHz. These frequencies show the high-est sensitivity of S21 to the dielectric coefficient between diethyl ether-oil anddiethyl ether-water respectively. Figure 15A plots the minimum power Pminversus the frequency for the same fluids as used for the scattering function S21.Pmin shows a less oscillatory behavior than S21. The minimum power increasesfor increasing dielectric coefficient. Between 800-1000 MHz we observe a singleminimum around 900 MHz, except for water where we observe two minima at850 MHz and 950 MHz respectively. We use the data to construct Figure 15B toplot the Pmin versus the dielectric coefficient for selected frequencies. Again thefrequency 868 MHz and 915 MHz shows the highest sensitivity. In Figures 16and 17 we convert the dielectric coefficient to volume fraction using the Bottchermixing rule as explained in Section 4. The volume fraction range of DEE of in-terest is up to 8 % volume fraction. Figure 16A shows the scattering functionS21 changing only significantly at 950 MHz (sensitivity 124.5 [dBm/ volumefraction%]) and therefore only the behavior at 950 MHz is preferably used todetermine the volume fraction of DEE in the aqueous solution. Figure 16Bshows the S21 response function versus the volume fraction of DEE in the oleicphase. This shows that 850 MHz (sensitivity 13.5 [dBm/ volume fraction %])and 868 (sensitivity 9.5 [dBm/ volume fraction %]) are the optimal frequenciesto determine the fluid composition in the entire range 0-100 % volume fraction.Figure 17A shows the Pmin as a function of the volume fraction of DEE in theaqueous phase. The volume fraction range of interest is 0−8%volumefraction,the optimal frequencies are 915 (sensitivity 46.8 [dBm/ volume fraction%]) and950 (sensitivity 46.4 [dBm/ volume fraction %]) MHz. Figure 17B shows theresponse function Pmin as a function of the volume fraction of DEE in the oleicphase. The frequencies, 800 MHz (sensitivity 2.6 [dBm/ volume fraction %]),850 MHz (sensitivity 2.3 [dBm/ volume fraction %]) and 868 MHz (sensitivity2.1 [dBm/ volume fraction %]), are optimal to determine the composition inthe entire range. The RFID manual states that the accuracy with which theresponse function can be measured is (0.0004 dBm). By dividing the standarddeviation by the sensitivity, we can estimate the precision with which, the com-position can be determined. Therefore we conclude that Pmin is the preferredresponse function at frequencies of 915 and 950 MHz for the oleic phase and800, 850 and 868 MHz for the aqueous phase.
17

Figure 14: The effect of dielectric coefficient and frequency on S21
Figure 15: The effect of dielectric coefficient and frequency on Pmin
Figure 16: S21 versus volume fraction of DEE in aqueous and oleic phase
18
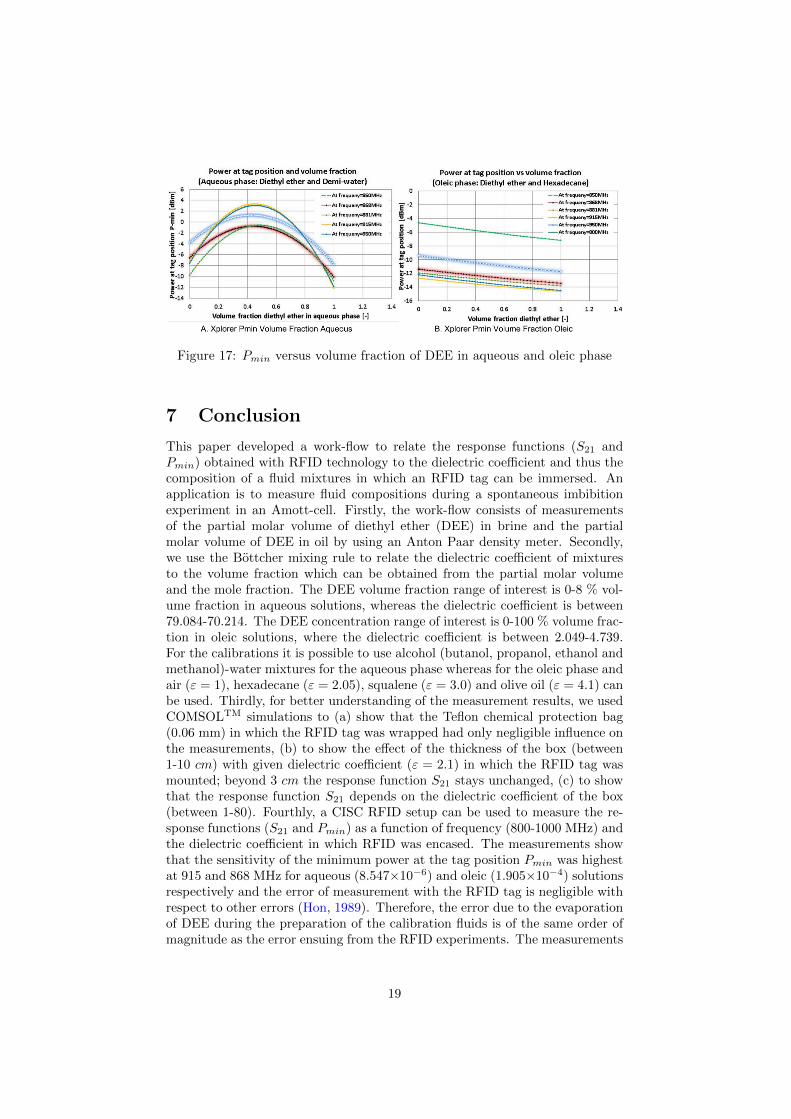
Figure 17: Pmin versus volume fraction of DEE in aqueous and oleic phase
7 Conclusion
This paper developed a work-flow to relate the response functions (S21 andPmin) obtained with RFID technology to the dielectric coefficient and thus thecomposition of a fluid mixtures in which an RFID tag can be immersed. Anapplication is to measure fluid compositions during a spontaneous imbibitionexperiment in an Amott-cell. Firstly, the work-flow consists of measurementsof the partial molar volume of diethyl ether (DEE) in brine and the partialmolar volume of DEE in oil by using an Anton Paar density meter. Secondly,we use the Bottcher mixing rule to relate the dielectric coefficient of mixturesto the volume fraction which can be obtained from the partial molar volumeand the mole fraction. The DEE volume fraction range of interest is 0-8 % vol-ume fraction in aqueous solutions, whereas the dielectric coefficient is between79.084-70.214. The DEE concentration range of interest is 0-100 % volume frac-tion in oleic solutions, where the dielectric coefficient is between 2.049-4.739.For the calibrations it is possible to use alcohol (butanol, propanol, ethanol andmethanol)-water mixtures for the aqueous phase whereas for the oleic phase andair (ε = 1), hexadecane (ε = 2.05), squalene (ε = 3.0) and olive oil (ε = 4.1) canbe used. Thirdly, for better understanding of the measurement results, we usedCOMSOLTM simulations to (a) show that the Teflon chemical protection bag(0.06 mm) in which the RFID tag was wrapped had only negligible influence onthe measurements, (b) to show the effect of the thickness of the box (between1-10 cm) with given dielectric coefficient (ε = 2.1) in which the RFID tag wasmounted; beyond 3 cm the response function S21 stays unchanged, (c) to showthat the response function S21 depends on the dielectric coefficient of the box(between 1-80). Fourthly, a CISC RFID setup can be used to measure the re-sponse functions (S21 and Pmin) as a function of frequency (800-1000 MHz) andthe dielectric coefficient in which RFID was encased. The measurements showthat the sensitivity of the minimum power at the tag position Pmin was highestat 915 and 868 MHz for aqueous (8.547×10⁻⁶) and oleic (1.905×10⁻⁴) solutionsrespectively and the error of measurement with the RFID tag is negligible withrespect to other errors (Hon, 1989). Therefore, the error due to the evaporationof DEE during the preparation of the calibration fluids is of the same order ofmagnitude as the error ensuing from the RFID experiments. The measurements
19

until now, show that it is possible to use RFID technology for contact-less mea-surements of the compositions of fluids in imbibition experiments.
8 Acknowledgments
The work was supported by Geoscience and Engineering Laboratory of DelftUniversity of Technology (TU Delft). The authors would like to acknowledgeProf. dr. W. R (William) Rossen and Ing. H.K.J. Heller for useful suggestions.Parts of this report greatly benefited from discussions with Prof. ir. Cor vanKruijsdijk and Dr. Christian Schoemaker.
References
Al-Hadhrami, H. S., Blunt, M. J., et al. (2000). Thermally induced wettabil-ity alteration to improve oil recovery in fractured reservoirs. In Spe/doeimproved oil recovery symposium.
Amin, E. M., Bhuiyan, M. S., Karmakar, N. C., & Winther-Jensen, B. (2014).Development of a low cost printable chipless rfid humidity sensor. IEEESensors Journal , 14 (1), 140–149.
Beriain, A., Rebollo, I., Fernandez, I., Sevillano, J. F., & Berenguer, R. (2012).A passive uhf rfid pressure sensor tag with a 7.27 bit and 5.47 pj capacitivesensor interface. In Microwave symposium digest (mtt), 2012 ieee mtt-sinternational (pp. 1–3).
Chahardowli, M. (2016). Dimethyl ether & diethyl ether for enhanced oilrecovery from conventional & fractured reservoirs. PhD thesis TU-Delft ,1–149.
Chahardowli, M., Farajzadeh, R., Masalmeh, S., Mahani, H., Bruining, H.,et al. (2016). A novel enhanced oil recovery technology using dimethylether/brine: Spontaneous imbibition in sandstone and carbonate rocks.In Spe annual technical conference and exhibition.
Chahardowli, M., Zholdybayeva, A., Farajzadeh, R., Bruining, H., et al. (2013).Solvent-enhanced spontaneous imbibition in fractured reservoirs. In Eageannual conference & exhibition incorporating spe europec.
Chernetsky, A., Masalmeh, S., Eikmans, D., Boerrigter, P., Fadili, A., Parsons,C., . . . others (2015). A novel enhanced oil recovery technique: Exper-imental results and modelling workflow of the dme enhanced waterfloodtechnology. In Abu dhabi international petroleum exhibition and confer-ence.
Cho, N., Song, S.-J., Kim, S., Kim, S., & Yoo, H.-J. (2005). A 5.1-/spl mu/w uhfrfid tag chip integrated with sensors for wireless environmental monitoring.In Solid-state circuits conference, 2005. esscirc 2005. proceedings of the31st european (pp. 279–282).
DeHennis, A., & Wise, K. D. (2002). A double-sided single-chip wireless pres-sure sensor. In Micro electro mechanical systems, 2002. the fifteenth ieeeinternational conference on (pp. 252–255).
Dobkin, D. M. (2012). The rf in rfid: Uhf rfid in practice. Newnes.
20

Dobkin, D. M., & Wandinger, T. (2005). A radio oriented introduction to radiofrequency identification. RFID Tutorial, High Frequency Electronics.
Fiddes, L. K., & Yan, N. (2013). Rfid tags for wireless electrochemical detectionof volatile chemicals. Sensors and Actuators B: Chemical , 186 , 817–823.
Firoozabadi, A., et al. (2000). Recovery mechanisms in fractured reservoirs andfield performance. Journal of Canadian Petroleum Technology , 39 (11).
Govind, P. A., Das, S. K., Srinivasan, S., Wheeler, T. J., et al. (2008). Expand-ing solvent sagd in heavy oil reservoirs. In International thermal operationsand heavy oil symposium.
Grimes, C. A., Mungle, C. S., Zeng, K., Jain, M. K., Dreschel, W. R., Paulose,M., & Ong, K. G. (2002). Wireless magnetoelastic resonance sensors: Acritical review. Sensors, 2 (7), 294–313.
Gupta, S., Gittins, S., et al. (2007). Effect of solvent sequencing and otherenhancements on solvent aided process. Journal of Canadian PetroleumTechnology , 46 (09).
Hassan, A. (2016). The use of rfid technology in solvent-enhanced imbibi-tion experiments. LAP Lambert Academic Publishing. Retrieved fromhttps://books.google.nl/books?id=2yUqvgAACAAJ
Hirasaki, G., Zhang, D. L., et al. (2004). Surface chemistry of oil recovery fromfractured, oil-wet, carbonate formations. Spe Journal , 9 (02), 151–162.
Holm, L., Csaszar, A., et al. (1962). Oil recovery by solvents mutually soluble inoil and water. Society of Petroleum Engineers Journal , 2 (02), 129–144.
Hon, G. (1989). Towards a typology of experimental errors: An epistemologicalview. Studies in History and Philosophy of Science Part A, 20 (4), 469–504.
Israelachvili, J. N. (2011). Intermolecular and surface forces. Academic press.Jia, Y., Heiß, M., Fu, Q., & Gay, N. A. (2008). A prototype rfid humidity sensor
for built environment monitoring. In Education technology and training,2008. and 2008 international workshop on geoscience and remote sensing.ett and grs 2008. international workshop on (Vol. 2, pp. 496–499).
Kahrobaei, S., Farajzadeh, R., Suicmez, V. S., & Bruining, J. (2012). Gravity-enhanced transfer between fracture and matrix in solvent-based enhancedoil recovery. Industrial & Engineering Chemistry Research, 51 (44), 14555–14565.
Karuppuswami, S., Kaur, A., Ghazali, M. I. M., & Chahal, P. (2016). Rfidcompatible sensor tags for remote liquid sample interrogation. In Elec-tronic components and technology conference (ectc), 2016 ieee 66th (pp.2401–2407).
Kleppe, J., Morse, R. A., et al. (1974). Oil production from fractured reser-voirs by water displacement. In Fall meeting of the society of petroleumengineers of aime.
Laheurte, J.-M., Ripoll, C., Paret, D., & Loussert, C. (2014). Uhf rfid technolo-gies for identification and traceability. John Wiley & Sons.
Law, M. K., Bermak, A., & Luong, H. C. (2010). A sub-µmw embedded cmostemperature sensor for rfid food monitoring application. IEEE journal ofsolid-state circuits, 45 (6), 1246.
Liu, H., Bolic, M., Nayak, A., & Stojmenovic, I. (2008). Taxonomy and chal-lenges of the integration of rfid and wireless sensor networks. IEEE net-work , 22 (6).
21
Lobato-Morales, H., Corona-Chavez, A., & Olvera-Cervantes, J. L. (2013). Pla-nar sensors for rfid wireless complex-dielectric-permittivity sensing of liq-uids. In Microwave symposium digest (ims), 2013 ieee mtt-s international(pp. 1–3).
Lobato-Morales, H., Murthy, D., Corona-Chavez, A., Olvera-Cervantes, J. L.,Martınez-Brito, J., & Guerrero-Ojeda, L. G. (2011). Permittivity mea-surements at microwave frequencies using epsilon-near-zero (enz) tunnelstructure. IEEE transactions on microwave theory and techniques, 59 (7),1863–1868.
Mattax, C. C., Kyte, J., et al. (1962). Imbibition oil recovery from fractured,water-drive reservoir. Society of Petroleum Engineers Journal , 2 (02), 177–184.
Mori, T., Suemasu, Y., Noguchi, H., & Sato, T. (2004). Multiple people trackingby integrating distributed floor pressure sensors and rfid system. In Sys-tems, man and cybernetics, 2004 ieee international conference on (Vol. 6,pp. 5271–5278).
Morrow, N. R., et al. (1990). Wettability and its effect on oil recovery. Journalof Petroleum Technology , 42 (12), 1–476.
Motealleh, S., de Zwart, B.-R., & Bruining, J. (2005). Wettability alterationand imbibition effects in steam recovery from matrix blocks in fracturedreservoirs. In Ior 2005-13th european symposium on improved oil recovery.
Novak, G. D. (2009). Rfid tags/planar inductors as chemical sensor platformsin liquid sensing applications (Unpublished doctoral dissertation). MAR-QUETTE UNIVERSITY.
Ong, K. G., Grimes, C., Robbins, C., & Singh, R. (2001). Design and applicationof a wireless, passive, resonant-circuit environmental monitoring sensor.Sensors and Actuators A: Physical , 93 (1), 33–43.
Opasjumruskit, K., Thanthipwan, T., Sathusen, O., Sirinamarattana, P., Gad-manee, P., Pootarapan, E., . . . Thamsirianunt, M. (2006). Self-poweredwireless temperature sensors exploit rfid technology. IEEE Pervasive com-puting , 5 (1), 54–61.
Parsons, C., Chernetsky, A., Eikmans, D., te Riele, P., Boersma, D., Sersic, I.,. . . others (2016). Introducing a novel enhanced oil recovery technology.In Spe improved oil recovery conference.
Potyrailo, R. A., Nagraj, N., Tang, Z., Mondello, F. J., Surman, C., & Morris,W. (2012). Battery-free radio frequency identification (rfid) sensors forfood quality and safety. Journal of agricultural and food chemistry , 60 (35),8535–8543.
Predel, B. (2006). Landolt-bornstein, group iv: Physical chemistry. Springer,Berlin.
Saidi, A., et al. (1983). Simulation of naturally fractured reservoirs. In Spereservoir simulation symposium.
Salimi, H., Bruining, J., et al. (2010a). Improved prediction of oil recovery fromwaterflooded fractured reservoirs using homogenization. SPE ReservoirEvaluation & Engineering , 13 (01), 44–55.
Salimi, H., Bruining, J., et al. (2010b). The influence of wettability on oilrecovery from naturally fractured oil reservoirs including non-equilibriumeffects. In Spe latin american and caribbean petroleum engineering confer-ence.
22

Shenghua, Z., & Nanjian, W. (2007). A novel ultra low power temperature sen-sor for uhf rfid tag chip. In Solid-state circuits conference, 2007. asscc’07.ieee asian (pp. 464–467).
Smith, J., Van Ness, H., & Abbott, M. (1987). Introduction to chemical engi-neering thermodynamics, ; macgraw hill. Inc.: New York .
Standal, S., Haavik, J., Blokhus, A., & Skauge, A. (1999). Effect of polarorganic components on wettability as studied by adsorption and contactangles. Journal of Petroleum Science and Engineering , 24 (2), 131–144.
Vaz, A., Ubarretxena, A., Zalbide, I., Pardo, D., Solar, H., Garcia-Alonso, A.,& Berenguer, R. (2010). Full passive uhf tag with a temperature sensorsuitable for human body temperature monitoring. IEEE Transactions onCircuits and Systems II: Express Briefs, 57 (2), 95–99.
Virtanen, J., Ukkonen, L., Bjorninen, T., Elsherbeni, A. Z., & Sydanheimo, L.(2011). Inkjet-printed humidity sensor for passive uhf rfid systems. IEEETransactions on Instrumentation and Measurement , 60 (8), 2768–2777.
Virtanen, J., Ukkonen, L., Bjorninen, T., & Sydanheimo, L. (2010). Printedhumidity sensor for uhf rfid systems. In Sensors applications symposium(sas), 2010 ieee (pp. 269–272).
Want, R. (2006). An introduction to rfid technology. Pervasive Computing,IEEE , 5 (1), 25–33.
Warnagiris, T. J. (2000). Liquid sensing at radio frequencies. MICROWAVEJOURNAL-EUROGLOBAL EDITION-, 43 (9), 140–151.
Warren, J., Root, P. J., et al. (1963). The behavior of naturally fracturedreservoirs. Society of Petroleum Engineers Journal , 3 (03), 245–255.
Wille, S., Buggert, M., Mokrushina, L., Arlt, W., & Smirnova, I. (2010). Effectof electrolytes on octanol-water partition coefficients: Calculations withcosmo-rs. Chemical Engineering & Technology , 33 (7), 1075–1082.
Wohlfarth, C. (2008). Static dielectric constants of pure liquids and binaryliquid mixtures: Supplement to iv/6 (Vol. 17). Springer Science & BusinessMedia.
Wyman Jr, J. (1933). Dielectric constants: ethanol-diethyl ether and urea-watersolutions between 0 and 50. Journal of the American Chemical Society ,55 (10), 4116–4121.
Yeoman, M., Reddy, B., Bowles, H., Zilla, P., Bezuidenhout, D., & Franz, T.(2009). The use of finite element methods and genetic algorithms in searchof an optimal fabric reinforced porous graft system. Annals of biomedicalengineering , 37 (11), 2266–2287.
Zhang, L., & Wang, Z. (2006). Integration of rfid into wireless sensor networks:architectures, opportunities and challenging problems. In Grid and coop-erative computing workshops, 2006. gccw’06. fifth international conferenceon (pp. 463–469).
Zhou, X., Morrow, N. R., Ma, S., et al. (2000). Interrelationship of wettabil-ity, initial water saturation, aging time, and oil recovery by spontaneousimbibition and waterflooding. SPE Journal , 5 (02), 199–207.
23