delft university of technology factors influencing the
TRANSCRIPT
Delft University of Technology
Factors influencing the prediction of pile driveability using CPT-based approaches
Prendergast, Luke J.; Gandina, Putri; Gavin, Kenneth
DOI10.3390/en13123128Publication date2020Document VersionFinal published versionPublished inEnergies
Citation (APA)Prendergast, L. J., Gandina, P., & Gavin, K. (2020). Factors influencing the prediction of pile driveabilityusing CPT-based approaches. Energies, 13(12), [3128]. https://doi.org/10.3390/en13123128
Important noteTo cite this publication, please use the final published version (if applicable).Please check the document version above.
CopyrightOther than for strictly personal use, it is not permitted to download, forward or distribute the text or part of it, without the consentof the author(s) and/or copyright holder(s), unless the work is under an open content license such as Creative Commons.
Takedown policyPlease contact us and provide details if you believe this document breaches copyrights.We will remove access to the work immediately and investigate your claim.
This work is downloaded from Delft University of Technology.For technical reasons the number of authors shown on this cover page is limited to a maximum of 10.

energies
Article
Factors Influencing the Prediction of Pile DriveabilityUsing CPT-Based Approaches
Luke J. Prendergast 1 , Putri Gandina 2 and Kenneth Gavin 2,*1 Department of Civil Engineering, Faculty of Engineering, University of Nottingham, Nottingham NG7 2RD, UK;
[email protected] Department of Civil Engineering and Geosciences, Delft University of Technology, Building 23, Stevinweg 1,
PO Box 5048, 2628 CN Delft/2600 GA Delft, The Netherlands; [email protected]* Correspondence: [email protected]
Received: 1 May 2020; Accepted: 11 June 2020; Published: 16 June 2020�����������������
Abstract: This paper investigates the applicability of Cone Penetration Test (CPT)-based axialcapacity approaches, used for estimating pile static capacity, to the prediction of pile driveability.An investigation of the influence of various operational parameters in a driveability study is conducted.A variety of axial capacity approaches (IC-05, UWA-05 and Fugro-05) are assessed in unmodified andmodified form to appraise their ability to be used in estimating the driveability of open-ended steelpiles used to support, for example, offshore jackets or bridge piers. Modifications to the CPT-baseddesign approaches include alterations to the proposed base resistance to account for the resistancemobilized under discrete hammer impacts and the presence of residual stresses, as well as accountingfor the effects of static capacity increases over time, namely ageing. Furthermore, a study on theinfluence of various operational parameters within a wave equation solver is conducted to ascertainthe relative impact of uncertain data in this respect. The purpose of the paper is not to suggest a newdesign procedure for estimating pile driveability, rather to investigate the influence of the variousoperating parameters in a driveability analysis and how they affect the magnitude of the resultingpredictions. The study will be of interest to geotechnical design of piles using CPT data.
Keywords: piles; driveability; CPT; pile installation; pile design
1. Introduction
Pile installation by driving is a high-risk activity in any construction project. Inefficient pile drivingcan potentially cause material damage to the piles and project delays that may have great financialimplications. Selected driving equipment must be capable of installing piles to a target depth within agiven time-frame without overstressing the pile. A comprehensive driveability analysis is thereforeessential to any project involving pile foundations. In the offshore environment, this is even moreimportant as delays can have significant financial costs and associated risks [1]. Driveability analysesmust consider all aspects of pile installation, such as soil conditions and soil-structure interaction,driving equipment performance, and pile specifications including geometrical and material properties.
Driveability analyses require calculation of Static Resistance to Driving (SRD) profiles, which area measure of the soil resistance to pile installation. SRD is analogous to the axial capacity of a pileand represents the cumulative increase in shaft capacity associated with further pile penetration.This also encompasses a base resistance that is associated with each driving increment. Schneider andHarmon [2] claim that SRD is similar to pile static axial capacity except that the resistance often differsdue to consolidation, stress equalization, and ageing effects (capacity increases over time).
The total resistance of a pile to driving is commonly presented in terms of the blow counts(hammer impacts) per 0.25 m penetration required to drive the pile to its target installation depth.
Energies 2020, 13, 3128; doi:10.3390/en13123128 www.mdpi.com/journal/energies
Energies 2020, 13, 3128 2 of 19
This can be estimated using wave equation analysis whereby the inputs include a combination ofSRD, pile properties, hammer properties, and dynamic resistance components. Solving the waveequation enables incorporation of the dynamic components including inertia and viscous rate effects,which contribute to the resistance. These are represented by damping and quake values, as discussedin more detail in Section 2. The solution to the wave equation allows estimation of the blow countsrequired to drive a pile, the installation-related stresses, and an estimate of the driving time. It shouldbe noted that an over-estimation of blow counts is considered conservative, unlike an over-estimationof axial capacity, which is considered unconservative. It is desirable that a driveability study wouldlead to a slight over-estimation of the required blow-counts to install a pile.
Arguably the most challenging aspect of performing driveability studies lies with the accuratemodelling of soil-structure interaction [1,3,4]. Several models have been put forward to derive SRDprofiles, see for example [2,5–8]. Many of these approaches are highly empirical and are biased to thedataset from which they are derived. Due to the analogous relationship between a pile being installedand a penetrating cone, Cone Penetration Tests (CPTs) have become popular in recent years as a wayto more accurately encapsulate pile-soil interaction behavior. There are various CPT-based methodsalready developed to determine the axial static capacity of piles [9,10]. Due to the similarity betweenaxially loaded piles and piles being installed by driving, it is of interest to assess the applicability ofthese approaches to estimating pile driveability [1]. However, there are some notable differences in thebehavior. Firstly, several of these CPT-based axial capacity methods have been developed based on pileload tests conducted between 10 and 30 days after pile installation. Previous studies have indicatedthat static pile capacity may increase over time after pile driving [11–15]. Based on this premise, the pileresistance experienced during driving should be less than the capacity measured after some time haspassed. The application of a time factor to account for this ageing is therefore of interest. Secondly,during pile driving, the shear resistance measured at a given point below the ground surface reduces asthe pile tip penetration increases, a phenomenon known as friction fatigue. Schneider and Harmon [2]suggest calculating the pseudo average shaft friction to accommodate changes in the shape of shearresistance distribution during pile driving. More details on this are provided in subsequent sections.Thirdly, the pile penetration per blow during driving is typically less than the failure criteria used toderive the base capacity in CPT-based axial capacity approaches including the IC-05, Fugro-05 andUWA-05 methods. These models incorporate a base resistance corresponding to a pile tip displacementof 0.1D, where D is the pile diameter. A reduction factor is therefore required to consider the actualpile tip displacement encountered during driving [1,16]. Finally, residual stresses on the pile base maybe significantly miss-represented, which could lead to considerable error particularly in the case of theUWA-05 base resistance [1,17]. Ignoring residual stresses could lead to an underestimation of the baseresistance during driving.
In this paper, factors influencing the prediction of pile driveability using CPT-based approachesare investigated. Three CPT-based static capacity models are trialed, namely IC-05, UWA-05 andFugro-05. The effects of pile ageing on the derived SRD profiles, base-mobilization and residual stressesare investigated with a view to understanding their influence on the perceived driveability of piles.Models are compared to measured pile installation records on relatively slender piles at Blessington,Ireland to appraise the performance of the methods used. Finally, the influence of operating parameterswithin the wave equation analysis including damping (toe and skin), quake, hammer stroke height,and efficiency is assessed.
2. Background to Pile Driveability
2.1. Wave Equation Analysis
The main parameters of interest from a driveability study are the blow counts required to installthe pile, the driving stresses experienced by the pile during installation and the time required to drivea pile to a target installation depth. These can be estimated using wave equation analysis. The factors

Energies 2020, 13, 3128 3 of 19
affecting a pile’s resistance to driving include the soil’s SRD profile, increases in the pile capacity dueto inertia (mass) and viscous rate effects (damping). Methods to define the SRD as an input to the piledriveability analysis are discussed in Section 2.2. The inertia and viscous rate effects are accountedfor automatically within the wave equation solution procedure. It is necessary to specify damping(energy dissipation) and quake (displacement to achieve yield) values for a given analysis. A 1-Dcommercially available finite-difference wave equation solver, GRLWEAP [18], is used in the presentstudy to estimate the blow-counts required to install piles and to investigate how variations in the inputparameters influence the predictions using CPT-based approaches. GRLWEAP is a commonly-usedcommercially available software, created by Pile Dynamics [18]. It enables estimation of soil resistanceand dynamic stresses in piles, selection of appropriate driving equipment, determination of whether apile will be over-stressed, determination of the likelihood of refusal, and estimation of driving time.The response of a pile can be predicted by GRLWEAP through solving the wave equation shownin Equation (1):
ρ
(∂2u∂t2
)= E
(∂2u∂x2
)(1)
where u is the displacement of the pile (m), ρ is the density of the pile material (kg/m3), E is the Young’s
modulus (N/m2) and c =(
Eρ
)0.5is the wave speed.
The various inputs and outputs of a pile driveability study in the context of the present paper areshown in Figure 1. This paper focusses on the influence of various factors affecting the SRD profile,derived by appropriate modification of CPT-based axial static capacity approaches for piles, as well asthe influence of uncertainty in the damping and quake values, used for a given calculation.
Energies 2020, 13, x FOR PEER REVIEW 3 of 19
affecting a pile’s resistance to driving include the soil’s SRD profile, increases in the pile capacity due to inertia (mass) and viscous rate effects (damping). Methods to define the SRD as an input to the pile driveability analysis are discussed in Section 2.2. The inertia and viscous rate effects are accounted for automatically within the wave equation solution procedure. It is necessary to specify damping (energy dissipation) and quake (displacement to achieve yield) values for a given analysis. A 1-D commercially available finite-difference wave equation solver, GRLWEAP [18], is used in the present study to estimate the blow-counts required to install piles and to investigate how variations in the input parameters influence the predictions using CPT-based approaches. GRLWEAP is a commonly-used commercially available software, created by Pile Dynamics [18]. It enables estimation of soil resistance and dynamic stresses in piles, selection of appropriate driving equipment, determination of whether a pile will be over-stressed, determination of the likelihood of refusal, and estimation of driving time. The response of a pile can be predicted by GRLWEAP through solving the wave equation shown in Equation (1):
= (1)
where u is the displacement of the pile (m), ρ is the density of the pile material (kg/m3), E is the
Young’s modulus (N/m2) and = .is the wave speed.
The various inputs and outputs of a pile driveability study in the context of the present paper are shown in Figure 1. This paper focusses on the influence of various factors affecting the SRD profile, derived by appropriate modification of CPT-based axial static capacity approaches for piles, as well as the influence of uncertainty in the damping and quake values, used for a given calculation.
Figure 1. Flow-chart of driveability analysis procedure.
2.2. Static Resistance to Driving (SRD)
Soil resistance to pile driving comprises both static and dynamic components. The SRD is analogous to axial static capacity and includes shaft friction and base resistance. Unlike static capacity however, which only has a single base resistance and shaft capacity distribution, a SRD profile has a base resistance for each driving increment. Moreover, the shaft capacity also varies according to pile penetration. Further differences between pile static capacity and SRD arise due to time effects (ageing), consolidation, stress equalisation, and the definition of soil failure used to derive base resistance in static load tests [2].
The occurrence of plugging in open-ended piles during driving can be represented by the Incremental Filling Ratio (IFR), which affects base resistance in the definition of SRD. In fully coring conditions (IFR = 1), end bearing is mobilized on the pile annulus (qann) only, and both internal ( , ) and external ( ) shaft friction are mobilized along the shaft surface area. Alm and Hamre [8] and Schneider and Harmon [2] suggest reducing unit shaft friction to 50% and applying on both the internal and external pile wall, which is approximately the same as applying the full external shaft
Figure 1. Flow-chart of driveability analysis procedure.
2.2. Static Resistance to Driving (SRD)
Soil resistance to pile driving comprises both static and dynamic components. The SRD isanalogous to axial static capacity and includes shaft friction and base resistance. Unlike static capacityhowever, which only has a single base resistance and shaft capacity distribution, a SRD profile has abase resistance for each driving increment. Moreover, the shaft capacity also varies according to pilepenetration. Further differences between pile static capacity and SRD arise due to time effects (ageing),consolidation, stress equalisation, and the definition of soil failure used to derive base resistance instatic load tests [2].
The occurrence of plugging in open-ended piles during driving can be represented by theIncremental Filling Ratio (IFR), which affects base resistance in the definition of SRD. In fully coringconditions (IFR = 1), end bearing is mobilized on the pile annulus (qann) only, and both internal (τ f ,in)and external (τ f ) shaft friction are mobilized along the shaft surface area. Alm and Hamre [8] andSchneider and Harmon [2] suggest reducing unit shaft friction to 50% and applying on both the internaland external pile wall, which is approximately the same as applying the full external shaft friction
Energies 2020, 13, 3128 4 of 19
without any internal shaft friction. Methods to derive estimates of shaft friction are presented inSection 2.3.
The shaft stress distribution associated with each pile penetration increment is altered due tofriction fatigue, whereby the shear resistance at a given point below ground level reduces withadvancement of the pile tip. Some existing SRD models incorporate this by inclusion of a degradationterm typically of the form (h/R)n, where h is the vertical distance from the pile tip to the point in theground where the stress is being calculated and R is the pile radius. This term changes the shape ofthe soil shear stress distribution as the pile penetrates, therefore an averaging technique to obtain oneglobal SRD profile for input to the wave equation solver is required. Schneider and Harmon [2] suggestthat the shape of the shaft stress distribution has a negligible effect on the bearing graph and suggestcalculating the pseudo-average shaft friction between successive depth increments (∆τ f ,avg) as follows:
∆τ f ,avg =
∑QS,L −
∑QS,L−1
πD∆L(2)
where∑
QS,L is the cumulative shaft resistance at the pile tip depth,∑
QS,L-1 is the cumulative shaftresistance at the previous depth increment, ∆L is the depth increment, and D is the pile diameter.Friction fatigue is incorporated to provide a more realistic estimate of the shaft friction experienced bya pile during installation.
2.3. Application of CPT-Based Axial Capacity Approaches to Predicting Pile Installation
Cone Penetration Tests (CPT) are a common and useful site investigation tool used in geotechnicalcharacterization. Site investigations must be undertaken to determine strength parameters of soil toinform on design and construction-related matters. The correlation between cone tip resistance (qc),which is the stress experienced by a cone tip as it penetrates into soil, and pile shaft friction and baseresistance has been developed over several years.
Various traditional SRD approaches have been proposed by Toolan and Fox [6], Stevens et al. [5]and Alm and Hamre [8] among others. For piles installed in sand, Toolan and Fox [6] proposed thatunit base resistance and unit skin friction be determined as a weighted average and a fraction of CPTqc respectively. The qc value used in the base resistance should be averaged over a number of pilediameters above and below the pile tip. Stevens et al. [5] proposed determining both the unit base andskin resistance by limiting these for plugged and coring conditions. Alm and Hamre [8] developed amodel-based CPT approach using back-calculated driveability studies, which incorporated frictionfatigue effects. While these approaches have been used with some success to date, there is a questionover their general applicability to piles with diameters beyond those used in the respective datasetsfrom which these were each derived.
Methods that use the CPT qc value as a primary input parameter in estimating the axial capacityof piles in sand include Imperial College (IC-05) [9], University of Western Australia (UWA-05) [10],and Fugro-05 [19]. Recent CPT-based approaches consider friction fatigue and plugging effects on piles.
The ultimate capacity of a pile is the summation of the shaft and base resistance as written in thefollowing equation:
Qt = Qs + Qb = P∫
τ f dz + Ab qb (3)
where Qs is the total shaft capacity, Qb is the total base capacity, P is the pile perimeter (P = πD for acircular pile and P = 4B for a square pile), τ f is the local shaft friction at failure along the pile shaft, z is
the embedded shaft length, Ab is the base area (Ab =πD2
4 for a circular pile, and Ab = B2 for a squarepile), qb is the base resistance, which assumes a displacement of 0.1D as the failure criterion (at the pilehead for IC-05, and at the pile tip for UWA-05 and Fugro-05), and D is the pile outer diameter.

Energies 2020, 13, 3128 5 of 19
2.3.1. Shaft Capacity
The shaft capacity is formulated differently for the various CPT-based axial capacity approaches.The IC-05 approach for estimating ultimate shaft resistance is shown in the following equation:
τ f = a
0.029 b qc
(∆σ′v0
pre f
)0.13[max
(h
R∗, 8
)]−0.38
+ ∆σ′rd
tan δ f (4)
where a = 0.9 for open-ended piles in tension and 1 in all other cases, b = 0.8 for piles in tension and 1for piles in compression and R* = (R2
− Ri2)0.5 where R and Ri are the external and internal pile radius
respectively. Using this approach it is assumed that no plugging has occurred during installation.∆σ′rd is the change in radial stress experienced at the interface due to dilation.
The UWA-05 approach for estimating shaft resistance is shown as follows:
τ f =ftfc
0.03 b qc Ar,e f f0.3
[max
(hD
, 2)]−0.5
+ ∆σ′rd
tan δ f (5)
where ftfc
(ratio of tension to compression capacity) = 1 for compression and 0.75 for tension,
Ar,e f f (effective area ratio) = 1− IFR (Di/D)2 where D and Di are the external and internal pile diameter,IFR = the incremental increase in soil plug length over the pile penetration depth, ∆hplug/∆Lpile.Given that IFR data is not available prior to pile installation, it is recommended to assume IFR = PlugLength Ratio, (PLR = final plug length/penetration depth) based on experience of similar pile geometriesand sand types or to assume IFR = 1.0 if no experience is available.
The Fugro-05 approach for estimating shaft friction is defined as follows:
τ f = 0.08 qc
(σ′v0
pre f
)0.05( hR∗
)−0.9
, compression loading f or(
hR∗
)≥ 4 (6)
τ f = 0.08 qc
(σ′v0
pre f
)0.05
(4)−0.9(
h4R∗
), compression loading f or
(h
R∗
)< 4 (7)
τ f = 0.045 qc
(σ′v0
pre f
)0.15[max
(h
R∗, 4
)]−0.85
, tension loading (8)
which varies depending on what portion of the pile shaft is being analyzed, i.e., dependent on (h/R*).
2.3.2. Base Resistance
Similarly to the shaft capacity, the base resistance is formulated differently for the various axialcapacity approaches. The IC-05 approach postulates two expressions depending on whether the pile isopen or closed-ended. Furthermore, for the open-ended pile, the expression varies depending on theplugging condition, as follows:
qb0.1
qc,avg= max
[1− 0.5 log
(D
DCPT
), 0.3
], for closed ended piles (9)
If Di ≥ 2 (Dr − 0.3) or Di ≥ 0.083qc,avgPre f
DCPT, pile is unplugged (Dr is the relative density of the sand).qb0.1qc,avg
= Ar, Ar (area ratio) = 1− (Di/D)2
(10)qb0.1
qc,avg= max
[0.5− 0.25 log
(D
DCPT
), 0.15 , Ar
], pile is plugged. (11)

Energies 2020, 13, 3128 6 of 19
where qb0.1 is the base resistance corresponding to a displacement of 0.1D, qc,avg is the average CPTstress (depending on which averaging technique is adopted), DCPT is the diameter of the penetratingcone, and Ar is the area ratio.
For the UWA-05 approach, the base resistance is formulated as follows:
qb0.1
qc,avg= 0.15 + 0.45 Ar,e f f (12)
For the Fugro-05 approach it is formulated as shown here:
qb0.1
qc,avg= 8.5
( Pre f
qc,avg
)0.5
Ar0.25 (13)
2.4. Modifications to CPT-Based Axial Capacity Approaches to Predict Pile Installation
In order to account for the conditions experienced at installation, some modification to the axialcapacity approaches can be undertaken, as discussed in the following subsections.
2.4.1. Pile Ageing
The methods described previously to calculate the axial capacity of piles (IC-05, UWA-05,and Fugro-05) were each derived empirically from pile load tests conducted between 10 and 30 daysafter pile installation. Various studies suggest that shaft capacity of piles driven in sand increases withtime, a phenomenon termed ageing.
Jardine et al. [11] investigated the ageing effect in dense sand by determining Intact Ageing Curves(IAC), which indicate that the shaft capacity experienced one day after driving is approximately 70%that experienced 10–30 days after driving. Gavin et al. [15] found that ageing does not depend onwhether the piles are driven in dry or partially saturated sand with salty or fresh water, however, drivingreduced the resistance during installation, causing higher gains in capacity with time. Lehane et al. [20]collected recent pile ageing information and collated into a database, including field test data atDunkirk [11], Blessington [12] and Larvik [13]. Using this database, an equation was derived toestimate the time-variation in capacity after installation, determined as:
Ftime =1
exp(−0.1 t0.68) + 0.45+ do f f set (14)
where t is the pile age in days and doffset is the vertical offset that best fits the data points. This time factorcan be applied to determine the shaft friction expected during installation by setting the time to zero,which reveals a time factor of 0.69 can be applied to determine the shaft friction for SRD calculations.Gavin and Igoe [21] found that changes in shaft capacity caused by ageing effects on piles installedin Blessington sand were concentrated in a zone within five pile diameters of the tip. Therefore, thisreduction factor should be used with caution on long, slender piles as it may be unconservative.
2.4.2. Base Mobilization during Driving
The unit base resistance expressions postulated in the CPT-based axial capacity methods suchas UWA-05, IC-05, and Fugro-05 calculate the resistance mobilized at a pile displacement of 0.1D(outer pile diameter). During pile installation, however, the displacement per blow is expected to besignificantly less than 0.1D. The UWA-05 method considers partially plugging conditions, which arerepresented by the Final Filling Ratio (FFR) value. This suggests a potential means for consideringactual expected displacements during installation within a modified UWA-05 approach [1,16].
Byrne et al. [1] propose the implementation of a three-stage base resistance-displacement model [16]to estimate the expected base resistance mobilized during driving. Figure 2 shows an idealized baseresistance-displacement model consisting of the unit base resistance (qb) versus the pile tip displacement

Energies 2020, 13, 3128 7 of 19
(wb) normalized by pile diameter (D). The model consists of three portions: the initial settlementresponse is assumed linear until a yield strain (wby/D = 1.5%) is exceeded, and this is followed by anon-linear parabolic stage until a strain of 0.1D is achieved. An initial residual stress qb,res must beovercome prior to any movement occurring (see Section 2.4.3).
Energies 2020, 13, x FOR PEER REVIEW 7 of 19
displacement (wb) normalized by pile diameter (D). The model consists of three portions: the initial settlement response is assumed linear until a yield strain (wby/D = 1.5%) is exceeded, and this is followed by a non-linear parabolic stage until a strain of 0.1D is achieved. An initial residual stress qb,res must be overcome prior to any movement occurring (see Section 2.4.3).
Figure 2. Base resistance-settlement model [16].
The linear portion of the curve is governed by the small-strain Young’s modulus of the soil (E0), which can be obtained from Multi-Channel Analysis of Surface Waves [22] or from correlations to CPT tip resistance [23–25]. The linear portion of the curve follows: = + , for wb/D < 0.015 (15)
= 4 1 − (16)
where ν is the Poisson’s ratio, wb is the pile tip displacement (at a given blow), D is the outer pile diameter, and qb,res is the residual base resistance.
The parabolic portion of the curve wby/D < wb/D < 0.1 is modified from the original source [1,16] and approximated as a line as follows:
= − 0.015 + 0.015 + , (17)
= , − 0.015 0.085 (18)
where qb01,UWA is the unit base resistance from the UWA-05 method. The reason for approximating the parabolic portion of the curve as a line is for ease of the analysis in this paper. To modify the base resistance using the base resistance-settlement model from [16], it is anticipated that the errors introduced in this respect will be minimal. Residual base stresses associated with the action of previous hammer blows can be incorporated as a proportion of the CPT end resistance [1], as discussed in the next section.
2.4.3. Residual Base Stresses
During driving, the pile experiences compression under the action of a hammer blow, and subsequently tension under zero loading (rebounding). The tension force tends to cause some rebound to occur between hammer blows. The development of this condition can be considered as a residual base stress (qb,res) developing on the pile base area. The development of this residual base
Figure 2. Base resistance-settlement model [16].
The linear portion of the curve is governed by the small-strain Young’s modulus of the soil (E0),which can be obtained from Multi-Channel Analysis of Surface Waves [22] or from correlations to CPTtip resistance [23–25]. The linear portion of the curve follows:
qb =[k1
(wbD
)]+ qb,res for wb/D < 0.015 (15)
k1 =( 4π
)[ E0
1− v2
](16)
where ν is the Poisson’s ratio, wb is the pile tip displacement (at a given blow), D is the outer pilediameter, and qb,res is the residual base resistance.
The parabolic portion of the curve wby/D < wb/D < 0.1 is modified from the original source [1,16]and approximated as a line as follows:
qb = k2
[(wbD
)− 0.015
]+ 0.015k1 + qb,res (17)
k2 =qb01,UWA − 0.015 k1
0.085(18)
where qb01,UWA is the unit base resistance from the UWA-05 method. The reason for approximatingthe parabolic portion of the curve as a line is for ease of the analysis in this paper. To modify thebase resistance using the base resistance-settlement model from [16], it is anticipated that the errorsintroduced in this respect will be minimal. Residual base stresses associated with the action of previoushammer blows can be incorporated as a proportion of the CPT end resistance [1], as discussed in thenext section.
2.4.3. Residual Base Stresses
During driving, the pile experiences compression under the action of a hammer blow,and subsequently tension under zero loading (rebounding). The tension force tends to cause somerebound to occur between hammer blows. The development of this condition can be consideredas a residual base stress (qb,res) developing on the pile base area. The development of this residual

Energies 2020, 13, 3128 8 of 19
base stress implies that negative skin friction (τ f ,neg) must also develop along the pile shaft to ensureequilibrium between blows. Figure 3 illustrate the development of the stress condition.
Energies 2020, 13, x FOR PEER REVIEW 8 of 19
stress implies that negative skin friction ( , ) must also develop along the pile shaft to ensure equilibrium between blows. Figure 3 illustrate the development of the stress condition.
Paik et al. [26] suggest that the presence of residual base stresses does not affect the ultimate bearing capacity of piles under axial static loading since the summation of residual shaft and base resistance will equal to zero. However, qb,res must be acknowledged when considering pile driveability, since its presence alters the proportion of resistance acting at the shaft and the base, which influences the response under wave equation analyses [1]. When a hammer impacts the pile, the residual negative skin friction must first go to zero then tend towards its limiting positive value. Meanwhile, the effective stress generated at the pile base due to a hammer impact is added to the residual base resistance already present.
(a) (b)
Figure 3. The development of residual base stress during pile driving. (a) Pile in compression. (b) Residual stresses at zero pile loading.
Estimating the magnitude of residual base stress is challenging. Alawneh and Malwaki [27] propose a method to estimate the post-driving residual base stresses as a function of the pile penetration length, diameter, area, shear and Young’s modulus. This method suggests residual stresses that range between 0 and 4000 kPa. Paik et al. [26] measured residual base stresses on 0.356 m diameter closed and open-ended piles which suggests these stresses are of the order of 11–14% of CPT qc. Similarly, Byrne et al. [1] suggest residual base stresses could be of the order of 1–10% of qc. Gavin and Lehane [16] found that the residual load developed on an open-ended pile was related to the IFR values, with fully-coring piles (IFR = 100%) developing low residual loads and fully plugged piles developing higher residual loads than closed-ended piles with the same external diameter. Gavin and Igoe [21] measured the residual load on Pile S6 considered in this paper and found that the residual base stress at the end of installation was 4 MPa, ≈ 20% of the qc value at this pile tip level. This was for an IFR value of 40% which is unlikely to be developed by an open-ended pile in practice as at such a value it would be extremely difficult to continue pile driving due to high base resistances. In reality, the estimation of residual stress magnitude is quite an uncertain process, and depends on the relative relationship between the developing negative skin friction and the internal stresses in the pile, among other factors.
Figure 3. The development of residual base stress during pile driving. (a) Pile in compression.(b) Residual stresses at zero pile loading.
Paik et al. [26] suggest that the presence of residual base stresses does not affect the ultimatebearing capacity of piles under axial static loading since the summation of residual shaft and baseresistance will equal to zero. However, qb,res must be acknowledged when considering pile driveability,since its presence alters the proportion of resistance acting at the shaft and the base, which influencesthe response under wave equation analyses [1]. When a hammer impacts the pile, the residual negativeskin friction must first go to zero then tend towards its limiting positive value. Meanwhile, the effectivestress generated at the pile base due to a hammer impact is added to the residual base resistancealready present.
Estimating the magnitude of residual base stress is challenging. Alawneh and Malwaki [27]propose a method to estimate the post-driving residual base stresses as a function of the pile penetrationlength, diameter, area, shear and Young’s modulus. This method suggests residual stresses thatrange between 0 and 4000 kPa. Paik et al. [26] measured residual base stresses on 0.356 m diameterclosed and open-ended piles which suggests these stresses are of the order of 11–14% of CPT qc.Similarly, Byrne et al. [1] suggest residual base stresses could be of the order of 1–10% of qc. Gavinand Lehane [16] found that the residual load developed on an open-ended pile was related to the IFRvalues, with fully-coring piles (IFR = 100%) developing low residual loads and fully plugged pilesdeveloping higher residual loads than closed-ended piles with the same external diameter. Gavin andIgoe [21] measured the residual load on Pile S6 considered in this paper and found that the residualbase stress at the end of installation was 4 MPa, ≈ 20% of the qc value at this pile tip level. This was foran IFR value of 40% which is unlikely to be developed by an open-ended pile in practice as at such avalue it would be extremely difficult to continue pile driving due to high base resistances. In reality,the estimation of residual stress magnitude is quite an uncertain process, and depends on the relativerelationship between the developing negative skin friction and the internal stresses in the pile, amongother factors.
Energies 2020, 13, 3128 9 of 19
3. Analysis and Results
3.1. Driven Pile Database
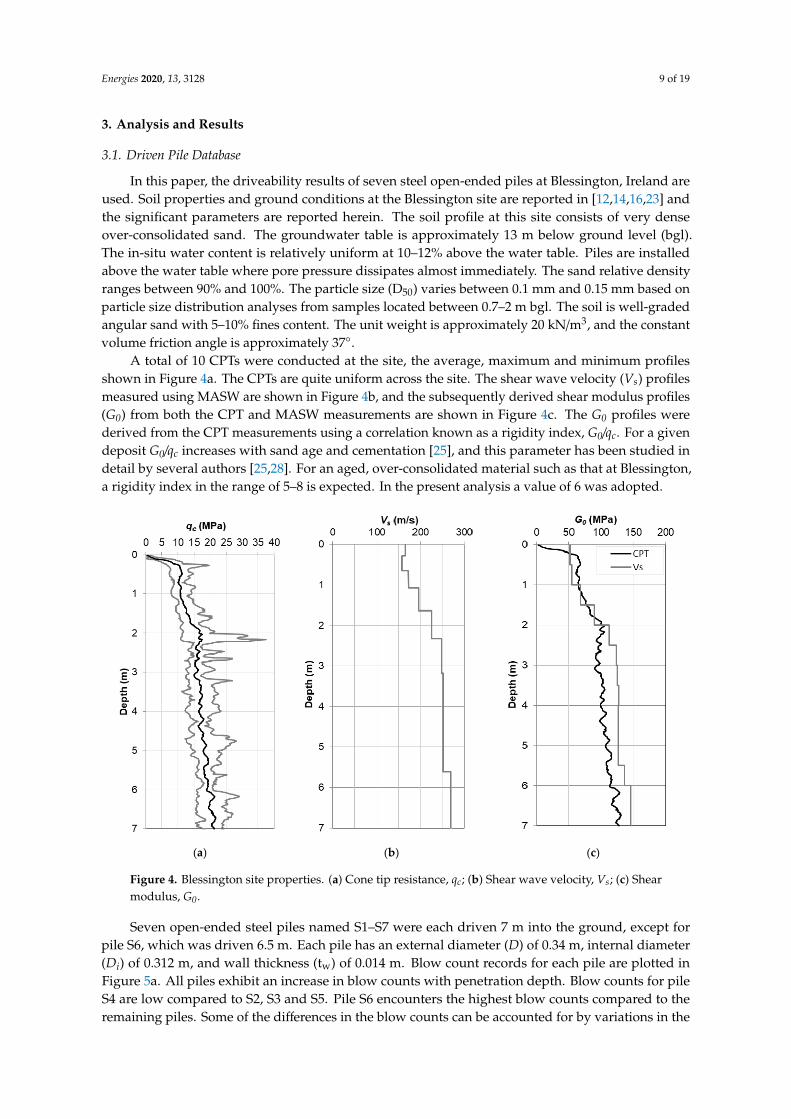
In this paper, the driveability results of seven steel open-ended piles at Blessington, Ireland areused. Soil properties and ground conditions at the Blessington site are reported in [12,14,16,23] andthe significant parameters are reported herein. The soil profile at this site consists of very denseover-consolidated sand. The groundwater table is approximately 13 m below ground level (bgl).The in-situ water content is relatively uniform at 10–12% above the water table. Piles are installedabove the water table where pore pressure dissipates almost immediately. The sand relative densityranges between 90% and 100%. The particle size (D50) varies between 0.1 mm and 0.15 mm based onparticle size distribution analyses from samples located between 0.7–2 m bgl. The soil is well-gradedangular sand with 5–10% fines content. The unit weight is approximately 20 kN/m3, and the constantvolume friction angle is approximately 37◦.
A total of 10 CPTs were conducted at the site, the average, maximum and minimum profilesshown in Figure 4a. The CPTs are quite uniform across the site. The shear wave velocity (Vs) profilesmeasured using MASW are shown in Figure 4b, and the subsequently derived shear modulus profiles(G0) from both the CPT and MASW measurements are shown in Figure 4c. The G0 profiles werederived from the CPT measurements using a correlation known as a rigidity index, G0/qc. For a givendeposit G0/qc increases with sand age and cementation [25], and this parameter has been studied indetail by several authors [25,28]. For an aged, over-consolidated material such as that at Blessington,a rigidity index in the range of 5–8 is expected. In the present analysis a value of 6 was adopted.
Energies 2020, 13, x FOR PEER REVIEW 9 of 19
3. Analysis and Results
3.1. Driven Pile Database
In this paper, the driveability results of seven steel open-ended piles at Blessington, Ireland are used. Soil properties and ground conditions at the Blessington site are reported in [12,14,16,23] and the significant parameters are reported herein. The soil profile at this site consists of very dense over-consolidated sand. The groundwater table is approximately 13 m below ground level (bgl). The in-situ water content is relatively uniform at 10–12% above the water table. Piles are installed above the water table where pore pressure dissipates almost immediately. The sand relative density ranges between 90% and 100%. The particle size (D50) varies between 0.1 mm and 0.15 mm based on particle size distribution analyses from samples located between 0.7–2 m bgl. The soil is well-graded angular sand with 5–10% fines content. The unit weight is approximately 20 kN/m3, and the constant volume friction angle is approximately 37°.
A total of 10 CPTs were conducted at the site, the average, maximum and minimum profiles shown in Figure 4a. The CPTs are quite uniform across the site. The shear wave velocity (Vs) profiles measured using MASW are shown in Figure 4b, and the subsequently derived shear modulus profiles (G0) from both the CPT and MASW measurements are shown in Figure 4c. The G0 profiles were derived from the CPT measurements using a correlation known as a rigidity index, G0/qc. For a given deposit G0/qc increases with sand age and cementation [25], and this parameter has been studied in detail by several authors [25,28]. For an aged, over-consolidated material such as that at Blessington, a rigidity index in the range of 5–8 is expected. In the present analysis a value of 6 was adopted.
(a) (b) (c)
Figure 4. Blessington site properties. (a) Cone tip resistance, qc; (b) Shear wave velocity, Vs; (c) Shear modulus, G0.
Seven open-ended steel piles named S1–S7 were each driven 7 m into the ground, except for pile S6, which was driven 6.5 m. Each pile has an external diameter (D) of 0.34 m, internal diameter (Di) of 0.312 m, and wall thickness (tw) of 0.014 m. Blow count records for each pile are plotted in Figure 5a. All piles exhibit an increase in blow counts with penetration depth. Blow counts for pile S4 are low compared to S2, S3 and S5. Pile S6 encounters the highest blow counts compared to the remaining piles. Some of the differences in the blow counts can be accounted for by variations in the properties of the driving equipment (hammer type and stroke heights). Table 1 provides information on the
Figure 4. Blessington site properties. (a) Cone tip resistance, qc; (b) Shear wave velocity, Vs; (c) Shearmodulus, G0.
Seven open-ended steel piles named S1–S7 were each driven 7 m into the ground, except forpile S6, which was driven 6.5 m. Each pile has an external diameter (D) of 0.34 m, internal diameter(Di) of 0.312 m, and wall thickness (tw) of 0.014 m. Blow count records for each pile are plotted inFigure 5a. All piles exhibit an increase in blow counts with penetration depth. Blow counts for pileS4 are low compared to S2, S3 and S5. Pile S6 encounters the highest blow counts compared to theremaining piles. Some of the differences in the blow counts can be accounted for by variations in the

Energies 2020, 13, 3128 10 of 19
properties of the driving equipment (hammer type and stroke heights). Table 1 provides informationon the hammer properties adopted to drive each pile. Piles S1–S5 and S6, S7 were driven using 4000 kgJunttan PM16 and 5000 kg Junttan PM20 hammers, respectively. Piles S1 and S2–S5 were driven withthe same constant stroke height of 0.4 m and 0.3 m accordingly. Piles S6 and S7 used a combinationof stroke heights with higher energies (e.g., drop-heights) being used for Pile S7 in order to limit theblow-counts during installation and thus protect sensitive radial stress sensors used in the ageingstudy reported by Gavin and Igoe [21].
Energies 2020, 13, x FOR PEER REVIEW 10 of 19
hammer properties adopted to drive each pile. Piles S1–S5 and S6, S7 were driven using 4000 kg Junttan PM16 and 5000 kg Junttan PM20 hammers, respectively. Piles S1 and S2–S5 were driven with the same constant stroke height of 0.4 m and 0.3 m accordingly. Piles S6 and S7 used a combination of stroke heights with higher energies (e.g., drop-heights) being used for Pile S7 in order to limit the blow-counts during installation and thus protect sensitive radial stress sensors used in the ageing study reported by Gavin and Igoe [21].
Table 1. Hammer properties used to install piles at Blessington.
Pile Name
Penetration length (m) Hammer Cushion Stroke height (m)
S1 7 4000 kg Junttan
PM16 None 0.4
S2 7 4000 kg Junttan
PM16 None 0.3
S3 7 4000 kg Junttan
PM16 None 0.3
S4 7 4000 kg Junttan
PM16 None 0.3
S5 7 4000 kg Junttan
PM16 None 0.3
S6 7 5000 kg Junttan
PM20 50 mm ash
timber 0.2 (0–4 m) & 0.35 (4–7 m)
S7 6.5 5000 kg Junttan
PM20 50 mm ash
timber 0.2–0.3 m (increment 0.025
m) Figure 5b shows the IFR measured during pile installation. All piles developed a similar IFR
profile. All piles were nearly fully coring or unplugged (IFR = 1) over the first meter of pile penetration and became partially plugged (IFR = 0.4) at the end of driving with 2.45 m final plug length. Pile S4 experienced less plugging over the final metre of penetration and had a final IFR = 0.75 at the end of driving and the longest final plug length.
(a) (b)
Figure 5. Recorded data during pile installation. (a) Blow counts; (b) IFR. Figure 5. Recorded data during pile installation. (a) Blow counts; (b) IFR.
Table 1. Hammer properties used to install piles at Blessington.
Pile Name Penetration Length (m) Hammer Cushion Stroke Height (m)
S1 7 4000 kg Junttan PM16 None 0.4S2 7 4000 kg Junttan PM16 None 0.3S3 7 4000 kg Junttan PM16 None 0.3S4 7 4000 kg Junttan PM16 None 0.3S5 7 4000 kg Junttan PM16 None 0.3S6 7 5000 kg Junttan PM20 50 mm ash timber 0.2 (0–4 m) & 0.35 (4–7 m)S7 6.5 5000 kg Junttan PM20 50 mm ash timber 0.2–0.3 m (increment 0.025 m)
Figure 5b shows the IFR measured during pile installation. All piles developed a similar IFRprofile. All piles were nearly fully coring or unplugged (IFR = 1) over the first meter of pile penetrationand became partially plugged (IFR = 0.4) at the end of driving with 2.45 m final plug length. Pile S4experienced less plugging over the final metre of penetration and had a final IFR = 0.75 at the end ofdriving and the longest final plug length.
3.2. Comparison of Unmodified CPT-Based Approaches Piles S1 and S2
In this section, the driveability data for piles S1 and S2 are compared to predictions usingunmodified CPT-based axial capacity approaches. The approaches are detailed in Section 2.3. The IC-05,UWA-05 and Fugro-05 methods are applied in their unmodified forms to derive SRD profiles for shaftand toe resistance using the average CPT profile from the site, which are subsequently input into thewave equation analysis software. The friction fatigue effect is incorporated using the pseudo-average

Energies 2020, 13, 3128 11 of 19
shaft friction as detailed in Section 2.2. For the IC-05 and Fugro-05 approaches, both unpluggedand plugged models are used to derive the base resistance since it is not possible to account forpartial plugging using these approaches (as experienced by the real piles). Analysing fully plugged orunplugged represents the extreme cases that can be considered. The hammer properties and strokeheights used on the real piles are modelled as closely as possible within the wave equation analysis toensure a fair prediction in each case. The results are shown in Figure 6a,b for pile S1 and S2, respectively.These results suggest that the IC-05 and Fugro-05 unplugged models provide a reasonable prediction(though slight under-prediction) whereas the IC-05 plugged model provides a slight over-predictionin estimated blow counts, for both S1 and S2. The UWA-05 and Fugro-05 plugged models appear toover-predict the blow counts required to install the piles. It should be noted that an over-prediction isdesireable as it is considered conservative in respect of pile driving. Even though the CPT profiles arerelatively uniform across the site, since the average profile is used in the driveability predictions, this isa potential source of some of the disparity evident.
Energies 2020, 13, x FOR PEER REVIEW 11 of 19
3.2. Comparison of Unmodified CPT-Based Approaches Piles S1 and S2
In this section, the driveability data for piles S1 and S2 are compared to predictions using unmodified CPT-based axial capacity approaches. The approaches are detailed in Section 2.3. The IC-05, UWA-05 and Fugro-05 methods are applied in their unmodified forms to derive SRD profiles for shaft and toe resistance using the average CPT profile from the site, which are subsequently input into the wave equation analysis software. The friction fatigue effect is incorporated using the pseudo-average shaft friction as detailed in Section 2.2. For the IC-05 and Fugro-05 approaches, both unplugged and plugged models are used to derive the base resistance since it is not possible to account for partial plugging using these approaches (as experienced by the real piles). Analysing fully plugged or unplugged represents the extreme cases that can be considered. The hammer properties and stroke heights used on the real piles are modelled as closely as possible within the wave equation analysis to ensure a fair prediction in each case. The results are shown in Figure 6a,b for pile S1 and S2, respectively. These results suggest that the IC-05 and Fugro-05 unplugged models provide a reasonable prediction (though slight under-prediction) whereas the IC-05 plugged model provides a slight over-prediction in estimated blow counts, for both S1 and S2. The UWA-05 and Fugro-05 plugged models appear to over-predict the blow counts required to install the piles. It should be noted that an over-prediction is desireable as it is considered conservative in respect of pile driving. Even though the CPT profiles are relatively uniform across the site, since the average profile is used in the driveability predictions, this is a potential source of some of the disparity evident.
(a) (b)
Figure 6. Predicted blow counts against recorded data for unmodified approaches. (a) Pile S1, (b) Pile S2.
3.3. Comparison of Modified CPT-Based Approaches Piles S1 and S2
In this section, the static capacity approaches from Section 2.3 are modified to account for the actual base resistance experienced during driving and the influence of pile ageing on the shaft resistance. Section 2.4 details the modifications adopted. The base resistance estimate for the UWA-05 method is updated by applying a base resistance-settlement model [16] as discussed in Section 2.4.2. During pile driving, the pile tip displacement experienced during each blow will be lower than the failure criterion typically adopted by the UWA-05 approach, 0.1D. It is therefore necessary to reduce the estimate of the acting resistance mobilized under each blow. In the present study, the actual displacements for each hammer blow are back-calculated from the blow counts recorded at
Figure 6. Predicted blow counts against recorded data for unmodified approaches. (a) Pile S1, (b) Pile S2.
3.3. Comparison of Modified CPT-Based Approaches Piles S1 and S2
In this section, the static capacity approaches from Section 2.3 are modified to account for the actualbase resistance experienced during driving and the influence of pile ageing on the shaft resistance.Section 2.4 details the modifications adopted. The base resistance estimate for the UWA-05 method isupdated by applying a base resistance-settlement model [16] as discussed in Section 2.4.2. During piledriving, the pile tip displacement experienced during each blow will be lower than the failure criteriontypically adopted by the UWA-05 approach, 0.1D. It is therefore necessary to reduce the estimate of theacting resistance mobilized under each blow. In the present study, the actual displacements for eachhammer blow are back-calculated from the blow counts recorded at Blessington. The residual basestresses are initially assumed to be zero. The results of applying the base-settlement model are shownin Figure 7 for Pile S1 and Figure 8 for Pile S2.
Figures 7 and 8 show the base resistance-settlement curves at various depths of the penetrationof piles S1 and S2, respectively. Both piles exhibit similar behavior. The initial linear portion of eachcurve is governed by Equation (16), which is modelled using the small-strain stiffness properties (E0) ofthe deposit. The base resistance value from the UWA-05 approach (qb01,UWA) is used as the limitingresistance when wb exceeds the failure criterion of 0.1D. The pile tip displacement per blow (averaged

Energies 2020, 13, 3128 12 of 19
into 0.5 m layers) and normalized by the pile diameter (wb/D) during pile driving is shown as the reddot for each layer of penetration. Almost all normalized displacements per blow in each layer (wb/D)occur at the second linearized stage of the base settlement-resistance model for both piles. wb/D valuesdecreased as the blow counts increased at deeper pile penetrations for both piles. The displacementexperienced during driving is less than the failure criterion of 0.1D except over the first 1.5 m for pileS1, and 1 m for pile S2, when the piles are fully coring (IFR = 1). The resistance mobilized exceeds theestimate due to the initial soft response (low blow counts) experienced upon initial installation.
Energies 2020, 13, x FOR PEER REVIEW 12 of 19
Blessington. The residual base stresses are initially assumed to be zero. The results of applying the base-settlement model are shown in Figure 7 for Pile S1 and Figure 8 for Pile S2.
Figures 7 and 8 show the base resistance-settlement curves at various depths of the penetration of piles S1 and S2, respectively. Both piles exhibit similar behavior. The initial linear portion of each curve is governed by Equation (16), which is modelled using the small-strain stiffness properties (E0) of the deposit. The base resistance value from the UWA-05 approach ( , ) is used as the limiting resistance when wb exceeds the failure criterion of 0.1D. The pile tip displacement per blow (averaged into 0.5 m layers) and normalized by the pile diameter (wb/D) during pile driving is shown as the red dot for each layer of penetration. Almost all normalized displacements per blow in each layer (wb/D) occur at the second linearized stage of the base settlement-resistance model for both piles. wb/D values decreased as the blow counts increased at deeper pile penetrations for both piles. The displacement experienced during driving is less than the failure criterion of 0.1D except over the first 1.5 m for pile S1, and 1 m for pile S2, when the piles are fully coring (IFR = 1). The resistance mobilized exceeds the estimate due to the initial soft response (low blow counts) experienced upon initial installation.
Figure 7. Application of base-settlement model to Pile S1.
Figure 8. Application of base-settlement model to Pile S2.
In addition to modifying the base resistance to account for the actual mobilized resistance, the influence of pile ageing on the shaft resistance is also incorporated. Based on normalized ageing curves derived from ageing studies, the shaft capacity as derived by each method is reduced to 69% of its value to account for the fact that ageing would have occurred and each of the design approaches was developed based on load tests conducted 10–30 days after installation, see Section 2.4.1. The driveability results using the modified axial static capacity approaches are shown in Figures 9a,b for
Figure 7. Application of base-settlement model to Pile S1.
Energies 2020, 13, x FOR PEER REVIEW 12 of 19
Blessington. The residual base stresses are initially assumed to be zero. The results of applying the base-settlement model are shown in Figure 7 for Pile S1 and Figure 8 for Pile S2.
Figures 7 and 8 show the base resistance-settlement curves at various depths of the penetration of piles S1 and S2, respectively. Both piles exhibit similar behavior. The initial linear portion of each curve is governed by Equation (16), which is modelled using the small-strain stiffness properties (E0) of the deposit. The base resistance value from the UWA-05 approach ( , ) is used as the limiting resistance when wb exceeds the failure criterion of 0.1D. The pile tip displacement per blow (averaged into 0.5 m layers) and normalized by the pile diameter (wb/D) during pile driving is shown as the red dot for each layer of penetration. Almost all normalized displacements per blow in each layer (wb/D) occur at the second linearized stage of the base settlement-resistance model for both piles. wb/D values decreased as the blow counts increased at deeper pile penetrations for both piles. The displacement experienced during driving is less than the failure criterion of 0.1D except over the first 1.5 m for pile S1, and 1 m for pile S2, when the piles are fully coring (IFR = 1). The resistance mobilized exceeds the estimate due to the initial soft response (low blow counts) experienced upon initial installation.
Figure 7. Application of base-settlement model to Pile S1.
Figure 8. Application of base-settlement model to Pile S2.
In addition to modifying the base resistance to account for the actual mobilized resistance, the influence of pile ageing on the shaft resistance is also incorporated. Based on normalized ageing curves derived from ageing studies, the shaft capacity as derived by each method is reduced to 69% of its value to account for the fact that ageing would have occurred and each of the design approaches was developed based on load tests conducted 10–30 days after installation, see Section 2.4.1. The driveability results using the modified axial static capacity approaches are shown in Figures 9a,b for
Figure 8. Application of base-settlement model to Pile S2.
In addition to modifying the base resistance to account for the actual mobilized resistance,the influence of pile ageing on the shaft resistance is also incorporated. Based on normalized ageingcurves derived from ageing studies, the shaft capacity as derived by each method is reduced to 69% ofits value to account for the fact that ageing would have occurred and each of the design approaches wasdeveloped based on load tests conducted 10–30 days after installation, see Section 2.4.1. The driveabilityresults using the modified axial static capacity approaches are shown in Figure 9a,b for pile S1 andS2, respectively. The IC-05 and Fugro-05 unplugged models both under-predict the blow-countsrequired to install the piles. In their unmodified form, they provided a closer estimate, as observed inFigure 6 (though still an under-prediction). The IC-05 plugged models provide a better estimate intheir modified form (Figure 9) than in their unmodified form (Figure 6). In Figure 6, the UWA-05 andFugro-05 plugged models significantly over-predicted the blow-counts, however in their modified form
Energies 2020, 13, 3128 13 of 19
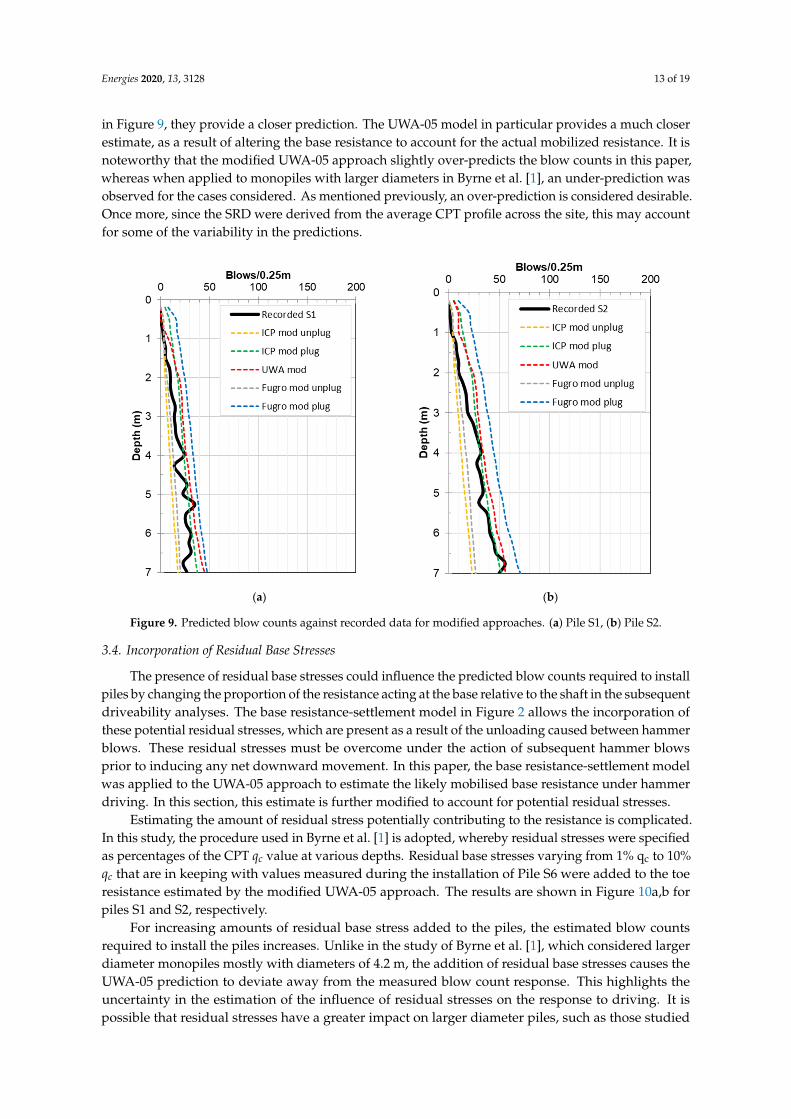
in Figure 9, they provide a closer prediction. The UWA-05 model in particular provides a much closerestimate, as a result of altering the base resistance to account for the actual mobilized resistance. It isnoteworthy that the modified UWA-05 approach slightly over-predicts the blow counts in this paper,whereas when applied to monopiles with larger diameters in Byrne et al. [1], an under-prediction wasobserved for the cases considered. As mentioned previously, an over-prediction is considered desirable.Once more, since the SRD were derived from the average CPT profile across the site, this may accountfor some of the variability in the predictions.
Energies 2020, 13, x FOR PEER REVIEW 13 of 19
pile S1 and S2, respectively. The IC-05 and Fugro-05 unplugged models both under-predict the blow-counts required to install the piles. In their unmodified form, they provided a closer estimate, as observed in Figure 6 (though still an under-prediction). The IC-05 plugged models provide a better estimate in their modified form (Figure 9) than in their unmodified form (Figure 6). In Figure 6, the UWA-05 and Fugro-05 plugged models significantly over-predicted the blow-counts, however in their modified form in Figure 9, they provide a closer prediction. The UWA-05 model in particular provides a much closer estimate, as a result of altering the base resistance to account for the actual mobilized resistance. It is noteworthy that the modified UWA-05 approach slightly over-predicts the blow counts in this paper, whereas when applied to monopiles with larger diameters in Byrne et al. [1], an under-prediction was observed for the cases considered. As mentioned previously, an over-prediction is considered desirable. Once more, since the SRD were derived from the average CPT profile across the site, this may account for some of the variability in the predictions.
(a) (b)
Figure 9. Predicted blow counts against recorded data for modified approaches. (a) Pile S1, (b) Pile S2.
3.4. Incorporation of Residual Base Stresses
The presence of residual base stresses could influence the predicted blow counts required to install piles by changing the proportion of the resistance acting at the base relative to the shaft in the subsequent driveability analyses. The base resistance-settlement model in Figure 2 allows the incorporation of these potential residual stresses, which are present as a result of the unloading caused between hammer blows. These residual stresses must be overcome under the action of subsequent hammer blows prior to inducing any net downward movement. In this paper, the base resistance-settlement model was applied to the UWA-05 approach to estimate the likely mobilised base resistance under hammer driving. In this section, this estimate is further modified to account for potential residual stresses.
Estimating the amount of residual stress potentially contributing to the resistance is complicated. In this study, the procedure used in Byrne et al. [1] is adopted, whereby residual stresses were specified as percentages of the CPT qc value at various depths. Residual base stresses varying from 1% qc to 10% qc that are in keeping with values measured during the installation of Pile S6 were added to the toe resistance estimated by the modified UWA-05 approach. The results are shown in Figure 10a,b for piles S1 and S2, respectively.
Figure 9. Predicted blow counts against recorded data for modified approaches. (a) Pile S1, (b) Pile S2.
3.4. Incorporation of Residual Base Stresses
The presence of residual base stresses could influence the predicted blow counts required to installpiles by changing the proportion of the resistance acting at the base relative to the shaft in the subsequentdriveability analyses. The base resistance-settlement model in Figure 2 allows the incorporation ofthese potential residual stresses, which are present as a result of the unloading caused between hammerblows. These residual stresses must be overcome under the action of subsequent hammer blowsprior to inducing any net downward movement. In this paper, the base resistance-settlement modelwas applied to the UWA-05 approach to estimate the likely mobilised base resistance under hammerdriving. In this section, this estimate is further modified to account for potential residual stresses.
Estimating the amount of residual stress potentially contributing to the resistance is complicated.In this study, the procedure used in Byrne et al. [1] is adopted, whereby residual stresses were specifiedas percentages of the CPT qc value at various depths. Residual base stresses varying from 1% qc to 10%qc that are in keeping with values measured during the installation of Pile S6 were added to the toeresistance estimated by the modified UWA-05 approach. The results are shown in Figure 10a,b forpiles S1 and S2, respectively.
For increasing amounts of residual base stress added to the piles, the estimated blow countsrequired to install the piles increases. Unlike in the study of Byrne et al. [1], which considered largerdiameter monopiles mostly with diameters of 4.2 m, the addition of residual base stresses causes theUWA-05 prediction to deviate away from the measured blow count response. This highlights theuncertainty in the estimation of the influence of residual stresses on the response to driving. It ispossible that residual stresses have a greater impact on larger diameter piles, such as those studied

Energies 2020, 13, 3128 14 of 19
in Byrne et al. [1], than on the pile geometries in the present study. This requires further research toinvestigate the underlying mechanisms.
Energies 2020, 13, x FOR PEER REVIEW 14 of 19
For increasing amounts of residual base stress added to the piles, the estimated blow counts required to install the piles increases. Unlike in the study of Byrne et al. [1], which considered larger diameter monopiles mostly with diameters of 4.2 m, the addition of residual base stresses causes the UWA-05 prediction to deviate away from the measured blow count response. This highlights the uncertainty in the estimation of the influence of residual stresses on the response to driving. It is possible that residual stresses have a greater impact on larger diameter piles, such as those studied in Byrne et al. [1], than on the pile geometries in the present study. This requires further research to investigate the underlying mechanisms.
(a) (b)
Figure 10. Predicted blow counts against recorded data for UWA-05 modified approach with varying residual base stresses. (a) Pile S1, (b) Pile S2.
4. Parameter Study
In this section, a parameter study is undertaken to highlight the relative importance of the parameters adopted in the wave equation analyses on the resulting predictions. The purpose of this section is to highlight the importance of accurate information to ensure that predictions are as fair as possible for proposed installations of piles.
4.1. Influence of Damping
In a driveability analysis, dynamic forces and viscous rate effects are represented by damping values. These values vary depending on soil type and in general standard values are adopted. However, this parameter can have a relatively large influence on the predicted blow counts, as demonstrated herein. For the UWA-05 method, the prescribed damping values for sand are 0.25 s/m and 0.5 s/m, respectively for skin and toe damping. Figure 11 shows the results of varying the damping values adopted for the prediction of blow counts for pile S2. Figure 11a shows the sensitivity of the prediction to variations in skin damping and Figure 11b shows the sensitivity for variations in toe damping. In both plots, the red lines represent the standard values adopted and is the same data as that presented in Figure 6b. Changes in toe damping result in a prediction of greater blows than changes in skin damping, highlighting that the dissipation of energy at the base results in a significant increase in the required blows to install a pile. This is not surprising, as the base resistance tends to govern the pile driveability as observed in the previous analyses. The effect of changing the damping parameter is not constant as the pile is driven but leads to increased predicted blow counts for deeper
Figure 10. Predicted blow counts against recorded data for UWA-05 modified approach with varyingresidual base stresses. (a) Pile S1, (b) Pile S2.
4. Parameter Study
In this section, a parameter study is undertaken to highlight the relative importance of theparameters adopted in the wave equation analyses on the resulting predictions. The purpose of thissection is to highlight the importance of accurate information to ensure that predictions are as fair aspossible for proposed installations of piles.
4.1. Influence of Damping
In a driveability analysis, dynamic forces and viscous rate effects are represented by dampingvalues. These values vary depending on soil type and in general standard values are adopted. However,this parameter can have a relatively large influence on the predicted blow counts, as demonstratedherein. For the UWA-05 method, the prescribed damping values for sand are 0.25 s/m and 0.5 s/m,respectively for skin and toe damping. Figure 11 shows the results of varying the damping valuesadopted for the prediction of blow counts for pile S2. Figure 11a shows the sensitivity of the predictionto variations in skin damping and Figure 11b shows the sensitivity for variations in toe damping.In both plots, the red lines represent the standard values adopted and is the same data as that presentedin Figure 6b. Changes in toe damping result in a prediction of greater blows than changes in skindamping, highlighting that the dissipation of energy at the base results in a significant increase inthe required blows to install a pile. This is not surprising, as the base resistance tends to govern thepile driveability as observed in the previous analyses. The effect of changing the damping parameteris not constant as the pile is driven but leads to increased predicted blow counts for deeper depths.At the final penetration (7 m), an increase of 50% in the skin and toe damping values relative totheir nominal specified values (marked as UWA on the plot legends) increases the predicted blowcounts by 16% and 22%, respectively. Generally, the blow counts and damping value are positivelycorrelated. Soil damping in the wave equation analysis represents the energy loss within the soil atthe pile-soil interface during pile driving, hence it is sensible that higher damping values lead to an

Energies 2020, 13, 3128 15 of 19
increased number of blows to install a pile. This brief study highlights the sensitivity of this parameterto obtaining accurate predictions.
Energies 2020, 13, x FOR PEER REVIEW 15 of 19
depths. At the final penetration (7 m), an increase of 50% in the skin and toe damping values relative to their nominal specified values (marked as UWA on the plot legends) increases the predicted blow counts by 16% and 22%, respectively. Generally, the blow counts and damping value are positively correlated. Soil damping in the wave equation analysis represents the energy loss within the soil at the pile-soil interface during pile driving, hence it is sensible that higher damping values lead to an increased number of blows to install a pile. This brief study highlights the sensitivity of this parameter to obtaining accurate predictions.
(a) (b)
Figure 11. Predicted blow counts for pile S2 using the UWA-05 approach with modified damping parameters. (a) modifying skin damping, (b) modifying toe damping.
4.2. Influence of Quake
Quake is the term used to describe the displacement required to achieve yield, and standard values for this parameter have been put forward for different soil types [2,5,8,29]. Increasing the quake value is equivalent to extending the soil elastic displacement range prior to yield. The quake value suggested by the UWA-05 method is 2.5 mm both for the skin and toe. Figure 12 investigates how quake values influence the predicted blow counts from the wave equation analysis. The data corresponding to unmodified UWA-05 approach applied to pile S2 is used in this analysis, similar to Section 4.1. Changes in toe quake, Figure 12b, have a lesser influence on the response than changes in the skin quake, Figure 12a. Increasing the skin and toe quake by 50% relative to their standard values as prescribed by UWA-05 results in an increase in predicted blow counts for 7 m penetration of 41.5% and 30.5% respectively.
The results of this analysis and that of changing the damping parameters in the previous section suggest that these parameters should really be obtainable based on measurable soil data, and the use of standard values is potentially misleading. Given the large change in prediction caused by changing the damping and quake, this is a potential source of significant disparity between actual pile driving records and predictions made using standard values.
Figure 11. Predicted blow counts for pile S2 using the UWA-05 approach with modified dampingparameters. (a) modifying skin damping, (b) modifying toe damping.
4.2. Influence of Quake
Quake is the term used to describe the displacement required to achieve yield, and standardvalues for this parameter have been put forward for different soil types [2,5,8,29]. Increasing thequake value is equivalent to extending the soil elastic displacement range prior to yield. The quakevalue suggested by the UWA-05 method is 2.5 mm both for the skin and toe. Figure 12 investigateshow quake values influence the predicted blow counts from the wave equation analysis. The datacorresponding to unmodified UWA-05 approach applied to pile S2 is used in this analysis, similar toSection 4.1. Changes in toe quake, Figure 12b, have a lesser influence on the response than changes inthe skin quake, Figure 12a. Increasing the skin and toe quake by 50% relative to their standard valuesas prescribed by UWA-05 results in an increase in predicted blow counts for 7 m penetration of 41.5%and 30.5% respectively.
The results of this analysis and that of changing the damping parameters in the previous sectionsuggest that these parameters should really be obtainable based on measurable soil data, and the useof standard values is potentially misleading. Given the large change in prediction caused by changingthe damping and quake, this is a potential source of significant disparity between actual pile drivingrecords and predictions made using standard values.

Energies 2020, 13, 3128 16 of 19Energies 2020, 13, x FOR PEER REVIEW 16 of 19
(a) (b)
Figure 12. Predicted blow counts for pile S2 using the UWA-05 approach with modified quake values. (a) modifying skin quake, (b) modifying toe quake.
4.3. Influence of Stroke Height and Hammer Efficiency
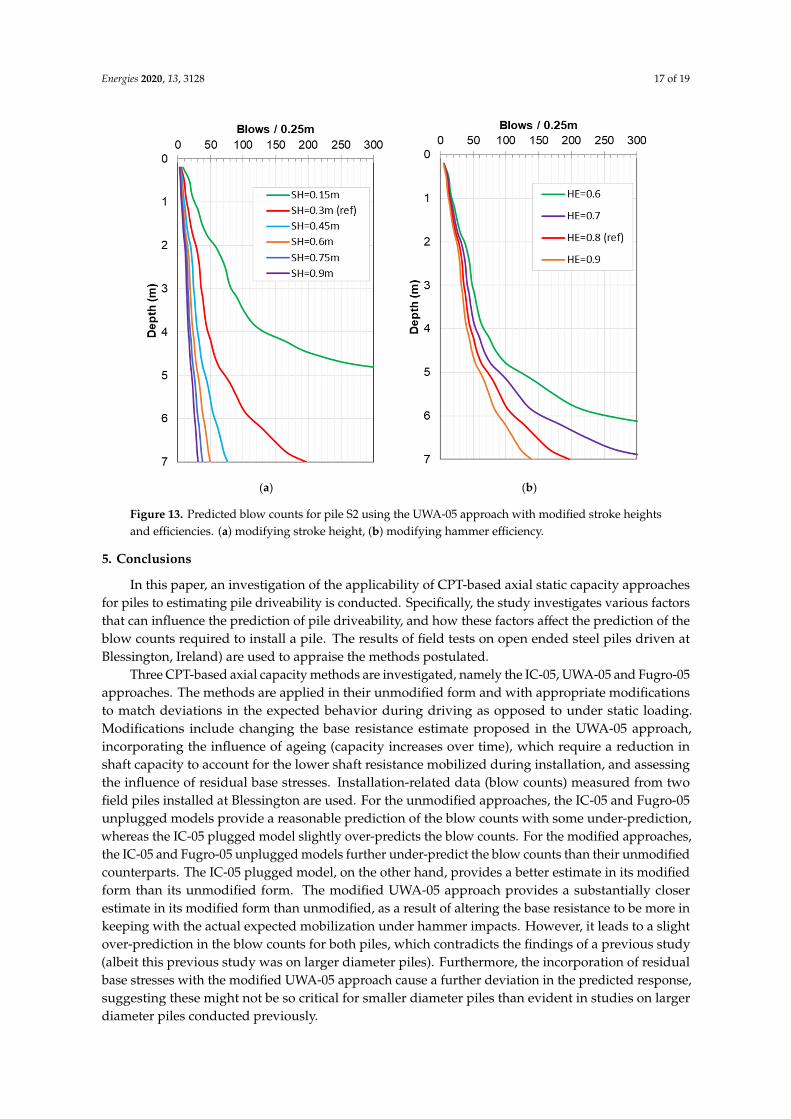
The height of hammer stroke influences the energy applied to drive a pile, and therefore has an impact on predicted blow counts required to drive a pile. Figure 13 shows the blow counts/0.25 m resulting from varying the hammer stroke height for the analysis using the unmodified UWA-05 approach applied to pile S2. Increasing the stroke height decreases the predicted blows required to install the pile. The estimated blow counts at the final pile penetration decreases by 61% when the hammer stroke height is increased from the value used (0.3 m) by 50% to 0.45 m. This suggests a significant sensitivity to the stroke height used and highlights the importance of accurately measuring this parameter on site to ensure the predictions made are sensible and reasonable. Other changes in stroke height and their influence on the predicted results can be seen in Figure 13a. It is important to note that installing a pile with excessive energy can lead to pile damage, whereas driving a pile using a low stroke height can lead to premature refusal. Pile stresses should be explicitly analyzed when proposing changes to hammer stroke height.
Hammer efficiency accounts for the energy losses that cannot be calculated directly during the pile driving process. The standard value of the hammer efficiency depends on the type of hammer adopted. The installation of pile S2 at the Blessington site used a hydraulic impact hammer, which has an efficiency value of 0.8 according to the recommendations of the pile driveability analysis software manual [18]. Figure 13b shows that increasing hammer efficiency results in lower predicted blow counts required to install a pile. This mainly influences the predicted blow counts at depth where differences in efficiency have a larger influence on the predicted results overall. A 10% reduction in efficiency (from 80% to 70%) results in a 76% increase in the predicted blow counts required at a penetration depth of 7 m. Changes in hammer efficiently have the largest influence on the results out of the various parameters investigated in this section, highlighting the paramount importance of accurately estimating this parameter.
Figure 12. Predicted blow counts for pile S2 using the UWA-05 approach with modified quake values.(a) modifying skin quake, (b) modifying toe quake.
4.3. Influence of Stroke Height and Hammer Efficiency
The height of hammer stroke influences the energy applied to drive a pile, and therefore has animpact on predicted blow counts required to drive a pile. Figure 13 shows the blow counts/0.25 mresulting from varying the hammer stroke height for the analysis using the unmodified UWA-05approach applied to pile S2. Increasing the stroke height decreases the predicted blows required toinstall the pile. The estimated blow counts at the final pile penetration decreases by 61% when thehammer stroke height is increased from the value used (0.3 m) by 50% to 0.45 m. This suggests asignificant sensitivity to the stroke height used and highlights the importance of accurately measuringthis parameter on site to ensure the predictions made are sensible and reasonable. Other changes instroke height and their influence on the predicted results can be seen in Figure 13a. It is important tonote that installing a pile with excessive energy can lead to pile damage, whereas driving a pile usinga low stroke height can lead to premature refusal. Pile stresses should be explicitly analyzed whenproposing changes to hammer stroke height.
Hammer efficiency accounts for the energy losses that cannot be calculated directly during thepile driving process. The standard value of the hammer efficiency depends on the type of hammeradopted. The installation of pile S2 at the Blessington site used a hydraulic impact hammer, which hasan efficiency value of 0.8 according to the recommendations of the pile driveability analysis softwaremanual [18]. Figure 13b shows that increasing hammer efficiency results in lower predicted blowcounts required to install a pile. This mainly influences the predicted blow counts at depth wheredifferences in efficiency have a larger influence on the predicted results overall. A 10% reductionin efficiency (from 80% to 70%) results in a 76% increase in the predicted blow counts required at apenetration depth of 7 m. Changes in hammer efficiently have the largest influence on the resultsout of the various parameters investigated in this section, highlighting the paramount importance ofaccurately estimating this parameter.
Energies 2020, 13, 3128 17 of 19Energies 2020, 13, x FOR PEER REVIEW 17 of 19
(a) (b)
Figure 13. Predicted blow counts for pile S2 using the UWA-05 approach with modified stroke heights and efficiencies. (a) modifying stroke height, (b) modifying hammer efficiency.
5. Conclusions
In this paper, an investigation of the applicability of CPT-based axial static capacity approaches for piles to estimating pile driveability is conducted. Specifically, the study investigates various factors that can influence the prediction of pile driveability, and how these factors affect the prediction of the blow counts required to install a pile. The results of field tests on open ended steel piles driven at Blessington, Ireland) are used to appraise the methods postulated.
Three CPT-based axial capacity methods are investigated, namely the IC-05, UWA-05 and Fugro-05 approaches. The methods are applied in their unmodified form and with appropriate modifications to match deviations in the expected behavior during driving as opposed to under static loading. Modifications include changing the base resistance estimate proposed in the UWA-05 approach, incorporating the influence of ageing (capacity increases over time), which require a reduction in shaft capacity to account for the lower shaft resistance mobilized during installation, and assessing the influence of residual base stresses. Installation-related data (blow counts) measured from two field piles installed at Blessington are used. For the unmodified approaches, the IC-05 and Fugro-05 unplugged models provide a reasonable prediction of the blow counts with some under-prediction, whereas the IC-05 plugged model slightly over-predicts the blow counts. For the modified approaches, the IC-05 and Fugro-05 unplugged models further under-predict the blow counts than their unmodified counterparts. The IC-05 plugged model, on the other hand, provides a better estimate in its modified form than its unmodified form. The modified UWA-05 approach provides a substantially closer estimate in its modified form than unmodified, as a result of altering the base resistance to be more in keeping with the actual expected mobilization under hammer impacts. However, it leads to a slight over-prediction in the blow counts for both piles, which contradicts the findings of a previous study (albeit this previous study was on larger diameter piles). Furthermore, the incorporation of residual base stresses with the modified UWA-05 approach cause a further deviation in the predicted response, suggesting these might not be so critical for smaller diameter piles than evident in studies on larger diameter piles conducted previously.
Figure 13. Predicted blow counts for pile S2 using the UWA-05 approach with modified stroke heightsand efficiencies. (a) modifying stroke height, (b) modifying hammer efficiency.
5. Conclusions
In this paper, an investigation of the applicability of CPT-based axial static capacity approachesfor piles to estimating pile driveability is conducted. Specifically, the study investigates various factorsthat can influence the prediction of pile driveability, and how these factors affect the prediction of theblow counts required to install a pile. The results of field tests on open ended steel piles driven atBlessington, Ireland) are used to appraise the methods postulated.
Three CPT-based axial capacity methods are investigated, namely the IC-05, UWA-05 and Fugro-05approaches. The methods are applied in their unmodified form and with appropriate modificationsto match deviations in the expected behavior during driving as opposed to under static loading.Modifications include changing the base resistance estimate proposed in the UWA-05 approach,incorporating the influence of ageing (capacity increases over time), which require a reduction inshaft capacity to account for the lower shaft resistance mobilized during installation, and assessingthe influence of residual base stresses. Installation-related data (blow counts) measured from twofield piles installed at Blessington are used. For the unmodified approaches, the IC-05 and Fugro-05unplugged models provide a reasonable prediction of the blow counts with some under-prediction,whereas the IC-05 plugged model slightly over-predicts the blow counts. For the modified approaches,the IC-05 and Fugro-05 unplugged models further under-predict the blow counts than their unmodifiedcounterparts. The IC-05 plugged model, on the other hand, provides a better estimate in its modifiedform than its unmodified form. The modified UWA-05 approach provides a substantially closerestimate in its modified form than unmodified, as a result of altering the base resistance to be more inkeeping with the actual expected mobilization under hammer impacts. However, it leads to a slightover-prediction in the blow counts for both piles, which contradicts the findings of a previous study(albeit this previous study was on larger diameter piles). Furthermore, the incorporation of residualbase stresses with the modified UWA-05 approach cause a further deviation in the predicted response,suggesting these might not be so critical for smaller diameter piles than evident in studies on largerdiameter piles conducted previously.

Energies 2020, 13, 3128 18 of 19
Finally, a parametric study is conducted where the parameters used in the wave equation analysisare varied to assess their relative influence on predicted blow counts. The data from the unmodifiedUWA-05 prediction for pile S2 are used and the quake, damping, stroke height and hammer efficiencyparameters are varied. Results suggest that hammer efficiency has the largest influence on thepredicted results highlighting the importance of accurate characterization of this information for use indriveability analyses.
The present study has investigated the various acting components contributing to pile driveabilityanalyses, and has highlighted the complex and inter-related nature of the various parameters governingthe predicted response. The eventual goal could be to derive a pile driveability approach based directlyon an empirical correction to CPT data, without the requirement for estimating residual stresses,damping and quake data, or even without the need to undertake a wave equation analysis. It isanticipated that this would be a significant challenge, however it would solve the issue that, at present,there are potentially too many variables contributing to the response. The ability to obtain a fairestimate of pile driveability remains a challenge.
Author Contributions: Conceptualization, K.G.; methodology, L.J.P.; software, P.G.; validation, P.G., K.G. and L.J.P.;formal analysis, P.G.; investigation, P.G., K.G. and L.J.P.; resources, K.G.; data curation, K.G.; writing—originaldraft preparation, L.J.P. and P.G.; writing—review and editing, K.G.; visualization, P.G.; supervision, L.J.P. andK.G.; project administration, K.G.; funding acquisition, K.G. All authors have read and agreed to the publishedversion of the manuscript.
Funding: This research received no external funding.
Acknowledgments: Gandina’s work is a development of the earlier work by Tiernan Byrne whose contribution isacknowledged together with members of the Geotechnical Research Group formerly at University College Dublinfor testing, data acquisition, software and organization. The first author wishes to acknowledge the Faculty ofEngineering, University of Nottingham, for travel funding to enable this collaboration.
Conflicts of Interest: The authors declare no conflict of interest.
References
1. Byrne, T.; Gavin, K.; Prendergast, L.J.; Cachim, P.; Doherty, P.; Pulukul, S.C. Performance of CPT-basedmethods to assess monopile driveability in North Sea sands. Ocean Eng. 2018, 166, 76–91. [CrossRef]
2. Schneider, J.; Harmon, I. Analyzing drivability of open ended piles in very dense sands. J. Deep. Found. Inst.2010, 4, 32–44. [CrossRef]
3. Wu, W.H.; Prendergast, L.J.; Gavin, K. An iterative method to infer distributed mass and stiffness profilesfor use in reference dynamic beam-Winkler models of foundation piles from frequency response functions.J. Sound Vib. 2018, 431, 1–19. [CrossRef]
4. Prendergast, L.J.; Wu, W.H.; Gavin, K. Experimental application of FRF-based model updating approach toestimate soil mass and stiffness mobilised under pile impact tests. Soil Dyn. Earthq. Eng. 2019, 123, 1–15.[CrossRef]
5. Stevens, R.; Wiltsie, E.; Turton, T. Evaluating drivability for hard clay, very dense sand, and rock.In Proceedings of the Offshore Technology Conference, Houston, TX, USA, 3–6 May 1982.
6. Toolan, F.E.; Fox, D.A. Geotechnical planning of piled foundations for offshore platforms. Proc. Inst. Civ. Eng.1977, 62, 221–244. [CrossRef]
7. Semple, R.; Gemeinhardt, J. Stress history approach to analysis of soil resistance to pile driving. In Proceedingsof the Offshore Technology Conference, Houston, TX, USA, 4–7 May 1981.
8. Alm, T.; Hamre, L. Soil model for pile driveability predictions based on CPT interpretations. In Proceedingsof the International Conference on Soil Mechanics and Geotechnical Engineering, Istanbul, Turkey,27–31 August 2001; pp. 1297–1302.
9. Jardine, R.J.; Chow, F.C.; Overy, R.F.; Standing, J. ICP Design Methods for Driven Piles in Sands and Clays;Institution of Civil Engineering (ICE): London, UK, 2005.
10. Lehane, B.; Schneider, J.; Xu, X. The UWA-05 method for prediction of axial capacity of driven piles insand. In Proceedings of the International Symposium on Frontiers in Offshore Geotechnics, Perth, Australia,19 September 2005.
Energies 2020, 13, 3128 19 of 19
11. Jardine, R.; Standing, J.; Chow, F. Some observations of the effects of time on the capacity of piles driven insand. Geotechnique 2006, 55, 227–244. [CrossRef]
12. Gavin, K.; Kirwan, L.; Igoe, D. The effect of ageing on the axial capacity of piles in sand. Proc. Inst. Civ. Eng.Geotech. Eng. 2013, 166, 122–130. [CrossRef]
13. Karlsrud, K.; Jensen, T.G.; Lied, E.K.W.; Nowacki, F.; Simonsen, A.S. Significant ageing effects for axiallyloaded piles in sand and clay verified by new field load tests. In Proceedings of the Offshore TechnologyConference, Houston, Texas, USA, 5–8 May 2014.
14. Kirwan, L. Investigation into Ageing Mechanisms for Axially Loaded Piles in Sand. Ph.D. Thesis, UniversityCollege Dublin, Dublin, Ireland, 2015.
15. Gavin, K.; Jardine, R.J.; Karlsrud, K.; Lehane, B.M. The effects of pile ageing on the shaft capacity of offshorepiles in sand. In Proceedings of the International Symposium Frontiers in Offshore Geotechnics (ISFOG),Oslo, Norway, 10–12 June 2015.
16. Gavin, K.; Lehane, B. Base load–displacement response of piles in sand. Can. Geotech. J. 2007, 44, 1053–1063.[CrossRef]
17. Xu, X. Investigation of the End Bearing Performance of Displacement Piles in Sand. Ph.D. Thesis,The University of Western Australia, Perth, Western Australia, Australia, 2007.
18. Pile Dynamics GRLWEAP Software Brochure. 2010. Available online: http://www.pile.com/wp-content/uploads/2020/05/PDI-GRLWEAP-Brochure.pdf (accessed on 1 June 2020).
19. Kolk, H.J.; Baaijens, A.E.; Senders, M. Design criteria for pipe piles in silica sands. In Proceedings of the FirstInternational Symposium on Frontiers in Offshore Geotechnics, Perth, Australia, 19 September 2005.
20. Lehane, B.M.; Lim, J.K.; Carotenuto, P.; Nadim, F.; Lacasse, S.; Jardine, R.; van Dijk, B.F.J. Characteristicsof Unified Databases for Driven piles. In Proceedings of the 8th International Conference of Offshore SiteInvestigation and Geotechnics OSIG, London, UK, 12–14 September 2017.
21. Gavin, K.; Igoe, D. A field investigation into the mechanisms of pile ageing in sand. Geotechnique 2019.[CrossRef]
22. Donohue, S.; Long, M.; Gavin, K.; O’Connor, P. Shear wave stiffness of Irish glacial till. In Proceedings of theInternational Conference of Site Characterisation ISC-2, Porto, Portugal, 19–22 September 2004; pp. 459–466.
23. Prendergast, L.J.; Hester, D.; Gavin, K.; O’Sullivan, J.J. An investigation of the changes in the naturalfrequency of a pile affected by scour. J. Sound Vib. 2013, 332, 6685–6702. [CrossRef]
24. Robertson, P. Soil classification using the cone penetration test. Can. Geotech. J. 1990, 27, 151–158. [CrossRef]25. Schnaid, F.; Lehane, B.M.; Fahey, M. In situ test characterisation of unusual geomaterials. In Proceedings of
the International Conference of Site Characterisation, Porto, Portugal, 19–22 September 2004; pp. 49–73.26. Paik, K.; Salgado, R.; Lee, J.; Kim, B. Behavior of open- and closed-ended piles driven into sands. J. Geotech.
Geoenviron. Eng. 2003, 296–306. [CrossRef]27. Alawneh, A.S.; Malkawi, A.I.H. Estimation of post-driving residual stresses along driven piles in sand.
Geotech. Test. J. 2000, 23, 313–326.28. Lunne, T.; Robertson, P.K.; Powell, J.J.M. Cone Penetration Testing in Geotechnical Practice; Blackie Academic
and Professional: London, UK, 1997.29. Hirsch, T.J.; Carr, L.; Lowery, L.L. Pile driving analysis-wave equation user manual. In TTI Programme -Final
Report; Federal Highway Administration (FHWA): Washington, DC, USA, 1976; Volume I–IV.
© 2020 by the authors. Licensee MDPI, Basel, Switzerland. This article is an open accessarticle distributed under the terms and conditions of the Creative Commons Attribution(CC BY) license (http://creativecommons.org/licenses/by/4.0/).