delft university of technology biliverdin-copper complex
TRANSCRIPT

Delft University of Technology
Biliverdin-copper complex at physiological pH
Dimitrijević, Milena S.; Bogdanović Pristov, Jelena; Žižić, Milan; Stanković, Dalibor M.; Bajuk-Bogdanović,Danica; Stanić, Marina; Spasić, Snežana; Hagen, Wilfred; Spasojević, IvanDOI10.1039/c8dt04724cPublication date2019Document VersionAccepted author manuscriptPublished inDalton Transactions
Citation (APA)Dimitrijević, M. S., Bogdanović Pristov, J., Žižić, M., Stanković, D. M., Bajuk-Bogdanović, D., Stanić, M.,Spasić, S., Hagen, W., & Spasojević, I. (2019). Biliverdin-copper complex at physiological pH. DaltonTransactions, 48(18), 6061-6070. https://doi.org/10.1039/c8dt04724c
Important noteTo cite this publication, please use the final published version (if applicable).Please check the document version above.
CopyrightOther than for strictly personal use, it is not permitted to download, forward or distribute the text or part of it, without the consentof the author(s) and/or copyright holder(s), unless the work is under an open content license such as Creative Commons.
Takedown policyPlease contact us and provide details if you believe this document breaches copyrights.We will remove access to the work immediately and investigate your claim.
This work is downloaded from Delft University of Technology.For technical reasons the number of authors shown on this cover page is limited to a maximum of 10.

Biliverdin-copper complex at physiological pH
Milena Dimitrijević,1 Jelena Bogdanović Pristov,1 Milan Žižić,1 Dalibor M. Stanković,2,3 Danica
Bajuk-Bogdanović,4 Marina Stanić,1 Snežana Spasić,3 Wilfred Hagen,5 Ivan Spasojević1*
1Institute for Multidisciplinary Research, University of Belgrade, Kneza Višeslava 1, 11030
Belgrade, Serbia 2 The Vinča Institute of Nuclear Sciences, University of Belgrade, POB 522, 11001
Belgrade, Serbia 3Innovation Center of the Faculty of Chemistry, University of Belgrade, Studentski trg 12-16,
11158 Belgrade, Serbia 4Faculty of Physical Chemistry, University of Belgrade, Studentski trg 12-16, 11158 Belgrade,
Serbia 5Department of Biotechnology, Delft University of Technology, Van der Maasweg 9, 2629HZ
Delft, The Netherlands
*Corresponding author: Ivan Spasojević
E-mail: : [email protected]
1

Abstract
Biliverdin (BV), a product of heme catabolism, is known to interact with transition metals, but
the details of such interactions under physiological conditions are scarce. Herein, we examined
coordinate/redox interactions of BV with Cu2+ in phosphate buffer at pH 7.4, using
spectrophotometry, ESI-MS, Raman spectroscopy, 1H NMR, EPR, fluorimetry, and
electrochemical methods. BV formed a stable coordination complex with copper in 1:1
stoichiometry. The structure of BV was more planar and energetically stable in the complex. The
complex showed strong paramagnetic effects that were attributed to an unpaired delocalized e-.
The delocalized unpaired electron most likely comes from BV, so the complex is formally
composed of BV radical cation and Cu1+. The complex underwent oxidation only in the presence
of both O2 and an excess of Cu2+, or by a strong oxidizing agent, and it was resistant to reducing
agents. The biological effects of the stable BV metallocomplex containing a delocalized electron
should be further examined, and may provide an answer to the long-standing question of high
energy investment in the catabolism of BV, which represents a relatively harmless molecule per
se.
2

Introduction
Heme, iron protoporphyrin IX complex, is released from hemoglobin in senescent and impaired
erythrocytes.3 It is further subjected to enzymatic degradation to biliverdin (BV) that is rapidly
converted to bilirubin by BV reductase. It is still not clear why physiologically harmless BV,
which may be easily excreted without conjugation,4 requires energetically expensive two-
electron reduction to potentially toxic bilirubin.5 A potential explanation may reside in the
coordinate and/or redox interactions of BV with copper and other physiologically-relevant
metals, which have been extensively studied by the Balch’s group and others [2, Nguyen, Balch
1993, Balch 1994, Balch 1992, Spasojevic 2001]. However, the interactions of BV with copper
ions have not been examined using physiological settings. Previous studies have preformed the
synthesis/analysis of BV-copper complexes in organic solvents,2,6 in aqueous medium at a very
high pH,6-7 or using Tris buffer,8 which shows high affinity for Cu2+ and may interfere with the
interactions with BV.9
In the present study we applied spectroscopic, (para)magnetic resonance, and electrochemical
methods to elucidate the structure and redox properties of complex of BV with copper ions under
physiological conditions using phosphate buffer at pH 7.4. Our results imply the formation of a
BV radical – copper complex containing a delocalized unpaired electron.
Experimental section
Chemicals
All chemicals were of analytical grade: BV, buffer components, dimethyl sulfoxide (DMSO),
DMSO-d6 (deuterated DMSO, 99.9 % D atom), D2O (99.9 % D atom), and urea were purchased
from Sigma-Aldrich (St. Louis, MO, USA); CuCl2 was from Merck (Kenilworth, NJ, USA);
solvents for MS (acetonitrile, formic acid; LC–MS grade) were obtained from Fisher Scientific
(Loughborough, UK). All experiments were performed using bidistilled deionized water (18
MΩ) that was obtained by reagent grade water system (Millipore, Billerica, USA). Stock
solutions of BV - 20 mM in DMSO for experiments with high final concentrations (NMR,
Raman, CV) or 1 mM in 5 mM NaOH for all other experiments were prepared daily and kept on
ice in the dark. Phosphate buffer - 50mM K2HPO4 with pH adjusted to 7.4 with KOH, was
prepared daily.
UV-VIS spectroscopy 3

UV-Vis absorption spectra were obtained using a 2501 PC Shimadzu spectrophotometer (Kyoto,
Japan). Sample volume was 1 mL. Scan time was 50 s. Samples were freshly prepared and
immediately scanned at wavelengths from 800 to 200 nm at room T. Changes of spectra were
monitored for 60 min. Each system was prepared in light-protected glass and stirred. Aliquots
were measured and discarded for each time-point, since we noted that irradiation during the
collection of UV-Vis spectra may result in BV degradation.
ESI-MS spectrometry
MS analysis was performed using a TSQ Quantum Access Max mass spectrometer equipped
with a HESI source, which was used with ion source settings as follows: spray voltage, 3500 V;
sheath gas, N2; pressure, 30 AU; ion sweep gas pressure, 3 AU; auxiliary gas (N2) pressure, 10
AU; vaporizer temperature, 450°C; capillary temperature, 380°C; skimmer offset, 0 V. Multiple
mass spectrometric data were acquired in positive mode, including full scanning in m/z range
from 100 to 1000 (FS) for qualitative analysis and product ion scanning (PIS) mode for the
quantitative analysis. Collision–induced fragmentation experiments were performed using Ar as
the collision gas, with collision energy set at 5 eV. SRM experiments for quantitative analysis
was performed using two MS2 fragments for each compound, which were previously defined as
dominant in PIS experiments. Standard calibration curves were generated using equal–weighted
linear regression and external standard method for quantification of each compound. Samples
were introduced into the mass spectrometer with a syringe pump and continuous flow injection
for a period of 5 min at a flow rate of 5.0 μL/min. Analyst version 1.4 of Xcalibur software
(Thermo Fisher Scientific, Bremen, Germany) was used for data acquisition and processing.
Raman spectroscopy
The Raman spectra of sample solutions were recorded on a Thermo DXR Raman microscope
(Thermo Fisher Scientific, Waltham, MA, USA). Aliquots of 5 μL os sample were placed on the
Raman grade calcium fluoride holder following the adjustment and stabilization of pH of the
solution and 5 min incubation period, and Raman spectra were recorded. The 532 nm laser
excitation line was used, with the following settings: exposure time, 10 s; number of exposures,
10; grating, 900 lines/mm; pinhole, 50 μm; laser power at the sample, 2 MW.
Fluorescence Spectroscopy
Fluorescence spectra were acquired using a Fluorolog FL3-221 with a 450 mW Xe lamp (Jobin
Yvon Horiba, Paris, France), and FluorEssence 3.5 software (Horiba Scientific, Kyoto, Japan), 4

and the following settings: excitation range, 320–400 nm; emission range, 400–600 nm;
increment, 2 nm; slit (band pass), 3 nm for establishing excitation and emission spectra, and 1
nm for acquiring emission spectra at 293 K and 328 K, and emission spectra in the presence of
urea (5 M). Emission detector signal was scaled by reference quantum counter signal (S1/R1).
Lifetime was calculated from fluorescence decay profile which was established using excitation
nano-led diode (380 nm). The emission was detected at 470 nm and 480 nm for BV and BV/Cu
system, respectively. The decay was fitted using 3 exponentials. Relative quantum yield was
determined from emission and excitation spectra using FluorEssence 3.5 software. 1H NMR Spectroscopy 1H NMR spectra of BV (300 μM) in the absence or in the presence of CuCl2 (300 μM) were
recorded on a Bruker Avance III 500 spectrometer with TopSpin v3.2 interface, using 5 mm
BBO probe-head, at 298 K. All samples (and solutions) were prepared in D2O and placed in 5-
mm quartz tubes. Residual HDO signal at 4.7 ppm was used as chemical shift reference. Spectra
were analyzed in MestReNova 12.0.1 (Mestrelab Research, Santiago de Compostela, Spain).
EPR Spectroscopy
Perpendicular-mode EPR spectra at 30 K were recorded on a Bruker Elexsys-II EPR
spectrometer operating at X-band (9.616 GHz), using the following conditions: power, 32 dB;
modulation amplitude, 0.8 mT; modulation frequency, 100 kHz. Parallel-mode signals were
obtained at 25.5 K, using a Bruker EMXplus spectrometer operating at X-band (9.272 GHz) with
the dual-mode cavity, and the following settings: power, 16 or 32 dB; modulation amplitude, 1
mT; modulation frequency, 20 kHz. Samples were placed in quartz EPR tubes and quickly
frozen in cold isopentane following 5 min incubation period under anaerobic conditions. All
spectra were non-saturated and baseline corrected. Measurements at room T were conducted on a
Varian E104 operating at X-band (9.51 GHz), using the following settings: microwave power, 20
mW; modulation amplitude, 0.2 mT; modulation frequency, 100 kHz. Spectra were obtained
under aerobic conditions. The simulation of the room T EPR spectrum was performed in
WINEPR SimFonia software (Bruker Analytische Messtechnik GmbH, Darmstadt, Germany),
using previously described parameters [Peeks].
Oximetry
Concentration of O2 in samples was measured/monitored using a Clark type oxygen electrode
(Hansatech Instruments Ltd., King's Lynn, UK) operating with Lab Pro interface and Logger Pro 5
3 software (Vernier, Beaverton, OR, USA). All systems were recorded for 2-5 min before the
addition of Cu to establish the stability of baseline and zero rate of O2 change at room T.
Cyclic voltammetry and differential pulse voltammetry
The voltammetric measurements were performed using a potentiostat/galvanostat CHI 760b (CH
Instruments, Inc, Austin, TX, USA). The electrochemical cell (total volume of 3 mL) was
equipped with a boron-doped diamond electrode (surface area 7.07 mm2; Windsor Scientific
LTD, UK; declared performances: resistivity, 0.075 Ω cm; boron doping level, 1000 ppm), as the
working electrode, an Ag/AgCl (3M KCl) and platinum wire as reference and counter electrode,
respectively. All potentials reported in this paper are referred versus this electrode. Scan rate was
0.1 V/s. Differential pulse voltammetry was performed on the same instrument using the
following settings: initial E, -1 V; final E, 1 V; increment, 0.004 V; amplitude, 0.05 V; pulse
width, 0.05 s; sample width, 0.01 s; quiet time, 2 s. Measurements were initiated immediately
after sample preparation and performed at room T.
Results and discussion
UV-Vis spectrophotometry was applied to investigate formation/degradation of complex of BV
with copper ions at pH 7.4 (Fig. 1). BV showed bands with λmax at 315 nm (non-restricted open-
chain bilatriens), 375 nm (Soret-like band), and 670 nm (transitions in C═C and C═N
systems).10 Different [BV]/[Cu2+] concentration ratios were applied to evaluate the stoichiometry
(Fig. 1a). At [BV]/[Cu2+] = 2, an immediate decrease in the intensity of the λ670 absorption band
was observed. At [BV]/[Cu2+] = 1, the λ670 band was absent, whereas the λ375 peak was shifted to
400 nm. The spectrum for [BV]/[Cu2+] = 2 corresponded to the sum of the experimental spectra
for [BV]/[Cu2+] = 1 and BV. The signal in the presence of an excess of Cu2+ ([BV]/[Cu2+] = 0.5)
was similar to the [BV]/[Cu2+] = 1 system. Altogether, this implies that BV interacted with Cu2+
in 1:1 stoichiometry, which was further confirmed by titration (Fig. 1e). The reaction was over
within 5 min and all signals were stable under anaerobic conditions for at least one hour. The
[BV]/[Cu2+] = 2 system was also stable in the presence of O2 (Fig. 1b), which implies that the
complex is not susceptible to oxidation by O2 per se. On the other hand, signals for [BV]/[Cu2+]
= 1 and [BV]/[Cu2+] = 0.5 systems showed a decay with time under aerobic settings (Fig. 1c, d).
The decrease was more pronounced for the latter. It appears that the complex undergoes
oxidation/degradation only in the presence of both O2 and ‘free’ Cu2+. The latter is present in 6

traces for the [BV]/[Cu2+] = 1 system, and in excess for [BV]/[Cu2+] = 0.5. In the [BV]/[Cu2+] =
2 system, BV sequestered (almost) all available copper thus preventing the oxidation. The
sensitivity of complexes of Cu2+ and porphyrin model molecules to O2 has been observed
previously in organic solvents.2,6,11 However, the involvement of ‘free’ Cu2+ has not been taken
into consideration. It is important to point out that the complex was not affected by
bathocuproine, a copper chelating agent (Fig. S1), implying that copper cannot be easily
removed from the complex. Further, we observed that BV degradation at [BV]/[Cu2+] = 1 molar
ratio was promoted at higher BV and Cu2+ concentrations (Fig. S2). This is most likely related to
a higher amount of 'free' copper ions and/or to a different Cu2+ speciation in phosphate buffer for
different [Cu2+] (Fig. S3). The degradation of the complex at high concentrations was prevented
by an excess of BV (in the [BV]/[Cu2+] = 2 system). Therefore, we applied a [BV]/[Cu2+] = 2
molar ratio for methods/measurements that required high concentrations and longer recording
periods at room T. It is worth mentioning that the interactions of porphyrins with metals are
frequently studied in DMSO, which is a more convenient solvent for some analyses. BV showed
similar UV-Vis spectra in DMSO and phosphate buffer (Fig. S4). On the other hand, spectral
features of the [BV]/[Cu2+] = 1 system differed significantly. The 660 nm band was not
annihilated in the presence of equimolar Cu2+ concentration, whereas the 380 nm band showed a
decrease and developed a “shoulder” at approximately 440 nm. This showed that the interactions
of BV with Cu2+ in DMSO and in phosphate buffer differ, and pointed out the importance of
analysing BV/Cu2+ system in the aqueous medium.
ESI-MS analysis confirmed that BV built a complex with copper ions in 1:1 stoichiometry (Fig.
2a). The mass spectrum of BV showed a molecular ion peak at 583.07 [M + H+]+. In the presence
of Cu2+ in 1:1 molar ratio, a peak at 643.36 emerged, whereas the peak of free BV was absent.
This m/z value corresponds to the sum of masses of BV and copper [(M + Cu2+ - H+]+. ESI-MS
of the [BV]/[Cu2+] = 0.5 system showed a significantly higher number of detectable fragments
compared to other systems (Fig. S5). It is noteworthy that the observed m/z of ~264 and ~320
could be assigned to a propentdyopent and its complex with copper, which have been reported to
form from BV analogs (bilindiones) in the presence of copper and oxygen.2 Next, we applied
Raman spectroscopy (Fig. 2b). The Raman spectrum of BV was in good agreement with
previous reports (Table S1). Comparing spectra of BV and BV-Cu complex, the following
differences were observed: (i) a new band at 540 cm-1 emerged for the complex; (ii) the band at 7

844 cm-1 was shifted to 821 cm-1; (iii) the peak at 1303 cm-1 was (almost) absent; (iv) the band at
1333 cm-1 was stronger; (v) the line at 1480 cm-1 was stronger; (vi) it appears that two
peaks/shoulders of 1616 cm-1 band emerged/were stronger at ~1580 cm-1 and ~1630 cm-1. The
540 cm-1 band may be attributed to Cu-N bond vibration.12 The band at 844 cm-1 was attributed
to ring (C-C bond) stretching.13 The shift to lower energies implicates increased stability of BV
in the complex. The band at 1303 cm-1 may be attributed to wagging vibration of C-H bond,13
which are very sensitive to environmental factors.14 The 1333 cm-1 band has been previously
recognized as a structure-sensitive band for Cu-bilirubin complex, and has been attributed to
CH(CH3) in-plane vibration.13,15 Therefore, changes in the intensities of these two bands imply a
more planar structure of BV in the complex. Stronger bands at 1480 cm-1 (stretching of aliphatic
C-C bonds), ~1580 cm-1 (stretching of C=C bonds in the ring), and ~1630 cm-1 (stretching of
C=C and C=O bonds in the ring), imply higher delocalization of π-electrons and consequently a
higher stability of the BV structure. Pertinent to this, it has been proposed that complexes of BV
model compounds with Cu2+ may show unusual electronic structures that exhibit a significant
ligand radical character.24
Figure 3a shows 1H NMR spectrum of BV in phosphate buffer (prepared with D2O). Poor
resolution of signals, which may originate from aggregation [Feliz], did not allow reliable
assignment. However, this was of little relevance here, since the addition of copper ions led to a
very strong effect - the complete loss of almost all lines. The loss of signals represents a result of
strong paramagnetic effects that may come from an unpaired e- that is delocalized in pπ orbitals
of the ring influencing all protons in the complex. It is worth mentioning that 1H NMR lines of
BV in deuterated DMSO were comparatively well resolved (Fig. S6), which points to an
alteration of the protonation state and/or location, and in particular to different aggregation
pattern. In addition, the lines were not lost in the presence of even higher Cu2+ concentration
(Fig. S6), underpinning the significant difference in BV/Cu2+ interactions in the two media. Low-
T EPR was applied to further examine paramagnetic properties of the BV-Cu complex. The EPR
spectrum of Cu2+ (S = 1/2; I = 3/2) in phosphate buffer shows that Cu2+ is weakly coordinated in
an axial symmetry with one g┴ line and four lines coming from hyperfine coupling along g║ (Fig.
3b). The addition of BV in equimolar concentration led to the loss of Cu2+ signal. In the
[BV]/[Cu2+] = 0.5 system the double integral of the signal of Cu2+ in phosphate buffer was
decreased by half, implying that that an excess of copper is not bound to BV. The remaining 8

signal in the [BV]/[Cu2+] = 1 system was broad, and did not show hyperfine structure. The g-
value of the isotropic signal of BV-Cu complex was significantly lower than the average g-value
of Cu2+ in the phosphate buffer indicating delocalizaton of the spin away from the metal nucleus.
Similar EPR signals have been reported previously for porphyrin radical cation [Peeks], and for
an oxidized copper-porphyrin model molecule complex.21 The signals have been attributed to a
highly delocalized electron [21 Peeks]. In addition, the [BV]/[Cu2+] = 1 system showed a 9-line
EPR spectrum at room T (Fig. 3c), as previously reported for porphyrin radical cation by Peeks
and co-workers [Peeks]. The simulation of this signal was performed assuming four equivalent 14N nuclei with an isotropic hyperfine coupling constant of 0.14 mT [Peeks]. This speaks in
favour of a delocalization of unpaired electron over the complex center. Finally, parallel-mode
EPR showed no signal (Fig. 3d). Furthermore, the spectra were ran over a wide field range and
no half field lines were observed, either in parallel or in perpendicular mode. These results are
consistent with S = 0 for the copper center.
Next, we compared the fluorescence of BV and BV-Cu complex (Fig. 3e-h). The [BV]/[Cu2+] =
1 system showed about two-fold stronger fluorescence compared to BV at equimolar
concentration (Fig. 3e). Relative quantum yields for BV and BV-Cu complex were 0.86 and
0.95, respectively. However, the excitation and emission maxima, as well as the lifetimes were
next-to-identical (Fig. 3f), which implies that the fluorecence comes form the same
fluorophore(s). To check whether the difference in fluorescence intensity is related to
aggregation-caused quenching, we applied temperature increase and 5 M urea to induce
deaggregation [Feliz, Rahman]. The increased fluorescence of BV under deaggregating
conditions confirmed that BV forms aggregates in phosphate buffer (Fig. 3g, h), as proposed
regarding the resolution of 1H NMR spectrum of BV (Fig. 3a). On the other hand, no changes
were observed for BV-Cu complex, which implies that it did not form aggregates. This may be
explained by a more planar structure and electrostatic repulsion by redistributed charge of the
complex. It is important to note that the results obtained by fluorimetry further confirm that
copper in the BV-Cu complex is not present in a paramagnetic form (Cu2+ with S = 1/2 or Cu3+
with S = 1). The paramagnetic nature of Cu2+ (or high-spin Cu3+ in analogy with Ni2+) may lead
to quenching by enhancing the processes that compete with fluorescence, such as intersystem
crossing and spin–orbit coupling.17,18
9

Further, redox properties of the complex were examined. BV showed a well-defined anodic peak
at Epa1 = 117 mV (Fig. 4a). CV of Cu2+ in phosphate buffer showed reversible redox behavior at
a peak potential at ~ -0.4 V, with very weak currents. Therefore, the redox activity of BV-Cu
systems in cyclic voltammograms was complex-centered. The [BV]/[Cu2+] = 2 system showed
two additional oxidation peaks at much lower potentials than BV: Epa2 = -91 mV and Epa3 = -341
mV. The former potential corresponds to the oxidation of Cu1+, as we have shown previously
[Bozic]. No reduction peaks could be observed. Differential pulse voltammetry delivered similar
results – the [BV]/[Cu2+] = 2 system showed two additional peaks, most likely coming from two
1e- oxidations (Fig. 4b). It is noteworthy that a similar oxidation pattern has been observed
previously for a complex of BV model compound with copper.25 A direct linear relationship
between I and the square root of scan rate implies that the currents mainly depend on two
parameters: the rate at which redox species diffuse to the electrode surface (D), and the rate
constant of electron transfer (Fig. S7). Other interactions, for example adsorption, were
negligible.27 BV showed significantly higher D compared to D values that were calculated for
the two other peak currents. A faster diffusion of BV to the electrode surface in comparison to
the BV-Cu complex was expected, since BV has more negative charge (two carboxyl groups are
deprotonated at pH 7.428), than the complex formed with positive copper ion. Oximetry was
applied to examine the possibility that in the reaction between BV and Cu2+ an electron is lost, as
proposed previously for complexes of copper ions with BV model molecules.2,23 However, the
syntheses have been performed in deaerated organic solvents, and in some cases it involved
photo-oxidation and transmetalation of the model molecule. In the process, BV-type molecules
act as non-innocent ligands and the complex may lose an electron to solvent molecules or acetate
(Cu(CH3COO)2 is commonly used for the synthesis). In the settings applied here, molecular
oxygen is the final e- acceptor. It may be directly involved in redox reaction between BV and
Cu2+, or it may be reduced by Cu1+, which is unstable under physiological settings. There was a
slight consumption of O2 in [BV]/[Cu2+] = 1 system during the process (Fig. 4c), which may be
explained by traces of ‘free’ copper as discussed for Fig. 1 and Fig. S2. However, in the presence
of an excess of copper ([BV]/[Cu2+] = 0.5), the consumption of O2 was significant. This implies
that ‘free’ Cu2+ reacts with the complex and ‘shuttles’ an e- to O2. The addition of catalase to
[BV]/[Cu2+] = 0.5 system following 15 min incubation, resulted in O2 release (not shown),
implying that hydrogen peroxide is accumulated. As an illustration of the redox mechanism, we 10
added Cu1+ to the buffer. Cu1+ rapidly reduced O2 at pH 7.4 to produce superoxide radical anion,
which resulted in a drop of O2 concentration. Next, the effects of reducing (Cu1+ and ascorbate)
and oxidizing (KMnO4) agents on BV-Cu complex were examined. The complex was not
affected by Cu1+ (Fig. 4d). BV was exposed to a 1/1 mixture of Cu1+ and Cu2+ under anaerobic
conditions. The spectrum of 20 μM BV with 10 μM Cu2+ and 10 μM Cu1+ corresponded to the
spectrum of an analogous [BV]/[Cu2+] = 2 system. Initially present Cu1+ did not affect the
spectrum, and the system was stable. When exposed to air, Cu1+ was oxidized by O2 to produce
Cu2+ that reacted with free BV producing an additional amount of complex. The complex was
not affected by ascorbate as well (Fig. 4e). On the other hand, the complex was degraded by
KMnO4, whereas this strong oxidizing species did not affect free BV (Fig. 4f).
The results presented here imply that BV and Cu2+ react under physiologcial settings to produce
a 1:1 complex that is composed of Cu1+ and BV radical cation (BV·+). It should be stressed that
the proposed distribution of electrons is formal, and that the unpaired e- may be delocalized over
the entire complex including the copper center. An electron is transferred form BV to copper, so
a delocalized unpaired electron remains on the ring, whereas Cu1+ is bound to N in pyrroles. The
presence of an unpaired delocalized e- and the development of BV·+ are implicated by: (i) the
results of Raman spectroscopy implicating a higher stability of BV in the complex that is
provided by an additional delocalization of π-electronic cloud; (ii) NMR data showing strong
paramagnetism of the complex; and (iii) perpendicular-mode EPR spectra. The proposed redox
state of copper in the complex – Cu1+ is implicated by: (i) parallel-mode EPR and fluorescence
results that were consistent with S = 0; (ii) The oxidation peak in CV of BV-Cu complex that
corresponds to Cu1+ oxidation; and (iii) the susceptibility of the complex to oxidizing and not to
reducing agents, since it appears more plausible that metal center and not delocalized e-
represents the main site of redox interactions of the complex. It is important to note that in
addition to the reduction of Cu2+ to Cu1+ with concomitant formation of BV·+, a complex with
delocalized e- and copper with S = 0 may develop via another redox process: the oxidation of
Cu2+ to Cu3+ that may show S = 0 (in addition to high-spin S = 1), and the formation of BV
radical anion. However, previous studies have shown that BV as well as trianionic corroles may
reduce Cu3+ [Wasbotten, Pierloot]. Pertinent to this, it appears that a complex between reduced
BV and Cu3+ would not be stable.
11

Conclusions
At physiological pH, BV builds a complex with copper ions in 1:1 stoichiometry. The formation
of complex involves the rearrangement of electronic structure which provides increased
energetic stability and strong paramagnetic effects. We believe that a complex with a highly
delocalized unpaired e- and the formal BV·+-Cu1+ character best suites the outlined properties,
but other structures of the complex cannot be completely ruled out. The presented results may
shed new light on long-standing issues of BV chemistry and catalysis in biological systems.
Supporting Information
UV-Vis spectra of different BV/copper systems, BV/copper system in DMSO – UV-Vis and 1H
NMR spectra, speciation of Cu2+ in phosphate buffer, ESI-MS spcectum, scan rate analysis of
BV and BV-Cu complex, list of Raman bands for BV.
Acknowledgements
This work was supported by the Ministry of Education, Science and Technological Development
of the Republic of Serbia (III43010). We acknowledge networking support from the COST
Action FeSBioNet (Contract CA15133). We thank Prof. Ana Popović-Bijelić and Prof. Miloš
Mojović (EPR Laboratory, Faculty of Physical Chemistry, University of Belgrade) for acquiring
low temperature EPR spectra. D.M.S was supported by Magbiovin project (FP7-ERA Chairs-
Pilot Call-2013, Grant Agreement: 621375).
Conflict of Interest The authors declare that they have no competing interests.
12

References
(1) Bhuyan, J., Metalloisoporphyrins: from synthesis to applications Dalton Trans.2015, 44,
15742-15756.
(2) Balch, A. L.; Mazzanti, M.; Noll, B. C.; Olmstead, M. M., Geometric and electronic structure
and dioxygen sensitivity of the copper complex of octaethylbilindione, a biliverdin analog. J.
Am. Chem. Soc. 1993, 115, 12206-12207.
(3) Zhang, L., Heme biology: the secret life of heme in regulating diverse biological processes.
World Scientific Publishing Company: Singapore, 2011.
(4) Chen, D.; Brown, J. D.; Kawasaki, Y.; Bommer, J.; Takemoto, J. Y., Scalable production of
biliverdin IXα by Escherichia coli. BMC biotechnol. 2012, 12, 89.
(5) Cornelius, C., Biliverdin in biological systems. In One Medicine: Ryder O.A., Byrd M. L.,
Eds.; Springer: Berlin, Heidelberg, 1984;Chapter 27 pp 321-334.
(6) Sóvágó, I.; Harman, B.; Kolozsvári, I.; Matyuska, F., Complex-formation and redox reactions
of bilirubin and biliverdin with zinc (II), cadmium (II) and copper (II) ions. Inorganica Chim
Acta 1985, 106, 181-186.
(7) Goncharova, I.; Urbanová, M., Vibrational and electronic circular dichroism study of bile
pigments: Complexes of bilirubin and biliverdin with metals. Anal. Biochem. 2009, 392, 28-36.
(8) (a) Asad, S. F.; Singh, S.; Ahmad, A.; Hadi, S., Bilirubin-Cu (II) complex degrades DNA.
Biochim. Biophys. Acta 1999, 1428, 201-208; (b) Asad, S. F.; Singh, S.; Ahmad, A.; Khan, N.
U.; Hadi, S., Prooxidant and antioxidant activities of bilirubin and its metabolic precursor
biliverdin: a structure–activity study. Chem. Biol. Interact. 2001, 137, 59-74.
(9) (a) Fischer, B. E.; Haring, U. K.; Tribolet, R.; Sigel, H., Metal ion/buffer interactions. FEBS
J. 1979, 94, 523-530; (b) Nagaj, J.; Stokowa-Sołtys, K.; Kurowska, E.; Frączyk, T.; Jeżowska-
Bojczuk, M.; Bal, W., Revised coordination model and stability constants of Cu (II) complexes
of tris buffer. Inorg. Chem. 2013, 52, 13927-13933.
(10) (a) McDonagh, A. F.; Palma, L. A., Preparation and properties of crystalline biliverdin IXα.
Simple methods for preparing isomerically homogeneous biliverdin and [14C] biliverdin by 13

using 2, 3-dichloro-5, 6-dicyanobenzoquinone. Biochem. J. 1980, 189, 193-208; (b) Krois, D.;
Lehner, H., Helically fixed chiral bilirubins and biliverdins: a new insight into the
conformational, associative and dynamic features of linear tetrapyrrols. J. Chem. Soc., Perkin
Trans. 2. 1993, 7, 1351-1360.
(11) Phillips, S.; Noll, B. C.; Olmstead, M. M.; Balch, A. L., Oxidation of copper (II)
hydroxyporphyrin (oxophlorin); oxidative ring opening and formation of an ester-linked,
dinuclear copper complex. Can. J. Chem. 2001, 79, 922-929.
(12) (a) Celis, F.; Campos-Vallette, M.; Gómez-Jeria, J.; Clavijo, R.; Jara, G.; Garrido, C.,
Surface-enhanced Raman scattering and theoretical study of the bilichromes biliverdin and
bilirubin. Spectrosc. Lett. 2016, 49, 336-342; (b) He, J.; Lu, X. D.; Zhou, X.; Yu, N. t.; Chen, Z.,
Surface‐enhanced Raman spectroscopy of bilirubin‐metal ion complexes. Biospectroscopy. 1995,
1, 157-162; (c) Hu, J.; Wang, T.; Moigno, D.; Wumaier, M.; Kiefer, W.; Mao, J.; Wu, Q.; Niu,
F.; Gu, Y.; Chen, Q., Fourier-transform Raman and infrared spectroscopic analysis of
dipyrrinones and mesobilirubins. Spectrochim. Acta A Mol. Biomol. Spectrosc. 2001, 57, 2737-
2743.; (d) Hu, J.-M.; Liang, E.-J.; Duschek, F.; Kiefer, W., Resonance Raman spectroscopic
study of free brilirubin and brilirubin complexes with copper (II), silver (I) and gold (III).
Spectrochim. Acta A Mol. Biomol. Spectrosc. 1997, 53, 1431-1438.
(13) Chen, J.; Hu, J.-m.; Sheng, R.-s., Surface-enhanced Raman spectroscopy of free bilirubin
and bilirubin complexes with transition metals iron (II), nickel (II) and cobalt (II). Spectrochim.
Acta, Part A. 1994, 50 (5), 929-936.
(14) Tao, S.; Yu, L.-J.; Wu, D.-Y.; Tian, Z.-Q., Raman Spectra of Amino Wagging Vibrational
Modes in p-π-Conjugated Molecules. Acta Phys.Chim. Sin. 2013, 29, 1609-1617.
(15) (a) He, J.; Lu, X. D.; Zhou, X.; Yu, N. t.; Chen, Z., Surface‐enhanced Raman spectroscopy
of bilirubin‐metal ion complexes. Biospectroscopy 1995, 1, 157- 162; (b) Hu, J.-M.; Liang, E.-J.;
Duschek, F.; Kiefer, W., Resonance Raman spectroscopic study of free brilirubin and brilirubin
complexes with copper (II), silver (I) and gold (III). Spectrochim. Acta A Mol. Biomol.
Spectrosc. 1997, 53 (9), 1431-1438.
(16) (a) Yunxia, Y.; Lihua, W.; Weichen, S.; Yinqun, H., Effects of Different Ligands on
Fluorescent Properties of Nd3+ Organic Complexes. Rare Metal Mat. Eng. 2014, 43, 2359-14

2364; (b) Zhang, Y.-M.; Zhang, X.-J.; Xu, X.; Fu, X.-N.; Hou, H.-B.; Liu, Y., Rigid
Organization of Fluorescence-Active Ligands by Artificial Macrocyclic Receptor to Achieve the
Thioflavin T-Amyloid Fibril Level Association. J. Phys. Chem. B. 2016, 120, 3932-3940.
(17) Sivaraman, G.; Iniya, M.; Anand, T.; Kotla, N. G.; Sunnapu, O.; Singaravadivel, S.;
Gulyani, A.; Chellappa, D., Chemically diverse small molecule fluorescent chemosensors for
copper ion. Coord. Chem. Rev. 2018, 357, 50-104.
(18) (a) Chen, Y.; Jiang, J., Porphyrin-based multi-signal chemosensors for Pb 2+ and Cu 2+.
Org. Biomol. Chem. 2012, 10, 4782-4787; (b) Kano, K.; Sato, T.; Yamada, S.; Ogawa, T.,
Fluorescence quenching of water-soluble porphyrins. A novel fluorescence quenching of anionic
porphyrin by anionic anthraquinone. J. Phys. Chem. 1983, 87, 566-569; (c) Prabphal, J.;
Vilaivan, T.; Praneenararat, T., Fabrication of a Paper‐Based Turn‐Off Fluorescence Sensor for
Cu2+ Ion from a Pyridinium Porphyrin. Chemistry Select. 2018, 3, 894-899.
(19) Mwakwari, S. C.; Wang, H.; Jensen, T. J.; Vicente, M. G. H.; Smith, K. M., Syntheses,
properties and cellular studies of metallo-isoporphyrins. J. Porphyr. Phthalocyanines. 2011, 15,
918-929.
(20) Bertini, I.; Luchinat, C.; Parigi, G., Solution NMR of paramagnetic molecules: applications
to metallobiomolecules and models. Elsevier: 2001; Vol. 2.
(21) Godziela, G. M.; Goff, H. M., Solution characterization of copper (II) and silver (II)
porphyrins and the one-electron oxidation products by nuclear magnetic resonance spectroscopy.
J. Am. Chem. Soc. 1986, 108, 2237-2243.
(22) Stoll, S.; Gunn, A.; Brynda, M.; Sughrue, W.; Kohler, A. C.; Ozarowski, A.; Fisher, A. J.;
Lagarias, J. C.; Britt, R. D., Structure of the biliverdin radical intermediate in phycocyanobilin:
ferredoxin oxidoreductase identified by high-field EPR and DFT. J. Am. Chem. Soc. 2009, 131,
1986-1995.
(23) Koerner, R.; Olmstead, M. M.; Ozarowski, A.; Phillips, S. L.; Van Calcar, P. M.; Winkler,
K.; Balch, A. L., Possible intermediates in biological metalloporphyrin oxidative degradation.
Nickel, copper, and cobalt complexes of octaethylformybiliverdin and their conversion to a
verdoheme. J. Am. Chem. Soc. 1998, 120, 1274-1284.
15

(24) Szterenberg, L.; Latos‐Grażyński, L.; Wojaczyński, J., Metallobiliverdin Radicals—DFT
Studies. Chem. Phys. Chem. 2003, 4, 691-698.
(25) Pistner, A. J.; Pupillo, R. C.; Yap, G. P.; Lutterman, D. A.; Ma, Y.-Z.; Rosenthal, J.,
Electrochemical, Spectroscopic, and 1O2 Sensitization Characteristics of 10, 10-
Dimethylbiladiene Complexes of Zinc and Copper. J. Phys. Chem. A. 2014, 118, 10639-10648.
(26) Galliani, G.; Monti, D.; Speranza, G.; Manitto, P., Biliverdin as an electron transfer catalyst
for superoxide ion in aqueous medium. Experientia. 1985, 41, 1559-1560.
(27) Sochr, J.; Švorc, Ľ.; Rievaj, M.; Bustin, D., Electrochemical determination of adrenaline in
human urine using a boron-doped diamond film electrode. Diam. Relat. Mater. 2014, 43, 5-11.
(28) Lightner, D. A.; Holmes, D. L.; McDonagh, A. F., On the Acid Dissociation Constants of
Bilirubin and Biliverdin pKa values from 13C NMR spectroscopy. J. Biol. Chem. 1996, 271,
2397-2405.
Nguyen KT, Rath SP, Latos-Grazyński L, Olmstead MM, Balch AL. Formation of a highly
oxidized iron biliverdin complex upon treatment of a five-coordinate verdoheme with dioxygen.
J Am Chem Soc. 2004 May 26;126(20):6210-1.
Alan L. Balch, Lechoslaw Latos-Grazynski, Bruce C. Noll, Marilyn M. Olmstead, Nasser Safari
Isolation and characterization of an iron biliverdin-type complex that is formed along with
verdohemochrome during the coupled oxidation of iron(II) octaethylporphyrin J. Am. Chem.
Soc., 1993, 115 (20), pp 9056–9061
Coordination Patterns for Biliverdin-Type Ligands. Helical and Linked Helical Units in Four-
Alan L. Balch, Marinella Mazzanti, Bruce C. Noll, Marilyn M. Olmstead. Coordinate Cobalt and
Five-Coordinate Manganese(III) Complexes of Octaethylbilindione. J. Am. Chem. Soc., 1994,
116 (20), pp 9114–9122
Alan L. Balch, Bruce C. Noll, Edward P. Zovinka Structural characterization of zinc(II)
complexes of octaethyloxophlorin dianion and octaethyloxophlorin radical anion. J. Am. Chem.
Soc., 1992, 114 (9), pp 3380–3385
Spasojević I, Batinić-Haberle I, Stevens RD, Hambright P, Thorpe AN, Grodkowski J, Neta P,
Fridovich I. Manganese(III) biliverdin IX dimethyl ester: a powerful catalytic scavenger of
16

superoxide employing the Mn(III)/Mn(IV) redox couple. Inorg Chem. 2001 Feb 12;40(4):726-
39.
Feliz M, Ribó JM, Salgado A, Trull FR, Vallò MA. On the 1H NMR Spectra of Biliverdins with
Free Propionic Acid Substituents Monatshefte Chemie 120, 445451 (1989)
Peeks MD1, Tait CE2, Neuhaus P1, Fischer GM1, Hoffmann M1, Haver R1, Cnossen A1,
Harmer JR2, Timmel CR2, Anderson HL1. Electronic Delocalization in the Radical Cations of
Porphyrin Oligomer Molecular Wires.J Am Chem Soc. 2017 Aug 2;139(30):10461-10471.
Mahmudur Rahman and H. James Harmon Inhibition of aggregation of meso-tetra(4-
sulfonatophenyl)-porphyrin (H4TPPS) by urea Journal of Porphyrins and PhthalocyaninesVol.
11, No. 02, pp. 125-129 (2007)
Božić B1, Korać J2, Stanković DM3, Stanić M2, Popović-Bijelić A4, Bogdanović Pristov J2,
Spasojević I5, Bajčetić M6. Mechanisms of redox interactions of bilirubin with copper and the
effects of penicillamine. Chem Biol Interact. 2017 Dec 25;278:129-134.
Pierloot K1, Zhao H, Vancoillie S. Copper corroles: the question of noninnocence. Inorg Chem.
2010 Nov 15;49(22):10316-29.
Wasbotten I1, Ghosh A. Biliverdine-based metalloradicals: sterically enhanced noninnocence.
Inorg Chem. 2006 Jun 26;45(13):4914-21.
17

Figure 1. Changes in UV-Vis spectra of biliverdin (BV) in the presence of Cu2+ in phosphate
buffer (50 mM; pH 7.4). (a) Different concentration ratios under anaerobic conditions (Ar
atmosphere). Spectra were recorded after 5 min of incubation and remained stable for at least 60
min. (b) The system with [BV]/[Cu2+] = 2 molar ratio under aerobic conditions. (c) [BV]/[Cu2+]
= 1 under aerobic conditions. (d) [BV]/[Cu2+] = 0.5 under aerobic conditions. (e) Absorbance
titration curve. Spectra were obtained after 5 min incubation period. In all experiments [BV] =
20 μM.
18
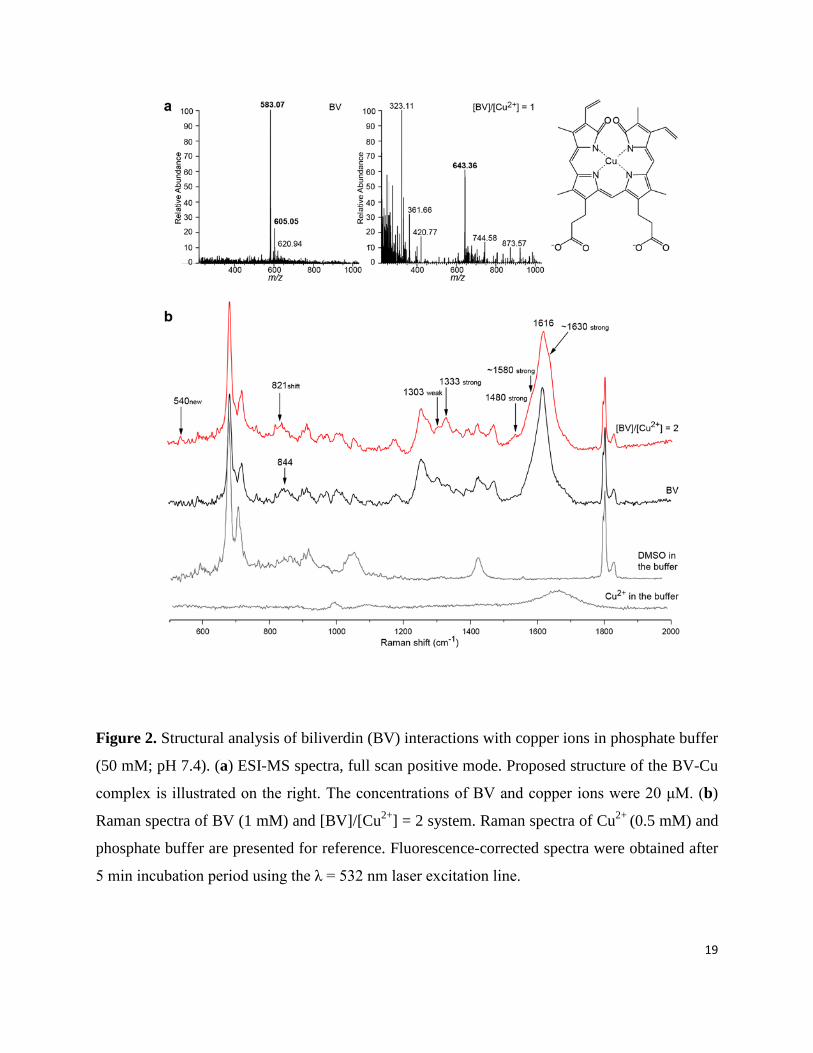
Figure 2. Structural analysis of biliverdin (BV) interactions with copper ions in phosphate buffer
(50 mM; pH 7.4). (a) ESI-MS spectra, full scan positive mode. Proposed structure of the BV-Cu
complex is illustrated on the right. The concentrations of BV and copper ions were 20 μM. (b)
Raman spectra of BV (1 mM) and [BV]/[Cu2+] = 2 system. Raman spectra of Cu2+ (0.5 mM) and
phosphate buffer are presented for reference. Fluorescence-corrected spectra were obtained after
5 min incubation period using the λ = 532 nm laser excitation line.
19

Figure 3. Paramagnetic properties of BV-Cu systems in phosphate buffer (50 mM; pH 7.4). (a) 1H NMR spectra of BV (0.3 mM) with or without Cu2+ (0.15 mM) in the buffer prepared with
D2O. BV stock (20 mM) was prepared in DMSO. The acquisition of spectra was initiated after 5
min of incubation. (b) 30 K EPR spectra (perpendicular-mode) of 40 μM Cu2+ in the absence or
the presence of BV (40 or 20 μM). Dashed line – the signal of the [BV]/[Cu] = 1 system divided
by 2. (c) Room-T EPR spectrum of [BV]/[Cu] = 1 system. The spectrum was obtained via 10
accumulations (baseline corrected). Gray line - spectral simulation. (d) 25.5 K EPR spectra
(parallel-mode) of 40 μM Cu2+ in the presence of 40 μM BV ([BV]/[Cu] = 1). Power was 32 and
16 dB. For low-T EPR, samples were frozen in liquid N2 after 5 min incubation. (e) Excitation
and emission fluorescence spectra of BV and [BV]/[Cu2+] = 1 system. The concentrations of BV
and Cu2+ in the sample were 10 μM. The acquisition of spectra was initiated after 5 min of
incubation. (f) Fluorescence decay profile of BV and BV-Cu complex. Lifetime (τ) is presented
as mean ± standard deviation. (g) Emission spectra of BV (λex = 381 nm) and BV/Cu2+ (λex = 386
nm) at two temperatures. (h) Emission spectra of BV (λex = 381 nm) and BV/Cu2+ (λex = 386 nm)
in the absence and the presence of 5 M u
20

Figure 4. Redox properties of BV/Cu systems in phosphate buffer (50 mM; pH 7.4). (a) Cyclic
voltammograms of BV and BV-Cu complex at a boron-doped diamond electrode (scan rate 0.1
V/s). Concentrations of BV and Cu2+ were 0.4 mM and 0.2 mM, respectively. Oxidation/anodic
peak current potentials (Epa) are labeled. (b) Differential pulse voltammograms (increment, 0.004
V; pulse width, 0.05 s; sample width, 0.01 s; quiet time, 2 s). (c) Consumption of molecular
oxygen in BV solutions following addition of Cu2+, or the addition of Cu1+ to phosphate buffer.
The trace without Cu addition is presented for reference. In all experiments [BV] = 200 μM. (d)
UV-Vis spectra of BV with Cu2+ and Cu1+ under anaerobic and aerobic conditions. The signals
are compared to the spectra of analogous BV/Cu2+ systems. Cu1+ does not show detectable
absorbance at the applied concentration. (e) The effects of reducing agent – ascorbate (Asc) on
BV-Cu complex. (f) The effects of oxidizing agent – KMnO4 on BV-Cu complex. Both, Asc and
KMnO4 did not affect the spectrum of free BV.
21

Synopsis
The coordinate/redox interactions of biliverdin with Cu2+ have been studies in phosphate buffer
at pH 7.4. A set of experimental techniques - spectrophotometry, MS-ESI, Raman spectroscopy, 1H NMR, EPR, fluorimetry and electrochemical methods point to formation of a stable 1:1
coordination complex with delocalized unpaired electron that most likely comes from the ligand.
The complex is formally composed of biliverdin radical cation and Cu1+.
22
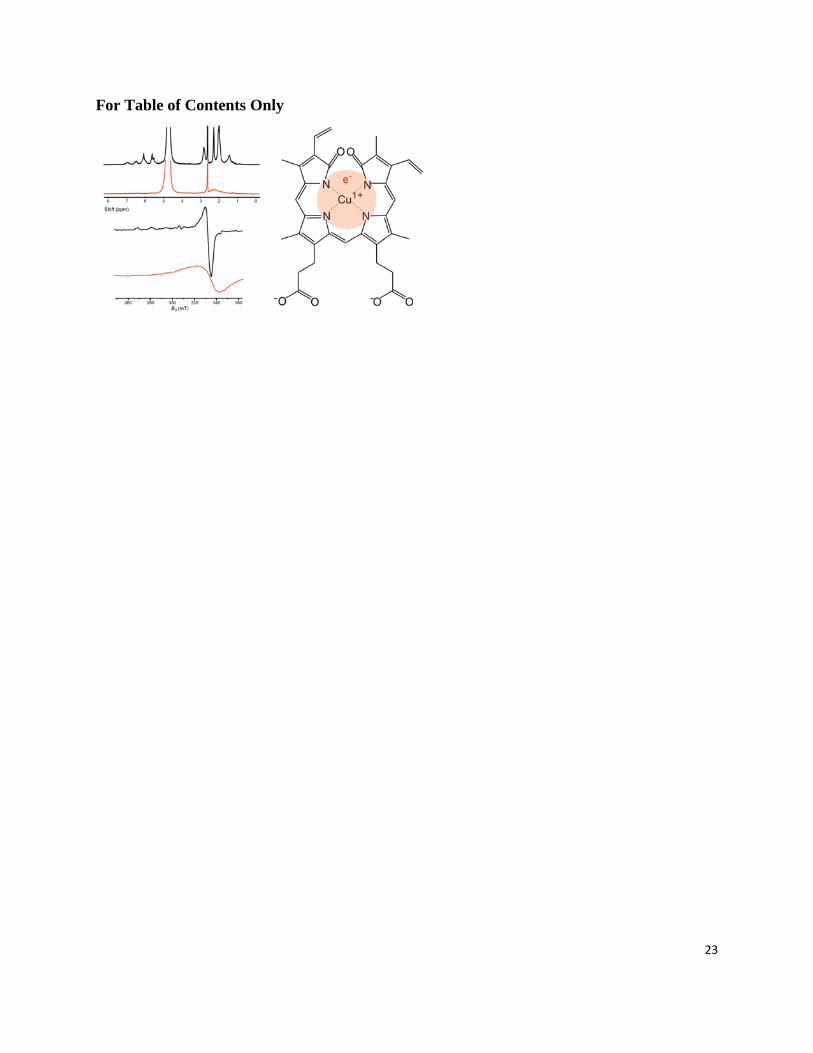
For Table of Contents Only
23
Supporting information
Biliverdin-copper complex at physiological pH
Milena Dimitrijević, Jelena Bogdanović Pristov, Milan Žižić, Dalibor Stanković, Danica Bajuk-
Bogdanović, Marina Stanić, Snežana Spasić, Wilfred Hagen, Ivan Spasojević*
*E-mail: : [email protected]

Figure S1. The stability of [BV]/[Cu2+] = 1 system in the presence of copper chelating agent
bathocuproine in phosphate buffer (50 mM; pH 7.4). Concentrations were: BV, 10 μM; Cu2+, 10
μM; bathocuproine, 300 μM. Green line - BV and Cu2+ were incubated for 5 min before the
addition of bathocuproine. Blue line - Cu2+ was added to the buffer with BV and bathocuproine
(arrow – absorbance line of bathocuproine complex with copper).

Figure S2. Changes in UV-Vis spectra of BV-Cu2+ systems prepared at high concentrations in
50 mM phosphate buffer, pH 7.4. Left: [BV]/[Cu2+] = 1; [BV] = [Cu2+] = 0.3 mM. Right:
[BV]/[Cu2+] = 2; [BV] = 2 mM; [Cu2+] = 1 mM. Aliquots were taken from each system and
diluted to lower final concentrations (10 or 40 μM, respectively), to allow spectra acquisition. It
can be observed that the [BV]/[Cu2+] = 1 system underwent degradation within 10 min, whereas
the [BV]/[Cu2+] = 2 system was relatively stable for 5 h.

Figure S3. Speciation diagrams of Cu2+ in phosphate buffer (50 mM) at two concentrations – 40
μM (top) and 300 μM (bottom). Diagrams were prepared in Hydra-Medusa Software, using the
presented parameters.

Figure S4. Comparison of UV-Vis spectra of biliverdin (BV) in the absence and the presence of
Cu2+ in phosphate buffer (50 mM; pH 7.4) and in DMSO. Spectra were recorded after 5 min
incubation period.

Figure S5. ESI-MS spectrum (full scan mode) of the system with [BV] = 20 μM and [Cu] = 40
μM. Assignation: m/z ~643, BV-Cu complex; m/z ~264, propentdyopent; m/z ~320,
propentdyopent complex with copper.
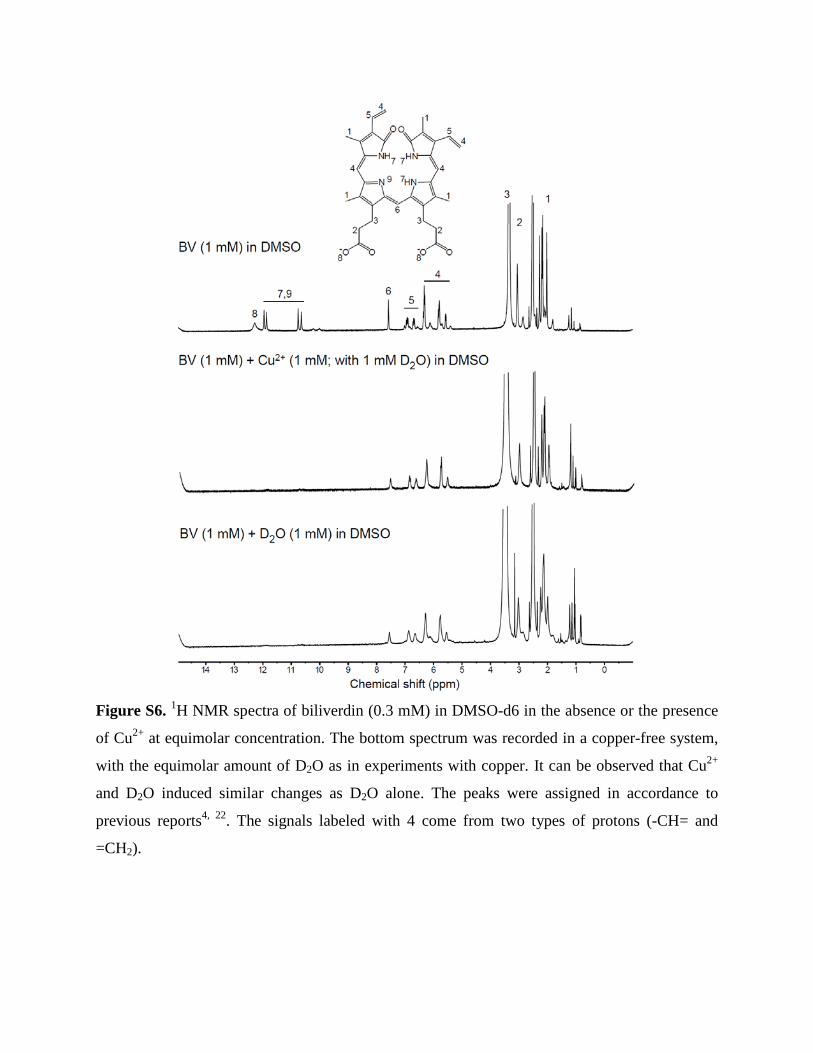
Figure S6. 1H NMR spectra of biliverdin (0.3 mM) in DMSO-d6 in the absence or the presence
of Cu2+ at equimolar concentration. The bottom spectrum was recorded in a copper-free system,
with the equimolar amount of D2O as in experiments with copper. It can be observed that Cu2+
and D2O induced similar changes as D2O alone. The peaks were assigned in accordance to
previous reports4, 22. The signals labeled with 4 come from two types of protons (-CH= and
=CH2).

Figure S7. Scan rate analysis of BV and BV-Cu complex in phosphate buffer (50 mM; pH 7.4).
(a) Cyclic voltammograms of BV (0.4 mM) in absence or presence of Cu2+ (0.2 mM) at the
boron doped diamond electrode obtained at different scan rates (ν = 0.025–0.5 V/s). (b) The
dependence between anodic peak currents I at potentials Epa1 (oxidation of BV), and Epa2 and
Epa3 (oxidation of BV-Cu complex(es)) and ν1/2. Linear fit and R2 values are presented. (c) D for
BV and BV-Cu complex(es). Randles–Sevick equation (in the box): n, number of transferred e-

(1e- for all peak currents), A, area of the working electrode (0.0707 cm2); C, concentration of
redox species in solution ([BV] = 0.4 mM; [BV-Cu] = 0.2 mM). Results are presented as means
(± standard deviation) of measurements made at various ν. All three D values were statistically
different (p < 0.001; ANOVA with post hoc Duncan’s test).

Table S1. Raman spectral lines that were observed for BV (1 mM), using the λ = 532 nm laser
excitation line.
Line
[cm-1] Assignment References
1619 Lactam stretching 12c
1470 C–C deformation, likely between rings 12c, 12d
1443 Stretching CC, stretching CN 12a
1393 CH3 asymmetric deformation 12a
1362 CH3 deformation 12a
1331 In plane bending CH(CH3) 12a
1303 CH wagging 12a
1254 Lactam ring 12a
1179 C–H twisting 12c
1101 Stretching C–C, stretching C–N 12a
1003 Asymmetric CH3 deformation 12a
971 C–C stretching mixed with C–H
rocking 12c
954 Stretching C–C–O 13
844 Stretching ring 12a
767 In plane ring deformation 12a
717 Out of plane ring deformation 12a
684 Out of plane bending C=O 12a