dehalococcoides (sdc 9tm for anaerobic · pdf filedehalococcoides‐containing microbial...
TRANSCRIPT

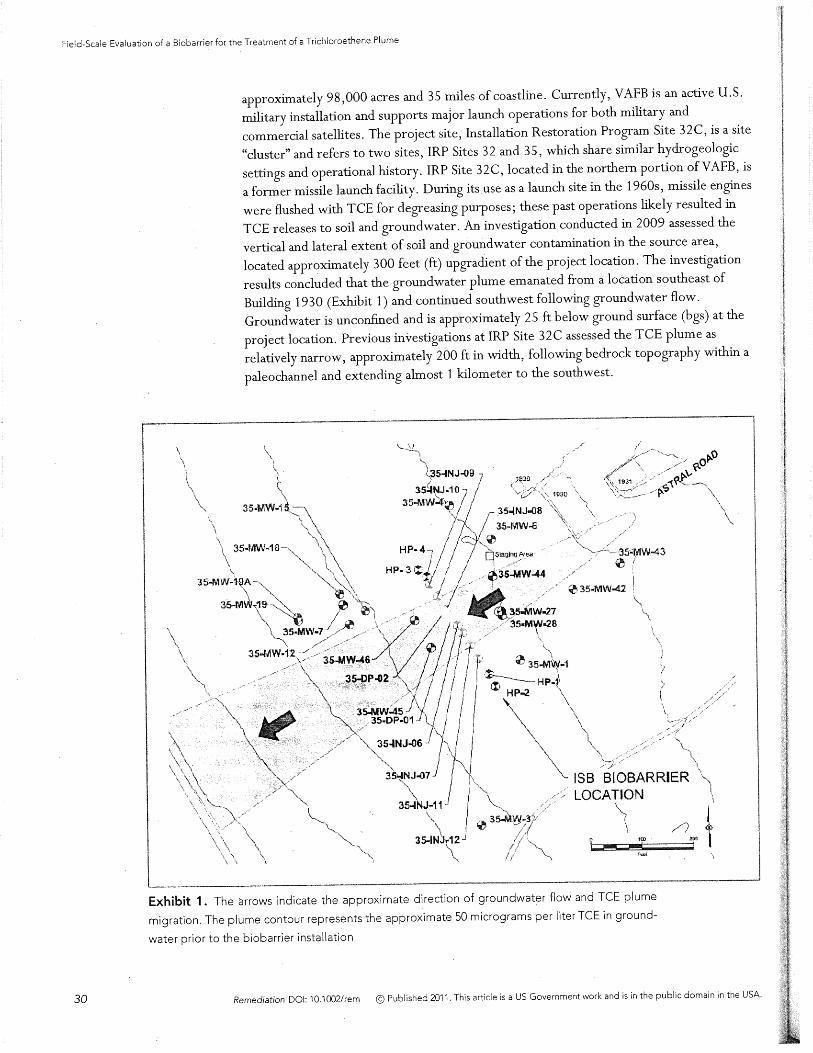
Dehalococcoides‐containing microbial consortium (SDC‐9TM) for anaerobic
bioremediation
1. Dr. Robert J. Steffan, CB&I Federal Services, LLC. (formerly Shaw Environmental, Inc.)
2. Composed of anaerobic bacteria including Dehalococcoides mccartii in an aqueous
medium.
3. MSDS and Technical Data Sheet
4. Number of Field‐scale Applications to Date: 650+ applications
5. Case Studies – Attached.
6. Technical Summary. The SDC‐9TM culture is a pathogen‐free, non‐genetically altered
microbial consortium capable of biologically degrading halogenated aliphatic pollutants
including , 1,1,1‐TCA, 1,1,2‐TCA, 1,1‐DCA, 1,2‐DCA, 1,2‐DBE, TeCA, CT, CF, PCE, TCE,
DCE, VC, and Freon 113 (1,2‐dichloro‐1,2‐difluoroethane), and also mixtures thereof.
Molecular biological analyses of the SDC‐9 culture has demonstrated that the culture
has at least three closely‐related strains of Dehalococcoides sp. bacteria which is the
only bacterial genus known to degrade chlorinated ethenes completely to ethene. In
addition, the culture contains other known pollutant degrading bacteria including
Desufitobacterium and Desulfovibrio strains. It has now been successfully applied motre
than 600 times, and 100,000 L have been delivered to sites throughout the United
States. The culture has been applied commercially since 2003, and it is sold by licensed
distributors under several trade names including RTB‐1TM, BAC‐9TM, TSI‐DCTM, and
BDIplusTM.

Page 1 of 4
Material Safety Data Sheet SECTION 1 – CHEMICAL PRODUCT AND COMPANY IDENTIFICATION Product Name: DHC microbial consortium (SDC-9) Manufacturer CB&I 17 Princess Road, Lawrenceville, NJ 08648. Phone (609) 895-5340 CAS #: N/A (Not Applicable) Product Use: For remediation of contaminated groundwater (environmental applications). Material Description: Non-toxic, naturally occurring, non-pathogenic, non-genetically altered
anaerobic microbes in a water-based medium. IN CASE OF EMERGENCY CALL CHEMTREC 24 HOUR EMERGENCY RESPONSE PHONE NUMBER (800) 424-
9300 SECTION 2 – COMPOSITIONS AND INFORMATION ON INGREDIENTS Components % OSHA
PEL ACGIH TLV
OTHER LIMITS
Non-Hazardous Ingredients 100 N/A N/A N/A
DHC microbial consortium (SDC-9) comprised of microorganism of the genus Dehalococcoides, Desulfovibrio, and Desulfitobacterium, and methanogenic archebacteria. SECTION 3 – HAZARDS IDENTIFICATION The available data indicates no known hazards associated with exposure to this product. Nevertheless, individuals who are allergic to enzymes or other related proteins should avoid exposure and handling. Health effects associated with exposure to similar organisms are listed below. Ingestion: Ingestion of large quantities may result in abdominal discomfort including nausea,
vomiting, cramps, diarrhea, and fever. Inhalation: Hypersensitive individuals may experience breathing difficulties after inhalation of
aerosols. Skin Absorption: May cause irritation upon prolonged contact. Hypersensitive individuals may experience allergic reactions.. Eye contact: May cause irritation unless immediately rinsed.

Page 2 of 4 SECTION 4 – FIRST AID MEASURES Ingestion: Thoroughly rinse mouth with water. Do not induce vomiting unless directed to do so by medical personnel. Get immediate medical attention. Never give
anything by mouth to an unconscious or convulsing person. Inhalation: Get medical attention if allergic symptoms develop. Skin Absorption: N/A Skin Contact: Wash affected area with soap and water. Get medical attention if allergic symptoms
develop. Eye Contact: Flush eyes with plenty of water for at least 15 minutes using an eyewash fountain, if
available. Get medical attention if irritation occurs. NOTE TO PHYSICIANS: All treatments should be based on observed signs and symptoms of distress in the patient. Consideration should be given to the possibility that overexposure to materials other than this material may have occurred. SECTION 5 – FIRE AND EXPLOSION DATA Flammability of the Product: Non-flammable Flash Point: N/A Flammable Limits: N/A Fire Hazard in Presence of Various Substances: N/A Explosion Hazard in Presence of Various Substances: N/A Extinguishing Media: Foam, carbon dioxide, water Special Fire Fighting Procedures: None Unusual Fire and Explosion Hazards: None SECTION 6 – ACCIDENTAL RELEASE MEASURES Reportable quantities (in lbs of EPA Hazardous Substances): N/A No emergency results from spillage. However, spills should be cleaned up promptly. Absorb with an inert material and put the spilled material in an appropriate waste disposal container. All personnel involved in the cleanup must wear protective clothing and avoid skin contact. After clean-up, disinfect all cleaning materials and storage containers that come in contact with the spilled liquid.
Page 3 of 4 SECTION 7 – HANDLING AND STORAGE Avoid breathing breathe aerosol. Avoid contact with skin. Use personal protective equipment recommended in Section 8. Keep containers tightly closed in a cool, well-ventilated area. The DHC microbial consortium (SDC-9) can be supplied in stainless steel kegs designed for maximum working pressure of 130 psi and equipped with pressure relief valves. The kegs are pressurized with Nitrogen up to the pressure of 15 psi. Do not exceed pressure of 15 psi during transfer of DHC microbial consortium (SDC-9) from kegs. Don’t open keg if content of the keg is under pressure. DHC microbial consortium (SDC-9) may be stored for up to 3 weeks at temperature 2-4C without aeration. Avoid freezing. SECTION 8 – EXPOSURE CONTROLS/PERSONAL PROTECTION Hand Protection: Rubber, nitrile, or vinyl gloves. Eye Protection: Safety goggles or glasses with side splash shields. Protective Clothing: Use adequate clothing to prevent skin contact. Respiratory Protection: N95 respirator if aerosols might be generated. Ventilation: Provide adequate ventilation to remove odors. Other Precautions: An eyewash station in the work area is recommended. SECTION 9 – PHYSICAL/CHEMICAL CHARACTERISTICS
Physical state and appearance: Light greenish murky liquid. Musty odor. Boiling Point: 100C (water) Specific Gravity (H2O = 1): 0.9 - 1.1 Vapor Pressure @ 25C: 24 mm Hg (water) Melting Point: 0C (water) Vapor Density: N/A Evaporation Rate (H2O = 1): 0.9 - 1.1 Solubility in Water: Soluble Water Reactive: No pH: 6.0 - 8.0 SECTION 10 – STABILITY AND REACTIVITY DATA Stability: Stable

Page 4 of 4 Conditions to Avoid: None Incompatibility (Materials to Avoid): Water-reactive materials Hazardous Decomposition Byproducts: None SECTION 11 – TOXICOLOGICAL INFORMATION This product contains no toxic ingredients. SDC-9 consortium has tested negative for pathogenic microorganisms such as Bacillus cereus, Listeria monocytogens, Salmonella sp., Fecal Coliform, Total Coliform, Yeast and Mold and Pseudomonas sp. SECTION 12 – ECOLOGICAL INFORMATION Ecotoxicity: this material will degrade in the environment. SECTION 13 – DISPOSAL CONSIDERATIONS Waste Disposal Method: No special disposal methods are required. The material is compatible with all known biological treatment methods. To reduce odors and permanently inactivate microorganisms, mix 100 parts (by volume) of SDC-9 consortium with 1 part (by volume) of bleach. Dispose of in accordance with local, state and federal regulations. SECTION 14 – TRANSPORT INFORMATION DOT Classification: N/A Labeling: NA Shipping Name: Not regulated SECTION 15 – REGULATORY INFORMATION Federal and State Regulations: N/A SECTION 16 – OTHER INFORMATION MSDS Code: ENV 1033 MSDS Creation Date: 10/06/2003 Last Revised: April 30, 2013. While the information and recommendations set forth herein are believed to be accurate as of the date hereof, CB&I MAKES NO WARRANTY WITH RESPECT HERETO AND DISCLAIMS ALL LIABILITY FROM RELIANCE THEREON.
SDCSDC‐‐9 9 Technical DataTechnical Data
Robert J. Steffan, Ph.D.Robert J. Steffan, Ph.D.
CB&I Federal Services, LLCCB&I Federal Services, LLC
(Formerly, Shaw Environmental, Inc.)(Formerly, Shaw Environmental, Inc.)( y, , )( y, , )
A World of SolutionsTM

About SDCAbout SDC‐‐99
Isolated in 2002Isolated in 2002
Enrichment culturing with samples from North Island Naval Station, CA Site 9
G l i l L t t l PCE ith t t f Y t E t tGrown exclusively on Lactate plus PCE with trace amounts of Yeast Extract
Grown under strict anaerobic conditions
First commercial-scale application – Treasure Island, CA Site 24– October 6, 2003
Before Biotreatment (2003) After Biotreatment (2010)( )
A World of SolutionsTM 1
Dark Green >10 mg/L TCE
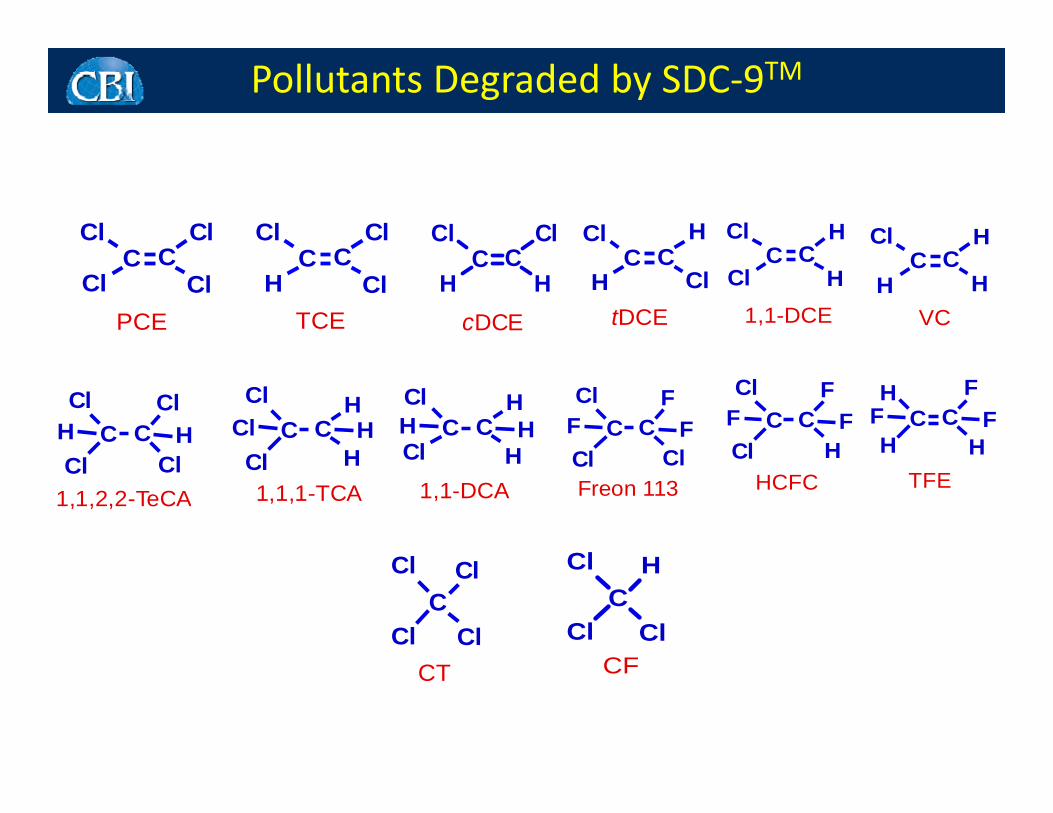
Pollutants Degraded by SDC‐9TM
CCl
CCl
CCl
CCl
CCl
CCl
CCl
CH
CHCl
C CHCl
CCH
CCl
TCE
CCl
CCl
PCE
CH
CH
cDCE
CH
CCl
tDCE
C CCl H
1,1-DCE
C CHH
VC
C
Cl
Cl
CCl
ClHH C
Cl
Cl
CClH
HH C
Cl
ClC
H
HHH C
Cl
Cl
CF
ClFF C
Cl
Cl
CF
FF
H
C CF
FFH H
H
Cl Cl
1,1,2,2-TeCA
Cl H
1,1,1-TCA
Cl H
1,1-DCA
Cl ClFreon 113
Cl
HCFC TFE
Cl Cl H
C
Cl
Cl Cl
Cl
C
Cl
Cl
Cl
H
CFCT CF
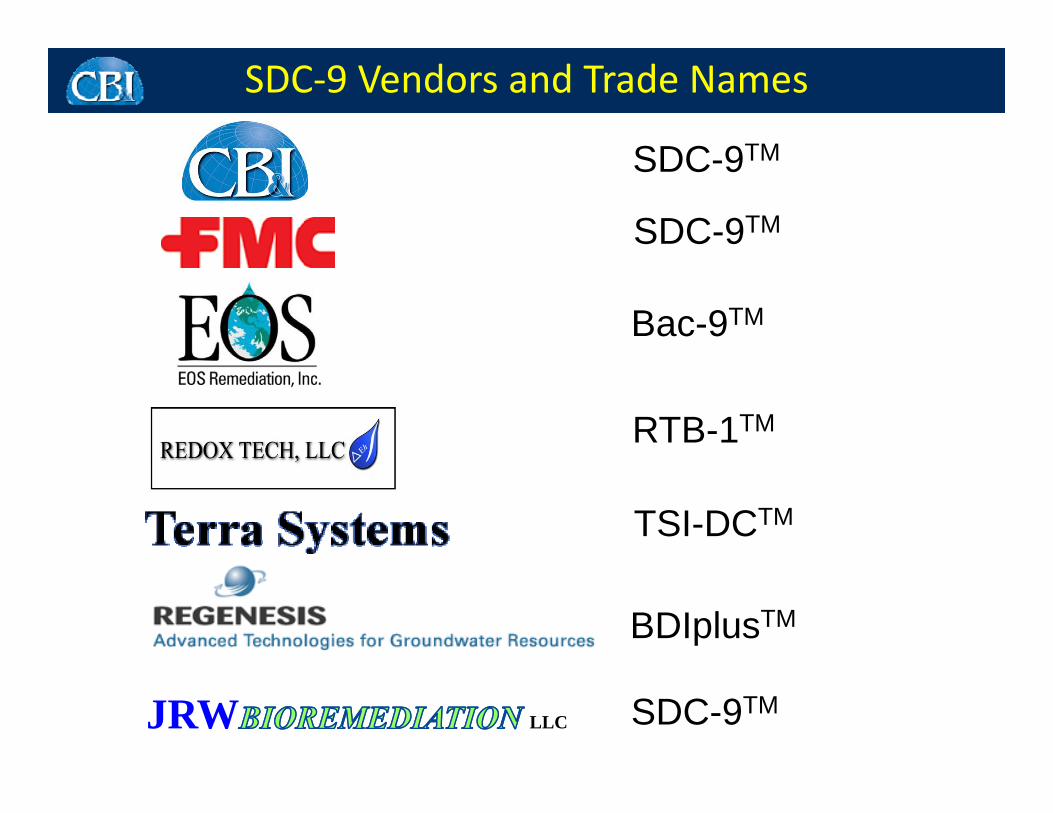
SDC‐9 Vendors and Trade Names
SDC 9TMSDC-9TM
SDC-9TM
Bac-9TM
RTB-1TM
TSI-DCTM
BDIplusTM
JRW LLC SDC-9TM
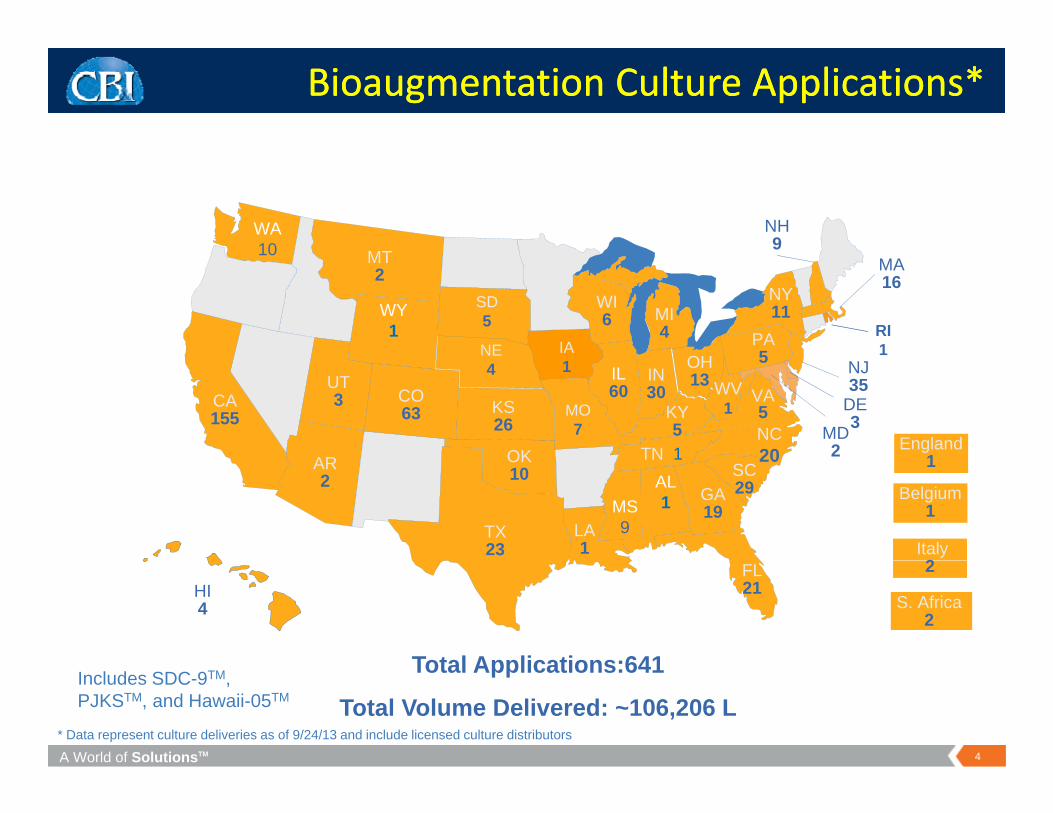
Bioaugmentation Culture Applications*Bioaugmentation Culture Applications*
NH9
WA10 MT
WY1
MA16
NY11
PA5OH
WI6
10
SD5
RI1NE
MI4
MT2
IANJ35
OK
CO63 KS
26CA155
UT3
IL60
IN30
NC20
VA5
5OH13
MO7
WV1KY
5TN 1
NE4
DE3
MD2
AREngland
1
1
AL1
LA1
TX23
OK10
GA19
SC29
20
MS9
TN 1
Italy2
Belgium1
AR2
1
Total Applications:641
S. Africa2
FL21HI
4 S. Africa2
2
A World of SolutionsTM 4
Total Applications:641
Total Volume Delivered: ~106,206 LIncludes SDC-9TM,PJKSTM, and Hawaii-05TM
* Data represent culture deliveries as of 9/24/13 and include licensed culture distributors

Gene Library Analysis by CDM et al.
• 4 Dehalococcoides strains4 Dehalococcoides strains
• vcrA present
M t l l l t d t St i VS A– Most closely related to Strain VS vcrA
– >99% sequence similarity
• bvcA not present

DGEE Analysis of SDC‐91,1,1-TCA Grown PCE Grown
Desulfovibrio spp.
Dehalococcoides spp.
Desulfitobacterium spp.
Desulfovibrio spp.
FLiPS
Dehalococcoides sp. – Common in cVOC-contaminated groundwater – dechlorinateDCE d VC t thDCE and VC to ethene
Desulfovibrio spp. – Common groundwater microbes – reduce sulfate, may dechlorinatePCE and TCE
Desulfitobacterium spp. – Common groundwater microbes – ferment, may dechlorinatePCE and TCE
FLiPS C i DHC ti f li i l hi i h t b li d tFLiPS – Common in DHC consortia - free living polymorphic spirochaetes- believed to ferment. Not recently detected in SDC-9
Also contains Methanogens

DGGE Analysis of Carbon Tet-Grown SDC-9
Band IDE
valueIdentiti
es
Community Uranium
A-1Uncultured bacterium
3.00E-75
188/202 (93%)
Community Uranium Reduction and Reoxidation
U lt d 3 00E 172/172
Anaerobic Polychlorinated Biphenyl D hl i ti
A-2Uncultured bacterium
3.00E-84
172/172 (100%)
Dechlorinating Consortia
B-1, band 1
Bacteroidales bacterium
1.00E-93
189/189 (100%)
Dehalococcoides Population Dechlorinating PCB Mixture Aroclor 1260
B-1, band 2 Same as A-1
B-1, band 3
Uncultured bacterium
2.00E-97
196/196 (100%)
Polychlorinated-dioxin-dechlorinating microbial community
B-1, band 4 Same as A-2
negative control
Shigella boydii, E. coli
5.00E-98
197/197 (100%)
A-1
A-2
B-1
B-2
ne
gativ
eco
ntr
ol

SDCSDC‐‐9 Pathogen Analysis9 Pathogen Analysis
A World of SolutionsTM 8
8Testing performed at least annually; Data available from 2005
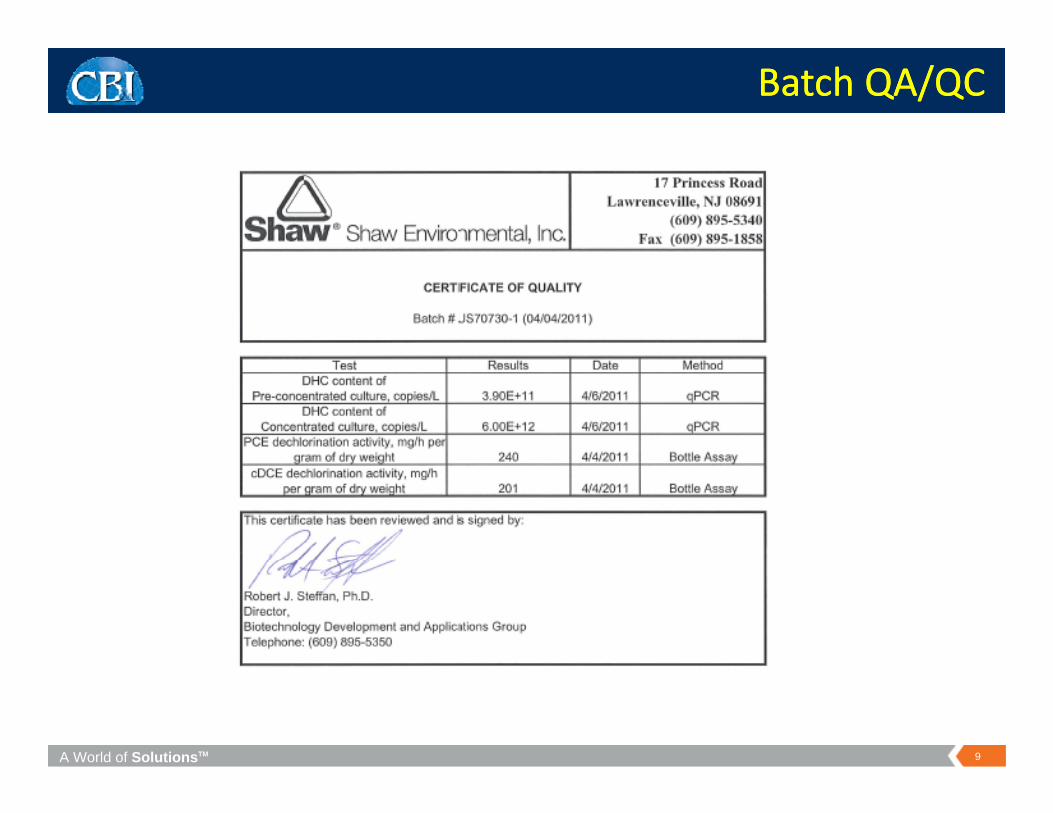
Batch QA/QCBatch QA/QC
A World of SolutionsTM 9

Bioaugmentation/SDCBioaugmentation/SDC‐‐9 Literature9 Literature
•Stedtfeld, R.D., T.M. Stedfeld, M. Kronlein, G. Seyrig, R.J. Steffan, A.M. Cupples, and S.A Hashsham. DNA-extraction free quantification of Dehalococcoides spp. in groundwater using a hand-held device. In press.
•Steffan, R. J. and S. Vainberg. 2013. Production and handling of Dehalococcoides bioaugmentation cultures. pp. 89-113 in, H.F. Stroo, A. Leeson, and C.H. Ward (eds) Bioaugmentation for Groundwater Remediation. Springer Science+Business Media, New York..
•Stroo, H .F., D. W. Major, R. J. Steffan, S. S. Koenigsberg, C. H. Ward. 2013. Bioaugmentation with Dehalococcoides: A decision guide. pp. 117-140 in, H.F. Stroo, A. Leeson, and C.H. Ward (eds) Bioaugmentation for Groundwater Remediation. Springer Science+BusinessMedia, New York..
•Aziz, C., R.Wymore, and R. Steffan. 2013. Bioaugmentation considerations. pp. 141-169 in, H.F. Stroo, A. Leeson, and C.H. Ward (eds) Bioaugmentation for Groundwater Remediation. Springer Science+Business Media, New York..
•Schaefer, C.E., D. R. Lippincott, and R. J. Steffan. 2010. Field-scale evaluation of bioaugmentation dosage for treating Chlorinated ethenes. Ground Water Monitor. Remediat. 30:113-124.••Schaefer, C.E., R.M. Towne, S. Vainberg, J.E. McCray, and R.J. Steffan. 2010. Bioaugmentation for treatment of dense non-aqueous phase liquid in fractured sandstone blocks. Environ. Sci. Technol. 44:4958-4964.
•Schaefer C E S Vainberg C Condee R.J. Steffan. 2009 Bioaugmentation for chlorinated ethenes using Dehalococcoides sp :Schaefer, C. E., S. Vainberg, C. Condee, R.J. Steffan. 2009. Bioaugmentation for chlorinated ethenes using Dehalococcoides sp.: Comparison between batch and column experiments. Chemosphere 75:141-148.
•Vainberg, S., C.W. Condee, R.J. Steffan. 2009. Large scale production of Dehalococcoides sp.-containing cultures for bioaugmentation. J. Indust. Microbiol. Biotechnol. 36:1189-1197.
A World of SolutionsTM 10

SHAW ENVIRONMENTAL
SDC-9TM Case StudiesSDC 9 Case Studies
1
Track #

Moody AFB Bioremediation Site LocationsLocations
LF-04SS-39Site Characteristics LF 04Passive
SS 39Active
• Chlorinated Ethenes- TCE from 100 – 10,000 µg/L
Littl i 1 2 DCE VC
FT-07Passive
- Little or no cis-1,2-DCE, VC
• Aquifer Conditions - DO >1 mg/L Passiveg- ORP >200 mV- pH between ~4.5 – 6.5- GW velocity ~ 150ft/yr
SS-38ActiveSD-16
Passive
• Active Remediation Performance Standards
- TCE/DCE 50 – 1,000 µg/L
2
Track #

Golf Course Area
• TCE >500 ppb• TCE >500 ppb
• Recirculation• Recirculation
• LactateLactate
• Bioaugmentation with SDC-9g
3
Track #

Golf Course Area (SS-39)Pilot Study Results
Golf Course Area (SS-39)Pilot Study Results
TCE concentrations in DEC 03(prior to system start-up)
TCE concentrations in JAN 05(two years post system start-up)
4
Track #

Golf Course Area (SS-39) Expanded Groundwater Recirculation SystemGolf Course Area (SS-39) Expanded Groundwater Recirculation Systemyy
Expanded SystemExpanded System
• TCE > 500 µg/L
• 10 Injection Wells10 Injection Wells
• 8 Extraction Wells
• Carbon SourceSodium Lactate
• BioaugmentationSDC-9
5
Track #
SDC 9
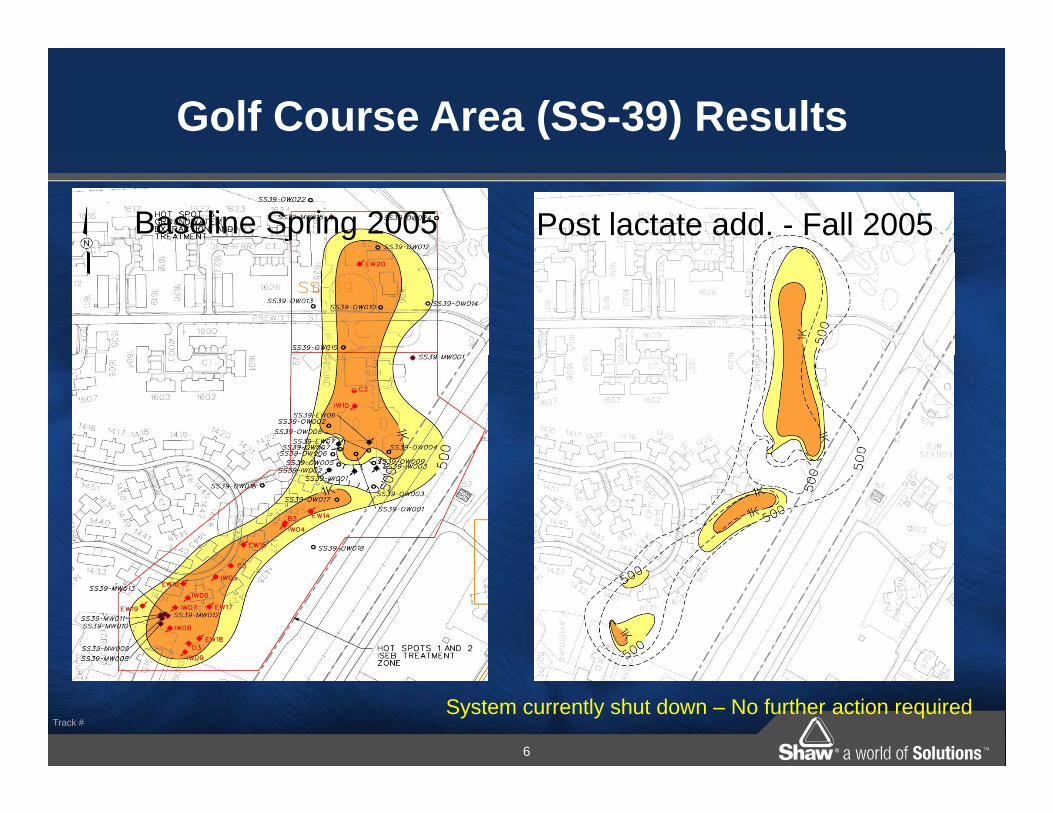
Golf Course Area (SS-39) Results
Baseline Spring 2005 Post lactate add. - Fall 2005
6
Track #System currently shut down – No further action required
Fire Training Area
• Passive Treatment• Passive Treatment
• Lactate
• Bioaugmentation with SDC-9
7
Track #

Former Fire Training Area (FT-07)Anaerobic Bioremediation Pilot Study
Former Fire Training Area (FT-07)Anaerobic Bioremediation Pilot Study
A pilot study was initiated in November 2002 to evaluate direct injection and distribution via ambient groundwater flow.
• HRC injection• HRC injection November 2002
• HRC injectionHRC injection December 2003
• Bioaugmentation gJune 2004
8
Track #

Former Fire Training Area (FT-07)Expanded Passive Delivery SystemFormer Fire Training Area (FT-07)
Expanded Passive Delivery Systemp y yp y y
Expanded Treatment Area
• cis-1,2-DCE > 1,000 µg/L57 G it I j ti W ll• 57 Gravity Injection Wells
• 20-ft Grid Spacing• Carbon Source – Sodium Lactate• Bioaugmentation SDC 9
9
Track #
• Bioaugmentation – SDC-9
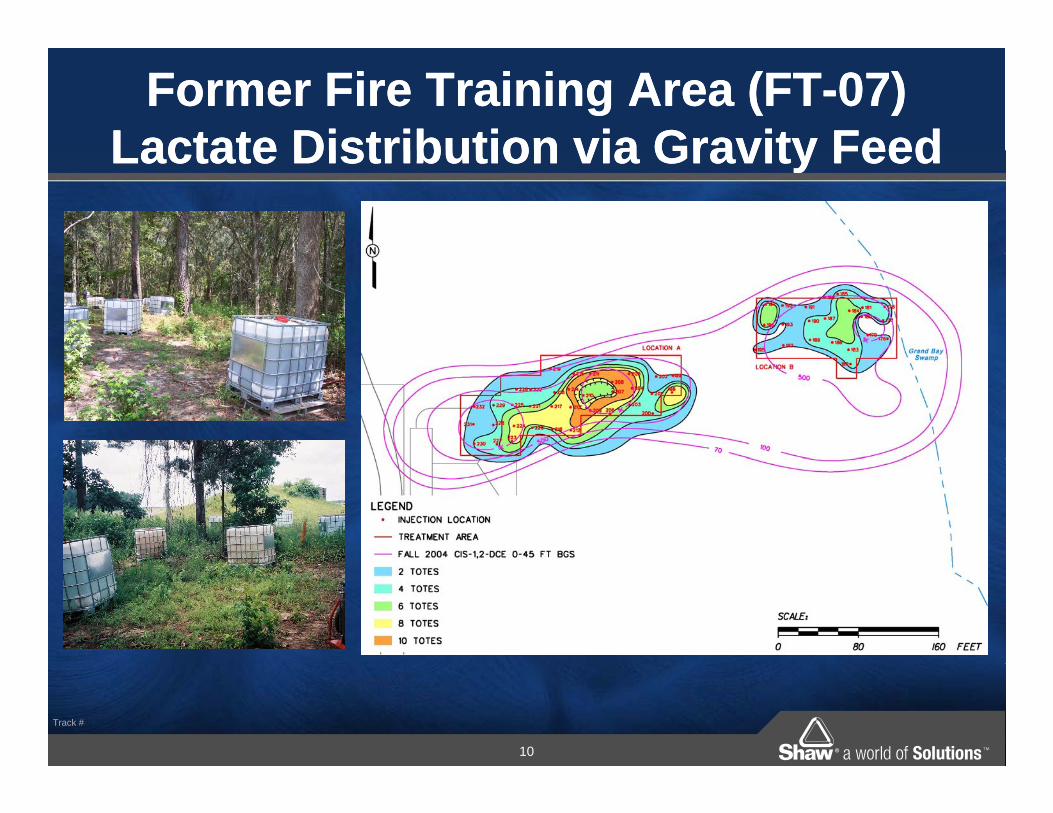
Former Fire Training Area (FT-07)Lactate Distribution via Gravity Feed
Former Fire Training Area (FT-07)Lactate Distribution via Gravity FeedLactate Distribution via Gravity FeedLactate Distribution via Gravity Feed
10
Track #

Former Fire Training Area (FT-07)Pilot Study Results
Former Fire Training Area (FT-07)Pilot Study Resultsyy
VOC and Ethene Trends in Well TW02 at FT-07Moody Air Force Base, Valdosta, Georgia Begin full-scale
12,000
14,000
250
300November 2002,
1st HRC Application,
June 2004, Lactate and SDC-9 Application
November 2003,
2cd HRC Application
August and Nove 2005, Lactate and SDC-9
gPilot test
8,000
10,000
DC
E C
on
c.
( g
/L)
150
200
Eth
ene
Co
nc.
g
/L)
2 000
4,000
6,000
cis
-D(
50
100
TC
E, V
C &
E ( g
1,000 g/L Active remediation Performance
0
2,000
Oct-02 May-03 Sep-03 May-04 Jan-05 5-Oct
0
11
Track #
cis-DCE TCE VC Ethene(230 ug/L) (45 ug/L) (0.97 ug/L)
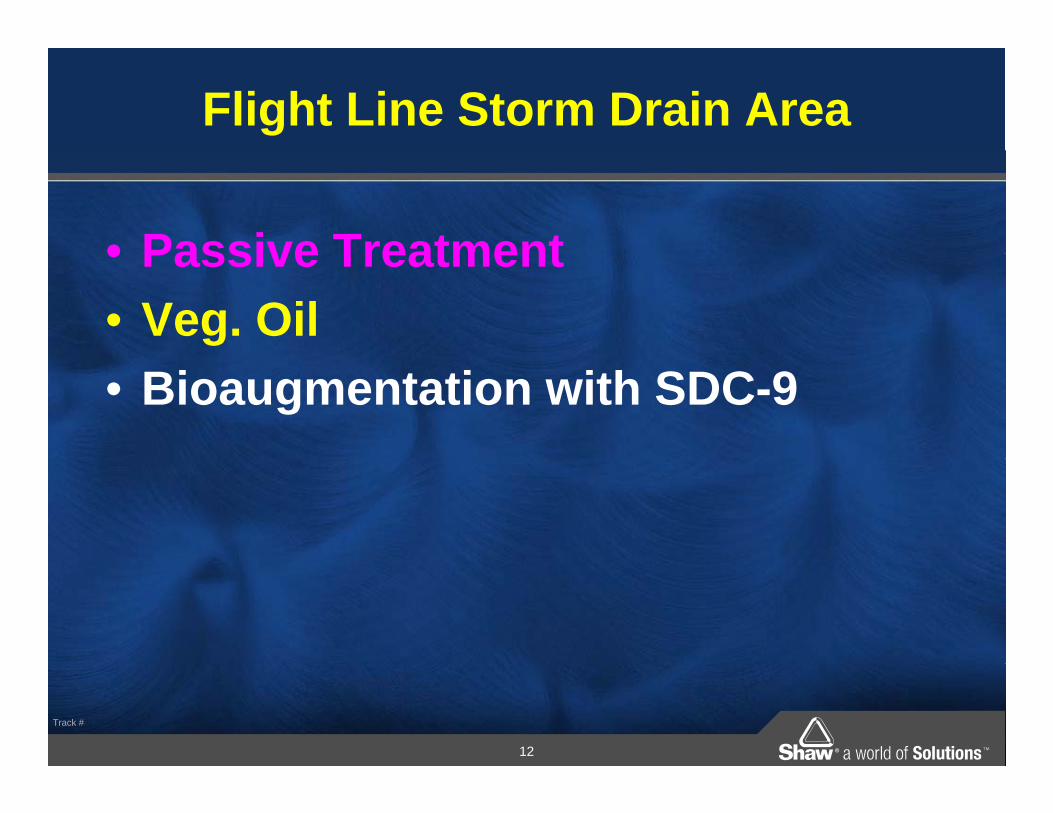
Flight Line Storm Drain Area
• Passive Treatment• Passive Treatment
• Veg. Oil
• Bioaugmentation with SDC-9
12
Track #
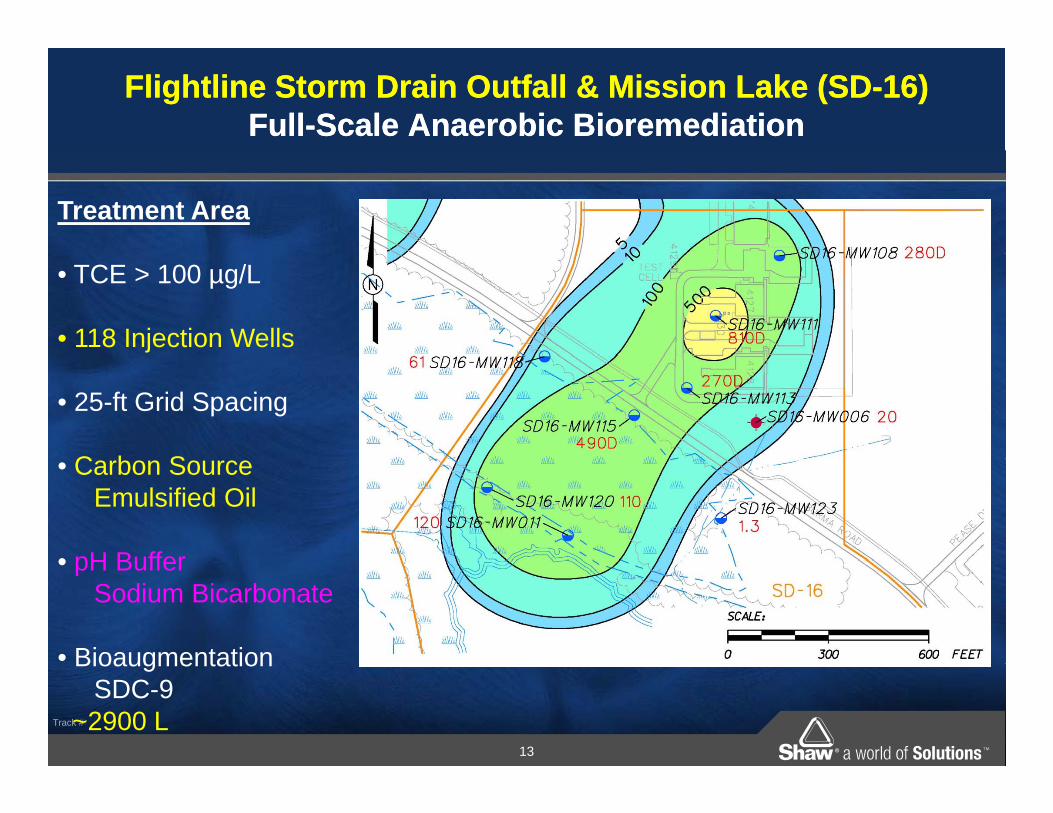
Flightline Storm Drain Outfall & Mission Lake (SD-16)Full-Scale Anaerobic Bioremediation
Flightline Storm Drain Outfall & Mission Lake (SD-16)Full-Scale Anaerobic Bioremediation
Treatment Area
• TCE > 100 µg/L
• 118 Injection Wells
• 25-ft Grid Spacing
C b S• Carbon SourceEmulsified Oil
• pH Buffer• pH BufferSodium Bicarbonate
• Bioaugmentation
13
Track #
BioaugmentationSDC-9
~2900 L
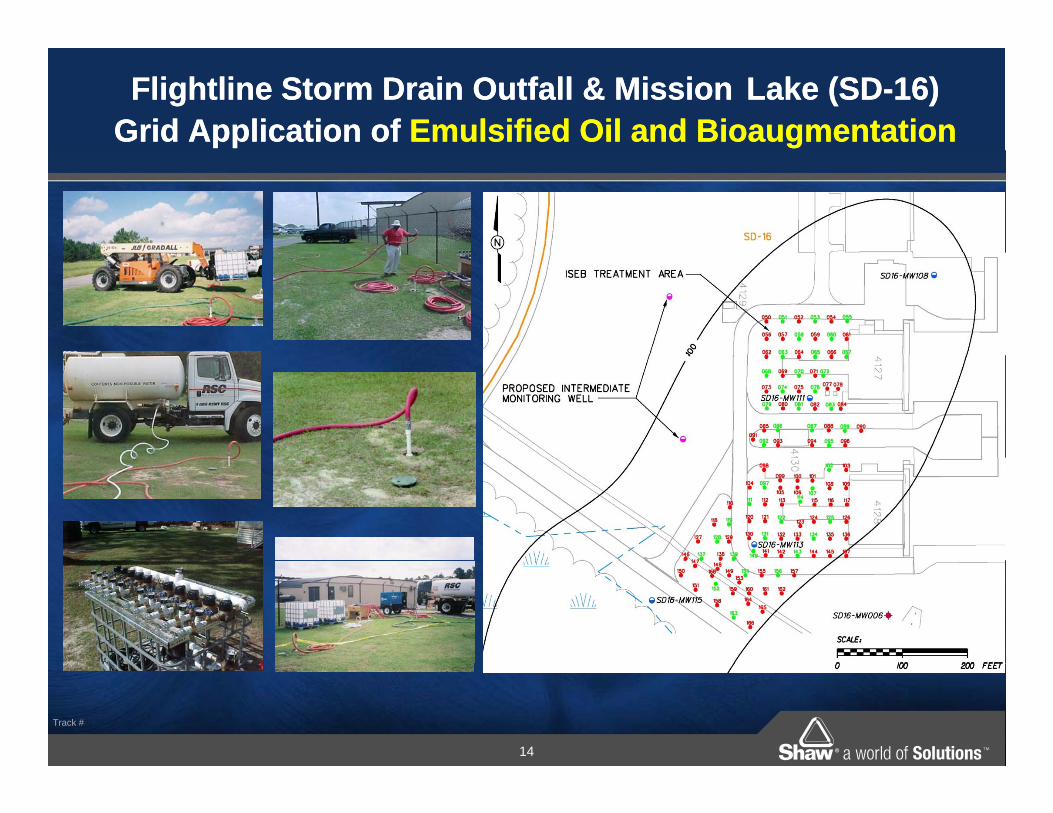
Flightline Storm Drain Outfall & Mission Lake (SD-16)Grid Application of Emulsified Oil and BioaugmentationFlightline Storm Drain Outfall & Mission Lake (SD-16)
Grid Application of Emulsified Oil and Bioaugmentation
14
Track #

Flightline Storm Drain Outfall & Mission Lake (SD-16)Performance Monitoring Results
Flightline Storm Drain Outfall & Mission Lake (SD-16)Performance Monitoring Results
Geochemical Trends over TimeM it i W ll SD16 MW111Monitoring Well SD16-MW111
15
Track #

Flightline Storm Drain Outfall & Mission Lake (SD-16)Performance Monitoring Results
Flightline Storm Drain Outfall & Mission Lake (SD-16)Performance Monitoring Results
Carbon, Metabolic Acids, and pH Trends over TimeMonitoring Well SD16-MW111Monitoring Well SD16 MW111
16
Track #
Flightline Storm Drain Outfall & Mission Lake (SD-16)Performance Monitoring Results
Flightline Storm Drain Outfall & Mission Lake (SD-16)Performance Monitoring Results
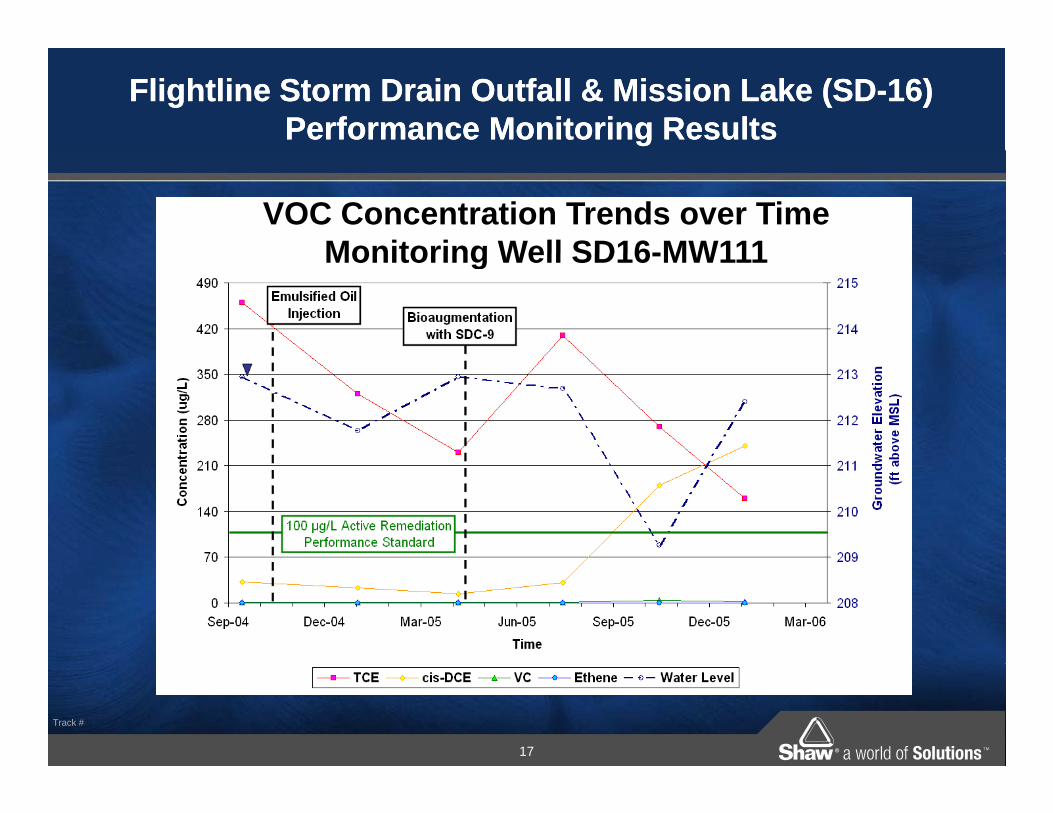
VOC Concentration Trends over TimeMonitoring Well SD16-MW111Monitoring Well SD16-MW111
17
Track #

Flight Line Full Scale
• Recirculation – Horizontal Wells• Recirculation – Horizontal Wells
• Lactate
• Bioaugmentation with SDC-9
18
Track #

Flightline Area (SS-38)Full-Scale Anaerobic Bioremediation
Flightline Area (SS-38)Full-Scale Anaerobic Bioremediation
Treatment AreasTreatment Areas
• TCE and 1,1-DCE > 400 µg/L
• Locations 1 and 5Passive Distribution
• Location 3 Ground-Location 3 Groundwater Recirculation
•Lactate
•Bioaug. with SDC-9
19
Track #

Flightline Area (SS-38)Anaerobic Bioremediation w/ Groundwater Recirculation
Flightline Area (SS-38)Anaerobic Bioremediation w/ Groundwater Recirculation
Location 3 Treatment Area• 1 Horizontal Injection Well• 1 Horizontal Injection Well• 1 Horizontal Extraction Well
• 700 ft, 500 ft. screened• Carbon Source – LactateCarbon Source Lactate• Bioaugmentation – SDC-9
• 925 L
20
Track #

Flightline Area (SS-38)Performance Monitoring Results
Flightline Area (SS-38)Performance Monitoring Resultsgg
ORP Readings in Treatment Area Monitoring Wells
21
Track #

Flightline Area (SS-38)Monitoring Well SS38-MW093 Results
Flightline Area (SS-38)Monitoring Well SS38-MW093 Results
22
Track #

Flightline Area (SS-38)Performance TCE Monitoring Results
Flightline Area (SS-38)Performance TCE Monitoring ResultsPerformance TCE Monitoring ResultsPerformance TCE Monitoring Results
Base lineApril 2005
January 20069-months post system
23
Track #
April 2005 start-upSystem currently shut down – No further action required

Active versus Passive DistributionActive versus Passive Distribution
Site Anaerobic Daughter Adequate S e ae ob cConditions
aug eProducts
dequa eDistribution
SS-39 (active) < 3 months < 3 months Yes
FT-07 (passive) NA 3-6+ months OK
SD-16 (passive) 3-6 months 9-12 months YesSD 16 (passive)
SS-38 (active) < 3 months < 3 months Yes
SS-38 (passive) 3-6 months 9-12 months Yes
LF-04 (passive) Performance Monitoring Data Not Yet Available
24
Track #
LF 04 (passive) g

NGWA.org Ground Water Monitoring & Remediation 1
Copyright © 2010 Shaw Environmental, Inc.Journal compilation © 2010 National Ground Water Association.doi: 10.1111/j1745–6592.2010.01297.x
Field-Scale Evaluation of Bioaugmentation Dosage for Treating Chlorinated Ethenes
by Charles E. Schaefer, David R. Lippincott, and Robert J. Steffan
AbstractA field demonstration was performed to evaluate the impacts of bioaugmentation dosage for treatment of chlorinated
ethenes in a sandy-to-silty shallow aquifer. Specifically, bioaugmentation using a commercially available Dehalococcoides (DHC)-containing culture was performed in three separate groundwater recirculation loops, with one loop bioaugmented with 3.9 × 10¹¹ DHC, the second loop bioaugmented with 3.9 × 10¹² DHC, and the third loop bioaugmented with 3.9 × 10¹³ DHC. Groundwater monitoring was performed to evaluate DHC growth and migration, dechlorination rates, and aquifer geochemistry. The loop inoculated with 3.9 × 10¹² DHC showed slower dechlorination rates and DHC migration/growth compared with the other loops. This relatively poor performance was attributed to low pH conditions. Results for the loops inoculated with 3.9 × 10¹¹ and 3.9 × 10¹³ DHC showed similar timeframes for dechlorination, as evaluated at a monitoring well approximately 10 feet downgradient of the DHC injection well. Application of a recently developed one-dimensional bioaugmentation fate and transport screening model provided a reasonable prediction of the data in these two loops. Overall, these results suggest that increasing bioaugmentation dosage does not necessarily result in decreased dechlorination time-frames in the field. The ability to predict results suggests that modeling potentially can serve as an effective tool for deter-mining bioaugmentation dosage and predicting overall remedial timeframes.
IntroductionChlorinated ethenes, such as tetrachloroethene (PCE) and
trichloroethene (TCE), have been used extensively as indus-trial solvents and cleaning agents at several government and private sector facilities. This widespread use, in addition to improper disposal practices and the stability of chlorinated ethenes, has led to them becoming common groundwater contaminants. One in situ technology that has proven to be effective at treating chlorinated ethenes is bioaugmentation (United States Environmental Protection Agency [USEPA] 2004; Interstate Technology & Regulatory Council 2005, 2007). Bioaugmentation for chlorinated ethenes involves delivery of electron donor, bacteria, and (if needed) nutrients to the subsurface for the purpose of facilitating microbially enhanced reductive dechlorination. The most accepted form of bioaugmentation for chlorinated ethenes involves the use of mixed anaerobic cultures that contain Dehalococcoides (DHC) sp., or closely related strains, that can reductively dechlorinate the chlorinated ethenes; DHC are the only bacteria known to completely dechlorinate PCE and TCE (Maymó-Gatell et al. 1997).
Several studies have been performed using model or real aquifers to evaluate bioaugmentation for treating chlorinated ethenes and for evaluating the relationship between mea-sured DHC concentration and observed dechlorination rates. Using laboratory silica sand columns, Amos et al. (2009) showed that bioaugmented DHC responsible for dechlo-rination were primarily associated with the solid phase. In contrast, Schaefer et al. (2009) showed that the bioaug-mented DHC were primarily associated with the aqueous phase (with the exception of a localized region near the col-umn influent), and Lu et al. (2006) showed that there was a relationship between DHC in groundwater and observed dechlorination rates.
Although the studies referenced earlier have provided substantial insight into the processes that control DHC growth, distribution, and dechlorination kinetics during bioaugmentation, there currently exists considerable uncer-tainty when designing and implementing bioaugmentation at the field scale. These uncertainties can have substantial ramifications on the technical and economic success of in situ bioaugmentation. Key unknowns include uncertainty related to the inoculated DHC dosage needed to treat a contaminated site, the transport and distribution of DHC in the aquifer, and DHC activity with respect to growth and dechlorination rates (Environmental Security Technology Certification Program 2005). In particular, the relationship
2 C.E. Schaefer et al./ Ground Water Monitoring & Remediation NGWA.org
between DHC injection dosage and aquifer response with respect to DHC distribution and observed dechlorination rates is poorly understood. No generally accepted concep-tual model exists and (to the best of our knowledge) no pub-lished field studies exist that can sufficiently address these uncertainties.
The purpose of this study was to quantitatively evalu-ate bioaugmentation performance at the field scale by measuring DHC distribution and growth and dechlorination of TCE, cis-1,2-dichloroethene (DCE), and vinyl chloride as a function of bioaugmentation dosage. Field results were evaluated using a previously developed bioaugmentation model. The model was used to provide additional insights into the mechanisms controlling the observed behavior.
Methods
Generalized ApproachThe bioaugmentation evaluation was performed by
delivering DHC to three groundwater recirculation loops for treating TCE and DCE; each groundwater recircula-tion loop was inoculated with a different DHC dosage. A fourth groundwater recirculation loop, which received no DHC inoculation, served as a control. Groundwater was monitored within each recirculation loop to evaluate the extent of TCE and DCE dechlorination over time and to determine DHC growth and migration. Results among the recirculation loops were compared to assess the impact of bioaugmentation dosage on observed treatment timeframes and overall effectiveness.
Demonstration Location and DescriptionThe bioaugmentation demonstration was performed at
Fort Dix, which is located in Burlington and Ocean coun-ties, New Jersey, approximately 25 miles southeast of Trenton. The actual demonstration plot was located within the MAG-1 Area, which is located in the northern part of the Cantonment Area at Fort Dix. The geology underlying the field demonstration site consisted of unconsolidated materials from the Kirkwood and Manasquan formations. Results of the predemonstration testing to evaluate the hydrogeology and contaminant distribution in the test area are summarized in Figure 1. Soils from the targeted bio-augmentation zone (approximately 104 to 90 feet mean sea level [MSL]) consisted of saturated, light gray silty fine sands (Kirkwood Formation). A 4- to 8-inch-thick interface zone, consisting of fine-to-coarse sands and fine gravel, is present at the base of this unit. The interface zone appears to exhibit significantly higher permeability than the formations above and below. Dissolved contaminants consisted primar-ily of TCE and DCE at concentrations up to 2900 µg/L, as measured via discrete Geoprobe® sampling points. Baseline sampling events showed that no vinyl chloride or ethene was present in the test area groundwater. Hydraulic con-ductivities estimated using slug test data ranged from 0.6 to 1.8 m/day in the targeted zone of the Kirkwood Formation. Ambient groundwater velocity through the demonstra-tion zone was approximately 0.0018 m/day. Measurement
of TCE and DCE concentrations in soil samples collected adjacent to the Geoprobe groundwater sampling points allowed for estimation of a linear adsorption coefficient; the estimated values for TCE and DCE were 2.1 and 1.1 L/kg, respectively.
Recirculation System Design and Amendment AdditionA groundwater recirculation system was installed and
implemented for the bioaugmentation demonstration. The system design consisted of four pairs of injection/ extraction wells (IW-1 through IW-4 and EX-1 through EX-4) oper-ating at approximately 1.9 L/min/pair; this system was located in the center of the TCE/DCE groundwater plume. The actual surveyed system layout, including performance monitoring wells (BMW-1 through BMW-8) within each recirculation loop, is shown in Figure 2. These monitoring wells were spaced approximately 10 and 20 feet downgra-dient of the groundwater injection well. Three additional performance-monitoring wells (BMW-9 through BMW-11) were located between or sidegradient of select loops. Loop 4 was used as a control loop. Well construction details are summarized in Table 1.
Amendment metering pumps for delivery of electron donor (sodium lactate), tracer (sodium bromide), and buf-fer (sodium bicarbonate and/or sodium carbonate) solutions were installed within a Conex box. A 836-L polyethylene tank containing a 50:50 volume mix of 60% liquid sodium lactate solution and deionized water was used to deliver electron donor to each of the recirculation loops. The lactate solution was metered into each of the four injection wells (operating at approximately 1.9 L/min) at 0.0025 L/min, thereby attaining a final sodium lactate injection concentra-tion of 400 mg/L. An additional eight 836-L polyethylene tanks were used to deliver buffer and nutrients (diammonium phosphate and yeast extract). The solution was metered into each of the injection wells between 0.048 and 0.12 L/min, thereby attaining a final buffer injection concentration of between approximately 1700 and 4300 mg/L. Sodium bicarbonate buffer was used from start-up (November 16, 2007) until December 11, 2007, at which time the buffer used was changed to sodium carbonate to more effectively increase pH within the aquifer. Additionally, diammo-nium phosphate was mixed into the buffer solution tanks, attaining a final injection concentration of approximately 75 mg/L. The final injection concentration for the yeast extract was approximately 50 mg/L. Individual feed lines were run from the tanks to the corresponding metering pump and from the metering pump to injection racks installed within a second Conex box. The injection racks contained filter housings, flow meters, pressure gauges, and injection ports for the amendments.
Bulk injections of sodium carbonate were performed on December 27, 2007 (45 kg/well) and January 15, 2008 (68 kg/well) at each of the four groundwater injection wells. Sodium carbonate powder was mixed in drums with ground-water extracted from each of the injections wells, then rein-jected into the wells. These bulk injections were performed to further elevate groundwater pH values that still largely remained below 5.5 standard units after several weeks of system operation.

NGWA.org C.E. Schaefer et al./ Ground Water Monitoring & Remediation 3
Tracer TestingAmendment delivery and recirculation, as described in
the previous section, were performed for a 10-week start-up period. During this start-up period, a tracer test was per-formed concurrently using sodium bromide in loops 1 and 3. Forty-five kilograms of sodium bromide was mixed into the buffer tanks with site groundwater. A total of 1938 L of solution (three 646-L batches), with an average bromide concentration of approximately 9100 mg/L, was prepared in the buffer tanks for loops 1 and 3. Tracer injections began on November 16, 2006, and were completed on December 14, 2007. The buffer metering pumps were used to inject the tracer solution continuously into the injection wells during
active groundwater recirculation periods. The bromide solu-tion was metered into the injection wells at 0.048 L/min at an average injection well concentration of approximately 225 mg/L.
Groundwater sampling was performed at select moni-toring locations within the demonstration area to monitor migration of tracer, lactate, and carbonate, to determine the appropriate changes in aquifer geochemical conditions (i.e., decreases in dissolved oxygen and other electron acceptors and decreases in oxidation-reduction potential [ORP]), to evaluate changes in dissolved chlorinated ethene concentra-tions due to system mixing, and to determine baseline con-ditions prior to bioaugmentation.
Figure 1. Demonstration area’s geologic cross section and contaminant distribution.

4 C.E. Schaefer et al./ Ground Water Monitoring & Remediation NGWA.org
BioaugmentationBioaugmentation was performed on May 1, 2008
(approximately 150 days after recirculating amendments) using the commercially available SDC-9 culture (Shaw Environmental Inc., Lawrenceville, New Jersey). The dechlo rination and growth kinetics of this DHC- containing culture have been described previously (Schaefer et al. 2009). Bioaugmentation implementation consisted of first pumping approximately 190 L of groundwater from wells BMW-1, BMW-3, and BMW-5 into individual 55-gallon drums. Drums were amended with lactate, diammonium phosphate, and yeast extract for final concentrations of 16,000, 1000, and 1000 mg/L, respectively. The SDC-9 culture, which was delivered to the site under nitrogen pressure in three individual soda kegs, was injected into wells BMW-1, BMW-3, and BMW-5 through Tygon tubing that was lowered into the water column within each well to the approximate middle of the screened interval. The groundwater injection wells (IW1 through IW4) were not used for delivery of the SDC-9 culture because of locally
elevated pH (∼10) measured in these wells. The concentra-tion of DHC in the soda kegs, as measured via quantitative polymerase chain reaction (qPCR), was 3.9 × 10¹¹ DHC/L. The tubing was connected to a valve on the outlet port of each soda keg containing the bacteria. A nitrogen cylinder was connected to the inlet port of the soda keg. The soda keg was pressurized to approximately 10 psi using the nitro-gen, and the outlet valve was opened allowing the culture to be injected into each well.
A total of 100 L (10 L of culture concentrated 10 times; 3.9 × 10¹³ DHC), 10 L (3.9 × 10¹² DHC), and 1 L (3.9 × 10¹¹ DHC) of culture was injected into wells BMW-1, BMW-3, and BMW-5, respectively. Bioaugmentation was not per-formed at well BMW-7 in recirculation loop 4, as this was used as the control loop. Each bioaugmentation injection took approximately 20 min to perform. Once the injec-tion of the culture was complete, the 190 L of groundwater extracted from each of the injection wells was pumped back into the respective wells to further distribute the culture within the surrounding formation.
Figure 2. Demonstration layout.

NGWA.org C.E. Schaefer et al./ Ground Water Monitoring & Remediation 5
System Operation and MonitoringAfter bioaugmentation was performed, the recirculation
system was operated in an intermittent mode (approximately 10 days “on” and 10 days “off”). In addition, groundwater recirculation flow rates were decreased to approximately 0.57 L/min due to increasing pressures at the injection wells and to limit cross flow between the loops.
Groundwater samples were collected by utilizing low-flow purging in accordance with New Jersey Department of Environmental Protection Low Flow Purging and Sampling Guidance, with the exception of purge times being limited to 60 min at each well before samples are collected. Samples were obtained using dedicated sub-mersible bladder pumps and Teflon® tubing. A YSI field meter (YSI, Inc.) with a flow-through cell was used to col-lect measurement of field geochemical parameters (pH, ORP, temperature, specific conductivity, and dissolved oxygen). Analyses of groundwater collected during the performance monitoring sampling events included vola-tile organic compounds, reduced gases, volatile fatty acids (VFAs), anions, and qPCR to measure DHC concentra-tions in groundwater.
Analytical MethodsAnalysis of chloride, bromide, nitrate, nitrite, and sul-
fate by EPA Method 300.0, VFAs by EPA Method 300m, chlorinated ethenes by EPA Method 8260, and reduced gases by EPA Method 8015 were performed at Shaw’s cer-tified analytical laboratory in Lawrenceville, New Jersey. DHC concentrations in the groundwater samples were determined by quantitative real-time PCR with primers (5′- gaagtagtgaaccgaaagg and 5′-tctgtccattgtagcgtc) that amplified a 235-bp fragment of the 16s rRNA gene of DHC-type organisms.
Results and Discussion
Tracer and Amendment DistributionThe bromide tracer was distributed through loops
1 and 3 quickly, with detectable concentrations of bromide observed at extraction wells EX-1 and EX-3 within 10 and 18 days, respectively. Analysis of the tracer test data indi-cated that the estimated travel time of the bromide tracer through loops 1 and 3 (from the injection to the extraction
Table 1Well Construction Details
Well ID
Ground Surface Elevation
(feet MSL)
Top of Casing Elevation
(feet MSL)
WellDiameter
(inch)
Depth to Topof Screen(feet bgs)
Depth toBottom of
Screen(feet bgs)
ScreenLength (feet)
Top of Screen Elevation
(feet MSL)
Bottom ofScreen
Elevation(feet MSL)
Injection wells
IW-1 109.27 111.44 6.0 8.0 18.0 10.0 101.3 91.3
IW-2 110.93 113.54 6.0 9.5 19.5 10.0 101.4 91.4
IW-3 112.38 115.28 6.0 11.5 21.5 10.0 100.9 90.9
IW-4 114.87 118.70 6.0 13.5 23.5 10.0 101.4 91.4
Extraction wells
EX-1 110.15 113.85 6.0 8.5 18.5 10.0 101.7 91.7
EX-2 111.90 115.06 6.0 10.5 20.5 10.0 101.4 91.4
EX-3 113.46 116.54 6.0 12.0 22.0 10.0 101.5 91.5
EX-4 116.25 118.91 6.0 15.0 25.0 10.0 101.3 91.3
Monitoring wells
BMW-1 109.76 112.10 2.0 8.0 18.0 10.0 101.8 91.8
BMW-2 110.10 112.44 2.0 8.5 18.5 10.0 101.6 91.6
BMW-3 111.43 111.14 2.0 10.0 20.0 10.0 101.4 91.4
BMW-4 110.70 111.28 2.0 10.5 20.5 10.0 100.2 90.2
BMW-5 112.98 115.38 2.0 11.5 21.5 10.0 101.5 91.5
BMW-6 113.25 112.88 2.0 11.5 21.5 10.0 101.8 91.8
BMW-7 115.50 117.77 2.0 14.0 24.0 10.0 101.5 91.5
BMW-8 116.31 118.31 2.0 14.5 24.5 10.0 101.8 91.8
BMW-9 109.66 111.96 2.0 8.0 18.0 10.0 101.7 91.7
BMW-10 109.24 111.72 2.0 8.0 18.0 10.0 101.2 91.2
BMW-11 110.27 109.92 2.0 9.0 19.0 10.0 101.3 91.3

6 C.E. Schaefer et al./ Ground Water Monitoring & Remediation NGWA.org
well) was approximately 30 to 40 days, with an average groundwater velocity of 0.23 to 0.30 m/day. These estimates were based on groundwater extraction/reinjection rates of 1.9 L/min/loop. However, because groundwater extraction rates were reduced to 0.57 L/min and were operated in an intermittent mode after bioaugmentation was performed, the average groundwater velocity was significantly decreased (to approximately 0.025 m/day) during the bioaugmentation portion of the demonstration. Tracer results for BMW-1 are provided in the Supporting Information.
Limited cross flow occurred between loops 1 and 2 and loops 3 and 4 during the tracer test. Bromide concentra-tions observed within loops 2 and 4 were generally 1 to 2 orders of magnitude below those observed in loops 1 and 3. As previously discussed, groundwater extraction rate was 1.9 L/min for each of the four extraction wells during the tracer testing. This pumping rate was reduced after the tracer test was completed, which resulted in a decrease in bromide concentration in loops 2 and 4 to approximately 1 mg/L (bromide concentrations remained above 20 mg/L in loops 1 and 3 throughout the demonstration). Additionally, as discussed in subsequent sections, vinyl chloride, ethene, and elevated DHC concentrations were not observed in the control loop (loop 4), indicating that significant cross flow between loops 3 and 4 likely was not occurring at the reduced (0.57 L/min) flow rates during the bioaugmentation portion of the demonstration.
Sidegradient monitoring well BMW-9 showed elevated VFA and bromide concentrations throughout the demon-stration. However, sidegradient monitoring wells BMW-10 and BMW-11 did not show any impacts of the recirculation system (i.e., no measureable bromide or VFAs). Based on these data, amendment distribution in each loop subsequent to bioaugmentation was estimated at 15 to 25 feet perpen-dicular to recirculation flow (as indicated by the dashed out-line for each loop in Figure 2).
During amendment delivery, but prior to bioaugmenta-tion, several changes in aquifer geochemical and contami-nant conditions were observed. Monitoring wells BMW-1 through BMW-8 showed that addition of the buffer solutions resulted in a gradual increase in aquifer pH from approxi-mately 4.5 to 6.5. Distribution of lactate was evidenced by VFA concentrations (predominantly lactate fermentation products acetate and propionate) ranging from 50 to 2000 mg/L at the monitoring wells. ORP values decreased from baseline levels of approximately +100 mV to approximately −200 mV in the monitoring wells in each of the four loops, and sulfate concentrations decreased from approximately 50 to 3 mg/L.
Prebioaugmentation amendment delivery also resulted in substantial decreases in TCE at BMW-5 and small-to-moderate decreases in TCE at BMW-7 and BMW-8 (Figures 3 through 6). Results of preliminary labora-tory column experiments using site soil and groundwater showed that addition of electron donor without bioaugmen-tation resulted in dechlorination of TCE but no subsequent dechlorination of DCE and vinyl chloride. The observed decreases in TCE concentrations in the field results are consistent with this laboratory result. However, as shown in Figures 3 through 6, a stochiometric increase in DCE
(or any other ethene) was not observed in the field prior to bioaugmentation. This is particularly evident at BMW-5. Thus, the decreases in TCE observed prior to bioaugmenta-tion may be partially due to in situ mixing effects rather than reductive dechlorination.
No generation of vinyl chloride or ethene occurred prior to bioaugmentation in any of the monitoring locations. Measured DHC concentrations at monitoring wells in all four loops increased from baseline concentrations of approx-imately 103 (prior to amendment addition) to 104 to 105 DHC/L (after approximately 140 days of amendment addi-tion and just prior to bioaugmentation) (Figures 3 through 6). The lack of measureable DCE dechlorination despite these increasing DHC levels likely is the result of slow dechlori-nation kinetics and/or the inability of native DHC to dechlo-rinate DCE.
Bioaugm entationAs shown in Figures 3 through 5, bioaugmentation
at BMW-1, BMW-3, and BMW-5 resulted in a substan-tial increase in DHC concentrations; DHC concentrations in these wells measured 18 days after bioaugmentation showed increases that were approximately proportional to the DHC injection dosage. Bioaugmentation also resulted in dechlorination of TCE and DCE, as evidenced by vinyl chloride and ethene generation measured in the bioaugmen-tation injection locations. With the exception of BMW-1, DHC concentrations increased in the monitoring wells fol-lowing the initial bioaugmentation (the reason for this lack of observed growth in BMW-1 is discussed in the modeling Results section). DHC concentrations in the control loop show a gradual increase to 106 DHC/L over the course of the demonstration. This increase could be due to a slow migration of DHC from loop 3 and/or the slow growth of indigenous DHC. However, no measureable DCE dechlori-nation (as evidenced by vinyl chloride or ethene generation) was observed in the control loop during the duration of the demonstration (Figure 6).
Comparison among BMW-1, BMW-3, and BMW-5 shows that DHC dosage affects the timeframe for DCE dechlorination. DCE conversion to ethene was most rapid in BMW-1 (highest DHC dosage, with conversion occur-ring within 14 days) and slowest in BMW-5 (lowest DHC dosage, with substantial conversion occurring in 50 to 100 days). These data also suggest that DHC groundwa-ter concentrations were (approximately) proportional to the observed dechlorination timeframes.
Results at the downgradient monitoring well in each treatment loop (i.e., BMW-2, BMW-4, and BMW-6) also were compared. Evidence of DCE dechlorination and increases in DHC concentration were delayed in BMW-2 and BMW-6 by several weeks (relative to the bioaugmenta-tion injection wells). This delay is presumably due to the travel time required for DHC and treated groundwater to migrate downgradient. Interestingly, both BMW-2 and BMW-6 show removal of DCE in approximately 250 days, despite a 100-fold difference in DHC dosage in the treat-ment loop.
In contrast, results at BMW-4 show limited DCE dechlorination, and DHC concentrations remained below

NGWA.org C.E. Schaefer et al./ Ground Water Monitoring & Remediation 7
107 DHC/L. One explanation for the relatively poor treat-ment at this monitoring location is that pH levels ranged from 4.9 to 5.8 during at least a 64-day period (days 116 to 180) in this well. At these pH levels, DHC dechlorination of DCE is severely inhibited (Vainberg et al. 2009). Increasing the buffer concentration ultimately resulted in an increase in pH within this loop. The decrease in DCE, accompanied by
the increase in DHC and vinyl chloride, at day 150 suggests that treatment was beginning to occur in this well by the end of the demonstration period.
Increases in DHC levels (∼107 DHC/L) were measured in EX-1 by day 193. Increases in DHC levels at EX-2 and EX3 (107 and 108 DHC/L, respectively) were measured by day 248. Ethene concentrations at EX-1 through EX-3 by
Figure 3. Ethenes and DHC concentrations plotted as a function of time for loop 1. Bioaugmentation was performed at 0 days. Ω, TCE; ■, DCE; ▲, vinyl chloride; ●, ethene; ◆, DHC. Solid and dotted lines represent corresponding model simulations. Simulated DHC concentrations in the bioaugmentation injection well (BMW-1) include the total (mobile and immobile) DHC.

8 C.E. Schaefer et al./ Ground Water Monitoring & Remediation NGWA.org
day 248 were 0.5, 0.06, and 1.3 µM, respectively. These data suggest that DHC and treated groundwater were migrat-ing toward the extraction wells. However, no measure-able decrease in DCE concentrations was measured at the extraction wells, suggesting that the extraction wells were still capturing untreated groundwater from the sidegradient and/or downgradient aquifer.
Screening-Level ModelTo provide a first-level evaluation of in situ dechlori-
nation rates and DHC growth, and to further evaluate the
mechanisms responsible for the observed microbial growth and dechlorination rates, the one-dimensional screening-level bioaugmentation model developed by Schaefer et al. (2009) for the SDC-9 culture was applied to demonstra-tion loops 1 and 3. This model uses Monod kinetics to describe DHC growth and dechlorination rates (determined for the SDC-9 culture in batch kinetic studies) and applies an attachment-detachment–type mechanism to describe DHC migration through soil. The model assumes that both immobile and mobile DHC near the bioaugmentation injection well, and mobile DHC migrating downgradient
Figure 4. Ethenes and DHC concentrations plotted as a function of time for loop 2. Bioaugmentation was performed at 0 days. Ω, TCE; ■, DCE; ▲, vinyl chloride; ●, ethene; ◆, DHC.

NGWA.org C.E. Schaefer et al./ Ground Water Monitoring & Remediation 9
from the bioaugmentation injection well, contribute to contaminant dechlorination. This finite difference model (Δx = 1 foot, Δt = 0.4 days) was applied to describe DHC growth and dechlorination from BMW-1 to BMW-2 and from BMW-5 to BMW-6. Because of the low pH issue at BMW-4, which likely resulted in inhibition of DCE dechlorination, the model was not applied to loop 2. The simulated porosity was assumed to be 0.35, and the super-ficial velocity for loops 1 and 3 was estimated (based on the bromide tracer data and adjusted based on the reduc-
tion in recirculation flow rate after bioaugmenting in each loop) at 0.021 and 0.029 m/day, respectively. The disper-sivity was estimated based on the bromide tracer data at 0.15 m. The linear sorption coefficient for vinyl chloride was estimated at 0.58 L/kg, which was calculated based on the DCE sorption coefficient and the organic carbon partition coefficient of vinyl chloride relative to that of DCE (USEPA 1996). The linear sorption coefficient for ethene was assumed equal to that of vinyl chloride. The lone fitting parameter in the model was the attachment-
Figure 5. Ethenes and DHC concentrations plotted as a function of time for loop 3. Bioaugmentation was performed at 0 days. Ω, TCE; ■, DCE; ▲, vinyl chloride; ●, ethene; ◆, DHC. Solid and dotted lines represent corresponding model simulations. Simulated DHC concentrations in the bioaugmentation injection well (BMW-5) include the total (mobile and immobile) DHC.
10 C.E. Schaefer et al./ Ground Water Monitoring & Remediation NGWA.org
detachment ratio of growing DHC in the soil. The best fit of this parameter (f) was approximately 0.9, indicating that 10% of the DHC growing in the soil detach and sub-sequently migrate through the aquifer. Model details are provided in the Supporting Information.
Model predictions for loops 1 and 3 are shown in Figures 3 and 5. Although intended to serve as only a semiquantitative tool, the model provided a reasonable prediction of the timeframe for DCE treatment at each of the monitoring wells in these treatment loops. In addition, the model provided a reasonable prediction of the DHC concentrations in groundwater, although the elevated
DHC levels at BMW-2 at 40 to 50 days after bioaug-mentation are not readily explained. Most importantly, the model showed that treatment timeframes at BMW-2 and BMW-6 were similar despite a 100-fold difference in DHC bioaugmentation dosage at BMW-1 and BMW-5. The model also showed that in situ DHC growth in loop 3 was greater than the DHC growth in loop 1. The rapid decrease in chlorinated ethene concentrations in BMW-1, which resulted from the large DHC inoculation dosage in this well, limits the subsequent rate of DHC growth within this treatment loop. Thus, in situ growth in loop 3 acted to compensate for the decreased DHC inoculation
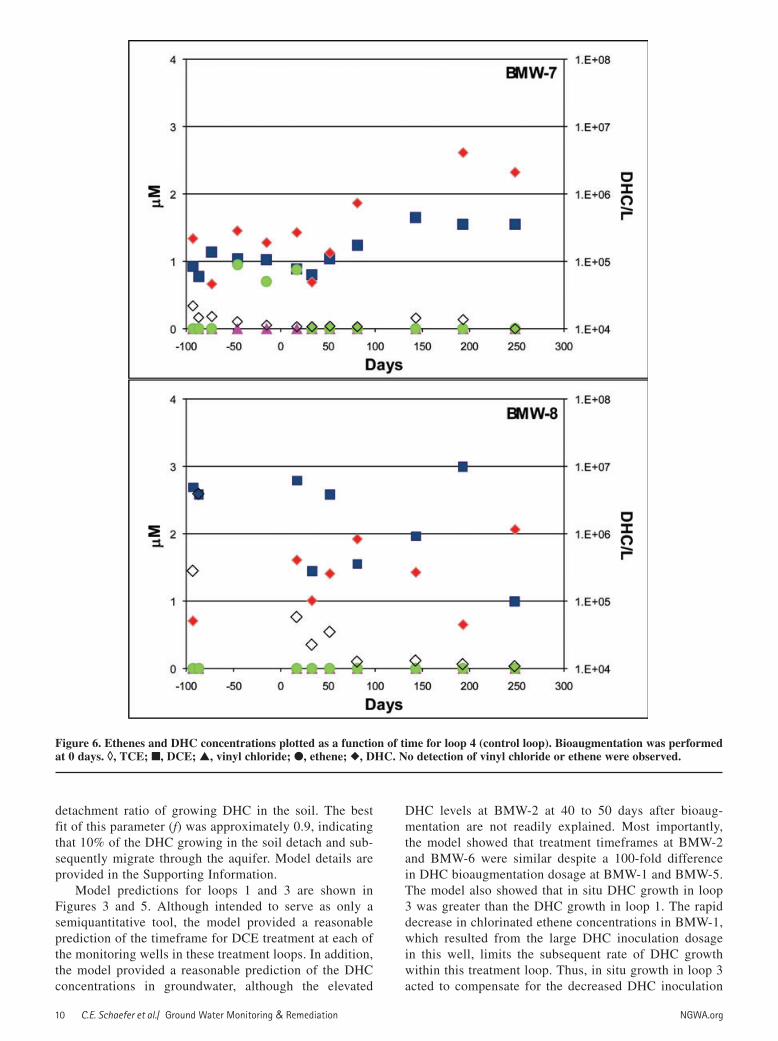
Figure 6. Ethenes and DHC concentrations plotted as a function of time for loop 4 (control loop). Bioaugmentation was performed at 0 days. Ω, TCE; ■, DCE; ▲, vinyl chloride; ●, ethene; ◆, DHC. No detection of vinyl chloride or ethene were observed.
NGWA.org C.E. Schaefer et al./ Ground Water Monitoring & Remediation 11
dosage, and this explains why results for these two treat-ment loops are similar despite the 100-fold difference in bioaugmentation dosage. Thus, the model provides a rea-sonable explanation for the observed similarity between loops 1 and 3. Simulation of the loop 3 bioaugmentation dosage using the flow rate and chlorinated ethene concen-trations in loop 1 did not substantially affect the simulated remedial timeframe or DHC levels obtained for loop 3. Thus, the similarity in the observed experimental results between loops 1 and 3 was not due to any artifacts caused by differences in chlorinated ethene or groundwater veloc-ity between the recirculation loops.
Both the experimental data and model simulations show that DHC concentrations at BMW-5 and BMW-6 are similar (within about an order of magnitude). This level of agree-ment is reasonable considering the variability associated with aqueous phase DHC sampling (Schaefer et al. 2009). The agreement between model simulations and the experimental data confirm our qualitative and quantitative interpretation of the processes controlling DHC migration and DCE dechlori-nation at both high and low bioaugmentation dosages.
The question then arises as to whether continuing to decrease the bioaugmentation dosage would result in any substantial increases in remedial timeframe. Performance of a simulation using a DHC inoculation of 0.1-times which was used in loop 3 resulted in an additional 50 days of treat-ment required for DCE removal at the downgradient well ( BMW-6). Thus, based on the combination of field and simulation results, the dosage used in loop 3 appears to be near optimal for the conditions of this study, balancing the benefits of high dosage and rapid treatment near the injec-tion well to sustained growth and detachment of DHC to facilitate treatment downgradient.
ConclusionsResults of this field demonstration were used to evalu-
ate the impacts of DHC dosage on effectiveness and rates of bioaugmentation. For the conditions of this demon-stration, a 100-fold difference in bioaugmentation dosage using a commercially available DHC-containing culture did not result in an apparent difference in bioaugmenta-tion performance, as measured at a monitoring well 10 feet downgradient of the bioaugmentation injection well. A one-dimensional screening-level model provided a reasonable prediction of the dechlorination rates and was able to pre-dict the impacts of DHC dosage on bioaugmentation per-formance. Thus, this type of model potentially can serve as a tool for estimating DHC dosage in some field applica-tions. The successful application of the model to the field results also verifies that the dechlorination and microbial processes observed at the bench scale (Schaefer et al. 2009) are applicable at the field scale, at least for the conditions of our study. Low pH conditions likely were responsible for inhibition of DCE dechlorination and DHC growth and migration in loop 2.
Results of this demonstration and others show that many factors including groundwater flow velocity, con-taminant concentration, groundwater chemistry, and het-erogeneity of the subsurface can affect the amount of
culture needed to effectively treat chlorinated solvent-contaminated aquifers. As a result, precisely determining the amount of culture needed for a given site still requires a site-by-site evaluation. Importantly, the one-dimensional model used to predict and evaluate growth of DHC and treatment effectiveness (Schaefer et al. 2009) reasonably described the results of the demonstration. Consequently, the model appears suitable for evaluating the affect of dif-ferent DHC dosages on treatment times and effectiveness and may serve a useful design tool for planning bioaug-mentation applications. Validation of the model under a wider range of bioaugmentation field conditions would be useful in more fully demonstrating the robustness of this model. A significant component of its use, however, is the need to determine the attachment-detachment factor (f) that may vary based on aquifer geochemistry and soil texture. Work is continuing to allow up-front estimates of this factor based on analysis of site samples, and efforts are in prog-ress to incorporate the one-dimensional model into existing groundwater flow and bioremediation models to make them more accessible to remediation practitioners.
AcknowledgmentFunding for this project was attained through the U.S.
DoD Environmental Security Technology Certification Program (ESTCP) project ER-0515.
Supporting InformationAdditional Supporting Information may be found in the
online version of this article.Please note: Blackwell Publishing is not responsible for
the content or functionality of any supplementary materials supplied by the authors. Any queries (other than missing material) should be directed to the corresponding author for the article.
ReferencesAmos, B.K., E.J. Suchomel, K.D. Pennell, and F.E. Löffler. 2009.
Spatial and temporal distributions of Geobacter lovleyi and Dehalococcoides spp. during bioenhanced PCE-DNAPL disso-lution. Environmental Science & Technology, 43, 1977–1985.
Environmental Security Technology Certification Program (ESTCP). 2005. Bioaugmentation for remediation of chlori-nated solvents: technology development, status, and research needs. http://docs.serdp-estcp.org/viewfile.cfm?Doc=BioaugmentationWhitePaper.pdf (accessed May 11, 2010).
Interstate Technology & Regulatory Council (ITRC). 2005. Overview of In Situ Bioremediation of Chlorinated Ethene DNAPL Source Zones. BioDNAPL-1. ITRC Bio DNAPL Team, Washington, DC.
Interstate Technology & Regulatory Council (ITRC). 2007. In Situ Bioremediation of Chlorinated Ethene DNAPL Source Zones: Case Studies. BioDNAPL-2. ITRC Bio DNAPL Team, Washington, DC.
Lu, X., J.T. Wilson, and D.H. Campbell. 2006. Relationship between Dehalococcoides DNA in groundwater and rates of reductive dechlorination at field scale. Water Research, 40, 3131–3140.

12 C.E. Schaefer et al./ Ground Water Monitoring & Remediation NGWA.org
Maymó-Gatell, X., Y. Chien, J.M. Gossett, and S.H. Zinder. 1997. Isolation of a bacterium that reductively dechlorinates tetra-chloroethene to ethene. Science, 276, 1568–1571.
Schaefer, C.E., C.W. Condee, S. Vainberg, and R.J. Steffan. 2009. Bioaugmentation for chlorinated ethenes using Dehalococcoides sp.: Comparison between batch and column experiments. Chemosphere, 75, 141–148.
United States Environmental Protection Agency (USEPA). 2004. Demonstration of Bioaugmentation of DNAPL Through Biostimulation and Bioaugmentation at Launch Complex 34 Cape Canaveral Air Force Station, Florida. EPA/540/R-07/007. Battelle, Columbus, Ohio.
United States Environmental Protection Agency (USEPA). 1996. Soil Screening Guidance: User’s Guide, 4–23. Publication 9355. Office of Solid Waste and Emergency Response, Washington, DC.
Vainberg, S., C.W. Condee, and R.J. Steffan. 2009. Large-scale production of bacterial consortia for remediation of chlori-nated solvent-contaminated groundwater. Journal of Industrial Microbiology and Biotechnology, 36, 1189–1197.
Biographical SketchesCharles E. Schaefer, Ph.D., corresponding author, may be
reached at Shaw Environmental Inc., Lawrenceville, NJ 08648; [email protected].
David R. Lippincott, P.G., may be reached at Shaw Environmental Inc., Lawrenceville, NJ 08648.
Robert J. Steffan, Ph.D., may be reached at Shaw Environmental Inc., Lawrenceville, NJ 08648.

Bioaugmentation for Treatment ofDense Non-Aqueous Phase Liquid inFractured Sandstone BlocksC H A R L E S E . S C H A E F E R , * , †
R A C H A E L M . T O W N E , † S I M O N V A I N B E R G , †
J O H N E . M C C R A Y , ‡ , § A N DR O B E R T J . S T E F F A N †
Shaw Environmental, Inc., 17 Princess Road, Lawrenceville,New Jersey 08648, Environmental Science and Engineeringand Hydrologic Science and Engineering, Colorado School ofMines, 1500 Illinois Street, Golden, Colorado 80401
Received January 22, 2010. Revised manuscript receivedMay 3, 2010. Accepted May 5, 2010.
Laboratory experiments were performed in discretely fracturedsandstone blocks to evaluate the use of bioaugmentation totreat residual dense non-aqueous phase liquid (DNAPL)tetrachloroethene (PCE). Significant dechlorination of PCE andgrowth of Dehalococcoides spp. (DHC) occurred within thefractures. DNAPL dissolution was enhanced during bioaug-mentation by up to a factor of approximately 3.5, with dissolvedPCE concentrations at or near aqueous solubility. The extentof dechlorination and DNAPL dissolution enhancementwere dependent upon the fracture characteristics, residencetime in the fractures, and dissolved concentration of PCE. Norelationship was observed between planktonic DHC con-centrations exiting the fracture and the observed extents ofPCE dechlorination and DNAPL dissolution. Measured planktonicDHC concentrations exiting the fracture increased withincreasing flow rate and bioaugmentation dosage, suggestingthat these parameters may be important for distribution ofDHCtotreatdissolvedchlorinatedethenesmigratingdowngradientof the DNAPL source. Bioaugmentation dosage, for the DHCdosagesandconditionsstudied,didnothaveameasurable impacton DNAPL dissolution or dechlorination within the fracturesthemselves. Overall, these results indicate that bioaugmentationmay be a viable remedial option for treating DNAPL sourcesin bedrock.
IntroductionBioaugmentation for treatment of tetrachloroethene (PCE)and trichloroethene (TCE) in groundwater has been suc-cessfully applied at numerous sites. Bioaugmentation forchlorinated ethenes typically involves the subsurface deliveryof mixed anaerobic cultures that contain Dehalococcoidesspp. (DHC) that can reductively dechlorinate the chlorinatedethenes; DHC are the only bacteria known to completelydechlorinate PCE and TCE (1).
While several laboratory and field studies have demon-strated the effectiveness of bioaugmenting with DHC for
treating dissolved phase PCE and TCE (2-5), the use of thisapproach for treating PCE or TCE when present as a densenon-aqueous phase liquid (DNAPL) has received far lessattention. Treatment of DNAPL source areas has increasinglybecome a focus at many contaminated sites (6-8). Batchand column studies have indicated that the presence of PCEDNAPL can have an inhibitory effect on the reductivedechlorination of PCE during bioaugmentation (9-11).Adamson et al. (10) noted the accumulation of TCE and cis-1,2-dichloroethene (DCE) in the DNAPL source zone, withoutfurther dechlorination to vinyl chloride (VC) or ethene untilPCE concentrations decreased to approximately 10 µM.
Despite this apparent inhibitory effect of DNAPL on thereductive dechlorination of PCE, bioaugmentation has beenshown to enhance the rate of PCE DNAPL dissolution insand columns and flow cells by factors ranging fromapproximately 1.1 to 21 (11-13); enhancement rates generallywere on the high end of this range when the dissolvedconcentration of PCE was less than approximately 300 µM(11, 13). Other factors shown to impact DNAPL dissolutionenhancement and overall PCE dechlorination during bio-augmentation include microbial dechlorination kinetics,water velocity (which impacts residence time and shearstress), electron donor supply, bioclogging, pH, and DNAPLsaturation and architecture (13-17). Becker and Seagren (15)also show that non-DHC partial dechlorinators can play animportant role in DNAPL dissolution.
While prior studies have provided insight into DNAPLdissolution processes during bioaugmentation in uncon-solidated media, published studies that evaluate similarmechanistic processes of PCE DNAPL dissolution in fracturedbedrock systems currently are lacking. Several recent ex-perimental and theoretical studies have focused on evaluatingabiotic DNAPL dissolution in bedrock fracture systems(18-20), and DNAPL dissolution in fractures during imple-mentation of chemical oxidation (21). Similar studies evalu-ating DNAPL dissolution in bedrock fractures during bio-augmentation are needed.
The objective of this study was to quantify the extent towhich bioaugmentation could enhance PCE DNAPL dis-solution in discretely fractured sandstone blocks. PCE DNAPLdissolution enhancement, dechlorination kinetics, and mi-crobial growth and transport were evaluated in four fracturesystems, and bioaugmentation effectiveness was evaluatedfor various DNAPL saturations, water velocities, and DHCinoculation dosages. Results of this study provided insightinto the mechanisms controlling DNAPL dissolution inbedrock fractures during bioaugmentation.
Experimental SectionMaterials. Sandstone blocks were used to create bench-scalefracture systems (two Colorado Red (C1 and C2) and twoArizona Buff (A1 and A2) sandstones). Construction andcharacterization of these systems, which were used for thebioaugmentation experiments presented herein, have beenpreviously described (20). Briefly, a discrete fracture wascreated in each block (29 cm ×29 cm ×5 cm) along naturallyoccurring bedding planes. The outside edges of the fracturewere sealed with epoxy. Twelve holes (0.20 cm diam.) weredrilled approximately 5 mm into the rock along the influentedge; 28 holes of similar size and depth were drilled alongthe effluent fracture edge. Stainless steel needles (16G) wereinserted into each hole and connected to an influent andeffluent manifold. The fracture apparatus is presented in theSupporting Information (Figure S1). Fracture properties foreach experimental fracture system are shown in Table 1.
* Corresponding author: phone: 609-895-5372; fax: 609-895-1858;e-mail: [email protected].
† Shaw Environmental, Inc.‡ Environmental Science and Engineering, Colorado School of
Mines.§ Hydrologic Science and Engineering, Colorado School of Mines.
Environ. Sci. Technol. 2010, 44, 4958–4964
4958 9 ENVIRONMENTAL SCIENCE & TECHNOLOGY / VOL. 44, NO. 13, 2010 10.1021/es1002428 2010 American Chemical SocietyPublished on Web 06/04/2010
Artificial groundwater was prepared using deionized wateramended with the following reagent grade chemicals pur-chased from Sigma-Aldrich (St. Louis, MO): 180 mg/L NaSO4,113 mg/L NaCl, 50 mg/L NaHCO3, 1.0 mg/L MnSO4 ·H2O,and HCl for a final pH of approximately 6.5. PCE waspurchased from Sigma Aldrich (St. Louis, MO). Sodium-(L)-lactate (60% solution) was purchased from Purac America(Lincolnshire, IL). Yeast extract (bacteriological grade) waspurchased from Marcor Development Corp. (Carlsdtadt, NJ).The DHC-containing consortium used in this study forbioaugmentation was the commercially available SDC-9 ((22);Shaw Environmental, Inc., Lawrenceville, NJ). Additionaldetails on the SDC-9 culture are provided in the SupportingInformation.
Batch Experiments. Batch reactor experiments wereperformed to evaluate PCE dechlorination kinetics by DHCin the presence of PCE DNAPL. Experiments were performedby adding 6 L of artificial groundwater to each of two nitrogensparged 6.5 L autoclavable bioreactors (Applicon, Inc., FosterCity, CA). Approximately 10 mL of PCE was added to eachreactor. Each reactor also was amended with sodium lactate(final concentration of 1,000 mg/L), yeast extract (finalconcentration of 300 mg/L), and DHC (109 cell/L). Thereactors were continuously mixed (250 rpm) and maintainedat room temperature (∼21 °C). The reactors were operatedfor 50 days, with periodic sampling for chlorinated ethenes,reduced gases, anions, and volatile fatty acids. For anionsand volatile fatty acids, 1 mL aqueous samples were collectedand filtered (0.25 µm) prior to analysis. For chlorinatedethenes and reduced gases, 5 mL aqueous samples werecollected, preserved with acid, and equilibrated in a 14 mLglass serum bottle (with septa) prior to headspace analysis.
An additional batch experiment was performed similarto those described by Schaefer et al. (5) to evaluate microbialPCE dechlorination at elevated dissolved concentrations, butin the absence of DNAPL. Glass serum bottles (13 mL) withTeflon-lined rubber septa were prepared in duplicate with13 mL artificial groundwater and dissolved PCE (finalconcentration of approximately 0.95 mM). The bottles wereinoculated with bacteria to attain a final concentration ofapproximately 5 × 10¹¹ DHC/L. Sodium lactate was addedfor a final concentration of 1,000 mg/L. A parallel set ofcontrols were prepared without bacteria or lactate. Periodicsampling for chlorinated ethenes and reduced gases wasperformed.
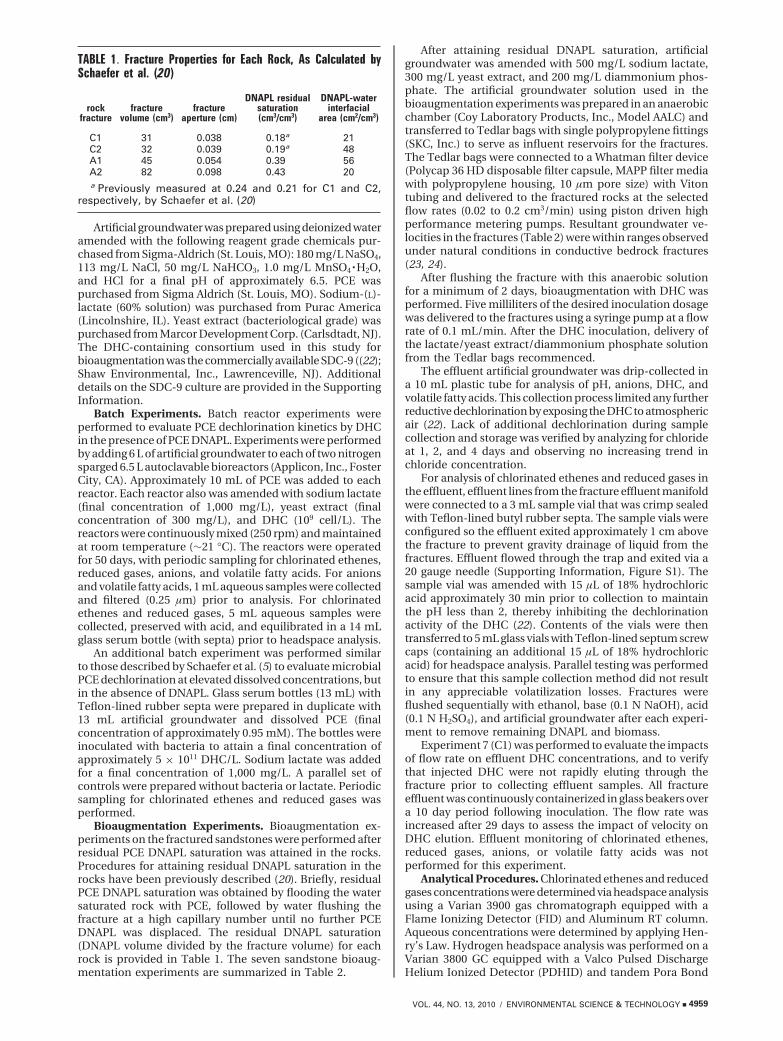
Bioaugmentation Experiments. Bioaugmentation ex-periments on the fractured sandstones were performed afterresidual PCE DNAPL saturation was attained in the rocks.Procedures for attaining residual DNAPL saturation in therocks have been previously described (20). Briefly, residualPCE DNAPL saturation was obtained by flooding the watersaturated rock with PCE, followed by water flushing thefracture at a high capillary number until no further PCEDNAPL was displaced. The residual DNAPL saturation(DNAPL volume divided by the fracture volume) for eachrock is provided in Table 1. The seven sandstone bioaug-mentation experiments are summarized in Table 2.
After attaining residual DNAPL saturation, artificialgroundwater was amended with 500 mg/L sodium lactate,300 mg/L yeast extract, and 200 mg/L diammonium phos-phate. The artificial groundwater solution used in thebioaugmentation experiments was prepared in an anaerobicchamber (Coy Laboratory Products, Inc., Model AALC) andtransferred to Tedlar bags with single polypropylene fittings(SKC, Inc.) to serve as influent reservoirs for the fractures.The Tedlar bags were connected to a Whatman filter device(Polycap 36 HD disposable filter capsule, MAPP filter mediawith polypropylene housing, 10 µm pore size) with Vitontubing and delivered to the fractured rocks at the selectedflow rates (0.02 to 0.2 cm3/min) using piston driven highperformance metering pumps. Resultant groundwater ve-locities in the fractures (Table 2) were within ranges observedunder natural conditions in conductive bedrock fractures(23, 24).
After flushing the fracture with this anaerobic solutionfor a minimum of 2 days, bioaugmentation with DHC wasperformed. Five milliliters of the desired inoculation dosagewas delivered to the fractures using a syringe pump at a flowrate of 0.1 mL/min. After the DHC inoculation, delivery ofthe lactate/yeast extract/diammonium phosphate solutionfrom the Tedlar bags recommenced.
The effluent artificial groundwater was drip-collected ina 10 mL plastic tube for analysis of pH, anions, DHC, andvolatile fatty acids. This collection process limited any furtherreductive dechlorination by exposing the DHC to atmosphericair (22). Lack of additional dechlorination during samplecollection and storage was verified by analyzing for chlorideat 1, 2, and 4 days and observing no increasing trend inchloride concentration.
For analysis of chlorinated ethenes and reduced gases inthe effluent, effluent lines from the fracture effluent manifoldwere connected to a 3 mL sample vial that was crimp sealedwith Teflon-lined butyl rubber septa. The sample vials wereconfigured so the effluent exited approximately 1 cm abovethe fracture to prevent gravity drainage of liquid from thefractures. Effluent flowed through the trap and exited via a20 gauge needle (Supporting Information, Figure S1). Thesample vial was amended with 15 µL of 18% hydrochloricacid approximately 30 min prior to collection to maintainthe pH less than 2, thereby inhibiting the dechlorinationactivity of the DHC (22). Contents of the vials were thentransferred to 5 mL glass vials with Teflon-lined septum screwcaps (containing an additional 15 µL of 18% hydrochloricacid) for headspace analysis. Parallel testing was performedto ensure that this sample collection method did not resultin any appreciable volatilization losses. Fractures wereflushed sequentially with ethanol, base (0.1 N NaOH), acid(0.1 N H2SO4), and artificial groundwater after each experi-ment to remove remaining DNAPL and biomass.
Experiment 7 (C1) was performed to evaluate the impactsof flow rate on effluent DHC concentrations, and to verifythat injected DHC were not rapidly eluting through thefracture prior to collecting effluent samples. All fractureeffluent was continuously containerized in glass beakers overa 10 day period following inoculation. The flow rate wasincreased after 29 days to assess the impact of velocity onDHC elution. Effluent monitoring of chlorinated ethenes,reduced gases, anions, or volatile fatty acids was notperformed for this experiment.
Analytical Procedures. Chlorinated ethenes and reducedgases concentrations were determined via headspace analysisusing a Varian 3900 gas chromatograph equipped with aFlame Ionizing Detector (FID) and Aluminum RT column.Aqueous concentrations were determined by applying Hen-ry’s Law. Hydrogen headspace analysis was performed on aVarian 3800 GC equipped with a Valco Pulsed DischargeHelium Ionized Detector (PDHID) and tandem Pora Bond
TABLE 1. Fracture Properties for Each Rock, As Calculated bySchaefer et al. (20)
rockfracture
fracturevolume (cm3)
fractureaperture (cm)
DNAPL residualsaturation(cm3/cm3)
DNAPL-waterinterfacial
area (cm2/cm3)
C1 31 0.038 0.18a 21C2 32 0.039 0.19a 48A1 45 0.054 0.39 56A2 82 0.098 0.43 20a Previously measured at 0.24 and 0.21 for C1 and C2,
respectively, by Schaefer et al. (20)
VOL. 44, NO. 13, 2010 / ENVIRONMENTAL SCIENCE & TECHNOLOGY 9 4959

Q and Molesieve columns. Volatile fatty acid analysis wasperformed on a Dionex AS 50 Chromatograph equipped witha Dionex IonPac AS11-HC column and CD 25 ConductivityDetector. Anions were analyzed via ion chromatography(Dionex DX-120, Sunnyvale, CA). The effluent pH wasmonitored periodically with pH test strips. Aqueous DHCconcentrations were determined by quantitative real-timePCR with primers (5′- gaagtagtgaaccgaaagg and 5′- tctgtc-cattgtagcgtc) that amplified a 235bp fragment of the 16s rRNAgene of DHC-type organisms. Biomass was concentrated viacentrifugation at 3700 rpm for a minimum of 1 h. Our previouswork (5) demonstrated that measurement of DHC for theculture used in this study was sufficient to assess overalldechlorination activity and kinetics.
ResultsBatch Experiments. Results of the batch testing showed thatno dechlorination daughter products (including chloride)were generated over the duration of the experiment in anyexperiments that contained PCE DNAPL. In addition, nofermentation of the lactate was observed, and no sulfatereduction occurred in experiments where DNAPL waspresent. Thus, the presence of the PCE DNAPL exhibited anapparent inhibitory effect not only on the DHC, but on thefermentative and sulfate reducing bacteria present in theconsortium. The addition of hydrogen to the batch reactorsystems (900 nM final concentration) did not result in anyPCE dechlorination. For the batch experiments containingonly dissolved PCE, PCE dechlorination to VC occurred within20 h, with continued transformation to ethene over the nextseveral days.
Results for these batch studies indicated that the presenceof PCE DNAPL was inhibitory to PCE dechlorination, whichis consistent with the results of others (9-11). The lack ofPCE dechlorination in the presence of DNAPL could be dueto toxicity from the sustained elevated dissolved PCEconcentration from the dissolution of the DNAPL, and/orsolvation of the DHC into the non aqueous phase.
Fracture Experiments - General Observations. Prior tobioaugmentation and during delivery of the lactate and yeastextract amended artificial groundwater, no dechlorinationwas observed, and DHC levels were below the detection limit(<105 DHC/L). Dissolved PCE concentrations measured priorto bioaugmentation (or within a few weeks after bioaug-menting, but prior to observation of measurable dechlori-nation) generally were in reasonable agreement ((20%) tothe abiotic PCE DNAPL dissolution concentrations previouslymeasured in these same bedrock fractures at the initial flowvelocities listed in Table 2 (20). The two exceptions wereExperiments 1 and 5, where the effluent PCE concentrationsvaried by up to 40% from those previously measured; thisdiscrepancy may have been due to slight differences in flow
paths within the fracture because of introduction of themicrobial culture. During all bioaugmentation experiments,effluent pH levels remained at approximately 6.5, and lactateand/or intermediate fermentation products were consistentlyobserved in the fracture effluent indicating that electrondonor was present in excess.
Arizona Rocks - Low Flow Rate (Experiments 1 and 2).After inoculating with DHC, monitoring showed that dechlo-rination of PCE occurred in the presence of DNAPL, withgeneration of measurable quantities of ethene, despiterelatively short fracture residence times (270 and 450 minfor A1 and A2, respectively) (Figure 1). DCE initially was theprimary dechlorination product in both rocks, but ethenebecame the predominant dechlorination product at later
TABLE 2. Experimental Design for the Bedrock Fracture Bioaugmentation Experimentsa
experiment rock DHC iInoculation (cells DHC) flow velocity (cm/min) dissolution enhancement factor (eq 1)
1 A1 3 × 10⁶ (day 0) 0.10 1.18 × 10⁸ (day 91)
2 A2 3 × 10⁶ (day 0) 0.062 5.08 × 10⁸ (day 91)
3 A1 4 × 10⁸ 0.10 (decreased to 0.025 on day 13) 3.54 A2 4 × 10⁸ 0.062 (decreased to 0.015 on day 13) 3.45 C1 2 × 10⁹ 0.11 (decreased to 0.022 on day 37) 1.46 C2 2 × 10⁹ 0.11 (decreased to 0.022 on day 37) 1.3
2 × 10¹¹ (day 58)7 C1 4 × 10⁸ 0.044 (increased to 0.22 on day 29) not calculated
a Flow velocity is calculated by dividing the influent volumetric flow rate by the fracture aperture (calculated by bromidetracers (20)), the fracture width (29 cm), and the water-filled porosity. Dissolution enhancement factors were calculated atthe end of the experiment, or the end of active bioaugmentation.
FIGURE 1. Effluent concentrations of ethenes and DHC fromrock A1 (top) and A2 (bottom) in Experiments 1 and 2,respectively. Fractures were bioaugmented on Day 0. Thevertical dashed lines indicate when inoculation with additionalculture was performed. The solid line for A1 represents thepredicted rate of DHC growth (5). For A2, some interruptions inflow occurred between days 150 and 190. Chlorideconcentrations were not monitored in Experiments 1 and 2.
4960 9 ENVIRONMENTAL SCIENCE & TECHNOLOGY / VOL. 44, NO. 13, 2010

times. VC and ethene concentrations between days 125 and195 generally ranged between 0.01 and 0.03 mM. The shiftfrom DCE accumulation to ethene was most apparent in A1,where the DCE to ethene transition correlated with decreasesin dissolved PCE concentration to approximately 0.3 mM.These observations suggest that elevated dissolved PCEconcentrations limited the further dechlorination of DCE.Similar DCE dechlorination inhibition near PCE DNAPLsources has been observed (10).
DNAPL mass removal was estimated by calculating themass of PCE and daughter products exiting the fractureeffluent. Approximately 16% of the residual DNAPL wasremoved in A1 during the experiment (15% as PCE, 1% asreductive dechlorination products). Approximately 8% of theresidual DNAPL was removed in A2 during the experiment,with <1% as dechlorination products (as shown in Table 1,A2 contained approximately twice the DNAPL residualvolume as A1). While no observable decrease in effluent PCEconcentration was observed in A2, effluent PCE concentra-tions decreased to approximately 0.01 mM in A1, whichrepresents approximately a 98% decrease in effluent PCEconcentration with only a 16% decrease in residualPCE DNAPL. This result suggests that most of the residualPCE residing in A1 was in low permeability regions that werenot well contacted by migrating water. After day 195, as PCEconcentrations continued to decrease in A1, ethene con-centrations increased to approximately twice that of PCE,and VC concentrations increased to approximately equal thatof PCE. This observation may suggest that the extent ofdechlorination within a PCE DNAPL source zone may bedependent upon the DNAPL source zone strength function(25). DNAPL sources in bedrock that have dissolved con-centrations that decrease rapidly in response to a relativelysmall fraction of DNAPL source removal may exhibit greaterconversion to VC and ethene in response to bioaugmentationtreatment than DNAPL sources that maintain elevateddissolved concentrations until nearly all the DNAPL mass isdepleted.
An increasing trend in eluted DHC concentrations in bothA1 and A2 was observed, as effluent DHC levels increasedby nearly 4 orders of magnitude. The rate of DHC growthobserved in the fracture effluent is well predicted by ourpreviously developed DHC Monod kinetic model (5), asindicated by the solid line for Experiment 1. This model (5)is based on DHC that have been proven capable of completedechlorination to ethene. These data suggest that thedechlorination and DHC growth in this study are likelybecause of DHC capable of complete dechlorination. Thus,for the SDC-9 culture and the conditions of this study, therole of any partial dechlorinators likely was limited. It isunclear if adding additional culture had a substantial impacton effluent DHC levels, as effluent DHC levels may havebeen increasing prior to reinoculation. DHC concentrationsin A1 were slightly greater than in A2, possibly because of thelower dissolved PCE concentration in A1 that may haveresulted in decreased inhibition/toxicity on DHC growth andsubsequent detachment. Integrating the DHC elution curveand multiplying by the flow rate showed that the amount ofDHC eluted from A1 and A2 were 28- and 7-times greater(respectively) than the total amount of DHC inoculated,verifying that DHC growth occurred in the fractures. Someflow interruptions occurred in A2 between 150 and 190 days,which might explain the decrease in DHC and increase inPCE within this interval.
The influent solution for both A1 and A2 was switched toaerobic artificial groundwater (without lactate) on day 197;500 ppm hypochlorite was added to the influent solutionbetween days 210 and 212 to remove biomass that may havebeen sustaining (but at a substantially decreased rate)dechlorination (26, 27). Despite the absence of any substantial
dechlorination by the end of the experiment (after 212 days),PCE concentrations remained low in Experiment 1, and didnot rebound, indicating that the decreased PCE concentra-tions were the result of a decrease in DNAPL mass, and werenot suppressed because of biological reaction.
Arizona Rocks - High Flow rate (Experiments 3 and 4).Results of bioaugmentation in the Arizona rocks for Experi-ments 3 and 4 (Figure 2) showed that DCE was the primarydechlorination daughter product, and that DCE concentra-tions were elevated (∼1 mM) compared to DCE concentra-tions measured in Experiments 1 and 2 (0.1 to 0.3 mM). VCconcentrations in Experiments 3 and 4 were 10-times greaterthan in Experiments 1 and 2. The increased DCE and VCconcentrations in Experiments 3 and 4 were likely due to theincreased residence time, which allowed for a greater extentof PCE dechlorination within the fractures. Conversely,despite the increased residence time, ethene concentrationin Experiments 3 and 4 were 3-times less than in Experiments1 and 2. One explanation for this is that VC dechlorinationin Experiments 3 and 4 may have been inhibited by theelevated dissolved PCE concentrations, which remained nearsolubility (approximately 1 mM) throughout the experiment.Alternately, the elevated DCE concentrations in Experiments3 and 4 may have inhibited VC dechlorination (12).
Despite the generation of DCE to levels near that of theinitial PCE effluent concentration, no decreases in effluentPCE concentration were observed during the duration of theexperiment. This indicates that biotic dechlorination of thePCE increases the concentration gradient for DNAPL dis-solution, thereby enhancing the overall rate of DNAPLdissolution. The quantity of chloride generated was ap-proximately two-times greater than the expected quantitybased on the measured chlorinated ethene (and ethene)daughter products. This discrepancy likely is due to back-
FIGURE 2. Effluent concentrations of ethenes, chloride, andDHC from rock A1 (top) and A2 (bottom) in Experiments 3 and 4,respectively. Fractures were bioaugmented on Day 0. Thevertical lines indicate when the fractures flow was decreasedfrom approximately 0.10 cm3/min to 0.025 cm3/min. Experiment 4was terminated prior to Experiment 3.
VOL. 44, NO. 13, 2010 / ENVIRONMENTAL SCIENCE & TECHNOLOGY 9 4961

partitioning of chlorinated ethene daughter products intothe DNAPL (15).
The effluent DHC concentrations in Experiments 3 and4 were 3 orders of magnitude less than in Experiments 1 and2, despite similar total bioaugmentation dosages. In addition,eluted DHC in Experiments 3 and 4 account for only 10% ofthe bioaugmented dosage. These findings suggest that mostof the DHC likely became retained within the fractures. Theincreased DCE generation was proportional to the increasein residence time, suggesting that DHC were still controllingdechlorination. However, a contribution from non-DHCpartial dechlorinators cannot be completely ruled out.
Less than 6% of the initial residual PCE DNAPL wasremoved from the fractures during the duration of Experi-ments 3 and 4. PCE mass balance analysis performed on A1showed that PCE mass removed during bioaugmentationand the post-treatment ethanol flushing accounted for 90%of the initially emplaced DNAPL mass; similar analysisperformed for A2 showed 86% PCE mass recovery.
Colorado Rocks - High Flow Rate (Experiments 5 and6). Results for rock C1 (Figure 3) were similar to Experiments3 and 4. Effluent DHC levels decreased from 109 DHC/L to106 DHC/L after reducing the flow rate, consistent with shear-controlled detachment process and consistent with com-parison of the low and high flow rate experiments for theArizona rocks. No increasing trend in effluent DHC wasobserved throughout the experiment, which is consistentwith the low flow rate experiments in A1 and A2. Most of theinjected DHC was retained within C1, as eluted DHCaccounted for approximately 30% of the total bioaugmentedcells.
Approximately 7% of the residual PCE DNAPL mass wasremoved (as PCE and reductive dechlorination daughterproducts) during the C1 experiment (Experiment 5). PCEmass balance analysis performed on C1 showed that PCEmass removed during bioaugmentation and the post-
treatment ethanol flushing accounted for 96% of the initiallyemplaced DNAPL mass.
For C2 (Experiment 6), adding additional culture at a 100-fold greater DHC dosage resulted in elevated DHC concen-trations in the effluent, but no increase in dechlorination.However, less than 1% of the total DHC injected elutedthrough the fracture. DHC effluent concentrations increasedafter adding the additional culture, but then remainedconstant (within an order of magnitude) throughout theremainder of the experiment. Approximately 8% of theresidual PCE DNAPL mass was removed (as PCE andreductive dechlorination daughter products). PCE massbalance analysis performed on C2 showed that PCE massremoved during bioaugmentation and the post-treatmentethanol flushing accounted for 59% of the initially emplacedDNAPL mass; this relatively low mass recovery may havebeen due to losses (leakage, spillage) during the ethanolflushing.
Impact of Increased Flow (Experiment 7). qPCR resultsindicated that no rapid DHC elution or “spike” was observed(greater than 90% of the injected DHC were retained withinthe fracture), and effluent DHC concentrations were con-sistent with those obtained in Experiment 5 (data not shown).Increasing the flow rate resulted in an increase in DHCeffluent concentration of approximately a factor of 5.Combined with the observed decrease in effluent DHCconcentrations observed in Experiments 3 and 4 (which wereoperated at a lower flow rate than in Experiments 1 and 2),these data suggest that DHC detachment and downgradientmigration is proportional to the shear.
DiscussionDNAPL Dissolution. Similar to the approach employed byothers (28), a maximum biotic dissolution enhancementfactor (E) to describe the increased rate of DNAPL dissolutionduring bioaugmentation was calculated as follows:
where the bracketed terms represent measured molarconcentration (mM), and the theoretical chloride concentra-tion is the expected chloride concentration based on themeasured chlorinated ethene (and ethene) daughter prod-ucts. The difference between [Cl-]measured and [Cl-]theoretical isassumed to be due to back-partitioning of the organicdaughter products into the DNAPL. For [PCE] in eq 1, thePCE solubility was used for Experiments 3 through 6, sinceeffluent PCE concentrations remained at solubility through-out the duration of the experiment. In Experiments 1 and 2,the PCE concentrations measured at 197 days were usedbecause these concentrations were unchanged after termi-nating active bioaugmentation.
For the high-flow Experiments 1 and 2, the values of E atthe end of bioaugmentation (197 days) were approximately5 and 1.1, respectively. The reason for the difference in thesetwo experiments likely is due to the decreased PCE con-centrations in Experiment 1 that resulted in less toxicity,which is consistent with observed PCE DNAPL inhibition ondechlorination observed by others (10). It is noted thatchloride concentrations were not measured in Experiments1 and 2, so the actual dissolution enhancement may havebeen greater than that calculated based on measurement ofethenes alone. For Experiments 3 and 4, the values of E atthe end of the experiments were 3.5 and 3.4, respectively.Despite having elevated dissolved PCE concentrations, thedissolution enhancement factor is greater than in Experiment
FIGURE 3. Effluent concentrations of ethenes, chloride, andDHC from rock C1 (top) and C2 (bottom) in Experiments 5 and 6,respectively. Fractures were bioaugmented on Day 0. Thevertical lines indicate when the fractures flow was decreasedor when inoculation with additional culture was performed.
E )
[PCE] + ([TCE] + [DCE] + [VC] + [ethene])[Cl-]measured
[Cl-]theoretical
[PCE](1)
4962 9 ENVIRONMENTAL SCIENCE & TECHNOLOGY / VOL. 44, NO. 13, 2010

2 because of the decreased flow rate (longer residence time)in the fracture that provided more time for reductivedechlorination. Daughter product concentrations were gradu-ally increasing at the end of the experiment, so a longerduration experiment would likely have yielded increasedvalues of E.
The calculated values of E for Experiments 1 through 4generally are within the general range observed by othersworking with unconsolidated materials (11-13). However,on the basis of the results of our batch testing and the resultsof others (11), negligible PCE dechlorination would have beenexpected, because of the presence of DNAPL and dissolvedPCE concentrations near 1 mM. The presence of regionswithin the fracture where the dissolved PCE concentrationwas reduced (because of flow heterogeneity), thereby fa-cilitating DHC growth and dechlorination activity, is onepossible explanation for the observed enhancement factors.
Despite the reduced flow velocities, the dissolutionenhancement factors for C1 and C2 (Experiments 5 and 6)were 1.4 and 1.3, respectively. The reason for these relativelylow values of E compared to Experiments 3 and 4 (which alsowere performed at reduced flow velocities) may be due todifferences in the effective aperture distribution in each setof rocks. The Colorado rocks have an effective fracturedistribution that is substantially more uniform than theArizona rocks (20). The Arizona rocks contain a comparativelygreater number of small aperture regions along the flow path;these small aperture regions likely are devoid of DNAPL, andmay serve as optimal locations for DHC biofilm growth anddechlorination activity. Thus, comparison of the Coloradoand Arizona bioaugmentation data suggest that aperturedistribution (and the distribution of DNAPL within thefractures) may control dechlorination kinetics and overallbioaugmentation effectiveness in these systems.
When considering the measured dissolution enhancementfactors in this bench scale study, it is important to considerthe length scale of the experiment. If the length scale of thefracture was 10-times greater, the bioaugmentation residencetime correspondingly would be 10-times greater, resultingin approximately a 10-fold increase in dechlorination daugh-ter products. This would result in a calculated value of E thatwas approximately 10-times greater than those calculated inthis study. Thus, results from all six dissolution experimentssuggest that bioaugmentation has the potential to substan-tially increase the rate of DNAPL dissolution at larger scales.
DHC Migration. As observed by comparing Experiments1 and 2 to Experiments 3 and 4, effluent DHC concentrationswere determined to not be a useful metric for assessingDNAPL dechlorination kinetics. These observations differfrom our previous studies that evaluated dissolved phaseDCE dechlorination in sand columns (5), where effluent DHCconcentrations were correlated to the dechlorination kineticsobserved in the column. The presence of the PCE DNAPL,and its inhibitory effects on planktonic DHC at elevatedaqueous PCE concentrations, is one possible reason for thisdiscrepancy. DHC present in biofilms, which might be moreresistant to toxicity than planktonic cells (29, 30), could haveplayed a dominant role in the observed PCE dechlorination.Additional study is needed to further evaluate the role ofDHC in biofilms in bedrock fractures when PCE DNAPL ispresent.
While increasing the DHC inoculation dosage did not havea measurable impact on dechlorination (as observed bycomparing Experiments 5 and 6), the flux of DHC leaving thecolumn was approximately 100-times greater in C2 than inC1. This increased concentration of DHC migrating down-gradient of the DNAPL source zone could provide additionalremedial benefit for the downgradient plume (12).
This study has shown that bioaugmentation using DHCcan substantially enhance PCE DNAPL dissolution rates in
bedrock fractures. Planktonic DHC in batch systems wereunable to dechlorinate PCE when DNAPL was present, butsubstantial dechlorination was observed in the DNAPL-impacted bedrock fractures even when dissolved PCE con-centrations were at or near solubility. Biofilms and/or thepresence of regions with lower dissolved PCE concentrationsmay have mitigated the inhibitory effects of sustained andelevated PCE levels, resulting in the observed dechlorination.Effluent DHC concentrations did not correlate to observeddechlorination activity, but rather were a function of theflow rate and shear. For the experimental fracture systemsand DHC dosages examined, DNAPL dechlorination kineticswere more sensitive to fracture properties than to bioaug-mentation dosage, as demonstrated by the differences in theArizona and Colorado rocks, and the negligible impact ondechlorination rates after increasing the bioaugmentationdosage. However, downgradient migration of DHC, andpotential treatment of the dissolved downgradient plume,was impacted by the DHC dosage. Although additional studiesare needed to further examine these processes under a widerrange of conditions, these results suggest that bioaugmen-tation may be a viable option for treatment of DNAPL inbedrock, and that bench scale batch testing may not be anappropriate indicator of in situ dechlorination kinetics whenDNAPL is present.
AcknowledgmentsSupport for this research was provided in part by the StrategicEnvironmental Research and Development Program (SERDP)under Project ER-1554.
Supporting Information AvailableAdditional details are available regarding the SDC-9 cultureand the experimental fracture apparatus constructed fromsandstone blocks. This material is available free of chargevia the Internet at http://pubs.acs.org.
Literature Cited(1) Maymo-Gatell, X.; Chien, Y.; Gossett, J. M.; Zinder, S. H. Isolation
of a bacterium that reductively dechlorinates tetrachloroetheneto ethene. Science 1997, 276, 1568–1571.
(2) Harkness, M. R.; Bracco, A. A.; Brennan, M. J., Jr.; De Weerd,K. A.; Spivack, J. L. Use of bioaugmentation to stimulate completereductive dechlorination of trichloroethene in Dover soilcolumns. Environ. Sci. Technol. 1999, 33, 1100–1109.
(3) Major, D. W.; McMaster, M. L.; Cox, E. E.; Edwards, E. A.;Dworatzek, S. M.; Hendrickson, E. R.; Starr, M. G.; Payne, J. A.;Buonamici, L. W. Field demonstration of a successful bioaug-mentation to achieve dechlorination of tetrachloroethene toethene. Environ. Sci. Technol. 2002, 36, 5106–5116.
(4) Lendvay, J. M.; Loffler, F. E.; Dollhopf, M.; Aiello, M. R.; Daniels,G.; Fathepure, B. Z.; Gebhard, M.; Heine, R.; Helton, R.; Shi, J.;Krajmalnik-Brown, R.; Major, C. L., Jr.; Barcelona, M. J.;Petrovskis, E.; Hickey, R.; Tiedje, J. M.; Adriaens, P. Bioreactivebarriers: a comparison of bioaugmentation and biostimulationfor chlorinated solvent remediation. Environ. Sci. Technol. 2003,37, 1422–1431.
(5) Schaefer, C. E.; Condee, C. W.; Vainberg, S.; Steffan, R. J.Bioaugmentation for chlorinated ethenes using Dehalococcoidessp.: comparison between batch and column experiments.Chemosphere 2009, 75, 141–148.
(6) United States Environmental Protection Agency. Demonstrationof bioaugmentation of DNAPL through biostimulation andbioaugmentation at Launch Complex 34 Cape Canaveral AirForce station, Florida. 2004; EPA/540/R-07/007.
(7) Overview of in situ bioremediation of chlorinated ethene DNAPLsource zones; BioDNAPL-1; Interstate Technology & RegulatoryCouncil: Washington, DC, 2005.
(8) In situ bioremediation of chlorinated ethene DNAPL source zones:case studies; BioDNAPL-2; Interstate Technology & RegulatoryCouncil: Washington, DC, 2007.
(9) Yang, Y.; McCarty, P. L. Biologically enhanced dissolution oftetrachloroethene DNAPL. Environ. Sci. Technol. 2005, 34, 2979–2984.
VOL. 44, NO. 13, 2010 / ENVIRONMENTAL SCIENCE & TECHNOLOGY 9 4963

(10) Adamson, D. T.; McDade, J. M.; Hughes, J. B. Inoculation of aDNAPL source zone to initiate reductive dechlorination of PCE.Environ. Sci. Technol. 2003, 37, 2525–2533.
(11) Amos, B. K.; Suchomel, E. J.; Pennell, K. D.; Loffler, F. E. Microbialactivity and distribution during enhanced contaminant dis-solution from a NAPL source zone. Water Res. 2008, 42, 2963–2974.
(12) Amos, B. K.; Suchomel, E. J.; Pennell, K. D.; Loffler, F. E. Spatialand temporal distributions of Geobacter lovleyi and Dehalo-coccoides spp. during bioenhanced PCE-DNAPL dissolution.Environ. Sci. Technol. 2009, 43, 1977–1985.
(13) Glover, K. C.; Munakata-Marr, J.; Illangasekare, T. H. Biologicallyenhanced mass transfer of tetrachloroethene from DNAPL insource zones: experimental evaluation and influence of poolmorphology. Environ. Sci. Technol. 2007, 41, 1384–1389.
(14) Christ, J. A.; Abriola, L. M. Modeling metabolic reductivedechlorination in dense non-aqueous phase liquid source zones.Adv. Water Resour. 2007, 30, 1547–1561.
(15) Becker, J. G.; Seagren, E. A. Modeling the effects of microbialcompetition and hydrodynamics on the dissolution and detoxi-fication of dense non-aqueous phase liquid contaminants.Environ. Sci. Technol. 2009, 43, 870–877.
(16) Sleep, B. E.; Seepersad, D. J.; Mo, K.; Heidorn, C. M.; Hrapovic,L.; Morrill, P. L.; McMaster, M. L.; Hood, E. D.; Lebron, C.; Lollar,B. S.; Major, D. W.; Edwards, E. A. Biological enhancement oftetrachloroethene dissolution and associated microbial com-munity changes. Environ. Sci. Technol. 2006, 40, 3623–3633.
(17) Chu, M.; Kitanidis, P. K.; McCarty, P. L. Effects of biomassaccumulation on microbially enhanced dissolution of a PCEpool: a numerical simulation. J. Contam. Hydrol. 2003, 65, 79–100.
(18) Dickson, S. E.; Thomson, N. R. Dissolution of entrapped DNAPLsin variable aperture fractures: Experimental data and empiricalmodel. Environ. Sci. Technol. 2003, 37, 4128–4137.
(19) Detwiler, R. L.; Rajaram, H.; Glass, R. J. Interphase mass transferin variable aperture fractures: controlling parameters andproposed constitutive relationships. Water Resour. Res. 2009,45, 1–21.
(20) Schaefer, C. E.; Callaghan, A. V.; King, J. D.; McCray, J. E. Densenon-aqueous phase liquid architecture and dissolution indiscretely fractured sandstone blocks. Environ. Sci. Technol.2009, 43, 1877–1883.
(21) Tunnicliffe, B. S.; Thomson, N. R. Mass removal of chlorinatedethenes from rough-walled fractures using permanganate. J.Contam. Hydrol. 2004, 75, 91–114.
(22) Vainberg, S.; Condee, C. W.; Steffan, R. J. Large-scale productionof bacterial consortia for remediation of chlorinated solvent-contaminated groundwater. J. Ind. Microbiol. Biotechnol. 2009,26, 1189–1197.
(23) Novakowski, K.; Bickerton, G.; Lapcevic, P.; Voralek, J.; Ross, N.Measurements of groundwater velocity in discrete rock fractures.J. Contam. Hydrol. 2006, 85, 44–60.
(24) McKay, L. D.; Sanford, W. E.; Strong, J. M. Field-scale migrationof colloidal tracers in a fractured shale saprolite. Ground Water2000, 38, 139–147.
(25) Falta, R. W.; Rao, P. S.; Basu, N. Assessing the impacts of partialmass depletion in DNAPL source zones. I. Analytical modelingof source zone strength functions and plume response. J.Contam. Hydrol. 2005, 78, 259–280.
(26) Adamson, D. T.; Newell, C. J. Support of source zone biore-mediation through endogenous biomass decay and electrondonor recycling. Biorem. J. 2009, 13, 29–40.
(27) Sleep, B. E.; Brown, A. J.; Lollar, B. S. Long-term tetrachloroethenedegradation sustained by endogenous cell decay. J. Environ.Engin. Sci. 2005, 4, 11–17.
(28) Seagren, E. A.; Rittmann, B. E.; Valocchi, A. J. Quantitativeevaluation of the enhancement of NAPL-pool dissolution byflushing and biodegradation. Environ. Sci. Technol. 1994, 28,833–839.
(29) Harrison, J. J.; Rabiei, M.; Turner, R. J.; Badry, E. A.; Sproule,K. M.; Ceri, H. Metal resistance in Candida biofilms. FEMSMicrobiol. Ecol. 2006, 55, 479–491.
(30) Chen, S.; Sun, D.; Chung, J. S. Anaerobic treatment of highlyconcentrated aniline wastewater used packed-bed biofilmsreactor. Process Biochem. 2007, 42, 1666–1670.
ES1002428
4964 9 ENVIRONMENTAL SCIENCE & TECHNOLOGY / VOL. 44, NO. 13, 2010

J Ind Microbiol Biotechnol (2009) 36:1189–1197
DOI 10.1007/s10295-009-0600-5ORIGINAL PAPER
Large-scale production of bacterial consortia for remediation of chlorinated solvent-contaminated groundwater
Simon Vainberg · Charles W. Condee · Robert J. SteVan
Received: 22 October 2008 / Accepted: 21 May 2009 / Published online: 12 June 2009© Society for Industrial Microbiology 2009
Abstract Chlorinated solvents such as perchloroethylene(PCE) and trichloroethylene (TCE) continue to be signiW-cant groundwater contaminants throughout the USA. Inmany cases eYcient bioremediation of aquifers contami-nated with these chemicals requires the addition of exoge-nous microorganisms, speciWcally members of the genusDehalococcoides (DHC). This process is referred to asbioaugmentation. In this study a fed-batch fermentationprocess was developed for producing large volumes (to3,200 L) of DHC-containing consortia suitable for treatingcontaminated aquifers. Three consortia enriched from threediVerent sites were grown anaerobically with sodium lac-tate as an electron donor and PCE or TCE as an electronacceptor. DHC titers in excess of 1011 DHC/L could bereproducibly obtained at all scales tested and with all threeof the enrichment cultures. The mean speciWc DHC growthrate for culture SDC-9™ was 0.036 § 0.005 (standarderror, SE)/h with a calculated mean doubling time of19.3 § 2.7 (SE) h. Finished cultures could be concentratedapproximately tenfold by membrane Wltration and storedrefrigerated (4°C) for more that 40 days without measur-able loss of activity. Dehalogenation of PCE by the fer-mented cultures was aVected by pH with no measurableactivity at pH <5.0.
Keywords Bioremediation · Bioaugmentation · PCE · TCE · Fermentation · Dehalococcoides · Dechlorination · SDC-9 · Groundwater
Introduction
Chlorinated ethenes have been used extensively as indus-trial solvents and cleaning agents, and their widespread useand improper disposal practices have led to them becomingcommon groundwater contaminants throughout the USAand the world [25, 33]. Because of the widespread occur-rence of chlorinated solvent contamination, a number oftreatment technologies have emerged and evolved. Cur-rently, the most common treatment alternative involvesbiological degradation of the solvents.
The predominant biodegradation pathway for chlori-nated ethenes under anaerobic conditions is reductivedechlorination. During reductive dechlorination, chlori-nated ethenes are used as electron acceptors by specializedmicroorganisms, and during the process a chlorine atom isremoved and replaced with a hydrogen atom [12, 13, 16,30]. Sequential dechlorination of perchloroethylene (PCE)most commonly proceeds to trichloroethene (TCE), cis-1,2-dichloroethene (cDCE), vinyl chloride (VC), and Wnally thedesired end product, ethene. In some cultures trans-1,2-DCE and 1,1-DCE also can be produced through the reduc-tive dechlorination of TCE [6, 35]. In situ biodegradationof chlorinated ethenes can be performed by indigenousmicroorganisms at contaminated sites that use endogenousresources to support contaminant degradation (i.e., intrinsicbioremediation), or nutrients that are purposefully added tosupport their activity (i.e., biostimulation). The lack of anadequate microbial population capable of completelydechlorinating PCE and TCE to ethene at some sites,
S. Vainberg · C. W. Condee · R. J. SteVan (&)Shaw Environmental, Inc., 17 Princess Road, Lawrenceville, NJ 08648, USAe-mail: [email protected]
S. Vainberge-mail: [email protected]
C. W. Condeee-mail: [email protected]
123
1190 J Ind Microbiol Biotechnol (2009) 36:1189–1197
however, may lead to the accumulation of cis-DCE and VC[11]. Consequently, the addition of exogenous organisms(i.e., bioaugmentation) is sometimes used to supplement theindigenous microbial population [5, 15, 21].
While many dechlorinating microorganisms have beenidentiWed [30], bacteria of only one microbial genus,Dehalococcoides (DHC), have been shown to completelyreduce cDCE and VC to ethene [7, 8, 22, 23, 26, 31]. Theseorganisms use molecular hydrogen as an obligate electrondonor and halogenated compounds as obligate respiratoryelectron acceptors. Acetate (e.g., from lactate fermentation)is used as a carbon source. Studies of Weld sites havestrongly correlated the presence of DHC strains with com-plete dehalogenation of chlorinated ethenes in situ [11].Therefore, microbial cultures used to remediate chlorinatedsolvent-contaminated groundwaters contain at least onestrain of Dehalococcoides sp. Because of the diYculty ofgrowing DHC-type organisms in pure culture [7, 8, 10, 23],however, cultures used for bioaugmentation applicationsare consortia that contain DHC as well as fermentative andother microbes that support the growth and activity of theDHC strains [4, 5, 15, 21]. The consortia, and the DHCtherein, can be grown on a wide range of carbon sourcesprovided the substrate is fermented to hydrogen.
One of the signiWcant challenges of performing bioaug-mentation at a commercial scale is the large size of contam-inant plumes and the large amount of culture needed tofacilitate timely and successful remediation. Contaminantplumes can range from less than an acre (0.4 ha) in size toseveral kilometers long and hundreds of meters wide.Recent studies of in situ chlorinated ethene degradationhave suggested that DHC concentrations in the range of107 DHC/L of groundwater are needed to support accept-able degradation rates [19, 28]. To illustrate the challengeof applying bioaugmentation in the Weld, a 0.4-ha (one-acre) aquifer with a saturated zone 3 m (10 ft) thick andporosity of 25% would contain »3 £ 106 L of groundwaterand require 3 £ 1013 DHC based on the Wndings of Lu et al.At the reported DHC concentrations of early bioaugmenta-tion cultures (109 DHC/L; [21]), as much as 104 L of cul-ture could be required to treat a one-acre site. Of courseother factors aVect the amount of culture applied at a site[14, 28], but it is clear that large-scale production of high-density cultures is necessary to apply bioaugmentation eco-nomically, especially at large sites.
The objective of this study is to evaluated large-scaleproduction of a DHC-containing consortium, SDC-9™, forfull-scale remedial applications. The culture was grown insmall (3-L) to large (4,000-L) fermentors by using sodiumlactate as a carbon and electron donor source and PCE as anelectron acceptor. DHC concentrations of >1011/L could beachieved, and the culture could be concentrated and storedprior to Weld application. The fermentation procedure
produced similar results with two other DHC culturesenriched from diVerent sites.
Materials and methods
Chemicals
Sodium-(L)-lactate (60% solution) was purchased fromPurac America (Lincolnshire, IL), yeast extract (bacterio-logical grade) was purchased from Marcor DevelopmentCorp. (Carlstadt, NJ), and PCE (99.9%) was from Sigma/Aldrich (Milwaukee, WI). Unless otherwise stated, all otherchemicals were of the highest purity available and pur-chased from either Aldrich Chemical Co. (Milwaukee, WI),Mallinckrodt Specialty Chemical Co. (Paris, KY), J.T.Baker Inc. (Phillipsburg, NJ.), Spectrum Chemical Manu-facturing Corp. (Garden, CA) or Sigma Chemical Co. (St.Louis, MO).
Bacterial cultures
An anaerobic dechlorinating consortium designatedSDC-9™ was isolated by enrichment culturing of samplesfrom a chlorinated solvent-contaminated aquifer in southernCalifornia with lactate as an electron donor and PCE as anelectron acceptor. The culture has been maintained onsodium lactate and PCE in reduced anaerobic mineralmedium (RAMM) [29], but without sodium sulWde andrezasurin, for more than 4 years. Hawaii-05™ was enrichedin 2005 by enrichment culturing of aquifer samples fromHickam Air Force Base, Hawaii on sodium lactate andTCE, and PJKS™ was enriched in 2005 from aquifer sam-ples from Air Force Plant PJKS in Colorado on sodium lac-tate and TCE. The latter cultures are maintained as describedfor SDC-9™. All three cultures are marketed commerciallyby Shaw Environmental, Inc. (Lawrenceville, NJ).
Fermentation equipment
Bench-scale fermentation experiments and seed cultureproduction were performed in a 3-L or 7-L Applicon fer-mentor (Cole Palmer, Vernon Hills, IL.) equipped with pHand mixer controls. Substrate and NaOH feeds were con-trolled by using syringe pumps (Harvard Apparatus, Holliston,MA). Larger seed cultures were produced in a similarlyequipped 20-L BiolaWtte fermentor (Pierre Guerin, Inc.,Spring Lake Park, MN). Larger cultures were produced in a750-L ABEC fermentor (Bethlehem, PA) or a custom-built4,000-L stainless-steel fermentor. In each case anaerobicconditions were maintained by pressurizing the vesselswith nitrogen. Cells in the fermentation broth were concen-trated by passing the broth over a custom-built concentrator
123

J Ind Microbiol Biotechnol (2009) 36:1189–1197 1191
constructed with six Kerasep™ tubular ceramic membranes(Novasep, Inc., Boothwyn, PA). Concentrated cells werestored at 4°C in 18.5-L stainless-steel soda kegs that werepressurized with nitrogen.
Fermentation protocol
For seed culture production RAMM medium [29] withoutNaHCO3 and Na2S was added to the 20-L fermentor andsteam sterilized at 121°C and 15 psi pressure for 45 min.After sterilization the fermentor was connected to a nitro-gen tank to maintain a positive pressure of nitrogen in thefermentor during cooling to 30°C. After the temperature inthe fermentor reached the set-point temperature of fermen-tation (28–30°C) and anaerobic condition were achieved[measured dissolved oxygen (DO) = 0 mg/L], nitrogen Xowwas stopped and NaHCO3 solution was added aseptically tothe medium. The fermentor was then inoculated with 2 L ofSDC-9™, PJKS™ or Hawaii-05™. The Wnal volume ofmedium in the fermentor was 16–18 L.
After inoculation of the fermentor, sterile 10% yeastextract (YE) solution was added to a Wnal concentration of0.1% YE (w/v) and PCE or TCE was added to a Wnal con-centration of 10 mg/L. SDC-9™ was grown on PCE, butPJKS™ and Hawaii-05™ were grown on either PCE orTCE. The fermentor was operated at 28–30°C with an agi-tator speed of 100 rpm. pH was maintained at 6.4–7.2 byaddition NaOH (2 N). Alternatively, to increase pH duringfermentation, the fermentor was sparged with nitrogen toremove dissolved CO2. To control foam in the fermentorAntifoam 289 or 204 (Sigma) was applied automatically.After 1 day of fermentation, sodium lactate (60% solution)was added continuously to the fermentor at Xow rate of0.02–0.04 mL/h £ liter of media. Subsequent additions ofPCE or TCE (10 mg/L) were made to the fermentor onlyafter complete dechlorination of PCE/TCE but before com-plete dechlorination of cDCE. Typically, PCE/TCE wasadded to the medium when the concentration of cDCE inthe medium was reduced to 1–3 mg/L. When the culturereached an optical density (OD) at 550 nm (OD550) ofapproximately 1.0 it was transferred anaerobically to the750-L fermentor.
The 750-L fermentor was prepared with 550 L RAMMmedium and sampled and monitored essentially asdescribed above. The fermentor was connected to a nitro-gen tank to maintain anoxic conditions, and it was operatedunder the same conditions as described for the 20-L fer-mentor except the agitator speed was set at 60 rpm. Theautomatic pH control system on the fermentor was inacti-vated to avoid addition of excess sodium. After 1 day offermentation a continuous feed of sodium lactate (60%solution) was initiated with Xow rate of 0.02–0.04 mL/h £ L.When the speciWc PCE and cDCE dechlorination activity
reached 1.3–1.7 mg/h £ gram of dry weight, a continuousfeed of neat PCE/TCE was initiated at rate of 0.18–0.25�L/h £ L. This rate was increased to 0.9–1.2 �L/h £ L asthe culture cell density and dechlorination activityincreased. The culture was grown for 13–15 days until anOD550 t 0.7–1.1 or 1010-1011 DHC/L was achieved. HigherDHC concentrations could be obtained by extending thefermentation for up to 35 days.
Growth of the cultures in the 4,000-L fermentor(working volume 3,200 L) was performed essentially asdescribed for the 750-L fermentor, but because the 4,000-Lfermentor did not have an impeller, cells were continuouslysuspended by using a centrifugal pump that circulated theculture medium. The 4,000-L fermentor was chemicallysterilized by using NaOH and a clean-in-place system. Theculture medium in the 4,000-L fermentor was not sterilized.Substrate feeding and other parameters were as describedfor the 750-L fermentor. The fermentor was inoculated witheither culture from the 750-L fermentor or refrigerated con-centrated cell stocks.
Degradation assays and analytical procedures
Whenever possible, analytical methods performed duringthis project followed US Environmental Protection Agency(USEPA) SW-846 methods [32] that are available online athttp://www.epa.gov/epawaste/hazard/testmethods/sw846/index.htm. Biodegradation assays were incubated at28 § 1°C in the dark in serum vials essentially as describedby Schaefer et al. [28]. Chlorinated ethene analyses wereperformed by gas chromatography using USEPA method8260 [gas chromatography/mass spectrometry (GC/MS)with purge and trap injection]. Methane and ethene weremonitored by GC/Xame ionization detection (FID) accord-ing to USEPA SW846 method 8015b. Lactate and volatilefatty acids (VFAs) were measured by ion chromatographyusing USEPA method 300.0-modiWed on a Dionex DX600ion chromatograph (Dionex Corp., Bannockburn, IL).Hydrogen concentration in the fermentors was measured byanalyzing the headspace of 100-mL samples in 120-mLvials on a Varian 3800 gas chromatograph (Varian, Inc.,Walnut Creek, CA) equipped with a Valco pulsed dischargehelium ionization detector (PDHID), a helium gas puriWerto achieve helium carrier and makeup gas of 99.999%purity, and Varian Pora Bond Q (10 m, 0.32 inner diameter,5 uM df) and Varian Molsieve 5A (10 m, 0.32 inner diame-ter, 5 �M df) columns operated in series. Concentration ofhydrogen was determined by comparison to a standardcurve. Dry weight (Dwt) was determined by concentrating15–30 mL culture in a RC5C centrifuge (10,000£g; SorvalInstruments, Newtown, CT), removing the supernatant,suspending the pellet in deionized (DI) water, and repeatingthe procedure twice. The washed cell pellet was suspended
123

1192 J Ind Microbiol Biotechnol (2009) 36:1189–1197
in DI water, transferred to an aluminum weighing dish, anddried at 105°C.
DHC quantiWcation
DHC-like organisms were quantiWed by using real-timequantitative polymerase chain reaction (qPCR). Followingcollection of fermentor samples, the OD550 of the samplewas measured and the cells were either concentrated bycentrifugation or diluted with water to an OD550 of approxi-mately 0.5. OD was then remeasured for veriWcation. Onemilliliter of the OD550 = 0.5 cells were then concentrated bycentrifugation (16,000£g for 2 min) and resuspended in100 �L distilled water. The cells were then processed usingan Idaho Technologies 1-2-3 RAPID DNA puriWcation kit(Idaho Technology Inc. Salt Lake City, UT) as per manu-facturer instructions and using a Bead Beater (BioSpecProducts Inc., Tulsa, OK). DNA was eluted from columnsin a Wnal volume of 100 �L buVer rather than the prescribed400 �L.
Quantitative real-time PCR was performed with aRAPID PCR machine (Idaho Technologies Inc.) and aLightcycler FastStart DNA Master Hybprobe probe kit(Roche Diagnostics GmbH, Manheim, Germany) and prim-ers developed by us with the assistance of Idaho Technolo-gies, Inc. to amplify and quantify 16 s ribosomal RNA(rRNA) gene DNA. DNA ampliWcation used a forwardprimer (5�-GAAGTAGTGAACCGAAAGG-3�) and areverse primer (5�-TCTGTCCATTGTAGCGTG-3�), andthe ampliWed DNA was quantiWed using a Xuorescence res-onance energy transfer (FRET) probe system that employeda Light Cycler Red 640 Xuorophore (5�-AGCGAGACTGCCCC-3�) and an Xuorescein isothiocyanate (FITC)-labeled probe (5�-CCCACCTTCCTCCCCGTTTC-3�). TheampliWcation conditions were as follows: denaturation at95°C for 10 min, followed by 40 cycles of melting at 94°Cfor 20 s, annealing at 53°C for 10 s, and extension at 72°Cfor 20 s. Dehalococcoides sp. chromosomal DNA wasquantiWed by comparison to a standard curve generated byamplifying serial dilutions of a known concentration ofplasmid (pSC-A vector; Stratagene Inc. La Jolla, CA) con-taining a cloned 16S rRNA gene from the SDC-9™ culture.
Results and discussion
Culture growth
A typical growth curve of large-scale (3,200-L) productionof SDC-9™ is shown in Fig. 1a. Monod kinetics parame-ters for SDC-9™ are reported elsewhere [28]. The cellswere grown with lactate as an electron donor and PCE as anelectron acceptor, and yeast extract was added periodically
as indicated. Although the OD550 of the culture increasedrapidly in the fermentor, DHC concentrations remainedconstant for 5 days before the initiation of the exponentialgrowth phase. This DHC lag phase, however, did not occurin all fermentation runs and it could be the result of vari-ability in the qPCR quantiWcation method. During the expo-nential growth phase when both cDCE and VC werepresent in excess the speciWc growth rate (m) reached0.032/h with a cell doubling time of 21.5 h. During multiplefermentation runs at both the 550-L and 3,200-L scale(n = 5) (data not shown), speciWc DHC growth rates rangedfrom 0.027 to 0.043/h with mean rate of 0.036/h(19.3 § 2.7 h doubling time).
Fig. 1 Growth of SDC-9™ in a 4,000-L fermentor. a Concentration ofDHC as measured by qPCR (Wlled circle) and total cell concentration asestimated by OD at 550 nm (open circle). DHC Wrst-order growth rate(�) and doubling time (td) are indicated on the graph. b Feed rate of neatPCE (Wlled circle) and 60% sodium lactate (Wlled square), and the pHof the culture medium (open diamond) are indicated. Yeast extract (YE)solution was added at the beginning of the fermentation and as indi-cated. The fermentor was sparged with N2 as indicated to control pH
107
108
109
1010
1011
1012
1013
0.2
0.4
0.6
0.8
1
1.2
0 5 10 15 20 25 30 35 40
DHC concentration (copies/L)
DH
C c
once
ntra
tion
(cop
ies/
L)
OD
OD
550
Time (d)
µ = 0.032 h-1td = 21.5 h
Add 0.1% YE
0
5
10
15
20
25
30
35
6
6.2
6.4
6.6
6.8
7
7.2
7.4
0 5 10 15 20 25 30 35 40
PCE feed (ul/h x L)
Fee
d (u
l/h x
L)
Sodium Lactate feed (ul/h x L)
pH
pH
Time (d)
Nitrogen sparging
Add 0.1% YE
Hydrogen= 79 nM
A
B
123

J Ind Microbiol Biotechnol (2009) 36:1189–1197 1193
Although the OD of the culture stabilized after approxi-mately 10 days, exponential growth of DHC continueduntil approximately day 24. These results suggest that non-DHC microorganisms in the consortium initially grewmuch faster than DHC. During this early fermentationperiod, DHC represented a relatively low proportion of thetotal bacterial population of the culture, but duringextended growth the relative abundance of DHC in the cul-ture increased. The results also demonstrate that, at leastduring the early stages of fermentation, OD measurementsare not a good indicator of DHC concentration in the cul-ture, and more advanced measurements such as qPCR areneeded to estimate DHC numbers in the culture eVectively[17, 27].
During the initial stages of 3,200-L fermentation (to day25) a maximum DHC concentration of »1011 DHC/L wasachieved in the fermentor, even though growth substrateswere still present in the culture broth (Fig. 1a). DHC con-centrations in the fermentor, however, could be increasedapproximately tenfold by the addition of YE as a nutrientsource. The exact role of the YE is not known, but its addi-tion also revived the growth of non-DHC organisms in theconsortium (Fig. 1a). Because the RAMM medium used inthis study did not contain sodium sulWde or other sulfur-containing salts, it is possible that the yeast extract pro-vided a needed source of sulfur for the cultures. Based onour analysis (data not shown) 1 g/L YE was estimated toprovide 5 mg/L sulfur and 0.48 mg/L iron. YE also couldprovide a needed source of amino acids and/or precursorsfor the production of corrinoid cofactors that are necessaryfor dehalogenation by DHC strains [23]. During thisextended growth of the culture there was a correlationbetween culture OD550 and DHC concentrations, suggest-ing that during this period of the fermentation process mea-surements of OD may be useful for estimating DHC levelsin the fermentor and to automate the control of the fermen-tation process.
Similar fermentation results were obtained with twoother chloroethene dechlorinating bacterial consortia,PJKS™ and Hawaii-05™, at both the 550-L and 3,200-Lscale (Table 1), by using the described procedures. Both
cultures could be grown to high DHC concentration(>1011 cells/L), and both the Wnal OD550 and total cell massobtained were similar to the results obtained with SDC-9™.
No other studies have evaluated or reported large-scaleproduction of DHC-containing consortia, but the DHC cellconcentration achieved in our studies were similar to thoseobtained by others in small-scale laboratory tests. Forexample, Couples et al. [1] calculated Wnal DHC concentra-tions of up to 4 £ 1011/L during growth of the VS culture inTCE-fed 60-mL batch cultures, and He et al. [9], achievedup to 1.8 £ 1011 copies/L of the tceA gene in 100-mL batchcultures of D. ethenogenes strain 195 containing a cocul-ture of a sulfate-reducing bacterium. Similarly, whereas weobserved DHC doubling times of 19.3 h during large-scalefermentation, DHC doubling times from small laboratorystudies of 19.5 h to 2 days have been reported [2, 9, 10, 22].
The results of this study demonstrate that culture vol-umes and DHC cell densities suYcient to treat even rela-tively large contaminated aquifers can be obtained.Assuming that 107 DHC/L of contaminated groundwaterare needed to obtain eVective and timely remediation [19],3,200 L of culture with 1011 DHC/L could potentially sup-port remediation of 3.2 £ 107 L of groundwater, even with-out further in situ growth of the organisms.
Factors aVecting fermentation
Several factors could aVect the results obtained duringgrowth of the test cultures, including substrate type andfeed rates, pH, and VFA accumulation. Growth of DHCrequires the presence of a chlorinated substrate as an elec-tron acceptor, H2 as an electron donor, and a carbon growthsource such as acetate [8, 16, 23]. In consortia such as thoseused in this study, the primary growth substrate (i.e., lac-tate) is fermented by non-DHC members of the consortia toH2 and acetate that can be utilized by DHC. The presenceof excess H2, however, can lead to substrate competitionwith methanogenic bacteria in the consortia that also canuse H2, albeit at a higher substrate threshold than DHC [18,20, 34]. Therefore, in developing a fermentation protocolfor the described cultures, attempts were made to maintain
Table 1 Results of multiple fermentation runs with the tested chlorinated solvent-dechlorinat-ing consortia
Culture Date (M/Y)
Volume (L)
Final OD550
Final DHC (cells/L)a
Dwt (mg/L)
PCE activity (mg/h/g Dwt)
cDCE activity (mg/h/g Dwt)
SDC-9 01/2006 550 1.3 1.4 E11 0.51 16 13
SDC-9 02/2008 550 1.7 2.8 E11 0.66 22 14
SDC-9 03/2008 3,200 1.6 1.4 E11 0.65 41 37
SDC-9 05/2008 2,500 1.6 2.4 E12 0.59 42 39
SDC-9 08/2008 2,000 1.4 1.0 E12 0.51 80 69
PJKS 01/2008 2,500 1.1 9.4 E11 0.41 32 14
PJKS 02/2008 1,700 1.3 1.0 E11 0.50 64 45
Hawaii-05 11/2007 550 1.2 1.5 E11 0.50 23 16a Based on qPCR assuming 1 16S rRNA gene copy/cell
123

1194 J Ind Microbiol Biotechnol (2009) 36:1189–1197
consistent low H2 concentrations within the reactor. Thesodium lactate feed rate used during the fermentation pro-cess resulted in sustained dissolved hydrogen concentrationin the reactor of <20 nM. During utilization of the initialbatch feeding of lactate and YE added prior to inoculation,H2 concentrations sometimes exceeded 100 nM, but duringthe extended fermentation process H2 concentrations weretypically 3–5 nM, which was similar to the half-velocitycoeYcient for hydrogen calculated for the VS culture(7 § 2 nM; [3]).
Fermentation of lactate also led to an accumulation ofVFAs (e.g., propionate and acetate) that could potentiallyinhibit dechlorinating organisms in the consortia. Studieswith SDC-9™ demonstrated that dehalogenation of chlori-nated ethenes by the culture was not inhibited by propio-nate and acetate concentrations to 6,000 mg/L (data notshown). Figure 2a, b shows the formation of VFAs duringgrowth of SDC-9™ and PJKS™, respectively. In bothcases, the VFA concentrations did not reach inhibitory lev-els with the fermentation protocol described here. Notably,the SDC-9™ culture accumulated much less propionateand acetate than the PJKS™ culture grown under the sameconditions. Although the reason for this lower accumula-tion of VFAs is not certain, it is likely due to evolution ofthe SDC-9™ consortium during several years of mainte-nance on lactate as a primary growth substrate, either inactivity or member composition, to utilize VFAs moreeYciently.
To optimize the growth of the SDC-9™ consortium itwas necessary to determine a relationship between PCEfeed rate and DHC cell concentration. We were most con-cerned about maintaining the VC-reducing population(s) inthe consortia because VC reduction is less energeticallyfavorable than the other dehalogenating reactions, so it waspossible that PCE and TCE dehalogenating populationscould outcompete the VC reducers if the higher chlorinatedsubstrates were maintained in excess. Furthermore,Cupples et al. [3] observed that net decay in dechlorinatingmicroorganisms could occur in the VS culture if DCE plusVC concentrations were below 0.7 �M. In addition, withSDC-9™, based on many biodegradation assays, the VCdechlorination rate is 28–35% of the PCE dechlorinationrate. Therefore, there was a tendency for VC to accumulatein the fermentor during high-rate PCE feeding. Conse-quently, PCE feed rates were adjusted to prevent accumula-tion of PCE, TCE or cis-DCE while maintaining a residualVC concentration in the medium of »1 mg/L (16 �M).Evaluating the PCE feed rates during multiple fermentationruns, the results of the biodegradation assays, and the anal-yses of PCE, TCE cDCE, and VC concentrations duringfermentation allowed us to optimize PCE feed rates for thegrowth of SDC-9™ consortium. The relationship betweenDHC yield and PCE feed rate could be described by the
following equation: DHC concentration (cells/L) =¡6.77 £ 1011 + [8.40 £ 1011 £ PCE feed rate (mg/h £ L)](R = 0.999).
Dehalogenation of chloroethenes by SDC-9™ also wasaVected by culture pH, with little or no dehalogenationbelow pH 5.0 (Fig. 3). Both reductive dehalogenation andfermentation of the growth substrates used to grow the cellsconsumes considerable amounts of alkalinity [24]. The pHof the medium in the 4,000-L fermentor decreased from aninitial pH of 7.4 to approximately 6.1 during the Wrst30 days of cell growth (Fig. 1b). Because the culture wasfed sodium lactate, however, the addition of NaOH to con-trol pH could have led to an excess of sodium ions in thereactor that could aVect cell growth. Therefore, instead ofadding NaOH, the fermentors were sparged periodicallywith N2 to remove dissolved CO2 from the culture medium.This approach suYciently regulated the medium pH toallow completion of the culture production (Fig. 1b), eventhough this may have been below the optimum pH fordehalogenation by the cultures.
Fig. 2 Accumulation of VFAs during growth of SDC-9™ (a) orPJKS™ (b) in a 750-L fermentor. Symbols indicate lactic acid (Wlleddiamond), propionic acid (Wlled circle), formic acid (open diamond),pyruvic acid (open square), butyric acid (open triangle), and aceticacid (Wlled square), or the total amount of sodium lactate added to thefermentor (open circle; b)
0
500
1000
1500
2000
2500
3000
3500
0 2 4 6 8 10 12 14 16
Time (d)
Con
cent
ratio
n (m
g/L)
Con
cent
ratio
n (m
g/L)
Totel Lactate added (g/l)
Start Sodium Lactate feed 0.5 ml/L x day
A
0
500
1000
1500
2000
0
1
2
3
4
5
6
7
0 4 8 12 16
Time (d)
B
123

J Ind Microbiol Biotechnol (2009) 36:1189–1197 1195
Culture activity
The relative degradative activity of the grown dehalogenat-ing cultures was evaluated by performing serum bottlebiodegradation assays with the grown culture. Thebiodegradation assays evaluated the ability of the growncultures to dehalogenate PCE and cDCE by incubating thecells in individual serum vials with either PCE or cDCE.An example of a PCE degradation activity assay is pre-sented in Fig. 4. A summary of results from several assayswith the three test cultures evaluated here is presented inTable 1. In each case, the speciWc activities of the resultingcultures were of a similar order of magnitude, but somevariation was observed. Several factors could cause the
observed diVerences, including variability in the concentra-tion of nondehalogenating organisms produced. That is,because the cultures were mixtures of dehalogenating andnondehalogenating microbes, even relatively small diVer-ences in the total concentration of nondehalogenatingmicrobes could greatly aVect the measured speciWc, dry-weight-based, activity measurements. Repetitive fermenta-tion of SDC-9™ culture over the last 4 years has resulted indevelopment of the current fermentation protocol that hasresulted in a general increase in the speciWc activity of theproduced cultures.
Related issues
The use of bioaugmentation to remediate chlorinated sol-vent-contaminated sites requires the shipment of culturesthroughout the USA and elsewhere. Shipping a large vol-ume of culture is costly, and ground transportation canrequire that the culture spend several days in shipping,which could aVect culture activity. An alternate approach isto concentrate the culture to allow overnight shipping of areduced culture volume. We used a tubular ceramic mem-brane system to concentrate consortia. The cell culture waschilled during concentration to ensure maintenance of cellviability. Analysis of the speciWc activity of the cells beforeand after concentration demonstrated only slight changes inactivity during concentration. For example, speciWc activityof two cultures tested were 24.5 and 16.5 mg PCE/h £ gDwt before concentration and 22.6 and 15.1 mg PCE/h £ gDwt after concentration, respectively. Concentrationresulted in approximately 90% reduction in culture volume,and it also removed »90% of any fermentation byproductsremaining in the culture broth. It also allowed us to stan-dardize the DHC concentration and activity of culturebatches, thereby allowing users to more accurately estimatethe volume of culture needed for Weld applications.
Storage of bacterial cultures also is critical for allowingtimely delivery of cultures to contaminated sites to coordinateculture injection with the availability of Weld personnel andequipment (e.g., drilling rigs). To evaluate storage longevity,tenfold-concentrated SDC-9™ cultures were incubated for upto 90 days at either 4°C, 13°C, 22°C, or 28°C in stainless-steelcontainers. Periodically, samples of the stored cultures wereremoved and assayed for their ability to degrade PCE andcDCE. Activity of the culture decreased rapidly if stored at13°C or 28°C, but SDC-9™ could be stored at 4°C for>40 day without measurable loss of activity (Fig. 5).
Conclusions
A fermentation protocol was developed for large-scaleproduction of DHC-containing cultures for in situ
Fig. 3 EVect of culture pH on PCE dehalogenation by SDC-9™.Values represent the mean of triplicate samples, and error barsrepresent one standard error of the mean
0
0.5
1
1.5
5 6 7 8 9 10
pH
PC
E d
egra
datio
n ra
te (
mg/
l x h
)
Fig. 4 Results of a PCE degradation assay with samples from a550-L fermentation batch of the SDC-9™ culture. The assay wasperformed in 60-mL serum vials containing 60 mL SDC-9™ culture(0.52 g/L Dwt), 6 mM sodium lactate, and 10 mg/L PCE. Valuesrepresent means of triplicate samples and error bars represent onestandard error of the mean
0
10
20
30
40
50
60
70
0 20 40 60 80 100 120 140
PCETCEcis-DCE
VC
Time (min)
Con
cent
ratio
n (µ
M)
123

1196 J Ind Microbiol Biotechnol (2009) 36:1189–1197
bioaugmentation of chlorinated ethene-contaminated aqui-fers. The performance of the SDC-9™ culture in contami-nated aquifer material is described elsewhere [28]. Successof the fermentation process was dependant on electrondonor (i.e., lactate) and acceptor (PCE) feed rate, and theaddition of YE greatly improved cell yield. The initialstages of fermentation were characterized by a rapid growthof non-DHC organisms in the culture, while the growth rateof DHC within the consortia tested exhibited a short lag andthen was relatively constant to Wnal DHC concentrations of>1011/L. The fermentation protocol was scalable to 550 Land 3,200 L and produced comparable results for consortiaenriched from three diVerent sites.
Based on 16S RNA gene sequencing the SDC-9™ cul-ture contains multiple DHC strains (data not shown), and itis possible that growth of the individual dehalogenatingstrains within the culture might be diVerent during the fer-mentation process. Although this could not be monitoredduring this study, our results demonstrated that both PCEand cDCE dehalogenation activities were high in the Wnalcultures, and the culture degraded VC well, albeit at a lowerrate than PCE and cDCE dehalogenation. This suggests thatthe described procedure supports the growth of DHC thatare able to completely dehalogenate chlorinated ethenes,including vinyl chloride. Our results also demonstrate thatDHC-containing cultures designed for bioaugmentation canbe concentrated by cross-Xow Wltration to reduce shipping
volumes, and that the concentrated cultures can be storedunder refrigeration for >40 days to allow for injectionschedule Xexibility.
With the increased use of bioaugmentation to treat chal-lenging chlorinated ethene-contaminated sites, the ability toproduce large volumes of high-density cultures is becomingincreasingly important. This study provides useful informa-tion to aid in the production of cultures for bioaugmenta-tion, even at scales suitable for treating large contaminantplumes.
Acknowledgments The authors thank Randi Rothmel, AntonioSoto, Kevin McClay, and Paul Hedman for excellent analytical support.This project was supported by the Environmental Security TechnologyCertiWcation Program (ESTCP) project number CU-0515. Any opin-ions, Wndings, and conclusions or recommendations expressed in thismaterial are those of the authors and do not necessarily reXect those ofthe US Army Corp. of Engineers, Humphreys Engineer Center SupportActivity.
References
1. Cupples AM, Spormann AM, McCarty PL (2003) Growth of aDehalococcoides-like microorganism on vinyl chloride and cis-di-chloroethene as electron acceptors as determined by competitivePCR. Appl Environ Microbiol 69:953–959. doi:10.1128/AEM.69.2.953-959.2003
2. Cupples AM, Spormann AM, McCarty PL (2004) Comparativeevaluation of chloroethene dechlorination to ethane by De-halococcoides-like microorganisms. Environ Sci Technol 38:4768–4774. doi:10.1021/es049965z
3. Cupples AM, Spormann AM, McCarty PL (2004) Vinyl chlorideand cis-dichloroethene dechlorination kinetics and microorganismgrowth under substrate limiting conditions. Environ Sci Technol38:1102–1107. doi:10.1021/es0348647
4. Duhamel M, Mo K, Edwards EA (2004) Characterization of ahighly enriched Dehalococcoides-containing culture that grows onvinyl chloride and trichloroethene. Appl Environ Microbiol70:5538–5545. doi:10.1128/AEM.70.9.5538-5545.2004
5. Ellis DE, Lutz EJ, Odom JM, Ronald J, Buchanan J, Bartlett C,Lee MD, Harkness MR, Deweerd KA (2000) Bioaugmentation foraccelerated in situ anaerobic bioremediation. Environ Sci Technol34:2254–2260. doi:10.1021/es990638e
6. GriYn BM, Tiedje JM, LöZer FE (2004) Anaerobic microbialreductive dechlorination of tetrachloroethene (PCE) to predomi-nately trans-1, 2 dichloroethene. Environ Sci Technol 38:4300–4303. doi:10.102/es035439g
7. He J, Ritalahti KM, Aiello MR, LöZer FE (2003) Complete detox-iWcation of vinyl chloride by an anaerobic enrichment culture andidentiWcation of the reductively dechlorinating population asDehalococcoides species. Appl Environ Microbiol 69:996–1003.doi:10.1128/AEM.69.2.996-1003.2003
8. He J, Ritalahti KM, Yang KL, Koenigsberg SS, LöZer FE (2003)DetoxiWcation of vinyl chloride to ethene coupled to growth of ananaerobic bacterium. Nature 424:62–65. doi:10.1038/nature01717
9. He J, Holmes V, Lee PKH, Alvarez-Cohen L (2007) InXuence ofvitamin B12 and co-cultures on the growth of Dehalococcoides iso-lates in deWned medium. Appl Environ Microbiol 73:2847–2853.doi:10.1128/AEM.02574-06
10. He J, Sung Y, Krajmalnik-Brown R, Ritalahti KM, LöZer FE(2005) Isolation and characterization of Dehalococcoides sp.
Fig. 5 EVect of storage conditions on the activity of concentratedSDC-9™ culture. Tenfold-concentrated SDC-9™ culture was storedanaerobically and without substrate at either 4°C (Wlled circle), 13°C(Wlled square), 22°C (Wlled diamond) or 28°C (Wlled triangle). Valuesrepresent means of triplicate samples, and error bars are one standarderror of the mean
0
2
4
6
8
10
0 20 40 60 80 100
Time (d)
PC
E d
echl
orin
atio
n ra
te (
mg/
l x h
)
123
J Ind Microbiol Biotechnol (2009) 36:1189–1197 1197
Strain FL2, a trichloroethene (TCE) and 1,2-dichloroethene-re-spiring anaerobe. Environ Microbiol 7:1442–1450. doi:10.1111/j.1462-2920.2005.00830.x
11. Hendrickson ER, Payne JA, Young RM, Starr MG, Perry MP,Fahnestock S, Ellis DE, Ebersole RC (2002) Molecular analysis ofDehalococcoides 16S ribosomal DNA from chloroethene-contam-inated sites throughout North America and Europe. Appl Micro-biol 68:485–495. doi:10.1128/AEM.68.2.485-495.2002
12. Holliger C, Wohlfarth G, Diekert G (1999) Reductive dechlorina-tion in the energy metabolism of anaerobic bacteria. FEMS Micro-biol Rev 22:383–398. doi:10.1111/j.1574-6976.1998.tb00377.x
13. Holliger C, Schumacher W (1994) Reductive dehalogenation as arespiratory process. Antonie Van Leeuwenhoek 66:239–246.doi:10.1007/BF00871642
14. Lee MD, Odom JM, Buchanan RJ Jr (1998) New perspectives onmicrobial dehalogenation of chlorinated solvents: insights fromthe Weld. Annu Rev Microbiol 52:423–452. doi:10.1146/annurev.micro.52.1.423
15. Lendvay JM, LöZer FE, Dollhopf M, Aiello MR, Daniels G,Fathepure BZ, Gebhard M, Heine R, Helton R, Shi J, Krajmalnik-Brown R, Major CL Jr, Barcelona MJ, Petrovskis E, Tiedje JM,Adriaens P (2002) Bioreactive barriers: bioaugmentation andbiostimulation for chlorinated solvent remediation. Environ SciTechnol 37:1422–1431. doi:10.102/es025985u
16. LöZer FE, Cole JR, Ritalahti KM, Tiedje JM (2003) Diversity ofdechlorinating bacteria. In: Häggblom MM, Bossert ID (eds)Dehalogenation: microbial processes and environmental applica-tions. Kluwer Academic Press, New York, pp 53–87. doi:10.1007/0-306-48011-5_3
17. LöZer FE, Sun Q, Li J, Tiedje JM (2000) 16S rRNA gene-baseddetection of tetrachloroethene-dechlorinating Desulfuromonasand Dehalococcoides species. Appl Environ Microbiol 66:1369–1374. doi:10.1128/AEM.66.4.1369-1374.2000
18. LöZer FE, Tiedje JM, Sanford RA (1999) Fraction of electronsconsumed in electron acceptor reduction and hydrogen thresholdsas indicators of halorespiratory physiology. Appl Environ Micro-biol 65:4049–4056
19. Lu X, Wilson JT, Kampbell DH (2006) Relationship betweenDehalococcoides DNA in ground water and rates of reductivedechlorination at Weld scale. Water Res 40:3131–3140. doi:10.1016/j.watres.2006.05.030
20. Lu X-X, Tao S, Bosma T, Gerritse J (2001) Characteristic hydro-gen concentrations for various redox processes in batch study. JEnviron Sci Health A 36:1725–1734. doi:10.1081/ESE-100106254
21. Major DW, McMaster ML, Cox EE, Edwards EA, Dworatzek SM,Hendrickson ER, Starr MG, Payne JA, Buonamici LW (2002)Field demonstration of successful bioaugmentation to achievedechlorination of tetrachloroethene to ethene. Environ Sci Technol36:5106–5116. doi:10.1021/es0255711
22. Maymó-Gatell X, Anguish T, Zinder SH (1999) Reductive dechlo-rination of chlorinated ethenes and 1, 2-dichloroethane by“Dehalococcoides ethenogenes” 195. Appl Environ Microbiol65:3108–3113
23. Maymó-Gatell X, Chien YT, Gossett JM, Zinder SH (1997) Isola-tion of a bacterium that reductively dechlorinates tetrachloroeth-ene to ethene. Science 276:1568–1571. doi:10.1126/science.276.5318.1568
24. McCarty PL, Chu M-Y, Kitanidis PK (2006) Electron donor andpH relationships for biologically enhanced dissolution of chlori-nated solvent DNAPL in groundwater. Eur J Soil Biol 43:276–282. doi:10.1016/j.ejsobi.2007.03.004
25. Moran MJ, Zogorski S (2007) Chlorinated solvents ingroundwater of the United States. Environ Sci Technol 41:74–81.doi:10.1021/es061553y
26. Müller JA, Rosner BM, von Abendroth G, Meshulam-Simon G,McCarty PL, Spormann AM (2004) Molecular identiWcation of thecatabolic vinyl chloride reductase from Dehalococcoides sp. strainVS and its environmental distribution. Appl Environ Microbiol70:4880–4888. doi:10.1128/AEM.70.8.4880-4888.2004
27. Ritalahti KM, Amos BK, Sung Y, Wu Q, Koenigsberg SS, LöZerFE (2006) Quantitative PCR targeting 16S rRNA and reductivedehalogenase genes simultaneously monitors multiple De-halococcoides strains. Appl Environ Microbiol 72:2765–2774.doi:10.1128/AEM.72.4.2765-2774.2006
28. Schaefer CE, Condee CW, Vainberg S, SteVan RJ (2009) Bioaug-mentation for chlorinated ethenes using Dehalococcoides sp.:comparison between batch and column experiments. Chemo-sphere 75:141–148. doi:10.1016/j.chemosphere.2008.12.041
29. Shelton DR, Tiedje JM (1984) General method for determininganaerobic biodegradation potential. Appl Environ Microbiol47:850–857
30. Smidt H, de Vos WM (2004) Anaerobic microbiol dehalogen-ation. Annu Rev Microbiol 58:43–73. doi:10.1146/annurev.micro.58.030603.123600
31. Sung Y, Ritalahti KM, Apkarian RP, LöZer (2006) QuantitativePCR conWrms purity of strain GT, a novel trichloroethene-to-ethene-respiring Dehalococcoides isolate. Appl Environ Micro-biol 72:1980–1987. doi:10.1128/AEM.72.3.1980-1987.2006
32. U.S. EPA (1998) U.S. EPA test methods for evaluating solidwaste, physical/chemical methods SW846, 3rd edn. Revision 5,1998
33. Westrick JJ, Mello JW, Thomas RF (2004) The groundwater sup-ply survey. J Am Water Works Assoc 76:52–59
34. Yang Y, McCarty PL (1998) Competition for hydrogen within achlorinated solvent dehalogenating anaerobic mixed culture. Envi-ron Sci Technol 32:3591–3597. doi:10.1021/es991410u
35. Zhang J, Andrew AP, Chiu PC (2006) 1,1-Dichloroethene as a pre-dominant intermediate of microbial trichloroethene reduction.Environ Sci Technol 40:1830–1836
123