degree in finance and accounting · final project – june 2015 ... pepsi, so it would be ... this...
TRANSCRIPT

DEGREE IN FINANCE AND ACCOUNTING
COCA-COLA’S CASE
Bachelor’s Degree Final Project –June 2015 Introduced by: Noelia Fabregat García DNI: 20905094A [email protected]
Tutor: Antonio Vico Martínez Departamento de Finanzas y Contabilidad
Coca-Cola’s case is a research paper based on coca-
cola bottling companies in Spain. Its aim is to analyse
its financial statements and the conclusions about its
corresponding profitability and liquidity indicators to
finally reach the conclusion that this large
reorganizations and the labour force adjustment plan
suffered were not really argued and the alleged causes
were not certain at all. So we can see that Coca-Cola’s
company was trying to get on train of what was
happening during the financial and economic crisis in
Spain.

COCA-COLA’S CASE 2015
Noelia Fabregat García Pg. 2
INDEX:
1. Introduction ................................................................................................................. 3
1.1 Justification and interest of the topic ............................................................................3
2. Analysis of financial statements .............................................................................. 4
3. Information and analysis of the companies ............................................................ 5
3.1 Sector analysis ................................................................................................................5
3.2 Description and evolution of its bottling companies ...................................................6
4. Financial evolution ..................................................................................................... 7
Evaluation of the main reasons in each bottling company ...............................................7
4.1.1 Profitability analysis ................................................................................................7
4.1.2 Liquidity Analysis: ..................................................................................................22
5. Conclusions; currently bottling companies .......................................................... 47
6. Bibligraphy: ............................................................................................................... 48

COCA-COLA’S CASE 2015
Noelia Fabregat García Pg. 3
1. Introduction
In this Bachelor’s Degree Final Project, it is realized an analysis regarding Coca-Cola
Company, as well as its Spanish subsidiary, Coca-Cola Iberian Partners, S.A. and its
respective bottling companies around Spain.
The main objective on this research is to analyse the financial statements of the
bottling companies. In this way we will know the pertinent indicators of profitability and
liquidity. This analysis will enable to obtain an evolution of these in each company, and
may be compared one company with others with the same features. In this way, a
ranking of the basis of the relevant indicators may be obtained. The financial analysis
of each of the above companies will be based from the information included in the
financial statements got thanks to IBAS (Iberian Balance of the Analysis System).
Thanks to this analysis we can to conclude a diagnosis of each one of the analysed
companies allowing the reader get their own conclusions about what happened until
now and what will probably happen in the future regarding the bottling companies of
Coca-Cola in Spain.
1.1 Justification and interest of the topic
The financial analysis of the bottling companies is considered an important issue. This
is because the previous year, the bottling companies underwent intense
reorganizations by the multinational. The labour force adjustment plan (ERE) suffered
by Coca-Cola, invaded the news with hundreds of firings, around 750 workers of a total
of 4200 of the staff.
What it is tried to analyse in this research is to know if these settings were really
necessary or it could have been avoided or maybe the existing possibilities for the
reductions of costs were not studied.
What it is really essential is to know if these measures were necessary or they simply
tried to get on the train of what at the moment was happening in the Spanish economy.

COCA-COLA’S CASE 2015
Noelia Fabregat García Pg. 4
2. Analysis of financial statements
The analysis of the financial statements is based on analysing their content for different
companies, whose final goal is to make useful judgements which diminish the
uncertainty to which economic agents are exposed in their decisions. The analysis of
the financial statements is therefore a procedure that interests both internal users and
external of the companies analysed.
To carry out a correct analysis, the analyst has to be clear that the task will begin
taking into account as raw material the financial statements of the companies analysed,
but at the same time, he has to have in mind the circumstances in which the company
operates. So by analysing the sector to the societies belong, the economic situation
and the enterprises strategies to deal with an uncertain future. In this way, five stages
in the analysis will must be done:
1- Analysis of the environment
2- Analysis of the company's strategy
3- Interpretation of the content of the financial statements
4- Analysis of the profitability-risks
5- Historical analysis to a future projection

COCA-COLA’S CASE 2015
Noelia Fabregat García Pg. 5
3. Information and analysis of the companies
3.1 Sector analysis
Coca-Cola belongs to the industrial sector of the economy, more specifically to the food
and beverage sector.
Coca-Cola Iberian Partner,S.A. belongs to a sector of drinks where the company itself
does not have many direct competitors. It is a company that offers a wide variety of
products, covering in this way the taste of all the consumers, such as: juices, water,
soft-drinks, energy drinks, drinks for athletes, and even tea. Therefore, Coca-Cola
leaves only a vacuum in beverages like coffee or alcoholic drinks. So Coca-Cola,
covering such a variety of beverages do not afraid by the competition which could
arrive in a future.
Moreover Coca-Cola Iberian Partner S.A. is a company which not bottled itself, but it
has a number of exclusive contracts with bottling companies, this is because that is a
great investment of machinery necessary for bottling the drink by what this phase of the
productive process is done by other companies with the objective of reducing the fixed
costs and having a lower operating risks.
There are not legal barriers to access to the production of the drink, but this sector has
a very important impediment, and it is its so well-known brand name, its evolution in the
sector and its history for more than 100 years. Another important barrier is to place the
new product in certain bars, restaurants and other points of sale; today all have that
need covered by Coca-Cola or by its more direct competitor, Pepsi, so it would be
difficult to place it on the market.
It is a sector where buyers do not have power over the company, since there are many
buyers and what somebody can say about the brand does not affect them. As well as
the supplier of the cans or the sweeteners, whose power over the company is very
limited, this is because there are many providers who can offer these products on the
market.

COCA-COLA’S CASE 2015
Noelia Fabregat García Pg. 6
3.2 Description and evolution of its bottling companies
Coca-Cola is a multinational company of great magnitude, which makes large
investments in countries where it has productive plants.
Coca-Cola Iberian Partners S.A. is the subsidiary of Coca-Cola in Spain, Portugal and
Andorra. It was born in February 2013 by the integration of the eight existing bottling
companies. Coca-Cola’s bottlers in Spain deal with the manufacture, sale and
distribution of beverages, in the limits of a specific territory and under strict quality
standards.
This analysis will be focused on the Spanish bottling, which will be reduced to a total of
seven:
1-Asturbega S.A. It was the first bottling plant which appeared in Colloto,
Asturias in 1961. It was a family business with a total of 44 workers who were only
devoted to the product of Coca-Cola. Currently, it bottles for more than 50 different
brands.
2- Begano, S.A. It is located in A Coruña and it was created in 1959 by
distributing to the Galician Community. In 1961 the first bottle came from this plant
came out to the market. The company had 387 workers in 2012.
3- Casbega, S.L. It was the second Spanish bottling company established in
1952, which was installed in Fuenlabrada, Madrid. The society was composed in 2012
by 957 workers.
4- Cobega S.A. In 1951, it located in Barcelona, it was the first Spanish bottling
of Coca-Cola in Spain and also of the European zone. It was on March 31, 1953 when
the first Spanish bottle of this soft-drink came out to the market. The company began in
Barcelona and currently it is also in Palma de Mallorca and Tenerife.
5- Colebega S.A. It was founded in 1954 in the Valencian Community. There
are 2 plants in Valencia and one in Alicante. It had 541 employees in 2012, there has
been a clear decline since 2007 because of the economic situation of the country.
Colebega has the oldest workers from the seven bottling companies.
6- Norbega S.A. Norbega, which began marketing the drink a year later, was
founded in 1955. The plant is in Galdakao, Bilbao. In 2012 the staff was about 292
workers, stressing that this staff is the youngest out of the seven.
7- Rendelsur S.A. It was created in 1957, there were three Coca-Cola bottling
companies in Badajoz, Seville and Málaga. After the economic situation it was reduced
to two, being eliminated Badajoz. There are 800 workers. It is noted that it is the
society with lower percentage of women who work out of the seven bottling companies.

COCA-COLA’S CASE 2015
Noelia Fabregat García Pg. 7
4. Financial evolution
Evaluation of the main reasons in each bottling company
The financial analysis is the study of companies which can determine if an investment
is advisable. This study is carried out thanks to the accounting information in the IBAS
about the seven bottling companies of Coca-Cola in recent years. Then it is analysed
the information through the use of a few financial indicators, which provide us
information about profitability and liquidity of these companies.
4.1.1 Profitability analysis
According Archel D.P (2012) ‘Profitability is a relative value which is defined in a
generic manner, as the quotient between the result and the level of investment made
by a company.
In order to do a corresponding analysis of profitability it will be necessary having an
account of income statement, and a balance sheet for each analysed society. There
are two types which refer to the concept of profitability in a society, the first one is
based on the economic management and the second takes into account the financial
management.
It is really important to difference between both profitabilities since in this way it is
allowed to discriminate between companies that are not profitable because of problems
in the development of its economic activity (ROA), and those that are not by
deficiencies in the management of its financing policy (ROE). It is an essential
difference to societies because with such results it can be altered the way of acting, but
it has to bear in mind that it is easier to modify the financial structure than the economic
one.’

COCA-COLA’S CASE 2015
Noelia Fabregat García Pg. 8
4.1.1.1 ROA Analysis
ROA (Return On Assets)- ROA (Return On Assets). According Archel D.P. (2012)
‘ROA is the profitability of the investments made by the company as an economic unit
or production unit. These investments correspond to the total of assets listed on the
balance sheet of the annual accounts of each analysed society.’
The economic profitability reflects a profitability independent rate of the form in which
the company finances its assets, that is, independent of its financial structure and its
cost.
To carry out this analysis, it has been considered appropriate to distinguish between
two methods used for research; these are: Cross-Section in the year 2013 and a time-
series according to the evolution of each bottling company in the analysed period, in
addition to the observation of the sector’s average during the same period 2008-2013.
A. Cross-Section 2013
A Cross-Section analysis is carried out in the year 2013. In this, there will be a
comparison of each bottling company with the own sector where they work. Thanks for
this analysis; the analyst can assess the efficiency of each company and check which
one has a highest profitability in order to make the best possible investment among all
the analysed companies.
Chart (1) Cross- Section 2013, ROA Analysis, own elaboration
This bar chart (1) shows that the bar, which is the average of the sector in 2013, is
above the other two bars, which at the same time, overcome such average, despite
the fact that three companies distance themselves clearly at this time.
In this year, 2013, the company that presents the highest profitability is Rendelsur, S.A.
with 21.60%, the second place is for Norbega, S.A. with 17.93% and the third is
-7,44%
7,66%
-25,07%
7,73%
16,88% 17,93% 21,60%
-30,00%
-20,00%
-10,00%
0,00%
10,00%
20,00%
30,00%
2013
%
year 2013
Cross- Section 2013
Asturbega,S.A.
Begano,S.A.
Casbega,S.L
Cobega,S.A.
Colebega,S.A.
Norbega,S.A.
Rendelsur,S.A.

COCA-COLA’S CASE 2015
Noelia Fabregat García Pg. 9
Colebega, S.A. with 16.88%. These are the three companies who distance themselves
clearly from the rest. Subsequently, there are two bottling companies in this period
which present a ROA approximately to the sector’s average, which are Begano,S.A.
and Cobega,S.A. with a 7% approximately. Finally, there are two companies which
have a negative profitability, these are Asturbega, S.A. and Casbega S.L..
B. Time Series
a. Each company in the period 2008-2013
Each company is analysed individually, so all the changes tried out over the observed
period. In this table which is attached, it can be observed the evolution of each one of
the seven bottling companies, maybe it can be facilitated the understanding of it later,
in a comparison between all the bottling with a bar chart.
ROA 2013 2012 2011 2010 2009 2008
Asturbega,S.A. -7,44% 6,66% 56,35% 3,71% 3,85% 4,69%
Begano,S.A. 7,66% 4,75% 15,78% 7,96% 8,22% 6,26%
Casbega,S.L. -25,07%
Cobega,S.A. 7,73%
Colebega,S.A. 16,88% 16,88% 29,38% 2,04% 2,19% 3,30%
Norbega,S.A. 17,93% 29,50% 14,20% 9,15% 8,92% 7,74%
Rendelsur,S.A. 21,60% 4,00% 32,52% 2,65% 2,58% 2,37%
Data table(1)Each company in the period 2008-2013, ROA Analysis
Attached below there is a clustered bar chart(2) which shows the evolution of the seven
companies, in terms of economic profitability over the seven years:
Chart (2) Each company in the period 2008-2013, ROA Analysis, own elaboration
-40,00%
-20,00%
0,00%
20,00%
40,00%
60,00%
2013 2012 2011 2010 2009 2008
%
years
ROA Analysis
Asturbega,S.A.
Begano,S.A.
Casbega,S.L
Cobega,S.A.
Colebega,S.A.
Norbega,S.A.
Rendelsur,S.A.

COCA-COLA’S CASE 2015
Noelia Fabregat García Pg. 10
Asturbega,S.A. As it can be observed it kept constant in terms of economic profitability
during the early years of the crisis, but in the year 2011 it suffered a great boom in the
ratio, but achieving in the next period the previous levels. In the last year it achieved a
negative ratio.
This great change that experienced in 2011 is because there was an increase of profit
of 48 million Euros, while reducing assets by EUR 29 million; this variation will
therefore affect the increased result.
Another point that should be discussed in the result of the ratio of 2013, because it is
one of the two negative ratio appearing on the economic profitability in all the
enterprises. This ratio is due to presenting a negative result exercise in this period, as,
it presents losses, since although the assets have decreased considerably, losses
prevail over this, the earning that is negative, and for this reason it has been obtained a
negative economic profitability.
Begano,S.A. It is a company whose economic profitability remains positive in all the
periods, and aproximately constant, except for the 2011 period, in which an increase is
perceived, until arriving to 15.78%. The increase in this period is due to a significant
increase which has occurred in the profits before tax of about double than in the
previous year while reducing the average assets; which makes that the economic
profitability analysed period was higher than the previous year.
Casbega,S.L. In its first year of creation as a limited liability company in 2013, it has
had a negative profitability of 25.07%, because this society has lost instead of profits.
Cobega, S.A., The database has only provided data of the last analysed period, and in
this case it presents a positive and higher profitability than the average sector at this
time.
Colebega,S.A., It presents a growing evolution of this ratio over the year, having a
large increase in 2011, which was later reduced but it still continues being a very high
number. In 2011 there was a huge increase in the profit for the period, dropping slightly
the average assets; so it was everything an evolution which had positive synergy so
that this ratio will be increased in 2011. Later in the following year, it was reduced again
the economic profitability in which while being reduced the profits and the average
assets, it was also reduced the ratio which was constant until the present.
Norbega,S.A., It shows a growing up evolution until the last period, which presents a
slight decrease, but still being considerably higher than the sector’s average in that
period. What has been produced is a constant increase in the profit which has been
increased more than the average assets. In the last period, this ratio instead of
increasing as has been experimenting throughout its evolution, decreases since the

COCA-COLA’S CASE 2015
Noelia Fabregat García Pg. 11
earnings of the society increases, producing a sharp increase in average assets,
making that this economic profitability period decreases with respect to the previous
one.
Rendelsur,S.A. It has produced a slight steady growth in the first three analysed
periods, but in 2011 there was a large rise of this ratio, for in 2012 to decline sharply to
increase again later. It is the same case that occurred with Colebega,S.A.. It had this
rise in 2012 for two reasons: the first one is a sharp increase in the benefit of the
society and the second one is a slight decrease of the average assets, both at the
same time. The change tried out in 2012 was caused because prior profits on 2011
were caught and that is when that sudden shift occurred but reducing the average
assets. Then the economic profitability was clearly lower in comparison with 2011, but
it is higher than the ratio in 2010 because it had a lower average assets and a greater
profit.
Now the meanings of ROA are going to be interpreted, what is the meaning of positive
or negative ROA?
On the one hand, there are two bottling companies which present a negative
ROA at some period of the analysis; so this means that the company invests a
lot in production and at the same time it receives little incomes. It would be a
negative consequence of this specific case, that a negative ROA was
accompanied from high levels of debt, since what would occur in the future
would be magnified its negative profitability.
On the other hand, a positive ROA expresses the amount of money which
makes the company with a particular capital’s investment.
Chart (3)-Average ROA of Each Company, ROA Analysis –Own elaboration
-5%
0%
5%
10%
15%
ROA( RE)
11%
8%
-4%
1%
12%
15%
11%
%
ROA
Average ROA of Each Company Asturbega,S.A.
Begano,S.A.
Casbega,S.L
Cobega,S.A.
Colebega,S.A.
Norbega,S.A.
Rendelsur,S.A.

COCA-COLA’S CASE 2015
Noelia Fabregat García Pg. 12
Data table (2) Average ROA each company, ROA Analysis- Own elaboration.
Below there is a comparison between these named companies to see which one offers
a higher average economic profitability? It is presented the date table (2) to see the
specific figures of the ROA by companies, and a cylindrical chart (3) where it can be
seen more clearly.
The company who presents the greater economic profitability with the investment made
on the average over the six years is Norbega, S.A. which has grown over the years in
which the Spanish economy was undergoing in a financial crisis so it is considered to
have a correct management of the company.
Casbega,S.L. presents a negative average ROA and because of that, this is which has
less economic profitability. If the degree of leverage has been risen the correct
management of the capital could have been wondered.
b. Sector’s average over 2008-2013
In this section it is estimated the average of the seven companies in each year in
particular. It has been added the date table (3) sector’s average and its corresponding
chart (4) which presenting the evolution of the average.
2013 2012 2011 2010 2009 2008
Industry average 5,61% 8,83% 21,18% 3,64% 3,68% 3,48%
Data table (3)Sector’s average over 2008-2013, ROA Analysis- Own elaboration
Business %
Asturbega,S.A. 11%
Begano,S.A. 8%
Casbega,S.L. -4%
Cobega,S.A. 1%
Colebega,S.A. 12%
Norbega,S.A. 15%
Rendelsur,S.A. 11%

COCA-COLA’S CASE 2015
Noelia Fabregat García Pg. 13
Chart (4) Sector’s average over 2008-2013, ROA Analysis- Own elaboration.
So if it compared the economic profitability of each company throughout the period with
the sector’s average, and by seeing the lineal representation for the sector’s average, it
can be concluded the following aspects:
o In the years 2008, 2009 and 2010 with a sector's average of 3.48%, 3.68% and
3.64% respectively, the companies which do not exceed the profitability in any
of these years are Rendelsur, S.A. and Colebega, S.A.
o There is therefore a change in 2011, where the sector’s average rises sharply
up to 21.18% level; companies that do not reach this level have varied respect
to the former; these are Norbega,S.A. and Begano,S.A. However the company
that exceeds by far the level is Astubega,S.A. reaching 56.35%.
o It is in 2012 when the average sector falls largely to 8.83% and it is for this
reason that Rendelsur, S.A. returns to not reach the average profitability level,
as in the case of Begano, S.A.
o In 2013 the average sector of economic profitability is 5.61%, the only
companies that have lower ROA are those which have a negative return in this
period. These are Asturbega,S.A. and Casbega,S.L. reaching -25.07%.
5,61%
8,83%
21,18%
3,64% 3,68%
3,48% 0,00%
5,00%
10,00%
15,00%
20,00%
25,00%
2013 2012 2011 2010 2009
%
years
Industry average- ROA
industry average

COCA-COLA’S CASE 2015
Noelia Fabregat García Pg. 14
4.1.1.2 ROE Analysis
ROE (Return On Equity)- According Archel.D.P. (2009) ‘It is the financial profitability
of the investments made by the owners as those who provide financing to the business
equity of the company. That profitability will be treated as an accounting point of view,
since the final profitability of the company will be analysed as an alternative to
investment-business-risk to the shareholder of the same.
The financial profitability depends on two factors: the economic profitability (ROA)
explained previously, and an additional factor called financial leverage. The sign of the
same will depend on that the assets will be greater or lower than the cost of the debt,
weighted the proportion representing the debt within the financial structure of the
company.
Thus, this analysis will be broken up in the aforementioned factors, analysing first ROE,
then ROA and its corresponding financial leverage attached. In this decomposition, it
will be observed that as higher company debts, the greater the economic profitability of
this, which at the same time it is translated in a higher financial profitability’.
ROE expresses the connection between the profit and the financial resources to get it.
It also measures the shareholders’ profitability on the equity that they have invested.
A. Cross-Section 2013
A Cross-Section analysis is carried out in the year 2013 which makes a comparison of
each bottling company with the sector itself in which they are during the same year.
Thanks to this analysis, the analyst can assess which is the entity who better manages
its funding policy.
The chart (5) contains the average financial profitability of each company.
Chart (5) Cross-Section 2013 ROE, ROE Analysis- Own elaboration
-10,85%
11,06%
-44,85%
10,01% 24,01% 21,90%
38,06%
-60,00%
-40,00%
-20,00%
0,00%
20,00%
40,00%
60,00%
2013
Cross- Section 2013 ROE Asturbega,S.A.
Begano,S.A.
Casbega,S.L
Cobega,S.A.
Colebega,S.A.
Norbega,S.A.
Rendelsur,S.A.

COCA-COLA’S CASE 2015
Noelia Fabregat García Pg. 15
In this analysis it can be observed that the pink column, which represents the sector’s
average, reaches 7.05%. In relation to this, there are only two companies that do not
reach the sector’s average of financial profitability; both are with negative figures.These
two bottling companies are Asturbega,S.A. and Casbega,S.L. -10.85% and -44.85%
respectively, being the latter company is the worse manages its policy of funding. The
best in this area is Rendelsur,S.A. with 38.06%.
B. Time Series
a. Each company in the period 2008-2013
That date table (4) will be shown by a column chart (6); where the evolution that has
been undergoing each society will be observed.
ROE 2013 2012 2011 2010 2009 2008
Asturbega,S.A. -10,85% 9,06% 69,26% 4,32% 4,46% 5,38%
Begano,S.A. 11,06% 8% 23,08% 9,92% 10,37% 8,09%
Casbega,S.L. -44,85%
Cobega,S.A. 10,01%
Colebega,S.A. 24,01% 23,15% 37,51% 2,38% 2,60% 3,90%
Norbega,S.A. 21,90% 40,09% 18,35% 11,13% 10,53% 9,06%
Rendelsur,S.A. 38,06% 6,04% 45,43% 3,16% 3,37% 2,96%
Data table (4) each company in the period 2008-2013, ROE Analysis- Own elaboration
Bar chart (6) ROE -Each company in the period 2008-2013, ROE Analysis, Own elaboration
Asturbega,S.A. It presents a negative evolution of the financial profitability, because in
2008 it has a relatively low figure 5.38%. It was subsequently having a positive trend; it
was increasing until 2011 where it reached 69.26%. This was brought about because
-60,00%
-40,00%
-20,00%
0,00%
20,00%
40,00%
60,00%
80,00%
2013 2012 2011 2010 2009 2008
%
years
ROE -Each company in the period 2008-2013 Asturbega,S.A.
Begano,S.A.
Casbega,S.L
Cobega,S.A.
Colebega,S.A.
Norbega,S.A.
Rendelsur,S.A.

COCA-COLA’S CASE 2015
Noelia Fabregat García Pg. 16
both parts had concordance to this positive evolution, that is, in 2011 there was a
terribly increased of the profits in this exercise. Moreover it was also accompanied by a
great reduction of the shareholders equity average. Then, it was getting decreased until
it got a figure of financial profitability in 2013, -10.85%. This year the business had
some high losses and despite the fact that shareholders equity average would be
reduced, this resulted in a negative financial ratio.
Begano,S.A. It is a company that has remained practically constant over the period
analysed, being always close to the average industry profitability. In 2011, it reached its
maximum being 23.08%, it produced by an increase in the profit and aided by a
reduction of the shareholders equity average. Despite this, it was one of the two years
where the company did not exceed the sector’s average which was 27% in 2011 and
12% in 2012.
Casbega,S.L. This one can be only analysed the last year and it presents the most
negative share of all the analysed companies, i.e. a financial profitability of -44.85%.
Cobega,S.A. With this company happens the same as in Casbega,S.L. and it is that
only the last period can be analysed but with a different result, 10.01% and moreover
this is a higher result than the sector’s average that in the same year, 7.05% in 2013.
Colebega,S.A. It presents an increasing tendency, giving a positive profitability to its
shareholders in all years. Reaching its maximum in 2011 with 37.51% and in the last
year, it shows a ratio of 24.01%. The clear slip-up that occurred in 2011 was the result
of a brutal increase in the profit of the company, more than 135 million Euros, adding to
this a brief reduction of the average equity. It should be noted that in the three first
periods, it has a lower profitability of the sector’s average, however in the last three
months it obtains a clearly superior profitability than this.
Norbega,S.A. It is the company which presented a greater financial profitability
average, 19%, which it will be detailed in the following chart (7). For this reason, there
is an up progress in this kind of profitability. In 2012 there was a change decreasing
this ratio. It has been observed in this company different data from the other
companies. Norbega,S.A. decides to increase the average shareholders’ equity of it, an
opposite aspect from the rest companies, as well as it increases at the same time the
profit of it. Due to this it obtains a growth in its financial profitability. This is a positive
aspect for shareholders, therefore it is the company who better has responded them,
evolving from 9.06% to 21.90%.
Rendelsur,S.A. It presents a growing evolution from the first period. There are three of
the periods where it has presented lower profitability than the average industry
profitability. It is a company characterized by having an average shareholders’ equity

COCA-COLA’S CASE 2015
Noelia Fabregat García Pg. 17
quite higher to other companies in its beginnings and reducing it to about half. It has
been increasing the profit in certain periods by making therefore the profitability to rise
considerably. Summarizing, this company is offering good profitability to its
shareholders.
As it has been commenting in this section, it is attached the necessary information
about companies in this period, date table (5)
Data table(5) and Chart (7), Average ROE of Each Company , ROE Analysis, Own elaboration.
It is observed in the Chart above (7). The company that has a higher financial
profitability is Norbega,S.A. with 19% followed by companies whose profitability
difference is minimum, such as; Rendelsur,S.A., Colebega,S.A., Asturbega,S.A. and
Begano,S.A.. Otherwise, the company who presents lower profitability although being
positive is Cobega,S.A.. Finally Casbega,S.L. has a negative profitability of -7%.
b. Sector’s average over 2008-2013
Being detailed the sector’s average in the following table (6), it is also attached the
pertinent chart (8).
2013 2012 2011 2010 2009 2008
Industry Average 7,05% 12,33% 27,66% 4,42% 4,48% 4,20%
Data table (6) Sector’s average over 2008-2013, ROE Analysis- Own elaboration
-10%
-5%
0%
5%
10%
15%
20%
Average ROE
14% 12%
-7%
2%
16% 19%
17%
%
year2013
Average ROE of Each Company
Asturbega,S.A.
Begano,S.A.
Casbega,S.L
Cobega,S.A.
Colebega,S.A.
Norbega,S.A.
Rendelsur,S.A.
BUSINESS Average
ROE
Asturbega,S.A. 14%
Begano,S.A. 12%
Casbega,S.L. -7%
Cobega,S.A. 2%
Colebega,S.A. 16%
Norbega,S.A. 19%
Rendelsur,S.A. 17%

COCA-COLA’S CASE 2015
Noelia Fabregat García Pg. 18
Chart (8) ROE with industry average – ROE Analysis, Own elaboration.
Looking the Chart (8), it is noticed the evolution of the financial profitability of the sector
for the analysed period:
In 2008, with a sector’s average of 4.20%, the companies which do not exceed
such profitability are Rendelsur,S.A. and Colebega,S.A.
In 2009, the sector’s average was increased slightly to 4.48% but they are the
same previous companies which do not reach such profitability, adding to this
Asturbega,S.A..
In 2010, the sector’s average is 4.42% still continue being the same companies
who do not reach the average.
There is a sudden change in 2011, where the sector’s average rises to 27.66%.
The companies who do not reach this level have changed, Norbega,S.A. and
BeganoS.A. are now. However the company who exceeds from afar the level is
Asturbega,S.A. reaching 56.35%.
It is in 2012 when the sector’s average decreases again to 12.33% and it is
pointed to this change a modification in companies, Rendelsur,S.A. again does
not reach the average profitability, and the same happens with Begano,S.A.
and Asturbega,S.A.
In 2013 the financial profitability sector’s average is 7.05% and the only
companies who have a lower profitability are those which have a negative ratio.
These are Asturbega,S.A. and Casbega,S.L., reaching -25.07%.
After all this analysis of the different perspectives, the components which were
introduced in the financial profitability concept and it is going to be made the apropiate
analysis will be performed are extended.
In this case, the different concepts must be splitted up: financial leverage, economic
profitability and cost of debt, to subsequently relate all of this with financial profitability.
That is, financial profitability will be equal economic profitability, plus/minus the financial
7,05%
12,33%
27,66%
4,42% 4,48% 4,20%
0,00%
5,00%
10,00%
15,00%
20,00%
25,00%
30,00%
2013 2012 2011 2010 2009 2008
%
years
ROE with industry average
industry average
COCA-COLA’S CASE 2015
Noelia Fabregat García Pg. 19
leverage (which is derived from the need of using the outside funding). The sign of
financial leverage will be derived from the relation between assets profitability (ROE)
and cost of debt (CD).
In this way, depending on whether interest in which it pays to outside funding is
therefore lower or higher to the net profit obtained for each Euro that is invested in
each company assets. The beneficiary or affected will be the shareholders of the
company.
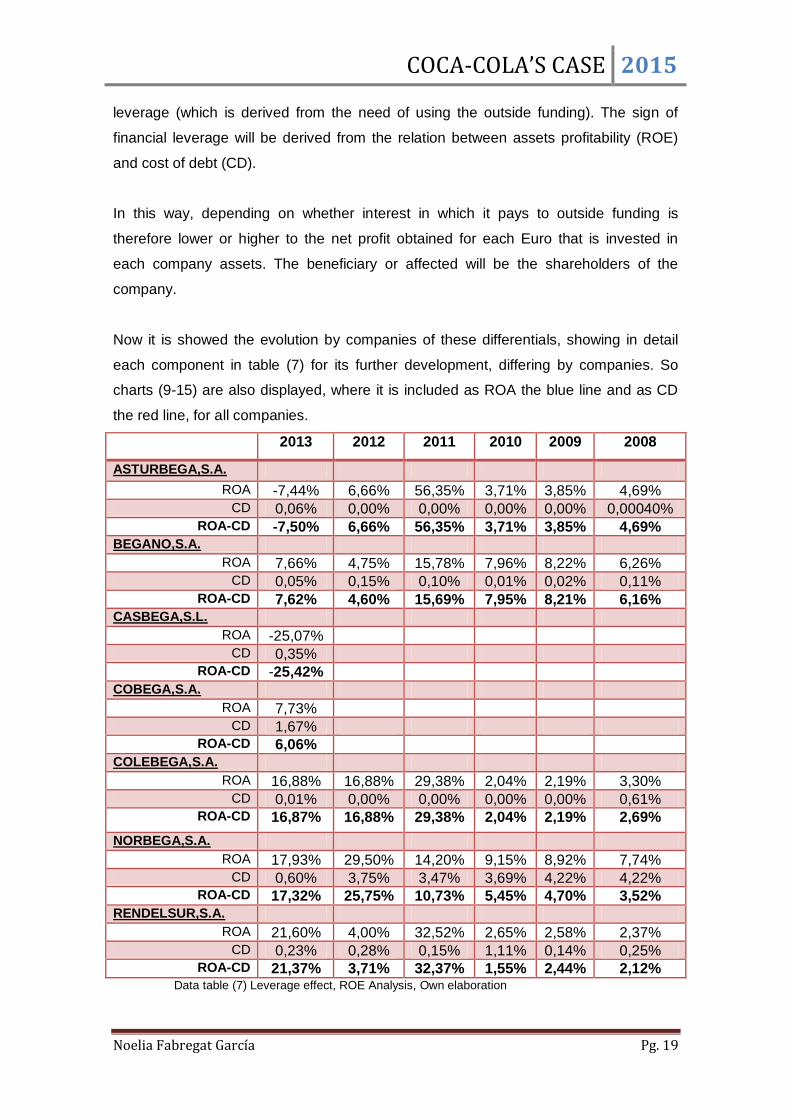
Now it is showed the evolution by companies of these differentials, showing in detail
each component in table (7) for its further development, differing by companies. So
charts (9-15) are also displayed, where it is included as ROA the blue line and as CD
the red line, for all companies.
2013 2012 2011 2010 2009 2008
ASTURBEGA,S.A.
ROA -7,44% 6,66% 56,35% 3,71% 3,85% 4,69% CD 0,06% 0,00% 0,00% 0,00% 0,00% 0,00040%
ROA-CD -7,50% 6,66% 56,35% 3,71% 3,85% 4,69% BEGANO,S.A.
ROA 7,66% 4,75% 15,78% 7,96% 8,22% 6,26% CD 0,05% 0,15% 0,10% 0,01% 0,02% 0,11%
ROA-CD 7,62% 4,60% 15,69% 7,95% 8,21% 6,16% CASBEGA,S.L.
ROA -25,07% CD 0,35%
ROA-CD -25,42% COBEGA,S.A.
ROA 7,73% CD 1,67%
ROA-CD 6,06% COLEBEGA,S.A.
ROA 16,88% 16,88% 29,38% 2,04% 2,19% 3,30% CD 0,01% 0,00% 0,00% 0,00% 0,00% 0,61%
ROA-CD 16,87% 16,88% 29,38% 2,04% 2,19% 2,69%
NORBEGA,S.A. ROA 17,93% 29,50% 14,20% 9,15% 8,92% 7,74%
CD 0,60% 3,75% 3,47% 3,69% 4,22% 4,22% ROA-CD 17,32% 25,75% 10,73% 5,45% 4,70% 3,52%
RENDELSUR,S.A. ROA 21,60% 4,00% 32,52% 2,65% 2,58% 2,37%
CD 0,23% 0,28% 0,15% 1,11% 0,14% 0,25% ROA-CD 21,37% 3,71% 32,37% 1,55% 2,44% 2,12%
Data table (7) Leverage effect, ROE Analysis, Own elaboration

COCA-COLA’S CASE 2015
Noelia Fabregat García Pg. 20
Chart (9) leverage effect, Asturbega,S.A. ROE Analysis, Own elaboration.
As it can been observed, AsturbegaS.A. has in the last year, an inflection point in this
analysis. That is, until the year 2013, ROA> CD. This means that the company will
have a positive financial leverage in the period between 2008-2012, where the financial
profitability was higher than the economic profitability; it happened if we look at
previous sections. As the debt of the company grows, this takes advantage of
increasing the profitability of the shareholders. In 2013, it is produced a change on the
mentioned trend, that is ROA<CD. Having a negative financial leverage (shown as a
differential in table 7) and thus, the financial profitability will be lower than the economic
profitability. This means that the financial profitability will decrease as the debt of the
company increases. When this happens, it means that the excess of the debt
compensation arises in that the owners of the company or the shareholders will receive
a lower compensation for their contribution that which is obtained by the company for
the management of their activities. In short, when the debt of the company grows, the
profitability of the shareholders will be reduced.
Now, the charts with a positive financial leverage are going to be attached. With
ROA>CD will happen that the financial profitability will be greater than the economic
profitability. Therefore, this is a positive aspect for the shareholders, since they will
have payoff once carried out by the corresponding investments. The financial leverage
effect allows that with a suitable combination of own resources and outside funding to
the company, this allows activities whose profitability will be lower than the minimum
financial profitability required by the shareholders. This is what happens in the following
companies:
-20,00% -10,00%
0,00% 10,00% 20,00% 30,00% 40,00% 50,00% 60,00%
2013 2012 2011 2010 2009 2008
%
years
Financial Leverage, Asturbega,S.A.
ROA
CD

COCA-COLA’S CASE 2015
Noelia Fabregat García Pg. 21
Chart (10) Leverage effect, Begano,S.A. ROE Analysis, Own elaboration.
Chart (11) Leverage effect, Casbega,S.L. ROE Analysis, Own elaboration.
Chart (12) Leverage effect, Cobega,S.A. ROE Analysis, Own elaboration.
The following three companies have presented a ROA>CD, but they are analysed
separately because they have suffered variations throughout the period analysed.
Chart (13) Leverage effect, Colebega,S.A. ROE Analysis, Own elaboration.
0,00%
5,00%
10,00%
15,00%
20,00%
2013 2012 2011 2010 2009 2008
%
years
CD>ROA,Begano,S.A.
ROA
CD
-30,00%
-25,00%
-20,00%
-15,00%
-10,00%
-5,00%
0,00%
5,00%
2013
ROA<CD,Casbega,S.L
ROA
CD
0,00%
2,00%
4,00%
6,00%
8,00%
10,00%
2013
%
year
ROA>CD,Cobega,S.A.
ROA
CD
0,00%
5,00%
10,00%
15,00%
20,00%
25,00%
30,00%
35,00%
2013 2012 2011 2010 2009 2008
%
years
ROA>CD, Colebega,S.A.
ROA
CD

COCA-COLA’S CASE 2015
Noelia Fabregat García Pg. 22
Chart (14) Leverage effect, Norbega,S.A. ROE Analysis, Own elaboration.
Chart (15) Leverage effect, Rendelsur,S.A. ROE Analysis, Own elaboration.
As it is observed in the line charts (13-15) of the three previous companies; these have
always presented an economic profitability higher than the cost of the debt but there
have been years in which they have been too near. For example, Rendelsur,S.A. in the
period from 2008 to 2013, the degree of financial leverage has increased. The reason
is that the liability has been reduced, but at the same time has been also reduced the
equity of the company which means that the company has gone into debt. Therefore,
the margin of financial leverage that is the difference between ROA and CD appears
blunted in two years by the high ROA presented. It is the result of a large increase of
the profits of the company in that year, moreover at the same time by a reduction in the
average assets. This is good for the shareholders; due to the company is still having a
good effect on them by having a positive profitability.
4.1.2 Liquidity Analysis:
According Archel,D.P. (2009) ‘A cycle is known as the succession of events that occur
repeatedly every time. A short cycle is that which is formed by the time period in which
commodities are bought, as well as the storage of these, the introduction of the
process of production, the manufacturing of the products and the storage of these; then
its sale and its collection. This short cycle is known as average period of economic
maturity.
0,00%
5,00%
10,00%
15,00%
20,00%
25,00%
30,00%
35,00%
2013 2012 2011 2010 2009 2008
ROA>CD,Norbega,S.A.
ROA
CD
0,00%
5,00%
10,00%
15,00%
20,00%
25,00%
30,00%
35,00%
2013 2012 2011 2010 2009 2008
%
years
ROA>CD,Rendelsur,S.A.
ROA
CD
COCA-COLA’S CASE 2015
Noelia Fabregat García Pg. 23
The average period of economic maturity is the elapsed time since it is invested a
monetary unit in the production process of each company, until it is recovered through
customer’s collection. That is, the number of days that each company takes in turning
its operating cycle. Since the production process is divided into several phases, the
maturity period also makes it in sub-periods. Now are going to be explained these sub-
periods:
Average period of commodities maturity - It is the period of time which elapses
from the company acquired them to suppliers to the time that it leaves the store
to start the production process.
Average period of costumers’ maturity – It is the deadline granted to costumers
for the liquidation of their own credits.
Therefore, the average period of economic maturity is the addition of both periods.
The average period of financial maturity will be valued by the difference between the
average period of economic maturity and the period of payment to suppliers of each
company.
Average period of suppliers’ maturity – It is the time that elapses from the
purchase to the payment to suppliers of goods.
Finally, it is defined as average period of financial maturity, the time elapsed since that
suppliers are paid a monetary unit, until this is recovered through the collection to
costumers; so the greater the deferment granted by suppliers, greater will be such
difference’.
4.1.2.1 Average period of maturity
A. Cross-Section 2013
The three periods of maturity are analysed in order to know the average period of
economic maturity, and together with the average period of suppliers maturity, to thus
obtain the average period of financial maturity.
With the date table (8) and the chart (16), it is carried out Cross-Section analysis of
2013; in which it is observed the period of time elapsed since the commodities are
purchased until they leave the production process in each company.

COCA-COLA’S CASE 2015
Noelia Fabregat García Pg. 24
Average period of commodities,
2013
2013
Asturbega,S.A. 17
Begano,S.A. 16
Casbega,S.L 10
Cobega,S.A. 11
Colebega,S.A. 11
Norbega,S.A. 9
Rendelsur,S.A. 21
Industryaverage 14
Data table (8) Average period of commodities by companies in 2013, Liquidity Analysis- Own elaboration
Chart (16) Cross-Section, Average period of commodities 2013, Liquidity Analysis- Own
elaboration.
The obtained result will be more favourable to the company as lower was the
mentioned storage period, because so they will be not many time stored. Therefore,
the company that has a shorter period is NorbegaS.A., being 9 days from the goods
are purchased to the suppliers to end the production process. The companies which
are in a period of 10 to 11 days are Casbega,S.L., Cobega,S.A. and Colebega,S.A..
There are three companies that attract attention because they have a higher period,
these are Asturbega,S.A. and Begano,S.A., having a maximum of 21 days.
Rendelsur,S.A. is the company whose commodities and goods are stored for the
greater period of time before the end of the production process.
It is also reflected the average period of goods storage in 2013, 14 days, and the
companies who are below this share are Norbega,S.A., Casbega,S.L., Cobega,S.A.
and Colebega,S.A., but it should also be mentioned that there is no company who
stand out in an exaggerated way.
0
10
20
30
2013
17 16
10 11
11 9
21
14
da
ys
year
Average period of commodity 2013 Asturbega,S.A.
Begano,S.A.
Casbega,S.L
Cobega,S.A.
Colebega,S.A.
Norbega,S.A.
Rendelsur,S.A.
industry average

COCA-COLA’S CASE 2015
Noelia Fabregat García Pg. 25
With the date table (9) and the chart (17), it is done a Cross-Section analysis of the
year 2013 which shows the period in which customers pay their credits in each
company.
Average period of costumers, 2013
2013
Asturbega,S.A. 73
Begano,S.A. 53
Casbega,S.L 28
Cobega,S.A. 26
Colebega,S.A. 50
Norbega,S.A. 20
Rendelsur,S.A. 50
Industry average 43
Data table (9) Average period of customers by companies in 2013, Liquidity Analysis- Own elaboration.
Chart (17) Cross-Section, Average period of customers 2013, Liquidity Analysis- Own
elaboration.
In the case of the term of payment to costumers, it will be more favourably for the
company as lower is the same, since the payment of sales is paid sooner, and
customers do not have debts to the company, who will have to go to fund these needs
if customers do not pay immediately.
Therefore, as it is shown in the chart (17) the company which has a shorter recovery
period from its customers is Norbega,S.A., i.e. 20 days elapse from the purchase of the
product to these are paid.
There are two very close businesses; these are Casbega,S.L. and Cobega,S.A. which
have 28 and 26 days respectively. There are three which are around 50 days which are
Begano,S.A. with 53 days, and Colebega,S.A. and Rendelsur,S.A. with 50 days.
0
20
40
60
80
2013
73
53
28 26
50
20
50 43
day
s
year 2013
Average period of costumers ,2013 Asturbega,S.A.
Begano,S.A.
Casbega,S.L
Cobega,S.A.
Colebega,S.A.
Norbega,S.A.
Rendelsur,S.A.
industry average

COCA-COLA’S CASE 2015
Noelia Fabregat García Pg. 26
There is one company which appears standing out from the rest of bottling companies,
that is Asturbega,S.A. which has the maximum period of payment of 73 days,
therefore, it is the company whose customers takes more time to pay what they have
bought.
It is added in this data table the average period of customers’ collection in 2013. It is a
period of 43 days and it is observed that there are three companies which have a lower
time of payment the customers than the rest of the companies, from 20 to 28 days;
there are three companies which are very close to the average with 50-53 days.
Finally, Asturbega,S.A. which stands out from the rest, being above the average of the
sector.
It has been added the table (10) which represents the average period of economic
maturity in 2013, as well as the correspondent Chart (18).
2013
AP COMM. AP CUSTOM. AP ECONOM. M
Asturbega,S.A. 17 73 90
Begano,S.A. 16 53 70
Casbega,S.L 10 28 38
Cobega,S.A. 11 26 37
Colebega,S.A. 11 50 61
Norbega,S.A. 9 20 29
Rendelsur,S.A. 21 50 72
Industryaverage 14 43 57
Data table (10) Average period of economic maturity by companies in 2013, Liquidity Analysis- Own elaboration
Chart (18) Cross-Section, average period of economic maturity, 2013, Liquidity Analysis- Own
elaboration
0
20
40
60
80
100
2013
90
70
38 37
61
29
72
57
day
s
year 2013
Average period of economic maturity,2013 Asturbega,S.A.
Begano,S.A.
Casbega,S.L
Cobega,S.A.
Colebega,S.A.
Norbega,S.A.
Rendelsur,S.A.

COCA-COLA’S CASE 2015
Noelia Fabregat García Pg. 27
The lower the average period of economic maturity was, it would be better for the
company, because the company gets liquidity.
So the ones which shorter time have, being even included the ones below the average
are Casbega,S.L., Cobega,S.A. and Norbega,S.A.. The other four companies are
higher than the average sector, so they take more days to recover the monetary unit
which these companies have previously been invested.
Finally, with table (11) and Chart (19) it is done a Cross-Section analysis of the year
2013; where it is shown the term in which companies pay its debts to suppliers.
Average period of suppliers, 2013
2013
Asturbega,S.A. 55
Begano,S.A. 26
Casbega,S.L 13
Cobega,S.A. 11
Colebega,S.A. 46
Norbega,S.A. 31
Rendelsur,S.A. 25
Industryaverage 29
Data table (11) Average period of suppliers by companies in 2013, Liquidity Analysis- Own elaboration.
Chart (19) Cross-Section, Average period of suppliers 2013, Liquidity Analysis- Own elaboration.
It will be more favourable to the company as greater is average period of suppliers; this
concept means that the greater is this, the greater is the funding obtained from
suppliers, and as a consequence, the greater will be the amount to pay which will
appear in the liability item, the suppliers.
0
10
20
30
40
50
60
2013
55
26
13 11
46
31 25
29
day
s
year 2013
Average period of suppliers,2013 Asturbega,S.A.
Begano,S.A.
Casbega,S.L
Cobega,S.A.
Colebega,S.A.
Norbega,S.A.
Rendelsur,S.A.

COCA-COLA’S CASE 2015
Noelia Fabregat García Pg. 28
Therefore, as it is shown in chart (18), the bottling company that has a shorter period of
payment to suppliers is Cobega,S.A., with 11 days, touching the minimum term of
payment to also Casbega,S.L., 13 days. There are three companies very close to the
average of the sector which are Begano,S.A., Rendelsur,S.A. and Norbega,S.A. with a
26, 25 and 31 respectively. There are two companies which stand of rest, a positive
aspect in this concept, which are Asturbega,S.A. with 55 days and Colebega,S.A. with
a period of 46 days.
It has been added in this table the data of the average period of suppliers payment in
the year 2013. This date indicates that after an average of 29 days, that is, from the
company acquires the goods to these are paid, there is a difference of 29 days. There
are only two companies which have a high period of the payment to suppliers.
What it would be ideal for the companies is that the average period of payment
suppliers exceeds the average period of costumers collection. So if we compare both
previous tables, it is seen that the only company that achieves this advisable theory is
Norbega,S.A., with a term of payment to suppliers of 31 days and with average period
of collecting to customers of 20 days.
Along with this, it is known the average period of financial maturity which is calculated
by the difference between the average period of economical maturity and the average
period of payment suppliers.
The table (12) has been added together with its corresponding Chart (20);
Average period of
economic maturity
Average period of
payment suppliers
Average period of
financial maturity
Asturbega,S.A. 90 55 35
Begano,S.A. 70 26 44
Casbega,S.L 38 13 25
Cobega,S.A. 37 11 26
Colebega,S.A. 61 46 15
Norbega,S.A. 29 31 -2
Rendelsur,S.A. 72 25 46
Industry average 57 29 27
Data table (12) Average period of financial maturity in 2013, Liquidity Analysis- Own elaboration.
COCA-COLA’S CASE 2015
Noelia Fabregat García Pg. 29
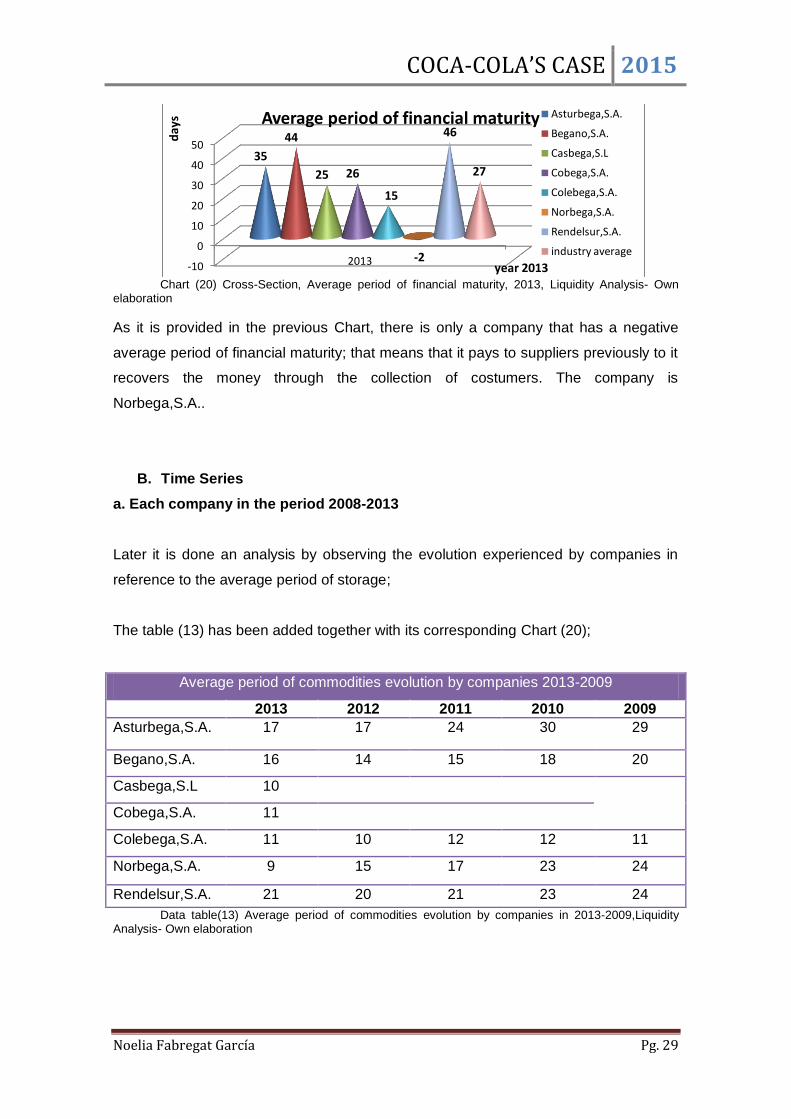
Chart (20) Cross-Section, Average period of financial maturity, 2013, Liquidity Analysis- Own
elaboration
As it is provided in the previous Chart, there is only a company that has a negative
average period of financial maturity; that means that it pays to suppliers previously to it
recovers the money through the collection of costumers. The company is
Norbega,S.A..
B. Time Series
a. Each company in the period 2008-2013
Later it is done an analysis by observing the evolution experienced by companies in
reference to the average period of storage;
The table (13) has been added together with its corresponding Chart (20);
Average period of commodities evolution by companies 2013-2009
2013 2012 2011 2010 2009
Asturbega,S.A. 17 17 24 30 29
Begano,S.A. 16 14 15 18 20
Casbega,S.L 10
Cobega,S.A. 11
Colebega,S.A. 11 10 12 12 11
Norbega,S.A. 9 15 17 23 24
Rendelsur,S.A. 21 20 21 23 24
Data table(13) Average period of commodities evolution by companies in 2013-2009,Liquidity Analysis- Own elaboration
-10
0
10
20
30
40
50
2013
35
44
25 26
15
-2
46
27 d
ays
year 2013
Average period of financial maturity Asturbega,S.A.
Begano,S.A.
Casbega,S.L
Cobega,S.A.
Colebega,S.A.
Norbega,S.A.
Rendelsur,S.A.
industry average

COCA-COLA’S CASE 2015
Noelia Fabregat García Pg. 30
Chart (21) Average period of commodities , each company in 2008-2013, Liquidity Analysis- Own
elaboration.
Asturbega,S.A. It is the company which had a period of storage higher than the rest.
For this reason, the dark blue line which represents this company is during 2009-2011
which stands above the rest, although maintaining a downward trend but reaching a
maximum of 30 days. In the last two periods, it holds steady in the year 2013. Here,
there is a company that exceeds it in its period of storage and is Rendelsur,S.A. which
is who reaches the maximum in this period, 21 days.
Begano,S.A. It was minimally above the average period of storage, taking a downward
trend until 2011 and growing from this last period. But although these trends, it has
remained virtually constant, since large variations have not occurred in their terms over
the years.
Both Casbega,S.L. as Cobega,S.A. are in their first term, 2013, in a period of
commodities storage quite lower, since these are between 10 and 11 days
respectively, and at the same time both are below the average sector in that period.
Colebega,S.A. It is a company whose period of storage held below the average period
of storage. It is the company which has the shortest period. This is a very positive
aspect, since to be less time in the store, it has fewer possibilities for the commodities
or raw materials to be obsolete or being damaged a long time. It is a company that
gives importance to the possibility that goods are halted.
Norbega, S.A. It is a company which has improved a lot in this aspect , since it was at
quite high levels at the very beginning of this paper, 24 days in 2009 and with this
decreasing trend, it has managed to improve up to 9 days in 2013. It is also the
company that has the shortest time in the storage of materials.
Rendelsur, S.A. It presents quite constant figures throughout the period, about 24-21
days. It has a very similar trend to Begano,S.A. but with higher figures for its storage
period.
30
9
0
5
10
15
20
25
30
35
2013 2012 2011 2010 2009
day
s
years
Average period of commodities, each company
Asturbega,S.A.
Begano,S.A.
Casbega,S.L
Cobega,S.A.
Colebega,S.A.
Norbega,S.A.
Rendelsur,S.A.

COCA-COLA’S CASE 2015
Noelia Fabregat García Pg. 31
Moreover it has been summarized the average period of storage of each company, in
order to know what company has the minor and major period of commodities:
Average period of commodities by
companies
2013
Asturbega,S.A. 23
Begano,S.A. 17
Casbega,S.L 2
Cobega,S.A. 2
Colebega,S.A. 11
Norbega,S.A. 18
Rendelsur,S.A. 22
Data table(14) Average period of commodities by companies in 2013,Liquidity Analysis- Own elaboration
Chart (22) Average period of commodities of each company, Liquidity Analysis- Own elaboration
As it is explained in Chart (22), companies which have a shorter average of storage are
Casbega,S.L. and Cobega,S.A., this is because it is only got one year depending on
the accounts of the companies. Despite these, the rest of the companies have the
average period of storage quite close to 11-23 days.
0
5
10
15
20
25
average
23
17
2 2
11
18 22
day
s
average
Average period of commodities of each company
Asturbega,S.A.
Begano,S.A.
Casbega,S.L
Cobega,S.A.
Colebega,S.A.
Norbega,S.A.
Rendelsur,S.A.

COCA-COLA’S CASE 2015
Noelia Fabregat García Pg. 32
Subsequently it is included a description based on the term of payment to customers;
Average period of customers evolution by companies 2013-2008
2013 2012 2011 2010 2009 2008
Asturbega,S.A. 73 58 59 69 66 62
Begano,S.A. 53 40 38 38 39 40
Casbega,S.L. 28
Cobega,S.A. 26
Colebega,S.A. 50 41 39 36 37 39
Norbega,S.A. 20 40 40 41 39 39
Rendelsur,S.A. 50 39 35 34 33 37 Data table(15) Average period of customers evolution by companies in 2013-2008,Liquidity
Analysis- Own elaboration.
Chart (23) Average period of customers, each company in 2008-2013, Liquidity Analysis- Own
elaboration
Asturbega, S.A. It is the company with an average period of collecting customers
higher than the rest of the companies. In the last two periods, the company
experiences a rising of the same trend; this means that it still takes more than before in
charge.
Begano, S.A., Colebega, S.A. and Rendelsur, S.A. they show a consistent trend but
with a slight increasing trends in that last period.
Both Casbega, S.L. and Cobega, S.A. are located in the first term, 2013, in a period of
collection to their customers to 28 and 26 days respectively; which as it has already
mentioned it is lower to the average period of costumers of 2013 which is of 43 days.
Norbega, S.A. It is a company which has improved in the last stage, since it was in
rather high levels, around 45 days and with a decreasing trend. It has been able to
improve up to a period of 20 days in 2013, having the shortest term in the costumers'
collecting.
0
10
20
30
40
50
60
70
80
2013 2012 2011 2010 2009 2008
day
s
years
Average period of customers, each company
Asturbega,S.A.
Begano,S.A.
Casbega,S.L
Cobega,S.A.
Colebega,S.A.
Norbega,S.A.
Rendelsur,S.A.

COCA-COLA’S CASE 2015
Noelia Fabregat García Pg. 33
Average period of customers
Asturbega,S.A. 65
Begano,S.A. 41
Casbega,S.L 5
Cobega,S.A. 4
Colebega,S.A. 40
Norbega,S.A. 37
Rendelsur,S.A. 38
Data table(16) Average period of costumers of each company. Liquidity Analysis- Own elaboration.
Chart (24) Average period of customers of each company, Liquidity Analysis- Own elaboration
As it is shown in chart (24) the companies which have a shortest term average period
of customers collecting are Casbega,S.L. and Cobega,S.A. because only one data
year is got. Despite these, the averages periods of costumers collecting are quite
close, between 31 and 41 days. AsturbegaS.A. stands out from the rest with 65 days,
which means that during the observed period is the bottling company which more takes
to collect their customers.
The evolution of the average period of economic maturity 2009-2013 is analysed;
Average period of economic maturity
2013 2012 2011 2010 2009
Asturbega,S.A. 90 76 83 99 96
Begano,S.A. 70 54 52 57 58
Casbega,S.L 38 0 0 0 0
Cobega,S.A. 37 0 0 0 0
Colebega,S.A. 61 51 51 48 48
Norbega,S.A. 29 56 57 64 63
Rendelsur,S.A. 72 59 56 57 57
0
20
40
60
80
average
65
41
5 4
40 37 38
day
s
Average 2013-2008
Average period of customers Asturbega,S.A.
Begano,S.A.
Casbega,S.L
Cobega,S.A.
Colebega,S.A.
Norbega,S.A.
Rendelsur,S.A.

COCA-COLA’S CASE 2015
Noelia Fabregat García Pg. 34
Data table(17) Average period of economical Maturity. Liquidity Analysis- Own elaboration
Chart (25) Average period of economical maturity of each company 2013-2009, Liquidity Analysis- Own elaboration
It can be observed in the line chart (25) an evolution of average period of economical
maturity by companies. This period will always present positive results:
Asturbega S.A. it is the company that presents a higher casual term since a monetary
unit is invested in the productive process until it is recovered in through the collection of
costumers. This is an aspect which will be summarized as being the company whose
operating cycle is wider than the other companies. A slight decreasing trend is
observed in the middle of the period but which resumes its upward trend in 2012, in a
period of 90 days approximately.
Begano,S.A., Colebega,S.A. and Rendelsur,S.A. They present a similar inclination, and
that is because this period has kept constant, even though in the last stage they have
suffered a slight rise in their average period economical maturity.
Both Casbega,S.L. and Cobega,S.A. They only have the data of 2013 because there is
no previous information. They are in an economic maturity period of 38 and 37 days
respectively and as it has been already mentioned, it is lower than the average in 2013,
which is 57 days.
Norbega, S.A. It has improved in term of its economic maturity period, since it has
decreased in 2013 and if this decreases, it is a consequence that the invested is
recovered from customers more quickly. At the same time, this decrease in 2013 of
Norbega,S.A. reaches the minimum of this concept.
To proceed with the calculus of the average period of financial maturity, the term of
payment suppliers is calculated. Once this has been obtained, by difference with
average period of economic maturity is calculated it.
0
20
40
60
80
100
120
2013 2012 2011 2010 2009 day
s
years
Average period of economical maturity,of each company Asturbega,S.A.
Begano,S.A.
Casbega,S.L
Cobega,S.A.
Colebega,S.A.
Norbega,S.A.
Rendelsur,S.A.

COCA-COLA’S CASE 2015
Noelia Fabregat García Pg. 35
So it is added a table of reference (18); along with a chart (26) that will help to clarify
this information. The supplier payment period makes that the operations of analysed
companies were financed; so as greater they are, the best for companies since it is
considered a credit without cost.
Average period of payment suppliers evolution by companies 2013-2008
2013 2012 2011 2010 2009 2008
Asturbega,S.A. 55 62 46 39 50 45
Begano,S.A. 26 24 25 25 24 46
Casbega,S.L 13
Cobega,S.A. 11
Colebega,S.A. 46 51 63 74 79 84
Norbega,S.A. 31 71 76 92 91 93
Rendelsur,S.A. 25 25 23 28 29 45
Data table (18) Average period of payment suppliers evolution by companies in 2013-2008, Liquidity Analysis- Own elaboration
Chart (26) Average period of payment suppliers of each company in 2008-2013, Liquidity
Analysis- Own elaboration
Now it is analysed the period of time that takes each company to pay their suppliers;
Asturbega, S.A., as it appears in the chart, it has several trends over the analysed
period but keeping between 60 and 45 days of payment to them.
Begano, S.A. and Rendelsur S.A. They maintain the same trend, being in 2008 around
50 days, decreasing in 2009 to about 30 days and then keeping constant.
0
10
20
30
40
50
60
70
80
90
100
2013 2012 2011 2010 2009 2008
da
ys
years
Average period of paymentsuppliers by companies
Asturbega,S.A.
Begano,S.A.
Casbega,S.L
Cobega,S.A.
Colebega,S.A.
Norbega,S.A.
Rendelsur,S.A.
COCA-COLA’S CASE 2015
Noelia Fabregat García Pg. 36
Casbega, S.L and Cobega, S.A. They are only taking into account the year 2013. They
are around the 10 days of payment their suppliers: the shortest recorded time
regarding the analysed bottling companies.
Colebega,S.A. and Norbega,S.A. They present a decreasing trend in all their evolution.
Norbega,S.A. has a steeper fall in the last year since it reduces 50 days its term of
payment to their suppliers. It is the company which experiments a greater variation.
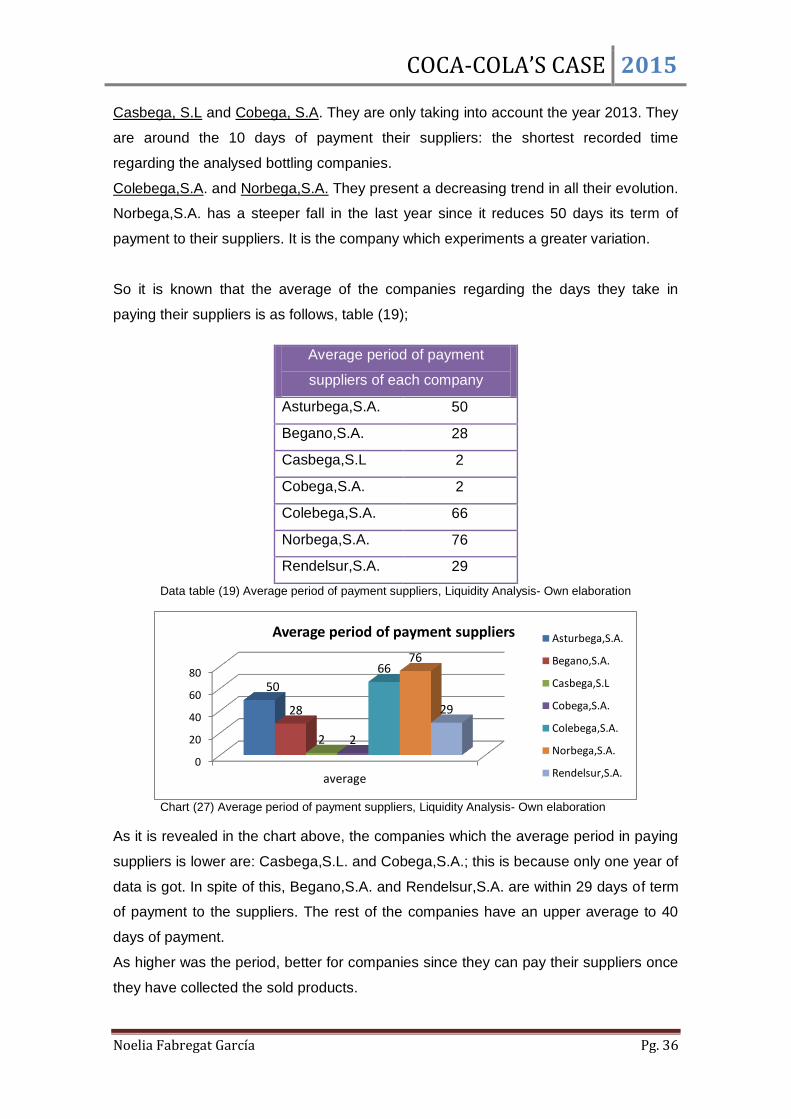
So it is known that the average of the companies regarding the days they take in
paying their suppliers is as follows, table (19);
Average period of payment
suppliers of each company
Asturbega,S.A. 50
Begano,S.A. 28
Casbega,S.L 2
Cobega,S.A. 2
Colebega,S.A. 66
Norbega,S.A. 76
Rendelsur,S.A. 29
Data table (19) Average period of payment suppliers, Liquidity Analysis- Own elaboration
Chart (27) Average period of payment suppliers, Liquidity Analysis- Own elaboration
As it is revealed in the chart above, the companies which the average period in paying
suppliers is lower are: Casbega,S.L. and Cobega,S.A.; this is because only one year of
data is got. In spite of this, Begano,S.A. and Rendelsur,S.A. are within 29 days of term
of payment to the suppliers. The rest of the companies have an upper average to 40
days of payment.
As higher was the period, better for companies since they can pay their suppliers once
they have collected the sold products.
0
20
40
60
80
average
50
28
2 2
66 76
29
Average period of payment suppliers Asturbega,S.A.
Begano,S.A.
Casbega,S.L
Cobega,S.A.
Colebega,S.A.
Norbega,S.A.
Rendelsur,S.A.
COCA-COLA’S CASE 2015
Noelia Fabregat García Pg. 37
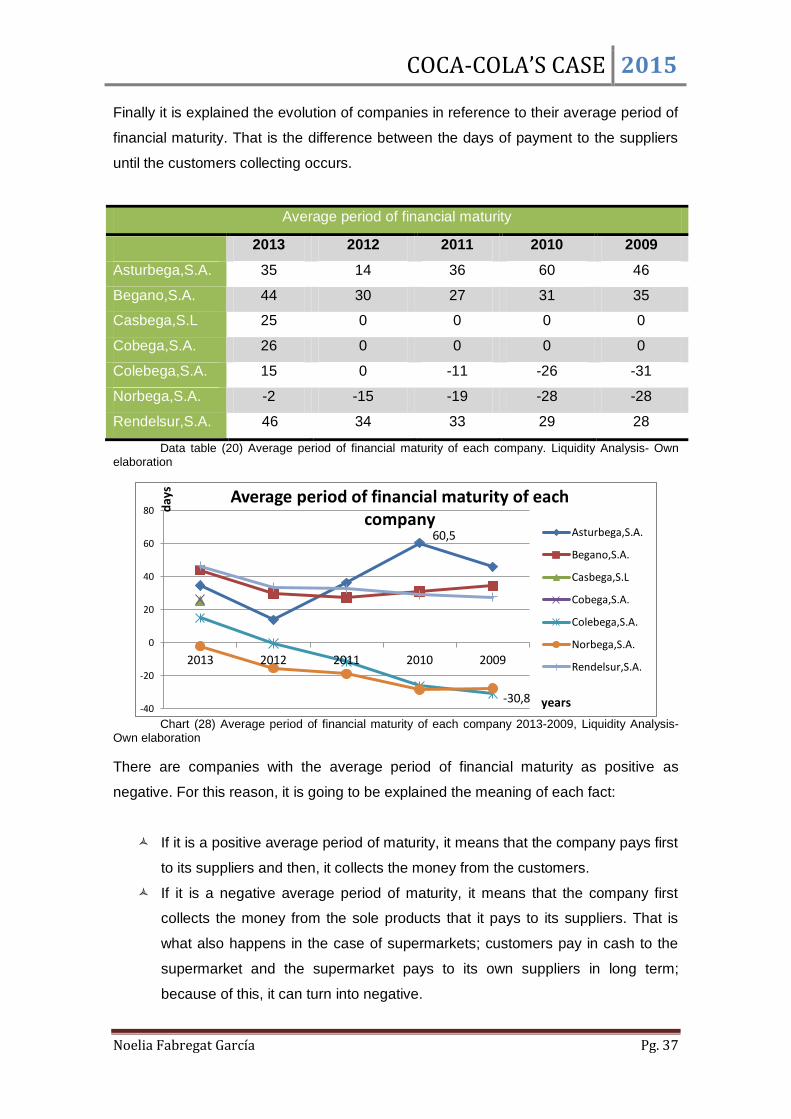
Finally it is explained the evolution of companies in reference to their average period of
financial maturity. That is the difference between the days of payment to the suppliers
until the customers collecting occurs.
Average period of financial maturity
2013 2012 2011 2010 2009
Asturbega,S.A. 35 14 36 60 46
Begano,S.A. 44 30 27 31 35
Casbega,S.L 25 0 0 0 0
Cobega,S.A. 26 0 0 0 0
Colebega,S.A. 15 0 -11 -26 -31
Norbega,S.A. -2 -15 -19 -28 -28
Rendelsur,S.A. 46 34 33 29 28
Data table (20) Average period of financial maturity of each company. Liquidity Analysis- Own elaboration
Chart (28) Average period of financial maturity of each company 2013-2009, Liquidity Analysis-
Own elaboration
There are companies with the average period of financial maturity as positive as
negative. For this reason, it is going to be explained the meaning of each fact:
If it is a positive average period of maturity, it means that the company pays first
to its suppliers and then, it collects the money from the customers.
If it is a negative average period of maturity, it means that the company first
collects the money from the sole products that it pays to its suppliers. That is
what also happens in the case of supermarkets; customers pay in cash to the
supermarket and the supermarket pays to its own suppliers in long term;
because of this, it can turn into negative.
60,5
-30,8 -40
-20
0
20
40
60
80
2013 2012 2011 2010 2009
day
s
years
Average period of financial maturity of each company
Asturbega,S.A.
Begano,S.A.
Casbega,S.L
Cobega,S.A.
Colebega,S.A.
Norbega,S.A.
Rendelsur,S.A.

COCA-COLA’S CASE 2015
Noelia Fabregat García Pg. 38
So, the companies which have a negative average period of financial maturity are
Norbega,S.A. and Colebega,S.A., although this last one reaches a positive stage in the
last period. The rest of the bottling companies have a positive average period of
financial maturity, because companies pay first the debt with the suppliers before of
collecting from its customers.
b. Sector’s average over 2008-2013
It is detailed the average period of financial and economic maturity during the enclosed period
in the following data table (21) and chart (29) of each bottling company.
Average period of economical maturity 2013 2012 2011 2010 2009
Industry Average 57 42 43 46 46
Data table (21) Sector’s average over 2008-2013, Liquidity Analysis- Own elaboration
Chart (29) Industry Average, period of economic maturity, Liquidity Analysis- Own elaboration.
Most of the companies in all periods appear above the sector’s average in reference to
the average period of economic maturity. There are some exceptions: Norbega,S.A.,
Casbega,S.L. and Cobega,S.A. which are in 2013 below the average, 57 days. This is
the maximum of the average period of economic maturity.
Average period of economical maturity 2013 2012 2011 2010 2009
Industry Average 27 9 9 9 7
Data table (22) Sector’s average over 2008-2013, PMM FINANCIAL- Own elaboration
57
42 43 46 46
0
10
20
30
40
50
60
2013 2012 2011 2010 2009
da
ys
years
Industry Average, Average period of economic maturity
industry average

COCA-COLA’S CASE 2015
Noelia Fabregat García Pg. 39
Chart (30) Average period of financial maturity and industry average, Liquidity Analysis- Own elaboration.
There are two companies which have an average period of financial maturity lower
than the industry average in all their periods. These are Norbega,S.A. and
Colebega,S.A.. The rest of the companies have a higher term than the average, due to
these are companies that pay to its suppliers before charging from their customers.
4.1.2.2 Working Capital
According Archel, D.P (2009) ‘The working capital is the amount of permanent financial
resources existing in each company which are necessary to carry out the normal
activities of the company with normality. That is, the part of the current assets which
are financed with non-current liabilities. It is added an image of the concept;’
Image (1) Working Capital- Liquidity Analysis- www.corelytics.com
According Archel, D.P (2009) ‘This calculation can result in three different outcomes:
WC = 0, the current assets would be financed with short-term loans, and it
would have difficulty in the renewal of liability.
WC<0, alarming situation. That is, the non-current asset is financed with
current liabilities; this situation can lead to a payment suspension. There are
companies with a small capital working, since the average period of payment to
suppliers is higher from the length of the operating cycle.
27
9 9 9 7
0
10
20
30
2013 2012 2011 2010 2009
day
s
Years
Industry Average, Average period of financial maturity
industry …

COCA-COLA’S CASE 2015
Noelia Fabregat García Pg. 40
WC>0, ideal situation. The current asset is financed with non-current liabilities
and it gives an operating margin to the company; what is colloquially called a
financial cushion in order to the company can finance long-term investments.’
A. Cross-Section 2013
It is only analysed the 2013 period to try to look at in more detail, what has happened in
the last year and in this way, to observe what has happened with each company.
Chart (31) Cross Section, Working capital 2013, Liquidity Analysis- Own elaboration.
As it is shown in the chart above, there is a company whose column does not appear in
the chart (31) and it is Cobega,S.A. and that is because its working capital quite
smaller than the rest of the companies (and because of the chart proportions, it makes
it not to appear in it). All the Coca-Cola bottling in Spain have a positive working
capital. As it has been explained previously, that is the ideal situation for all companies.
B. Time Series
a. Each company in the period 2008-2013
Below there is a table (23) along with the chart (32) where it is shown the evolution
over the analysed period in function of the working capital for each company.
2013 2012 2011 2010 2009 2008
Asturbega,S.A. 4.949.757 25.237.323 18.797.136 37.852.529 49.460096 48.243.247
Begano,S.A. 34.626.558 45.214.952 9.299.716 45.526.693 34.541.060 38656219
Casbega,S.L. 34.120.676
CobegaS.A. 86.260
Colebega,S.A. 65.421.181 116.018.745 130.819.073 215.165.192 285.605.653 248.186.749
Norbega,S.A. 4.769.976 12.505.741 4.819.414 11.665.961 148.231 2.322.132
Rendelsur,S.A. 36.844.736 78.607.342 118.081.459 187.716.969 171.063.220 133.749.082
Data table (23) Working capital by companies in 2013, Liquidity Analysis- Own elaboration.
4.949.757
34.626.558 34.120.676
65.421.181
4.769.976
36.844.736
25.831.306
0
10.000.000
20.000.000
30.000.000
40.000.000
50.000.000
60.000.000
70.000.000
2013
€
2013
Cross Section, 2013 Asturbega,S.A.
Begano,S.A.
Casbega,S.L
Cobega,S.A.
Colebega,S.A.
Norbega,S.A.
Rendelsur,S.A.
industry average

COCA-COLA’S CASE 2015
Noelia Fabregat García Pg. 41
Chart (32) Working capital by companies, Liquidity Analysis- Own elaboration.
As it can be observed there are two companies which stand out from the rest regarding
the working capital in the evolution of each period. These are Asturbega,S.A. and
Rendelsur,S.A.. The first one is the company with more working capital, therefore it
can be said that the current assets investments are financed to a long-term debt. As it
is also observed, there isn’t bottling companies with negative data or zero since it
would be an alarming situation.
Business €
Asturbega,S.A. 30.756.681
Begano,S.A. 34.644.200
Casbega,S.L. 5.686.779
Cobega,S.A. 14.377
Colebega,S.A. 176.869.432
Norbega,S.A. 6.038.576
Rendelsur,S.A 121.010.468 Data table (24) Average Working capital of each companies, Liquidity Analysis- Own elaboration.
Chart (33) Average Working Capital of each companies, Liquidity Analysis- Own elaboration.
The average of the companies in the analysed period, it is a logically positive in all the
companies, since in the evolution does not appear any zero or negative numbers. It
has been also observed how it is noted in the evolution over the studied years
Colebega, S.A. and Rendelsur,S.A. are above the rest. Subsequently, there are two
0
50.000.000
100.000.000
150.000.000
200.000.000
250.000.000
300.000.000
2013 2012 2011 2010 2009 2008
€
years
Working Capital by companies Asturbega,S.A.
Begano,S.A.
Casbega,S.L
Cobega,S.A.
Colebega,S.A.
Norbega,S.A.
Rendelsur,S.A.
-
50.000.000
100.000.000
150.000.000
200.000.000
Average
30.756.681 34.644.200
5.686.779 14.377
176.869.432
6.038.576
121.010.468
€ Average Working Capital Asturbega,S.A.
Begano,S.A.
Casbega,S.L
Cobega,S.A.
Colebega,S.A.
Norbega,S.A.
Rendelsur,S.A.

COCA-COLA’S CASE 2015
Noelia Fabregat García Pg. 42
companies similar to these average, close to 34 million Euros which are
Asturbega,S.A. and Begano,S.A.. Below, there are another two companies with similar
data, Casbega,S.L. and Norbega,S.A. close to 6 million Euros and finally it is
Cobega,S.A. which is the lower number of financial cushion has, only about 14,000
Euros.
b. Sector’s average over 2008-2013
It is observed the evolution of the working capital as the sector’s average;
2013 2012 2011 2010 2009 2008
Industry average
25.831.306 39.654.872 40.259.543 71.132.478 77.259.752 67.308.204
Data table (25) Industry average Working capital, Liquidity Analysis- Own elaboration.
Chart (33) Industry Average Working capital, Liquidity Analysis- Own elaboration.
It appears in the previous line chart, a line where the evolution of the sector’s average
is reflected. As it can be seen there is the sector’s average as a line with a down ward
trend since 2009, maybe it could be because the Spanish economic crisis, since from
that year to 2013, it was greatly reduced the current assets, reducing also the non-
current liabilities, but this non-current liabilities in a lesser extent.
25.831.306
39.654.872
40.259.543
71.132.478 77.259.752
67.308.204
-
20.000.000
40.000.000
60.000.000
80.000.000
100.000.000
2013 2012 2011 2010 2009 2008
€
years
Industry Average, Working Capital
industry average
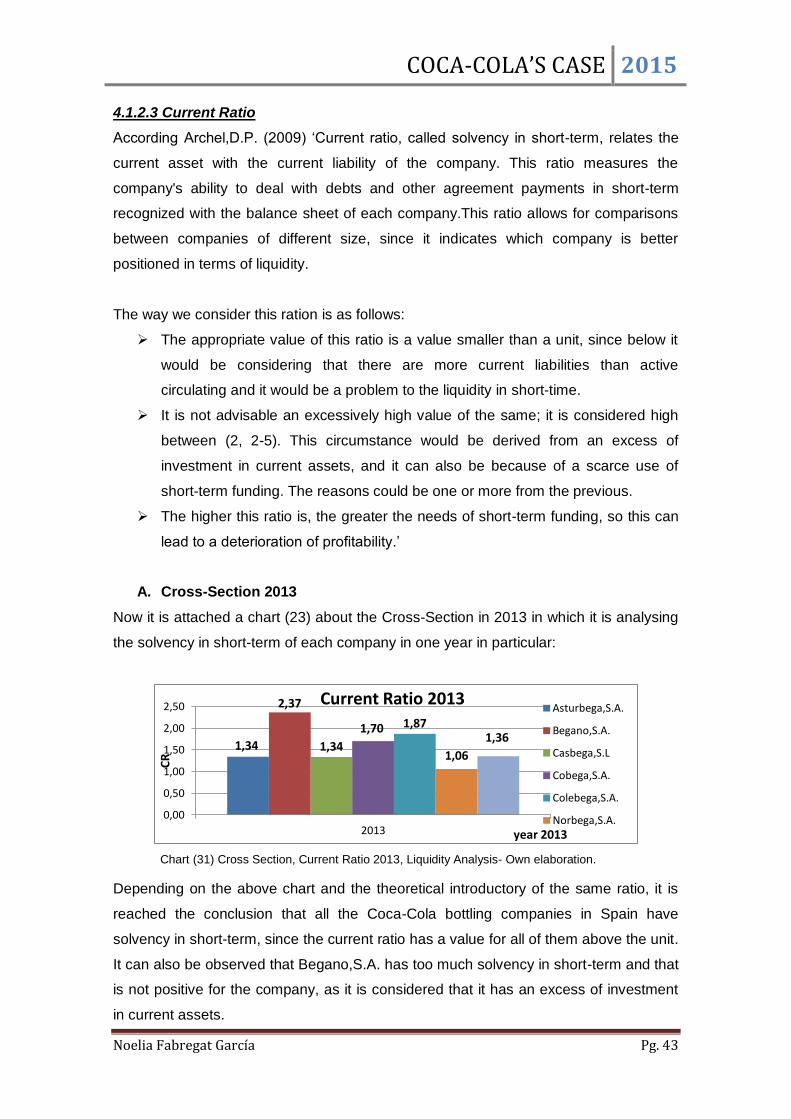
COCA-COLA’S CASE 2015
Noelia Fabregat García Pg. 43
4.1.2.3 Current Ratio
According Archel,D.P. (2009) ‘Current ratio, called solvency in short-term, relates the
current asset with the current liability of the company. This ratio measures the
company's ability to deal with debts and other agreement payments in short-term
recognized with the balance sheet of each company.This ratio allows for comparisons
between companies of different size, since it indicates which company is better
positioned in terms of liquidity.
The way we consider this ration is as follows:
The appropriate value of this ratio is a value smaller than a unit, since below it
would be considering that there are more current liabilities than active
circulating and it would be a problem to the liquidity in short-time.
It is not advisable an excessively high value of the same; it is considered high
between (2, 2-5). This circumstance would be derived from an excess of
investment in current assets, and it can also be because of a scarce use of
short-term funding. The reasons could be one or more from the previous.
The higher this ratio is, the greater the needs of short-term funding, so this can
lead to a deterioration of profitability.’
A. Cross-Section 2013
Now it is attached a chart (23) about the Cross-Section in 2013 in which it is analysing
the solvency in short-term of each company in one year in particular:
Chart (31) Cross Section, Current Ratio 2013, Liquidity Analysis- Own elaboration.
Depending on the above chart and the theoretical introductory of the same ratio, it is
reached the conclusion that all the Coca-Cola bottling companies in Spain have
solvency in short-term, since the current ratio has a value for all of them above the unit.
It can also be observed that Begano,S.A. has too much solvency in short-term and that
is not positive for the company, as it is considered that it has an excess of investment
in current assets.
1,34
2,37
1,34
1,70 1,87
1,06
1,36
0,00
0,50
1,00
1,50
2,00
2,50
2013
CR
year 2013
Current Ratio 2013 Asturbega,S.A.
Begano,S.A.
Casbega,S.L
Cobega,S.A.
Colebega,S.A.
Norbega,S.A.

COCA-COLA’S CASE 2015
Noelia Fabregat García Pg. 44
B. Time Series
a. Each company in the period 2008-2013
Now it is attached the evolution of all the companies along the period in reference with
this ratio;
2013 2012 2011 2010 2009 2008
Asturbega,S.A. 1,34 3,05 2,42 4,10 4,88 4,54
Begano,S.A. 2,37 3,19 1,16 2,79 2,32 2,59
Casbega,S.L. 1,34
Cobega,S.A. 1,70
Colegeba,S.A. 1,87 3,52 1,94 4,30 4,90 4,46
Norbega,S.A. 1,06 1,34 1,10 1,26 1,00 1,06
Rendelsur,S.A. 1,36 2,52 2,76 3,64 3,19 2,69 Data table (23) Current Ratio by companies in 2013, Liquidity Analysis- Own elaboration.
Chart (32) Current Ratio of each company, Liquidity Analysis- Own elaboration.
All of Coca-Cola bottling companies, as it has been mentioned in the previous section,
have short-term solvency ratio above the unit, which is the appropriate value for the
same. Once commented the important aspects, there are seen two aspects which
stand out from the rest.
The first of these is the minimum that belongs to Norbega,S.A., and very close to the
unit, so it has assets in approximately the same proportion but slightly higher than the
current liabilities, a positive aspect for the entity.
The second of them is Asturbega,S.A. and Colebega,S.A. that appear above the rest in
the first three phases of this analysed period, having a value of 4. so they had made
too many investments in current assets, but this was decreasing and in later stages,
the companies have become to quite similar levels between 1-2; with the exception of
Begano, S.A. which exceeds 2.2 points in the year 2013.
0,00
1,00
2,00
3,00
4,00
5,00
6,00
2013 2012 2011 2010 2009 2008 CR
years
Current Ratio of each company Asturbega,S.A.
Begano,S.A.
Casbega,S.L
Cobega,S.A.
Colebega,S.A.
Norbega,S.A.
Rendelsur,S.A.

COCA-COLA’S CASE 2015
Noelia Fabregat García Pg. 45
Business Average Current Ratio
Asturbega,S.A. 3,39
Begano,S.A. 2,41
Casbega,S.L 0,22
Cobega,S.A. 0,28
Colebega,S.A. 3,50
Norbega,S.A. 1,14
Rendelsur,S.A. 2,69 Data table (24) Average Current Ratio of each companies, Liquidity Analysis- Own elaboration.
Chart (32) Average Current Ratio of each company, Liquidity Analysis- Own elaboration.
As it appears both in the table (24) and the chart (32), it can be seen that all companies have a
current ratio greater than the unity and even higher than the range of the advisable. With the
exception of the two companies, that they only have data of their last period, which in this
case have a ratio smaller than a unit. The advisable to the solvency of the companies is having
a ratio higher than a unit which does not exceed the 2.2 and this is only got by Norbega,S.A.. It
is observed, the existence of four bottling companies which exceed this not advisable range,
since if they are within this is due to an elevated existence of current assets; this is the case of
Asturbega,S.A:, Begano,S.A., Colebega,S.A. and Rendelsur,S.A.
b. Sector’s average over 2008-2013
Current Ratio 2013 2012 2011 2010 2009 2008
Industry Average 1,58 1,95 1,34 2,30 2,33 2,19 Data table (25) Industry Average, Current Ratio 2013-2008, Liquidity Analysis- Own elaboration.
0,00
1,00
2,00
3,00
4,00
CURRENT RATIO
3,39
2,41
0,22 0,28
3,50
1,14
2,69
Average CR of each companies
Asturbega,S.A.
Begano,S.A.
Casbega,S.L
Cobega,S.A.
Colebega,S.A.
Norbega,S.A.
Rendelsur,S.A.

COCA-COLA’S CASE 2015
Noelia Fabregat García Pg. 46
Chart (33) Industry Average Current Ratio, Liquidity Analysis- Own elaboration.
In the current ratio evolution it is seen that in the first three periods of this analysed
stage, they were more elevated and within the range of the high ratio which is
explained by a high investment in current assets, and in the second stage is within the
advisable ratio. If we compare the sector’s average with the each company average it
can be observed:
2008, 2009 and 2012 as it has been already mentioned, it overtakes the
advisable, and it is within the considered high range, since the range is 2.2 to 5
and these years it is around 2.3. All companies do it, except Norbega,S.A..
2011, the average industry stands at 1.34, an advisable value, close to the
same value are Norbega,S.A. And Begano,S.A. The others are located above
the previous range; Colebega,S.A. is close to reach this rank.
2012, all companies are in the range of high current ratio with the exception of
Norbega,S.A. which has1.34, since the average stands at 1.95 and this is
already close to the same.
2013, all companies are within what it is considered advisable for companies,
the sector’s average is 1.58, only Begano,S.A. is located in the high rank with
2.37
1,58
1,95
1,34
2,30 2,33 2,19
0,00
0,50
1,00
1,50
2,00
2,50
2013 2012 2011 2010 2009 2008
CR
years
Industry Average, Current Ratio
industry average

COCA-COLA’S CASE 2015
Noelia Fabregat García Pg. 47
5. Conclusions; currently bottling companies
In 2014 bottling companies set out salary changes, organizational and work changes,
affecting salaries, categories, and competitions among other areas. Coca-Cola
Company got that the workers be angry because there were many affected with firings
and relocations.
This is the map of the Spanish bottling companies where appears the companies which
have closed last year due to the adjustments and which are still open today.
Map of Spanish bottling companies (1) www.libremercado.com
Coca-Cola Iberian Partners, introduced the labour force adjustment plan claiming a
record due to organizational and productive causes, incident that happens when the
factories are not kept with idle capacity, since it is not operated at the level that the
profitability suffered a fall of 43% from 2009 until the time of the labour force
adjustment plan, and postpone decisions had made it worse.
As it can been observed throughout this analysis, bottling companies of Coca-Cola
have not experimented falls in its financial or economic profitability. Simply,
Asturbega,S.A. has suffered a decline in the period 2012-2013, but this is not a result
that will persist in the future. It is considered that the causes claimed by Coca-Cola
Iberian Partner, on the labour force adjustment plan were not certain at all, and that
they tried to get on the train of what then happened in the Spanish economy thus
making in this way that costs were reduced and by relocating the workers.
As you can read currently in newspapers, the National Court has declared the labour
force adjustment plan was wrong, and therefore they will have to take the necessary
measures such as compensation, a new plan or relocations.
In this way, it is put an end to this investigation about Coca-Cola case.

COCA-COLA’S CASE 2015
Noelia Fabregat García Pg. 48
6. Bibligraphy:
Archel D.P(2012) Estados contables, Elaboración análisis e interpretación.
Web-Grafía
www.cincodias.com/cincodias/2015/04/15/empresas/1429087632_907339.html
www.cocacola.es
www.comunicarseweb.com.ar/?page=ampliada&id=8118
www.corelytics.com
www.finanzasclarasysimples.blogspot.com.es/2013/05/el-periodo-medio-de-
maduracion.html
www.libremercado.com/2015-04-17/coca-cola-y-ahora-que-nuevo-ere-recolocacion-o-
dinero-1276545773/
www.linguee.es
www.wordreference.com