deformation and aging kinetics of model polymer systems
TRANSCRIPT

1
Deformation and aging kinetics
of model polymer systems
J.G. Zwitserlood
MT 11.09

Introduction 2
Table of contents
1. Introduction .......................................................................................................................................... 3
2. Background ........................................................................................................................................... 4
2.1. Mechanical behaviour of amorphous polymers ........................................................................... 4
2.1.1. Intrinsic deformation ............................................................................................................ 4
2.1.2. Deformation kinetics ............................................................................................................. 5
2.1.3. Activation volume and time-to-failure .................................................................................. 5
2.2. Thermal behaviour of polymers .................................................................................................... 7
2.3. Tacticity ......................................................................................................................................... 9
2.4. Heterogeneity in amorphous polymers ...................................................................................... 10
3. Materials and methods ....................................................................................................................... 11
3.1. Materials ..................................................................................................................................... 11
3.2. Methods ...................................................................................................................................... 13
4. Discussion ............................................................................................................................................ 14
4.1. Effect of tacticity on aging kinetics ............................................................................................. 14
4.1.1. Introduction ........................................................................................................................ 14
4.1.2. Experiment description ....................................................................................................... 14
4.1.3. Results ................................................................................................................................. 15
4.2. Deformation kinetics of polycarbonates .................................................................................... 17
4.2.1. Glass transition temperature .............................................................................................. 17
4.2.2. Deformation kinetics ........................................................................................................... 17
4.3. Interplay between deformation kinetics and aging .................................................................... 20
4.3.1. Material selection ............................................................................................................... 20
4.3.2. Thermal analysis.................................................................................................................. 20
4.3.3. Mechanical analysis ............................................................................................................ 21
5. Conclusion ........................................................................................................................................... 22
6. References .......................................................................................................................................... 23

Introduction 3
1. Introduction
In this study, the influence of features of the molecular architecture on physical aging and the
deformation kinetics of amorphous polymers are investigated. Also a relation between the two
phenomena is investigated. A schematic of the problem is given in figure 1.1.
Physical aging is a common feature of all polymeric materials. The rate and extent of this phenomenon
depends on subtle details of the molecular structure and therefore differ from polymer to polymer. All
polymers however, will age over time. While aging, polymers embrittle and this limits the number of
applications. It would be very interesting to be able to control the aging process. However, it is still
unclear which processes cause aging and what factors influence it.
To get a better understanding of the before mentioned, the influence of tacticity on aging is
investigated. This is done by comparing the properties of atactic polystyrene (aPS) and syndiotactic
polystyrene (sPS) after a number of different annealing times. By using the same base material, but with
a different distribution of side groups, this comparison should clearly show if the tacticity of a polymer
has an effect on aging.
The influence of molecular structure on deformation kinetics is investigated by measuring the
deformation kinetics of a set of polycarbonate copolymers that differ by “small” details of the molecular
structure. This could give some information on the influence of molecular structure on deformation
kinetics. This data is then used to select three polymers with very different deformation kinetics. By
analyzing these three materials a relationship between the deformation kinetics and the aging kinetics is
sought.
figure 1.1 Schematic of problem
Physical aging
- Aging time
- Aging temperature
- Embrittlement
Deformation kinetics
- Yield stress
- Activation volume
- Strain rate
Molecular structure
- Side groups
- Tacticity
- Co-monomers

Background 4
2. Background
2.1. Mechanical behaviour of amorphous polymers
2.1.1. Intrinsic deformation
The intrinsic deformation is a materials’ true stress-strain response during homogeneous deformation at
a constant strain rate that can be obtained during a uniaxial compression test. In figure 2.1 a general
representation of the intrinsic deformation of a polymer is depicted.
Initially, the relation between stress and strain is linear (a). For larger strain the relation becomes
increasingly non-linear until the stress reaches a maximum called the yield stress (b). This marks the
point at which the main polymer chains obtain segmental mobility, so they can start moving with
deformation. This phenomenon is similar to the glass transition except for the fact that this time the
mobility is stress induced and the glass transition is temperature induced. When the strain is increased
even further, the stress drops. This effect is called strain softening (c). For even greater strain the stress
starts to increase again. This last effect is called strain hardening and is caused by the fact that
molecules in the material under large strain become oriented (d). The intrinsic deformation is rate
dependent and, as can be seen in figure 2.2, the yield stress increases with strain rate.
figure 2.1 General representation of intrinsic
behaviour
figure 2.2 Influence of strain rate on intrinsic
behaviour
Aging affects the intrinsic mechanical behaviour increasing yield stress and leaving strain hardening
unchanged, see figure 2.3. As a result of the increased softening, the material embrittles over time.
ε�

Background 5
figure 2.3 Influence of strain rate on intrinsic behaviour
2.1.2. Deformation kinetics
Unlike, for instance, metals and ceramics, the mechanical behaviour of polymers is strain rate
dependent. This makes it possible to construct a graph of the yield stress versus the strain rate. A
general representation of such a graph, called deformation kinetics, is given in figure 2.4 for three
generic polymers and a metal. Note that the x-axis is logarithmically scaled.
figure 2.4 General representation of deformation kinetics
2.1.3. Activation volume and time-to-failure
When the observation time-scale is sufficiently long, amorphous polymers behave like fluids also below
Tg. Therefore, when loaded, they will fail eventually. The time to failure depends on the applied stress
as can be seen in figure 2.5.
An unusual reading of figure 2.4 can be used to define a failure criterion: when loaded with a constant
stress σ , the material deforms plastically at a constant rate∗ε� . Plastic deformation accumulates (
tannealing

Background 6
t
* *
pl
0
( ,t) ( )dt' ( ) tε σ = ε σ = ε σ ⋅∫ � � ) and when it exceeds a critical value (pl crε = ε ), the material fails. The
life-time of the material or time to failure is defined by the critical condition:
* cr
f cr f *( ) t t
( )
εε σ ⋅ = ε ⇒ =
ε σ�
� (2.1)
The flow behaviour below Tg can be described with the Eyring's equations [5].
( ) ( )0
T sinh,Tk T
∗ σ⋅ν ε σ = ε
⋅ ⋅� � (2.2)
With
0 0exp
R
U
T
∗ ∆ε ε
= ⋅
⋅ � � (2.3)
where 0
∗ε� a reference strain rate at an arbitrary temperature, σ the applied stress, ν the activation
volume, k Boltzmann’s constant, T the absolute temperature, 0
ε� the absolute reference strain rate, U∆
the activation energy and R the gas constant.
From this, one can conclude that the activation volume ν is an important parameter in determining the
time-to-failure. This parameter can easily be calculated using the deformation kinetics of a material [1].
Assume the slope of the deformation kinetics in MPA/decade is φ , the activation volume can then be
calculated using
( )
kTln 10ν = ⋅
φ (2.4)
figure 2.5 General representation of time-to-failure vs. applied stress

Background 7
2.2. Thermal behaviour of polymers
The thermal behaviour of polymers can be studied with a technique called Differential Scanning
Calorimetry (DSC). In figure 2.6 the general thermal response of a crystallizable polymer is depicted as a
function of the temperature. In this picture three characteristic features of the curve are indicated.
figure 2.6 General DSC curve
Starting from low temperature, the first feature observed is the glass transition resembling a step-wise
change of the heat capacity. The midpoint of this shift is the glass transition temperature (Tg). The next
feature represents the crystallization of the polymer. As this is an exothermic process the peak is
positive, meaning that less heat has to flow to the sample in order to maintain a constant heating rate.
The last feature shows the melting of the polymer as a negative peak as this is an endothermic process
where the lattice is broken down.
DSC can be used to study aging as well. One feature that is not present in the curve of figure 2.6 is the
enthalpy overshoot that is observed in aged polymers heated across Tg , see figure 2.7. The area of the
peak increases for longer annealing times [2]. The size of this peak is therefore a measure for the “age”
of the material.

Background 8
figure 2.7 Enthalpy overshoot

Background 9
2.3. Tacticity
Many polymers, for instance vinyl polymers which consist of an extended alkane chain backbone with
substituents attached to this base chain, can exhibit different tacticity or stereo regularity. Tacticity is
the spatial positioning of the side group with respect to the side groups of the adjacent repeating units.
These side groups can either be located at the same side of the backbone, on alternating sides or
randomly on either of the sides as shown for polystyrene (PS) in figure 2.8 a to c. When the side groups
are consistently on the same side of the molecule the material is called isotactic, when they alternate
syndiotactic and when they are randomly distributed atactic.
Tacticity can hugely influence the mechanical properties of a material [3]. The ability to crystallize for
instance is dependent on the tacticity since for crystallization the side groups have to be regularly
distributed. For PS for example, this means that the atactic variant cannot crystallize due to the random
stereoregularity of the side groups.
(a) Isotactic polystyrene
(b) Syndiotactic polystyrene
(c) Atactic polystyrene
figure 2.8 Molecular structure of polystyrene with different tacticity

Background 10
2.4. Heterogeneity in amorphous polymers
When a polymer is quickly cooled below Tg, the material will not be in thermo dynamical equilibrium as
depicted in figure 2.9. Because of the high cooling rate, the mobility of the molecules is too small to
assemble with a denser packing and, at the same time, comply with the decreasing thermal expansion
coefficient [1]. The molecules are, so to say, frozen-in before being able to move closer to each other.
Therefore the material will have a specific volume larger than the equilibrium value.
figure 2.9 Equilibrium volume
Amorphous polymers lack tri-dimensional long-range order. However, it is still possible to encounter
small domains where molecules are closer to each other. These static density fluctuations or
heterogeneities are the result of a natural tendency towards the thermodynamic equilibrium. The
situation is schematically shown in figure 2.10. The nature of the heterogeneities is not yet clarified.
Nevertheless, their fingerprint is readily observed, for instance, in scattering experiments. Eventually,
the densification process leads to thermodynamic equilibrium (figure 2.9).
Since densification is caused by structure formation in the amorphous polymer, the structure of the
molecules could probably influence the phenomenon. For instance, it is known that chain regularity
influences a materials’ possibility to crystallize. If these heterogeneities are, in fact, a result of structure
formation at micro scale then this too could be dependent on the regularity of the base chain and its
side groups.
figure 2.10 Heterogeneity in amorphous polymers

Materials and methods 11
3. Materials and methods
3.1. Materials
To investigate the influence of tacticity on aging, we have investigated syndiotactic and atactic
polystyrene, sPS and aPS respectively (Shell N5000 and Dow Questra 101). Both materials were
compression moulded at 280°C and cooled either by dropping them into ice water of
∼5°C or between water cooled plates.
The materials used to study the deformation kinetics in polycarbonates are given with their respective
structural formula in table 3.1. The supplier as well as the temperature at which they were compression
moulded are also listed in the same table. Unlike PS, PC absorbs water. To rule out effects due to
moisture absorbed, the material was dried in vacuum before sample preparation.
The last material used in this study is poly-L-lactide IVI 4.2 (PLLA), provided by Purac Biochem
(Gorinchem, The Netherlands). The bulk material was kept in a freezer to avoid degradation due to the
absorption of moisture. After the material had thawed, it was put in a vacuum chamber to dry for at
least two days. Compression moulding took place at a mould temperature of 200°C after which the
material was cooled between water cooled plates.

Materials and methods
table 3.1 Different PCs and their stru
Name and
providing
company
Mould
temperature
[°C]
BPA 240
TMPC
(Bayer) 240
Bisphenol
AP
(SABIC)
260
DMBPC
(SABIC) 200
Thio-
diphenol
(SABIC)
240
30%mol BP
(SABIC) 220
12%mol SA
(SABIC) 180
Isosorbide
(SABIC) 210
Tert. butyl
HQ
(SABIC)
190
12
able 3.1 Different PCs and their structural formula
Structural formula

Materials and methods 13
3.2. Methods
Both tensile and compression tests are performed on a Zwick tensile tester. For tensile testing tensile
bars of 1x2x18.5 mm are used. These are made by compression moulding 1 mm thick plates of 30x60
mm and punching the tensile bars out. Compression tests are done on samples with a diameter of 4.5
mm or 6 mm and a ratio between the diameter and the height of approximately 1, to avoid buckling and
to attain homogeneous deformation. Friction between the sample and compression plates is reduced by
spraying the compression plates with PTFE lubricant and by applying a thin film of PTFE tape to both
ends of the sample.
Differential scanning calorimetry (DSC) was performed on a Mettler Toledo DSC823e equipped with a
FRS5 sensor.
WAXD was performed on a Rigaku diffractometer in Bragg-Brentano configuration.

Discussion 14
4. Discussion
4.1. Effect of tacticity on aging kinetics
4.1.1. Introduction
The effect of tacticity on aging kinetics is studied by measuring the differences between aPS and sPS.
These are the same materials except for the tacticity, so this eliminates any other factors that might
influence the aging results. Because of this difference in tacticity however, one of the materials, sPS, can
crystallize and the other one, aPS, cannot. To be able to really compare the results both materials should
be amorphous. This is only possible for sPS if the material is cooled very rapidly at a cooling rate of
about 200°C/s [7]. This rate can only be achieved for very thin films. As seen in figure 4.1 , the absence
of sharp peaks in the WAXD pattern indicates that there are no crystalline structures in the sample
quenched in ice water ( T� = 200°C/s), unlike the sample which is cooled between water cooled plates ( T�
= 100°C/min).
figure 4.1 WAXD of sPS for two different cooling rates
4.1.2. Experiment description
To demonstrate aging in polymers, we normally look at the increase in yield stress and strain softening
by mechanically testing the material. However, amorphous PS is brittle; therefore, we would need to
prepare samples for compression tests. For aPS these samples are easy to make since the material
cannot crystallize. For sPS, instead, a very high cooling rate is needed, and this is cannot be achieved in

Discussion 15
(thick) compression samples. This makes an alternative way of analysing the aging kinetics necessary.
As mentioned before, one can study aging by looking at the thermal behaviour in DSC. Since it is
possible to make thin films of amorphous sPS it is no problem to make samples for thermal analysis. The
samples are made by compression moulding a thin film of 200 μm and dropping it into ice water to
avoid crystallization. Even though aPS cannot crystallize, the samples are prepared in the same way, to
give both materials the same thermal history before testing. The test is done by heating the sample to
80°C on the DSC equipment and keeping it at that temperature for different annealing times. Afterwards
the material is cooled to room temperature and is then heated to 300°C at a rate of 10°C/min.
4.1.3. Results
By calculating the area under the peak of the enthalpy overshoot a measure of the amount of aging is
obtained. The results are given in figure 4.2a. From these results one can conclude that sPS shows more
aging after the same annealing time at the same temperature. However, this conclusion neglects the
difference in Tg between aPS and sPS that can be seen in figure 4.3. In fact, the glass transition
temperature of aPS is 5°C higher than that of sPS (96°C vs. 101°C), which is probably a result of a
different molecular weight. Because of this, the materials are not annealed at the same distance from Tg
and will therefore not have the same chain mobility. When both materials are annealed at the same
distance from Tg they behave very similarly as can be seen in figure 4.2b. An extra annealing time of 30
hours has been added, because the difference should be more distinct for longer annealing time. There
seems to be almost no difference between aPS and sPS however.
The outcome of the second experiment suggests that aPS and sPS age with the same kinetics. This is not
sufficient to confirm or rule out the influence of molecular regularity on the formation of
heterogeneities. It only suggests that aging is caused by structures smaller than the typical length scale
of regular (syndiotactic) sequences in sPS.
figure 4.2a Entahlpy overshoot for aPS and sPS for
different annealing times at 80°C
figure 4.2b Entahlpy overshoot for aPS and sPS for
different annealing times at 16°C below their
respective Tg

Discussion 16
figure 4.3 Difference in Tg between aPS and sPS

Discussion 17
4.2. Deformation kinetics of polycarbonates
4.2.1. Glass transition temperature
To find the influence of molecular structure on deformation kinetics a number of PCs have been
analyzed. First of all the glass transition temperature is determined with DSC. The results are given in
figure 4.4 below. It is not simple to establish a relationship between the molecular structure of the
polymers and Tg without performing detailed simulations on the properties of the molecular structure.
In this project however, the value of Tg is instrumental as it used to find an estimate for the mould
temperature, since beforehand there was very little information on the different polycarbonates.
figure 4.4 Tg for different polycarbonates
4.2.2. Deformation kinetics
To determine the deformation kinetics either tensile bars or compression samples are made depending
on the properties of the specific PC. 30%mol BP, 12%mol SA, Bisphenol AP and BPA behave ductile are
tested in tension. Thiodiphenol, however, is a brittle material and is tested in compression. TMPC and
Isosorbide, on the other hand, are so brittle that it is impossible to produce compression samples and so
they cannot be tested. The DMBPC provided by SABIC is also too brittle to prepare samples. The
deformation kinetics of DMPBC is therefore determined using a different grade of the same material,
presumably with a higher molecular weight. This is possible because the deformation kinetics is not
Discussion 18
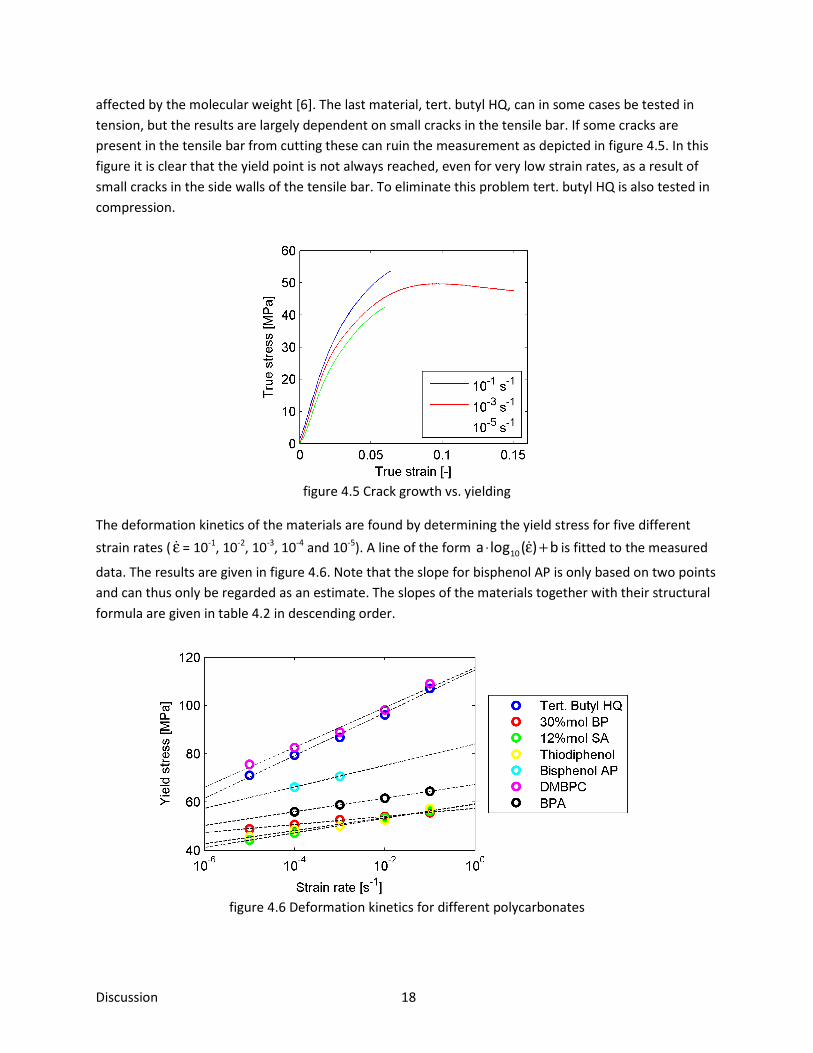
affected by the molecular weight [6]. The last material, tert. butyl HQ, can in some cases be tested in
tension, but the results are largely dependent on small cracks in the tensile bar. If some cracks are
present in the tensile bar from cutting these can ruin the measurement as depicted in figure 4.5. In this
figure it is clear that the yield point is not always reached, even for very low strain rates, as a result of
small cracks in the side walls of the tensile bar. To eliminate this problem tert. butyl HQ is also tested in
compression.
figure 4.5 Crack growth vs. yielding
The deformation kinetics of the materials are found by determining the yield stress for five different
strain rates ( ε� = 10-1
, 10-2
, 10-3
, 10-4
and 10-5
). A line of the form ⋅ ε +�10
a log ( ) b is fitted to the measured
data. The results are given in figure 4.6. Note that the slope for bisphenol AP is only based on two points
and can thus only be regarded as an estimate. The slopes of the materials together with their structural
formula are given in table 4.2 in descending order.
figure 4.6 Deformation kinetics for different polycarbonates

Discussion
table 4.2 Slopes of deformation kinetics for different polycarbonates
Name Slope
[MPa/dec.]
Tert. butyl HQ 8.9
DMBPC 8.3
Bisphenol AP 4.4
12%mol SA 3
BPA 2.8
Thio-diphenol 2.7
30%mol BP 1.7
Two of the tested materials, tert. butyl HQ and DMBPC, have significantly higher slopes than the norma
polycarbonate, BPA. On the other end of the spectrum 30%mol BP has a very low slope of only 1.7
MPa/decade. The link between molecular features and the observed slope is not obvious. For instance,
there is no obvious correlation between T
dependent on the stiffness of the molecule, but is also influenced by other factors. This relation can be
investigated in further studies.
19
table 4.2 Slopes of deformation kinetics for different polycarbonates
Structural formula
Two of the tested materials, tert. butyl HQ and DMBPC, have significantly higher slopes than the norma
polycarbonate, BPA. On the other end of the spectrum 30%mol BP has a very low slope of only 1.7
MPa/decade. The link between molecular features and the observed slope is not obvious. For instance,
there is no obvious correlation between Tg and the slope. This means that the slope is not only
dependent on the stiffness of the molecule, but is also influenced by other factors. This relation can be
Two of the tested materials, tert. butyl HQ and DMBPC, have significantly higher slopes than the normal
polycarbonate, BPA. On the other end of the spectrum 30%mol BP has a very low slope of only 1.7
MPa/decade. The link between molecular features and the observed slope is not obvious. For instance,
This means that the slope is not only
dependent on the stiffness of the molecule, but is also influenced by other factors. This relation can be

Discussion 20
4.3. Interplay between deformation kinetics and aging
4.3.1. Material selection
As it was discussed in paragraph 2.1, the ductile time-to-failure is closely related to the deformation
kinetics. However, since aging increases yield stress, the time-to-failure is also related to aging. In this
paragraph, the relation between deformation kinetics and aging kinetics is investigated for three
materials with very different deformation kinetics, namely aPS, 30% BP and PLLA.
The 30%mol BP shows a very low slope (1.7 MPa/decade) and is therefore selected. The next material
used for this study is PLLA, since it has a very steep slope of 14 MPa/decade. The final material is aPS,
which has a slope of 8 MPa/decade. The aging kinetics of these three materials will be tested by looking
at both their thermal and mechanical behaviour after different annealing times.
4.3.2. Thermal analysis
First, we look at the thermal response of the materials for different annealing times varying from 30
minutes to 30 hours. In paragraph 4.1, it was already discussed that the annealing should take place at a
constant distance from Tg. For this reason, all materials are annealed at 19°C below Tg which means
139°C for 30%mol BP, 85°C for aPS and 42°C for PLLA. The results are obtained in the same way as
before, by calculating the size of the enthalpy overshoot. The results are given in figure 4.8.
figure 4.8 Entahlpy overshoot for aPS, 30%mol BP and PLLA for different annealing times at 16°C below
their respective Tg
From the graph, it becomes clear that 30%mol BP ages slower than the other two materials.
Interestingly, 30%mol BP has also the lowest slope in the deformation kinetics. Whereas, aPS and PLLA
show a very similar aging kinetics despite the very different slopes (PLLA is almost twice as steep as aPS).

Discussion 21
4.3.3. Mechanical analysis
Fortunately, in this case it is possible to also do some mechanical testing since test samples are
producible for all three materials. Because 30%mol BP is ductile, it is tested in tension whereas both aPS
and PLLA are tested in compression due to their brittle nature.
PLLA is expected to age very fast already at room temperature. To prevent aging from taking place at
room temperature, compression samples were milled directly after compression moulding and rapidly
put in the oven at 42°C.
The results of the tests can be evaluated in two ways. We can look at the absolute values (figure 4.9),
but it is also interesting to look at the change relative to the initial value (figure 4.10). Again, 30%mol BP,
shows very slow aging and the increase of yield stress is small compared with aPS and PLLA. The yield
stress increased only 2 MPa after 30 hours which is equal to 3.5% of its initial yield stress. Moreover, the
increase seems to level off already after 30 hours of annealing.
Unlike in the thermal analysis however, this time there is a significant difference between PLLA and aPS.
The slope of the yield stress versus the annealing time is higher for PLLA than for aPS. Especially in
comparison to its original yield stress the slope of PLLA is almost three times as high as that of aPS. This
clearly shows that the rate at which aging occurs is much higher in PLLA than in aPS. Whether or not
PLLA also shows more aging, in the sense that the relative increase in yield stress will exceed the relative
increase in yield stress for aPS for an infinite annealing time, is not sure. Eventually, the yield stress will
reach a plateau level as already seems to be the case for 30%mol BP after 30 hours. Even though the
yield stress of PLLA increases much faster than that of aPS, there is no data on the maximum increase. A
single test for aPS after 7 days of annealing suggests, however, that it keeps increasing for at least 7
days.
figure 4.9 Absolute yield stress versus annealing
time
figure 4.10 Relative yield stress versus annealing
time
Conclusion 22
5. Conclusion
It’s still unclear what the underlying cause of aging exactly is. Some light has been shed on a number of
aspects however. First of all the influence of tacticity on aging kinetics was investigated. Based on the
thermal analysis done on amorphous atactic polystyrene and syndiotactic polystyrene tacticty doesn’t
seem to have an effect on aging. The study could be expanded by the use of micro indentation, so that
the mechanical properties can also be compared. In this experiment it was also found that, in order to
be able to compare the results, annealing should be performed at a constant distance from the glass
transition temperature and not at a constant temperature.
To investigate if there is a relationship between molecular structure and deformation kinetics a number
of polycarbonates was tested at multiple strain rates. When the logarithm of the strain rate is plotted
versus the yield stress very different slopes are found. This suggests that subtle details of the molecular
structure have large influence on the macroscopic mechanical behavior of the material.
To further investigate the effect of deformation kinetics three materials with very different slopes
(30%mol BP, aPS and PLLA) were studied by looking at their thermal response as well as their
mechanical response after different annealing times. The thermal analysis showed a big difference
between 30%mol BP and the other materials. aPS And PLLA gave a very similar response however even
though PLLA has a slope which is almost twice as high as that of aPS. From this experiment, at least, it is
clear that 30%mol BP ages significantly slower. In order to see the difference, if any, between the other
two materials mechanical testing was performed. This time PLLA seemed to age much faster than aPS,
since the yield stress of PLLA went up much faster than that of aPS. Again 30%mol BP showed
remarkably less aging than the others. In short, the results suggest that materials with a steep slope in
the deformation kinetics tend to age faster than materials with a low slope, and mechanical testing is
more sensitive towards aging than DSC.
The outcome of this second experiment clearly showed the limitations of DSC since that technique
showed no difference between aPS and PLLA while there is a big difference between the two. The
results obtained in the first experiment to study the influence of tacticity can therefore not be
considered conclusive and a more extensive study is necessary to definitively determine the influence of
tacticty on aging kinetics.

References 23
6. References
[1] van der Vegt, A.K., & Govaert, L.E. (1991). Polymeren, van keten tot kunststof. VSSD, NL: Delft.
[2] Cook, W.D., Mehrabi, M., & Edward, G.H. (1998). Aging and yielding in model epoxy thermosets.
Elsevier Polymer, 40, 1209–1218.
[3] Gitsas, A., Floudas, G. (2008). Pressure Dependence of the Glass Transition in Atactic and Isotactic
Polypropylene. Macromolecules, 41, 9423-9429.
[4] Karasz, F. E., &MacKnight, W.J. (1968). The Influence of Stereoregularity on the Glass
Transition Temperatures of Vinyl Polymers. Macromolecules, 1, 537–540.
[5] Roe, R.J., & Curro, J.J. (1982). Small-Angle X-ray Scattering Study of Density Fluctuation in
Polystyrene Annealed below the Glass Transition Temperature. Macromolecules, 16, 428-434.
[6] Govaert, L.E., van Melick, H.G.H., Meijer, H.E.H., Nauta, W.J., & Raas, B. (2003). Kinetics of aging
and re-embrittlement of mechanically rejuvenated polystyrene. Elsevier Polymer, 44, 1171–1179.
[7] La Carrubba, Piccarolo, Brucato (2007). Journal of Polymer Science Part B: Polymer Physics, 45, 19,
2688-2699