definitions accident: a specific unplanned event or sequence of events that has a specific...
TRANSCRIPT

Definitions
Accident: a specific unplanned event or sequence of events that has a specific undesirable consequence consequence.
Consequences: the results of an accident event sequence. It is originally considered to be the fire, explosion, and release of toxic material that results from the accident, but not the health effects, economic loss, etc., which is the ultimate result.
Battelle, Guidelines for Hazard Evaluation Procedures, AIChE, New York (1985).

EXAMPLES
Feyzin, France, 1966
Fixborough, England, 1974
Bhopal, India, 1984

TABLE 1-1. ELEMENTS OF ACCIDENTS
Hazards Initiating Event/Upsets Intermediate Events Accident (System or Operator Responses to Upsets) Consequences Propagating Ameliorative
Significant Machinery and Equipment Process Parameter Safety SystemInventories of Malfunctions Deviations Responses a) Flammable Materials a) Pumps, Valves a) Pressure a) Relief Valvesb) Combustible Materials b) Instruments, Sensors b) Temperature b) Back-up Utilities Firesc) Unstable Materials c) Flow Rate c) Back-up Componentsd) Toxic Materials d) Concentration d) Back-up Systems Explosionse) Extremely Hot or e) Phase/State Change Cold Materials Impactsf) Inerting Gases (Methane, Carbon Monoxide)
Highly Reactive Containment Failures Containment Failures Mitigation System Dispersion of Responses Toxica) Reagents a) Pipes a) Pipes a) Vents Materialsb) Products b) Vessels b) Vessels b) Dikesc) Intermediate c) Storage Tanks c) Storage Tanks c) Flares Dispersion of Products d) Gaskets d) Gaskets, Bellows, etc. d) Sprinklers Highlyd) By-products e) Input/output or Reactive venting Materials

Hazards Initiating Event/Upsets Intermediate Events Accident (System or Operator Responses to Upsets) Consequences Propagating Ameliorative
Reaction Rates Control ResponsesEspecially Sensitive to Human Errors Material Releases Operator Responses a) Impurities a) Operations a) Combustibles a) Plannedb) Process Parameters b) Maintenance b) Explosive Materials b) Ad Hoc c) Testing c) Toxic Materials d) Reactive Materials
Loss of Utilities Ignition/Explosion Contingency Operations a) Electricity Operator Errors a) Alarms b) Water b) Emergency Procedures c) Air a) Omission c) Personnel Safety d) Steam b) Commission d) Evacuations c) Diagnosis/Decision-Making e) Security
External Events External Events External Events
a) Floods a) Delayed Warning a) Early Detection b) Earthquakes b) Unwarned b) Early Warning c) Electrical Storms d) High Winds e) High Velocity Impacts f) Vandalism
Method/Information Errors Method/Information Failure Information Flow
a) As Designed a) Amount a) Routing b) As Communicated b) Usefulness b) Methods c) Timeliness c) Timing

DEFINITIONS
Incident
The loss of containment of material or energy (e. g., a leak of 10 1b/sec of ammonia from a connecting pipeline to the ammonia tank, producing a toxic vapor cloud).
Incident Outcome
The physical manifestation of the incident; for toxic materials, the incident outcome is a toxic release, while for flammable materials, the incident outcome could be a BLEVE (Boiling Liquid Expanding Vapor Explosion), flash fire, unconfined vapor could explosion, etc. (e. g., for a 10 1b/sec leak of ammonia, the incident outcome is a toxic release).
Incident Outcome Case
The quantitative definition of a single result of an incident outcome through specification of sufficient parameters to allow distinction of this case from all others for the same incident outcome [e. g., a concentration of 3333 ppm (v) of ammonia 2000 ft downwind from a 10 1b/sec ammonia leak is estimated assuming a 1.4 mph wind, and Stability Class D].
Consequence
A measure of the expected effects of an incident outcome case (e. g., an ammonia cloud from a 10 1b/sec leak under Stability Class D weather condition, and 1.4 mph wind traveling in a northerly direction will injure 50 people).
*CCPS, Guidelines for Chemical Process Quantitative Risk Analysis, AIChE, New York (1989)

INCIDENTS INCIDENT OUTCOMES INCIDENT OUTCOME CASES
5 mph Wind, Stability Class A
Toxic Vapor 10 mph Wind, Stability Class D Atmospheric Dispersion 15 mph Wind, Stability Class E o o o etc.
Jet Fire
Tank Full
BLEVE of Tank 50% Full HCN Tank o o o etc.
After 15 min. Release Unconfined Vapor After 30 min. Release Cloud Explosion After 60 min. Release o o o etc.
The relationship between incidents, incident outcomes, and incident outcome cases for a hydrogen cyanide (HCN) release.
100 1b/minRelease of HCN froma Tank Vent

Definitions
Hazard
a physical situation with a potential for human injury, damage to property, damage to environment or some combination of these. (IChem E)
a characteristic of the system/plant/process that represents a potential for an accident. (AIChE)
Risk
the likelihood of a specified undesirable event occurring within a specified period or in specified circumstances. (IChem E)
a measure of potential economic loss or human injury in terms of the probability of the loss or injury occurring and the magnitude of the loss or injury if it occurs. (AIChE)

TYPICAL HAZARDSSignificant inventories of: Extreme physical conditions
Flammable materialsCombustible materialsUnstable materialsCorrosive materialsAsphyxiantsShock sensitive materialsHighly reactive materialsToxic materialsInerting gasesCombustible dustsPyrophoric materials
High temperaturesCryogenic temperaturesHigh pressuresVacuumPressure cyclingTemperature cyclingVibration/liquid hammering
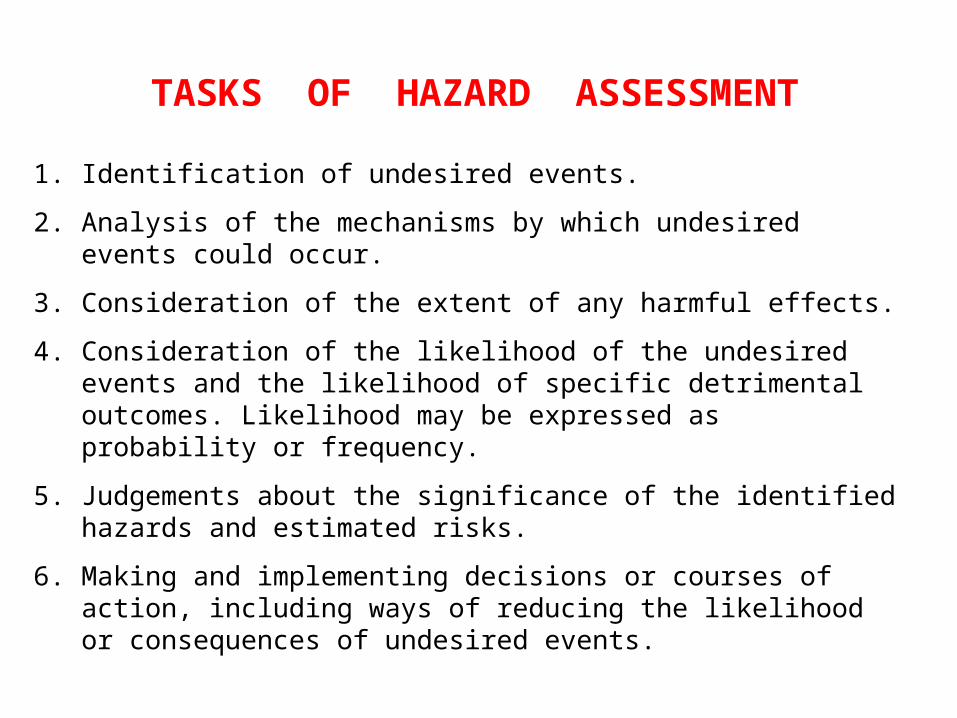
TASKS OF HAZARD ASSESSMENT
1. Identification of undesired events.
2. Analysis of the mechanisms by which undesired events could occur.
3. Consideration of the extent of any harmful effects.
4. Consideration of the likelihood of the undesired events and the likelihood of specific detrimental outcomes. Likelihood may be expressed as probability or frequency.
5. Judgements about the significance of the identified hazards and estimated risks.
6. Making and implementing decisions or courses of action, including ways of reducing the likelihood or consequences of undesired events.
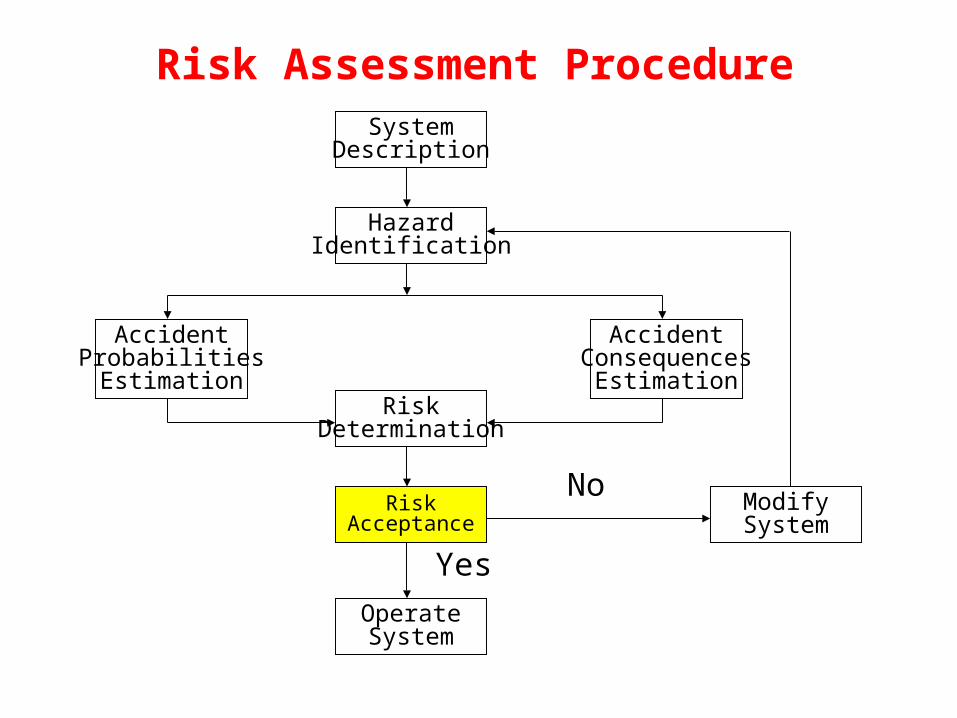
Risk Assessment ProcedureSystem
Description
HazardIdentification
AccidentProbabilitiesEstimation
RiskDetermination
RiskAcceptance
ModifySystem
OperateSystem
AccidentConsequences
Estimation
No
Yes

“hazard”, “risk”, “safety” + “analysis”, “assessment”“evalution” = ?
Hazard identification = (1) + (2)
Hazard Analysis = (1) + (2) + (3) + (4) qualitative
Risk Analysis = (1) + (2) + (3) + (4) quantitative
(Hazard Assessment) or (Hazard Evaluation) = (1) + (2) + (3) + (4) + (5) + (6) qualitative
Risk Assessment = (1) + (2) + (3) + (4) + (5) + (6) quantitative

Hazard Identification and Assessment
Hazard Identificationthe techniques for finding out what hazards are present in a plant or process.
Hazard Assessmentthe techniques for deciding how far we ought to go in removing the hazards or protecting people from them.

Results of Hazard Identification and Assessment
• Identification and description of hazards which could lead to undesirable consequences.
• Identification and description of the mechanisms leading to the hazardous event, i. e. accident event sequence.
• A qualitative estimate of the likelihood and/or consequence of each accident event sequence.
• A quantitative estimate of risk, which can be compared with “acceptable risk” to determine whether or not expenditure on particular safety measure is justified.
• A relative ranking of the risk of each hazard and accident event sequence.
• Some suggested approaches to risk reduction.

Possible Actions to Reduce Risk
• A change in the physical design and control system.
• A change in the operating procedure.
• A change in process configuration or conditions.
• A change in the process material.
• A change in the testing, inspection/calibration and maintenance procedure of key safety items.
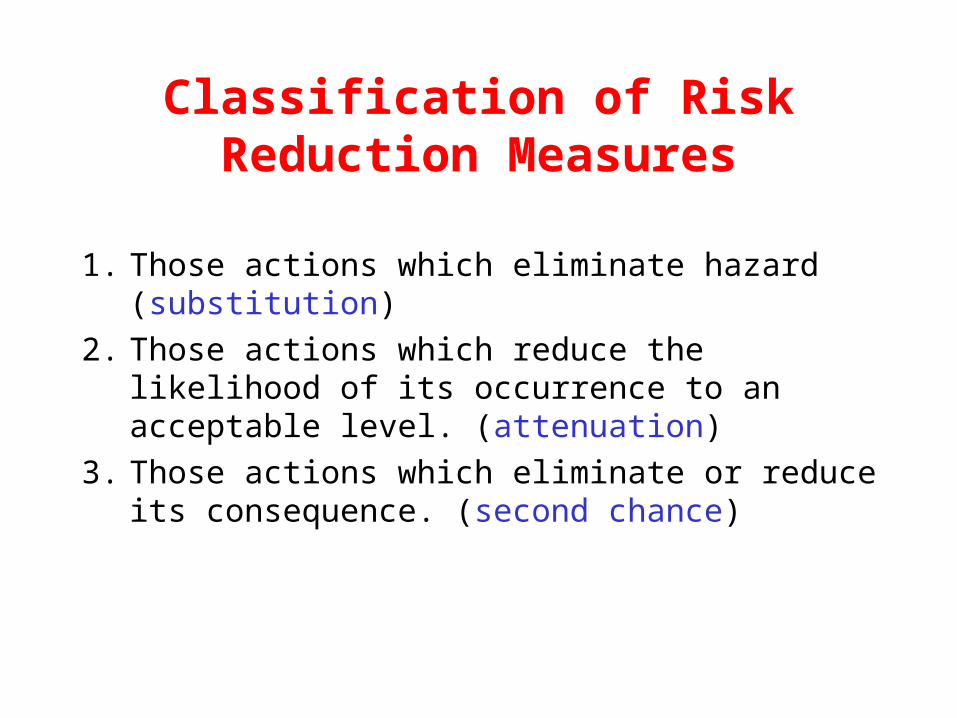
Classification of Risk Reduction Measures
1. Those actions which eliminate hazard (substitution)
2. Those actions which reduce the likelihood of its occurrence to an acceptable level. (attenuation)
3. Those actions which eliminate or reduce its consequence. (second chance)

[Example] Consider a reaction vessel where, in a HAZOP session, it was discovered that if a certain impurity were introduced with one of the raw materials, there would be a sudden evolution of gas and an increase in pressure.
• Solution – Eliminating the possibility of gas evolution by
changing the raw material responsible for the problem. (substitution)
– Lowering the possibility of gas evolution by altering one of the process condition. (attenuation)
– Fitting an appropriate pressure relief valve and vent system to protect the plant. (second chance)

MATRIX RELATING HAZARD EVALUATION PROCEDURES TO HAZARD EVALUATION PROCESS STEPS (upper left)
Steps inHazard
EvaluationProcess
Hazard Evaluation procedures Process/ Relative Preliminary System Safety Ranking Hazard “What If”Checklists Review Dow & Mond Analysis Method
Identify DeviationsFrom Good Practice
Identify Hazards
Estimate “WorstCase” Consequences
Primary Primary PrimaryPurpose Purpose Purpose
Primary Primary Primary Primary PrimaryPurpose* Purpose* Purpose* Purpose Purpose
Primary Primary Purpose Purpose
IdentifyOpportunities toReduce Consequences
Identify AccidentInitiating Events
Estimate Probabilitiesof Initiating Events
Primary Secondary Purpose Purpose
Primary Purpose
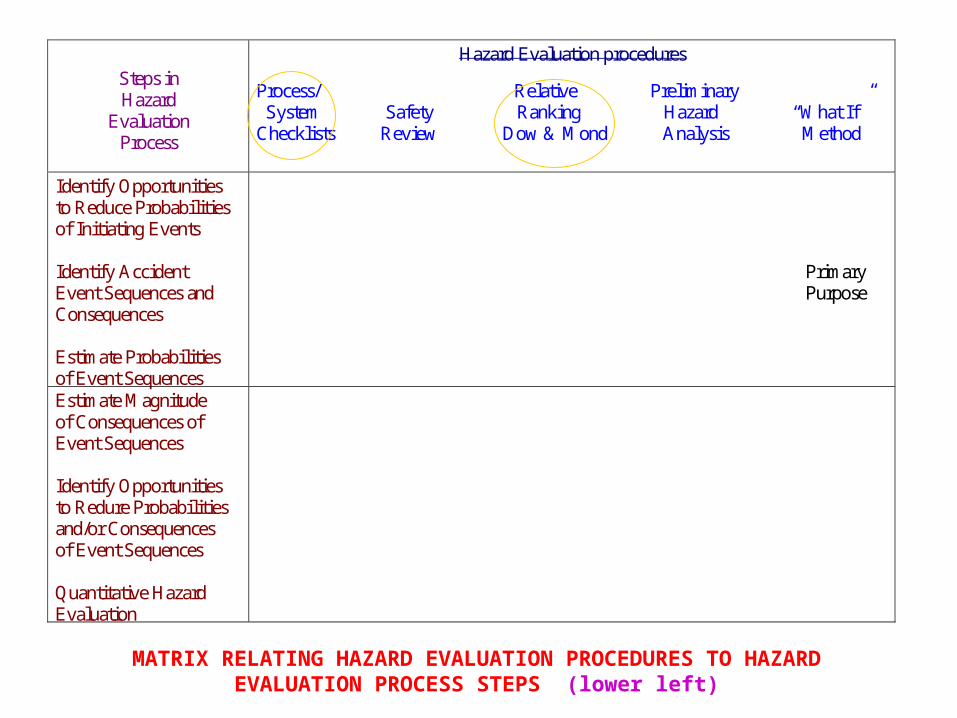
MATRIX RELATING HAZARD EVALUATION PROCEDURES TO HAZARD EVALUATION PROCESS STEPS (lower left)
Steps inHazard
EvaluationProcess
Hazard Evaluation procedures Process/ Relative Preliminary System Safety Ranking Hazard “What If”Checklists Review Dow & Mond Analysis Method
Identify Opportunitiesto Reduce Probabilitiesof Initiating Events
Identify AccidentEvent Sequences andConsequences
Estimate Probabilitiesof Event Sequences
Primary Purpose
Estimate Magnitudeof Consequences ofEvent Sequences
Identify Opportunitiesto Redure Probabilitiesand/or Consequencesof Event Sequences
Quantitative HazardEvaluation

MATRIX RELATING HAZARD EVALUATION PROCEDURES TO HAZARD EVALUATION PROCESS STEPS (upper right)
Steps in Hazard
Evaluation Process
Hazard Evaluation procedures Failure Modes
Hazard and Effects and Fault Event Cause Human Operability Criticality Tree Tree Consequence Error Study Analysis Analysis Analysis Analysis Analysis
Identify Deviations From Good Practice
Identify Hazards
Estimate “Worst Case” Consequences
Primary Primary Provides Purpose Purpose Context Only Provides Primary Context Purpose Only
Identify Opportunities to Reduce Consequences Identify Accident Initiating Events Estimate Probabilities of Initiating Events
Provides Provides Context Context Only Only Primary Primary Primary Primary Purpose Purpose Purpose Purpose Provides Provides Context Context Primary Primary Primary Only Only Purpose Purpose Purpose
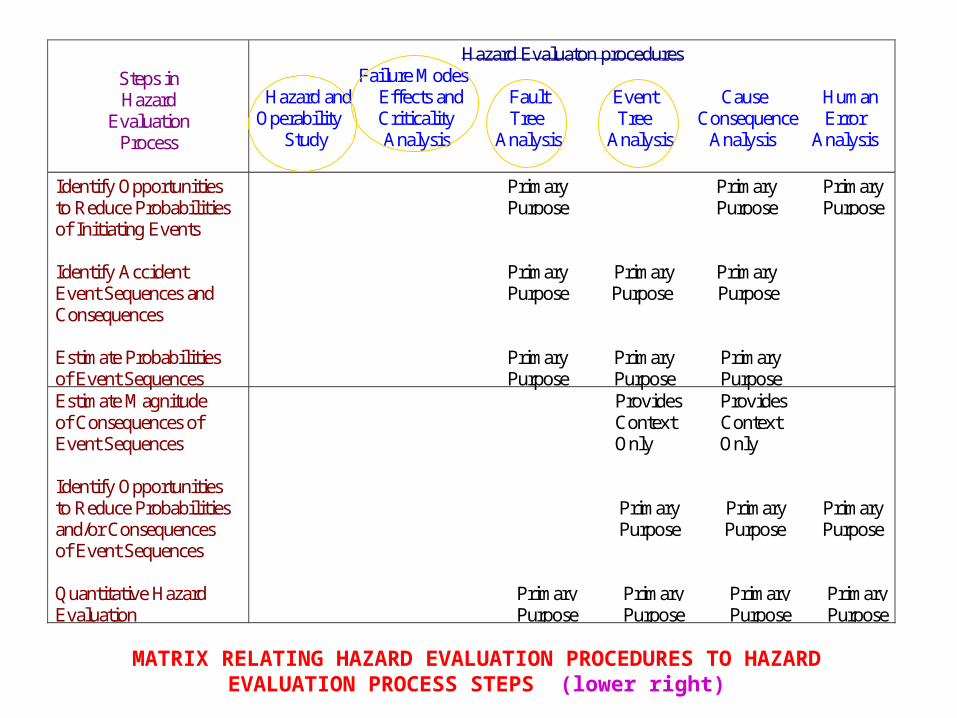
MATRIX RELATING HAZARD EVALUATION PROCEDURES TO HAZARD EVALUATION PROCESS STEPS (lower right)
Steps inHazard
EvaluationProcess
Hazard Evaluaton procedures Failure Modes Hazard and Effects and Fault Event Cause HumanOperability Criticality Tree Tree Consequence Error Study Analysis Analysis Analysis Analysis Analysis
Identify Opportunitiesto Reduce Probabilitiesof Initiating Events
Identify AccidentEvent Sequences andConsequences
Estimate Probabilitiesof Event Sequences
Primary Primary Primary Purpose Purpose Purpose
Primary Primary Primary Purpose Purpose Purpose
Primary Primary Primary Purpose Purpose Purpose
Estimate Magnitudeof Consequences ofEvent Sequences
Identify Opportunitiesto Reduce Probabilitiesand/or Consequencesof Event Sequences
Quantitative HazardEvaluation
Provides Provides Context Context Only Only
Primary Primary Primary Purpose Purpose Purpose
Primary Primary Primary Primary Purpose Purpose Purpose Purpose

What is “acceptable” risk?
“Acceptable” Risk
Most treatment of acceptable risk deal primarily with the riskof death. This may appear somewhat arbitrary. But there is justification for this approach:
• Data on fatalities are most possibly recorded and are relatively straightforward.
• (number of fatalities) (number of other injuries)
• measures which reduce death from a particular hazard tend to reduce injuries as well.

Computation of Risk
n
iiii
n
iii
fPNN
fxN
r
1
1
1
1
where,fi = the rate at which the event occurs (event/year)xi = number of fatalities per event i (death/event)Ni = number of peoples exposed to event i (number of exposed peoples/event)Pi = the probability of fatalities among the exposed people (death/exposed people)N = total number of peoples at risk

Fatal Accident Frequency Rate (FAFR)
)hours exposed ()men(10
fatalitiesFAFR
8
8Total number of deaths due to accidents 10
Total number of workers Average total working hours in a specified period
* Based on the total working hours of 1000 employees (2000 hr/year and 50 year/person).

Table 9.2 Fatal Accident Rates in different industries and jobs in the U.K.
Fatal Accident Rate (FAR)
(deaths/108 exposed hours)
Clothing and footwear industry 0.15 Vehicle industry 1.3 Chemical industry 3.5(a)
British industry 4 Steel industry 8 Agricultural work 10 Fishing 35 Coal mining 40(b)
Railway shunting 45 Construction work 67 Air crew 250 Professional boxers 7000 Jockeys (flat racing) 50000
(a). This value of the FAR for the chemical industry predates Flixborough. If the Flixborough fatalities are averaged over 10 years the value becomes 5. (b). This value is now appreciably less. Sources: Sowby (1964), Pochin (1975), Kletz (1971,1976d)

Table 9.3 Fatal Accident Rates for the chemical industry in different contries
Fatal Accident Rate (FAR)
(deaths/108 exposed hours)
France 8.5
West Germany 5
United Kingdom (before Flixborough) 4
(including Flixborough) 5
United States 5
Sources: Sowby (1964), Pochin (1975), Kletz (1971,1976d)

Table 9.4 Fatal Accident Rates for some non-industrial activities
Fatal Accident Rate (FAR)
(deaths/108 exposed hours)
Staying at home 3
Travelling: by bus 3 by train 5 by car 57 by bicycle 96 by air 240 by moped 260 by motor scooter 310 by motor cycle 660 Canoeing 1000 Rock climbing 4000
Sources: Sowby (1964), Pochin (1975), Kletz (1971,1976d)

Maximum Risk to Employees
(Kletz, 1986)
(U.S.)
0.4~5.3max FAFR
0.5max FAFR

Fatality Rate per Person per Year
(unrelated to work
Annual death toll
ing hour)
due to a common cause
Total number of individuals in a population
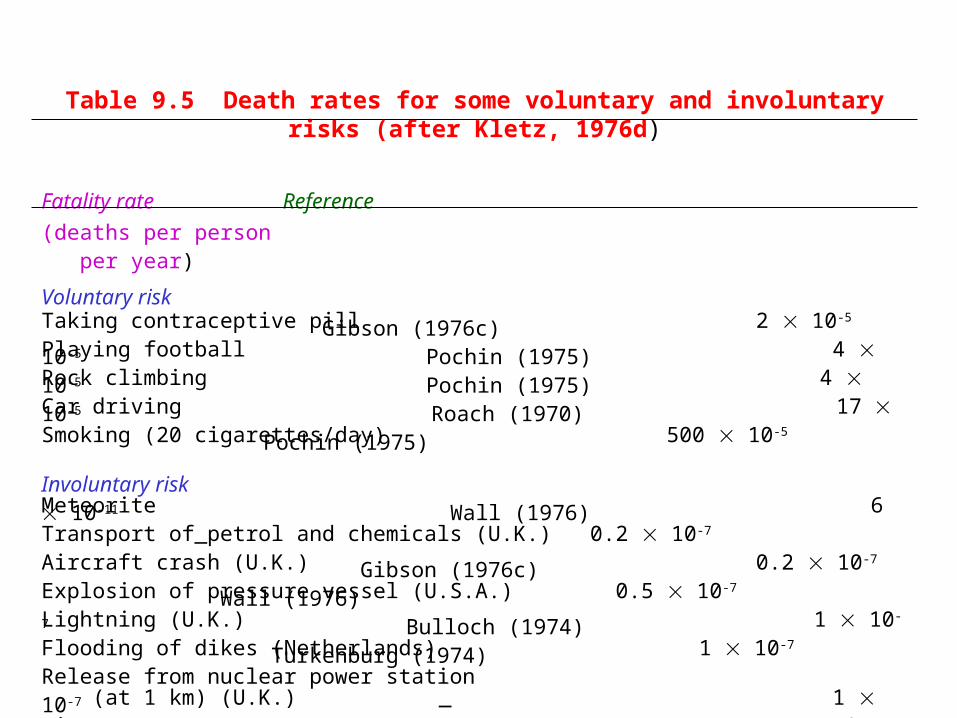
Table 9.5 Death rates for some voluntary and involuntary risks (after Kletz, 1976d)
Fatality rate Reference (deaths per person per year)
Voluntary riskTaking contraceptive pill 2 10-5 Gibson (1976c)Playing football 4 10-5 Pochin (1975)Rock climbing 4 10-5 Pochin (1975)Car driving 17 10-5 Roach (1970)Smoking (20 cigarettes/day) 500 10-5 Pochin (1975)
Involuntary riskMeteorite 6 10-11 Wall (1976)Transport of petrol and chemicals (U.K.) 0.2 10-7 —Aircraft crash (U.K.) 0.2 10-7 Gibson (1976c)Explosion of pressure vessel (U.S.A.) 0.5 10-7 Wall (1976)Lightning (U.K.) 1 10-7 Bulloch (1974)Flooding of dikes (Netherlands) 1 10-7 Turkenburg (1974)Release from nuclear power station (at 1 km) (U.K.) 1 10-7 —Fire (U.K.) 150 10-7 Melinek (BRE 1974 CP 88/74)Run over by road vehicle 600 10-7 —Leukemia 800 10-7 Gibson (1976c)

“Acceptable” Risk to Public
Voluntary: 10-5/person/year
Involuntarily: Natural Disaster 10-5/person/year Man-made 10-7/person/year
Maximum Risk to Public (Kletz)
Averaged over the whole population (average risk) 10-7/person/year
For anyone in public (individual risk) 10-5 to 10-6/person/year

OSHA Incidence Rate
• OSHA Incidence Rate (injury or sickness)
• OSHA Incidence Rate (loss of work days)
• Based on the total working hours of 100 employees in 1 year (2000 hr/year).
= (total number of injuries/sicknesses ) ÷
(total working hours of all employees) × 200,000
= (total number of lost work days)÷
(total working hours of all employees) × 200,000