deep-sea research i - welcome to epicepic.awi.de/40649/1/ryan_at_al_2016.pdf · production and...
TRANSCRIPT
Deep-Sea Research I 107 (2016) 70–81
Contents lists available at ScienceDirect
Deep-Sea Research I
http://d0967-06
Abbrerent; ADOcean SWater;Shelf WDeep WvironmeSoutherSourceWater;Weddel
n CorrE-m
michaelralph.tim
journal homepage: www.elsevier.com/locate/dsri
On the warm inflow at the eastern boundary of the Weddell Gyre
S. Ryan a,n, M. Schröder a, O. Huhn b, R. Timmermann a
a Alfred Wegener Institute, Bussestrasse 24 D-27570 Bremerhaven, Germanyb Institute of Environmental Physics (IUP), University of Bremen, Germany
a r t i c l e i n f o
Available online 2 December 2015
Keywords:Eastern boundaryWeddell GyreWarm Deep WaterCircumpolar Deep WaterGreenwich MeridianOptimum Multiparameter Analysis
x.doi.org/10.1016/j.dsr.2015.11.00237/& 2015 Elsevier Ltd. All rights reserved.
viations: AABW, Antarctic Bottom Water; ACCCP, Acoustic Doppler Current Profiler; BRIOSimulations; CARS, CSIRO Atlas of Regional SeaCFC, Chlorofluorocarbon; GM, Greenwich merater; LCDW, Lower Circumpolar Deep Water;ater; NADW, North Atlantic Deep Water; NCEntal Prediction; OMP, Optimum Multiparamen ACC Front; SAM, Southern Annular Mode; SWater Types; UCDW, Upper Circumpolar DeepWG, Weddell Gyre; WOCE, World Ocean Circul Sea Bottom Water; WSDW, Weddell Sea Deeesponding author.ail addresses: [email protected] (S. Ryan),[email protected] (M. Schröder), ohuhn@[email protected] (R. Timmermann).
a b s t r a c t
The Weddell Sea plays an important role for the global oceans and climate by being one of the biggestproduction and export areas of Antarctic Bottom Water (AABW). Circumpolar Deep Water (CDW) entersthe Weddell Gyre (WG) at its eastern boundary. Then called Warm Deep Water (WDW), it is a majorcontributor to the formation of deep and bottom waters due to ocean-ice shelf interactions in thesouthern and soutwestern Weddell Sea. Hydrographic data collected between 0 and 30°E on the RVPolarstern cruise ANT XX/2 reveals a two-core structure for the eastern inflow of warm water at roughly20°E but not further downstream at the Greenwich meridian (GM). Model results and climatologicalfields suggest that the two cores represent two separate modes of warm inflow. One mode is driven byeddy mixing in the northeastern corner of the WG and the other one is an advective mode, forming thesouthern branch of the inflow which extends beyond 30°E before turning westward. Both pathways arelikely to carry waters from different origins within the Antarctic Circumpolar Current ACC, where moreventilated CDW is found at the Southern Boundary SB compared to the centre. The southern route showsconsiderable interannual variability in the model. A variable inflow of two types of CDW together withadmixed recirculated and cooler waters from the Weddell Sea can potentially contribute to the observedvariability and warming trend of WDW over the last decade at the GM.
& 2015 Elsevier Ltd. All rights reserved.
1. Introduction
The oceanic meridional overturning circulation plays an im-portant role in the global climate system by transporting heat, salt,and other properties around the globe. The Weddell Sea con-tributes to this circulation by producing and exporting AntarcticBottom Water (AABW) (Carmack, 1977; Orsi et al., 1999), which isthe coldest and most voluminous water mass in the world oceans.Johnson (2008) suggests that the total volume of AABW is abouttwice as much as that of the North Atlantic Deep Water (NADW).Although many studies in the past have revised the contribution of
, Antarctic Circumpolar Cur-, Bremerhaven Regional Ices; CDW, Circumpolar Deepidian; HSSW, High SalinitymWDW, modified WarmP, National Centers for En-ter; PF, Polar Front; SACCF,B, Southern Boundary; SWT,Water; WDW, Warm Deeplation Experiment; WSBW,p Water.
-bremen.de (O. Huhn),
the Weddell Sea to the total AABW formation, it is still regarded asa major source region by contributing roughly 40%, followed byinputs from the Ross Sea, Adélie Land and Cape Darnely (Meredith,2013).
A schematic of the circulation in the Weddell Sea and the ad-jacent Southern Ocean is shown in Fig. 1. The Weddell Gyre (WG)is a mainly wind-driven, cyclonic ocean gyre. The northern borderis given by the Antarctic Circumpolar Current (ACC) which flowscompletely around Antarctica. Within the ACC, several oceanicfronts (light grey lines in Fig. 1) are known and are associated withsharp gradients in the isopycnals which are generally rising to-wards Antarctica (Deacon, 1937). For a detailed description ofoceanic fronts in the Southern Ocean the reader is referred to Orsiet al. (1995). The WG boundaries are predominantly specified bytopography, except in the east, where intense water mass ex-changes between the gyre and the ACC take place (Schröder andFahrbach, 1999; Gouretski and Danilov, 1993). Warm and salinewater is injected at the eastern boundary (marked in yellow) ori-ginating from Circumpolar Deep Water (CDW) (Orsi et al., 1993;Deacon, 1979; Gouretski and Danilov, 1994), which is called WarmDeep Water (WDW) once entering the WG. Along its way in thegyre, WDW is modified by upwelling into and mixing with thesurface layer to compensate the heat loss at the surface. This watermass, then called modified Warm Deep Water (mWDW) (reddotted line), makes its way to the southern Weddell Sea crossing
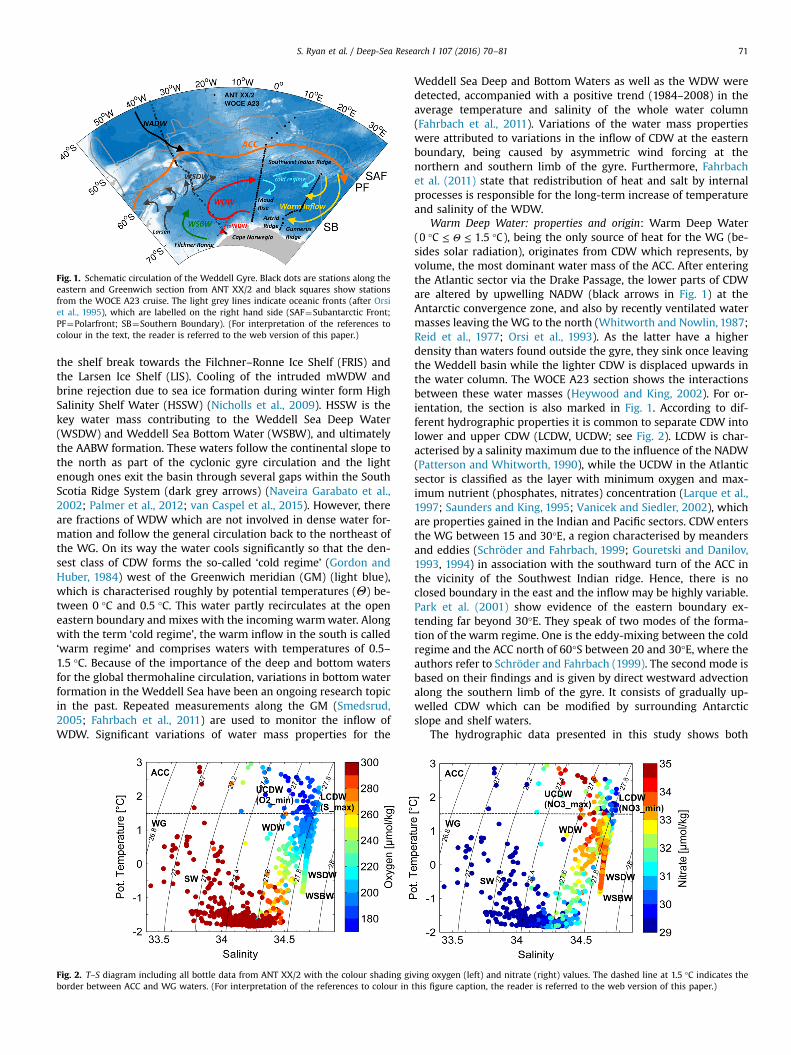
Fig. 1. Schematic circulation of the Weddell Gyre. Black dots are stations along theeastern and Greenwich section from ANT XX/2 and black squares show stationsfrom the WOCE A23 cruise. The light grey lines indicate oceanic fronts (after Orsiet al., 1995), which are labelled on the right hand side (SAF¼Subantarctic Front;PF¼Polarfront; SB¼Southern Boundary). (For interpretation of the references tocolour in the text, the reader is referred to the web version of this paper.)
S. Ryan et al. / Deep-Sea Research I 107 (2016) 70–81 71
the shelf break towards the Filchner–Ronne Ice Shelf (FRIS) andthe Larsen Ice Shelf (LIS). Cooling of the intruded mWDW andbrine rejection due to sea ice formation during winter form HighSalinity Shelf Water (HSSW) (Nicholls et al., 2009). HSSW is thekey water mass contributing to the Weddell Sea Deep Water(WSDW) and Weddell Sea Bottom Water (WSBW), and ultimatelythe AABW formation. These waters follow the continental slope tothe north as part of the cyclonic gyre circulation and the lightenough ones exit the basin through several gaps within the SouthScotia Ridge System (dark grey arrows) (Naveira Garabato et al.,2002; Palmer et al., 2012; van Caspel et al., 2015). However, thereare fractions of WDW which are not involved in dense water for-mation and follow the general circulation back to the northeast ofthe WG. On its way the water cools significantly so that the den-sest class of CDW forms the so-called ‘cold regime’ (Gordon andHuber, 1984) west of the Greenwich meridian (GM) (light blue),which is characterised roughly by potential temperatures (Θ) be-tween 0 °C and 0.5 °C. This water partly recirculates at the openeastern boundary and mixes with the incoming warmwater. Alongwith the term ‘cold regime’, the warm inflow in the south is called‘warm regime’ and comprises waters with temperatures of 0.5–1.5 °C. Because of the importance of the deep and bottom watersfor the global thermohaline circulation, variations in bottom waterformation in the Weddell Sea have been an ongoing research topicin the past. Repeated measurements along the GM (Smedsrud,2005; Fahrbach et al., 2011) are used to monitor the inflow ofWDW. Significant variations of water mass properties for the
Fig. 2. T–S diagram including all bottle data from ANT XX/2 with the colour shading giborder between ACC and WG waters. (For interpretation of the references to colour in
Weddell Sea Deep and Bottom Waters as well as the WDW weredetected, accompanied with a positive trend (1984–2008) in theaverage temperature and salinity of the whole water column(Fahrbach et al., 2011). Variations of the water mass propertieswere attributed to variations in the inflow of CDW at the easternboundary, being caused by asymmetric wind forcing at thenorthern and southern limb of the gyre. Furthermore, Fahrbachet al. (2011) state that redistribution of heat and salt by internalprocesses is responsible for the long-term increase of temperatureand salinity of the WDW.
Warm Deep Water: properties and origin: Warm Deep Water( Θ° ≤ ≤ °0 C 1.5 C), being the only source of heat for the WG (be-sides solar radiation), originates from CDW which represents, byvolume, the most dominant water mass of the ACC. After enteringthe Atlantic sector via the Drake Passage, the lower parts of CDWare altered by upwelling NADW (black arrows in Fig. 1) at theAntarctic convergence zone, and also by recently ventilated watermasses leaving the WG to the north (Whitworth and Nowlin, 1987;Reid et al., 1977; Orsi et al., 1993). As the latter have a higherdensity than waters found outside the gyre, they sink once leavingthe Weddell basin while the lighter CDW is displaced upwards inthe water column. The WOCE A23 section shows the interactionsbetween these water masses (Heywood and King, 2002). For or-ientation, the section is also marked in Fig. 1. According to dif-ferent hydrographic properties it is common to separate CDW intolower and upper CDW (LCDW, UCDW; see Fig. 2). LCDW is char-acterised by a salinity maximum due to the influence of the NADW(Patterson and Whitworth, 1990), while the UCDW in the Atlanticsector is classified as the layer with minimum oxygen and max-imum nutrient (phosphates, nitrates) concentration (Larque et al.,1997; Saunders and King, 1995; Vanicek and Siedler, 2002), whichare properties gained in the Indian and Pacific sectors. CDW entersthe WG between °15 and 30 E, a region characterised by meandersand eddies (Schröder and Fahrbach, 1999; Gouretski and Danilov,1993, 1994) in association with the southward turn of the ACC inthe vicinity of the Southwest Indian ridge. Hence, there is noclosed boundary in the east and the inflow may be highly variable.Park et al. (2001) show evidence of the eastern boundary ex-tending far beyond 30°E. They speak of two modes of the forma-tion of the warm regime. One is the eddy-mixing between the coldregime and the ACC north of 60°S between 20 and 30°E, where theauthors refer to Schröder and Fahrbach (1999). The second mode isbased on their findings and is given by direct westward advectionalong the southern limb of the gyre. It consists of gradually up-welled CDW which can be modified by surrounding Antarcticslope and shelf waters.
The hydrographic data presented in this study shows both
ving oxygen (left) and nitrate (right) values. The dashed line at 1.5 °C indicates thethis figure caption, the reader is referred to the web version of this paper.)

Table 1Source water type definitions plus the according weight used for the OMP analysisand the limits chosen for the Monte Carlo approach.
SWT Θ [° ]C [ ]S psu [μ ]O mol/kg2 [μ ]NO mol/kg3
Smax at SB (SWT1) 1.68 34.74 192 30.24O2-min at SB (SWT2) 1.66 34.64 174.21 33.5WDW cold regime (SWT3) 0.43 34.69 194 34.8Mixed layer (SWT4) �0.7 34.3 325.53 29.55Weight 1 1 0.3 0.3Limit 70.1 70.05 75 70.75
S. Ryan et al. / Deep-Sea Research I 107 (2016) 70–8172
modes combined in one section located at the eastern boundary ofthe WG. Two maximum potential temperature cores reveal dif-ferent ventilation signals. The presence of two modes is supportedby model results. We discuss the dynamics which set up these twomodes and perform an Optimum Multiparameter (OMP) analysisto gain more insight on the origin of the cores within the ACC.
2. Data and methods
2.1. Observational data
The hydrographic data set used was obtained during the ANTXX/2 RV Polarstern cruise taking place from 24 November 2002 to23 January 2003 (Fütterer and Kattner, 2005; Schröder and Wi-sotzki, 2010). In total, 143 stations were sampled along threetransects, from which only two are analysed in this study. Onebeing located along the GM between 52°S and the continent,which was fully covered by ice and one eastern transect centredaround 20°E, between 54°S and the coast (Fig. 1). The main focus ison the eastern transect as it is located at the eastern boundary ofthe WG, where in situ measurements are rare. Some sea ice wasstill remaining in the south, while the northern part was ice free(Bakker et al., 2008). Vertical profiles of temperature and salinitywere obtained from a SBE 911þ CTD (conductivity–temperature–depth) sonde with a sampling frequency of 24 Hz. The sonde wasmounted on a rosette with 24 Niskin bottles with a capacity of 12 leach. Additional sensors such as one oxygen sensor were attached.
Calibrations of the conductivity and temperature sensors wereobtained by Seabird Electronics before and after the cruise. Theconductivity was corrected by salinity measurements from watersamples performed with the Guildline Precision Salinometer(OPS). The resulting accuracy is at least 0.003 for salinity, 0.003 °Cfor temperature, and 2 db for pressure. Data from the oxygensensor was corrected by oxygen values from water samples mea-sured via the Winkler method with a Dissolved Oxygen Analyser.
Additional water samples were taken to obtain Chloro-fluorocarbon (CFC) concentrations, which serve as an anthro-pogenic tracer. The samples were flame-sealed on board andanalysed after the cruise with a gas chromatograph. Nutrientconcentrations were also drawn from water samples by using aTechnicon autoanalyser II.
Since the inflow of CDW/WDW is confined to the upper1000 m, we choose to limit our analysis to this depth range, whichcoincides roughly with the 0.5 °C isotherm in the southeasternWG.
2.2. Model analysis
The circumpolar ice-ocean model Bremerhaven Regional IceOcean Simulations (BRIOS) (Timmermann et al., 2002) has beenused to investigate the variability of the eastern boundary of theWG and possible inflow patterns. The model is run on a cir-cumpolar grid which covers the Southern Ocean south of 50°S
with a horizontal resolution of 1.5° in the zonal and ϕ°1.5 cos inthe meridional direction, with ϕ being the latitude. The verticaldomain is split into 24 layers with a higher resolution at thebottom and the surface. All major Antarctic ice shelves are in-cluded. The simulations were forced with reanalysis data from theNational Centers for Environmental Prediction (NCEP) for the1958–2014 period.
2.3. Optimum multiparameter analysis
The OMP (Tomczak, 1981; Tomczak and Large, 1989; Huhnet al., 2008) is a method to quantify the fractions fi of definedSource Water Types (SWT) with characteristic properties Xi whichmix and form the observed characteristics Xobs at a certain datapoint. This data point must lie downstream of the formation re-gion of the SWTs. A further requirement is mass conservation(∑ = )f 1i . The number of SWT must be equal to or better smallerthan the number of conservative properties plus one, to avoidunder-determination of the equation system.
∑= ( )X f X 1i iobs
By inverting the linear system (Eq. (1)) in a least-squares sense, theoptimal combination of SWT fractions fi is obtained. The equationis normalised by the mean and variance of each SWT and eachparameter is weighted (see Table 1) to account for uncertainties.Residuals between the computed and observed properties areused as a skill measure for the conducted OMP. In this study po-tential temperature, salinity, oxygen, and nitrate are used asproperties. Although biological activity can influence oxygen andnutrient concentrations, the influence on our data is neglectedhere as the defined SWTs are limited to small oxygen valuescompared to surface values. The choice of the SWTs is difficult inour case as no typical water masses with fixed definitions can beused, which will be dealt with in Section 3.4.
3. Results
3.1. Hydrographic observations
Eastern boundary: Fig. 3 shows potential temperature (top) andoxygen (bottom) of the upper 1000 m along the eastern section ofANT XX/2. A clear structure can be seen below the thermoclinewhich separates the cold northern branch of the WG from thewarmer ACC (∼55°S). Within the gyre, the warm inflow(Θ > °0.8 C) is found south of roughly 59 °S being in agreementwith other hydrographic sections at 20°E (Orsi et al., 1993; Huberet al., 1981). Cooler temperatures around 0.5 °C are found in thenorthern limb of the gyre which are recirculating remnants of coldregime waters. This cooler part is characterised by doming iso-pycnals (grey lines). In the warm regime a shoaling of isopycnalscauses upwelling of WDW. The WDW reveals a striking two-corestructure with maximum temperatures located at 60°S around300 m depth (Θ ≈ °1.5 C) and a second larger core centred around65°S which is shallower (200 m depth) with a temperature over1.3 °C. For convenience we call the core at 60°S ‘core 1’ (C1) andthe core further south ‘core 2’ (C2). The shape of the density lineswithin core 1 indicate the presence of an anticyclonic eddy, whichis also seen in geostrophic velocities (not shown). A second warmcore eddy is found further north in the cold regime (58°S) with amaximum potential temperature around 0.6°C. The oxygen section(Fig. 3, bottom) generally shows low values (< μ200 mol/kg) for thewarm inflow, being derived from CDW. Minimum values (withinthe gyre) coincide with core 2 with < μO 190 mol/kg2 , while core1 shows higher values, close to μ200 mol/kg. Within the cold
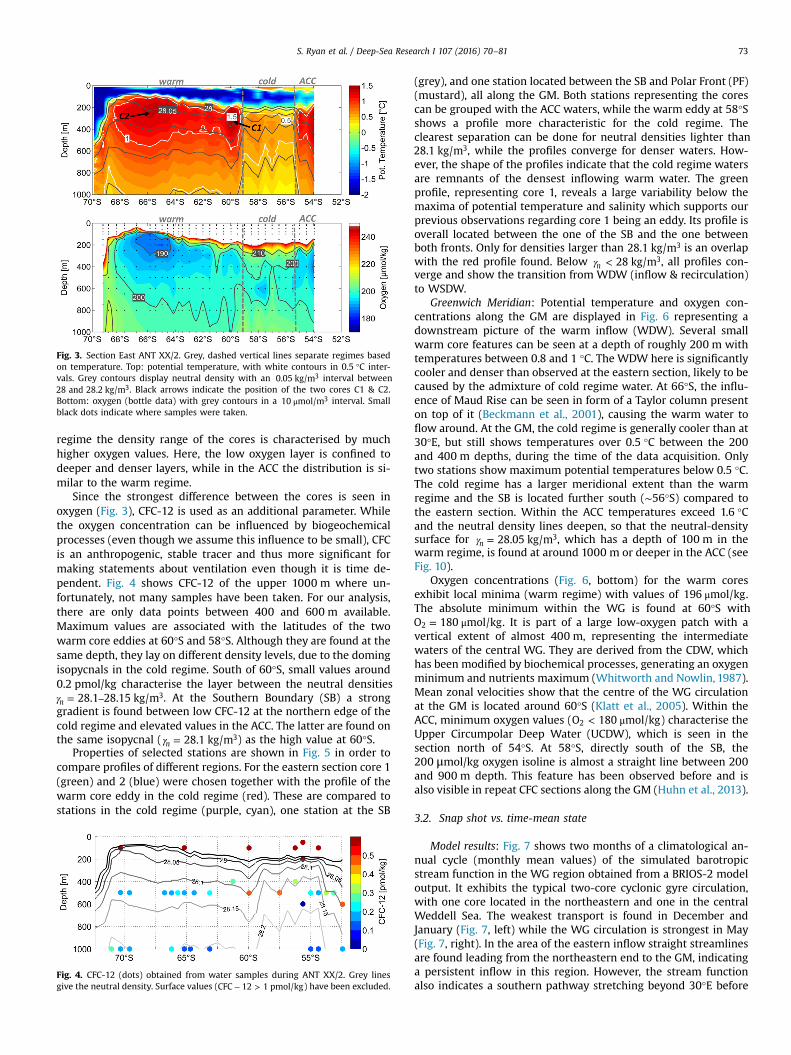
Fig. 3. Section East ANT XX/2. Grey, dashed vertical lines separate regimes basedon temperature. Top: potential temperature, with white contours in 0.5 °C inter-vals. Grey contours display neutral density with an 0.05 kg/m3 interval between28 and 28.2 kg/m3. Black arrows indicate the position of the two cores C1 & C2.Bottom: oxygen (bottle data) with grey contours in a μ10 mol/m3 interval. Smallblack dots indicate where samples were taken.
S. Ryan et al. / Deep-Sea Research I 107 (2016) 70–81 73
regime the density range of the cores is characterised by muchhigher oxygen values. Here, the low oxygen layer is confined todeeper and denser layers, while in the ACC the distribution is si-milar to the warm regime.
Since the strongest difference between the cores is seen inoxygen (Fig. 3), CFC-12 is used as an additional parameter. Whilethe oxygen concentration can be influenced by biogeochemicalprocesses (even though we assume this influence to be small), CFCis an anthropogenic, stable tracer and thus more significant formaking statements about ventilation even though it is time de-pendent. Fig. 4 shows CFC-12 of the upper 1000 m where un-fortunately, not many samples have been taken. For our analysis,there are only data points between 400 and 600 m available.Maximum values are associated with the latitudes of the twowarm core eddies at 60°S and 58°S. Although they are found at thesame depth, they lay on different density levels, due to the domingisopycnals in the cold regime. South of 60°S, small values around0.2 pmol/kg characterise the layer between the neutral densitiesγ = –28.1 28.15 kg/mn
3. At the Southern Boundary (SB) a stronggradient is found between low CFC-12 at the northern edge of thecold regime and elevated values in the ACC. The latter are found onthe same isopycnal (γ = 28.1 kg/mn
3) as the high value at 60°S.Properties of selected stations are shown in Fig. 5 in order to
compare profiles of different regions. For the eastern section core 1(green) and 2 (blue) were chosen together with the profile of thewarm core eddy in the cold regime (red). These are compared tostations in the cold regime (purple, cyan), one station at the SB
Fig. 4. CFC-12 (dots) obtained from water samples during ANT XX/2. Grey linesgive the neutral density. Surface values ( − >CFC 12 1 pmol/kg) have been excluded.
(grey), and one station located between the SB and Polar Front (PF)(mustard), all along the GM. Both stations representing the corescan be grouped with the ACC waters, while the warm eddy at 58°Sshows a profile more characteristic for the cold regime. Theclearest separation can be done for neutral densities lighter than28.1 kg/m3, while the profiles converge for denser waters. How-ever, the shape of the profiles indicate that the cold regime watersare remnants of the densest inflowing warm water. The greenprofile, representing core 1, reveals a large variability below themaxima of potential temperature and salinity which supports ourprevious observations regarding core 1 being an eddy. Its profile isoverall located between the one of the SB and the one betweenboth fronts. Only for densities larger than 28.1 kg/m3 is an overlapwith the red profile found. Below γ < 28 kg/mn
3, all profiles con-verge and show the transition from WDW (inflow & recirculation)to WSDW.
Greenwich Meridian: Potential temperature and oxygen con-centrations along the GM are displayed in Fig. 6 representing adownstream picture of the warm inflow (WDW). Several smallwarm core features can be seen at a depth of roughly 200 m withtemperatures between 0.8 and 1 °C. The WDW here is significantlycooler and denser than observed at the eastern section, likely to becaused by the admixture of cold regime water. At 66°S, the influ-ence of Maud Rise can be seen in form of a Taylor column presenton top of it (Beckmann et al., 2001), causing the warm water toflow around. At the GM, the cold regime is generally cooler than at30°E, but still shows temperatures over 0.5 °C between the 200and 400 m depths, during the time of the data acquisition. Onlytwo stations show maximum potential temperatures below 0.5 °C.The cold regime has a larger meridional extent than the warmregime and the SB is located further south (∼56°S) compared tothe eastern section. Within the ACC temperatures exceed 1.6 °Cand the neutral density lines deepen, so that the neutral-densitysurface for γ = 28.05 kg/mn
3, which has a depth of 100 m in thewarm regime, is found at around 1000 m or deeper in the ACC (seeFig. 10).
Oxygen concentrations (Fig. 6, bottom) for the warm coresexhibit local minima (warm regime) with values of μ196 mol/kg.The absolute minimum within the WG is found at 60°S with
= μO 180 mol/kg2 . It is part of a large low-oxygen patch with avertical extent of almost 400 m, representing the intermediatewaters of the central WG. They are derived from the CDW, whichhas been modified by biochemical processes, generating an oxygenminimum and nutrients maximum (Whitworth and Nowlin, 1987).Mean zonal velocities show that the centre of the WG circulationat the GM is located around 60°S (Klatt et al., 2005). Within theACC, minimum oxygen values ( < μO 180 mol/kg2 ) characterise theUpper Circumpolar Deep Water (UCDW), which is seen in thesection north of 54°S. At 58°S, directly south of the SB, the200 μmol/kg oxygen isoline is almost a straight line between 200and 900 m depth. This feature has been observed before and isalso visible in repeat CFC sections along the GM (Huhn et al., 2013).
3.2. Snap shot vs. time-mean state
Model results: Fig. 7 shows two months of a climatological an-nual cycle (monthly mean values) of the simulated barotropicstream function in the WG region obtained from a BRIOS-2 modeloutput. It exhibits the typical two-core cyclonic gyre circulation,with one core located in the northeastern and one in the centralWeddell Sea. The weakest transport is found in December andJanuary (Fig. 7, left) while the WG circulation is strongest in May(Fig. 7, right). In the area of the eastern inflow straight streamlinesare found leading from the northeastern end to the GM, indicatinga persistent inflow in this region. However, the stream functionalso indicates a southern pathway stretching beyond 30°E before
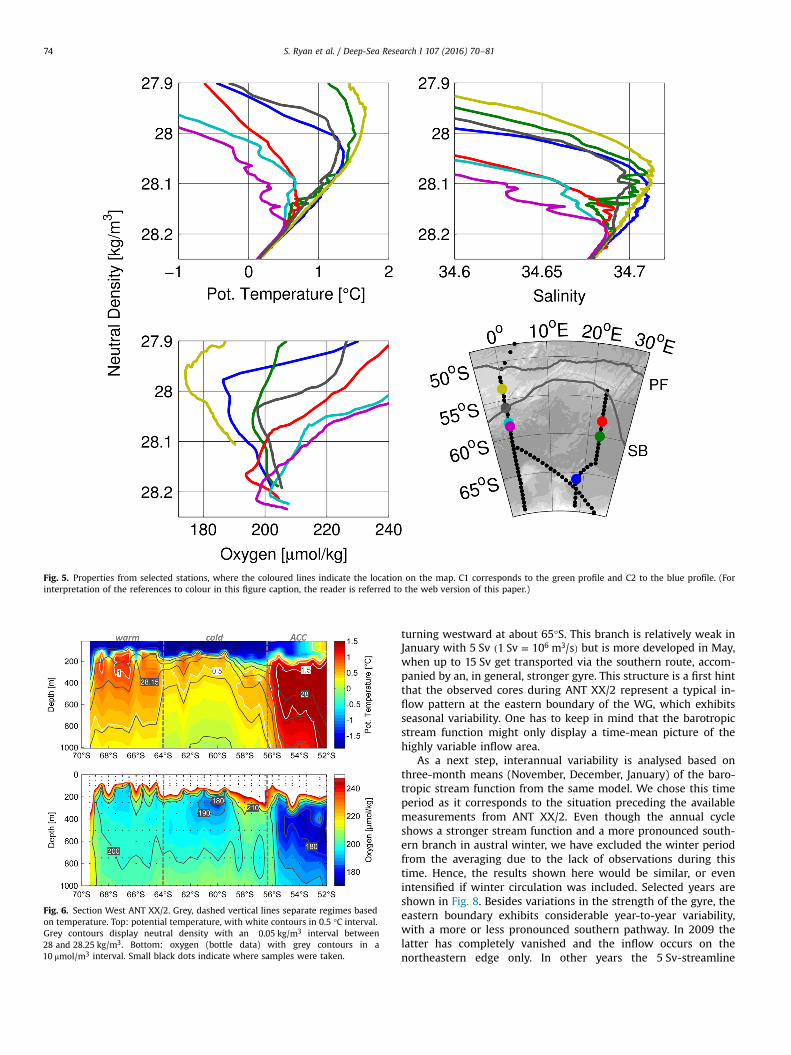
Fig. 5. Properties from selected stations, where the coloured lines indicate the location on the map. C1 corresponds to the green profile and C2 to the blue profile. (Forinterpretation of the references to colour in this figure caption, the reader is referred to the web version of this paper.)
Fig. 6. Section West ANT XX/2. Grey, dashed vertical lines separate regimes basedon temperature. Top: potential temperature, with white contours in 0.5 °C interval.Grey contours display neutral density with an 0.05 kg/m3 interval between28 and 28.25 kg/m3. Bottom: oxygen (bottle data) with grey contours in a
μ10 mol/m3 interval. Small black dots indicate where samples were taken.
S. Ryan et al. / Deep-Sea Research I 107 (2016) 70–8174
turning westward at about 65°S. This branch is relatively weak inJanuary with 5 Sv ( = )1 Sv 10 m /s6 3 but is more developed in May,when up to 15 Sv get transported via the southern route, accom-panied by an, in general, stronger gyre. This structure is a first hintthat the observed cores during ANT XX/2 represent a typical in-flow pattern at the eastern boundary of the WG, which exhibitsseasonal variability. One has to keep in mind that the barotropicstream function might only display a time-mean picture of thehighly variable inflow area.
As a next step, interannual variability is analysed based onthree-month means (November, December, January) of the baro-tropic stream function from the same model. We chose this timeperiod as it corresponds to the situation preceding the availablemeasurements from ANT XX/2. Even though the annual cycleshows a stronger stream function and a more pronounced south-ern branch in austral winter, we have excluded the winter periodfrom the averaging due to the lack of observations during thistime. Hence, the results shown here would be similar, or evenintensified if winter circulation was included. Selected years areshown in Fig. 8. Besides variations in the strength of the gyre, theeastern boundary exhibits considerable year-to-year variability,with a more or less pronounced southern pathway. In 2009 thelatter has completely vanished and the inflow occurs on thenortheastern edge only. In other years the 5 Sv-streamline

Fig. 7. Climatological (1968–2014) monthly-mean modelled stream function for January (left) and May (right). The location of the cores is marked in yellow. (For inter-pretation of the references to colour in this figure caption, the reader is referred to the web version of this paper.)
S. Ryan et al. / Deep-Sea Research I 107 (2016) 70–81 75
indicates a permanent weak inflow in the south, which can reachup to 10 Sv in some years (e.g. 1978 and 1999). The model resultsindicate that there is substantial variability causing changes in theinflow paths on a seasonal but also interannual basis, which isimportant to keep in mind for analysing variability furtherdownstream, i.e. at the GM.
To summarise, on seasonal and interannual time scales the twodifferent inflow pathways seem to be a persistent feature in theeastern WG time-mean field.
3.2.1. Hydrographic climatologyAnother option to analyse the time-mean field is looking at
hydrographic climatologies, even though they have to be viewedcarefully in an undersampled region like the eastern WG. Wechose the CSIRO Atlas of Regional Seas (CARS) argo-only clima-tology, as we believe that ARGO floats provide a better spatialcoverage of the inflow region, as ship measurements are mostlydone along specific sections only.
Fig. 9(a) shows potential temperature at 300 m depth. A broadwarm inflow can be seen at the eastern boundary, which getsnarrower during its westward propagation. However, it is im-possible to distinguish between two pathways based on thetemperature field alone. Since Park et al. (2001) pointed out twodifferent modes of the warm inflow with a turbulent eddy-dominated shorter route and a longer advective route furthersouth, we plotted the standard deviation of the climatologicaltemperature field at 300 m depth (Fig. 9(b)). The highest standarddeviation is found in the northeastern corner where the ACC turnssouthward, associated with turbulent eddy field in this region. Aband of high variability spreads south westward towards 20°E,60°S, the location where core 1 is located. What looks like a per-sistent inflow in the stream function is likely a time-mean pictureof a pathway set up by transient eddies. Further south, the stan-dard deviation seems to decrease, which would be in agreementwith an advective southern branch.
3.3. Dynamics of the eastern inflow
As mentioned in the introduction the circulation in thenortheastern corner of the WG is influenced by a gap in theSouthwest Indian ridge, causing a southward turn of the ACC. Bylaws of vorticity dynamics, both circulation (vorticity flux) andvolume are conserved as well as their ratio called potential vorti-city. The barotropic part of the circulation is assumed to follow f/H-
contours, where f is the Coriolis parameter and H the total depth.Hence, there is always competition between the magnitude ofeffects of topography and Earth's rotation on the flow. Fig. 10adisplays the f/H-contours plotted over bathymetry, which showthe strong topographic influence of the ridge including thesouthwestward turn near the gap (see red arrow), where thedepth increases. The contours agree with the inner pathway foundin the model results and trajectories. Once the flow has been de-flected to the south, moving away from the ridge, the topographiceffect will become smaller while the planetary effect will increase.The latter means that a southward displacement will introduce ananticyclonic rotation, i.e. an eastward motion which can be seen atthe nearly zonal contour at 60°S (green arrow). This pattern mightdetermine the shape of the outer pathway indicated in the modelresults and explains the anticyclonic rotation of the eddy asso-ciated with core 1. Gouretski and Danilov (1993) also find antic-yclonic motion for eddies of circumpolar origin. Towards thecontinental shelf zonal isolines are disturbed by several smallridges named, from east to west, the Gunnerus ridge, Astrid ridge,and Maud Rise (see Fig. 1). Here, westward flow (blue arrow) isassociated with the belt of easterly winds around Antarctica. Core2 must emerge from waters that turn eastward first due to po-tential vorticity conservation but then enter the region of west-ward flow near the continent. While a large part of the warmwater will proceed eastward, some will turn westward and formthe southern, advective mode, which is in agreement with apossibly low standard deviation.
Basic fluid dynamics seem to be able to describe and explainthe existence of two pathways but it is still not clear where exactlythe two observed cores obtained their properties from, i.e. wherethey originated from. As shown in Fig. 5, the cores have a neutraldensity around 28.05 kg/m3. To trace their origin in the ACC, thedepth of this neutral density surface is shown in the right panel ofFig. 10. It becomes clear that waters found as shallow as 100 m inthe WG are located at a depth between 400 m at the SB and over1000 m in the centre of the ACC. Looking at oxygen along a mer-idional section across the ACC (i.e. Figs. 3 and 6), one finds that thewaters near the transition zone of the ACC and the WG are slightlymore ventilated than further north. Orsi et al. (1999) state that atthe SB entrainment from Lower Circumpolar Deep Water (LCDW)into UCDW happens, which would diminish the oxygen minimumof UCDW. LCDW is significantly altered in the western Atlanticbasin, where it gets into contact with newly formed water massesfrom the WG, causing a higher ventilation. Also the oxygen profile

Fig. 8. Three-month-mean modelled stream function covering November, December and January for selected years. Contours are given in 5 Sv-intervals. The location of thecores is marked in yellow. (For interpretation of the references to colour in this figure caption, the reader is referred to the web version of this paper.)
S. Ryan et al. / Deep-Sea Research I 107 (2016) 70–8176
at the SB in Fig. 5 shows much higher values compared to thestation north of it. This could explain the oxygen and CFC-12 va-lues for core 1, which would mean that core 1 was formed by aneddy carrying warm waters from the SB. To shed more light on theorigin of the cores and the composition of the warm inflow ingeneral we conduct an cOMP analysis involving four SWTs.
3.4. Optimum multiparameter analysis results
An OMP analysis was conducted for the eastern section and theGM from ANT XX/2, where the same four SWTs were used for both
sections. Individual profiles of ANT-XX/2 were chosen to representthe different SWTs. SWT1 is defined as the salinity maximum atthe SB (Station 29), i.e. the LCDW, while SWT2 corresponds to theoxygen minimum layer (Station 31), which is characteristic forUCDW. The comparison of profiles in Fig. 5 let us draw the con-clusion that the warm inflow mainly consists of ACC waters lo-cated near the SB or the centre, where the northern ACC watersproceed eastward. Since the cold regime waters meet the warminflow at a highly variable northeastern corner of the WG, thethird SWT was chosen to account for this water mass. The prop-erties were taken from a station along the GM (Station 42). Finally,

Fig. 9. Climatological temperature field from the CARS argo-only climatology at 300 m depth (a) and the associated standard deviation (b). For the latter values south of 60°Sare not available.
Fig. 10. Left: f/H-contours smoothed by a running mean on top of bathymetry (blue shading). Lines are removed over steep slopes for better visibility. Right: Depth of the28.05 kg/m3 neutral density surface over bathymetry. Cores are marked in orange. (For interpretation of the references to colour in this figure caption, the reader is referredto the web version of this paper.)
S. Ryan et al. / Deep-Sea Research I 107 (2016) 70–81 77
a fourth SWT is introduced to see the impact of waters from thethermocline, laying just above the warm inflow. Table 1 shows thedefinition of each SWT and the associated weight for the analysis.Surface waters have been excluded from the analysis and are notshown in the results. All residuals lay within the accuracy of themeasurements and the standard deviation, indicating that theOMP works well. As the OMP is very sensitive to the choice ofSWTs a Monte Carlo approach has been used to perform 100OMPs, where the individual properties of the SWTs were statisti-cally changed within a chosen limit (see Table 1) in order to obtainerror bars for the fractions (see titles in Fig. 11). Fractions alongsections (latitude-depth) for each SWT at each data point areshown in Fig. 11.
Eastern boundary: The results for the eastern section are givenin the left panels of Fig. 11. The top and middle represent the warminflow (high fractions south of 59°S) while the bottom panelshows the fractions for the cold regime water, which thus showshigh fractions between 59°S and 55°S. The warm regime isdominated by contributions from SWT1 and SWT2, where SWT1occupies mainly the water column between 300 and 500 m depthand SWT2 shows higher fractions above this layer. Both SWTsexhibit maximum fractions of over 50%, which in each case can befound at the latitude of the cores. The upper layer consists almostexclusively of SWT2 with small fractions of cold regime water(SWT3), while the lower layer shows maximum fractions of SWT1(E60%) around 450 m depth and a higher contribution of SWT3.Minimum fractions of cold regime water at 60°S support the
presence of an isolated eddy, forming core 1 and transporting ACCwaters. Smaller fractions of SWT3 around 58°S are in agreementwith another warm eddy found in the observations. Here, SWT1shows slightly higher fractions. In general the results introduce aclear vertical separation of the inflow, with low oxygen, and highnutrient waters (SWT2) above the salinity maximum layer atroughly 400 m depth (SWT1).
Greenwich Meridian: Further downstream at the GM (Fig. 11,right panels) a lot of mixing has already eroded the dominantsignals of SWT1 and SWT2. The latter shows fractions close to zeroexcept at a small patch south of Maud Rise. Most of this watermass would have been entrained into the surface mixed layer (Orsiet al., 1995). High fractions of the cold regime water show that, asindicated in Fig. 1, this water mass is admixed to the warm inflowon its way to Greenwich meridian, as the temperature differenceof up to 0.5 °C between the warm regime of the two sections in-dicates. The influence of the surface water is again negligible,hence the fractions of SWT3 are not shown.
4. Discussion
Our analysis has improved the understanding of the warm in-flow at the eastern boundary of the WG and further establishedthe existence of the two modes previously suggested by Park et al.(2001), where a shorter route is driven by eddy-mixing in thenortheastern corner and a longer, more advective route exceeding
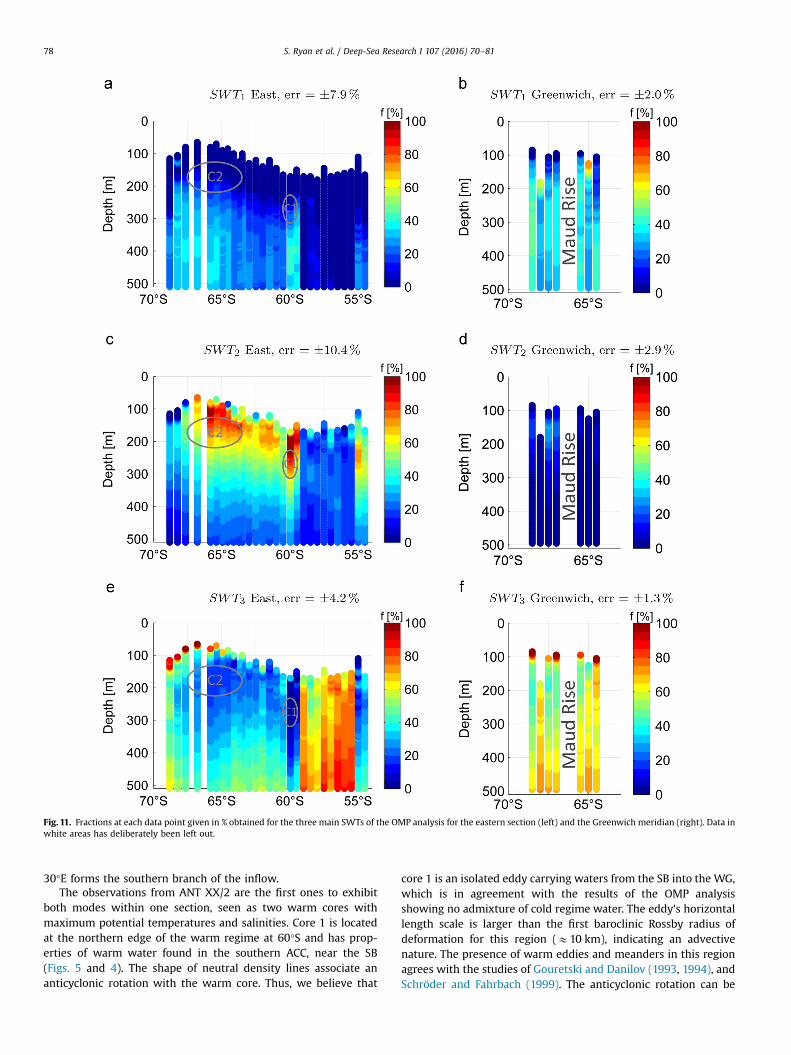
Fig. 11. Fractions at each data point given in % obtained for the three main SWTs of the OMP analysis for the eastern section (left) and the Greenwich meridian (right). Data inwhite areas has deliberately been left out.
S. Ryan et al. / Deep-Sea Research I 107 (2016) 70–8178
30°E forms the southern branch of the inflow.The observations from ANT XX/2 are the first ones to exhibit
both modes within one section, seen as two warm cores withmaximum potential temperatures and salinities. Core 1 is locatedat the northern edge of the warm regime at 60°S and has prop-erties of warm water found in the southern ACC, near the SB(Figs. 5 and 4). The shape of neutral density lines associate ananticyclonic rotation with the warm core. Thus, we believe that
core 1 is an isolated eddy carrying waters from the SB into the WG,which is in agreement with the results of the OMP analysisshowing no admixture of cold regime water. The eddy's horizontallength scale is larger than the first baroclinic Rossby radius ofdeformation for this region (E10 km), indicating an advectivenature. The presence of warm eddies and meanders in this regionagrees with the studies of Gouretski and Danilov (1993, 1994), andSchröder and Fahrbach (1999). The anticyclonic rotation can be
S. Ryan et al. / Deep-Sea Research I 107 (2016) 70–81 79
explained by vorticity dynamics (Orsi et al., 1993).The second core further south seems to be part of an advective
pathway. It has slightly cooler temperatures and significantlylower oxygen levels than core 1. Even though the upwelling iso-pycnals (due to wind forcing) towards the coast indicate eastwardgeostrophic motion, we are confident that the dominating (Ci-sewski et al., 2010; Fahrbach et al., 1991) barotropic component iswestward. Several studies at 30°E observed westward transportfor the WDW density class (Park et al., 2001; Jullion et al., 2014)even though the baroclinic transport was to the east. Un-fortunately, during ANT XX/2, the ship's Acoustic Doppler CurrentProfiler (ADCP) had to be switched off due to technical problemsbefore the eastern section was occupied.
The biggest difference between the two cores was found intheir ventilation signature, i.e. oxygen and CFC levels. At theeastern section measurements relevant for our analysis whereonly available between 400 and 600 m, which is below the max-imum temperature cores but within the maximum salinity. Hence,the measurements can be representative for the warm inflow.However, the 500 m contour line crosses several density lines sothat the high values associated with core 1 and the warm eddy at58°S are found at different densities. A comparison of profiles(Fig. 5) shows that the waters at 58°S originate from the cold re-gime while core 1 exhibits ACC characteristics. At γ ≈ 28.15 kg/mn
3
the profiles overlap which means that the high CFC-12 value at58°S could come from the same source as core 1. High values at theSB along at a density of γ ≈ 28.1 kg/mn
3 suggest that this area is asource region for the warm inflow. Several authors describe sub-stantial water mass transformations at the SB in the Atlantic basin.Heywood and King (2002) show that significant interleaving ofACC and WG waters is seen particularly at intermediate depth,which inevitably leads to mixing of LCDW and WSDW. They alsostate that waters to the south of the Southern ACC Front (SACCF),which is situated between the SB and the PF, exhibit increasedsilicate and CFC concentrations, being consistent with our ob-servations. Not only exchanges between the ACC and the WG butalso exchanges with NADW coming from the north occur betweenthe Drake Passage and the GM (Whitworth and Nowlin, 1987).Furthermore, vertical mixing occurs between UCDW and the risingLCDW at the SB (Orsi et al., 1995). These facts are able to explainthe higher ventilation in this region.
Oxygen and CFC suggest lower values for core 2, which couldindicate a different source for the southern branch of the warminflow. Lower oxygen is found towards the centre of the ACC as-sociated with UCDW. Core 2 exhibits an oxygen vs. neutral densityprofile similar to the station north of the SB (Fig. 5). Temperatureand salinity suggest an origin at the SB for densities smaller than28 kg/m3, while denser water has its origin further north. How-ever, mixing along the eastern boundary could alter the propertiesof the inflow significantly. Given the lack of CFC data at lowerdepth and measurements in general, it is difficult to draw a finalconclusion regarding the origin of core 2. Archambeau et al. (1998)show a CFC-12 section at 30°E from 44 to 69°S. A band of highvalues between 0.2 and 0.5 pmol/kg follows the upwelling iso-pycnals associated with the warm inflow, which is located atroughly 500 m depth at the northern edge and rises up to 300 m atthe southern edge. As we expect core 2 to represent the southern,advective path of the inflow which extends to 30°E, this couldmean that our measurements at 500 m depth are not in agree-ment with the actual values in the core, which could be higher.
How representative is the location of the two cores in our da-taset regarding a general pattern of circulation? Indeed, severalother sections located around 20°E show a warm core at about60°S (Gouretski and Danilov, 1993; Huber et al., 1981), althoughthe temperatures are just over 1 °C. In the section analysed byGouretski and Danilov (1993), core 1 is not so dominant in
temperature but definitely seen in salinity. Furthermore, the sec-tion reveals a second core at 65°S, coinciding with our core 2. Also,the oxygen distribution is in agreement with the minimum beingfound in core 2, having similar values to the oxygen minimum atthe SB. Gouretski and Danilov (1993) applied a free inertial jetmodel (after Niiler and Robinson, 1967) in order to discuss possiblemechanisms that control the pathway of the ACC. They concludedthat the shape of the ACC in the study region is controlled by thebottom topography. Later, Park et al. (2001) applied the samemodel and state that the bottom topography can effectively hinderthe eastward extension of the Weddell cold regime. In return, thismeans that the pathway for the warm inflow at the northern edgeis controlled by a permanent topographic feature, hence leading tothe regular occurrence of warm cores at e.g. 20°E, 60°S. This isconfirmed by the pattern of the standard deviation of the clima-tological temperature field (Fig. 9(b)) and the model results pre-sented in this study. Even though the model is non-eddy resolvingthe barotropic stream function captures both modes, likely as atime-mean picture, as there is no observational evidence of aquasi-permanent flow forming the northern short route (Parket al., 2001). Nevertheless, the streamlines always go on a directroute through the location of core 1, except in 1962 . Based on thefindings of the topographic influence of the ridge on the south-ward turn of the ACC, the significance of the stream function inthat year is questionable, since all the other years show the turn ofthe streamlines at roughly the same position. The precise strengthof the southward curl is given by the bottom velocities of the flow(Gouretski and Danilov, 1993; Park et al., 2001). The advective,southern branch, however, shows a higher seasonal and inter-annual variability in shape and strength. It is suggested that thestrength of the southern limb is related to the regional wind field(Fahrbach et al., 2011). A low pressure system is centred at 65°S inthe eastern part of the WG, thus leading to westerlies north andeasterlies south of this latitude. Hence, the northern part of thewarm inflow, which is eddy-driven, occurs against the wind, whileobviously the advective part flows with the wind. During positivephases of the SAM, a southward shift of the westerly winds occurs,which according to Fahrbach et al. (2011) slows down the southerninflow path and reduces the warm inflow and vice versa. Thevariability at the eastern boundary in the barotropic streamfunction of BRIOS seems to be related to the SAM index, whichexhibits a trend to a more positive phase since the 1960s. Until the1980s, the index was predominantly negative and we can see astronger southern branch in the stream function which exceedsfurther to the east. On the other hand, the limb has been veryweek since the beginning of the 2000s, and was accompanied byan almost exclusively positive SAM. This relation will ultimatelylead to variability of the WDW further downstream, which waspointed out by Fahrbach et al. (2011). Nevertheless, we haveshown that the inflow at the eastern boundary is not trivial andthat there is the possibility of different origins of the warm water.By the time it reaches the GM, significant cooling and mixing withcold regime waters has occurred as the OMP results show. Also,the lighter CDW (UCDW) has been entrained into the surfacemixed layer, a process which is necessary to compensate for theheat loss at the surface (Park et al., 2001). The WDW at the GMshows uniform properties, which is why we believe that the inflowwater has mixed between 0 and 30°E. A meridional temperaturesection at 10°E (Huber et al., 1981) shows only one large patch ofwarm water just before Maud Rise is reached, where the warmwater will split again. Although, the SAM seems to be able to causevariations in the warm inflow, it has to be kept in mind that theWDW which is measured at the GM is already altered significantlycompared to the direct inflow. Different mixing ratios between thecold and warm regime and also between CDW from differentorigins could lead to variability of WDW further downstream. Also,

S. Ryan et al. / Deep-Sea Research I 107 (2016) 70–8180
the cold regime seems to be more pronounced in some years thanothers (Schröder and Fahrbach, 1999), which provides more or lesscool water for mixing at the eastern boundary.
5. Summary
Hydrographic data at the eastern boundary of the WG revealtwo maximum temperature cores around 20°E. The first core islocated at the northern edge of the warm inflow (60°S) with apeak in CFC-12 and elevated oxygen. It has been identified as ananticyclonic eddy carrying ACC waters from the SB into the WG,which agrees with findings of previous literature. The combinedanalysis of model results and climatological temperature fieldssupport the regular occurrence of warm cores at this location,which form a short inflow path set up by eddy-mixing. The secondcore (66°S) is slightly cooler and has minimum oxygen and CFC-12values, although the latter were measured below the maximumtemperature core and could be higher above this depth. This corerepresents an advective pathway which extends beyond 30°E be-fore turning westward to form the southern limb of the warminflow. The origin of this water could lay just north of the SBwithin the ACC, where the UCDW forms an oxygen minimum, thusexplaining the lower ventilation of the southern inflow. Thecompeting effects of topography and the Coriolis force duringconservation of potential vorticity determine the shape of the twopathways. Model results exhibit a considerable variability of thesouthern, advective branch which can be connected to changes inthe local wind field, determined by the SAM. Different mixingratios between cold regimes waters and CDW with different ori-gins can lead to significant temporal variability of the WDWmeasured downstream at the GM, which has to be consideredwhen analysing trends in water mass properties. The area remainsan undersampled region. The dynamical connection between 20°Eand the GM is still not fully understood. More observations areneeded in order to gain more insight on this subject, which thencould be combined with a more detailed model analysis if possi-ble. To investigate the source regions of the warm inflow withinthe ACC one could release numerical floats at the eastern bound-ary in the model and plot trajectories backward in time. Trajec-tories calculated forward in time could help understanding thepathways from the boundary towards the west.
Acknowledgements
We would like to express our gratitude to the officers and crewof RV Polarstern for their efficient assistance during the ANT XX/2cruise. We thank the scientific party for excellent cooperation.Special thanks to A. Wisotzki for the outstanding care with thedata sampling, for processing the oceanographic data (http://dx.doi.org/10.1594/PANGAEA.738486). Thanks to Klaus Bulsiewicz formeasuring the CFC samples. The expedition ANT XX/2 was fi-nanced by Polarstern grant no. PS63. Thank you to H.H. Hellmerand three anonymous reviewers for their detailed and constructivecomments, which helped to improve the manuscript significantly.
References
Archambeau, A.-S., Pierre, C., Poisson, A., Schauer, B., 1998. Distributions of oxygenand carbon stable isotopes and CFC-12 in the water masses of the SouthernOcean at 30°E from South Africa to Antarctica: results of the CIVA 1 cruise. J.Mar. Syst. 17, 25–38.
Bakker, D., Hoppema, M., Schröder, M., 2008. A rapid transition from ice coveredCO2—rich water to a biologically mediated CO2 sink in the eastern WeddellGyre. Biogeosciences 5, 1373–1386.
Beckmann, A., Timmermann, R., Pereira, A.F., Mohn, C., 2001. The effect of flow atMaud Rise on the sea-ice cover—numerical experiments. Ocean Dyn. 52 (1),0011–0025.
Carmack, E., 1977. Water mass characteristics of the Southern Ocean south of thePolar Front. In: Angel, M. (Ed.), A voyage of discovery, George Deacon 70thAnniversary Volume. Pergamon, New York, pp. 15–41.
Cisewski, B., Strass, V., Leach, H., 2010. Circulation and transport of water masses inthe Lazarev Sea, Antarctica, during summer and winter 2006. Deep-Sea Res. I58, 186–199.
Deacon, G., 1937. The hydrology of the Southern Ocean. Discov. Rep. 15, 1–24.Deacon, G., 1979. The Weddell Gyre. Deep-Sea Res. 26A, 981–995.Fahrbach, E., Hoppema, M., Rohardt, G., Boebel, O., Klatt, O., Wisotzki, A., 2011.
Warming of deep and abyssal water masses along the Greenwich meridian ondecadal time scales: the Weddell Gyre as a heat buffer. Deep-Sea Res. II (58),2509–2523.
Fahrbach, E., Knoche, M., Rohardt, G., 1991. An estimate of water mass transfor-mation in the southern Weddell Sea. Mar. Chem. 35, 25–44.
Fütterer, D., Kattner, G., 2005. The expedition ANTARKTIS-XX of RV Polarstern in2002/2003. Ber. Polarforschung 495.
Gordon, A.L., Huber, B.A., 1984. Thermohaline stratification below the SouthernOcean sea ice. J. Geophys. Res. 89 (C1), 641–648.
Gouretski, V.V., Danilov, A.I., 1993. Weddell Gyre: structure of the eastern bound-ary. Deep-Sea Res. 40 (3), 561–582.
Gouretski, V.V., Danilov, A.I., 1994. Characteristics of warm rings in the Africansector of the Antarctic Circumpolar Current. Deep-Sea Res. I 41 (8), 1131–1157.
Heywood, K.J., King, B.A., 2002. Water masses and baroclinic transport in the SouthAtlantic and Southern Oceans. J. Mar. Res. 60 (5), 639–676.
Huber, B., Rennie, S., Georgi, D., Jacobs, S., Gordon, A., 1981. Ara Islas Orcadas DataReport, Cruise 12, Ref. CU-2-81-TR2. Technical report, Lamont-Doherty Geol.Observ., Palisades, New York.
Huhn, O., Hellmer, H.H., Rhein, M., Rodehacke, C., Roether, W., Schodlok, M.P.,Schröder, M., 2008. Evidence of deep- and bottom- water formation in thewestern Weddell Sea. Deep-Sea Res. II (55), 1098–1116.
Huhn, O., Rhein, M., Hoppema, M., van Heuven, S., 2013. Decline of deep and bot-tom water ventilation and slowing down of anthropogenic carbon storage inthe Weddell Sea, 1984–2011. Deep-Sea Res. I 76, 66–84.
Johnson, G.C., 2008. Quantifying Antarctic Bottom Water and North Atlantic DeepWater volumes. J. Geophys. Res. 113 (C05027).
Jullion, L., Garabato, A.C.N., Bacon, S., Meredith, M.P., Brown, P.J., Torres-Valdés, S.,Speer, K.G., Holland, P.R., Dong, J., Bakker, D., Hoppema, M., Loose, B., Hugh J.Venables, W.J.J., Messias, M.-J., Fahrbach, E., 2014. The contribution of theWeddell Gyre to the lower limb of the Global Overturning Circulation. J. Geo-phys. Res. Oceans 119, 3357–3377.
Klatt, O., Fahrbach, E., Hoppema, M., Rohardt, G., 2005. The transport of the WeddellGyre across the Prime Meridian. Deep-Sea Res. Part II: Top. Stud. Oceanogr. 52(3–4), 513–528.
Larque, L., Maamaatuaiahutapu, K., Garcon, V., 1997. On the intermediate and deepwater flow in the South Atlantic Ocean. J. Geophys. Res. 102 (C6), 12425–12440.
Meredith, M., 2013. Replenishing the abyss. Nat. Geosci. 6, 166–167.Naveira Garabato, A., Mc Donagh, E., Stevens, D., Heywood, K., Sanders, R., 2002. On
the export of Antarctic Bottom Water from the Weddell Sea. Deep-Sea Res. PartII 49, 4715–4742.
Nicholls, K.W., Osterhus, S., Makinson, K., Gammelsrod, T., Fahrbach, E., 2009. Ice-ocean processes over the continental shelf of the southern Weddell Sea, Ant-arctica: a review. Rev. Geophys. 47 (RG3003).
Niiler, P., Robinson, A., 1967. The theory of free inertial jets. Tellus 19 (4), 601–619.Orsi, A., Johnson, G., Bullister, J., 1999. Circulation, mixing, and production of Ant-
arctic Bottom Water. Prog. Oceanogr. 43, 55–109.Orsi, A., Whitworth, T., Nowlin Jr., W., 1995. On the meridional extent and fronts of
the Antarctic Circumpolar Current. Deep-Sea Res. 34, 641–673.Orsi, A.H., Nowlin Jr., W.D., Whitworth, T., 1993. On the circulation and stratification
of the Weddell Gyre. Deep-Sea Res. 40 (1), 169–203.Palmer, M., Gomis, D., del Mar Flexas, M., Jullion, L., Tsubouchi, T., NaveiraGarabato,
A., 2012. Water mass pathways and transport over the Scotia Ridge west of50°W. Deep-Sea Res. Part I 59, 8–24.
Park, Y.-H., Charriaud, E., Craneguy, P., 2001. Fronts, transport, and Weddell Gyre at30E between Africa and Antarctica. J. Geophys. Res. 106 (2), 2857–2879.
Patterson, S., Whitworth, T., 1990. Physical oceanography. In: Antarctic Sector of thePacific. Elsevier, New York, pp. 55–93.
Reid, J., Nowlin Jr., W.D., Patzert, W., 1977. On the characteristics and circulation ofthe southwestern Atlantic Ocean. J. Phys. Oceanogr. 7, 62–91.
Saunders, P., King, B., 1995. Ocean fluxes on the WOCE A11 section. J. Phys. Ocea-nogr. 25 (9), 1942–1958.
Schröder, M., Fahrbach, E., 1999. On the structure and the transport of the easternWeddell Gyre. Deep-Sea Res. II 46, 501–527.
Schröder, M., Wisotzki, A., 2010. Physical Oceanography During POLARSTERN cruiseANT-XX/2. Technical Report, Alfred Wegener Institute, Helmholtz Centre forPolar and Marine Research, Bremerhaven.
Smedsrud, L.H., 2005. Warming of the deep water in the Weddell Sea along theGreenwich meridian: 1977–2001. Deep-Sea Res. I (52), 241–258.
Timmermann, R., Beckmann, A., Hellmer, H.H., 2002. Simulations of ice-ocean dy-namics in the Weddell Sea 1. Model configuration and validation. J. Geophys.Res. 107 (C3) 10-1–11.
Tomczak, M., 1981. A multiparameter extension of temperature/salinity diagramtechniques for the analysis of non-isopycnal mixing. Prog. Oceanogr. 10,147–171.
Tomczak, M., Large, D.G., 1989. Optimum multiparameter analysis of mixing in thethermocline of the Eastern Indian Ocean. J. Geophys. Res. 94 (C11),16141–16149.
van Caspel, M., Schröder, M., Huhn, O., Hellmer, H., 2015. Precursors of Antarctic

S. Ryan et al. / Deep-Sea Research I 107 (2016) 70–81 81
Bottom Water formed on the continental shelf off Larsen Ice Shelf. Deep-SeaRes. Part I 99, 1–9.
Vanicek, M., Siedler, G., 2002. Zonal fluxes in the deep layers of the Western South
Atlantic Ocean. J. Phys. Oceanogr. 32 (8), 2205–2235.Whitworth, T., Nowlin, W., 1987. Water masses and currents of the Southern Ocean
at the Greenwich Meridian. J. Geophys. Res. 92 (C6), 6462–6476.