decomposition rate of organic fertilizers: effect on … rate of organic fertilizers: effect on...
TRANSCRIPT

Decomposition rate of organic fertilizers:
effect on yield, nitrogen availability and nitrogen stock
in the soil
A.H.M. van OpheusdenG.J.H.M. van der Burgt
P.I. Rietberg

© 2012 Louis Bolk Institute
Decomposition rate of organic fertilizers: effect on yield,
nitrogen availability and nitrogen stock in the soil.
Authors: A.H.M. van Opheusden, G.J.H.M. van
der Burgt and P.I. Rietberg, 40 pages.
Key words: MAC, soil fertility, nitrogen balance,
decomposition, mineralization, long term field
trial, NDICEA.
Publication number 2012-033 LbP
This report can be downloaded from
www.louisbolk.nl
Corresponding author: [email protected]
www.louisbolk.org

Preface 3
Preface
The MAC field trial (Manure As Chance) is a unique long-term field trial, that has been running for 13
years. With 12 different organic fertilizer and one artificial fertilizer strategies, it offers the opportunity
to study the long-term effects of different types and quantities of organic fertilizers on yield, product
quality and soil properties. We were glad that the project “Bedrijfsinterne Optimalisatie” (Internal
Farm Optimization) provided the opportunity to analyse the nitrogen dynamics of for the period 1999-
2011 We thank the Ministry of Economics, Agriculture and Innovation (EL&I) for financing this work.
We invite other researchers to use these experimental plots for their own research questions. A start
has already been made, some of the treatments being used for a soil phosphate study. Feel
welcome to contact about research questions which might be answered using this experimental field.
Geert-Jan van der Burgt
Project leader


Contents 5
Contents
Summary 7
Samenvatting 9
1 Introduction 11
2 Methods 13
2.1 Experimental setup 13
2.2 Model study 15
2.3 Data analysis 16
2.4 Statistical analyses 18
3 Results and discussion 19
3.1 Crop yield 19
3.1.1 Relative yield of treatments with similar readily available nitrogen 20
3.1.2 Relative yield of treatments with similar total nitrogen 21
3.2 Nitrogen availability 23
3.3 Mineralization 23
3.4 Soil nitrogen content and nitrogen balances 25
3.4.1 Nitrogen balances for treatments with similar available nitrogen-applications 26
3.4.2 Nitrogen balances for treatments with similar total nitrogen applications: high and
low nitrogen input 27
3.4.3 A stable soil nitrogen content 29
4 Conclusion 31
5 Discussion 33
References 35
Annex 1: RMSE values of NDICEA predictions against mineral nitrogen measurements 37
Annex 2: Crop yield versus nitrogen availability 39


Summary 7
Summary
The nitrogen of organic fertilizers does not fully mineralize within a season, and hence will partly
become available in later years. This effect is taken into account for the first year but generally not in
later fertilizer applications. If it would be taken into account, fertilizer use could be more efficient.
This study is an analysis of a 13-year field trial where crop yield was measured in 13 fertilizer
treatments which differ in total N applied and decomposition rate. This is complemented with a model
study in which mineralization and soil nitrogen content were calculated.
We intended to show step by step that the use of fertilizers with a low decomposition rate, relative to
fertilizers with a high decomposition rate, lead in the course of years to an increase in soil organic
nitrogen, an increased nitrogen mineralization and availability and that this results in increased
yields. Some of the results in these four steps in our work give support to this, but there are more
factors at play.
We show that when using, for example, deep stable manure, after some years the available nitrogen
may for 50% or more be derived from manure applied in former years. This makes clear that, at least
in agricultural systems that use a substantial amount of organic fertilizers, it is worthwhile taking this
delayed mineralization into account.


Samenvatting 9
Samenvatting
Stikstof uit organische mest komt niet volledig beschikbaar in het jaar van toediening. Een deel komt
in de volgende jaren pas beschikbaar. In de bemesting wordt daar bij de toepassing in het eerste jaar
rekening mee gehouden (werkingscoëfficiënt van stikstof) maar in de volgende jaren meestal niet.
Als dat wel gedaan zou worden zou dat de stikstofefficiëntie kunnen verhogen.
Dit rapport gaat over de analyse van een 13-jarige veldproef waarin de opbrengst is gemeten van
verschillende gewassen in 13 bemestingsvarianten. Die verschillen onder andere in totale N-gift en in
afbraaksnelheid van de organische stof. Dit is aangevuld met een modelstudie waarin mineralisatie
en bodemstikstof worden berekend.
We wilden stap voor stap aantonen dat meststoffen met een lage afbraaksnelheid, vergeleken met
die met een hoge afbraaksnelheid, leiden tot een opbouw van bodemstikstofvoorraad, toename van
mineralisatie van stikstof, toename van beschikbaarheid van stikstof voor het gewas en uiteindelijk
hogere opbrengst. Enkele van deze vier stappen in ons werk leveren een ondersteuning van dit
proces op, maar er zijn meerdere factoren die een rol vervullen.
Als bijvoorbeeld rundveepotstalmest gebruikt wordt kan na een aantal jaar meer dan 50% van de
beschikbaar komende stikstof afkomstig zijn van bemestingen uit voorgaande jaren. Dat maakt
duidelijk dat, in ieder geval in landbouwsystemen met een aanzienlijke input van organische mest,
het de moeite waard is om met deze vertraagde mineralisatie rekening te houden.


Introduction 11
1 Introduction
In Dutch agriculture the issue of fertilizer application has been receiving a lot of attention for several
decades. It has shown to be difficult for Dutch agricultural practice to fulfill the European Nitrate
directive and Water directive. Careful management is needed to be able to obtain high yields without
burdening the environment. Current Dutch policies are based on maximum amounts of nitrogen
application per crop, on a maximum load of nitrogen in applied manure and on a maximum of applied
phosphate, dependent on soil phosphate conditions. However, organic fertilizer does not fully
decompose in one season, and for this a ‘ decomposition rate’ for each type of organic fertilizer has
been introduced. For example, it is estimated that slurry decomposes for 60% in the first year and
plant compost decomposes only for 10% in the first year. Therefore, one has to apply more nitrogen
in total in order to have a certain amount of mineral nitrogen available for the crop. This surplus
nitrogen may become available in later years. This fact is usually not taken into account both in
fertilizer policy and in agricultural practice. In recent research projects this has been subject of study
(Bokhorst and Van der Burgt, 2012). So farmers may enhance their nitrogen efficiency if they do take
this into account in their choice of fertilizer type and nitrogen input level. Mineralization of nitrogen
from former organic fertilizer applications may increase crop yield, but at the same time it may
increase leaching and hence reduce efficiency.
The Louis Bolk Institute has a long-term field trial in which the performance of 13 fertilizer types and
combinations is compared. Except for one (artificial fertilizer) all fertilizers are organic. The trial has
been running for 13 years. The results of this trial are interesting since there are only few trials of
such length. Zanen et al (2008) gave an overview of results up to 2006; Bokhorst et al (2008)
summarized this in a leaflet. We combine the trial results of twelve years on yield with a model study
to gain insight in the nitrogen dynamics in the soil. The fertilizer treatments cover a range of nitrogen,
phosphorus and organic matter input levels and different decomposition rates of the organic matter
applied. Hence, we can study the effect of low decomposition rate for various levels of total nitrogen
input. Also, we compare the soil nitrogen dynamics for a high input regime with a low input regime.
Our hypothesis consists of four parts. After a number of years the use of slow decomposing fertilizer,
relative to fast decomposing fertilizer, is expected to result in a relative build-up of soil organic matter
and soil N content (1). This in turn may enhance mineralization (2) and hence the nitrogen
availability (3), which is in the end expected to increase yield (4). So we expect the yield to diverge
over the years when in different treatments the same level of first-year available nitrogen is applied,
but different levels of total nitrogen because of differences in decomposition rates of the organic
matter. Similarly, we expect the yields to converge when the same total nitrogen is added, but with a
different decomposition rate.
Studying mineralization and soil nitrogen build-up is relevant for several reasons. As different crops
are grown, mineralization is expected to be more consistent over the years than yields and therefore
more useful to study trends. Soil nitrogen build-up is investigated by making nitrogen balances. The
NDICEA model was used to calculate mineralization and the various in- and outflows. This shows us
the nitrogen build-up, and also gives insight in the various nitrogen losses.

12 Decomposition rate of organic fertilizers: effect on yield, nitrogen availability and nitrogen stock in the soil
Chapter 2 gives a brief description of the experiment and our approach. A more detailed description
can be found in Zanen et al (2008). In chapter 3 we present and discuss the results for each part of
the hypothesis. We start with the last part of our hypothesis, yield, since the yields are observed
values, and work back towards soil N budgets based on model calculations. In chapter 4 we come to
overall conclusions which are discussed in chapter 5.
Methods 13
2 Methods
2.1 Experimental setup The trial field is situated in Lelystad (52.32.30 N; 5.30.17 E), on an organic farm in the reclaimed
lands, on a sandy loam soil. The trial started in 1999 and consists of 13 fertilizer treatments laid out
in 4 replicates, resulting in 52 plots. The plots within the replicates are randomized and the plot size
is 63 m2 (7m by 9m). The field is an integral part of the farm system, so the crop rotation is set by the
farmer.
For some treatments the fertilizer application is aimed at 67 kg ha-1 readily available nitrogen per
year. This is the amount of nitrogen that is present in mineral form or expected to mineralize within
the first season. Additionally, two constraints are taken into account: a maximum phosphorus
application of 80 kg ha-1 and -for the compost treatments- a maximum organic matter application of
6000 kg ha-1 because of risk of heavy metal contamination. These constraints are in line with Dutch
legislation in 1999, the year that the trial started.
Decomposition rate is defined as the fraction of fertilizer-N that decomposes in the first year,
including the fertilizer N fraction which is already inorganic. For the decomposition rate commonly
accepted ‘rule-of-thumb-values’ are used. Nitrogen application for 67 kg ha-1 mineral nitrogen is
calculated as follows:
Table 1 shows the fertilizer treatments and their corresponding nitrogen and phosphorus applications
and decomposition rates.

14 Decomposition rate of organic fertilizers: effect on yield, nitrogen availability and nitrogen stock in the soil
Table 1 The fertilizer treatments and their nitrogen and phosphorus applications and decomposition rate
Treatment
Fertilizer Readily available N application
aimed for (kg ha-1 year-1)
Decomposa-bility (fraction decomposed in first year)
Total N application
aimed for (kg ha-1year-1) (average)
Total N application
realised (kg ha-1year-1)
(average)
Constraint (N/P/OM)
1 Deep stable manure,
fresh 67 0.45 149 174 N
2 Slurry 67 0.60 112 106 N
3 Artificial fertilizer 67 1 67 67 N
4 Household compost
with slurry 67 n.a.1 n.a. 172 N
5 Poultry manure with
slurry 67 n.a.1 n.a. 116 N & P
6 Deep stable manure,
lightly composted 45 0.35 129 138 P
t7 Deep stable manure,
intensively composted2
45 0.35 129 89 P
8 Pig manure 41 0.45 91 95 P
9 Poultry manure 47 0.55 85 92 P
10 Nature compost3 24 0.15 160 174 P
11 Household compost 9 0.10 90 74 OM
12 Plant compost, lightly
composted 8 0.10 80 58 OM
13 Plant compost,
intensively composted 8 0.15 53 41 OM
1These are treatments with 2 fertilizers. 2This treatment was stopped in 2004. 3Nature compost is exempted from the constraint of 6000 kg ha-1 organic matter, since this compost has a low heavy
metal concentration.
To calculate the amount of fertilizer needed the nitrogen content of the fertilizer was estimated each
year. For this the average nitrogen content of the former years was used. The fertilizers were
weighed at the field and spread out over the plots manually. Samples of the manure were then taken
at the day of application and their nitrogen content was analysed. Thereafter, the exact amount of
nitrogen application was calculated. As a result of this procedure, the exact amount of nitrogen and
phosphorus applied varied slightly over the years.

Methods 15
Fertilizer is applied in 2 out of 3 years, in which 1.5 times the amount as of table 1 is applied1. Table
2 shows the fertilizer application schedule and the crop rotation.
Table 2 Crops grown and fertilizer application. Year Crop Fertilizer application
1999 Red cabbage X
2000 Potato X
2001 Beetroot X
2002 Carrots
2003 Parsnip X
2004 Broccoli
2005 Squash X
2006 Cauliflower X
2007 Potato
2008 Salsify X
2009 Parsnip X
2010 Squash
2011 Parsnip X
2.2 Model study To calculate the nitrogen dynamics we made use of the model NDICEA (Van der Burgt et al, 2006).
NDICEA simulates the day-to-day nitrogen dynamics of arable systems for a given soil type and
farming system (i.e. manure application and crop rotation). It uses crop yield and crop nitrogen
content as input values for backward calculation of the nitrogen dynamics throughout the year.
Regional data on rainfall, temperature and evapotranspiration are used. For the crop nitrogen content
as well as for the decomposition rate of crop residues and soil organic matter the NDICEA default
values were used.
The model was validated by comparing soil mineral nitrogen content measurements with model
predictions. Soil mineral nitrogen content was measured in 2010 and 2011, for a total of 7 times.
There is a quantitative criterion available for the comparison: a root mean square error (RMSE,
Wallach and Goffinet, 1989) of maximally 20 kg ha-1 is considered to be within range of allowable
variability (Van der Burgt et al, 2006). The RMSE of all 13 treatments was smaller than 20 kg ha-1
(see Annex 1 for RMSE values) so we supposed that the NDICEA model describes the nitrogen
dynamics in an acceptable way. Since the model can handle a maximum of 12 years, the data from
1The initial idea was to apply 67 kg ha-1 mineral nitrogen each year, but in 2001 - two years after the start of the trial –
the maximum allowed phosphorus application was lowered from 120 kg ha-1 to 80 kg ha-1. It was then decided to continue adding 67 kg ha-1 mineral nitrogen in two out of every three years, such that the experimental design could stay the same. At that time the trial had run for 3 years. Therefore the first year of non-fertilization has been one year later than scheduled.

16 Decomposition rate of organic fertilizers: effect on yield, nitrogen availability and nitrogen stock in the soil
2000 up to 2011 were used. The experiment started in 1999. This first year was modelled separately
and the resulting soil organic matter parameters were used as input for the next 12 years
calculations.
The model was used to calculate for each treatment the mineralization during the whole year and the
nitrogen availability for the crop. The yearly mineralization was calculated as the summation of the
mineralization during all 365 days of the year. The nitrogen availability was calculated as the
mineralization during crop growth plus the mineral nitrogen content of the soil at day of sowing.
Furthermore, the model calculated the total nitrogen in- and output via the processes deposition,
leaching, denitrification and volatilization. These values were used to create nitrogen balances.
These give an impression of whether soil nitrogen content of the soil has been increasing or
decreasing.
Apart from the yield data, this study is for a major part based on model results. Every simulation
approach has the challenge of the ‘starting point’. In this case the model outcomes of the first years
highly depend on the parameter settings of the soil organic matter. The NDICEA model has three
pools of soil organic matter, with different quantity, N-content and speed of decomposition. These are
model parameters and cannot be measured in the soil. The starting values will influence the results
in the first years. In this study we used the first year, 1999, as starting period, using the NDICEA
default values for the three pools. We continued the 2000 – 2011 runs with the obtained soil organic
matter pools from the end of 1999. This reduces the possible influence of ‘wrong’ starting data.
2.3 Data analysis The complete set of 13 treatments (Table 1) was used to correlate yield to nitrogen availability. For
further data analysis a selection of treatments was used.
We selected the treatments with the largest contrast in yield, nitrogen application and decomposition
rate of applied organic matter. The treatments selected are:
Deep stable manure, fresh (treatment 1)
Slurry (treatment 2)
Artificial fertilizer (treatment 3)
Plant compost, lightly composted (treatment 12)
Nature compost (treatment 10)
From here onwards ‘deep stable manure’ refers to treatment 1 and ‘plant compost’ to treatment 12.
To be able to compare yields of different crops over time, the crop yield in ton per hectare is
transformed in a relative crop yield, 1.00 being equivalent to the average yield per year.
Table 3 shows an excerpt of Table 1: the mineral nitrogen, decomposition rate and the total nitrogen
application of the five selected treatments.

Methods 17
Table 3 nitrogen mineralizing from fertilizer application and the total nitrogen in the application of deep stable manure, artificial fertilizer, slurry, plant compost and nature compost.
Mineral nitrogen application aimed for
(kg ha-1 year-1 )
Decomposition rate (fraction decomposed
in first year)
Total nitrogen application aimed for
(kg ha-1 year-1 )
Total nitrogen applied (kg ha-1 year-1 )
(average)
Deep stable manure
67 0.45 149
174
Slurry 67 0.6 112 106
Artificial fertilizer
67 1 67
67
Nature compost
24 0.15 160
174
Plant compost
8 0.10 80
58
Figure 1: Total nitrogen application in the five treatments selected for analysis and their respective
readily available nitrogen applications. Readily available nitrogen application is calculated from total
nitrogen application, based on fraction assumed to decompose within a year.
The treatments selected differ in either application of readily available nitrogen or total nitrogen
application (Figure 1). This limited the number of comparisons between treatments that could be
made. Two different kinds of comparisons can be made: treatments with the same application of
readily available nitrogen, and treatments with the same total nitrogen application. Deep stable
manure, slurry and artificial fertilizer have a fairly similar application of readily available nitrogen, but
a different total nitrogen application. Deep stable manure and nature compost have a similar total
nitrogen application. This holds as well for artificial fertilizer and plant compost. For this part of the
study we included the 1999 yield data.
Nitrogen balances were made for the selected treatments for the period 2000 - 2011. Separate
balances were made for the first 6 years and the following 6 years of this period, such that time
effects can be seen. Both periods contain two years of non-fertilization.

18 Decomposition rate of organic fertilizers: effect on yield, nitrogen availability and nitrogen stock in the soil
2.4 Statistical analyses Data were analysed with GenStat 13.0. Repeated measurement analysis of variance was used to
test whether any yield differences could be observed between treatments. Least significant difference
(P<.05) was used to assess differences between treatments.
Regression analysis was done for the yield against the nitrogen availability as calculated by NDICEA.

Results and discussion 19
3 Results and discussion
First, yield differences between treatments are analysed. Then, we correlate yield to nitrogen
availability as calculated by NDICEA to test whether nitrogen is indeed the explaining factor for crop
yield. Thirdly we study the effect of the different treatments on nitrogen mineralization (which
determines availability), and lastly we study the effects on soil nitrogen content. For these last two
analyses we use the comparisons as described above in paragraph 2.3. For the study of the soil
nitrogen content we have created nitrogen balances that also give insight in nitrogen losses and
hence in efficiency.
3.1 Crop yield Table 4 shows crop yield in tons ha-1, and Table 5 shows relative crop yield. The data from Table 5
are used in the further analysis. In 2002 no yield measurements were done.
Table 4 Crop yield (ton/ha)
Year Crop Deep stable manure
Slurry Artificial fertilizer
Plant compost
Nature compost
1999 Red cabbage 48.0 42.8 41.3 35.7 41.6
2000 Potato 35.4 35.6 35.1 35.7 37.1
2001 Beetroot 26.8 29.2 27.4 17.9 19.0
2002 Carrots
2003 Parsnip 42.2 35.5 33.7 26.7 34.0
2004 Broccoli 9.0 7.3 6.9 6.1 9.2
2005 Squash 17.8 16.9 14.9 14.6 13.8
2006 Cauliflower 19.5 11.7 9.0 8.9 15.8
2007 Potato 23.5 19.9 18.6 20.9 25.4
2008 Salsify 18.2 20.0 19.2 16.3 19.1
2009 Parsnip 47.9 37.2 29.2 30.0 38.6
2010 Squash 22.3 22.8 18.4 20.1 19.3
2011 Parsnip 34.8 32.0 23.3 25.5 31.3

20 Decomposition rate of organic fertilizers: effect on yield, nitrogen availability and nitrogen stock in the soil
Table 5 Relative crop yield (relative to the average of all treatments, which is set at 1.00)
Year Crop Deep stable manure
Slurry Artificial fertilizer
Plant compost
Nature compost
1999 Red cabbage 48.0 42.8 41.3 35.7 41.6
2000 Potato 35.4 35.6 35.1 35.7 37.1
2001 Beetroot 26.8 29.2 27.4 17.9 19.0
2002 Carrots
2003 Parsnip 42.2 35.5 33.7 26.7 34.0
2004 Broccoli 9.0 7.3 6.9 6.1 9.2
2005 Squash 17.8 16.9 14.9 14.6 13.8
2006 Cauliflower 19.5 11.7 9.0 8.9 15.8
2007 Potato 23.5 19.9 18.6 20.9 25.4
2008 Salsify 18.2 20.0 19.2 16.3 19.1
2009 Parsnip 47.9 37.2 29.2 30.0 38.6
2010 Squash 22.3 22.8 18.4 20.1 19.3
2011 Parsnip 34.8 32.0 23.3 25.5 31.3
There are statistically significant differences (repeated measure ANOVA, p<0.05, lsd: 0.033).The lsd
is depicted in Fig. 2, 3 and 4, such that can be seen which of the results differ significantly. In the
following section these results will be elaborated on.
3.1.1 Relative yield of treatments with similar readily available nitrogen
From 1999 until 2001 the differences in relative yield of the treatments deep stable manure, slurry
and artificial fertilizer were small (Figure 2). In the first three years differences were negligible. From
2003 onwards crop yield was almost always higher in the treatment with higher total nitrogen
application: deep stable manure gave a higher yield than slurry and slurry gave a higher yield than
artificial fertilizer, with 2008 and 2010 as exceptions. In 2008 salsify was grown, which is known to
have a weak response on fertilizer application. This explains the sudden decrease in relative yield of
the deep stable manure treatment. In 2010 however squash showed this same decrease in relative
yield. This year no fertilizer was applied, and squash is generally known as a crop with a strong
response on nitrogen availability. Overall there is a considerable yearly variability. If the period
before 2002 is compared with the period after 2002, a diverging trend is visible. Between 2003 and
2011 such a diverging trend is not visible. From our four hypothesis, the fourth is supported to a
limited extend: increased yield differences in later years, correlated to the decomposition rates.

Results and discussion 21
Figure 2 Relative yield of deep stable manure, slurry and artificial fertilizer in the years 1999 until 2011.
3.1.2 Relative yield of treatments with similar total nitrogen
In Figure 3 the relative yield from the treatments deep stable manure and nature compost are shown.
Except for in 2001 there were no significant differences. The yield of the nature compost treatment
was generally lower than that of deep stable manure. However, there is a number of years in which
yields in both treatments were nearly equal. In two of the four years in which this was the case there
was no fertilization. The years without fertilization are expected to show a more pronounced effect of
soil organic matter and soil N build-up since without fertilization the crops fully depend on
mineralization of soil organic matter. However, in 2010 there was no fertilization either and this year
the yield was just like in the years in which there was fertilization. So there seem to be multiple
factors of effect. In general there is no clear trend. We would have expected the yield of nature
compost to increase relative to deep stable manure. Within this time lapse, these two treatments give
no support for the fourth part of our hypothesis.
lsd

22 Decomposition rate of organic fertilizers: effect on yield, nitrogen availability and nitrogen stock in the soil
Figure 3 Relative yield of deep stable manure and nature compost in the years 1999 until 2011.
Figure 4 shows that the relative yield of crops grown in treatments with plant compost and with
artificial fertilizer are fluctuating. Plant compost tends to have a lower yield in the first half of the trial,
and a slightly higher yield towards the end of the trial, but significant differences are absent in most
years. Even without differences this is interesting since the total nitrogen application of plant
compost was lower than that of artificial fertilizer (58 kg ha-1 and 67 kg N ha-1 respectively).
Assuming that nitrogen availability was a limiting factor this means that the yield of plant compost can
only be this high due to mineralization from fertilizer applied in former years. This again would give
support to the fourth part of our hypothesis. Another explanation could be the overall positive effect of
organic matter, leading to a more efficient use of nitrogen.
Figure 4 Relative yield of artificial fertilizer and plant compost in the years 1999 until 2011.
lsd
lsd
Results and discussion 23
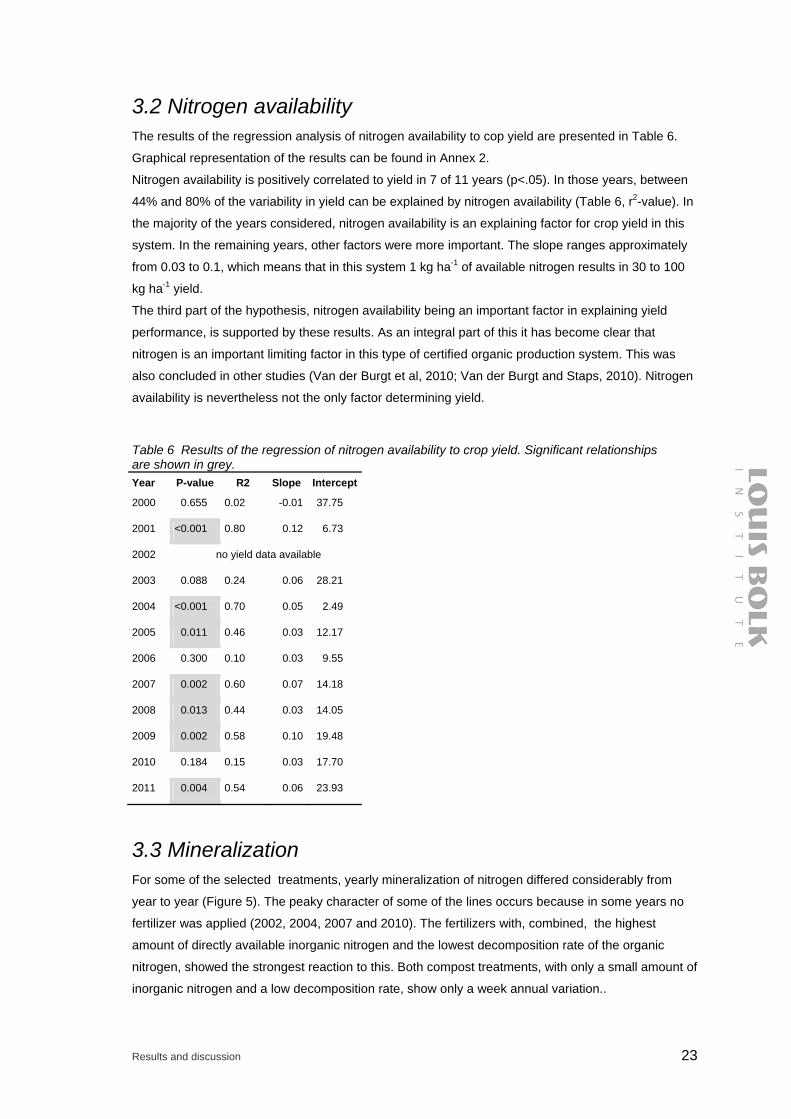
3.2 Nitrogen availability The results of the regression analysis of nitrogen availability to cop yield are presented in Table 6.
Graphical representation of the results can be found in Annex 2.
Nitrogen availability is positively correlated to yield in 7 of 11 years (p<.05). In those years, between
44% and 80% of the variability in yield can be explained by nitrogen availability (Table 6, r2-value). In
the majority of the years considered, nitrogen availability is an explaining factor for crop yield in this
system. In the remaining years, other factors were more important. The slope ranges approximately
from 0.03 to 0.1, which means that in this system 1 kg ha-1 of available nitrogen results in 30 to 100
kg ha-1 yield.
The third part of the hypothesis, nitrogen availability being an important factor in explaining yield
performance, is supported by these results. As an integral part of this it has become clear that
nitrogen is an important limiting factor in this type of certified organic production system. This was
also concluded in other studies (Van der Burgt et al, 2010; Van der Burgt and Staps, 2010). Nitrogen
availability is nevertheless not the only factor determining yield.
Table 6 Results of the regression of nitrogen availability to crop yield. Significant relationships are shown in grey.
Year P-value R2 Slope Intercept
2000 0.655 0.02 -0.01 37.75
2001 <0.001 0.80 0.12 6.73
2002 no yield data available
2003 0.088 0.24 0.06 28.21
2004 <0.001 0.70 0.05 2.49
2005 0.011 0.46 0.03 12.17
2006 0.300 0.10 0.03 9.55
2007 0.002 0.60 0.07 14.18
2008 0.013 0.44 0.03 14.05
2009 0.002 0.58 0.10 19.48
2010 0.184 0.15 0.03 17.70
2011 0.004 0.54 0.06 23.93
3.3 Mineralization For some of the selected treatments, yearly mineralization of nitrogen differed considerably from
year to year (Figure 5). The peaky character of some of the lines occurs because in some years no
fertilizer was applied (2002, 2004, 2007 and 2010). The fertilizers with, combined, the highest
amount of directly available inorganic nitrogen and the lowest decomposition rate of the organic
nitrogen, showed the strongest reaction to this. Both compost treatments, with only a small amount of
inorganic nitrogen and a low decomposition rate, show only a week annual variation..

24 Decomposition rate of organic fertilizers: effect on yield, nitrogen availability and nitrogen stock in the soil
In general, over the first five years of the trial, there was a decline in mineralization. Nitrogen levels of
the fertilizer application before the start of the trial were higher than during the trial, which might
explain this decline..
The mineralization of the nature compost treatment gradually picked up with that of deep stable
manure. The mineralization of the plant compost treatment superseded that of artificial fertilizer in the
non-fertilized years 2007 and 2010.
Figure 5 Mineralization for the whole year as calculated by NDICEA for the five selected treatments.
In 2010 there was a strong dip in mineralization over more or less all treatments. The environmental
data collected by NDICEA show that 2010 was indeed a relatively cold year (Table 7). This is likely to
be the cause of the decrease in mineralization.
Table 7 Average temperature in the years of non-fertilization
Year Average temp (ºC)
2002 10.8
2004 10.4
2007 11.2
2010 8.7
Due to the peaks in the curves it is hard to see a trend in this graph. We therefore look at the years in
which there was no fertilizer application. This shows us per definition mineralization from former
years (Figure 6).
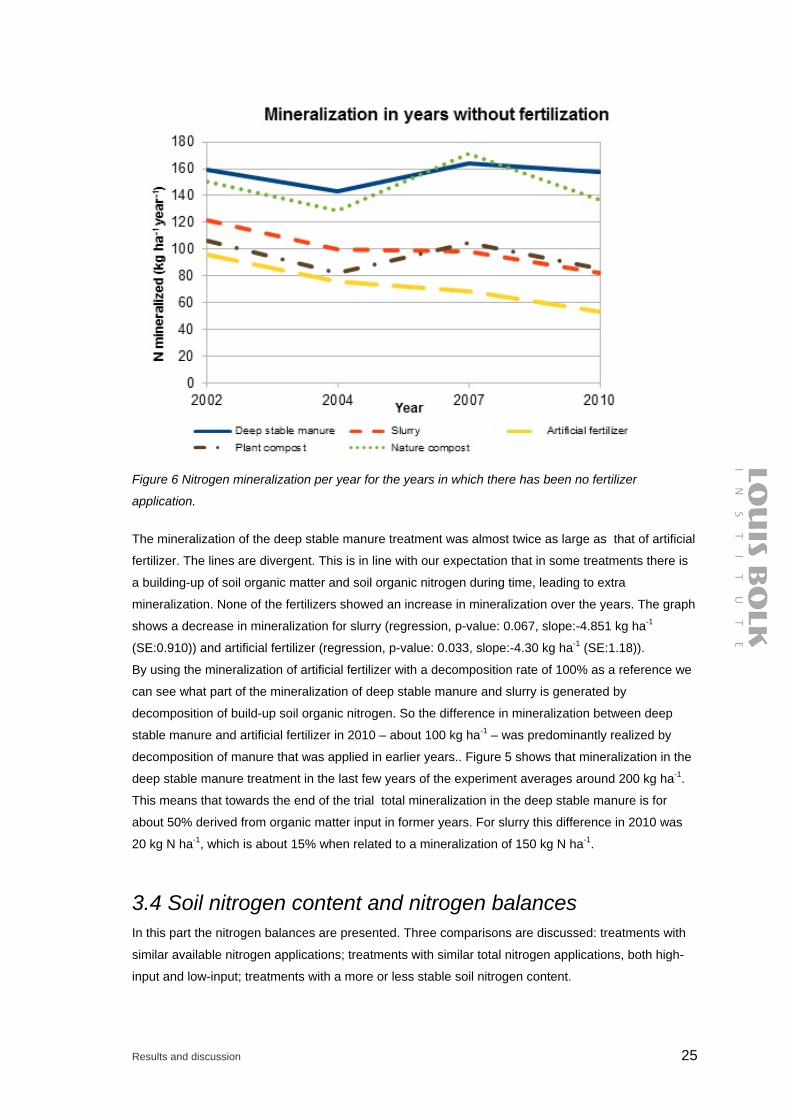
Results and discussion 25
Figure 6 Nitrogen mineralization per year for the years in which there has been no fertilizer
application.
The mineralization of the deep stable manure treatment was almost twice as large as that of artificial
fertilizer. The lines are divergent. This is in line with our expectation that in some treatments there is
a building-up of soil organic matter and soil organic nitrogen during time, leading to extra
mineralization. None of the fertilizers showed an increase in mineralization over the years. The graph
shows a decrease in mineralization for slurry (regression, p-value: 0.067, slope:-4.851 kg ha-1
(SE:0.910)) and artificial fertilizer (regression, p-value: 0.033, slope:-4.30 kg ha-1 (SE:1.18)).
By using the mineralization of artificial fertilizer with a decomposition rate of 100% as a reference we
can see what part of the mineralization of deep stable manure and slurry is generated by
decomposition of build-up soil organic nitrogen. So the difference in mineralization between deep
stable manure and artificial fertilizer in 2010 – about 100 kg ha-1 – was predominantly realized by
decomposition of manure that was applied in earlier years.. Figure 5 shows that mineralization in the
deep stable manure treatment in the last few years of the experiment averages around 200 kg ha-1.
This means that towards the end of the trial total mineralization in the deep stable manure is for
about 50% derived from organic matter input in former years. For slurry this difference in 2010 was
20 kg N ha-1, which is about 15% when related to a mineralization of 150 kg N ha-1.
3.4 Soil nitrogen content and nitrogen balances In this part the nitrogen balances are presented. Three comparisons are discussed: treatments with
similar available nitrogen applications; treatments with similar total nitrogen applications, both high-
input and low-input; treatments with a more or less stable soil nitrogen content.

26 Decomposition rate of organic fertilizers: effect on yield, nitrogen availability and nitrogen stock in the soil
Slurry
Artificial
fertilizer
Deep
stable
manure
3.4.1 Nitrogen balances for treatments with similar available nitrogen-applications
2000-2005 2006-2011
Figure 7 Nitrogen balances for the treatments deep stable manure, slurry and artificial fertilizer. All
units are kg ha-1 year-1. Within the square: change in soil nitrogen. Emission: sum of denitrification
and volatilization.

Results and discussion 27
In Figure 7, it can be seen that only in the case of deep stable manure there was build-up of nitrogen
in the soil. However, nitrogen was only built up in the second half of the trial. This may be explained
by the fact that from 2008 onwards the nitrogen application – incidentally - increased. Artificial
fertilizer showed a stronger decrease in soil nitrogen content than slurry, which is expected since
artificial fertilizer had a lower total nitrogen and no organic nitrogen application. Both artificial fertilizer
and slurry showed a stronger decrease during the first half of the trial than during the second half of
the trial. This suggests that the systems tend to go towards equilibrium. This turns out to be a slow
process, for this equilibrium is clearly not reached within 6 years.
The losses of nitrogen to the environment were considerable. In most treatments, around 60 kg N ha-1
was collected in the harvest per year, and between 63 and 92 kg N ha-1 leached annually from the soil
(Figure 7). The other emissions, being the sum of denitrification and volatilization, were highest for the
slurry treatment. This is mainly due to the volatilization when the manure was spread
In the treatment with artificial fertilizer, a high amount of nitrogen was lost by leaching compared to
the nitrogen input. In the first 6 years the leaching was higher than in the treatment with slurry,
whereas the treatment with slurry had a higher nitrogen input. Leaching in the treatment with artificial
fertilizer was similar to that in the treatment with deep stable manure, although the nitrogen input of
deep stable manure was more than twice as high. This can partly be explained by leaching during
crop growth, which can be higher in case of a fertilizer with a high mineral nitrogen content. During
the second half of the trial leaching from the treatment with artificial fertilizer decreased from 89 kg
ha-1 to 63 kg ha-1, while the nitrogen input stayed the same. This is not hard to explain: a decrease in
soil organic matter will imply a decrease in mineralization and so in leaching.
3.4.2 Nitrogen balances for treatments with similar total nitrogen applications: high and low nitrogen input
In this section the results for deep stable manure versus nature compost (Figure 8) and artificial
fertilizer versus plant compost (Figure 9) are compared. Within the pairs the total nitrogen input is
more or less the same, but they differ in decomposition rate. The first pair is high-input and the
second pair is low-input.

28 Decomposition rate of organic fertilizers: effect on yield, nitrogen availability and nitrogen stock in the soil
Deep
stable
manure
Nature
compost
2000-2005 2006-2011
Figure 8 Nitrogen balances for the treatments deep stable manure and nature compost. All units are
kg ha-1year-1. Within the square: change in soil nitrogen. Emission: sum of denitrification and
volatilization.
In the treatment with nature compost, more nitrogen was build up in the soil than in the treatment
with deep stable manure (Figure 8). Because nature compost has a lower decomposition rate than
deep stable manure ( 0.1 resp.0.45) the readily available nitrogen was generally lower, so less
leaching was expected. This corresponds with what we see in Figure 8. In the second half of the
experiment leaching increased a bit compared to the first half, being in accordance with an increased
mineralization after harvest due to build-up of soil nitrogen.
Interestingly, the amount of nitrogen in the yield was about the same in both treatments. This
suggests that with nature compost as fertilizer the crops can obtain the same yield with lower
available nitrogen than with deep stable manure. Possibly, other soil processes such as enhanced
soil life, enhanced rooting capacity or better water drainage contribute to this effect.
In the treatment with nature compost, less nitrogen was lost by emission and leaching, per kg of
nitrogen in the crop, than in the treatment with deep stable manure. Nature compost thus seems
more efficient. However, in the nature compost treatment the process of nitrogen build-up is still
going on, and values for leaching may change. Leaching increased from 70 kg N ha-1 to 76 kg N ha-1
in the second half of the trial. This may further increase in future if the same fertilizer application is
maintained.

Results and discussion 29
Artificial
fertilizer
Plant
compost
2000-2005 2006-2011
Figure 9: Nitrogen balances for the treatments artificial fertilizer and plant compost. All units are kg
ha-1 year-1. Within the square: change in soil nitrogen. Emission: sum of denitrification and
volatilization.
The differences between artificial fertilizer and plant compost (Figure 9) are similar to the differences
between deep stable manure and nature compost (Figure 8). In the treatment with plant compost,
much more nitrogen was maintained in the soil than in the treatment with artificial fertilizer, whereas
nitrogen input was even a bit smaller. The yields were comparable although directly available
nitrogen was lower for the plant compost treatment. The soil nitrogen content in the treatment with
plant compost has decreased less than that in the treatment with artificial fertilizer. Despite the higher
directly available nitrogen and the higher soil nitrogen content in the plant compost treatment,
leaching was lower for this treatment than for the artificial fertilizer treatment (Figure 8).
3.4.3 A stable soil nitrogen content
There are two treatments that have had a stable soil nitrogen content for at least some of the time.
These are the fertilization of about 150 kg N ha-1 deep stable manure from 2000 to 2005 and the
application of about 70 kg N ha-1 plant compost in 2006 to 2011. This is an interesting comparison,

30 Decomposition rate of organic fertilizers: effect on yield, nitrogen availability and nitrogen stock in the soil
for the deep stable manure treatment has a relatively high nitrogen input within the context of this
experiment, whereas plant compost has reached equilibrium with a much lower input.
Deep stable manure 2000-2005 Plant compost 2006-2011
Figure 10 Two nitrogen balances that have a more or less stable soil nitrogen content. All units are
kg ha-1 year-1.
The yield in the treatment with plant compost was approximately 30% lower, whereas nitrogen input
was more than 50% lower (Figure 10). So the low-input system is more efficient. This is related to
less leaching and lower emissions. Moreover, the deposition of 25 kg N ha-1 is of relatively larger
contribution when the fertilizer application is low. However, a harvest of 47 kg N ha-1 as in the low-
input system is hard to make economically viable.

Conclusion 31
4 Conclusion
A higher total nitrogen input tends to lead to higher yields, when the amount of applied readily
available nitrogen is similar. This difference becomes visible after 4 to 5 years. (chapter 3.1.1). At the
same time, total nitrogen applied seems to be a more important factor in determining yield than
readily available nitrogen. The yields of the low and high input treatments with different
decomposition rates do, within the time-span of this research, not tend to diverge in time. (chapter
3.1.2.)
Nitrogen availability plays a dominant, although not exclusive role in yield. This is shown in the
regression analysis of nitrogen availability and yield of all treatments (chapter 3.2).
Nitrogen mineralization of soils receiving fertilizers with a high decomposition rate, such as slurry or
artificial fertilizer, decreases over time, especially in years without fertilization. In contrast,
mineralization stays at a constant level in plots receiving fertilizers with a medium decomposition
rate, such as deep stable manure, or with a low decomposition rate, such as nature or plant compost.
Plots receiving less total nitrogen show lower mineralization levels than plots receiving more total
nitrogen (chapter 3.3).
The soil nitrogen stock decreased in most of the five selected treatments during the time lapse of this
experiment. The changes in soil nitrogen are less negative or a bit positive in the second half of the
studied time lapse compared to those in the first part. There are substantial differences between the
three treatments with the same application of readily available nitrogen. The soil nitrogen balances in
case of deep stable manure (positive balance), slurry and artificial fertilizer (most negative balance)
are according to our expectations. The differences between deep stable manure and nature compost
are less easy to interpret because of interaction with other processes such as substantial changes in
input.
Overall we conclude that the process as described in our hypothesis (build-up of soil nitrogen ->
increased mineralization -> increased nitrogen availability -> increased yield) are shown in our
results. Some effects are visible within a few years, some effects may last longer than the time lapse
studied to become visible.


Discussion 33
5 Discussion
Extra nitrogen application to compensate for low decomposition rate is common practice in The
Netherlands. In the long run, this has a major impact on nitrogen dynamics in the soil and hence,
potentially, on the yield. This makes it interesting to study this process in detail. Within the MAC long
term field trial there are differences in yield of around 30%. We showed that treatments with fertilizers
with a low decomposition rate may obtain 50% or more of the mineralization during crop growth from
organically bound nitrogen applied in former years, compared to the treatment with artificial fertilizer
only. This is substantial and makes it well worth taking into account in nitrogen management.
However, this is not easy. As we have seen, these processes may well last for over 10 years. Also,
although crop yield correlated with nitrogen availability rather well, the results of the crop yield alone
were quite variable, since different crops were grown. This means that within the context of this study
conclusions cannot be based on crop yield alone. Further knowledge on the soil processes is
needed, such as changes in soil nitrogen.
In this long-term experiment fertilizer is applied in a quantity independent from the crop that was
grown. In agricultural practice other choices will be made. One will usually adapt the nitrogen
application to the crop grown, which may help to limit leaching. Although in this case there was
generally a decrease in soil nitrogen rather than a build-up it is advisable to level off fertilizer
application when a sufficiently high soil nitrogen content level and, correlated to that, a certain level
of mineralization has been reached. Also, combinations of different fertilizers can be used. Especially
using a combination of a fast decomposing and a slowly decomposing fertilizer is advisable because
of their complementary characters.
The amount of nitrogen leaching was quite high in this trial, even though the nitrogen applications
were generally low. Apart from fertilization management there are other options to limit leaching. The
most effective might be inserting catch crops in the rotation. We expect that this change in the
rotation will have major impacts on the nitrogen dynamics. It is possible to get an impression of the
influence of catch crops on the nitrogen dynamics by using the existing NDICEA files, but there is a
limitation. NDICEA is target-oriented, and there is no feedback between nitrogen availability and crop
yield. Increase of yield due to increased nitrogen availability has to be estimated by interpolation or
extrapolation of the relation between nitrogen availability and crop yield. This could be subject for a
next study.
This study was limited to the effect of nitrogen on crop yield. However, it is well known that organic
matter has additional positive effects on yield through amelioration of soil life, improved rooting
density and water retention and other aspects. It is interesting to study these factors as well to shed
more light on their relative importance.
The soil conditions in the MAC trial field are in general favourable for decomposition: a low clay
content, a pH > 7, well-drained soil, regular soil cultivation. Under a fertilizer applications of around
67 kg ha-1readily available nitrogen, a build-up in the soil is only achieved with the use of compost

34 Decomposition rate of organic fertilizers: effect on yield, nitrogen availability and nitrogen stock in the soil
and of deep stable manure. In these cases the application of additional nitrogen to compensate for
low decomposition rate is no luxury, but needed to maintain the soil nitrogen content at a constant
level. This coincides with a surplus in the phosphorus balance (data not given here). Under the new
Dutch regulations for phosphorus application in agriculture these levels of phosphorus are not
allowed. This invokes a new urgent question: how to maintain soil fertility and soil organic matter
within the new regulations?

References 35
References
Bokhorst, J.G., Berg, C. ter, Zanen, M. and Koopmans, C.J. (2008). The MAC trial: results form a
long-term organic inputs trial. Report LD10E, Louis Bolk Instituut, Driebergen, 24 pp.
Bokhorst, J.G. and Burgt, G.J.H.M. van der (2012). Organische stofbeheer en stikstofleverend
vermogen van de grond in de Nederlandse akkerbouw. Rapport 2012-017 LbP. Louis Bolk
Instituut, Driebergen. 21 p
Burgt, G.J.H.M. van der, G.J.M Oomen, A.S.J. Habets and W.A.H. Rossing (2006). The NDICEA
model, a tool to improve nitrogen use efficiency in cropping systems. Nutrient Cycling in
Agroecosystems 74: 275-294
Burgt, G.H.M. van der, B.G.H. Timmermans, C. ter Berg. (2010). Minder en Anders Bemesten:
Onderzoeksresultaat akkerbouw op klei. Maaimeststoffen bij aardappel, Van Strien 2010.
Rapport 2010-023LbP. Louis Bolk Instituut, Driebergen.
Burgt, G.H.M. van der, J.J.M. Staps. 2010. Minder en Anders Bemesten. Onderzoeksresultaten
tuinbouw op zand. Van Lierop 2008-2010. Rapport 2010-028LbP. Louis Bolk Instituut, Driebergen.
Wallach D. and Goffinet B.,(1989). Mean squared error of prediction as criterion for evaluation
and comparing system models. Ecol. Modell. 44: 209-306
Zanen, M., J.G. Bokhorst, C. ter Berg, C.J. Koopmans. 2008.,Investeren tot in de bodem:
Evaluatie van het proefveld Mest Als Kans . Rapport LD11. Louis Bolk Instituut, Driebergen.


Annex 1 37
Annex 1: RMSE values of NDICEA predictions against mineral nitrogen measurements
The RMSE (root mean square error) is a measure to evaluate whether model predictions fit
experimental data well enough. In this case the technique is used to evaluate the NDICEA
predictions on the nitrogen fluxes in the soil with data on mineral nitrogen content. A RMSE of 20 kg
ha-1 is considered to be within range of allowable deviation. The following table shows the RMSE for
each treatment.
Treatment Fertilizer RMSE
1 Deep stable manure, fresh 13.53
2 Slurry 12.27
3 Artificial fertilizer 10.46
4 Household compost with slurry 12.05
5 Poultry manure with slurry 13.08
6 Deep stable manure, lightly composted 14.82
7 Deep stable manure, heavily composted 10.75
8 Pig manure 11.83
9 Poultry manure 15.79
10 Nature compost 12.41
11 Household compost 12.69
12 Plant compost, lightly composted 13.08
13 Plant compost, heavily composted 11.79


Annex 2 39
2000 - potatoe
33
34
35
36
37
38
39
40
41
0 50 100 150 200N availability (kg N/ha)
yiel
d (
ton
/ha)
2001 - beetroot
0
5
10
15
20
25
30
35
0 50 100 150 200 250N availability (kg N/ha)
yiel
d (
ton
/ha)
Annex 2: Crop yield versus nitrogen availability
The following table shows the graphs of the correlations of the yield against the nitrogen availability
for each year. The slope, intercept, R2-value and the significance are given in Table 5 of the main
text.
No crop yield data available
2003 - parsnip
0
5
10
15
2025
30
35
40
45
50
0 50 100 150 200 250N availability (kg N/ha)
yiel
d (
ton
/ha)
2004 - broccoli
01
23
45
67
89
10
0 50 100 150N availability (kg N/ha)
yiel
d (
ton
/ha)
2005 - squash
0
5
10
15
20
25
0 50 100 150 200 250N availability (kg N/ha)
yiel
d (
ton
/ha)
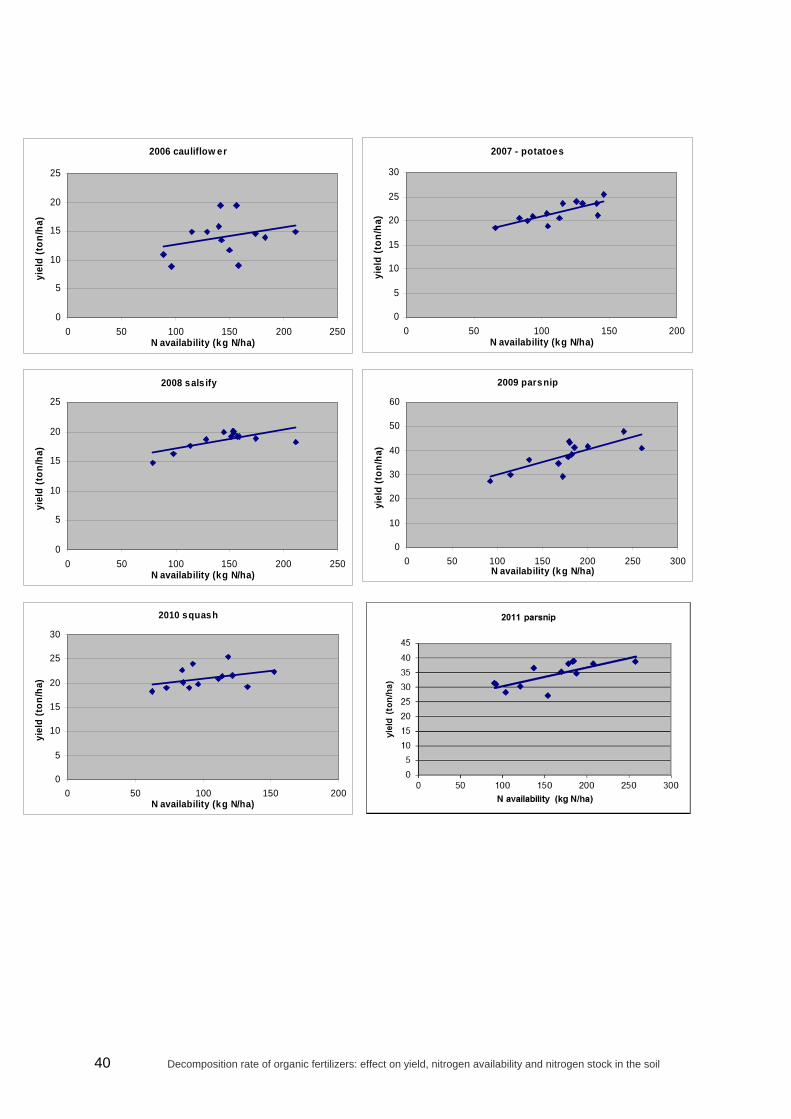
40 Decomposition rate of organic fertilizers: effect on yield, nitrogen availability and nitrogen stock in the soil
2006 cauliflow er
0
5
10
15
20
25
0 50 100 150 200 250N availability (kg N/ha)
yiel
d (
ton
/ha)
2007 - potatoes
0
5
10
15
20
25
30
0 50 100 150 200N availability (kg N/ha)
yiel
d (
ton
/ha)
2008 sals ify
0
5
10
15
20
25
0 50 100 150 200 250N availability (kg N/ha)
yiel
d (
ton
/ha)
2009 parsnip
0
10
20
30
40
50
60
0 50 100 150 200 250 300N availability (kg N/ha)
yiel
d (
ton
/ha)
2010 squash
0
5
10
15
20
25
30
0 50 100 150 200N availability (kg N/ha)
yiel
d (
ton
/ha)