december 5-6, 2002 hapl program workshop, nrl, washington, d.c. 1 enhancing target survival...
Post on 20-Dec-2015
214 views
TRANSCRIPT

December 5-6, 2002 HAPL Program Workshop, NRL, Washington, D.C.
1
Enhancing Target Survival
Presented by A.R. Raffray
Other Contributors:
M. S. Tillack, B. Christensen, Z. Dragovlovic, J. Pulsifer, X. Wang
UCSD
D. Goodin, R. Petzoldt
General Atomics
HAPL Program Workshop
Naval Research Laboratory, Washington, D.C.
December 4-5, 2002

December 5-6, 2002 HAPL Program Workshop, NRL, Washington, D.C.
2
Previous Transient Thermal Analyses Have Shown Very Low Heat Flux Limits for Target Survival Based on Maintaining DT Below its Triple Point
• Analysis using ANSYS
- Target is not tumbling
- 2-D heat flux distribution from DSMC results
- Temperature dependent DT properties including
latent heat of fusion at triple point to model phase change
l
l
ll
l
t
t
tt
t
n
n
n
n
n
0.0
0.5
1.0
1.5
2.0
2.5
0 2000 4000 6000 8000 10000
Target diameter = 4 mmInjection velocity = 400 m/s
Heat flux varies along targetsurface , the maximum heat fluxoccurring at the leading edge.
Maximum heat flux (W/m2)
24
10
6
Chamber radius (m)
Triplepoint
• Heat flux to reach triple point only ~ 6000 W/m2 for a 6-m radius chamber
• Major limit on energy transfer from background gas and absorbed
radiation from chamber wall

December 5-6, 2002 HAPL Program Workshop, NRL, Washington, D.C.
3
Highly Reflective Target Surface Needed to Minimize Total Absorbed Heat Flux from Chamber Wall
• Simple estimate given by:
Where Tw is the wall temperature (assumed as a black body), S-B is Stefan-Boltzmann constant,
and the target surface reflectivity.
qrad'' =(1−ρ)σ S−BTw4
- For very thin (275–375 Å) gold coating, ~96% was assumed
- A 1% change in reflectivity --> 25% change in absorbed heat flux
- As an illustration:
Tw(K): 1000 1275 1500
qrad’’(W/m2): 2300 6000 11,500
• Effort underway to estimate more accurately radiated
energy absorption and reflection based on a multi-layer wave model
• Initial results based on spherical and wavelength averaging
gold
2 m GDP
100 m DT
gold(Å) 50 0.622100 0.806150 0.879200 0.915400 0.963600 0.973900 0.976

December 5-6, 2002 HAPL Program Workshop, NRL, Washington, D.C.
4
Condensation from Xe as Background Gas
1x101
1x10²
1x10³
1x10⁴
1x10⁵
1x10⁶
0.1 1 10 100
1000K, 400m/s
4000K,400m/s
1000K, 100 m/s
4000K,100m/s
Max. heat flux is at the leading target surface
Xe temp.,Inj.vel.
Condensation coefficient x Pressure at RT (mtorr) (c x )P
q''max - for D T to
reach triple pointfor Rchamb 6of m
.and injection vel of:400 /m s
100 /m s
• For an assumed condensation coefficient of ~1, q’’= 6000 W/m2 with only 2.5mtorr/4000K Xe or 7.5mtorr/1000K Xe for 400 m/s injection velocity- Minimal wall protection under these Xe densities
Similar results for He
• For 400 m/s injection velocity, q’’= 6000 W/m2 with only:
- 1mtorr/4000K He or - 7mtorr/1000K He

December 5-6, 2002 HAPL Program Workshop, NRL, Washington, D.C.
5
How to Enhance Target Survival?
• To provide a reasonable design window for gas protection and power core performance:
- Gas pressure up to ~50 mtorr at 1000-4000 K (qcond’’= 4 -10 W/cm2 for Xe)
- Chamber wall temperature ~ 1000-1500 K (qrad’’~ 0.2 -1.2 W/cm2)
- Total q’’ to be accommodated by target = 5 -11 W/cm2
(compared to current case of ~0.6 W/cm2)
- Need means to increase thermal robustness of target
• Two-prong approach: 1. Design modification to create more thermally robust target2. Explore possibility of relaxing phase change constraint
- Solution must accommodate target physics requirements as well as injected target integrity requirements

December 5-6, 2002 HAPL Program Workshop, NRL, Washington, D.C.
6
Add Outer Insulating Foam Layer to Enhance Target Thermal Robustness
• Simple assumption: adjust thickness of DT+foam layer
accordingly to maintain same overall
(consistent with initial S. Obenschain’s guidelines)
DT gas
1.5 mm
DT solid0.19 mm
DT + foam
x~ m’s
Dense plastic coat(not to scale)(0.289-x) mm
Insulating foam Au or Pd
• Properties of cryogenic foam based on those of polystyrene
- Density and thermal conductivity adjusted according to foam region
porosity
- Thermal conductivity further scaled by 2/3 to account for possible optimization of
porous micro-structure to minimize the conductivity.
- As conservative measure, higher thermal conductivity values found in the literature used, ranging from 0.088 W/m-K at 19 K to
0.13 W/m-K at 40 K
- Heat capacity values used range from 100 J/kg-K at 20 K to 225 J/kg-K at 40 K

December 5-6, 2002 HAPL Program Workshop, NRL, Washington, D.C.
7
Example DT Interface Temperature History for Different Thicknesses(m)of 25% Dense Outer Foam Region
• Transient analyses performed using ANSYS
- q’’ = 2.2 W/cm2 for example case(10 mTorr/4000 K Xe)
- Outer foam region density = 25% (Consistent with J. Sethian’s guideline)
18.0
18.5
19.0
19.5
20.0
20.5
21.0
1E-05 0.002 0.004 0.006 0.008 0.01 0.012 0.014
Injection Time (s)
DT Interface Temperature (K)
0.0
180
140
120
100800
DT Triple Point (19.79 K)
• ~130 m (32 m of equivalent solid polystyrene) would be sufficient to prevent DT from reaching the
triple point after 0.015 s (corresponding to flight time of 400 m/s target in 6 m radius chamber)
• As comparison, DT would reach the triple point after ~0.002 s in the
absence of the outer foam layer

December 5-6, 2002 HAPL Program Workshop, NRL, Washington, D.C.
8
Summary of Thermal Analysis Results on Effectiveness of Insulating Outer Foam Layer
• To increase target thermal robustness:
- maximize both thickness and porosity of outer foam layer while
- accommodating target physics and structural integrity requirements.
Foam
Density
Foam
Thickness
( )m
Plastic
coating
thickness
( )m
Maximum
’’q on
Target
( /W cm2)
Timefor
D T to
Reach
Tr iple
Point(s)
0.25 72 2 1.17 0.010
0.25 72 10 1.17 0.0108
0.25 104 2 1.17 >0.015
0.25 104 2 7.5 0.0068
0.1 72 2 1.17 0.0116
0.1 97 2 1.17 >0.015
0.1 152 2 7.5 0.0147

December 5-6, 2002 HAPL Program Workshop, NRL, Washington, D.C.
9
Allowing DT Phase Change• Formation of DT vapor at DT/foam and plastic overcoat interface depends on bonding
- For high quality bond, evaporation would only occur through nucleation- Homogeneous nucleation very low under typical conditions (~0 for T<26 K and takes off at 34 K)
- If localized micro-defects are present, heterogeneous nucleation is possible (> ~1 m)
- If micro-gap present, surface evaporation is possible (worst case scenario considered here)
• Amount of DT liquid and vapor based on saturation P-T relationship from phase diagram
Tsat= 5.2911 P0.1356
Phase diagram DT and D2
1.E+03
1.E+04
1.E+05
1.E+06
1.E+07
1.E+08
1.E+09
10 20 30 40 50 60 70 80Temperature (K)
Pressure (Pa)
DT vapor press (Pa)
DT freezing press (Pa)
D2 vapor press (Pa)
D2 freezing press (Pa)
solidliquid
vapor
Triple point
Critical point

December 5-6, 2002 HAPL Program Workshop, NRL, Washington, D.C.
10
Thermo-mechanical Model for Rigid DTq’’
Plastic coating
DT gas
DT + foam
Melt layer
Evaporatedlayer
V/V due to phase-change equivalent to P on plastic sphere
€
VVt arg et
=6PRint
4tplasticE(1− μ )
ΔV=Vl +Vv −Vs −ΔVth
€
h =PRint
2tplastic
V=total volumetric change of targetVs=Equivalent solid volume of phase change regionVl and Vv=liquid and vapor volumes of phase change regionVth=volumetric thermal expansion of plastic coating
Both liquid and vapor densities of DT are lower than DT solid density

December 5-6, 2002 HAPL Program Workshop, NRL, Washington, D.C.
11
Simple Model Utilizing DT Tint and Phase-Change Thickness as a Function of Heat Flux from Transient ANSYS Calculations
• The initial solid volume, Vs, that has undergone phase change is given by:
€
Vs =4
3π (Rint
3 − (Rint −δp−c )3 )
• Assume that a mass fraction xl of the phase change region, p-c, is liquid and (1-xl) is vapor:
€
Vl = Vsρ sρ lxl
€
Vv = Vsρ s(1− xl )RDTTvP
• Substitution in V/V eqn. leads to a quadratic equation for P:
ΔVth=43πRint
3 ((1+αΔTpl)3 −1)
• The volumetric expansion of the plastic coating is given by:
(xlρsρl
+(1−xl)ρsRDTTv
P−1)Vs −ΔVth=Vtarget
6PRint
4tplasticE(1−μ)

December 5-6, 2002 HAPL Program Workshop, NRL, Washington, D.C.
12
DT Evaporated Region Thickness as a Function of Maximum Heat Flux for Different Plastic Coating Thicknesses
0.0E+00
5.0E-06
1.0E-05
1.5E-05
2.0E-05
0 1 2 3 4 5 6
Maximum Heat Flux (W/cm 2)
DT Evap. Thickness (m)
tplastic=2 micronstplastic=5 micronstplastic=8 microns
• Is 1% density variation acceptable based on target physics requirements?- For the 289 m foam+DT region--> ~3 m vapor region- e.g. for a 8 m plastic overcoat, the maximum allowable q’’~4.2 W/cm2
• A thicker plastic coating is preferred to minimize vapor region thickness

December 5-6, 2002 HAPL Program Workshop, NRL, Washington, D.C.
13
Hoop Stress as a Function of Maximum Heat Flux for Different Plastic Coating Thicknesses
0.0E+00
1.0E+07
2.0E+07
3.0E+07
4.0E+07
5.0E+07
6.0E+07
7.0E+07
8.0E+07
9.0E+07
1.0E+08
0 1 2 3 4 5 6
Maximum Heat Flux (W/cm 2)
Hoop Stress (Pa)
0.0E+00
3.0E+05
6.0E+05
9.0E+05
1.2E+06
1.5E+06
Pressure (Pa)
Hoop Stress for tplastic=5 micronsHoop Stress for tplastic=2 micronsHoop stress for tplastic-8 micronsPressure
Ultimate stress for polystyrene
• A maximum q’’ of ~5-5.5 W/cm2 for a plastic overcoat thickness of 8 mis allowable based on the ultimate tensile strength of polystyrene

December 5-6, 2002 HAPL Program Workshop, NRL, Washington, D.C.
14
DT Vapor and Maximum Interface Temperatures as a Function of Maximum Heat Flux
15202530354045505560657075808590
0 1 2 3 4 5 6Maximum Heat Flux (W/cm 2)
Temperature (K)
Vapor temp. for tplastic=2 microns
Vapor Temp. for tplastic=5 microns
Vapor temp. for tplastic=8 microns
Liq./vap. interf. temp.
• Homogeneous nucleation increases dramatically as T--> 34 K,corresponding to q’’ > 6 W/cm2

December 5-6, 2002 HAPL Program Workshop, NRL, Washington, D.C.
15
• Equivalent q’’ required to evaporate vapor region is small for vapor region thicknesses ~ 1-10 m (<< heat flux on target)
0
0.05
0.1
0.15
0.2
0.25
0.3
0.35
0.4
0.0E+00 5.0E-06 1.0E-05 1.5E-05 2.0E-05 2.5E-05 3.0E-05
DT Evap. Thickness (m)
Equivalent Evap. q'' (W/cm
2) tplastic=2 microns
tplastic=10 microns
Equivalent Heat Flux as a Function of DT Evaporated Thickness

December 5-6, 2002 HAPL Program Workshop, NRL, Washington, D.C.
16
DT Evaporated Thickness as a Function of Maximum Heat Flux for Different Plastic Coating Thicknesses for a Case with
a 72-m 25% Dense Insulating Outer Foam Layer
0.0E+00
5.0E-06
1.0E-05
1.5E-05
2.0E-05
0 1 2 3 4 5 6 7 8 9 10
Maximum Heat Flux (W/cm 2)
DT Evap. Thickness (m)
tplastic=2 micronstplastic=5 micronstplastic=8 microns
• Based on the 1% density variation (~3 m vapor region ), the maximum allowable q’’ is now ~8.6 W/cm2 for a 8 m plastic overcoat(compared to 4.2 W/cm2 for case without insulating foam layer)

December 5-6, 2002 HAPL Program Workshop, NRL, Washington, D.C.
17
Hoop Stress as a Function of Maximum Heat Flux for Different Plastic Coating Thicknesses with a 72-m 25% Dense
Insulating Outer Foam Layer
0.0E+00
1.0E+07
2.0E+07
3.0E+07
4.0E+07
5.0E+07
6.0E+07
7.0E+07
8.0E+07
9.0E+07
1.0E+08
0 1 2 3 4 5 6 7 8 9 10
Maximum Heat Flux (W/cm 2)
Hoop Stress (Pa)
0.0E+00
3.0E+05
6.0E+05
9.0E+05
1.2E+06
1.5E+06
Pressure (Pa)
Hoop Stress for tplastic=2 micronsHoop Stress for tplastic=5 micronsHoop stress for tplastic-8 micronsPressure
Ultimate stress for polystyrene
• A maximum q’’ of ~9.5 W/cm2 for a plastic overcoat thickness of 8 mis allowable based on the ultimate tensile strength of polystyrene

December 5-6, 2002 HAPL Program Workshop, NRL, Washington, D.C.
18
DT Vapor and Maximum Interface Temperatures as a Function of Maximum Heat Flux for a Case with a 72-m 25%
Dense Insulating Outer Foam Layer
15202530354045505560657075808590
0 1 2 3 4 5 6 7 8 9 10Maximum Heat Flux (W/cm 2)
Temperature (K)
Vapor temp. for tplastic=2 microns
Vapor Temp. for tplastic=5 microns
Vapor temp. for tplastic=8 microns
Liq./vap. interf. temp.
• DT vapor generation forms an insulating layer that retards heat flux to DT liquid and solid (such transient effect not included in this model)

December 5-6, 2002 HAPL Program Workshop, NRL, Washington, D.C.
19
Conclusions (I)• For a typical target configuration the maximum q’’ for DT to reach its triple point is
only about 0.6 W/cm2 for a 6-m radius chamber.– This would place an unreasonable constraint on background gas density that might be
required for wall protection.
• Adding an outer foam layer would increase the allowable q’’for DT to reach its triple point
– e.g. a 152m 10% dense foam layer would increase q’’ up to 7.5 W/cm2
• For increased target thermal robustness, it is preferable to have the maximum thickness and porosity outer foam layer which can still accommodate the target physics and structural integrity requirements.
• Allowing for vapor formation would relax the target thermal constraint– A simple thermo-mechanical model was developed to help in better understanding
the DT phase change process. – A thicker plastic overcoat was found preferable to reduce the vapor region thickness
– A ~1% change in DT/foam region density corresponds to ~ 3m of vapor region – If this were acceptable, the maximum allowable q’’ is ~4 W/cm2 for
the original target design and ~ 9 W/cm2 for a target design with 72-m thick, 25%-dense outer insulating foam layer and an 8-m thick plastic overcoat - In both cases, the corresponding hoop stresses in the plastic coating are less than the
anticipated ultimate tensile strength.

December 5-6, 2002 HAPL Program Workshop, NRL, Washington, D.C.
20
Conclusions (II)• The results from the simple thermo-mechanical model have helped to highlight
benefits of relaxing DT vapor formation constraint and of including design modifications such as an insulating outer layer
• However, this model has limitations and a better understanding of the phase change processes would be obtained from a multi-D, fully integrated model including interactions of key processes such as:- Effect of 2-D heat flux variation on vapor gap formation
- Insulating effect of vapor gap formation
- Local effect of latent heat of vaporization effect
- Nucleation boiling based on local conditions
- Non-rigid DT ice assumption
• This also indicates the need for an experimental effort to better characterize the
DT multi-phase behavior at the plastic overcoat interface ideally by using or possibly by simulating the actual materials.
• Guidance is needed from the target physics perspective to understand better the constraints and limitations imposed on such actions.
These issues will be discussed as part of the target workshop tomorrow
December 5-6, 2002 HAPL Program Workshop, NRL, Washington, D.C.
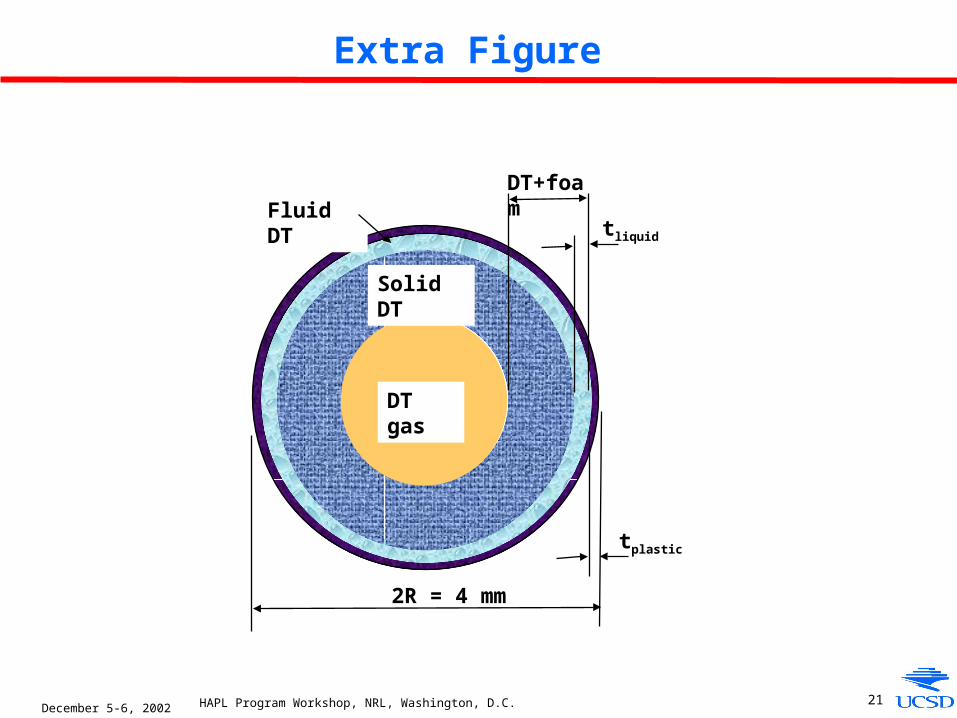
21
Extra Figure
2R = 4 mm
tplastic
DT gas
DT+foamFluid DT
Solid DT
tliquid