debt investor presentation q1-3/2019 - op
TRANSCRIPT
©O
P
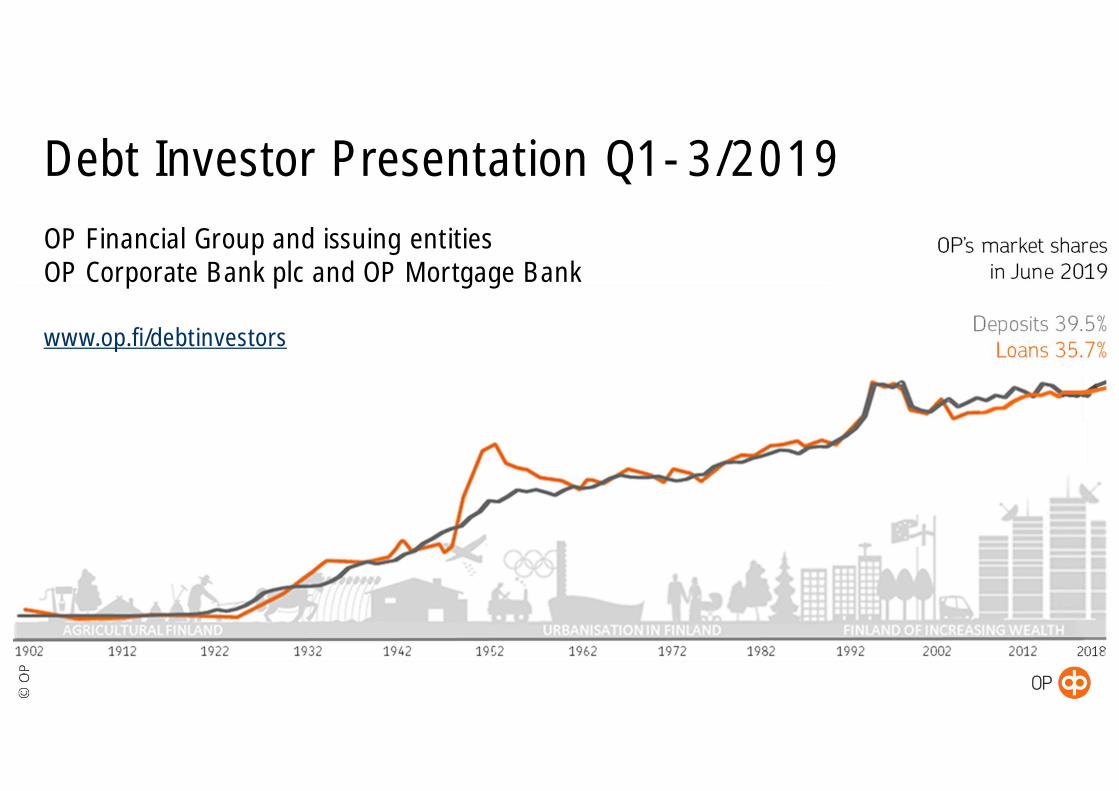
Debt Investor Presentation Q1-3/2019OP Financial Group and issuing entitiesOP Corporate Bank plc and OP Mortgage Bank
www.op.fi/debtinvestors

©O
P
DisclaimerCertain statements in this presentation are based on the beliefs of our management as well as assumptions made by andinformation currently available to the management. All forward-looking statements in this presentation expressing themanagement’s expectations, beliefs, estimates, forecasts, projections and assumptions are based on the current view of thefuture development in the operating environment and the future financial performance of OP Financial Group and its variousfunctions. No assurance can be given that such expectations will prove to have been correct. Accordingly, results may differmaterially from those set out in the forward-looking statements as a result of various factors. OP Financial Group has usedsources of information which it considers to be reliable, and the accuracy and reliability of which it has sought to establish to thebest of its ability, but it can nevertheless not guarantee their accuracy or reliability.
A number of different factors may cause the actual performance to deviate significantly from the forward-looking statements inthe presentations. Our financial reports also describe risks and factors that could affect our future performance and the industryin which we operate. Should one or more of these risks or uncertainties materialise or should any underlying assumptions proveto be incorrect, our actual financial position or results of operations could materially differ from that presented as anticipated,believed, estimated or expected. The views and other information provided are current as at the date of when such informationwas provided and may be subject to change without notice. OP Financial Group does not undertake and is not under anyobligation to update any of the forward-looking statements or to conform such statements to actual results, except as may berequired by law or applicable stock exchange regulations.
Past performance is no guide to future performance. Persons needing advice should consult an independent financial, legal or taxadviser.
2
©O
P
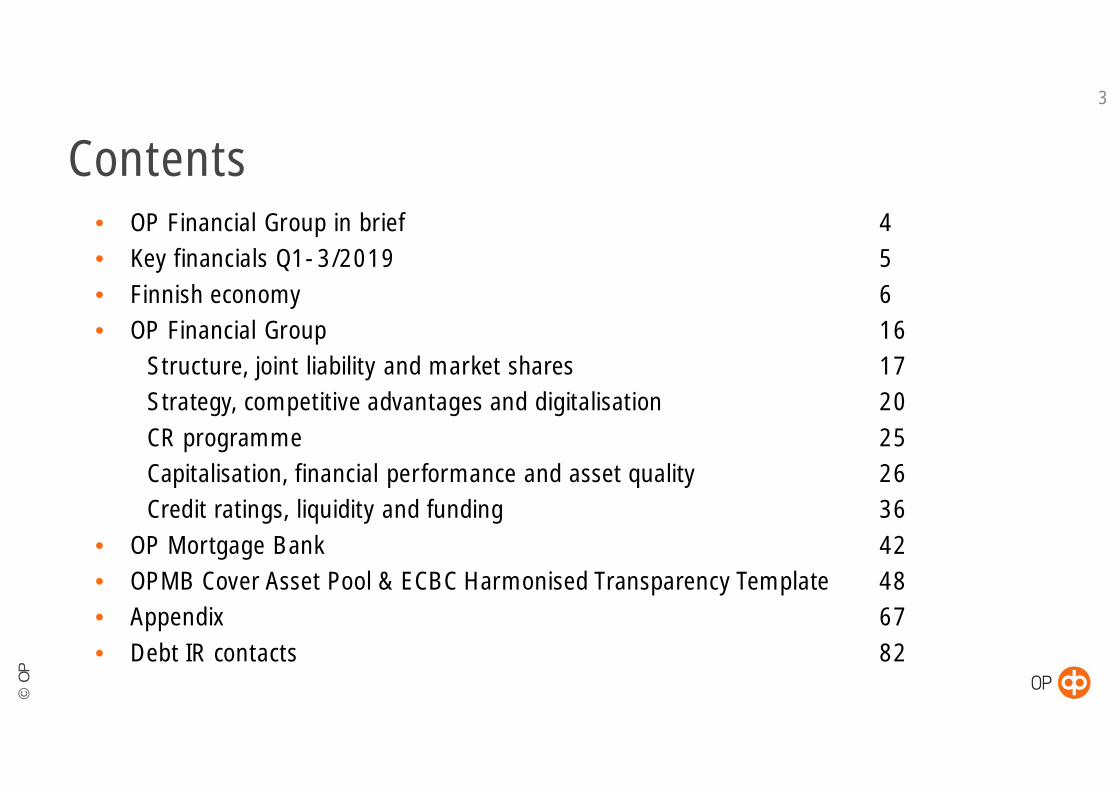
Contents• OP Financial Group in brief 4• Key financials Q1-3/2019 5• Finnish economy 6• OP Financial Group 16ü Structure, joint liability and market shares 17ü Strategy, competitive advantages and digitalisation 20ü CR programme 25ü Capitalisation, financial performance and asset quality 26ü Credit ratings, liquidity and funding 36
• OP Mortgage Bank 42• OPMB Cover Asset Pool & ECBC Harmonised Transparency Template 48• Appendix 67• Debt IR contacts 82
3

©O
P
HIGH CREDIT RATINGS
SOLID CAPITAL POSITION
MARKET LEADER IN FINLAND
FINNISH RISK EXPOSURE
4
CET1 ratioat end-Sep2019
Market sharein LoansJune, 2019
€147 bnend-Sep 2019
19.6%
35.7% 39.5% 33.6% 26.4% Moody’s Aa3S&P AA-
Moody’s AaaS&P AAA
OP Corporate Bankplc
OP Mortgage Bank’scovered bonds
Market sharein Non-lifeInsurance 2018
Market sharein DepositsJune, 2019
Co-operative OP Financial Group in brief
Total capital ratioat end-Sep2019
21.2%
TOTAL ASSETS DIVERSIFIED EBT(generated by the business lines in Q1-3/19)
JOINT LIABILITYCentral institution, OP Cooperative, and the member creditinstitutions (incl. both issuing entities) of the amalgamationare jointly liable for each others’ debts and commitments,by virtue of the Finnish law.
Leverage ratioat end-Sep2019
8.6%
Market sharein Life Insurance2018
©O
P
5
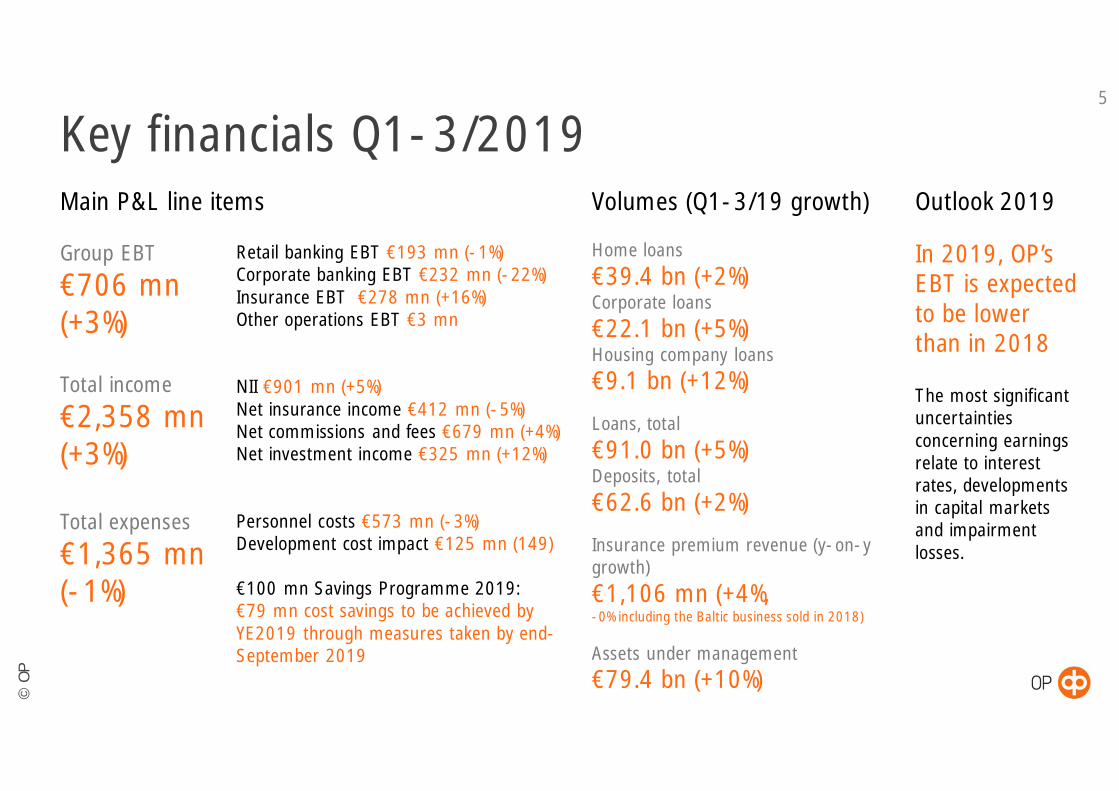
Key financials Q1-3/2019Outlook 2019
In 2019, OP’sEBT is expectedto be lowerthan in 2018
The most significantuncertaintiesconcerning earningsrelate to interestrates, developmentsin capital marketsand impairmentlosses.
Group EBT
€706 mn(+3%)
Total income
€2,358 mn(+3%)
Total expenses
€1,365 mn(-1%)
Retail banking EBT €193 mn (-1%)Corporate banking EBT €232 mn (-22%)Insurance EBT €278 mn (+16%)Other operations EBT €3 mn
NII €901 mn (+5%)Net insurance income €412 mn (-5%)Net commissions and fees €679 mn (+4%)Net investment income €325 mn (+12%)
Personnel costs €573 mn (-3%)Development cost impact €125 mn (149)
€100 mn Savings Programme 2019:€79 mn cost savings to be achieved byYE2019 through measures taken by end-September 2019
Volumes (Q1-3/19 growth)
Home loans€39.4 bn (+2%)Corporate loans€22.1 bn (+5%)Housing company loans€9.1 bn (+12%)
Loans, total€91.0 bn (+5%)Deposits, total€62.6 bn (+2%)
Insurance premium revenue (y-on-ygrowth)€1,106 mn (+4%,-0% including the Baltic business sold in 2018)
Assets under management€79.4 bn (+10%)
Main P&L line items
©O
P
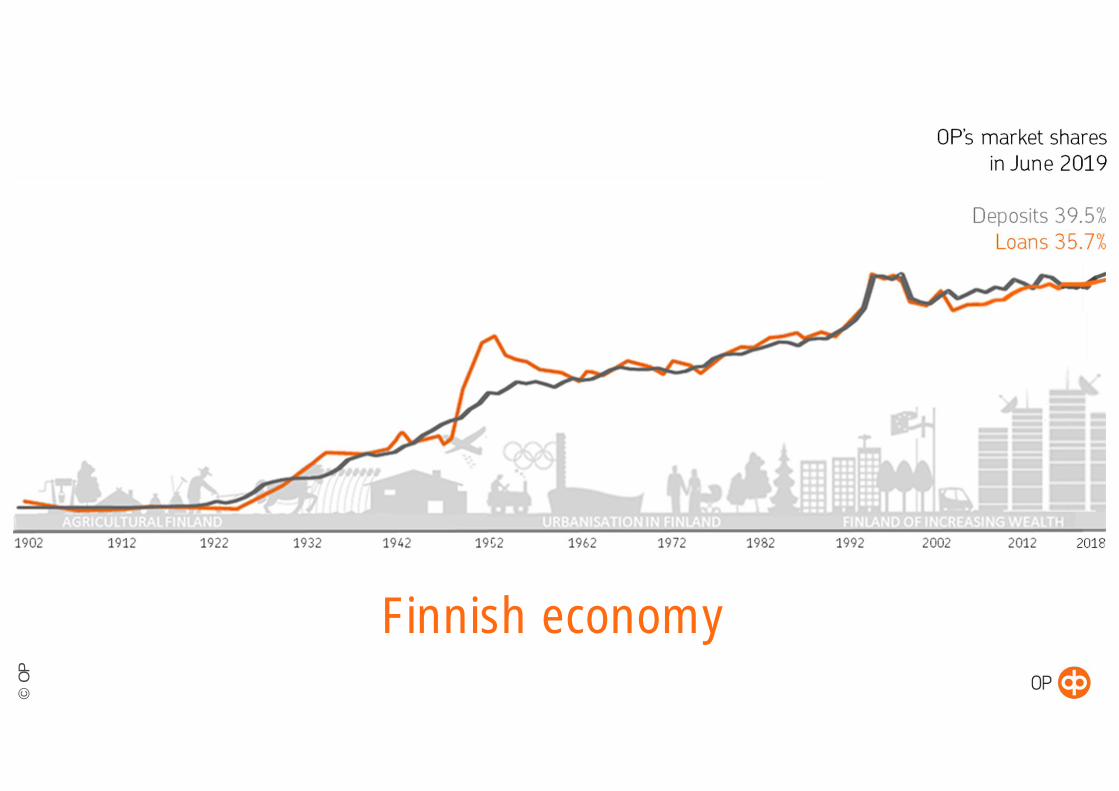
Finnish economy
© OP
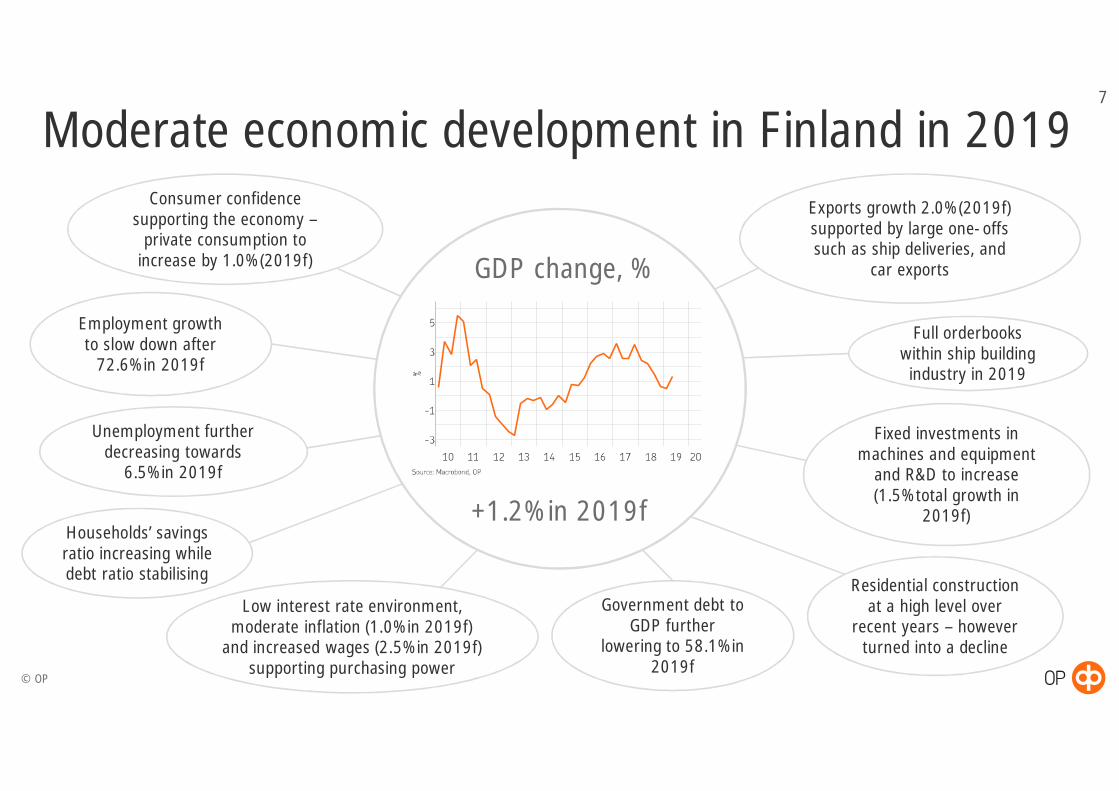
Moderate economic development in Finland in 2019Consumer confidence
supporting the economy –private consumption to
increase by 1.0% (2019f)
Exports growth 2.0% (2019f)supported by large one-offssuch as ship deliveries, and
car exports
Employment growthto slow down after
72.6% in 2019f
Full orderbookswithin ship buildingindustry in 2019
Fixed investments inmachines and equipment
and R&D to increase(1.5% total growth in
2019f)
Unemployment furtherdecreasing towards
6.5% in 2019f
Government debt toGDP further
lowering to 58.1% in2019f
Residential constructionat a high level over
recent years – howeverturned into a decline
Households’ savingsratio increasing whiledebt ratio stabilising
7
GDP change, %
Low interest rate environment,moderate inflation (1.0% in 2019f)
and increased wages (2.5% in 2019f)supporting purchasing power
+1.2% in 2019f
©O
P
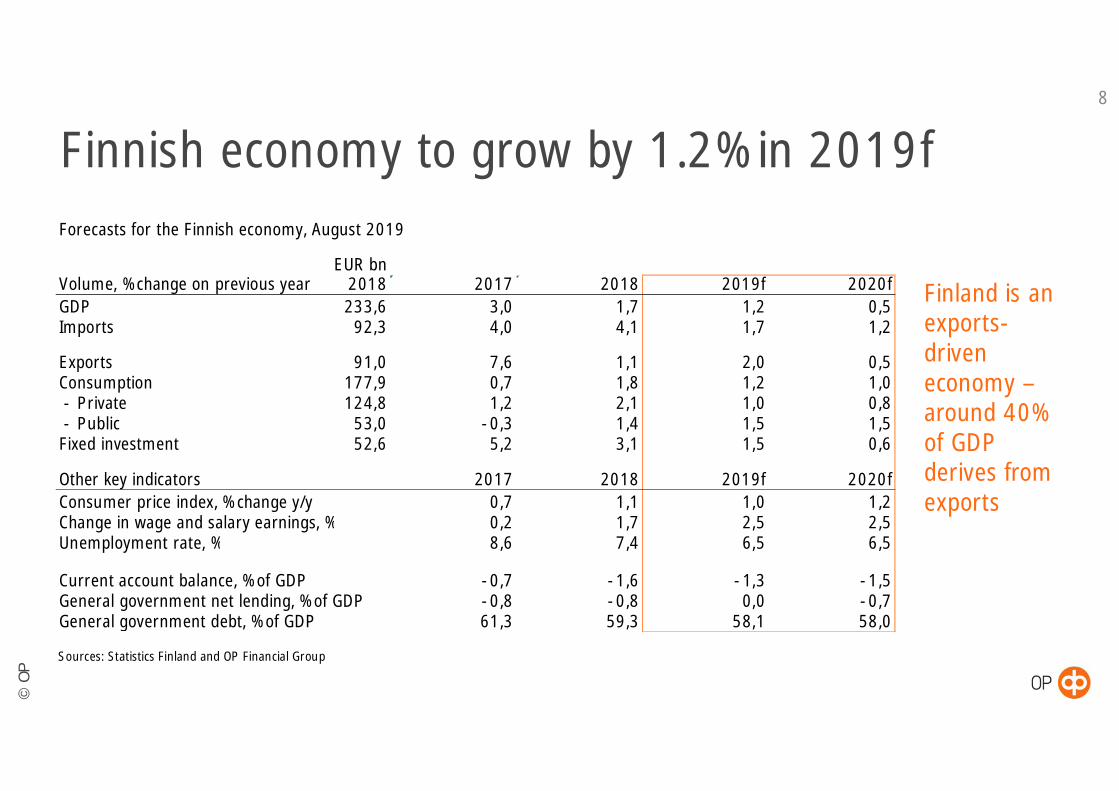
Finnish economy to grow by 1.2% in 2019f8
Finland is anexports-driveneconomy –around 40%of GDPderives fromexports
Forecasts for the Finnish economy, August 2019
EUR bnVolume, % change on previous year 2018 2017 2018 2019f 2020fGDP 233,6 3,0 1,7 1,2 0,5Imports 92,3 4,0 4,1 1,7 1,2
Exports 91,0 7,6 1,1 2,0 0,5Consumption 177,9 0,7 1,8 1,2 1,0 - Private 124,8 1,2 2,1 1,0 0,8 - Public 53,0 -0,3 1,4 1,5 1,5Fixed investment 52,6 5,2 3,1 1,5 0,6
Other key indicators 2017 2018 2019f 2020fConsumer price index, % change y/y 0,7 1,1 1,0 1,2Change in wage and salary earnings, % 0,2 1,7 2,5 2,5Unemployment rate, % 8,6 7,4 6,5 6,5
Current account balance, % of GDP -0,7 -1,6 -1,3 -1,5General government net lending, % of GDP -0,8 -0,8 0,0 -0,7General government debt, % of GDP 61,3 59,3 58,1 58,0
Sources: Statistics Finland and OP Financial Group

©O
P
Balanced goods exports structure bycommodity group
9
Goods exports by commodity group Goods exports around 2/3 ofcommodity group 2008–18 Finnish exports
Source: Macrobond, Finnish Customs Source: Macrobond, OPLatest values: Q2/2019
©O
P
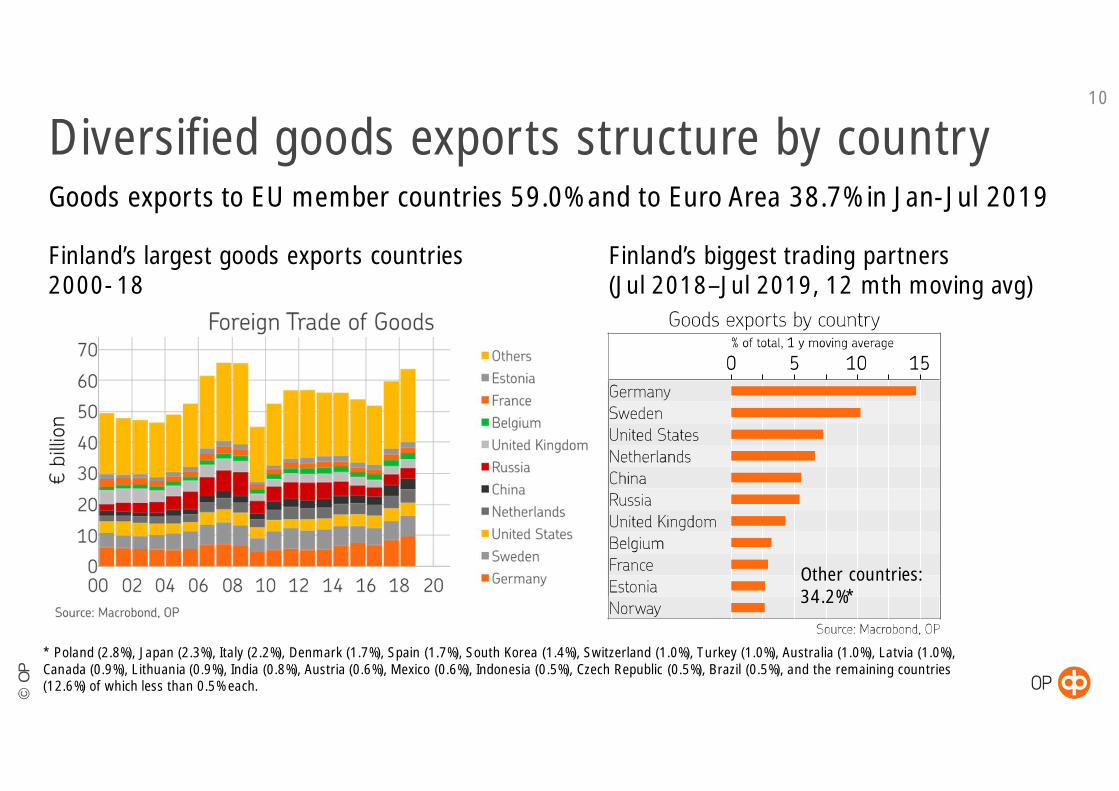
Diversified goods exports structure by country10
Finland’s largest goods exports countries Finland’s biggest trading partners2000-18 (Jul 2018–Jul 2019, 12 mth moving avg)
Goods exports to EU member countries 59.0% and to Euro Area 38.7% in Jan-Jul 2019
Other countries:34.2%*
* Poland (2.8%), Japan (2.3%), Italy (2.2%), Denmark (1.7%), Spain (1.7%), South Korea (1.4%), Switzerland (1.0%), Turkey (1.0%), Australia (1.0%), Latvia (1.0%),Canada (0.9%), Lithuania (0.9%), India (0.8%), Austria (0.6%), Mexico (0.6%), Indonesia (0.5%), Czech Republic (0.5%), Brazil (0.5%), and the remaining countries(12.6%) of which less than 0.5% each.
©O
P
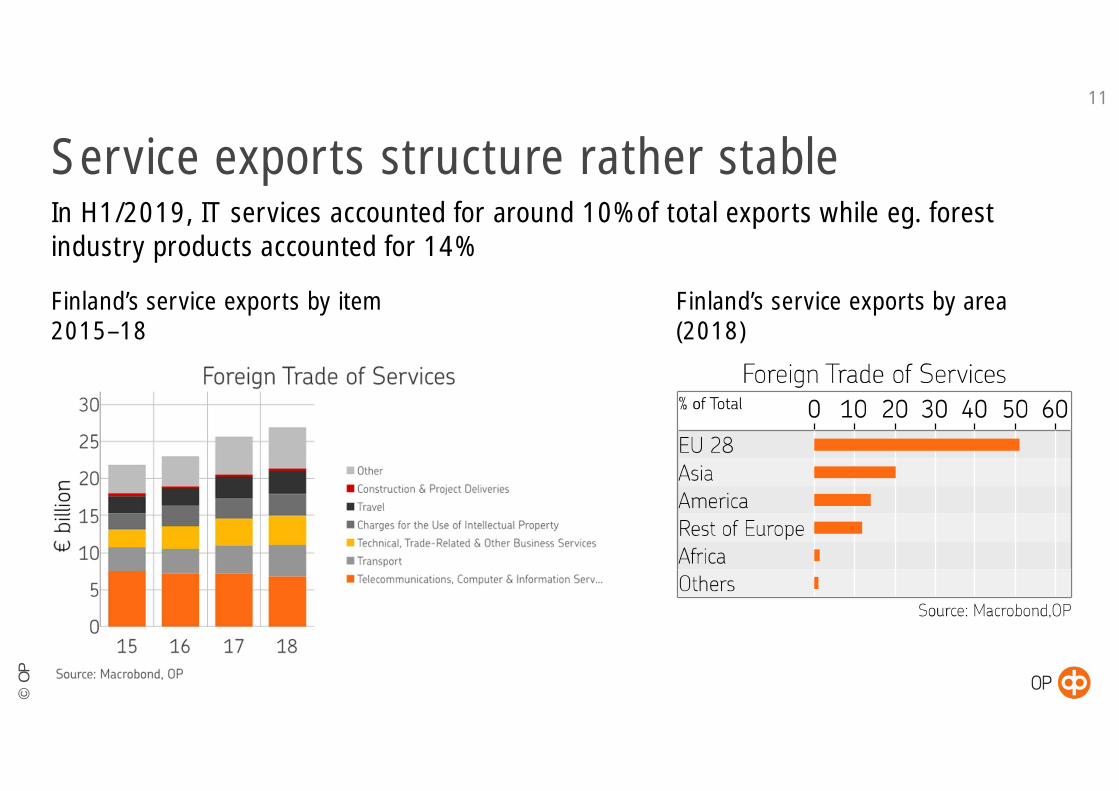
Service exports structure rather stable11
Finland’s service exports by item Finland’s service exports by area2015–18 (2018)
In H1/2019, IT services accounted for around 10% of total exports while eg. forestindustry products accounted for 14%
©O
P
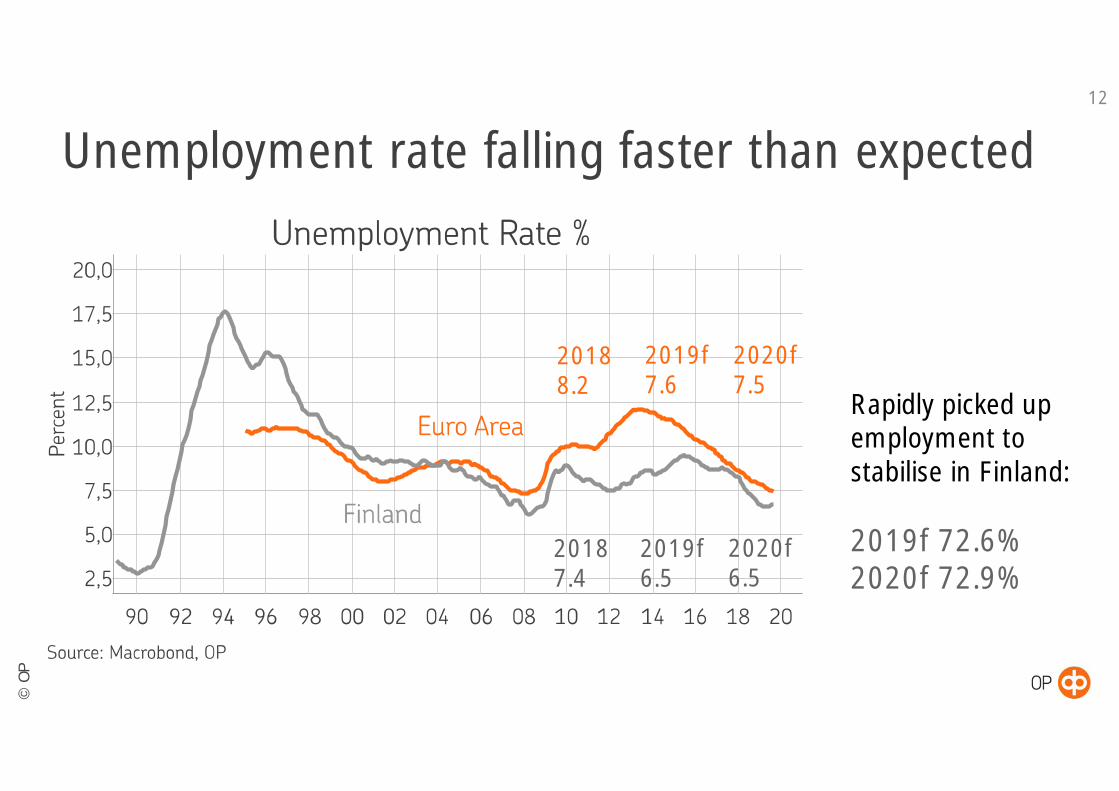
Unemployment rate falling faster than expected12
Rapidly picked upemployment tostabilise in Finland:
2019f 72.6%2020f 72.9%
20187.4
2019f6.5
20188.2
2019f7.6
2020f7.5
2020f6.5

©O
P
Average house prices and households’ debt13
In Finland, housing market picking up and average house prices estimated to increaseby 0–1.5% in 2019
Latest values: Q2/2019 Latest values: 2018
©O
P
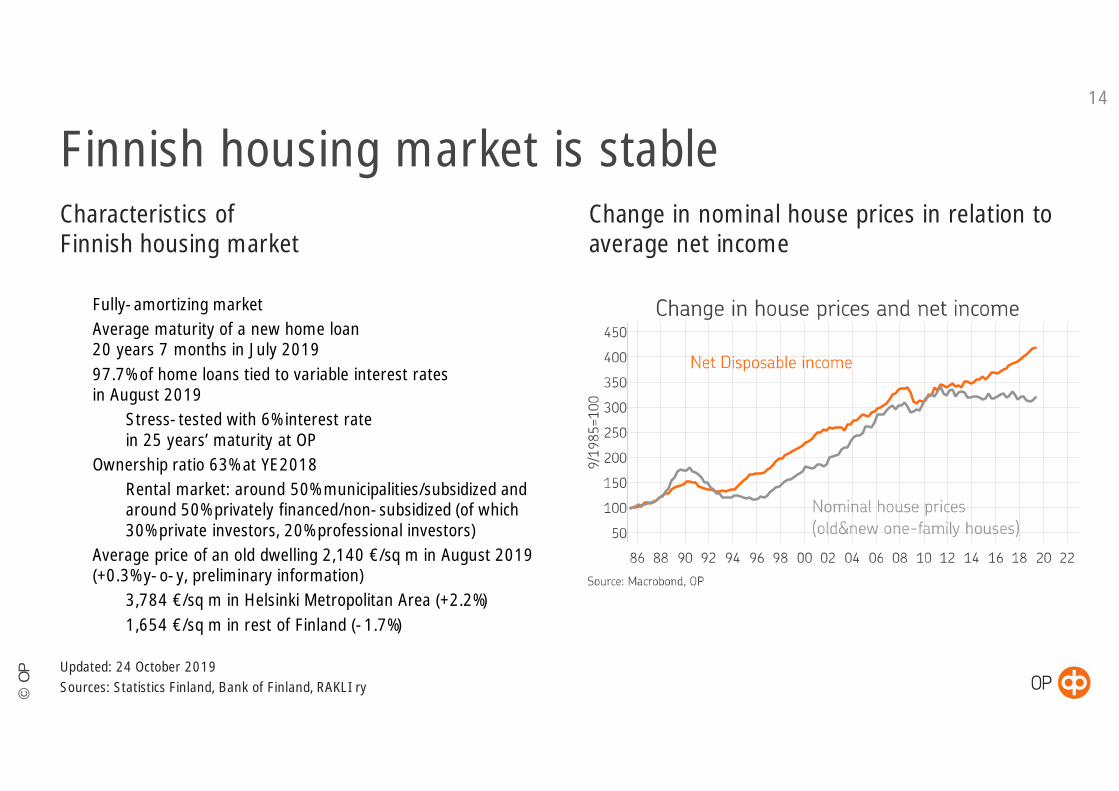
Finnish housing market is stable14
Characteristics ofFinnish housing market
ü Fully-amortizing marketü Average maturity of a new home loan
20 years 7 months in July 2019ü 97.7% of home loans tied to variable interest rates
in August 2019ü Stress-tested with 6% interest rate
in 25 years’ maturity at OPü Ownership ratio 63% at YE2018ü Rental market: around 50% municipalities/subsidized and
around 50% privately financed/non-subsidized (of which30% private investors, 20% professional investors)
ü Average price of an old dwelling 2,140 €/sq m in August 2019(+0.3% y-o-y, preliminary information)ü 3,784 €/sq m in Helsinki Metropolitan Area (+2.2%)ü 1,654 €/sq m in rest of Finland (-1.7%)
Updated: 24 October 2019Sources: Statistics Finland, Bank of Finland, RAKLI ry
Change in nominal house prices in relation toaverage net income
©O
P
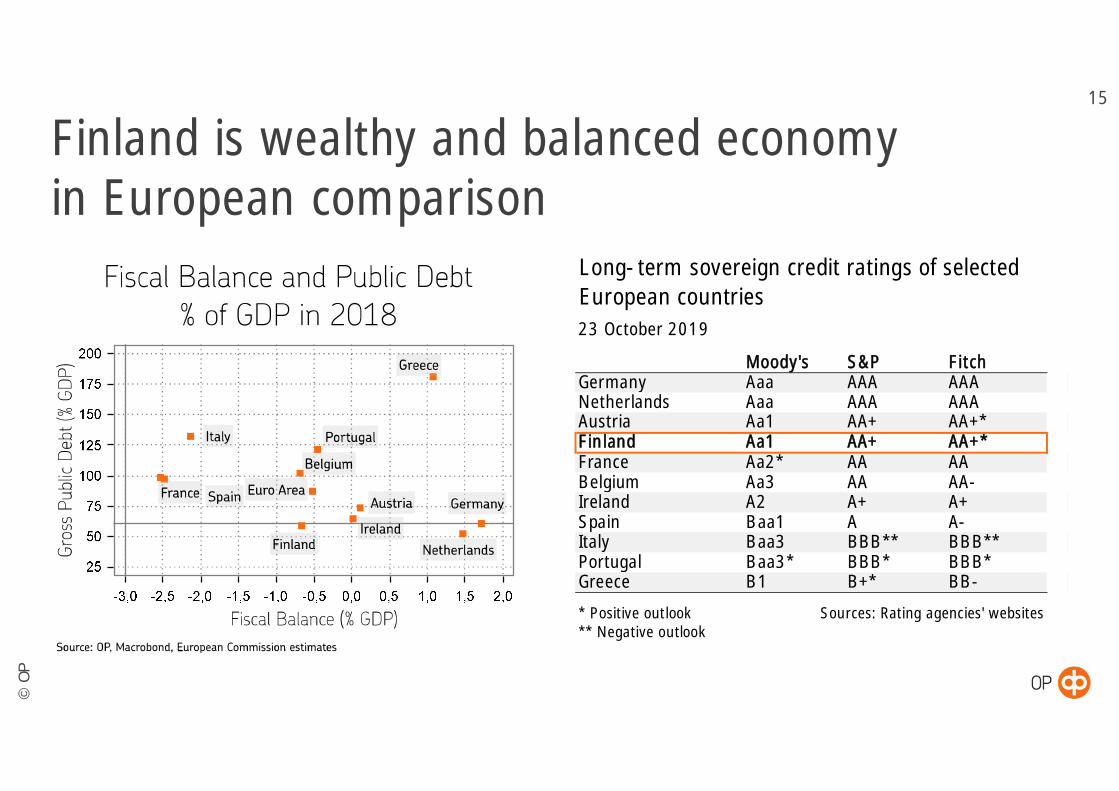
Finland is wealthy and balanced economyin European comparison
15
Long-term sovereign credit ratings of selectedEuropean countries
Moody's S&P FitchGermany Aaa AAA AAANetherlands Aaa AAA AAAAustria Aa1 AA+ AA+*Finland Aa1 AA+ AA+*France Aa2* AA AABelgium Aa3 AA AA-Ireland A2 A+ A+Spain Baa1 A A-Italy Baa3 BBB** BBB**Portugal Baa3* BBB* BBB*Greece B1 B+* BB-
* Positive outlook Sources: Rating agencies' websites** Negative outlook
23 October 2019

©O
P
OP Financial Group
©O
P
17
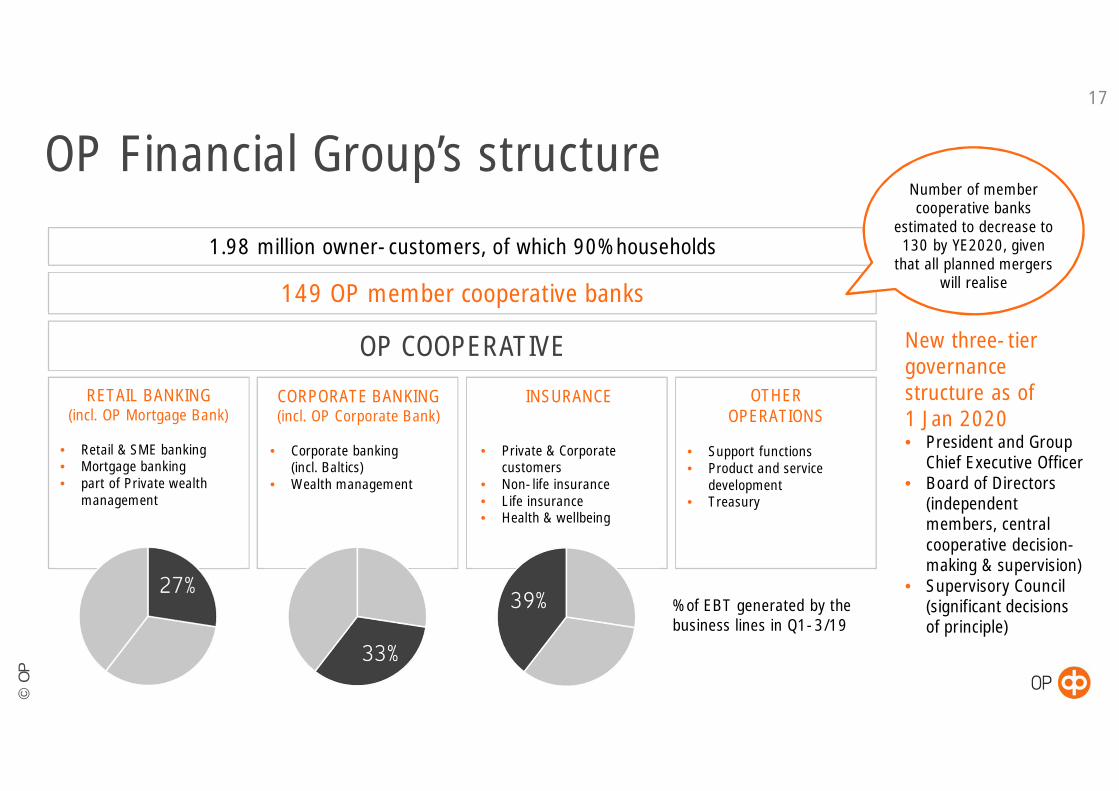
OP Financial Group’s structure
RETAIL BANKING(incl. OP Mortgage Bank)
• Retail & SME banking• Mortgage banking• part of Private wealth
management
INSURANCE
• Private & Corporatecustomers
• Non-life insurance• Life insurance• Health & wellbeing
OP COOPERATIVE
149 OP member cooperative banks
OTHEROPERATIONS
• Support functions• Product and service
development• Treasury
1.98 million owner-customers, of which 90% households
% of EBT generated by thebusiness lines in Q1-3/19
CORPORATE BANKING(incl. OP Corporate Bank)
• Corporate banking(incl. Baltics)
• Wealth management
Number of membercooperative banks
estimated to decrease to130 by YE2020, given
that all planned mergerswill realise
New three-tiergovernancestructure as of1 Jan 2020• President and Group
Chief Executive Officer• Board of Directors
(independentmembers, centralcooperative decision-making & supervision)
• Supervisory Council(significant decisionsof principle)
©O
P
ü Under the Act on the Amalgamation of Deposit Banks (Laki talletuspankkien yhteenliittymästä 599/2010),OP Cooperative and the member credit institutions are jointly liable for each others’ debts.
ü The member credit institutions include OP Corporate Bank plc, Helsinki Area Cooperative Bank, OPMortgage Bank, OP Card Company Plc, OP Customer Services Ltd* and the member cooperative banks.Insurance companies or other group entities do not fall within the scope of joint liability.
ü If a creditor has not received payment from a member credit institution on a due debt, the creditor maydemand payment from OP Cooperative.
ü The member credit institutions must pay proportionate shares of the amount OP Cooperative has paid,and upon insolvency of OP Cooperative they have an unlimited liability to pay the debts of OPCooperative.
ü OP Cooperative and the member credit institutions are under an obligation to take support actions toprevent a member credit institution’s liquidation.
ü Further information on the joint liability available in the Base Prospectuses of OP Corporate Bank plc andOP Mortgage Bank.
* OP Customer Services Ltd is planned to be merged into OP Card Company Plc on 30 November 2019
Joint liability within OP Financial Group18
©O
P
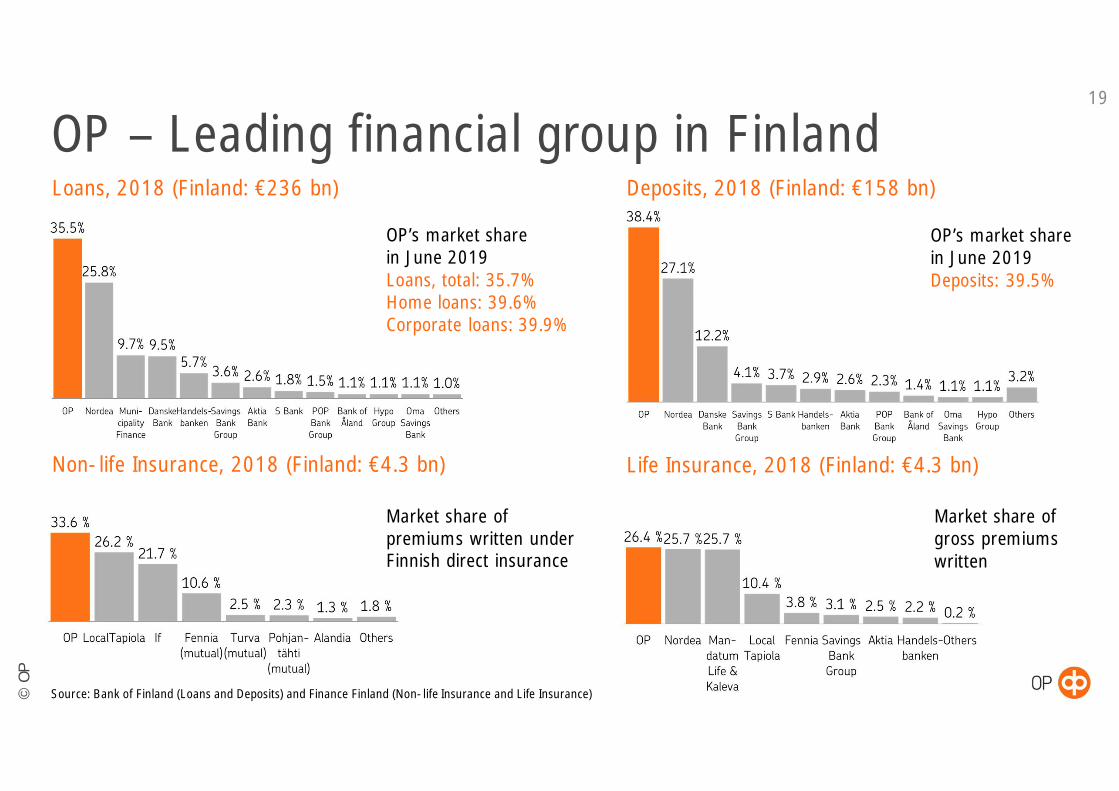
Loans, 2018 (Finland: €236 bn) Deposits, 2018 (Finland: €158 bn)
OP – Leading financial group in Finland
OP’s market sharein June 2019Loans, total: 35.7%Home loans: 39.6%Corporate loans: 39.9%
Non-life Insurance, 2018 (Finland: €4.3 bn) Life Insurance, 2018 (Finland: €4.3 bn)
Source: Bank of Finland (Loans and Deposits) and Finance Finland (Non-life Insurance and Life Insurance)
Market share ofpremiums written underFinnish direct insurance
Market share ofgross premiumswritten
19
OP’s market sharein June 2019Deposits: 39.5%
©O
P
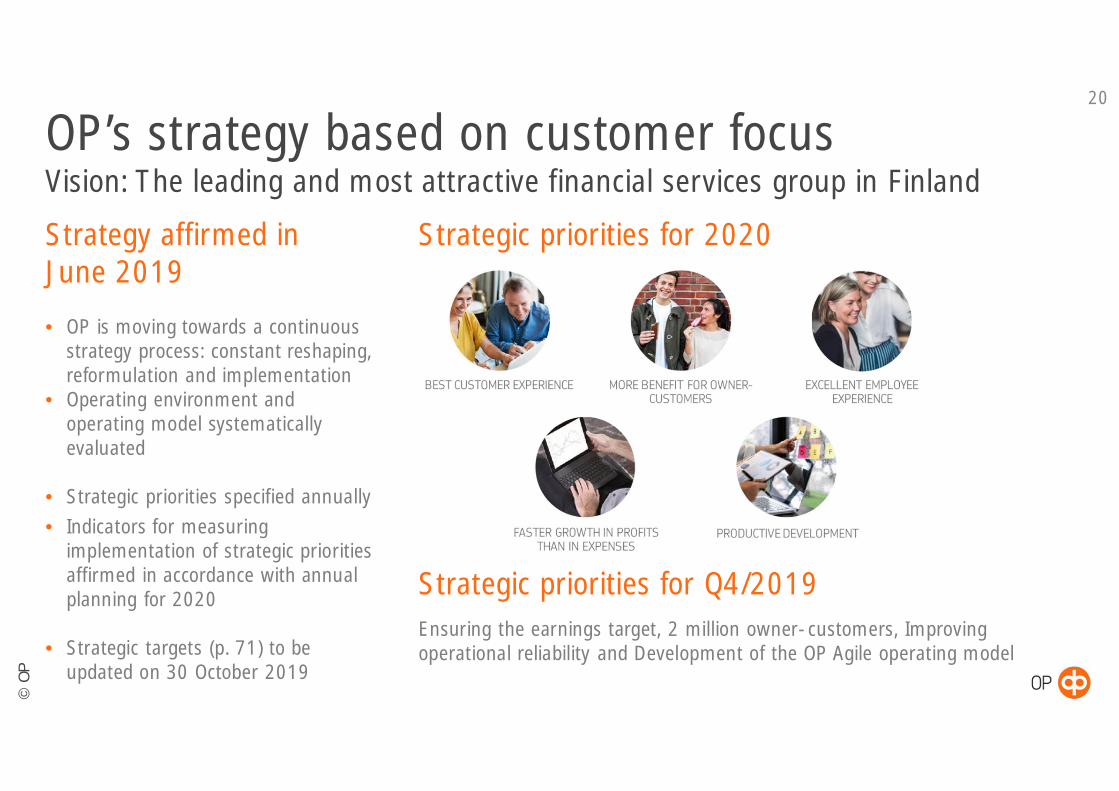
OP’s strategy based on customer focusVision: The leading and most attractive financial services group in Finland
20
Strategic priorities for 2020Strategy affirmed inJune 2019
• OP is moving towards a continuousstrategy process: constant reshaping,reformulation and implementation
• Operating environment andoperating model systematicallyevaluated
• Strategic priorities specified annually• Indicators for measuring
implementation of strategic prioritiesaffirmed in accordance with annualplanning for 2020
• Strategic targets (p. 71) to beupdated on 30 October 2019
Strategic priorities for Q4/2019Ensuring the earnings target, 2 million owner-customers, Improvingoperational reliability and Development of the OP Agile operating model

©O
P
Owner-customer* benefits in Q1-3/19
Successful integration of banking andnon-life insurance customerships, mn
Growth in number of owner-customers and successfulcross-selling supported by attractive loyalty benefits
21
+68,000owner-customersin Q1-3/19
+79%since 2005
Solid growth in number of owner-customers, mn
1.3 mn***combined bankingand non-lifeinsurance customersat end-Sep 2019
35%of total number ofOP customers
€191 mnaccrued OP Bonuses**
€88 mnto banking and wealthmanagement service fees
€95 mnto insurance policy fees
€3.0 bninvestments in ProfitShares
€72 mnestimated accruedinterests (returntarget 3.25%)
€24 mndiscounts on daily banking
€52 mnloyalty discounts on non-life insurance policies
€4 mnbenefit of selling, buying and trading of mostmutual funds free of charge
* Membership fee varies depending on the OP cooperative bank (eg. 100€ at Helsinki Area Cooperative Bank)** An owner-customer’s loans, savings, investments and insurance premiums generate OP bonuses 0.25% of monthly transactions*** Calculation method applied to the number of customers has been changed as of September 2019, due to a change in definition of a party linked to a customer
©O
P
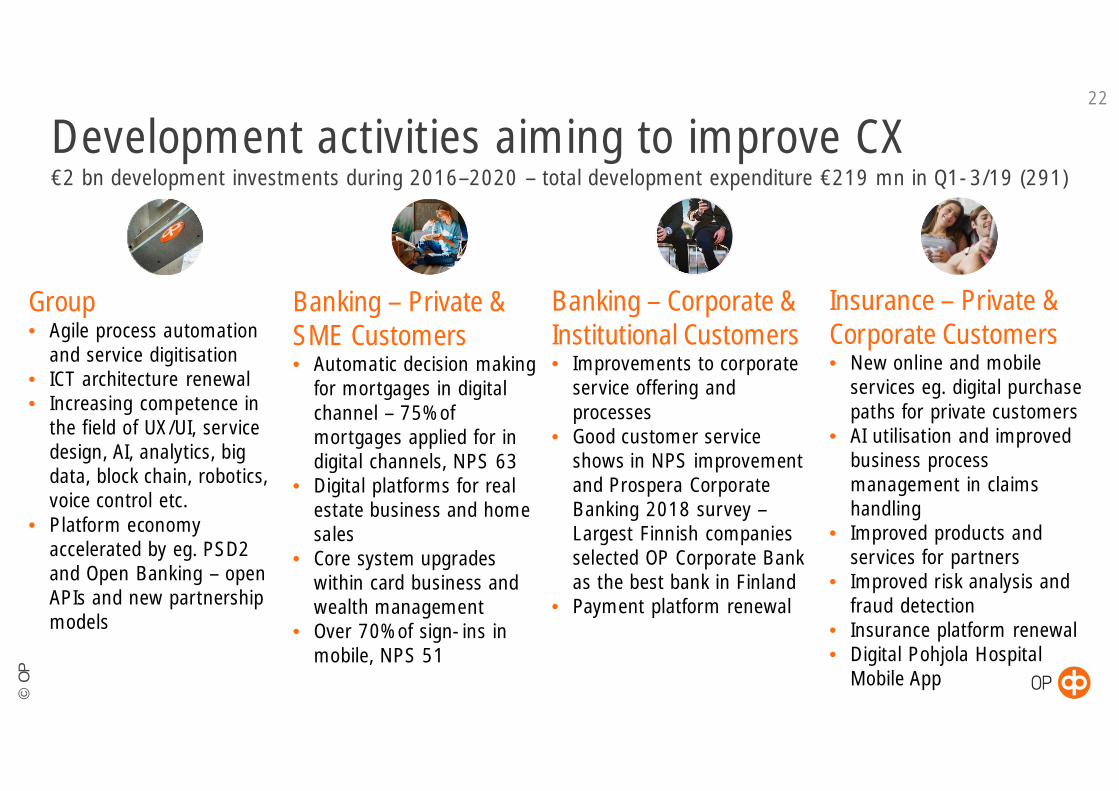
Development activities aiming to improve CX€2 bn development investments during 2016–2020 – total development expenditure €219 mn in Q1-3/19 (291)
22
Banking – Private &SME Customers• Automatic decision making
for mortgages in digitalchannel – 75% ofmortgages applied for indigital channels, NPS 63
• Digital platforms for realestate business and homesales
• Core system upgradeswithin card business andwealth management
• Over 70% of sign-ins inmobile, NPS 51
Group• Agile process automation
and service digitisation• ICT architecture renewal• Increasing competence in
the field of UX/UI, servicedesign, AI, analytics, bigdata, block chain, robotics,voice control etc.
• Platform economyaccelerated by eg. PSD2and Open Banking – openAPIs and new partnershipmodels
Insurance – Private &Corporate Customers• New online and mobile
services eg. digital purchasepaths for private customers
• AI utilisation and improvedbusiness processmanagement in claimshandling
• Improved products andservices for partners
• Improved risk analysis andfraud detection
• Insurance platform renewal• Digital Pohjola Hospital
Mobile App
Banking – Corporate &Institutional Customers• Improvements to corporate
service offering andprocesses
• Good customer serviceshows in NPS improvementand Prospera CorporateBanking 2018 survey –Largest Finnish companiesselected OP Corporate Bankas the best bank in Finland
• Payment platform renewal
©O
P
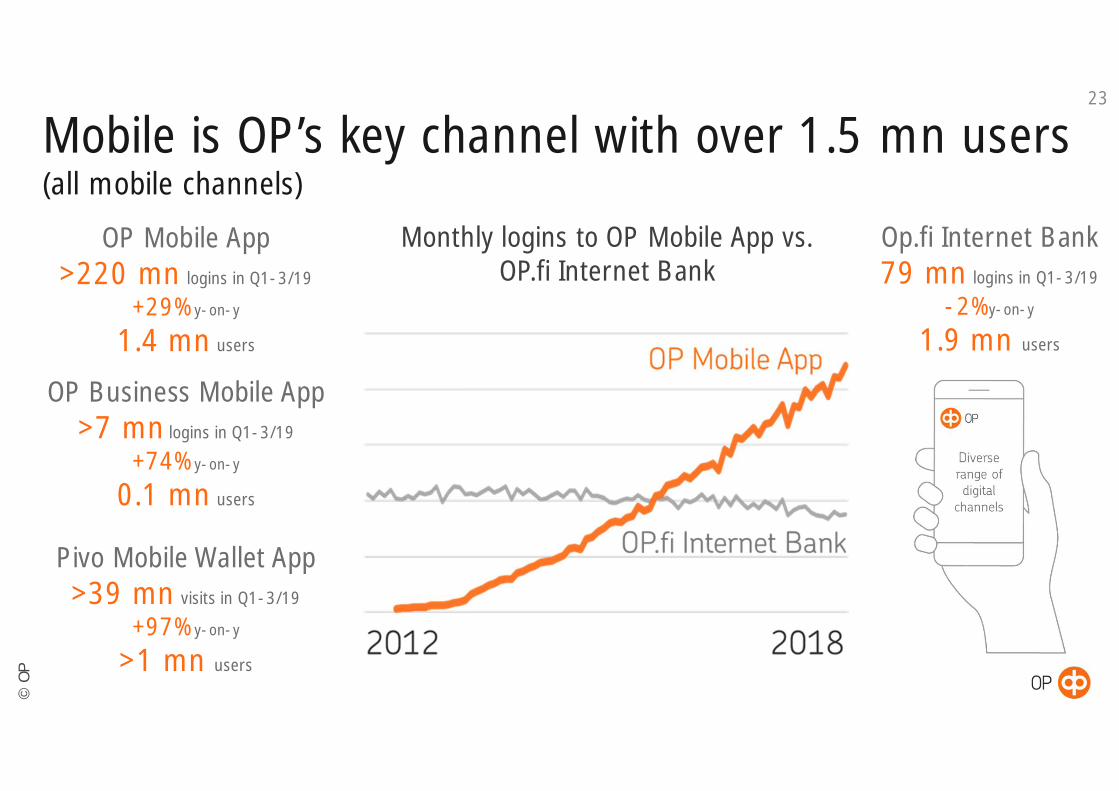
Mobile is OP’s key channel with over 1.5 mn users(all mobile channels)
OP Mobile App>220 mn logins in Q1-3/19
+29% y-on-y
1.4 mn users
Op.fi Internet Bank79 mn logins in Q1-3/19
-2% y-on-y
1.9 mn users
Monthly logins to OP Mobile App vs.OP.fi Internet Bank
OP Business Mobile App>7 mn logins in Q1-3/19
+74% y-on-y
0.1 mn users
Pivo Mobile Wallet App>39 mn visits in Q1-3/19
+97% y-on-y
>1 mn users
23
©O
P
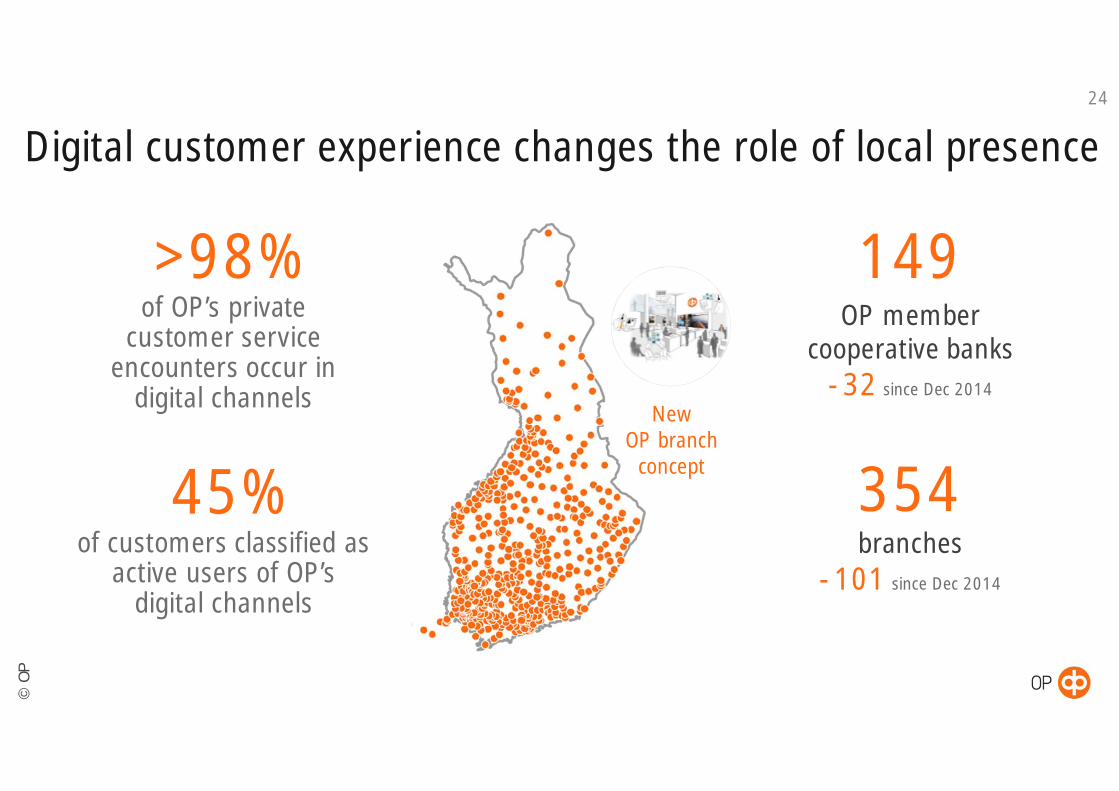
Digital customer experience changes the role of local presence
>98%of OP’s private
customer serviceencounters occur in
digital channels
149OP member
cooperative banks-32 since Dec 2014
354branches
-101 since Dec 2014
NewOP branch
concept
45%of customers classified as
active users of OP’sdigital channels
24
©O
P
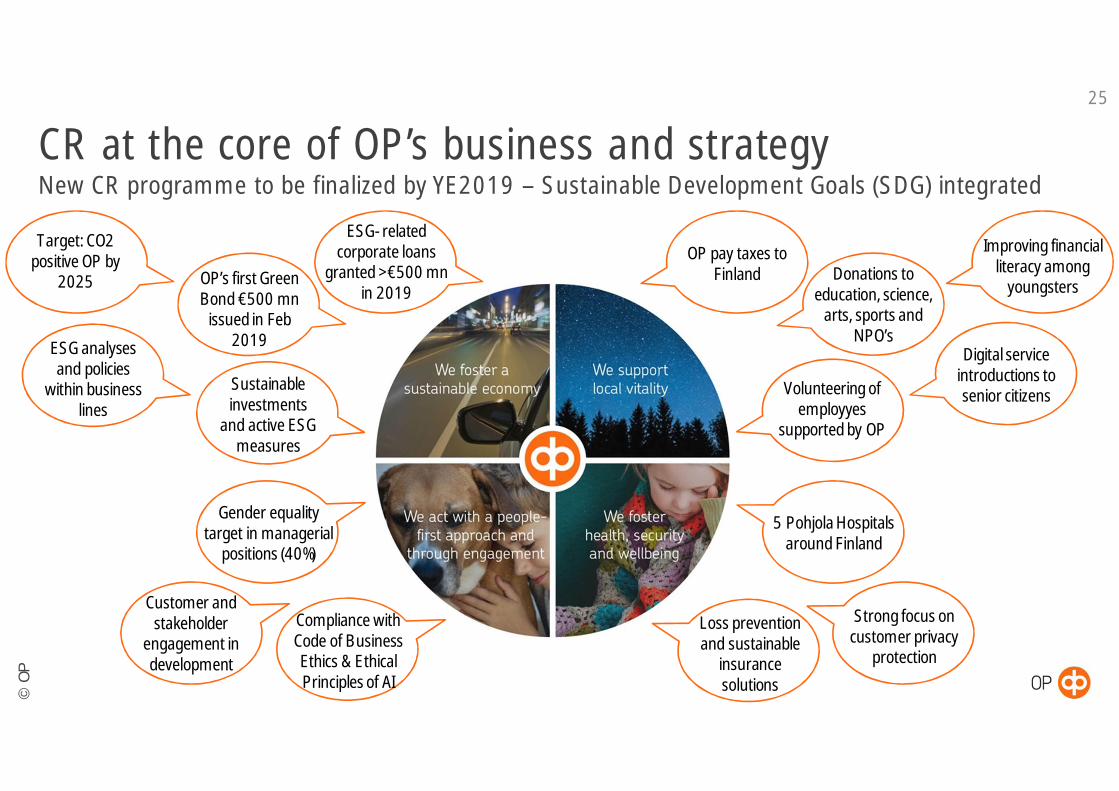
CR at the core of OP’s business and strategyNew CR programme to be finalized by YE2019 – Sustainable Development Goals (SDG) integrated
25
OP’s firstGreenBond €500 mnissued in Feb
2019
ESG-relatedcorporate loans
granted >€500 mnin 2019
Target: CO2positive OP by
2025
ESG analysesand policies
withinbusinesslines
Sustainableinvestments
and active ESGmeasures
Gender equalitytarget in managerial
positions (40%)
Donations toeducation, science,arts, sports and
NPO’s
Strong focusoncustomerprivacy
protection
Customer andstakeholder
engagement indevelopment
Compliance withCode of BusinessEthics & EthicalPrinciples of AI
5 Pohjola HospitalsaroundFinland
Loss preventionand sustainable
insurancesolutions
Improving financialliteracy among
youngsters
Digital serviceintroductions tosenior citizens
OP pay taxes toFinland
Volunteeringofemployyes
supportedby OP
©O
P
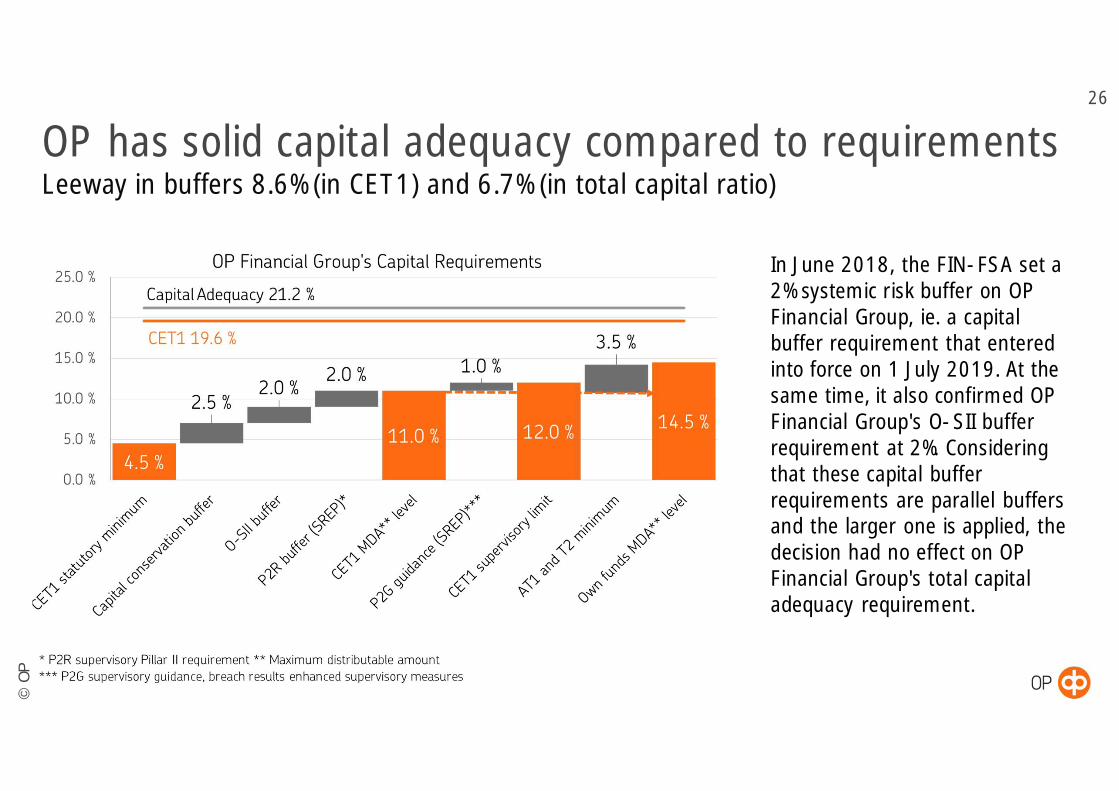
OP has solid capital adequacy compared to requirementsLeeway in buffers 8.6% (in CET1) and 6.7% (in total capital ratio)
26
In June 2018, the FIN-FSA set a2% systemic risk buffer on OPFinancial Group, ie. a capitalbuffer requirement that enteredinto force on 1 July 2019. At thesame time, it also confirmed OPFinancial Group's O-SII bufferrequirement at 2%. Consideringthat these capital bufferrequirements are parallel buffersand the larger one is applied, thedecision had no effect on OPFinancial Group's total capitaladequacy requirement.
©O
P
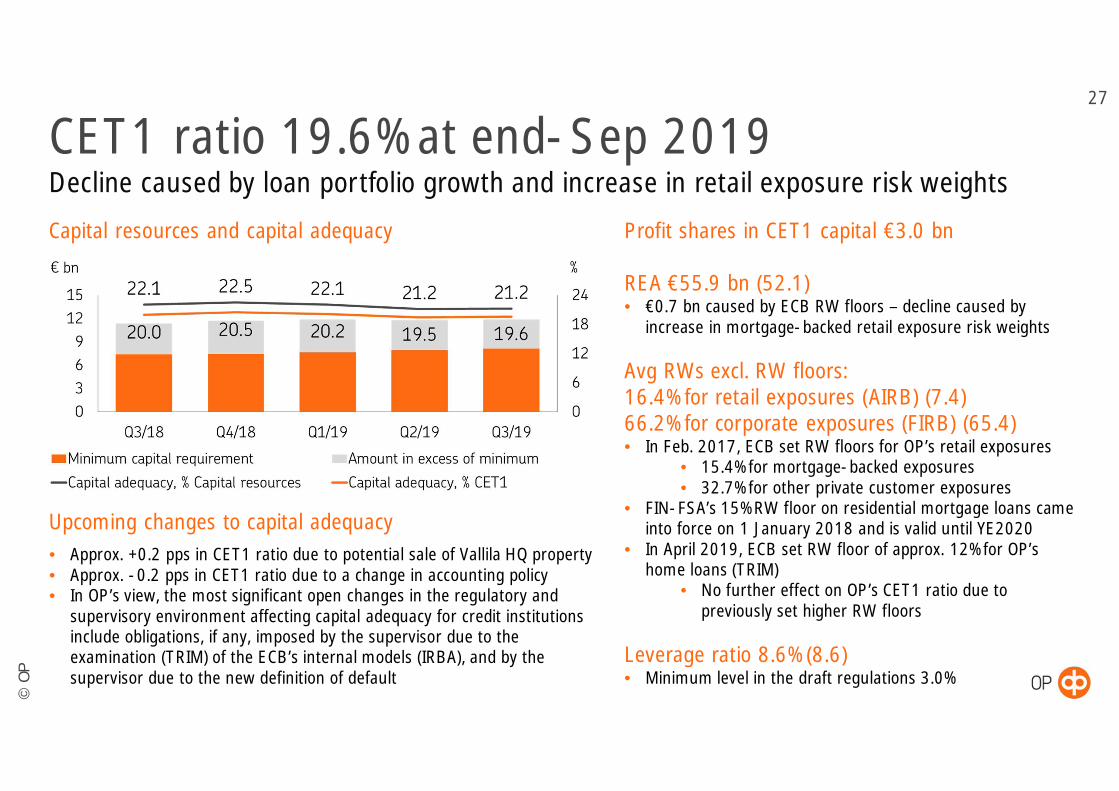
CET1 ratio 19.6% at end-Sep 2019Decline caused by loan portfolio growth and increase in retail exposure risk weights
27
Profit shares in CET1 capital €3.0 bn
REA €55.9 bn (52.1)• €0.7 bn caused by ECB RW floors – decline caused by
increase in mortgage-backed retail exposure risk weights
Avg RWs excl. RW floors:16.4% for retail exposures (AIRB) (7.4)66.2% for corporate exposures (FIRB) (65.4)• In Feb. 2017, ECB set RW floors for OP’s retail exposures
• 15.4% for mortgage-backed exposures• 32.7% for other private customer exposures
• FIN-FSA’s 15% RW floor on residential mortgage loans cameinto force on 1 January 2018 and is valid until YE2020
• In April 2019, ECB set RW floor of approx. 12% for OP’shome loans (TRIM)
• No further effect on OP’s CET1 ratio due topreviously set higher RW floors
Leverage ratio 8.6% (8.6)• Minimum level in the draft regulations 3.0%
Capital resources and capital adequacy
• Approx. +0.2 pps in CET1 ratio due to potential sale of Vallila HQ property• Approx. -0.2 pps in CET1 ratio due to a change in accounting policy• In OP’s view, the most significant open changes in the regulatory and
supervisory environment affecting capital adequacy for credit institutionsinclude obligations, if any, imposed by the supervisor due to theexamination (TRIM) of the ECB’s internal models (IRBA), and by thesupervisor due to the new definition of default
Upcoming changes to capital adequacy
©O
P
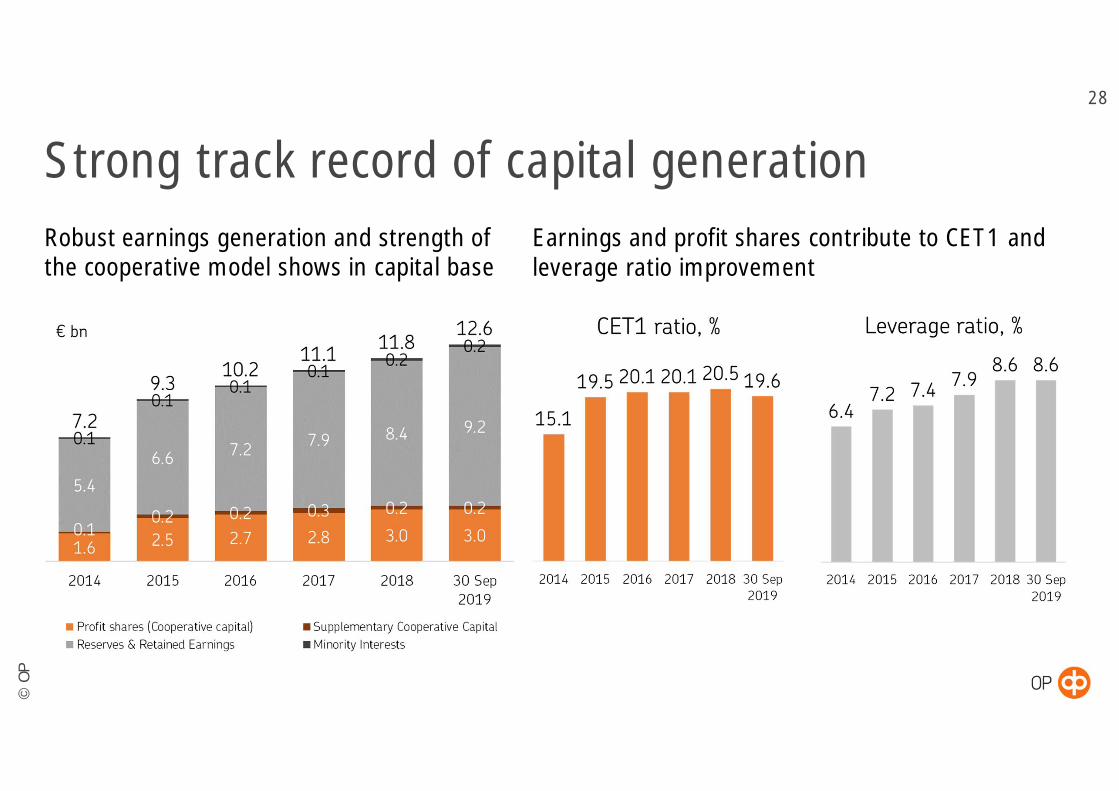
Strong track record of capital generation28
Earnings and profit shares contribute to CET1 andleverage ratio improvement
Robust earnings generation and strength ofthe cooperative model shows in capital base
©O
P
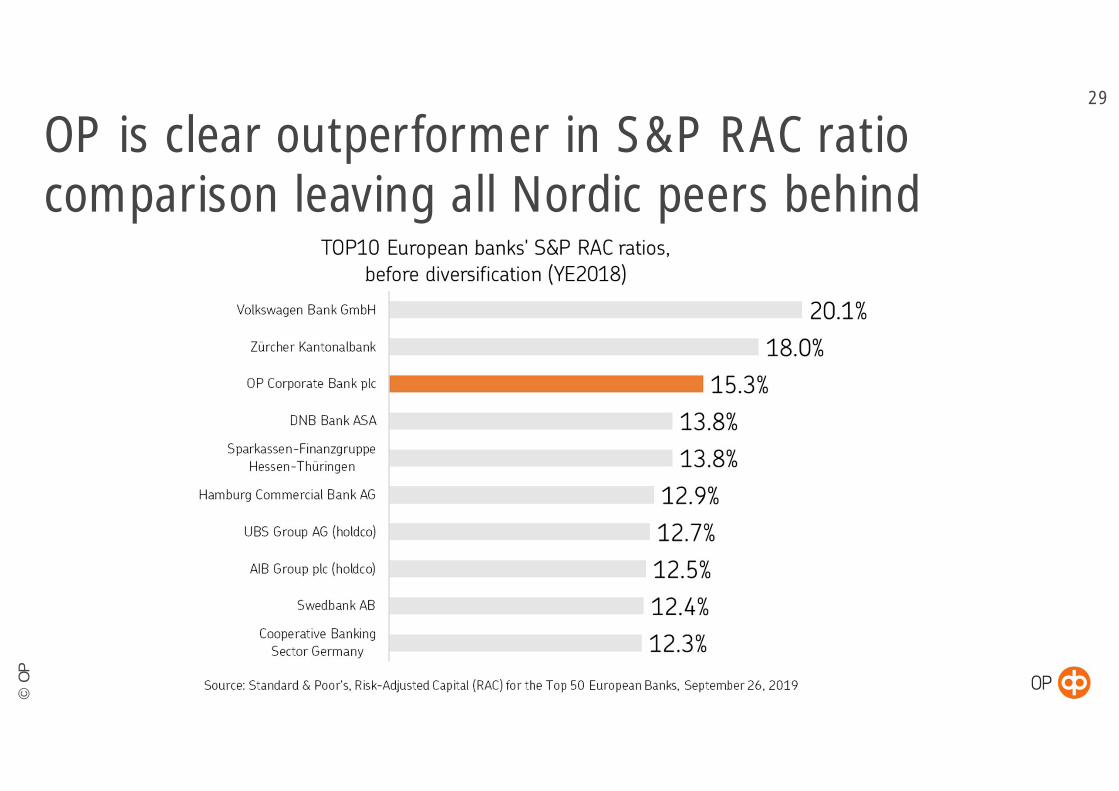
OP is clear outperformer in S&P RAC ratiocomparison leaving all Nordic peers behind
29
©O
P
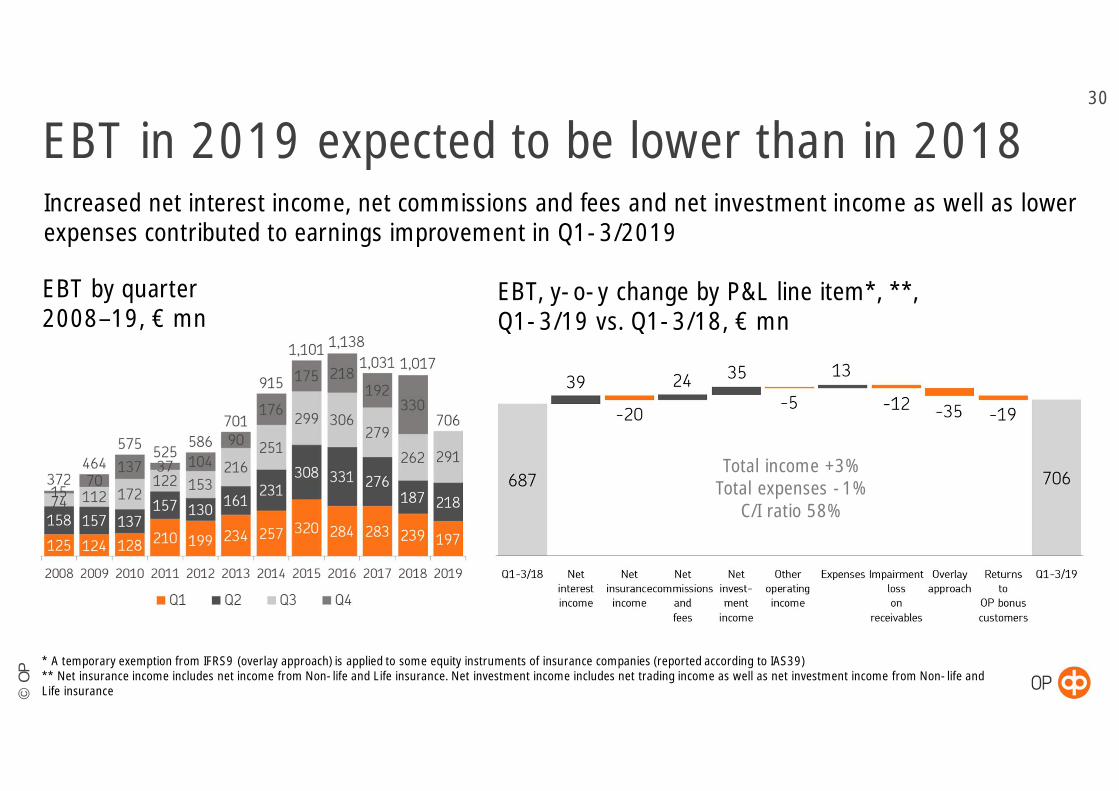
EBT by quarter2008–19, € mn
30
EBT in 2019 expected to be lower than in 2018Increased net interest income, net commissions and fees and net investment income as well as lowerexpenses contributed to earnings improvement in Q1-3/2019
* A temporary exemption from IFRS9 (overlay approach) is applied to some equity instruments of insurance companies (reported according to IAS39)** Net insurance income includes net income from Non-life and Life insurance. Net investment income includes net trading income as well as net investment income from Non-life andLife insurance
EBT, y-o-y change by P&L line item*, **,Q1-3/19 vs. Q1-3/18, € mn
Total income +3%Total expenses -1%
C/I ratio 58%

©O
P
31
EBT, € mn 193 (194)-1%
NII, € mn 691 (658)+5%
Net commissionsand fees, € mn
530 (504)+5%
Net investmentincome, € mn
-16 (0)
Impairment loss onreceivables, € mn
-25 (-18)
Loans, € bn 67.6 (64.6)+5%
Deposits, € bn 53.8 (50.4)+7%
Assets undermanagement,€ bn
22.7 (20.2at YE2018)+12%
Cost/incomeratio, %
69.5 (70.6)
EBT, € mn 278 (240)+16%
Insurancepremiumrevenue, € mn
1 106 (1 107)-0%
Net insuranceincome, € mn
421 (443)-5%
Net commissionsand fees, € mn
54 (50)+8%
Net investmentincome, € mn
218 (116)+87%
Operatingcombinedratio,% Non-life
91.8 (90.5)
Operating costratio, % Non-life
26.5 (26.9)
Solvency II ratio*Non-life, %
132 (132)
Solvency II ratio*Life, %
154 (176)
EBT, € mn 232 (299)-22%
NII, € mn 281 (258)+9%
Net commissionsand fees, € mn
87 (102)-14%
Net investmentincome, € mn
73 (132)-45%
Impairment losson receivables, €mn
-11 (-6)
Loans, € bn 23.7 (21.7)+9%
Deposits, € bn 10.1 (12.1)-16%
Assets undermanagement,€ bn
56.7 (51.7at YE2018)+10%
Net inflows, € mn 57 (-22)
Cost/incomeratio, %
44.8 (37.7)
OP’s financial performance in Q1-3/2019EBT, € mn 706 (687)
+3%
NII, € mn 901 (862)+5%
Net insuranceincome, € mn
412 (432)-5%
Net commissionsand fees, € mn
679 (655)+4%
Net investmentincome, € mn
325 (290)+12%
Expenses, € mn 1 365 (1 378)-1%
Impairment losson receivables, €mn
-36 (-24)
Cost/incomeratio, %
58 (60)
GROUP RETAIL BANKING INSURANCECORPORATE BANKING
* Excluding transitional provision
OTHER OPERATIONS
EBT, € mn 3 (-38)
NII, € mn -48 (-34)
Net commissionsand fees, € mn
5 (4)+34%
Net investmentincome, € mn
37 (34)+9%
Long-term bondsissued to thepublic, € bn
2.8 (3.3 in2018)
Average margin ofsenior wholesalefunding, TLTRO IIfunding andcoveredbonds, bps
16 (14 atYE2018)
©O
P
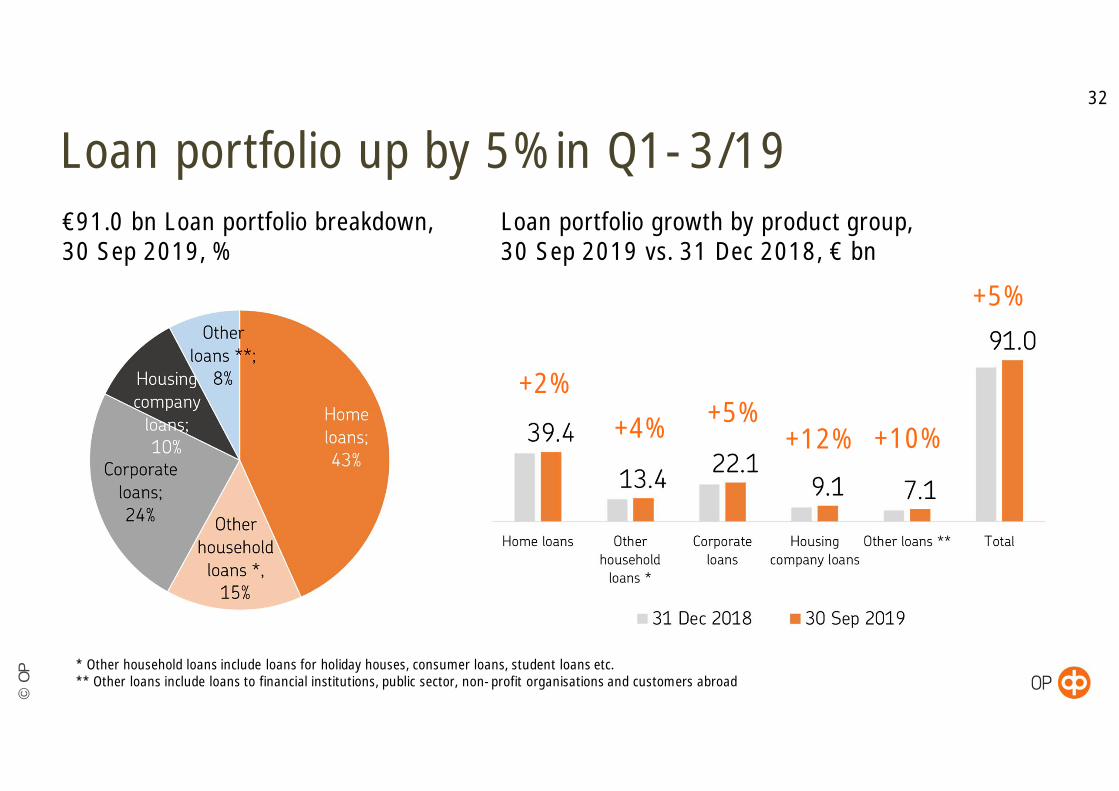
Loan portfolio growth by product group,30 Sep 2019 vs. 31 Dec 2018, € bn
€91.0 bn Loan portfolio breakdown,30 Sep 2019, %
Loan portfolio up by 5% in Q1-3/1932
* Other household loans include loans for holiday houses, consumer loans, student loans etc.** Other loans include loans to financial institutions, public sector, non-profit organisations and customers abroad
+2%+4% +5%
+12% +10%
+5%

©O
P
Doubtful receivables (gross)Impairment loss on receivables
Q1-3/19 impairment loss on receivables €36 mn,equaling to 0.04% of loan and guarantee portfolio (0.01)
33
Performing forborne receivables 67% (70) of gross doubtful receivables at end-Sep 2019
Non-performing1.1% (1.0) to loan & guarantee portfolio
Performing2.2% (2.4) to loan & guarantee portfolio
€99 mn2012
€149 mn2010
€101 mn2011
€84 mn2013
€88 mn2014
€78 mn2015
€77 mn2016
€48 mn2017
€46 mn2018
In Q3/19, impairmentlosses increasedEBTby €3 mn due to loan
maturings
©O
P
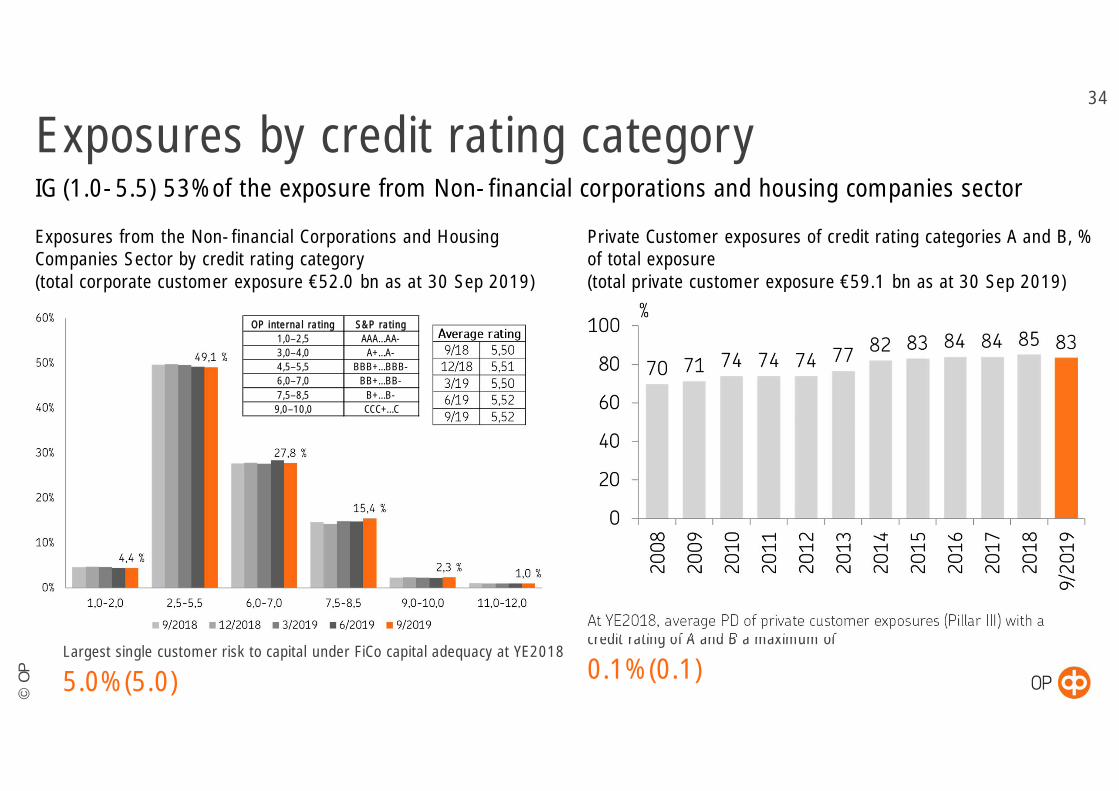
Exposures from the Non-financial Corporations and HousingCompanies Sector by credit rating category(total corporate customer exposure €52.0 bn as at 30 Sep 2019)
Private Customer exposures of credit rating categories A and B, %of total exposure(total private customer exposure €59.1 bn as at 30 Sep 2019)
Largest single customer risk to capital under FiCo capital adequacy at YE2018
5.0% (5.0)
At YE2018, average PD of private customer exposures (Pillar III) with acredit rating of A and B a maximum of
0.1% (0.1)
34
Exposures by credit rating categoryIG (1.0-5.5) 53% of the exposure from Non-financial corporations and housing companies sector
OP internal rating S&P rating1,0–2,5 AAA…AA-3,0–4,0 A+…A-4,5–5,5 BBB+…BBB-6,0–7,0 BB+…BB-7,5–8,5 B+…B-9,0–10,0 CCC+…C

©O
P
Sep 30,2018
Sep 30,2019
1 Renting and operating ofresidential real estate 17,6 % 17,9 %
2 Services 9,7 % 10,9 %3 Renting and operating of
other real estate 10,2 % 10,3 %4 Wholesale and retail trade 8,9 % 8,9 %5 Construction 7,9 % 8,5 %6 Energy 9,2 % 8,4 %7 Financial and insurance services 5,0 % 6,7 %8 Manufacture of machinery
and equipment (incl. services) 4,7 % 4,9 %9 Agriculture, forestry and fishing 4,9 % 4,8 %
10 Transportation and storage 4,4 % 4,3 %11 Forest industry 2,4 % 2,4 %12 Information and communication 2,2 % 2,2 %13 Chemical industry 2,2 % 2,1 %14 Metal industry 2,3 % 2,1 %15 Food industry 2,2 % 1,5 %16 Other 6,2 % 4,1 %
Exposures from the Non-financial corporations and housing companies sector€52.0 bn as at 30 Sep 2019
Corporate exposures well diversified by industry35
Renting and operating of residential real estate industry (1)• 94% of the exposure is housing company loans• 10% of the exposure is guaranteed by government,
cities or municipalities
©O
P
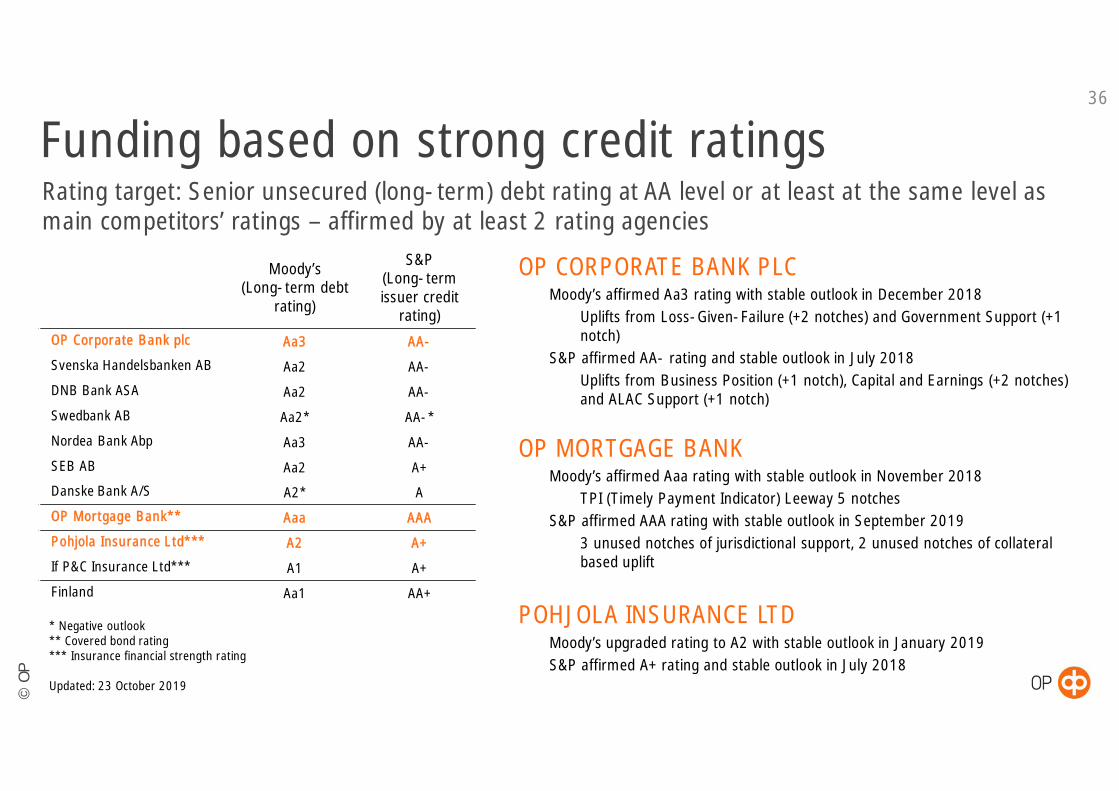
Funding based on strong credit ratings36
OP CORPORATE BANK PLCü Moody’s affirmed Aa3 rating with stable outlook in December 2018ü Uplifts from Loss-Given-Failure (+2 notches) and Government Support (+1
notch)ü S&P affirmed AA- rating and stable outlook in July 2018ü Uplifts from Business Position (+1 notch), Capital and Earnings (+2 notches)
and ALAC Support (+1 notch)
OP MORTGAGE BANKü Moody’s affirmed Aaa rating with stable outlook in November 2018ü TPI (Timely Payment Indicator) Leeway 5 notches
ü S&P affirmed AAA rating with stable outlook in September 2019ü 3 unused notches of jurisdictional support, 2 unused notches of collateral
based uplift
POHJOLA INSURANCE LTDü Moody’s upgraded rating to A2 with stable outlook in January 2019ü S&P affirmed A+ rating and stable outlook in July 2018
Moody’s(Long-term debt
rating)
S&P(Long-termissuer credit
rating)OP Corporate Bank plc Aa3 AA-
Svenska Handelsbanken AB Aa2 AA-
DNB Bank ASA Aa2 AA-
Swedbank AB Aa2* AA-*
Nordea Bank Abp Aa3 AA-
SEB AB Aa2 A+
Danske Bank A/S A2* A
OP Mortgage Bank** Aaa AAA
Pohjola Insurance Ltd*** A2 A+
If P&C Insurance Ltd*** A1 A+
Finland Aa1 AA+
* Negative outlook** Covered bond rating*** Insurance financial strength rating
Updated: 23 October 2019
Rating target: Senior unsecured (long-term) debt rating at AA level or at least at the same level asmain competitors’ ratings – affirmed by at least 2 rating agencies
©O
P
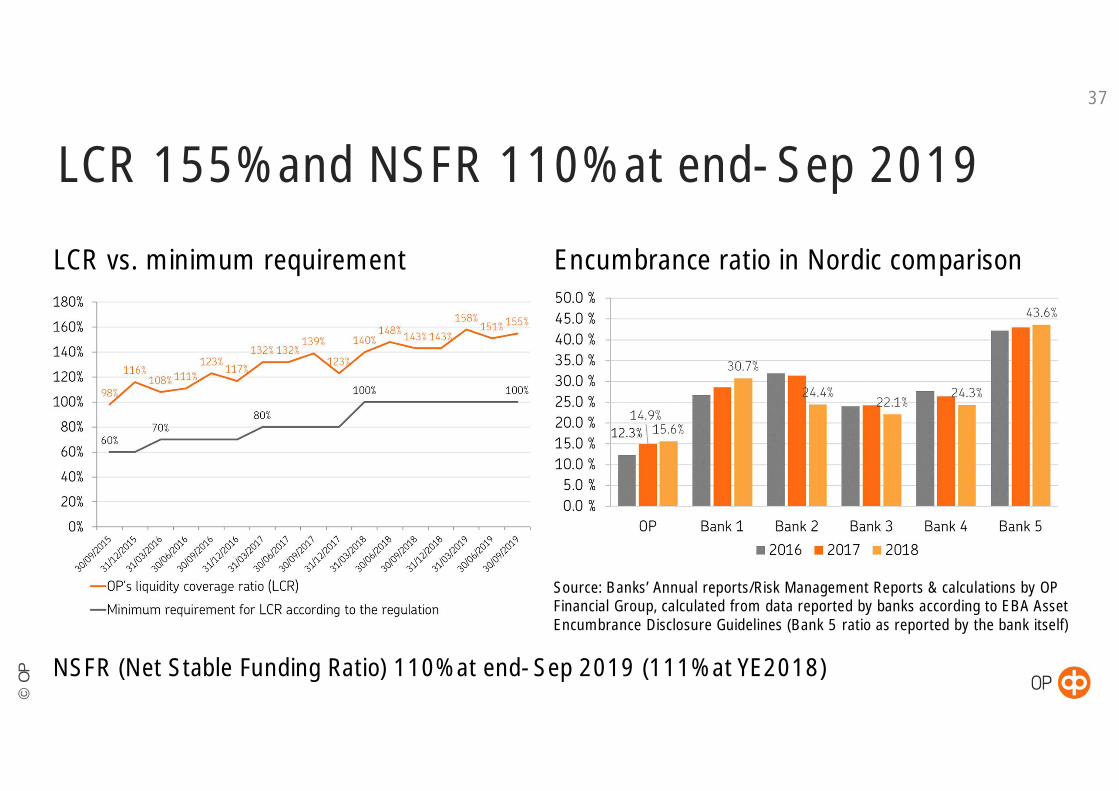
37
LCR 155% and NSFR 110% at end-Sep 2019
LCR vs. minimum requirement Encumbrance ratio in Nordic comparison
NSFR (Net Stable Funding Ratio) 110% at end-Sep 2019 (111% at YE2018)
Source: Banks’ Annual reports/Risk Management Reports & calculations by OPFinancial Group, calculated from data reported by banks according to EBA AssetEncumbrance Disclosure Guidelines (Bank 5 ratio as reported by the bank itself)

©O
P
38
Liquidity buffer €21.8 bn at end-Sep 2019
Liquidity buffer breakdown, € bnLiquidity buffer by credit rating**, as at30 Sep 2019
** “Internally rated” includes externally non-rated notes and bonds issued bypublic-sector entities and companies
The liquidity buffer is sufficient to cover the need for short-term funding forknown and predictable payment flows and in a liquidity stress scenario
©O
P
39
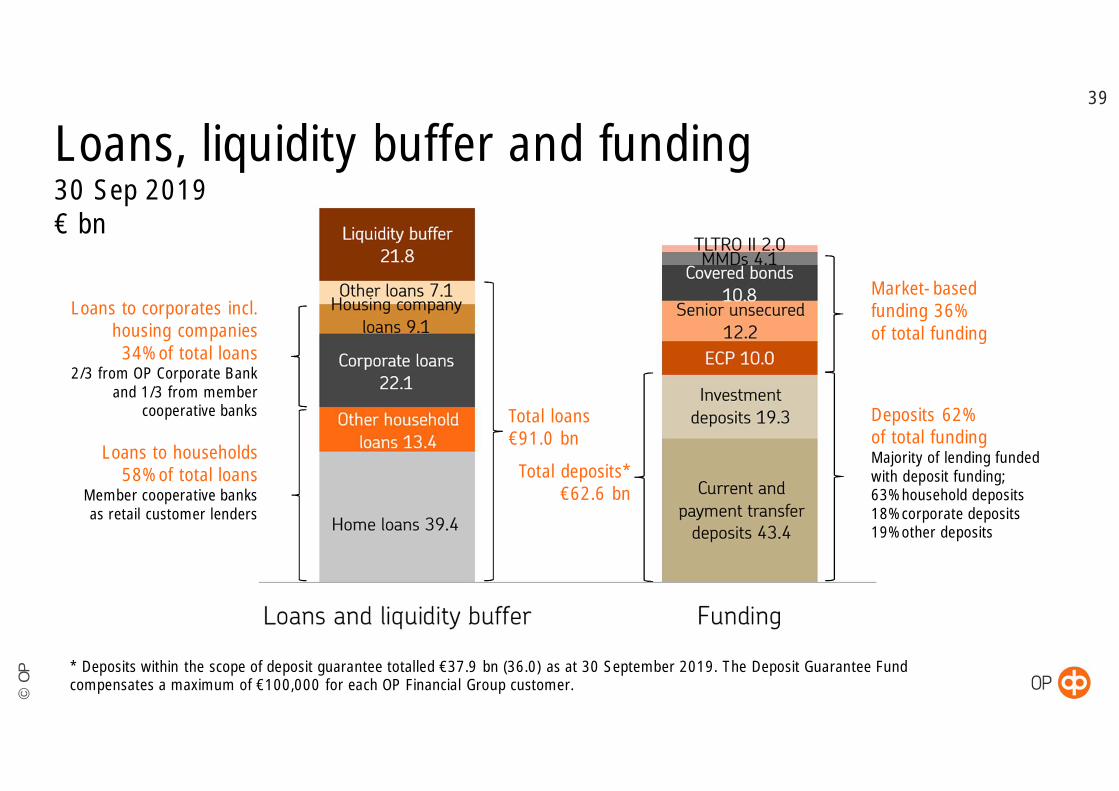
Deposits 62%of total fundingMajority of lending fundedwith deposit funding;63% household deposits18% corporate deposits19% other deposits
Loans to corporates incl.housing companies34% of total loans
2/3 from OP Corporate Bankand 1/3 from member
cooperative banks
Market-basedfunding 36%of total funding
Loans to households58% of total loans
Member cooperative banksas retail customer lenders
Total loans€91.0 bn
Total deposits*€62.6 bn
Loans, liquidity buffer and funding30 Sep 2019€ bn
* Deposits within the scope of deposit guarantee totalled €37.9 bn (36.0) as at 30 September 2019. The Deposit Guarantee Fundcompensates a maximum of €100,000 for each OP Financial Group customer.
©O
P
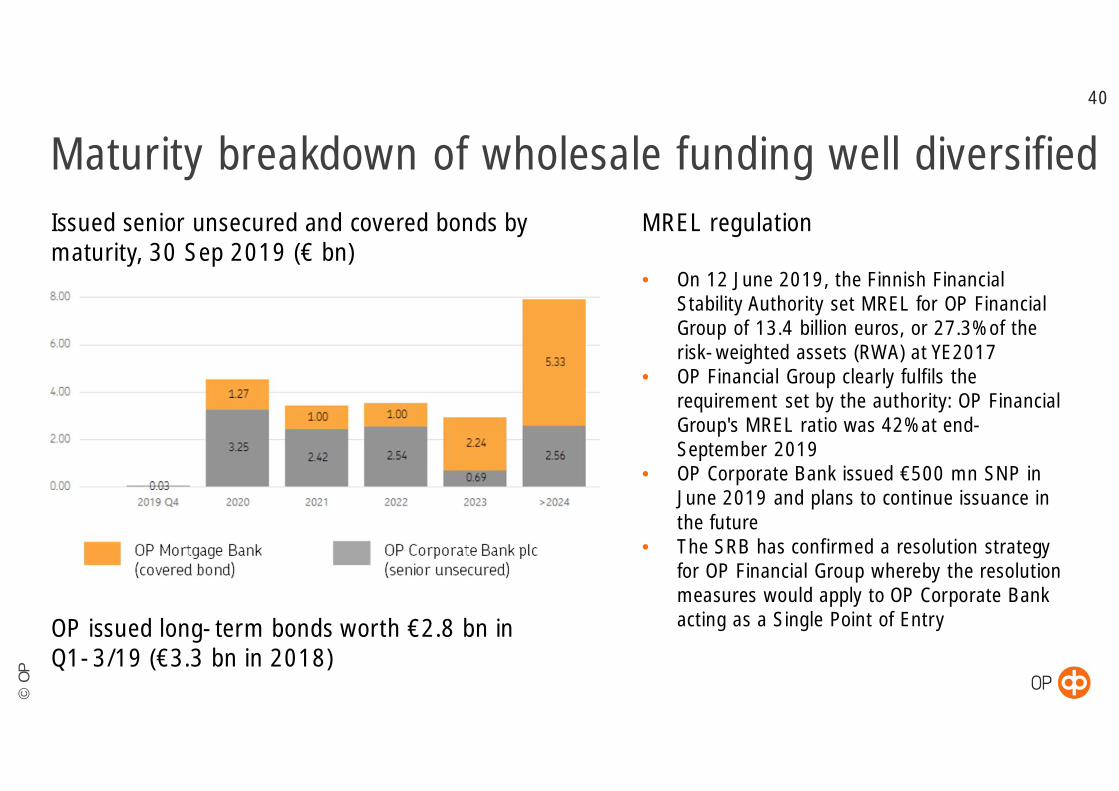
Maturity breakdown of wholesale funding well diversified40
Issued senior unsecured and covered bonds bymaturity, 30 Sep 2019 (€ bn)
MREL regulation
• On 12 June 2019, the Finnish FinancialStability Authority set MREL for OP FinancialGroup of 13.4 billion euros, or 27.3% of therisk-weighted assets (RWA) at YE2017
• OP Financial Group clearly fulfils therequirement set by the authority: OP FinancialGroup's MREL ratio was 42% at end-September 2019
• OP Corporate Bank issued €500 mn SNP inJune 2019 and plans to continue issuance inthe future
• The SRB has confirmed a resolution strategyfor OP Financial Group whereby the resolutionmeasures would apply to OP Corporate Bankacting as a Single Point of EntryOP issued long-term bonds worth €2.8 bn in
Q1-3/19 (€3.3 bn in 2018)
©O
P
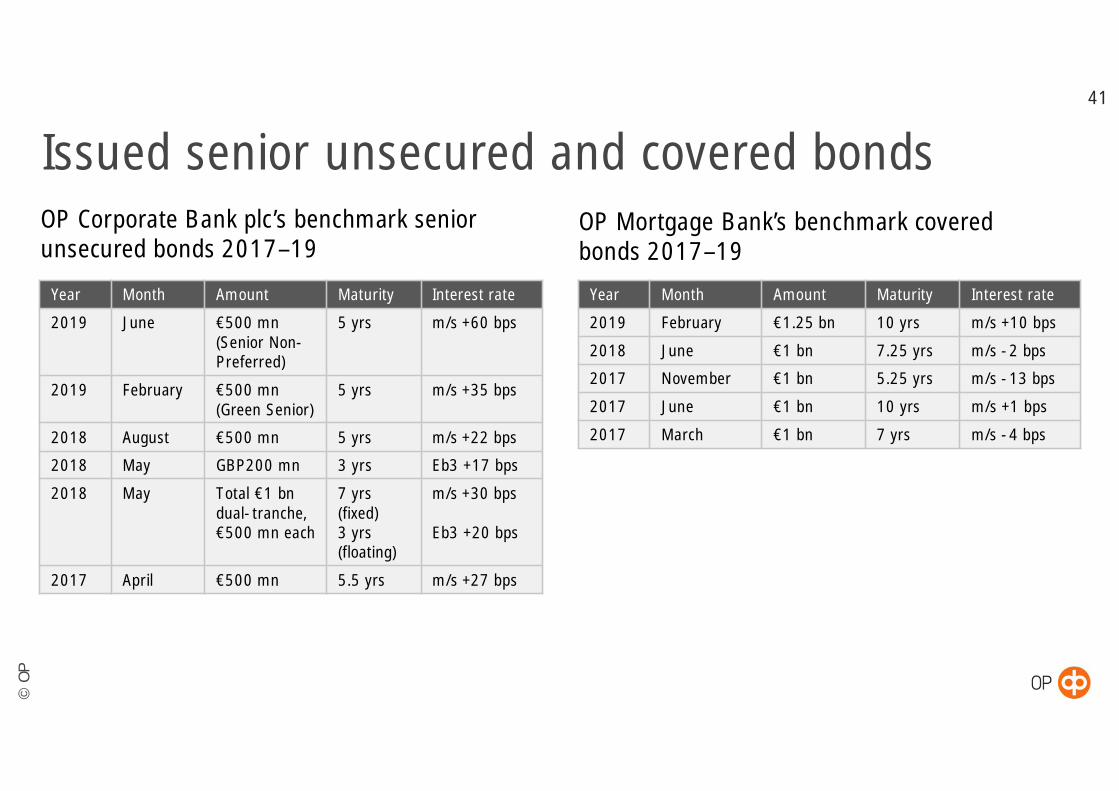
Issued senior unsecured and covered bonds41
OP Corporate Bank plc’s benchmark seniorunsecured bonds 2017–19
OP Mortgage Bank’s benchmark coveredbonds 2017–19
Year Month Amount Maturity Interest rate
2019 June €500 mn(Senior Non-Preferred)
5 yrs m/s +60 bps
2019 February €500 mn(Green Senior)
5 yrs m/s +35 bps
2018 August €500 mn 5 yrs m/s +22 bps
2018 May GBP200 mn 3 yrs Eb3 +17 bps
2018 May Total €1 bndual-tranche,€500 mn each
7 yrs(fixed)3 yrs(floating)
m/s +30 bps
Eb3 +20 bps
2017 April €500 mn 5.5 yrs m/s +27 bps
Year Month Amount Maturity Interest rate
2019 February €1.25 bn 10 yrs m/s +10 bps
2018 June €1 bn 7.25 yrs m/s -2 bps
2017 November €1 bn 5.25 yrs m/s -13 bps
2017 June €1 bn 10 yrs m/s +1 bps
2017 March €1 bn 7 yrs m/s -4 bps

©O
P
OP Mortgage Bank
©O
P
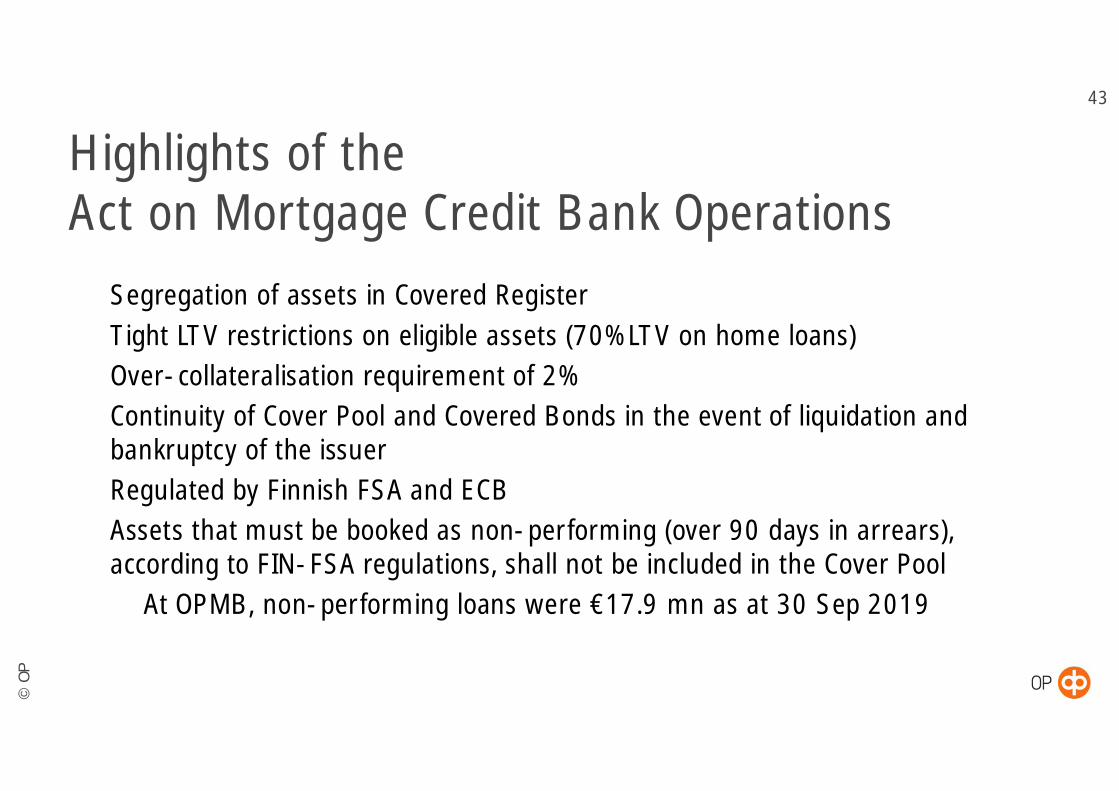
Highlights of theAct on Mortgage Credit Bank Operationsü Segregation of assets in Covered Registerü Tight LTV restrictions on eligible assets (70% LTV on home loans)ü Over-collateralisation requirement of 2%ü Continuity of Cover Pool and Covered Bonds in the event of liquidation and
bankruptcy of the issuerü Regulated by Finnish FSA and ECBü Assets that must be booked as non-performing (over 90 days in arrears),
according to FIN-FSA regulations, shall not be included in the Cover Poolü At OPMB, non-performing loans were €17.9 mn as at 30 Sep 2019
43
©O
P
OP Mortgage Bank (OPMB)OPMB in briefü 100% owned subsidiary of OP Cooperativeü Covered bond issuing entity of OP Financial Groupü Special-purpose bank and a funding vehicle for the
OP member cooperative banksü Covered bond ratings: AAA (S&P), Aaa (Moody’s)ü Covered bond programme qualifies for the
ECBC Covered Bond Label
OPMB & Joint liabilityü OPMB fully benefits from the joint liability among OP Cooperative and the member credit institutions,
based on the Act on the Amalgamation of Deposit Banksü However, since assets in OPMB’s Cover Asset Pool are ring-fenced, the noteholders have the right to
receive what is due to them before all other creditors
44
Read more about the ECBC’s covered bond label atwww.coveredbondlabel.com
©O
P
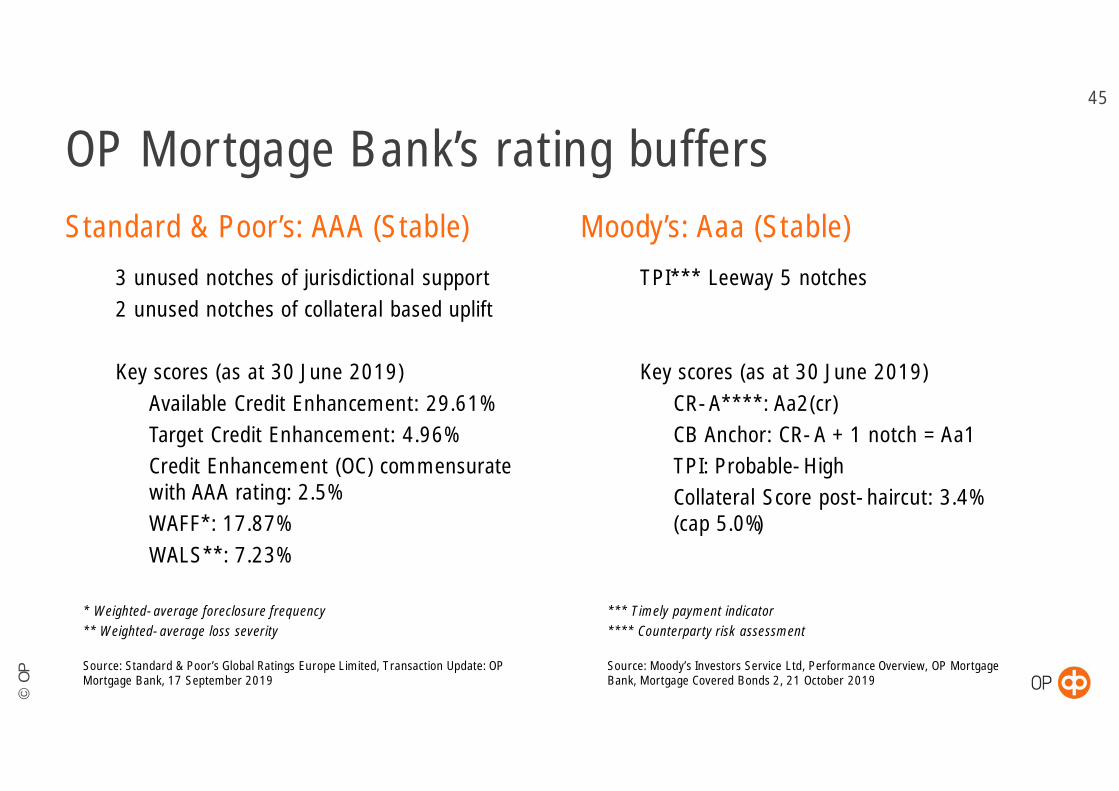
OP Mortgage Bank’s rating buffersStandard & Poor’s: AAA (Stable)ü 3 unused notches of jurisdictional supportü 2 unused notches of collateral based uplift
ü Key scores (as at 30 June 2019)ü Available Credit Enhancement: 29.61%ü Target Credit Enhancement: 4.96%ü Credit Enhancement (OC) commensurate
with AAA rating: 2.5%ü WAFF*: 17.87%ü WALS**: 7.23%
* Weighted-average foreclosure frequency** Weighted-average loss severity
Source: Standard & Poor’s Global Ratings Europe Limited, Transaction Update: OPMortgage Bank, 17 September 2019
Moody’s: Aaa (Stable)ü TPI*** Leeway 5 notches
ü Key scores (as at 30 June 2019)ü CR-A****: Aa2(cr)ü CB Anchor: CR-A + 1 notch = Aa1ü TPI: Probable-Highü Collateral Score post-haircut: 3.4%
(cap 5.0%)
*** Timely payment indicator**** Counterparty risk assessment
Source: Moody’s Investors Service Ltd, Performance Overview, OP MortgageBank, Mortgage Covered Bonds 2, 21 October 2019
45

©O
P
Operating model and roles46
* Basic lending criteria for the Group are set by OP Cooperative. OP Mortgage Bank has additional loan selection and cover pool eligibility criteria.
Issuesunder the
programme
Collateral istransferredto OPMB
cover poolvia
intermediaryloan process
OP MORTGAGE BANKLoan selection*
Pool management and analysisInvestor reporting
Bond issuing
DEBTINVESTORS
OP MEMBERCOOPERATIVE
BANKSLoan origination
Servicing
OP COOPERATIVEAccounting
Risk managementLegal affairs & Compliance etc.
OP SERVICES LTDIT service production
Product and service developmentSupport functions
OP CORPORATE BANK PLCSwap counterparty (interest rate risk management)
Short-term funding providerLegal issues/capital markets
MORTGAGEBORROWER
OP CUSTOMERSERVICES LTD
Debt collectionSupport functions
©O
P
Intermediary loansü The Finnish Covered Bond Act (2010) enables granting intermediary loansü The member cooperative banks are granted the opportunity to indirectly participate in the covered bond
issuance process
ü The intermediary loan contract is made between the member cooperative bank and OPMBü Intermediary loans are the way for the member cooperative banks to utilize OPMBü The amount of loan, interest margin/fixed interest rate and maturity of the loan are indicative during the
contracting phase of the intermediary loanü The member cooperative bank commits to preserving adequate intermediary loan worthy loan portfolio
for the maturity of the intermediary loans, and accepts that OPMB subscribes the mortgage loans ascollateral in the cover pool
ü OPMB monitor’s the adequacy of the loans daily
ü Once the mortgage loans are registered in the OP MB Covered Bond Register via intermediaryloan process, they serve as collateral for the covered bonds for the benefit of the noteholdersas long as intermediary loan expires
47
©O
P
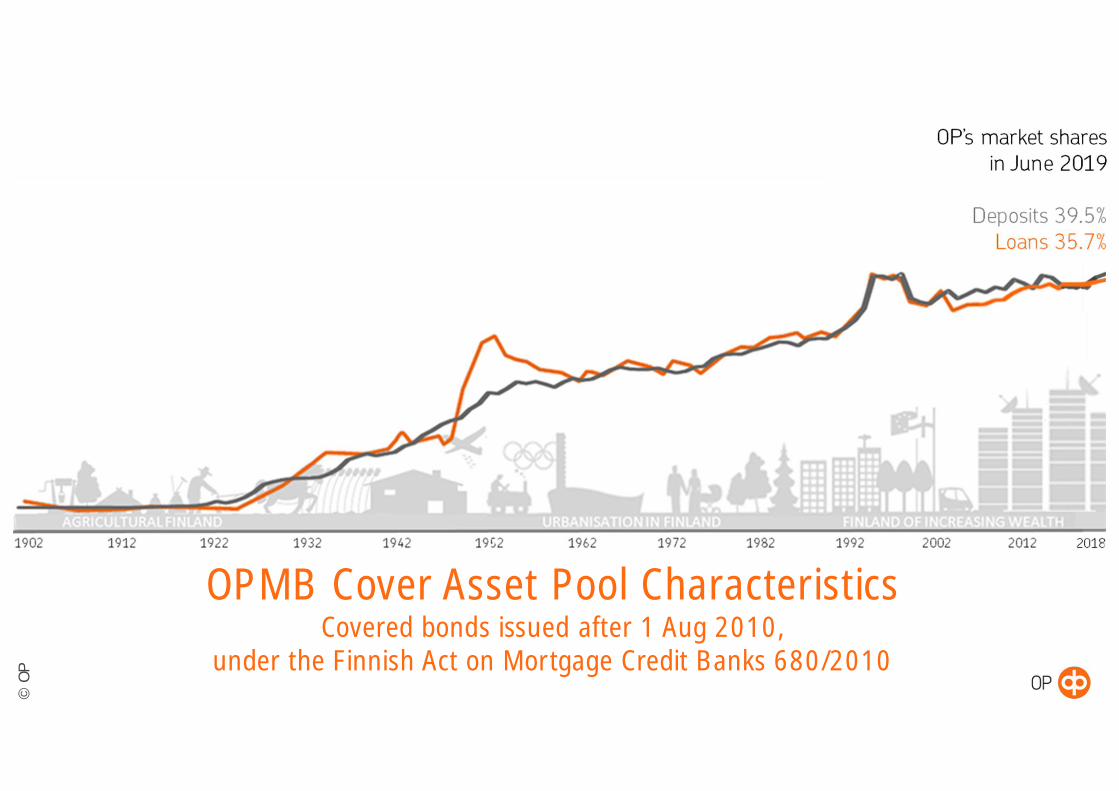
OPMB Cover Asset Pool CharacteristicsCovered bonds issued after 1 Aug 2010,
under the Finnish Act on Mortgage Credit Banks 680/2010
©O
P
49
Main Features of OP Mortgage Bank’sCover Asset Pool as at 30 September 2019
• Collateralized by Finnish mortgages
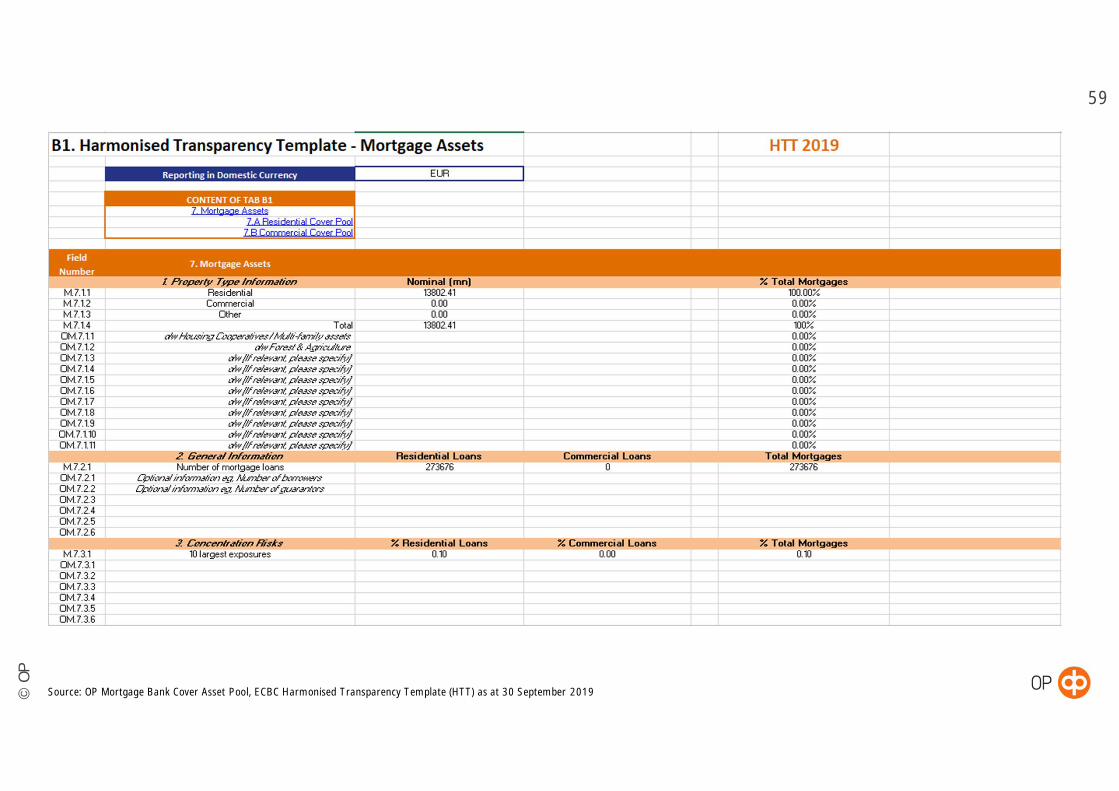
• Current balance EUR 13.8 billion
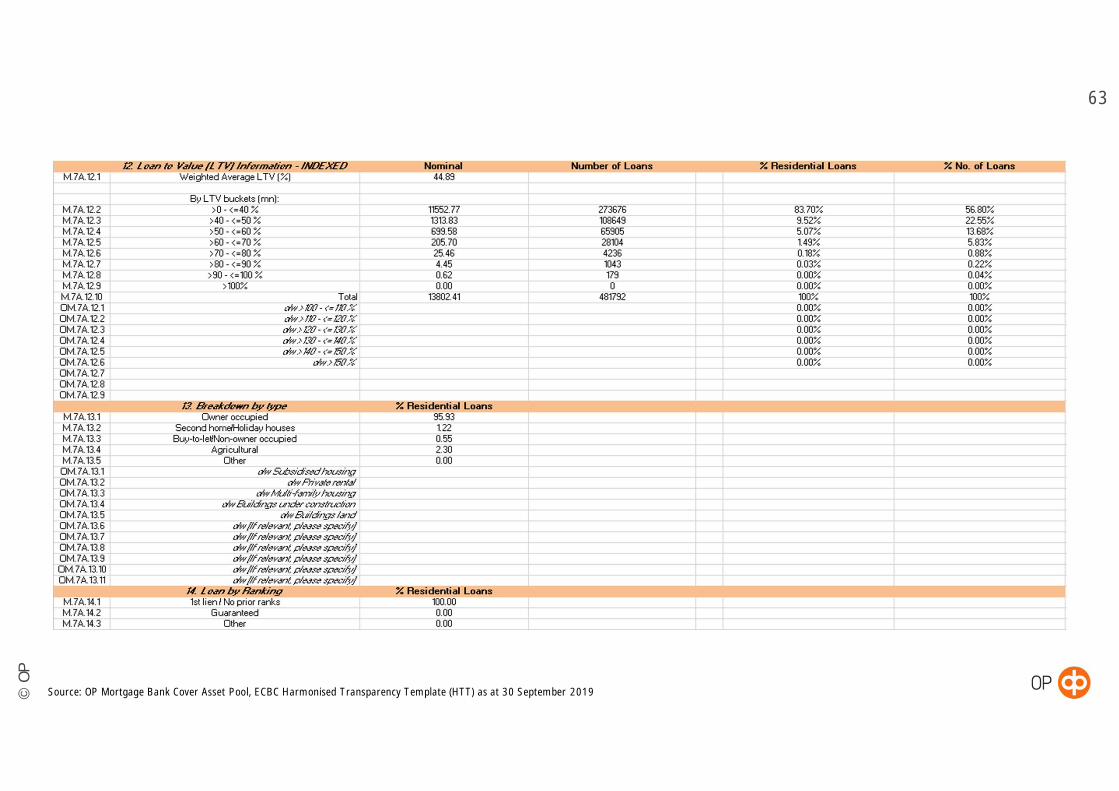
• Weighted Average indexed LTV of 45%
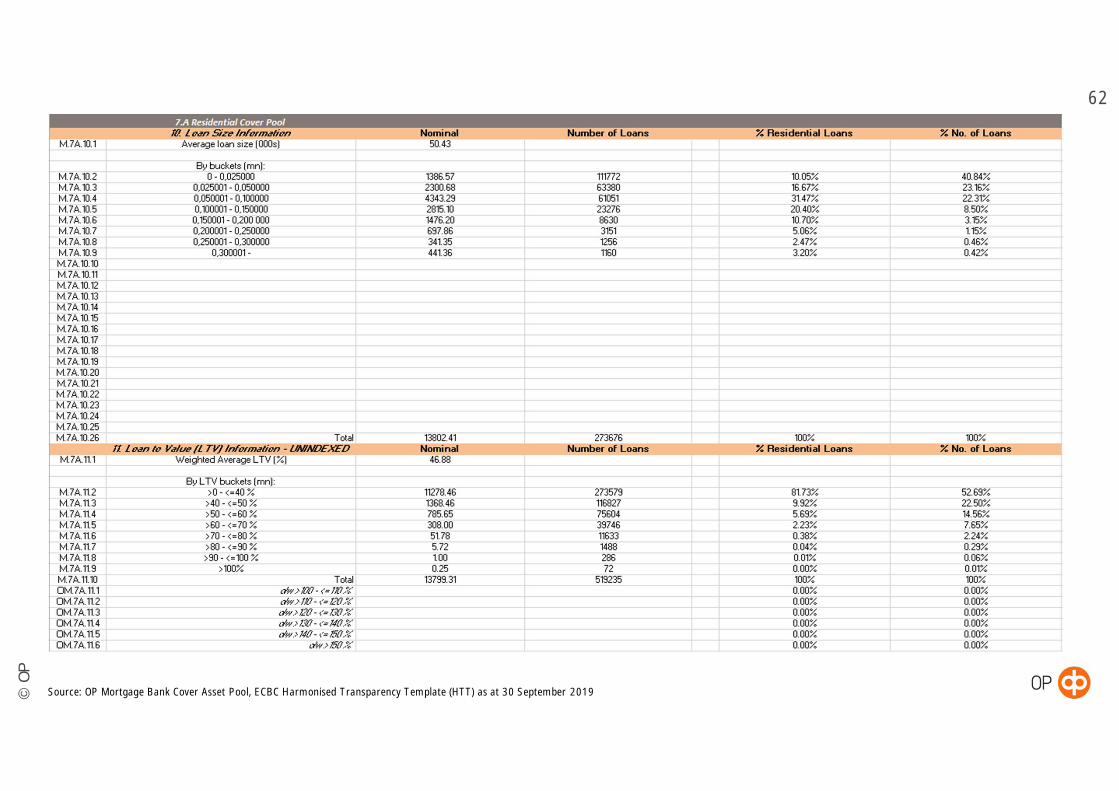
• Average loan size of approximately EUR 50,400
• No loans over 60 days in arrears ongoing
• Variable interest rates: over 98% of all loans
• Hedging agreements in place in order to mitigate interest rate risk
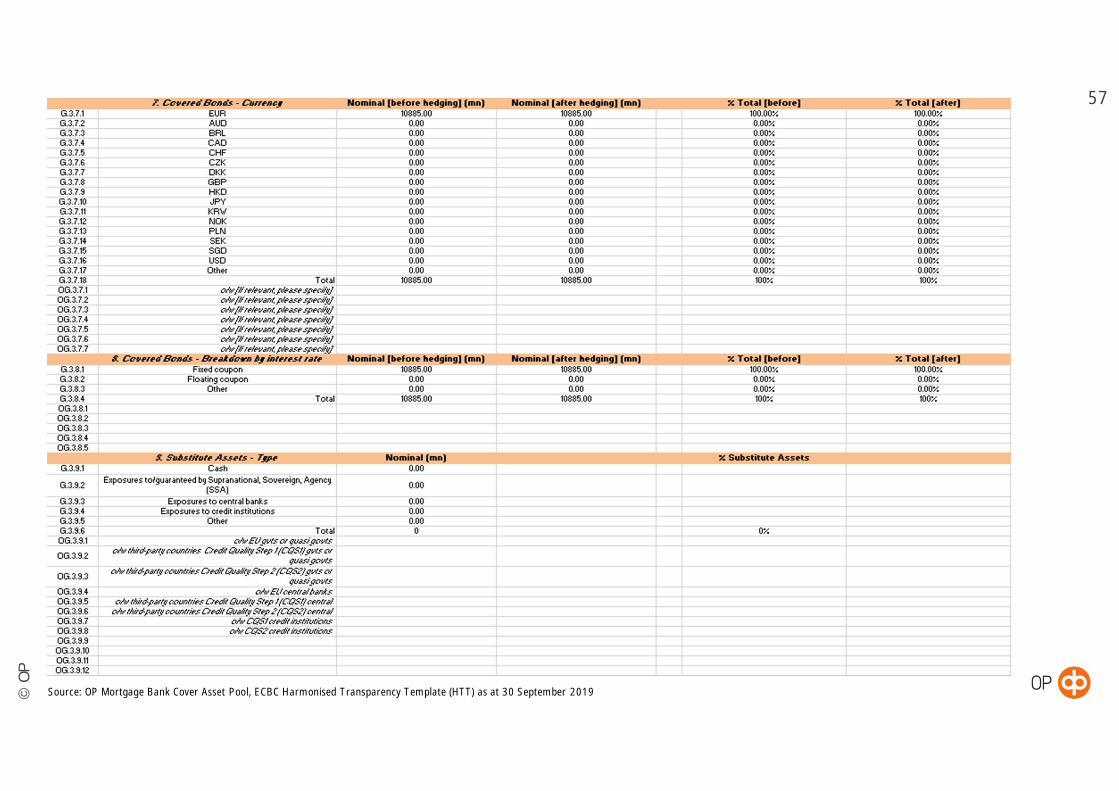
• Total amount of covered bonds issued EUR 10.885 billion
©O
P
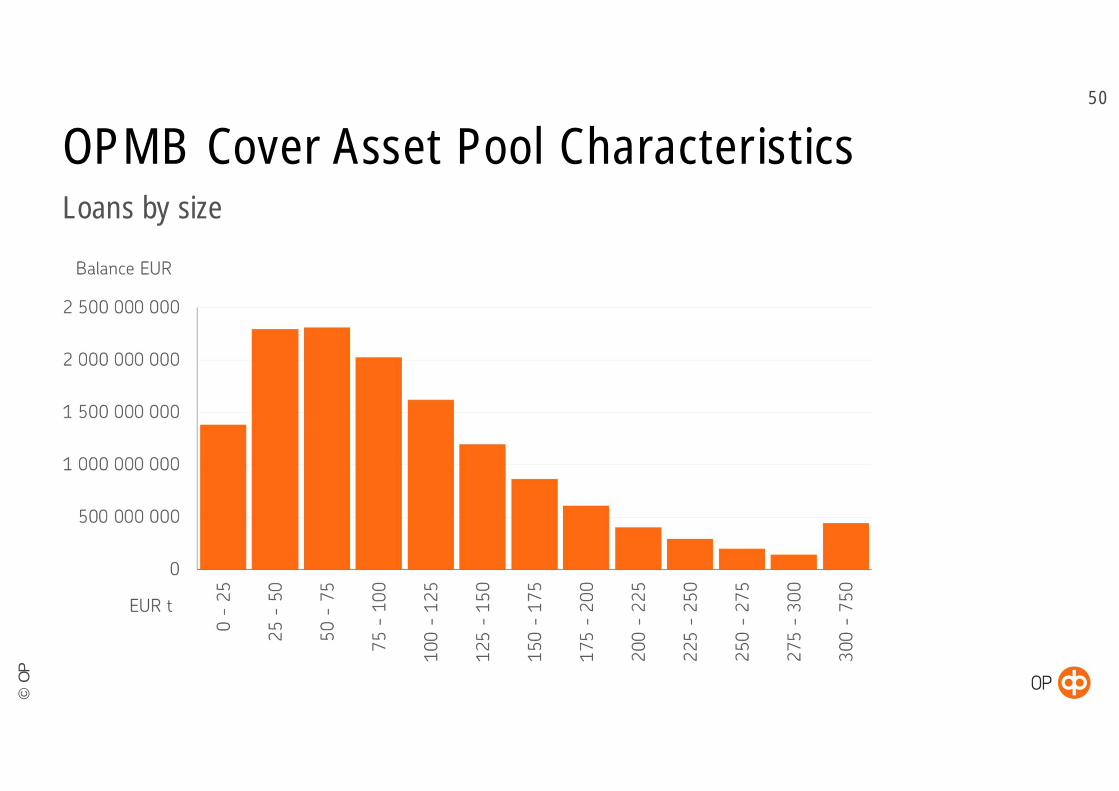
OPMB Cover Asset Pool CharacteristicsLoans by size
50
©O
P
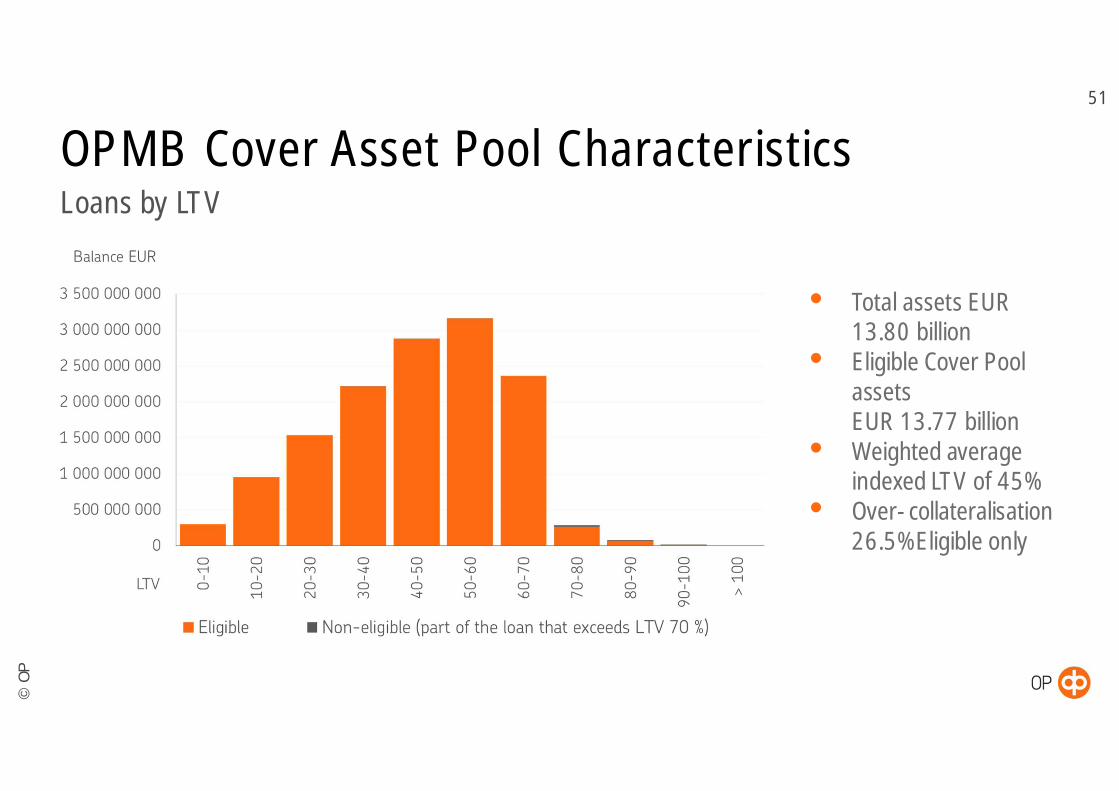
OPMB Cover Asset Pool CharacteristicsLoans by LTV
51
• Total assets EUR13.80 billion
• Eligible Cover PoolassetsEUR 13.77 billion
• Weighted averageindexed LTV of 45%
• Over-collateralisation26.5% Eligible only
©O
P
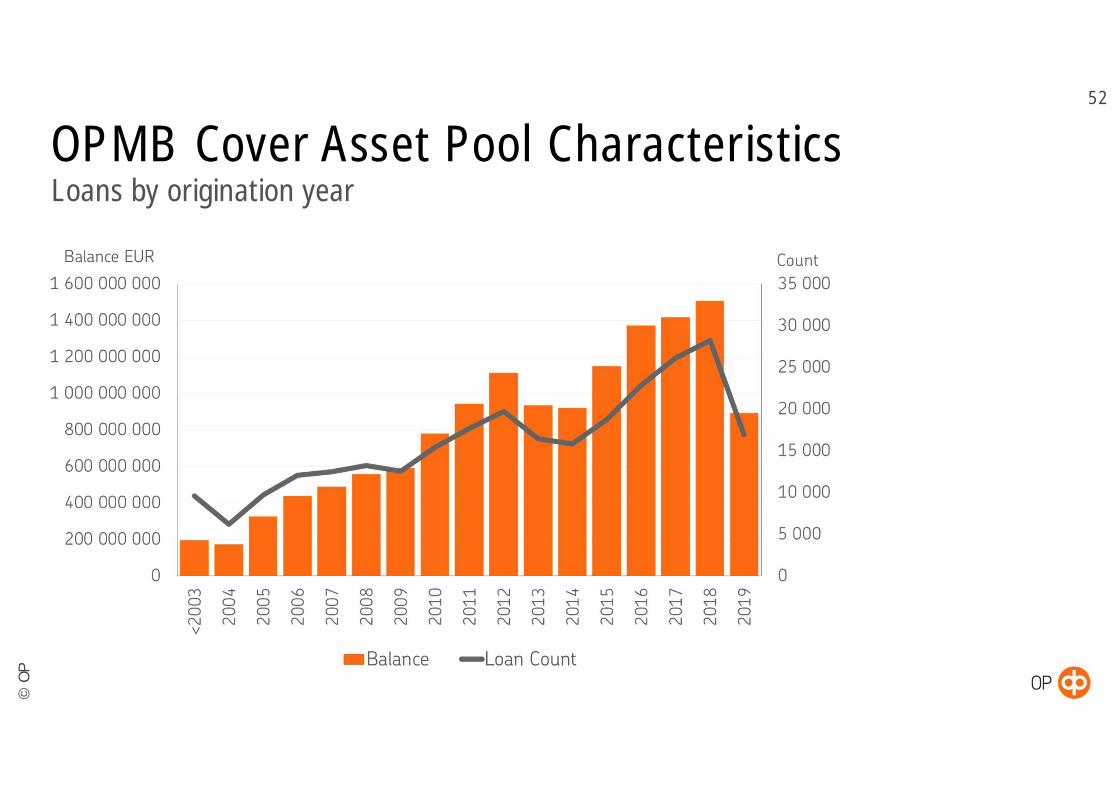
OPMB Cover Asset Pool CharacteristicsLoans by origination year
52
©O
P
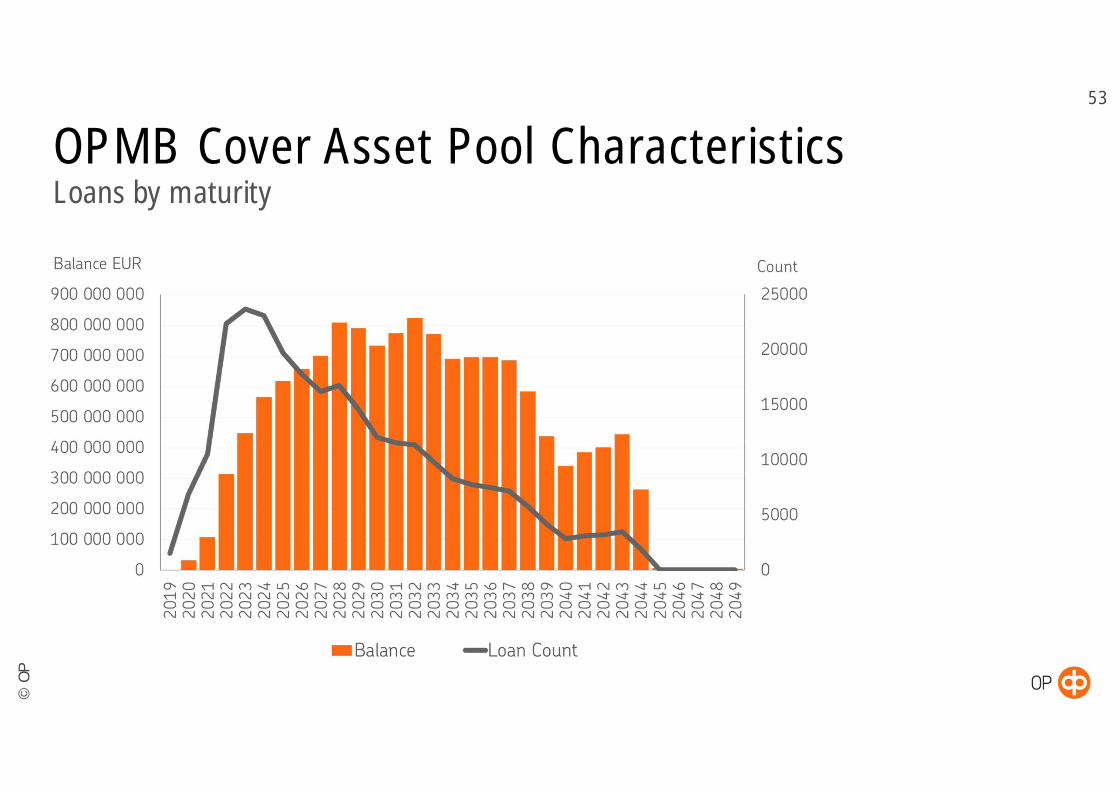
OPMB Cover Asset Pool CharacteristicsLoans by maturity
53
©O
P
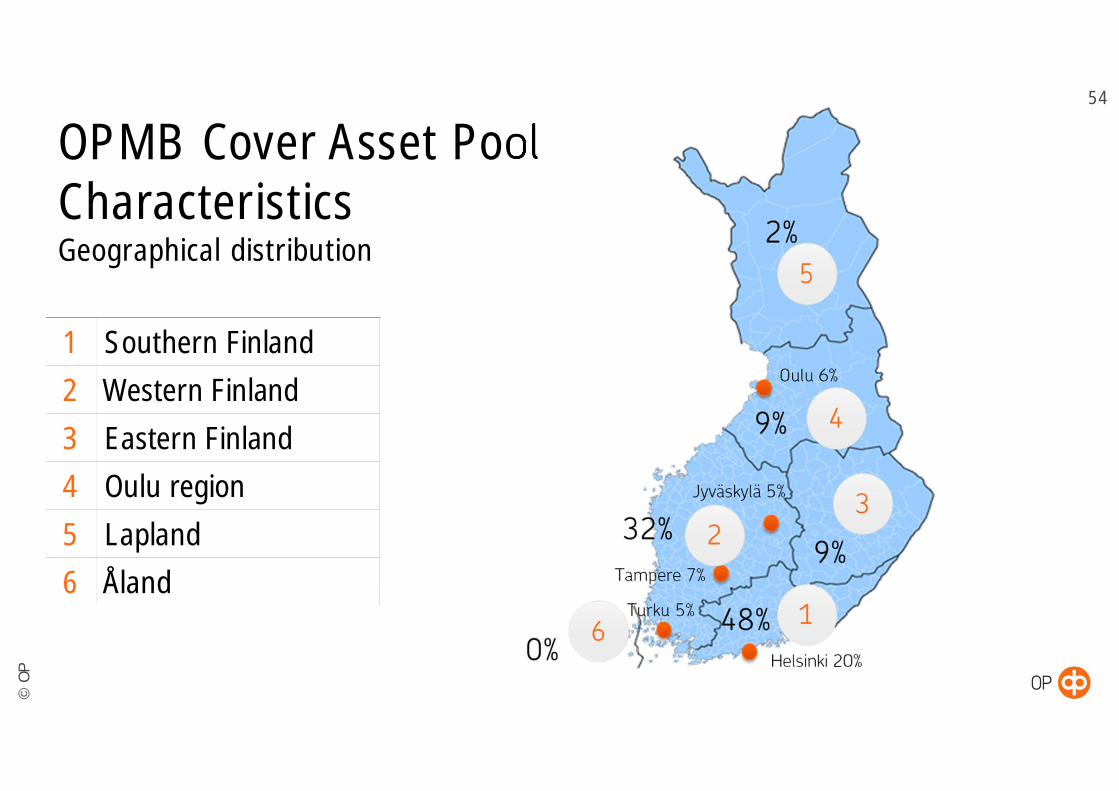
OPMB Cover Asset PoolCharacteristicsGeographical distribution
1 Southern Finland2 Western Finland3 Eastern Finland4 Oulu region5 Lapland6 Åland
54
©O
P
55
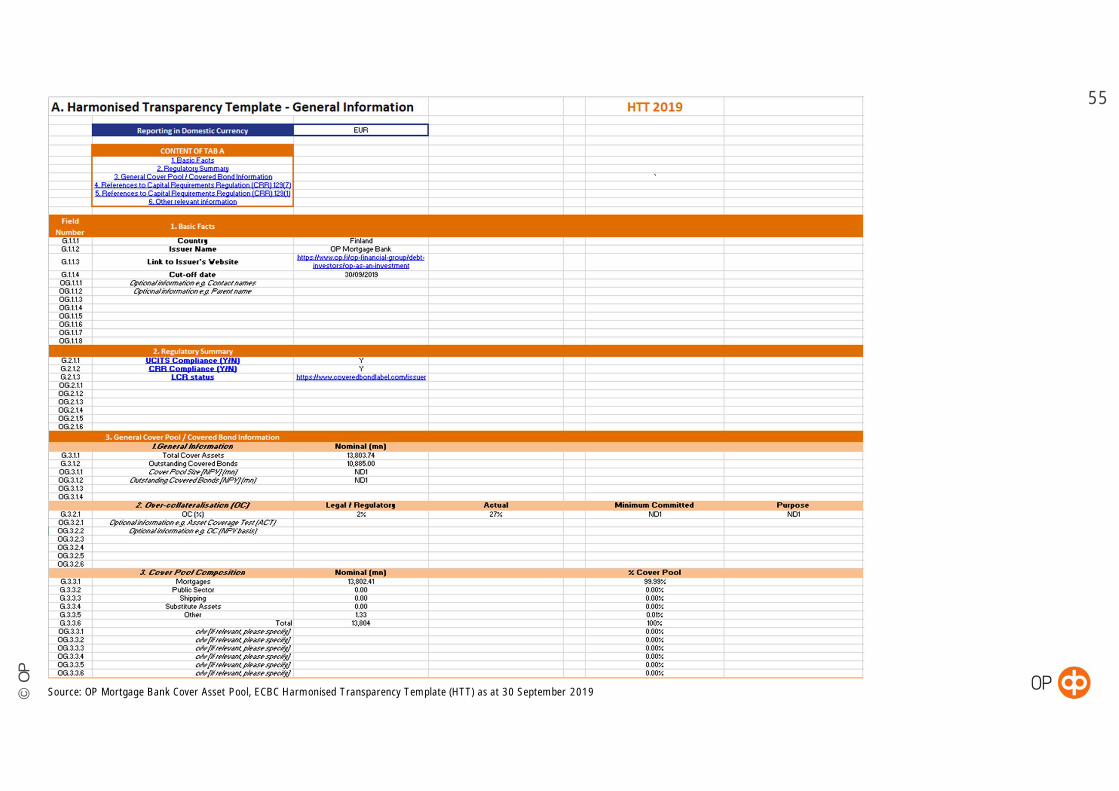
Source: OP Mortgage Bank Cover Asset Pool, ECBC Harmonised Transparency Template (HTT) as at 30 September 2019
©O
P
56
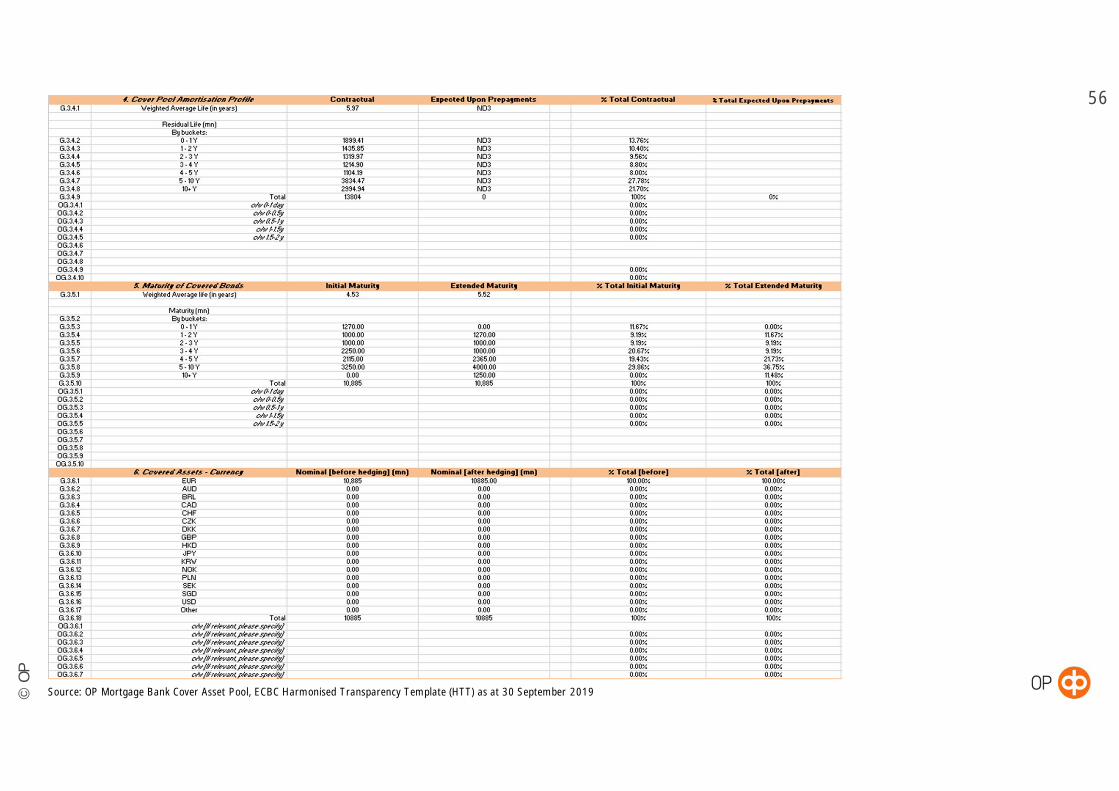
Source: OP Mortgage Bank Cover Asset Pool, ECBC Harmonised Transparency Template (HTT) as at 30 September 2019
©O
P
57
Source: OP Mortgage Bank Cover Asset Pool, ECBC Harmonised Transparency Template (HTT) as at 30 September 2019

©O
P
58
Source: OP Mortgage Bank Cover Asset Pool, ECBC Harmonised Transparency Template (HTT) as at 30 September 2019
©O
P
59
Source: OP Mortgage Bank Cover Asset Pool, ECBC Harmonised Transparency Template (HTT) as at 30 September 2019

©O
P
60
Source: OP Mortgage Bank Cover Asset Pool, ECBC Harmonised Transparency Template (HTT) as at 30 September 2019

©O
P
61
Source: OP Mortgage Bank Cover Asset Pool, ECBC Harmonised Transparency Template (HTT) as at 30 September 2019
©O
P
62
Source: OP Mortgage Bank Cover Asset Pool, ECBC Harmonised Transparency Template (HTT) as at 30 September 2019
©O
P
63
Source: OP Mortgage Bank Cover Asset Pool, ECBC Harmonised Transparency Template (HTT) as at 30 September 2019

©O
P
64
Source: OP Mortgage Bank Cover Asset Pool, ECBC Harmonised Transparency Template (HTT) as at 30 September 2019
©O
P
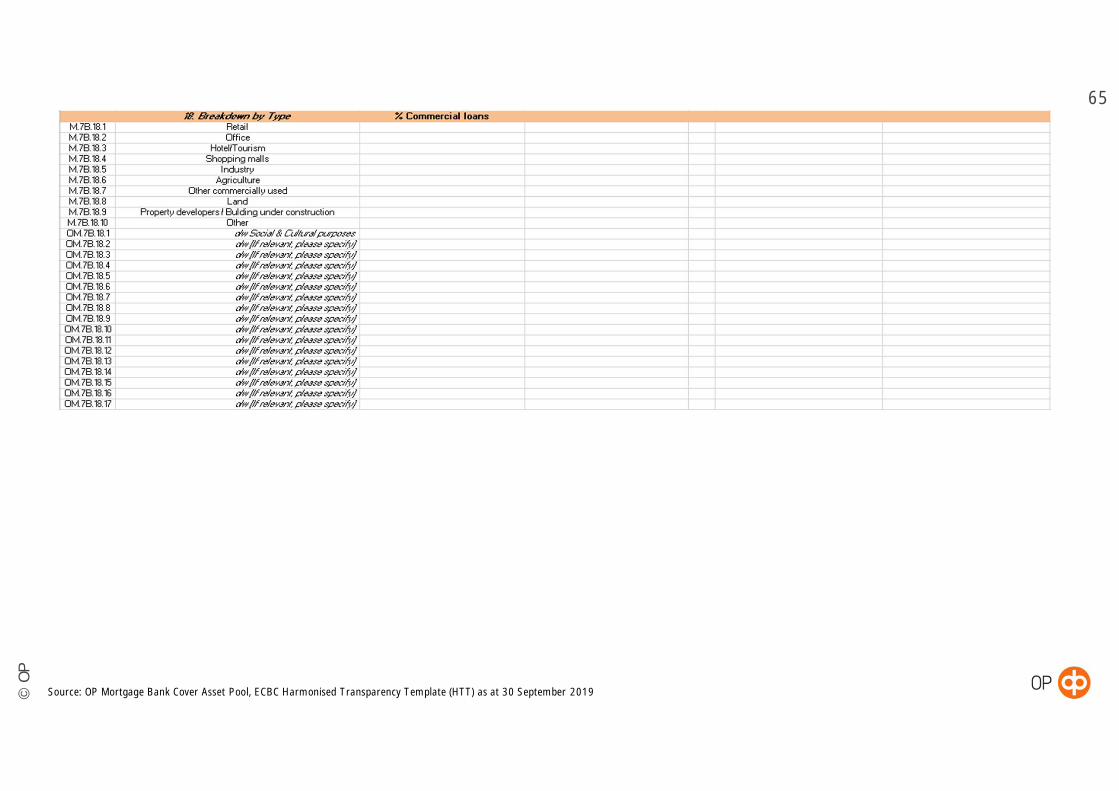
65
Source: OP Mortgage Bank Cover Asset Pool, ECBC Harmonised Transparency Template (HTT) as at 30 September 2019
©O
P
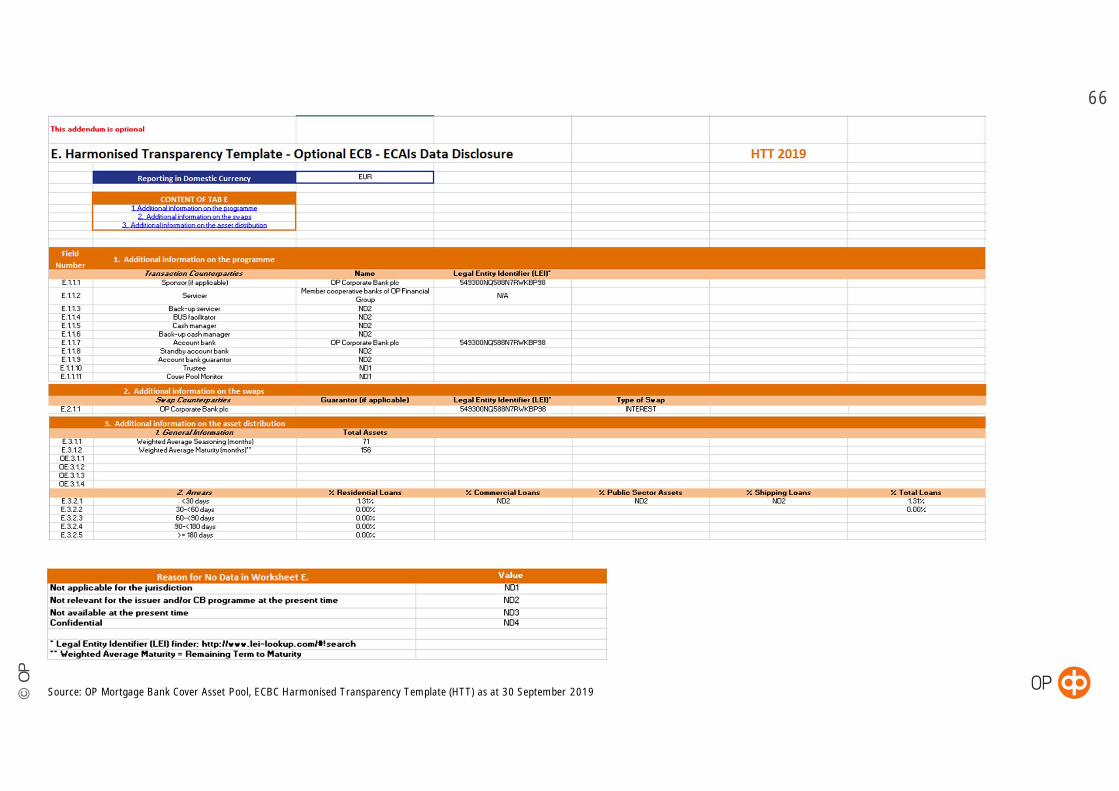
66
Source: OP Mortgage Bank Cover Asset Pool, ECBC Harmonised Transparency Template (HTT) as at 30 September 2019
©O
P
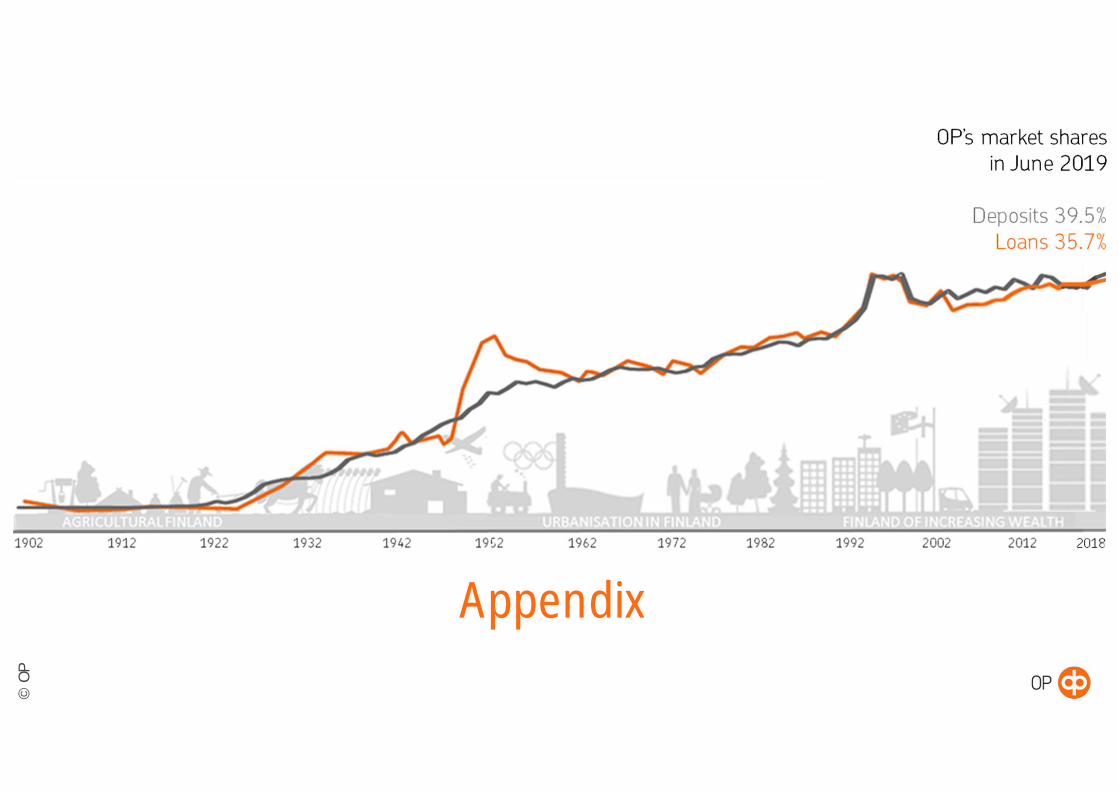
Appendix
©O
P
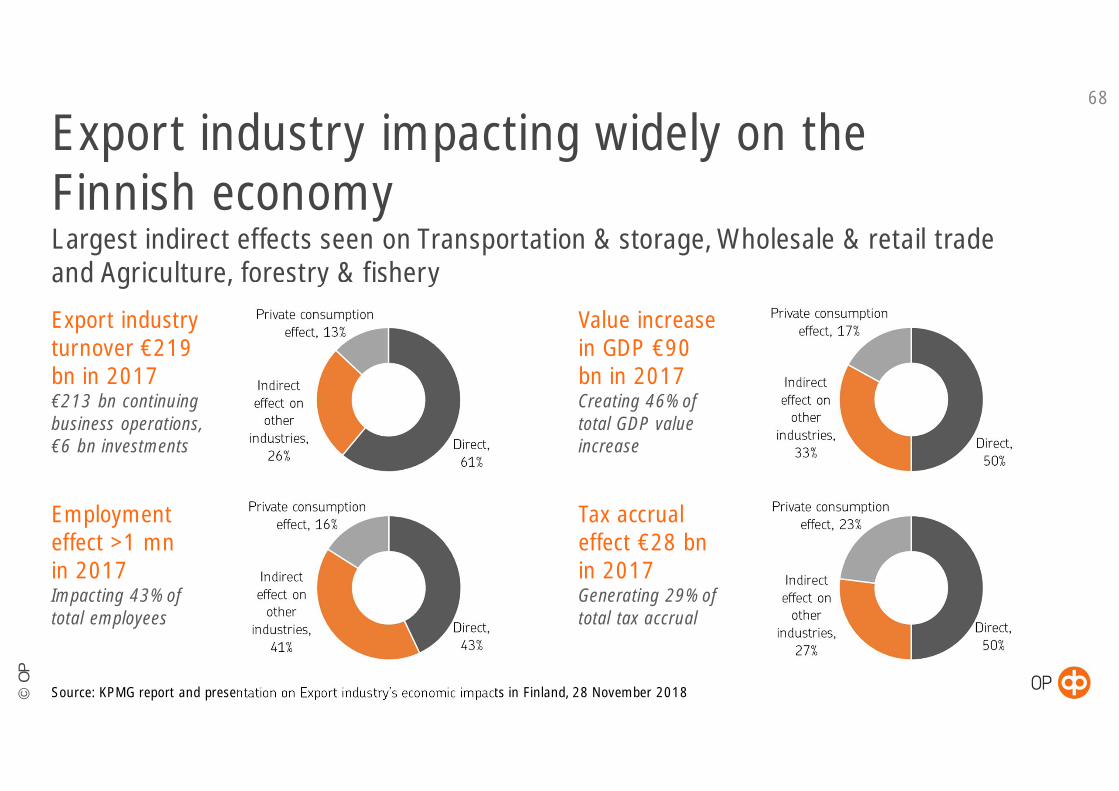
Export industry impacting widely on theFinnish economyLargest indirect effects seen on Transportation & storage, Wholesale & retail tradeand Agriculture, forestry & fishery
68
Source: KPMG report and presentation on Export industry’s economic impacts in Finland, 28 November 2018
Export industryturnover €219bn in 2017€213 bn continuingbusiness operations,€6 bn investments
Employmenteffect >1 mnin 2017Impacting 43% oftotal employees
Value increasein GDP €90bn in 2017Creating 46% oftotal GDP valueincrease
Tax accrualeffect €28 bnin 2017Generating 29% oftotal tax accrual
©O
P
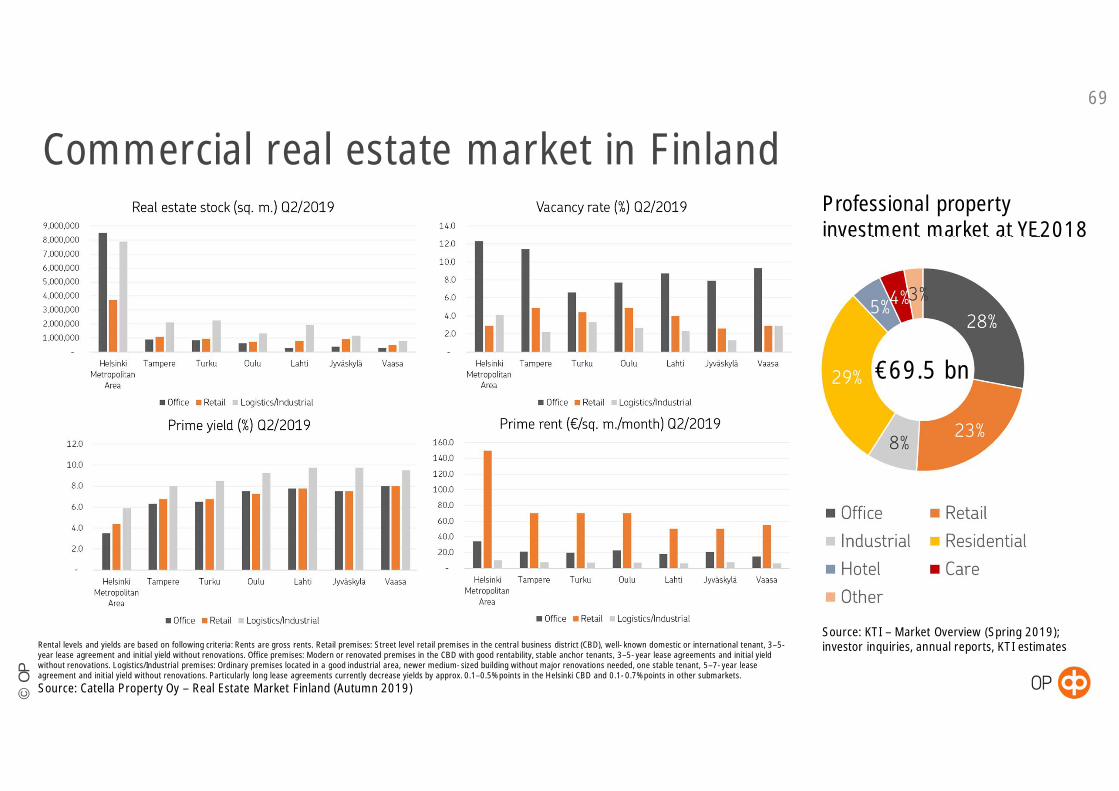
Commercial real estate market in Finland69
Rental levels and yields are based on following criteria: Rents are gross rents. Retail premises: Street level retail premises in the central business district (CBD), well-known domestic or international tenant, 3–5-year lease agreement and initial yield without renovations. Office premises: Modern or renovated premises in the CBD with good rentability, stable anchor tenants, 3–5-year lease agreements and initial yieldwithout renovations. Logistics/Industrial premises: Ordinary premises located in a good industrial area, newer medium-sized building without major renovations needed, one stable tenant, 5–7-year leaseagreement and initial yield without renovations. Particularly long lease agreements currently decrease yields by approx. 0.1–0.5% points in the Helsinki CBD and 0.1-0.7% points in other submarkets.
Source: Catella Property Oy – Real Estate Market Finland (Autumn 2019)
Source: KTI – Market Overview (Spring 2019);investor inquiries, annual reports, KTI estimates
Professional propertyinvestment market at YE2018
€69.5 bn
©O
P
70
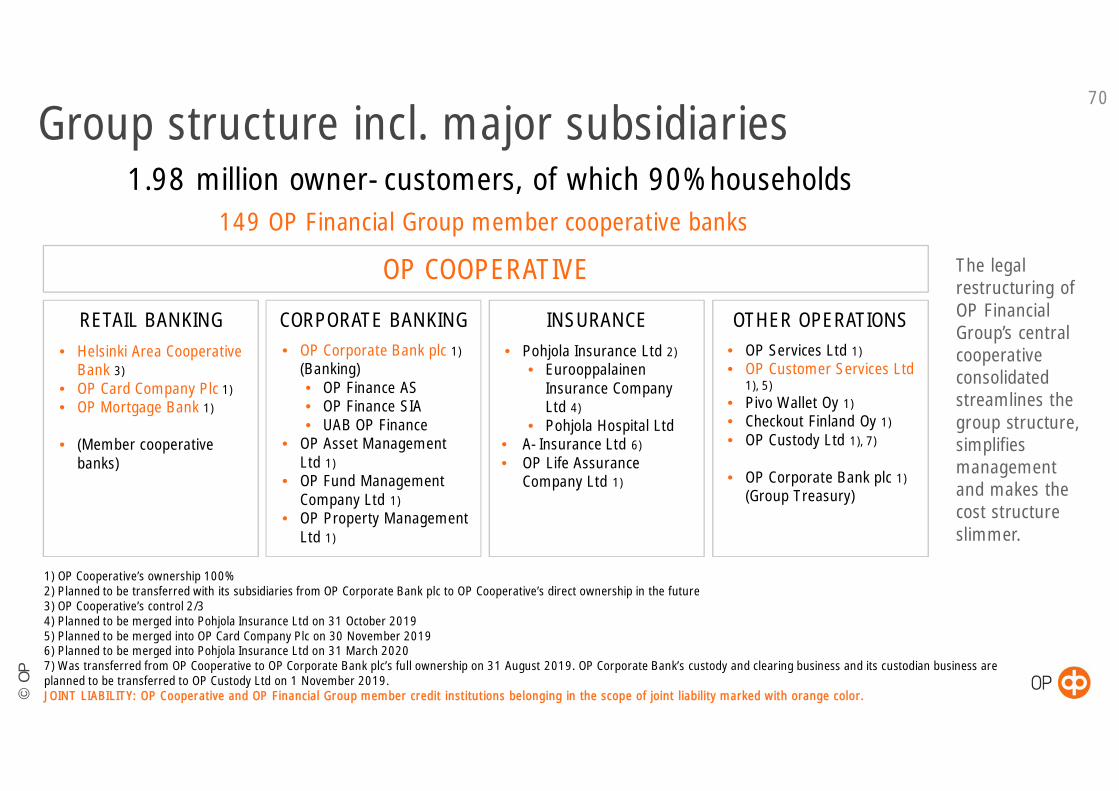
1) OP Cooperative’s ownership 100%2) Planned to be transferred with its subsidiaries from OP Corporate Bank plc to OP Cooperative’s direct ownership in the future3) OP Cooperative’s control 2/34) Planned to be merged into Pohjola Insurance Ltd on 31 October 20195) Planned to be merged into OP Card Company Plc on 30 November 20196) Planned to be merged into Pohjola Insurance Ltd on 31 March 20207) Was transferred from OP Cooperative to OP Corporate Bank plc’s full ownership on 31 August 2019. OP Corporate Bank’s custody and clearing business and its custodian business areplanned to be transferred to OP Custody Ltd on 1 November 2019.JOINT LIABILITY: OP Cooperative and OP Financial Group member credit institutions belonging in the scope of joint liability marked with orange color.
Group structure incl. major subsidiaries1.98 million owner-customers, of which 90% households
CORPORATE BANKINGRETAIL BANKING• Helsinki Area Cooperative
Bank 3)• OP Card Company Plc 1)• OP Mortgage Bank 1)
• (Member cooperativebanks)
• OP Corporate Bank plc 1)(Banking)• OP Finance AS• OP Finance SIA• UAB OP Finance
• OP Asset ManagementLtd 1)
• OP Fund ManagementCompany Ltd 1)
• OP Property ManagementLtd 1)
INSURANCE
OP COOPERATIVE
149 OP Financial Group member cooperative banks
OTHER OPERATIONS• OP Services Ltd 1)• OP Customer Services Ltd
1), 5)• Pivo Wallet Oy 1)• Checkout Finland Oy 1)• OP Custody Ltd 1), 7)
• OP Corporate Bank plc 1)(Group Treasury)
• Pohjola Insurance Ltd 2)• Eurooppalainen
Insurance CompanyLtd 4)
• Pohjola Hospital Ltd• A-Insurance Ltd 6)• OP Life Assurance
Company Ltd 1)
The legalrestructuring ofOP FinancialGroup’s centralcooperativeconsolidatedstreamlines thegroup structure,simplifiesmanagementand makes thecost structureslimmer.

©O
P
OP’s group-level strategic targets (Strategy 2016)New strategic targets to be published on 30 October 2019
INDICATOR TARGET 2019 30 Sep 2019 2018 2017 2016
Customer experience (CX)*,NPS for brandNPS for service
2570
2461
2361
2258
2353
CET1 ratio 22% 19.6% 20.5% 20.1% 20.1%
Return on economic capital(12-month rolling)
22% 20.3% 20.8% 20.4% 22.7%
Expenses of present-daybusiness (12-month rolling)
Expenses in 2020 atthe same level as in2015(€1,500 mn)
€1,835 mn €1,833 mn €1,661 mn €1,532 mn
Owner-customers, number 2.0 mn 1.98 mn 1.91 mn 1.8 mn 1.7 mn
71
* OP’s customer experience (CX) metric is based on the Net Promoter Score (NPS) that measures likelihood of recommendation.NPS for the brand gauges the overall customer experience of OP. The NPS for service measures what kind of customer experienceOP manages to create in individual service encounters in all channels. NPS can range between -100 and +100.
©O
P
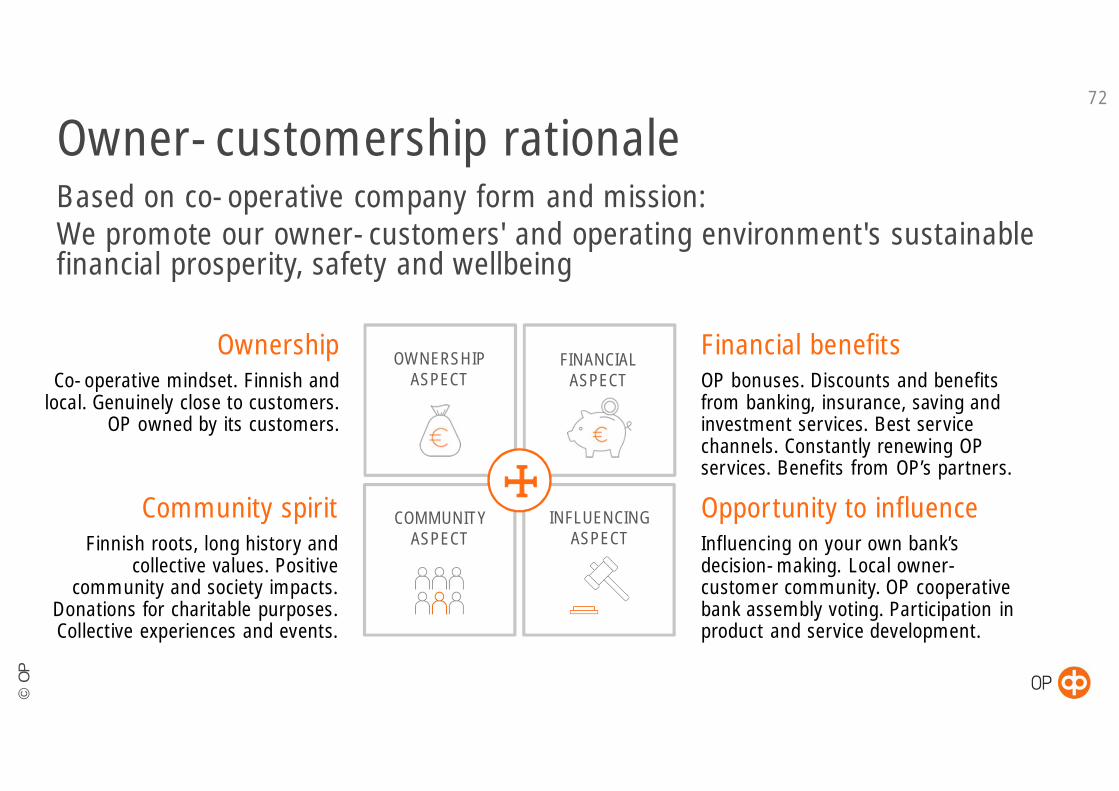
Based on co-operative company form and mission:We promote our owner-customers' and operating environment's sustainablefinancial prosperity, safety and wellbeing
Owner-customership rationale72
Community spiritFinnish roots, long history and
collective values. Positivecommunity and society impacts.
Donations for charitable purposes.Collective experiences and events.
OwnershipCo-operative mindset. Finnish and
local. Genuinely close to customers.OP owned by its customers.
Financial benefitsOP bonuses. Discounts and benefitsfrom banking, insurance, saving andinvestment services. Best servicechannels. Constantly renewing OPservices. Benefits from OP’s partners.
Opportunity to influenceInfluencing on your own bank’sdecision-making. Local owner-customer community. OP cooperativebank assembly voting. Participation inproduct and service development.
OWNERSHIPASPECT
FINANCIALASPECT
COMMUNITYASPECT
INFLUENCINGASPECT
II
©O
P
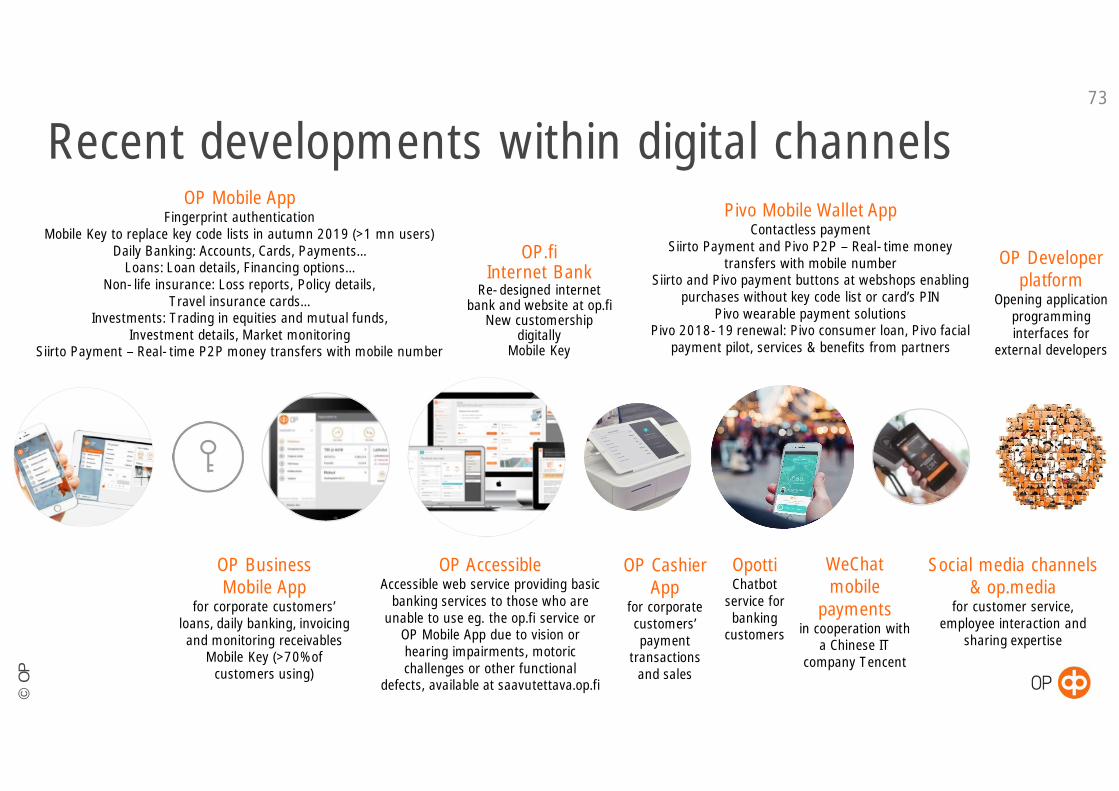
Recent developments within digital channels73
Social media channels& op.media
for customer service,employee interaction and
sharing expertise
OP Mobile AppFingerprint authentication
Mobile Key to replace key code lists in autumn 2019 (>1 mn users)Daily Banking: Accounts, Cards, Payments…
Loans: Loan details, Financing options…Non-life insurance: Loss reports, Policy details,
Travel insurance cards…Investments: Trading in equities and mutual funds,
Investment details, Market monitoringSiirto Payment – Real-time P2P money transfers with mobile number
OP CashierApp
for corporatecustomers’payment
transactionsand sales
Pivo Mobile Wallet AppContactless payment
Siirto Payment and Pivo P2P – Real-time moneytransfers with mobile number
Siirto and Pivo payment buttons at webshops enablingpurchases without key code list or card’s PIN
Pivo wearable payment solutionsPivo 2018-19 renewal: Pivo consumer loan, Pivo facial
payment pilot, services & benefits from partners
OP BusinessMobile App
for corporate customers’loans, daily banking, invoicingand monitoring receivables
Mobile Key (>70% ofcustomers using)
OP.fiInternet Bank
Re-designed internetbank and website at op.fi
New customershipdigitally
Mobile Key
OP Developerplatform
Opening applicationprogramminginterfaces for
external developers
OP AccessibleAccessible web service providing basic
banking services to those who areunable to use eg. the op.fi service or
OP Mobile App due to vision orhearing impairments, motoricchallenges or other functional
defects, available at saavutettava.op.fi
OpottiChatbot
service forbanking
customers
WeChatmobile
paymentsin cooperation with
a Chinese ITcompany Tencent
©O
P
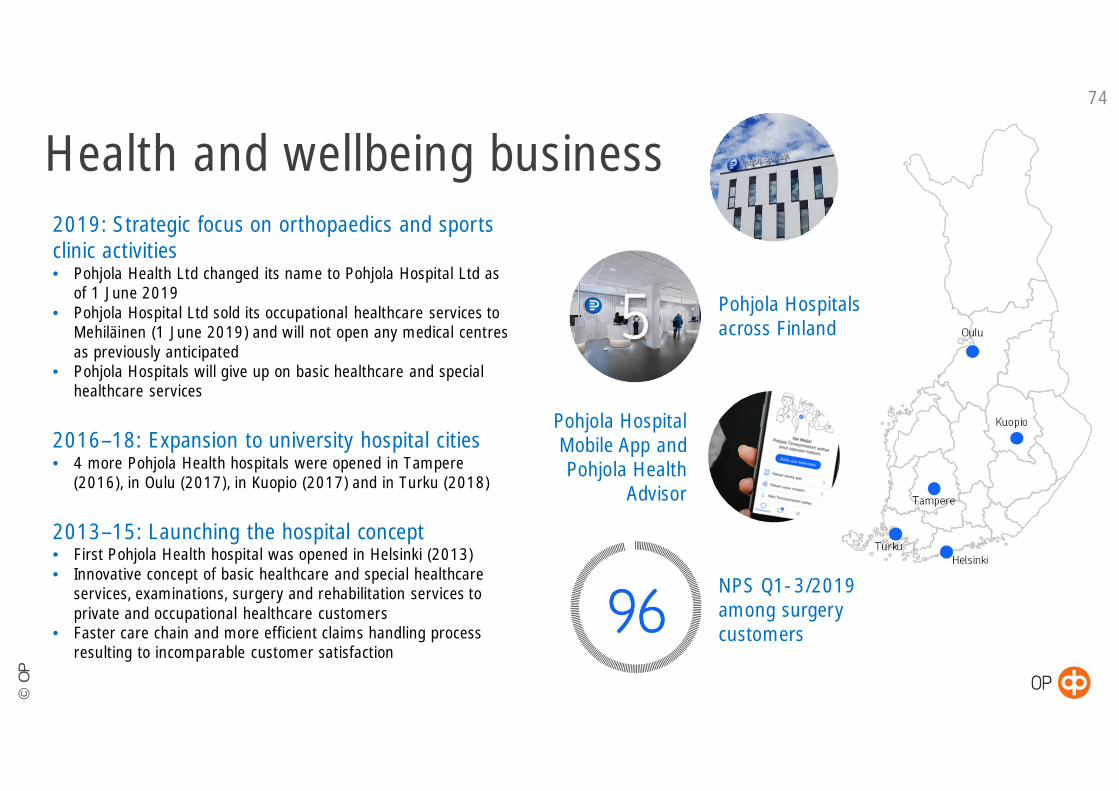
2019: Strategic focus on orthopaedics and sportsclinic activities• Pohjola Health Ltd changed its name to Pohjola Hospital Ltd as
of 1 June 2019• Pohjola Hospital Ltd sold its occupational healthcare services to
Mehiläinen (1 June 2019) and will not open any medical centresas previously anticipated
• Pohjola Hospitals will give up on basic healthcare and specialhealthcare services
2016–18: Expansion to university hospital cities• 4 more Pohjola Health hospitals were opened in Tampere
(2016), in Oulu (2017), in Kuopio (2017) and in Turku (2018)
2013–15: Launching the hospital concept• First Pohjola Health hospital was opened in Helsinki (2013)• Innovative concept of basic healthcare and special healthcare
services, examinations, surgery and rehabilitation services toprivate and occupational healthcare customers
• Faster care chain and more efficient claims handling processresulting to incomparable customer satisfaction
74
Health and wellbeing business
Pohjola HospitalMobile App andPohjola Health
Advisor
NPS Q1-3/2019among surgerycustomers
Pohjola Hospitalsacross Finland
©O
P
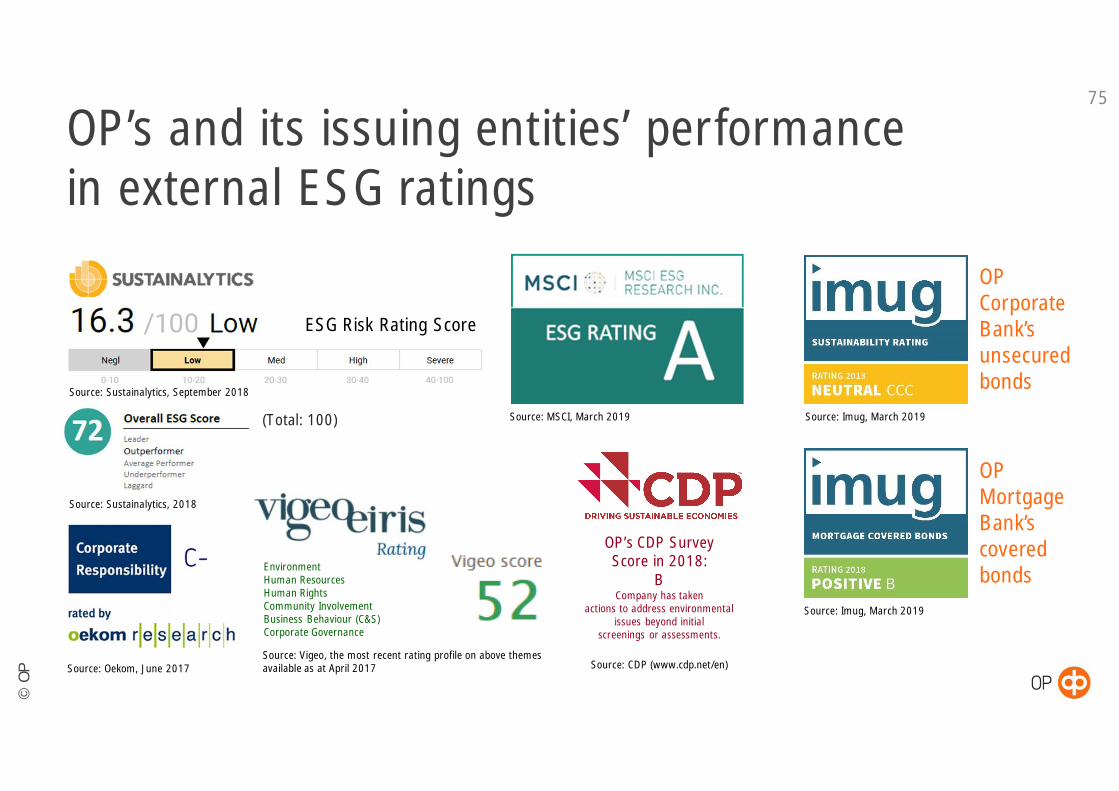
OP’s and its issuing entities’ performancein external ESG ratings
75
OPCorporateBank’sunsecuredbonds
Source: Oekom, June 2017
Source: MSCI, March 2019 Source: Imug, March 2019
Source: Imug, March 2019
Source: CDP (www.cdp.net/en)
OP’s CDP SurveyScore in 2018:
BCompany has taken
actions to address environmentalissues beyond initial
screenings or assessments.
Source: Vigeo, the most recent rating profile on above themesavailable as at April 2017
EnvironmentHuman ResourcesHuman RightsCommunity InvolvementBusiness Behaviour (C&S)Corporate Governance
Source: Sustainalytics, 2018
(Total: 100)
Source: Sustainalytics, September 2018
ESG Risk Rating Score
OPMortgageBank’scoveredbonds
©O
P
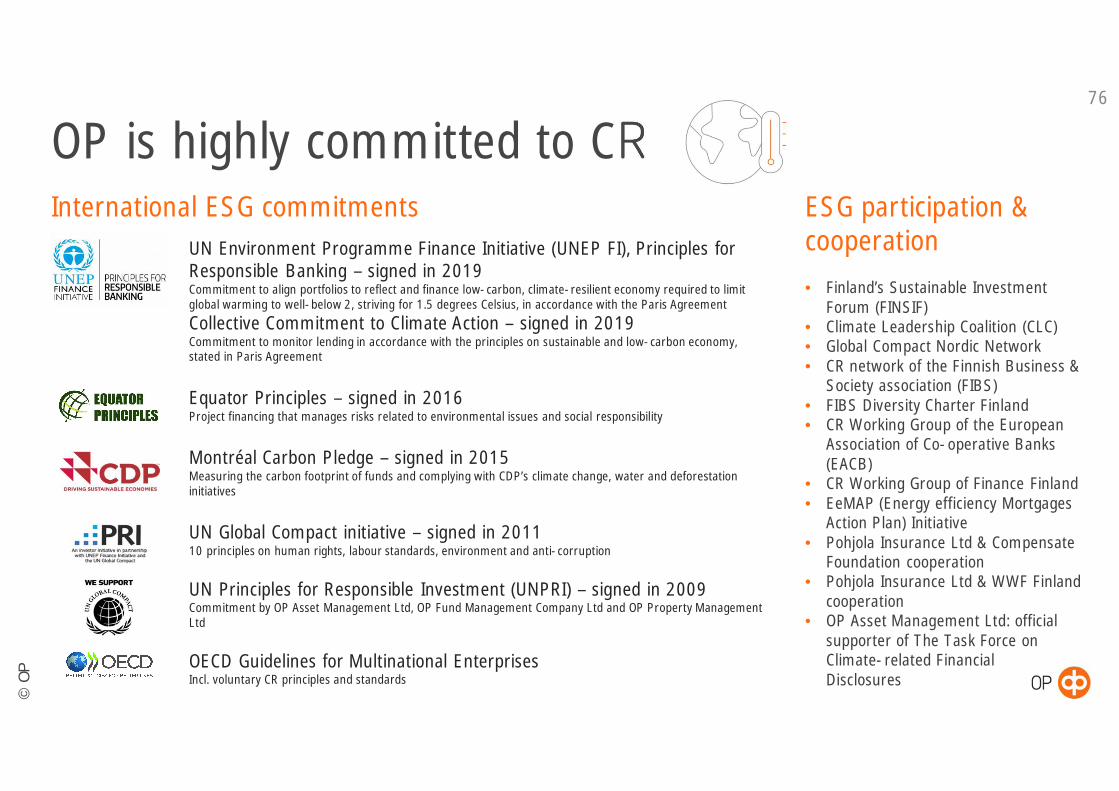
OP is highly committed to CRInternational ESG commitments
76
ESG participation &cooperation• Finland’s Sustainable Investment
Forum (FINSIF)• Climate Leadership Coalition (CLC)• Global Compact Nordic Network• CR network of the Finnish Business &
Society association (FIBS)• FIBS Diversity Charter Finland• CR Working Group of the European
Association of Co-operative Banks(EACB)
• CR Working Group of Finance Finland• EeMAP (Energy efficiency Mortgages
Action Plan) Initiative• Pohjola Insurance Ltd & Compensate
Foundation cooperation• Pohjola Insurance Ltd & WWF Finland
cooperation• OP Asset Management Ltd: official
supporter of The Task Force onClimate-related FinancialDisclosures
UN Environment Programme Finance Initiative (UNEP FI), Principles forResponsible Banking – signed in 2019Commitment to align portfolios to reflect and finance low-carbon, climate-resilient economy required to limitglobal warming to well-below 2, striving for 1.5 degrees Celsius, in accordance with the Paris Agreement
Collective Commitment to Climate Action – signed in 2019Commitment to monitor lending in accordance with the principles on sustainable and low-carbon economy,stated in Paris Agreement
Equator Principles – signed in 2016Project financing that manages risks related to environmental issues and social responsibility
Montréal Carbon Pledge – signed in 2015Measuring the carbon footprint of funds and complying with CDP’s climate change, water and deforestationinitiatives
UN Global Compact initiative – signed in 201110 principles on human rights, labour standards, environment and anti-corruption
UN Principles for Responsible Investment (UNPRI) – signed in 2009Commitment by OP Asset Management Ltd, OP Fund Management Company Ltd and OP Property ManagementLtd
OECD Guidelines for Multinational EnterprisesIncl. voluntary CR principles and standards
©O
P
OP’s CR measures during recent years77
Banking• Green corporate loans• Corporate loans with terms
and conditions (margin) tied toESG performance targets –currently €500 mn granted byOP Corporate Bank
• ESG Analyses to identify ESGrisks within corporateexposures
• SME financing programmes(€300 mn) guaranteed by EIFand guarantee programme(€300mn) with EIB for largeand mid-sized companies tosupport economic growth andemployment
• Financing of energy-savingimprovements for housingcompanies in cooperation withLeaseGreen to cut housingcompanies’ heating costs andcarbon footprint
Treasury &ALM• OP Corporate Bank’s
Green Bond Frameworkaiming to increasesustainable financingthrough issuing greenbonds and allocatingproceeds to greencorporate customer assets
Insurance• Promoting traffic safety• Preventing losses and
injuries• Predicting impacts caused
by climate change• Pohjola Hospitals’ rapid
care chain to minimiselosses caused by medicalleaves to all parties
WealthManagement• Exclusion of high-carbon
companies and measuringcarbon footprint of mutualfunds
• Quarterly sustainabilityanalyses on OP funds
• Active proxy voting at AGMs• OP and Finnfund global
impact fund• Membership in Climate Action
100+ (5yr investorengagement initiative) toimpact on listed companieswith the highest GHGemissions globally – thematicengagement projects oncarbon, water and tax risks
• Signature of CDP’s climatechange, water anddeforestation initiatives
OP premises &practices• LEED Gold certificates
for OP HQ andPohjola Hospitals
• Solar power stationsat OP HQ, PohjolaHospitals and inbuildings of OPProperty Management
• Energy used at OP HQ 100%renewable
• WWF Finland Green Office systemapplied to OP HQ and some membercooperative banks
• Carbon footprint of OP’s employeesmitigated by remote work opportunityand incentives to use publictransportation
• Emissions from own operations downby 44% (2018 vs. 2011)
©O
P
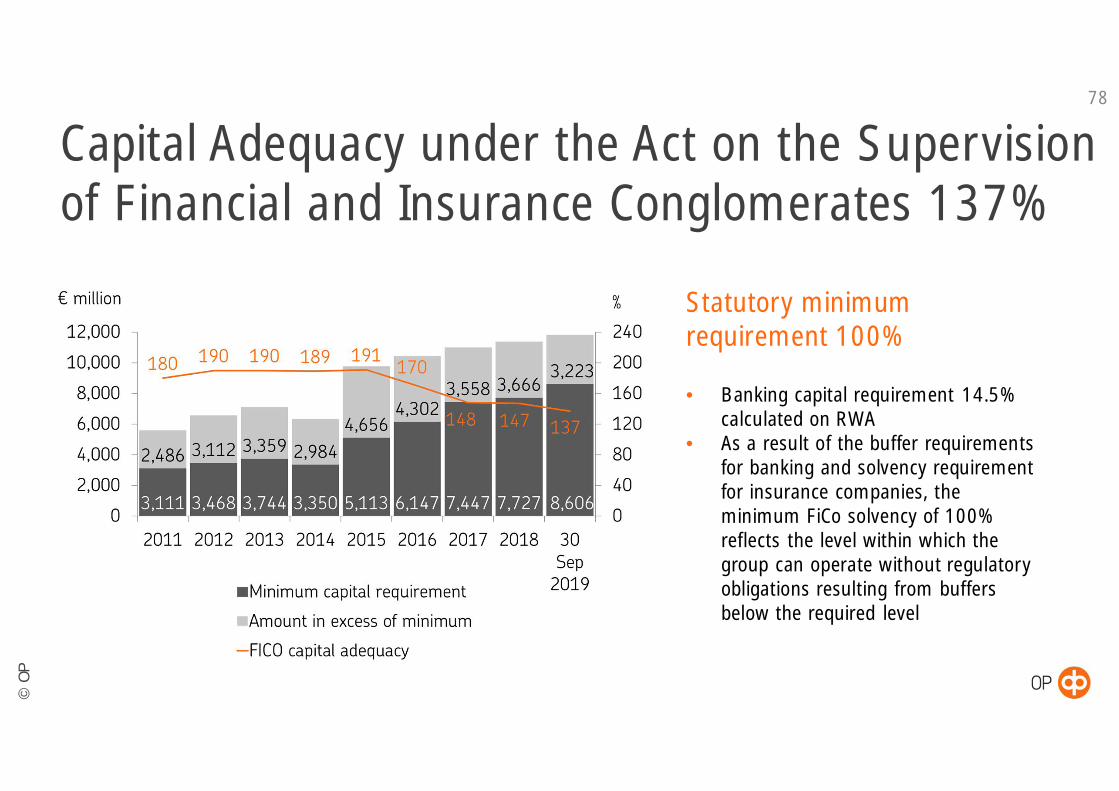
Capital Adequacy under the Act on the Supervisionof Financial and Insurance Conglomerates 137%
78
Statutory minimumrequirement 100%
• Banking capital requirement 14.5%calculated on RWA
• As a result of the buffer requirementsfor banking and solvency requirementfor insurance companies, theminimum FiCo solvency of 100%reflects the level within which thegroup can operate without regulatoryobligations resulting from buffersbelow the required level
©O
P
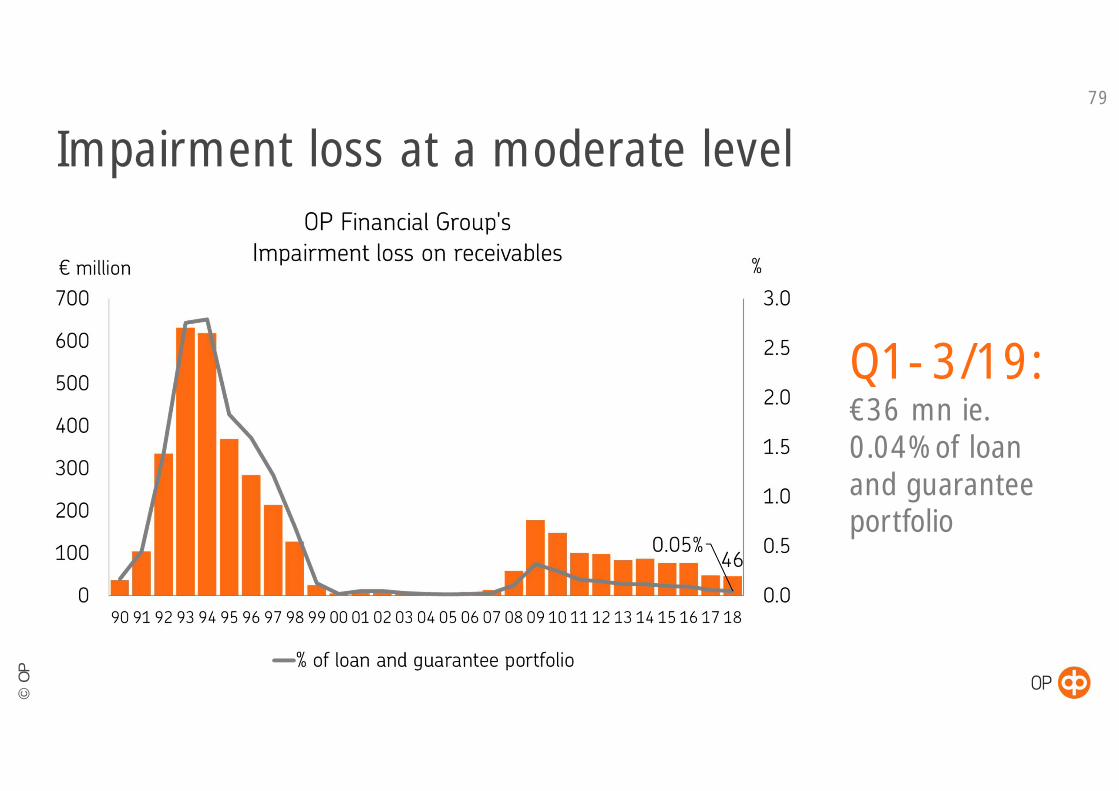
Impairment loss at a moderate level79
Q1-3/19:€36 mn ie.0.04% of loanand guaranteeportfolio

©O
P
€ million Q1-3/19 Q1-3/18 2018 2017 2016 2015Net interest income 901 862 1 166 1 102 1 058 1 026
Net insurance income 412 432 566 478 558 528
Net commissions and fees 679 655 887 879 859 855
Net investment income 325 290 263 522 390 432
Other operating income 41 46 61 83 123 55
Total income 2 358 2 286 2 943 3 063 2 989 2 895
Personnel costs 573 592 516 758 762 781
Depreciation/amortisation and impairment loss 189 189 325 246 160 162
Other operating expenses 602 597 839 764 646 577
Total expenses 1 365 1 378 1 681 1 768 1 567 1 520
Impairment loss on receivables -36 -24 -46 -48 -77 -78
OP bonuses to owner-customers -186 -167 -226 -217 -206 -196
Overlay approach* -65 -30 26
Earnings before tax 706 687 1 017 1 031 1 138 1 101
OP Financial Group’s earnings analysis80
* A temporary exemption from IFRS9 (overlay approach) is applied to some equity instruments of insurance companies (reported according to IAS39)
©O
P
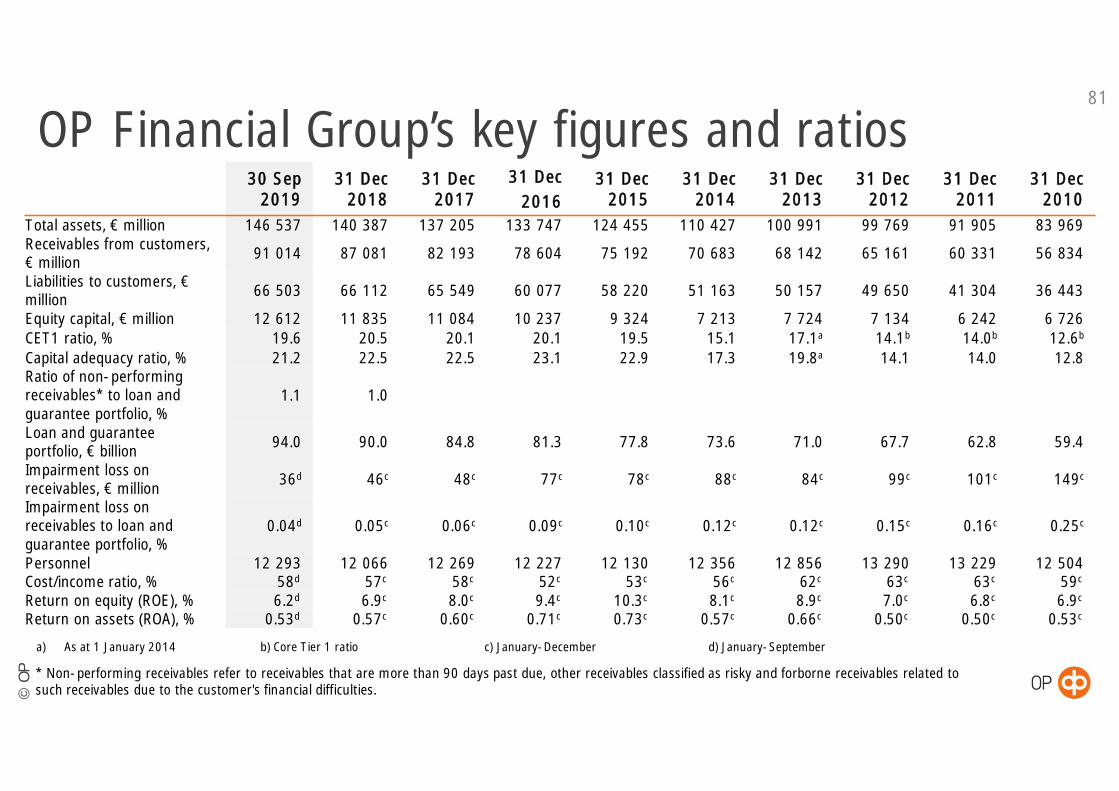
OP Financial Group’s key figures and ratios30 Sep
201931 Dec
201831 Dec
201731 Dec
201631 Dec
201531 Dec
201431 Dec
201331 Dec
201231 Dec
201131 Dec
2010Total assets, € million 146 537 140 387 137 205 133 747 124 455 110 427 100 991 99 769 91 905 83 969Receivables from customers,€ million 91 014 87 081 82 193 78 604 75 192 70 683 68 142 65 161 60 331 56 834
Liabilities to customers, €million 66 503 66 112 65 549 60 077 58 220 51 163 50 157 49 650 41 304 36 443
Equity capital, € million 12 612 11 835 11 084 10 237 9 324 7 213 7 724 7 134 6 242 6 726CET1 ratio, % 19.6 20.5 20.1 20.1 19.5 15.1 17.1a 14.1b 14.0b 12.6b
Capital adequacy ratio, % 21.2 22.5 22.5 23.1 22.9 17.3 19.8a 14.1 14.0 12.8Ratio of non-performingreceivables* to loan andguarantee portfolio, %
1.1 1.0
Loan and guaranteeportfolio, € billion 94.0 90.0 84.8 81.3 77.8 73.6 71.0 67.7 62.8 59.4
Impairment loss onreceivables, € million 36d 46c 48c 77c 78c 88c 84c 99c 101c 149c
Impairment loss onreceivables to loan andguarantee portfolio, %
0.04d 0.05c 0.06c 0.09c 0.10c 0.12c 0.12c 0.15c 0.16c 0.25c
Personnel 12 293 12 066 12 269 12 227 12 130 12 356 12 856 13 290 13 229 12 504Cost/income ratio, % 58d 57c 58c 52c 53c 56c 62c 63c 63c 59c
Return on equity (ROE), % 6.2d 6.9c 8.0c 9.4c 10.3c 8.1c 8.9c 7.0c 6.8c 6.9c
Return on assets (ROA), % 0.53d 0.57c 0.60c 0.71c 0.73c 0.57c 0.66c 0.50c 0.50c 0.53c
81
a) As at 1 January 2014 b) Core Tier 1 ratio c) January-December d) January-September
* Non-performing receivables refer to receivables that are more than 90 days past due, other receivables classified as risky and forborne receivables related tosuch receivables due to the customer's financial difficulties.
©O
P
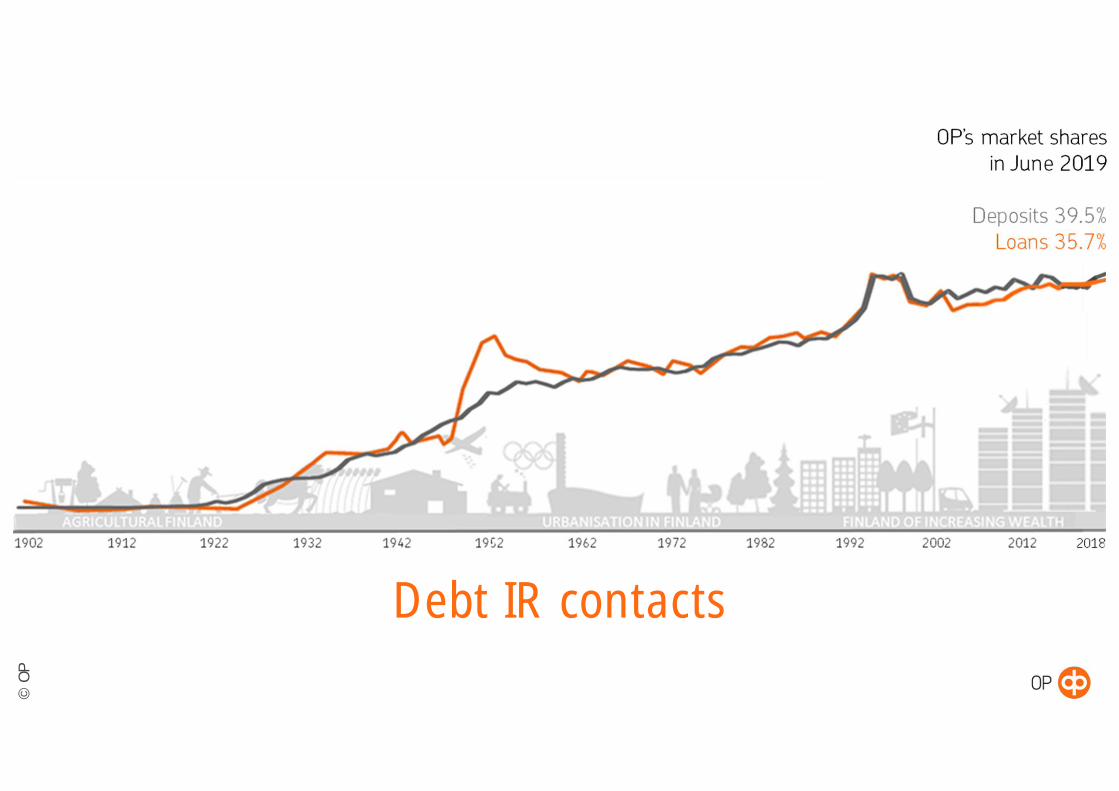
Debt IR contacts

©O
P
Debt IR contacts83
For OP Financial Group’s and issuing entities’ financial reports and other publications,please visit OP’s Debt IR website at www.op.fi/debtinvestors
Head of Treasury and ALMLauri IloniemiTel. +358 10 252 3541lauri.iloniemi(a)op.fi
IR Officer,Debt IR and Rating Agency RelationsJaana MauroTel. +358 10 252 8426jaana.mauro(a)op.fi
Senior Funding ManagerTom AlanenTel. +358 10 252 4705tom.alanen(a)op.fi
IR Officer,Debt IR and Rating Agency RelationsEerikki HolstTel. +358 10 252 4455eerikki.holst(a)op.fi